Embed Size (px)
Citation preview

New Data Managers Session
• Melinda Offer, RN, MSN

Learning Objectives:
Upon completion of this session, participant will be able to:
• Identify STS Educational Resources
• Understand how to read the Data and Software Specifications
• Understand the Procedure ID Chart
• Identify resources within the National Harvest Report

LET THE GAMES BEGIN

Data Manager Resources
STS Website
Webinars
Mentorship Program
Advances in Quality Outcomes Conference (AQO)
Database News newsletter
ACSD– Regional groups

STS National Database Website


STS Mentorship Program

Advances in Quality & Outcomes: A Data Manager Meeting (AQO)
• Annual educational meeting for Data Managers of the STS National Database.
• Objective to improve data abstraction and coding skills.

Database News Newsletter
• The Database News newsletter is a newsletter dedicated to the STS National Database.
• Contains information on public reporting, data submission deadlines, meetings, and audits.
• The STS newsletter is available on the STS Data Manager Education page

Regional Groups

Frequently Asked Questions - FAQ

Ask a Question


Additional Resources on STS Website
• Data Collection Forms
• Training Manual
• Ask a Clinical Question
• FAQ Updates

Navigating the STS Website:

Data Collection Forms (DCF’s)
Non-Annotated DCF
Annotated DCF

STS Training Manual

Navigating the STS Website

Software Specifications
– page 4
• Important Resource to be familiar with
• Dates of Versions

Software Specifications
– page 6
Describes how to read Data Specs

Software Specs – page 11• Record ID - unique numeric value that identifies the record in the database.
• Generated Software site by the STS. The codes will be in a format similar to “V01”.
• For example - V01000001

Software Specs – page 14• Points out what data can be
imported into Vendor Data Form
• ADT Tool
• Reason we can’t import more data is because of the importance of the data managers eyes on the data, the limitations of informatics on writing the correct code, especially when there are changes in definitions and between EMR versions and vendors

Software Specs – page
16
• Parent Child Relationships

Software Specs – page 26
• Meld Score Calculation – system calculation must have INR, Total Bili, and Creatinine to calculate

Software Specs – page 27
• Post-op Vent Calculation

Software Specs – page
29
Appendix F: Field Short Name and Seq Number by Data Version

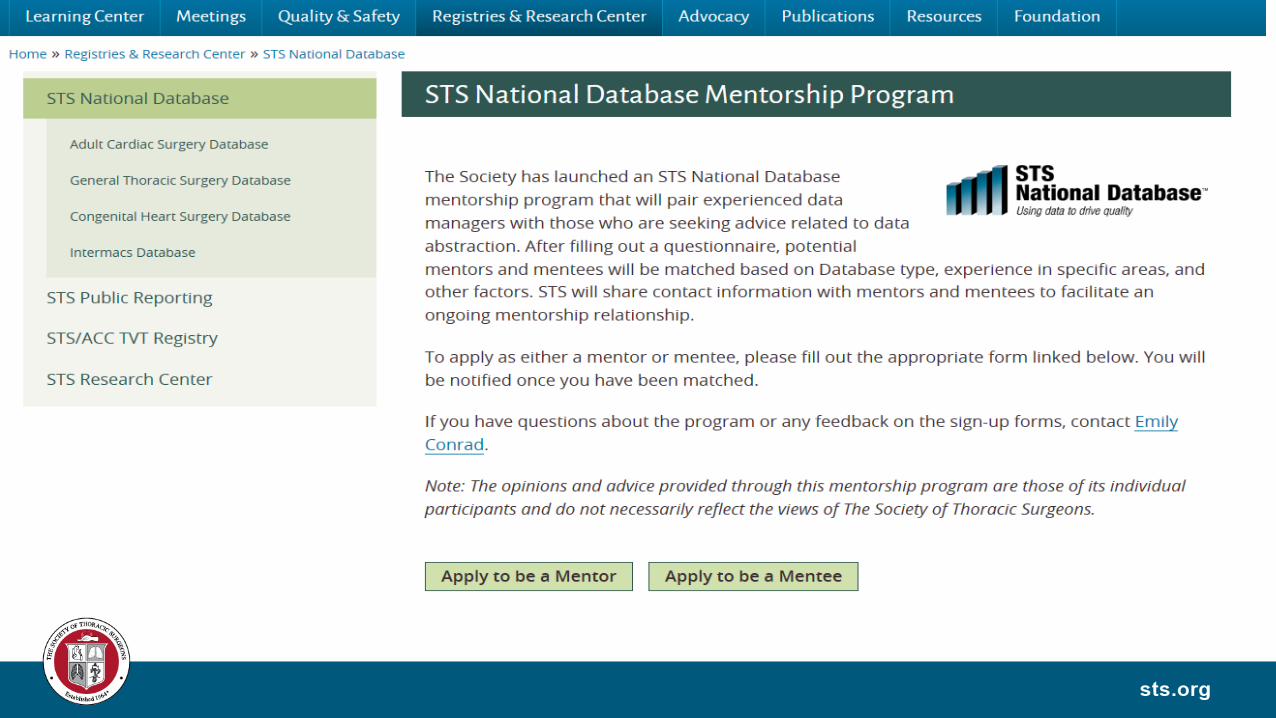
Data Specifications
Data Specification

Data Specifications - Parent Child Relationship

Procedure ID Chart
• Isolated Coronary Artery Bypass (CAB)
• Isolated Aortic Valve Replacement (AV Replace)
• Isolated Mitral Valve Replacement (MV Replace)
• Aortic Valve Replacement + CAB (AV Replace + CAB)
• Mitral Valve Replacement + CAB (MV Replace + CAB)
• Aortic Valve Replacement + Mitral Valve Replacement (AV Replace + MV Replace)
• Isolated Mitral Valve Repair (MV Repair)
• Mitral Valve Repair + CAB (MV Repair + CAB)
Need to have DCF with Seq Numbers to read this chart

Page 1 with 4 categories –scroll down to see how other procedures effect the category
The Gray lines are programming lingo and can be ignored. Focus on the white rows

SEQ 4191 A-fib Lesion location that is used in the Isolated CAB, Isolated AVR, and Isolated CAB AVR calculation, however it is not used in the Isolated MVR calculation
On this slide you have procedures that effect all 4 categories and others that effect individual categories
Green Highlights changes from V 2.9 to 4.2

Other Cardiac Tumor SEQ 4115
On PROC ID Chart
• No – this means if you code No to this field then the procedure will stay isolated.
• Missing- this means if you leave this field missing then the procedure will stay isolated.
https://youtu.be/2-vH1cCiCts
Short Name and Seq Number
If you code “No or Missing” case will stay isolated
Ignore Gray Lines

PROC ID Scenario
Patient has CABG with A-fib Pulmonary Vein Isolation performed SEQ 4191. Will this procedure be classified as an isolated CABG?
CABG AVR MVR AVR + CABG
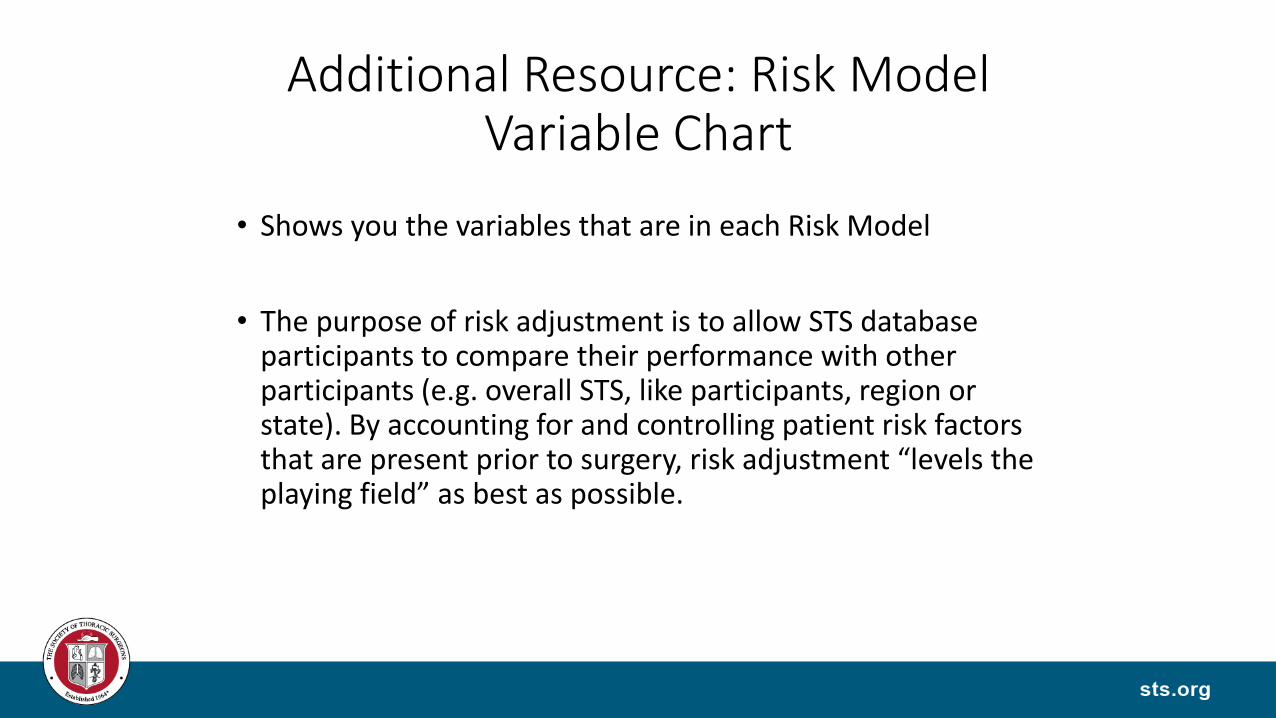
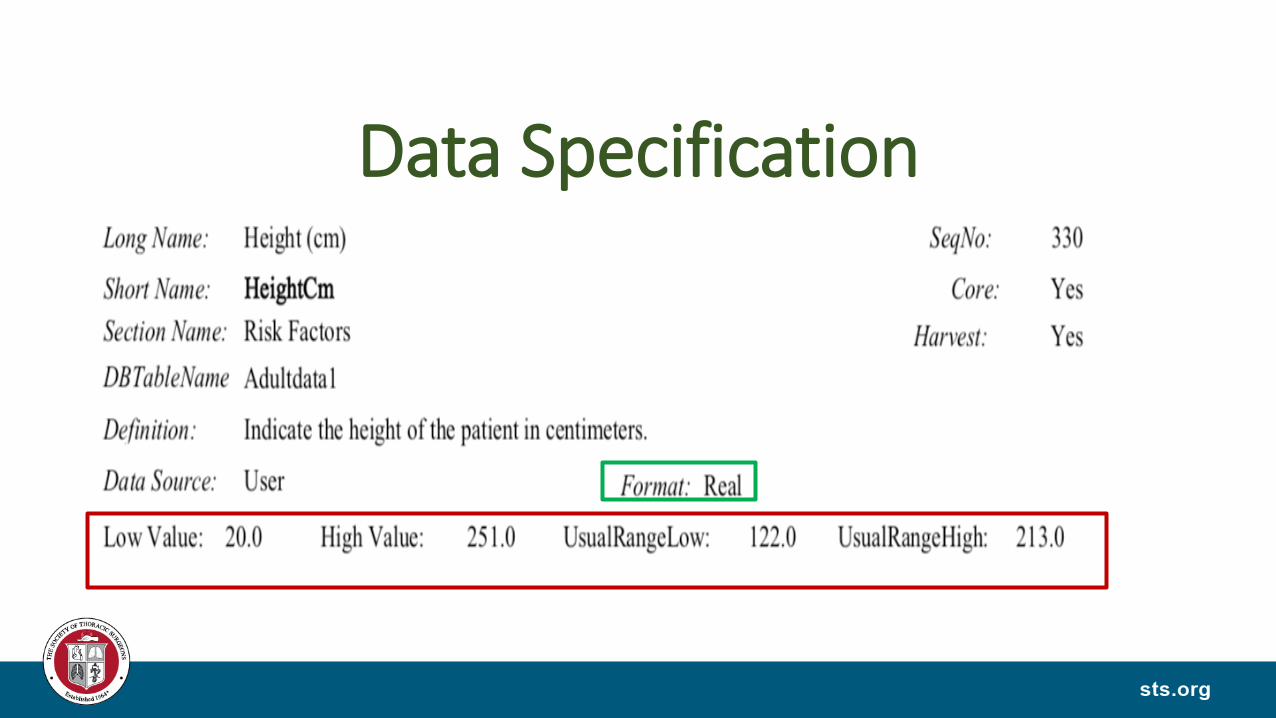
Additional Resource: Risk Model Variable Chart
• Shows you the variables that are in each Risk Model
• The purpose of risk adjustment is to allow STS database participants to compare their performance with other participants (e.g. overall STS, like participants, region or state). By accounting for and controlling patient risk factors that are present prior to surgery, risk adjustment “levels the playing field” as best as possible.


Additional Resources -Congenital Diagnoses and Procedure List

Additional Resources – Case Inclusion Guide

Additional Resources – NQF Measures
Process Measures: Preoperative beta blockade therapyUse of IMADischarge anti-platelet medicationDischarge beta blockade therapyDischarge anti- lipid medication
Outcomes Measures: Post-op Renal FailureSurgical Re-explorationOperative Mortality for CABGProlonged VentilationDeep Sternal Wound InfectionStroke/Cerebrovascular Accident


Additional Resources –Surgeon Worksheets

Additional Resource – National Report Analysis Overview
• Reports are published following each quarterly database harvest and the report is provided to each eligible STS database participant. Report Overview
Reporting LevelsParticipant’s RegionOverview of Risk-Adjusted ResultsModel EndpointsHandling of Missing DataOE Ratio InterpretationsStar RatingNQF Measures

Additional Resources ACSD Analysis Overview
Complete Chart found in Analysis Overview – page 16-17
Update June 2021 – In the Risk Model, EF values that are less than 10% get imputed to 40%. If your patient has an EF value < 10% enter the EF as 10% in the Database

Comparison of O/E Ratio and Odds Ratio
Because each of these statistics has its advantages, the STS has decided to provide both in the report.
• OE Ratio: The benefit of O/E Ratios is that they are familiar to many surgeons and are simple to compute using an STS-certified software package.
• OR Ratio: The main benefit of Odds Ratios obtained from hierarchical models is that they provide a more reliable estimate of performance for hospitals with a small number of patients.
50
Odds Ratio
OE RatioRisk Adjusted Rate
STS Event Rates

O/E Ratio – The
Simplified Version
The interpretations in this table can also be roughly extended to Odds Ratios - values less than 1 imply better than average performance, values of 1 imply average performance and values over 1 imply worse than average performance. Note that the Odds Ratio will generally be closer to 1.0 than the O/E Ratio. It is possible that these two measures will be discrepant, but only if they are close to 1.0.
Observed is your site compared to the expected which is computed using the risk models on all sites data.

Understanding Risk
Adjustment -The Simplified
Version

Star Rating Trends
Drill Down details
STAR Rating and ScoresNQF Measures

STAR Rating
54

Quality Ratings

Quality Rating Details

Rating Trends

NQF Measures

IQVIA Library

Housekeeping Tips
Keep DCF and or your collection notes for at
least 4 years.
Keep a log of 30-Day Mortality / 30 Day
Readmission/ 30 Day DSWI & Infection in the
event of an Audit.

Resources
• STS National Database Webpage
• [email protected] (Uploader, DQR, Missing Variable, Dashboard, Password and Login )
• Phone Support: 1-833-256-7187
• STS National Database Feedback Form
• Resource Documents
• Contact Information
• Webinar Information
• FAQ Document
• Go-Live Checklist
• Tiered-level Support Document
• Training Videos
• Link to IQVIA

Contact Information
• Carole Krohn, Sr. Clinical Manager, STS National Database• [email protected]
• 312-202-5847
• Database Operational Questions• [email protected]

Open Discussion
Please use the Q&A Function.
We will answer as many questions as possible.
We encourage your feedback and want to hear from you!