Embed Size (px)
Citation preview

Contents lists available at ScienceDirect
Journal of Inorganic Biochemistry
journal homepage: www.elsevier.com/locate/jinorgbio
New Cu(II) complexes with pyrazolyl derived Schiff base ligands: Synthesisand biological evaluationNádia Ribeiroa, Somnath Roya,b, Nataliya Butenkoa,c, Isabel Cavacoa,c, Teresa Pinheirod,Irina Alhoe, Fernanda Marquesf, Fernando Avecillag, João Costa Pessoaa, Isabel Correiaa,⁎a Centro de Química Estrutural, Instituto Superior Técnico, Universidade de Lisboa, Av. Rovisco Pais, 1049-001 Lisboa, Portugalb Department of Chemistry, Ananda Chandra College, Jalpaiguri, West Bengal, Indiac Departamento de Química Bioquímica e Farmácia, Universidade do Algarve, Campus de Gambelas, 8005-139 Faro, Portugald Instituto de Bioengenharia e Biociências, Departamento de Engenharia e Ciências Nucleares, Instituto Superior Técnico, Universidade de Lisboa, Av. Rovisco Pais 1, 1049-001 Lisboa, Portugale Instituto de Medicina Molecular, Faculdade de Medicina, Universidade de Lisboa, Av. Professor Egas Moniz, 1649-028 Lisboa, Portugalf Centro de Ciências e Tecnologias Nucleares, Instituto Superior Técnico, Universidade de Lisboa, Estrada Nacional 10, 2695-066 Bobadela LRS, Portugalg Grupo Xenomar, Centro de Investigacións Científicas Avanzadas (CICA), Departamento de Química, Facultade de Ciencias, Universidade da Coruña, Campus de ACoruña, 15071 A Coruña, Spain
A R T I C L E I N F O
Keywords:PyrazoleSchiff base ligandCopper complexesCytotoxicityFluorescence quenching
A B S T R A C T
Since the discovery of cisplatin there has been a continuous pursuit for new metallodrugs showing higher effi-cacies and lower side effects. In this work, new copper(II) complexes (C1–C6) of Schiff bases derived frompyrazolyl were developed. Through condensation of 5-methyl-1H-pyrazole-3-carbohydrazide with differentaromatic aldehydes – pyridoxal, salicylaldehyde, 3-methoxy-2-hydroxybenzaldehyde, 3-ethoxy-2-hydro-xybenzaldehyde and 2-hydroxynaphthene-1-carbaldehyde – a set of new pyrazole based “ONO” tridentate Schiffbases were obtained in moderate to good yields – L1–L6, as well as their Cu(II)-complexes. All compounds werecharacterized by analytical techniques and their molecular formulae established. The antioxidant potential of allcompounds was tested, yielding low activity in most cases, with the exception of L1 and C5. The Cu(II) com-plexes were tested for their aqueous stability, and for their interaction with biological molecules, namely DNAand HSA (human serum albumin), through fluorescence quenching experiments (and electrophoresis for DNA).With the exception of C3, all the synthesized complexes were able to interact with DNA and HSA. Their cytotoxicactivity against two cancer cell lines (MCF7 — breast and PC3 — prostate) was also evaluated. Complexes C5and C6, with larger aromatic systems, showed much higher cytotoxicity (in the low μM range), than C1–C4, aswell as IC50 values much lower than cisplatin. For C6 the results suggest that the mechanisms of cell death do notseem to be mediated by apoptosis, through caspases 3/7 activation, but by involving membrane potential andimbalance in physiological elements such as P, K and Ca.
1. Introduction
Cancer is one of the diseases with higher impact at personal, socialand economic level [1]. It is nowadays the leading cause of death ineconomically developed countries and the second one in developingcountries [2]. The common feature to all forms of cancer is highgenomic instability; this leads to continuous acquisition of DNA aber-rations, which prompt the cancer cells to adapt, resist, and becomecontinuously more aggressive [2].
Among various types of anticancer drugs, metal-based complexeshave been under much attention since the discovery of cisplatin in the1960s [3]. The interest in developing coordination compounds of
different metal ions for application as anticancer agents arises from thefact that platinum-based drugs, although possessing a powerful antic-ancer effect, present undesirable side-effects and are only efficientagainst a restricted variety of cancer cells. Also, the fact that platinum isan exogenous metal to the human organism can lead to a response fromthe body that can severely prejudice the efficacy of the drug and/or itstoxic side effects can prevail over the therapeutic ones. There is,therefore, an interest in developing new drugs based in endogenousmetal ions, such as copper, considered to have less side-effects, withimproved spectrum of efficacy and lower toxicity [4], as well as af-fording distinct mechanisms of action. Copper is a trace element in thehuman body and acts as cofactor in enzymes and other structures,
http://dx.doi.org/10.1016/j.jinorgbio.2017.05.011Received 22 February 2017; Received in revised form 19 May 2017; Accepted 22 May 2017
⁎ Corresponding author.E-mail address: [email protected] (I. Correia).
making its presence indispensable for the normal function of the or-ganism. It is therefore no surprise that compounds containing thiselement are being considered in the development of metallodrugs [5,6].
The use of copper complexes has, in many cases, the genetic ma-terial as primary target, the damage being provided by different me-chanisms that can be promoted by intercalation of the compound intothe DNA double helix [7]. The success of metal-based drugs is closelylinked to the proper choice of the auxiliary ligand, which plays a keyrole in modifying reactivity, lipophilicity, and stabilizing specific oxi-dation states. Ligands containing nitrogen atoms have been widely usedin coordination chemistry and, in particular, as elements for thesynthesis and development of pharmaceuticals. Extensive research hasbeen done using the simple chemistry that leads to the formation ofSchiff bases [8]. One of the most interesting characteristics of Schiffbases is its modular character, since the combination of differentamines with different aldehydes may yield compounds with differentfeatures. They exhibit a broad range of biological activities, includingantifungal, antibacterial, antimalarial, antiproliferative, anti-in-flammatory, antiviral, and antipyretic properties [8–11].
Schiff bases and their metal complexes in particular copper(II)complexes are important in drug research and development due to theirbioactivity [1]. Interesting features among some of these complexes arethe favourable DNA intercalative abilities, antiproliferative activity,dependence on the cell type and induction of apoptosis [11,12]. Pyr-azoles and their derivatives are one important group of compounds indrug research. These consist of a doubly unsaturated 5-membered ringcontaining two nitrogen atoms (positions 1 and 2 of the ring) [13]. Theattractiveness of pyrazole and its derivatives is their versatility thatallows the synthesis of a series of analogues containing different moi-eties, thus affecting the electronics and by extension the properties ofthe resultant compounds [14]. The core pyrazole structure, in general,has attracted widespread attention also because of the diversity ofbiological activity shown by derivatives of this nucleus, such as anti-microbial, anticancer, cytotoxic, analgesic, anti-inflammatory, anti-hypertensive, central nervous system activity like antiepileptic, anti-depressant, etc. [13,15]. Substitution with a carbohydrazide moiety atposition C5 of the pyrazole ring provides derivatives that can undergocondensation with aldehydes, forming Schiff bases. These compoundsalso exhibit antitumour activity, particularly those resulting from thereaction with salicylaldehyde [15].
In this work we report the synthesis and characterization of newSchiff base complexes and analyze their interaction with biomolecules,such as DNA and Human Serum Albumin (HSA), as well as their po-tential anticancer activity. The choice fell on copper complexes withSchiff bases derived from pyrazole-3-carbohydrazide and aromaticsubstituents, such as pyridoxal, salicylaldehyde and its derivatives, and2-hydroxynaphthene-1-carbaldehyde — see Scheme 1.
2. Experimental part
2.1. Materials
5-Methyl-1H-pyrazole-3-carbohydrazide, pyridoxal hydrochloride,2-hydroxybenzaldehyde, 3-methoxy-2-hydroxybenzaldehyde, and 3-ethoxy-2-hydroxybenzaldehyde (all from Sigma) were used as received.The metal salt CuCl2·2H2O (Merck) was used as supplied. Methanol(Aldrich) and dimethyl sulfoxide (Carlo Erba) were p.a. grade and usedwithout further purification. Millipore® water was used throughout allthe experiments with biological macromolecules. Phosphate bufferedsaline (PBS) was purchased from Sigma-Aldrich as tablets readily so-luble in water (deionized water) giving solutions 0.01 M in phosphate(and NaCl 0.138 M; KCl 0.0027 M), pH 7.4 at 25 °C. Calf thymus DNA(ctDNA), thiazole orange (TO) and Human Serum Albumin (HSA) (fattyacid free) were purchased from Sigma-Aldrich. All other materials notmentioned here were either p.a. or reagent grade.
2.2. Instrumentation
Elemental analysis for C, H and N were carried on a FISONS EA1108 CHNS-O apparatus. The 1H NMR spectra were recorded at am-bient temperature on a Bruker Avance II + 300 (UltraShieldTMMagnet) spectrometer operating at 300.13 MHz. The chemical shifts arereported in ppm using tetramethylsilane as internal reference. The in-frared spectra were recorded on a JASCO FT/IR 4100 spectro-photometer and the UV–Visible absorption spectra were recorded on aPerkin Elmer Lambda 35 UV–Vis spectrophotometer with 10.0 mmquartz cuvettes. A 500-MS Varian Ion Trap Mass Spectrometer was usedto measure ESI-MS spectra of methanolic solutions of the complexes inboth positive and negative modes. The first derivative X-band EPRspectra of the frozen solutions (frozen in liquid nitrogen, 77 K) wererecorded on a Bruker ESP 300E spectrometer. The spectrometer wasoperated at ~9.51 GHz with a frequency modulation of 100 kHz. Anion chromatography system was used to determine the presence andamount of chloride using a DIONEX ICS-1500, equipped with IonPac®AS14A 4-mm analytical (4 × 250 mm) column and suppressed con-ductivity at 10 μSFS ASRS®-ULTRA AutoSuppression® recycle modedetection system. Fluorescence measurements were carried out on aSPEX® Fluorolog spectrofluorimeter (Horiba Jobin Yvon) in a FL3-11configuration, equipped with a Xenon lamp and in a 10.0 mm quartzcuvette. The instrumental response was corrected by means of a cor-rection function provided by the manufacturer. The experiments werecarried out at room temperature and are all steady-state measurements.
2.3. Synthesis and characterization
2.3.1. Synthesis of the ligandsLigands L1 to L5 were synthesized in by refluxing a methanolic
solution (25 mL) of 5-methyl-1H-pyrazole-3-carbohydrazide (250 mg,1.78 mmol) with the corresponding aldehyde (1.78 mmol), also takenin methanol (25 mL), for ca. 5 h in the presence of two drops of aceticacid. White to yellowish solid compounds separated out. They werefiltered, washed with cold methanol and dried in vacuum. The generalsynthesis of the ligands is given in Scheme 1.
2.3.1.1. (E)-N′-((3-hydroxy-5-(hydroxymethyl)-2-methylpyridin-4-yl)-5-methyl-1H-pyrazole-3-carbohydrazide hydrochloride (L1). Yield: 83%;ESI-MS (electrospray ionization mass spectra) (MeOH) m/z [Found(Calcd)]: 290.1 (290.12) (100%) [L + H]+; 288.6 (288.12) (15%)[L − H]−; 324.2 (324.09) (100%) [L + Cl] −; 612.9 (613.24) (80%)[2L + Cl]−. Anal. Calc. for C13H16ClN5O3: C, 47.90; H, 4.95; N, 21.50.Found: C, 48.1; H, 4.9; N, 21.7%. FTIR (KBr, cm−1): 3440 (m, pyr,eCH2OH), 3338 (s, NH), 3204 (s, pyr, eOH), 2868 (s, pyr,NeH+eCl−), 1658 (s, eC]O), 1599 (m, azomethine, C]N), 1562(s, C]C), 1411 (m, pz, C]N). 1H NMR (300 MHz, DMSO-d6, δ (ppm)):2.08 (s, 1H, pyr, eCH2OH), 2.31 (s, 3H, pz, eCH3), 2.61 (s, 3H, pyr,eCH3), 4.74 (s, 2H, pyr, eCH2OH), 6.62 (s, 1H, pz, eCH), 8.19 (s, 1H,pyr, eCH), 9.04 (s, 1H, eCH]N), 12.83 (s, 1H, NNH), 13.21 (s, 1H, pz,eNH). 13C NMR (300 MHz, DMSO-d6, δ (ppm)): 10.61 (pz, eCH3),14.79 (pyr, eCH3), 58.18 (pyr, eCH2OH), 105.85 (pz, eCH), 115.98,129.70, 135.74, 151.87, 153.57 (pyridine moiety), 140.74, 147.99(pyrazolyl moiety), 143.68 (eCH]N), 158.19 (carbonyl). UV–Vis[MeOH, λmax/nm (ε/M−1 cm−1)]: 296 (1.55 × 10⁴), 309(1.98 × 10⁴), 319 (1.96 × 10⁴), 342 (1.81 × 10⁴), 355 (1.61 × 10⁴),403 (5.01 × 10²).
2.3.1.2. (E)-N′-(2-hydroxybenzylidene)-5-methyl-1H-pyrazole-3-carbohydrazide (L2). Yield: 85.7%; ESI-MS (MeOH) m/z [Found(Calcd)]: 245.2 (245.10) (100%) [L + H]+; 243.8 (243.1) (95%)[L − H] −. Anal. Calc. for C12H12N4O2: C, 59.01; H, 4.95; N, 22.94.Found: C, 59.1; H, 4.9; N, 22.6%. FTIR (KBr, cm−1): 3281 (m,eNeNH), 3172 (m, eOH), 1683 (s, eC]O), 1649 (m, azomethine,C]N), 1545 (s, C]C), 1488 (m, pz, C]N). 1H NMR (300 MHz, DMSO-
N. Ribeiro et al.

d6, δ (ppm)): 2.30 (s, 3H, pz, eCH3), 6.52 (s, 1H, pz, eCH), 6.94 (m, 2H,aromatic), 7.29 (m, 1H, aromatic), 7.43 (m, 1H, aromatic), 8.66 (s, 1H,eCH]N), 11.46 (s, 1H, eOH), 11.98 (s, 1H, pz, eNH), 13.14 (s, 1H,NNH). 13C NMR (300 MHz, DMSO-d6, δ (ppm)): 10.68 (pz, eCH3),105.35 (pz, eCH), 116.29, 118.66, 119.30, 129.73, 131.63, 157.40(benzylidene moiety), 140.72, 148.13 (pyrazolyl moiety), 148.68(eCH]N), 157.35 (carbonyl). UV–Vis [DMF, λmax/nm (ε/M−1 cm−1)]: 276 (1.03× 10⁴), 286 (1.61 × 10⁴), 297 (1.77 × 10⁴),325 (1.25× 10⁴), 332 (1.20 × 10⁴).
2.3.1.3. (E)-N′-(3-methoxy-2-hydroxybenzylidene)-5-methyl-1H-pyrazole-3-carbohydrazide (L3). Yield: 67.5%; ESI-MS (MeOH) m/z [Found(Calcd)]: 275.3 (275.11) (20%) [L + H]+; 297.2 (297.11) (100%) [L+ Na]+; 570.8 (571.22) (55%) [2L + Na]+; 273.3 (273.11) (100%)[L − H]−. Anal. Calc. for C13H14N4O3: C, 56.93; H, 5.14; N, 20.43.Found: C, 56.8; H, 5.3; N, 20.4%. FTIR (KBr, cm−1): 3302 (s, NH), 1666(s, eC]O), 1610 (m, azomethine, C]N), 1542 (s, C]C), 1468 (s, pz,C]N). 1H NMR (300 MHz, DMSO-d6, δ (ppm)): 2.30 (s, 3H, pz, eCH3),3.81 (s, 3H, eOCH3), 6.52 (s, 1H, pz, eCH), 6.85 (m, 1H, aromatic),7.01 (m, 2H, aromatic), 8.66 (s, 1H, eCH]N), 11.24 (s, 1H, eOH),11.96 (s, 1H, pz, eNH), 13.14 (s, 1H, NNH). 13C NMR (300 MHz,DMSO-d6, δ (ppm)): 10.67 (pz, eCH3), 56.16 (eOCH3), 105.35 (pz,eCH), 113.77, 118.84, 118.94, 121.36, 147.24, 147.92 (benzylidenemoiety), 140.13, 145.43 (pyrazolyl moiety), 148.62 (eCH]N), 158.50(carbonyl). UV–Vis [DMSO, λmax/nm (ε/M−1 cm−1)]: 300(2.72 × 10⁴), 309 (2.55 × 10⁴), 333 (1.05 × 10⁴).
2.3.1.4. (E)-N′-(3-ethoxy-2-hydroxybenzylidene)-5-methyl-1H-pyrazole-3-carbohydrazide (L4). Yield: 62%; ESI-MS (MeOH) m/z [Found(Calcd)]: 289.3 (289.12) (30%) [L + H]+; 598.9 (599.24) (100%)[2 L + H]+; 287.4 (287.12) (75%) [L − H]−; 574.8 (575.24) (100%)[2L − H]−. Anal. Calc. for C14H16N4O3·0.2H2O: C, 57.61; H, 5.66; N,19.19. Found: C, 57.8; H, 5.7; N, 19.3%. FTIR (KBr, cm−1): 3311 (w,eNeNH), 3253 (w, eOH), 1667 (s, eC]O), 1539 (s, C]C), 1467 (s,pz, C]N). 1H NMR (300 MHz, DMSO-d6, δ (ppm)): 1.34 (t, 3H,eOCH2CH3), 2.30 (s, 3H, pz, eCH3), 4.07 (m, 2H, eOCH2CH3), 6.53(s, 1H, pz, eCH), 6.83 (m, 1H, aromatic), 6.99 (m, 2H, aromatic), 8.66(s, 1H, eCH]N), 11.28 (s, 1H, eOH), 11.97 (s, 1H, pz, eNH), 13.14 (s,1H, NNH). 13C NMR (300 MHz, DMSO-d6, δ (ppm)): 10.38 (pz, –CH3),14.78 (eOCH2CH3), 64.19 (eOCH2CH3), 104.95 (pz, eCH), 115.25,119.04, 121.37, 136.31, 145.37, 147.50 (benzylidene moiety), 140.21,147.15 (pyrazolyl moiety), 148.32 (eCH]N), 158.22 (carbonyl).UV–Vis [DMSO, λmax/nm (ε/M−1 cm−1)]: 300 (3.11× 10⁴), 310(2.90 × 10⁴), 341 (1.02 × 10⁴).
2.3.1.5. (E)-N′-((3-hydroxynaphthalen-1-yl) methylene)-5-methyl-1H-pyrazole-3-carbohydrazide (L5). Yield: 60.0%; ESI -MS (MeOH) m/z[Found (Calcd)]: 293.4 (293.11) (35%) [L − H]−; 329.1 (329.08)(10%) [L + Cl]−; 586.9 (587.22) (100%) [2L − H]−. Anal. Calc. forC16H14N4O2: C, 65.30; H, 4.79; N, 19.04. Found: C, 65.1; H, 4.8; N,18.7%. FTIR (KBr, cm−1): 3196 (s, eNeNH), 3148 (s, eOH), 1671 (s,eC]O), 1626 (m, C]N), 1583 (s, C]C), 1468 (m, pz, C]N). 1H NMR(300 MHz, DMSO-d6, δ (ppm)): 2.32 (s, 3H, pz, eCH3), 6.56 (s, 1H, pz,–CH), 7.21–8.15 (5 m, 6H, aromatic), 9.65 (s, 1H, –CH]N), 12.04 (s,1H, eOH), 12.93 (s, 1H, pz, eNH), 13.20 (s, 1H, NNH). 13C NMR(300 MHz, DMSO-d6, δ (ppm)): 10.70 (pz, eCH3), 104.98 (pz, eCH),108.56, 119.45, 120.82, 123.62, 123.87, 127.78, 128.03, 129.63,132.68, 157.93 (naphthalene moiety), 140.31, 145.26 (pyrazolylmoiety), 147.03 (eCH]N), 157.83 (carbonyl). UV–Vis [DMSO, λmax/nm (ε/M−1 cm−1)]: 262 (2.53 × 10⁴), 300 (7.78× 10³), 312(1.54 × 10⁴), 325 (2.28 × 10⁴), 345 (1.36 × 10⁴), 360 (2.06 × 10⁴),375 (1.91 × 10⁴), 435 (4.13 × 10²).
2.3.1.6. (E)-N′-((3-hydroxynaphthalen-2-yl) methylene)-5-methyl-1-(pyridine-2-yl)-pyrazole-3-carbohydrazide (L6). Compound L6 wasprepared by reaction of 5-methyl-1-(2-pyridyl)pyrazole-3-carbohydrazide [16] (434 mg, 2.00 mmol) with 2-hydroxy-1-naphthaldehyde (344 mg, 2.00 mmol). (Yield: 502 mg, 67.5%) ESI-MS(MeOH) m/z [Found (Calcd)]: 370.6 (371.14) (51%) [L − H]−. Anal.Calc. for C21H17N5O2: C, 67.91; H, 4.61; N, 18.86. Found: C, 68.0; H,4.7; N, 18.5%. FTIR (KBr, cm−1): 3423 (br, eNeNH and eOH), 1707(m, eC]O), 1666 (s, C]N), 1592 (m, C]C), 1473 (m, pz, C]N). 1HNMR (300 MHz, DMSO-d6, δ (ppm)): 2.71 (s, 3H, pz, eCH3), 6.85 (s,1H, pz, eCH), 7.24, 7.42, 7.61, 7.91, 7.94, 8.22 (m, 6H, naphthalenemoiety), 7.51, 8.05, 8.12, 8.59 (m, 4H, pyridine substituent), 9.56 (s,1H, eCH]N), 12.10 (s, 1H, eOH), 12.79 (s, 1H, NNH). 13C NMR(300 MHz, DMSO-d6, δ (ppm)): 14.15 (pz, eCH3), 109.68 (pz, eCH),109.20, 119.15, 120.99, 123.69, 124.49, 128.17, 129.45, 132.70,132.98, 158.41 (naphthalene moiety), 142.43, 143.28 (pyrazolylmoiety), 147.54 (eCH]N), 153.30 (carbonyl), 117.56, 123.45,138.80, 139.56, 148.49 (pyridine substituent). UV–Vis [DMF, λmax/nm (ε/M−1 cm−1)]: 268 (1.66 × 10⁴), 275 (1.57× 10⁴), 312(1.29 × 10⁴), 325 (1.91 × 10⁴), 346 (1.18 × 10⁴), 361 (1.78 × 10⁴),377 (1.64 × 10⁴).
2.3.2. Synthesis of the complexes2.3.2.1. Complex C1 (L1 + CuCl2·2H2O). To a solution of L1 (289 mg,0.887 mmol) in methanol (10 mL), CuCl2·2H2O (170 mg, 0.997 mmol)taken in the same solvent was added drop wise with constant stirring in
Scheme 1. General scheme for the synthesis of the ligandsused in this work. The substituents chosen allow variationin steric hindrance, electron donating ability and ar-omaticity.
N. Ribeiro et al.

the presence of two drops of NaOH 0.5 M. Immediately, the solutionturned olive green. Stirring was continued for ca. 2 h and a greencoloured compound separated out from the reaction mixture. The solidwas filtered, washed with cold methanol and dried in vacuum. (Yield:183 mg, 47%); ESI-MS (H2O) m/z [Found (Calcd)]: 351.2 (351.04)(100%) [M − Cl]+. Anal. Calc. for C13H14ClCuN5O3·NaCl.2.5H2O: C,31.82; H, 3.90; N, 14.27. Found: C, 31.8; H, 3.3; N, 14.1%. FTIR (KBr,cm−1): 3478 (w, pyr, eCH2OH), 2857 (m, pyr, hydrogen bonding),1575 (s, C]N), 1544 (s, C]C), 1430 (s, pz, C]N). UV–Vis [MeOH,λmax/nm (ε/M−1 cm−1)]: 236 (2.20× 10⁴), 317 (8.02 × 10³), 332(9.60 × 10³), 345 (9.85 × 10³), 383 (9.16 × 10³), 401 (1.48 × 10⁴),419 (1.64× 10⁴).
2.3.2.2. Complex C2 (L2 + CuCl2·2H2O). To a hot solution of L2(122 mg, 0.499 mmol) in methanol (10 mL), CuCl2.2H2O (85 mg,0.499 mmol) taken in H2O/MeOH (8 mL, 1:2 v/v) was added dropwise with constant stirring at 55 °C in the presence of two drops ofNaOH 0.5 M. Immediately, the solution turned olive green and thestirring was continued for ca. 5 h. A green coloured compoundseparated out from the reaction mixture. This was filtered, washedwith cold methanol and dried in vacuum. (Yield: 140 mg, 82%); ESI-MS(MeOH) m/z [Found (Calcd)]: 337.8 (337.99) (90%) [M−Cl+ MeOH]+; 340.4 (339.99) (100%) [M-H]−. Anal. Calc. forC12H11ClCuN4O2: C, 42.11; H, 3.24; N, 16.37. Found: C, 42.3; H, 3.5;N, 16.2%. FTIR (KBr, cm−1): 1618 (s, azomethine, C]N), 1539 (s,C]C), 1440 (m, pz, C]N). UV–Vis [DMF, λmax/nm (ε/M−1 cm−1)]:269 (1.40 × 10⁴), 287 (1.28 × 10⁴), 298 (1.41 × 10⁴), 313(1.38 × 10⁴), 327 (1.22 × 10⁴), 383 (1.02 × 10⁴), 396 (1.08 × 10⁴).
2.3.2.3. Complex C3 (L3 + CuCl2·2H2O). Compound C3 wassynthesized in a procedure similar to the one used for C1 with L3(272 mg, 0.992 mmol) instead of L1. A green coloured product wasobtained. (Yield: 302 mg, 81%); ESI-MS (MeOH) m/z [Found (Calcd)]:336.2 (336.00) (50%) [M−Cl]+; 273.5 (273.11) [M−H]− (100%);370.2 (370.00) (62%) [M−H]−. Anal. Calc. forC13H13ClCuN4O3·0.3H2O: C, 41.34; H, 3.63; N, 14.83. Found: C, 41.5;H, 3.7; N, 14.6%. FTIR (KBr, cm−1): 1617 (s, N]CO), 1605 (s,azomethine, eC]N), 1549 (s, C]C), 1440 (s, pz, C]N). UV–Vis[DMSO, λmax/nm (ε/M−1 cm−1)]: 261 (1.48 × 10⁴), 300(1.30 × 10⁴), 313 (1.43 × 10⁴), 325 (1.41 × 10⁴), 338 (1.13 × 10⁴),401 (7.48× 10³).
2.3.2.4. Complex C4 (L4 + CuCl2·2H2O). Compound C4 wassynthesized in a procedure similar to the one used for C2 with L4(144 mg, 0.499 mmol) instead of L2. A green coloured productseparated out from the reaction mixture. (Yield: 168 mg, 87%); ESI-MS (MeOH) m/z [Found (Calcd)]: 428.05 (428.3) [M + Acetonitrile+ H]+ (90%); 384.3 (384.01) (85%) [M−H]−. Anal. Calc. forC14H15ClCuN4O3·0.7H2O: C, 42.15; H, 4.14; N, 14.05. Found: C, 42.3;H, 4.1; N, 13.8%. FTIR (KBr, cm−1): 1619 (s, eN]CO), 1602 (s,azomethine C]N), 1540 (s, C]C), 1442 (s, pz, C]N). UV–Vis [DMSO,λmax/nm (ε/M−1 cm−1)]: 260 (1.13× 10⁴), 313 (1.04 × 10⁴), 326(1.10 × 10⁴), 339 (9.37 × 10³), 401 (6.78 × 10³).
2.3.2.5. Complex C5 (L5 + CuCl2·2H2O). Compound C5 wassynthesized in a procedure similar to the one used for C1 with L5(294 mg, 0.999 mmol) instead of L1. A green coloured productseparated out from the reaction mixture. (Yield: 301 mg, 76.8%); ESI-MS (MeOH) m/z [Found (Calcd)]: 455.1 (455.03) [M + Acetonitrile+ Na]+ (100%). Anal. Calc. for C16H13ClCuN4O2.1.1H2O: C, 46.63; H,3.72; N, 13.59. Found: C, 46.6; H, 3.4; N, 13.1%. FTIR (KBr, cm−1):3235 (m, NH), 1634 (m, eC]O), 1575 (m, azomethine, C]N), 1546 (s,C]C), 1456 (m, pz, C]N). UV–Vis [DMSO, λmax/nm (ε/M−1 cm−1)]:262 (2.41 × 10⁴), 271 (2.39 × 10⁴), 310 (9.15 × 10³), 325(1.16 × 10⁴), 333 (1.15 × 10⁴), 382 (6.81 × 10³), 415 (1.24 × 10⁴),433 (1.23× 10⁴).
2.3.2.6. Complex C6 (L6 + CuCl2·2H2O). Compound C6 wassynthesized in a procedure similar to the one used for C2 with L6(110 mg, 0.296 mmol) instead of L2. A green coloured productseparated out from the reaction mixture, after ca. 5 h. (Yield: 116 mg,85.5%); ESI-MS (MeOH) m/z [Found (Calcd)]: 433.4 (433.94)[M−Cl]+ (100%). Anal. Calc. for C21H16ClCuN5O2·2H2O: C, 49.91; H,3.99; N, 13.86. Found: C, 49.8; H, 3.3; N, 13.6%. FTIR (KBr, cm−1):3434 (br, eNeNH), 1664 (s, eC]O), 1612 (s, C]N), 1600 (m, C]C),1460 (s, pz, C]N). UV–Vis [DMF, λmax/nm (ε/M−1 cm−1)]: 268(2.19 × 10⁴), 283 (2.69 × 10⁴), 326 (1.33 × 10⁴), 340 (1.63 × 10⁴),395 (1.15 × 10⁴), 416 (1.81 × 10⁴), 435 (1.54 × 10⁴).
2.3.3. Chloride analysis by ion exchange chromatographySolutions of C1 in water and C3 and C5 in DMSO (ca. 4 mM) were
hydrolysed with a solution 0.1 M of H2SO4 by stirring overnight atroom temperature. The resulting solutions were diluted with Milliporewater so that the expected Cl− concentration was within the range ofthe measured calibration curve. A calibration curve was obtained withfive solutions of KCl, prepared from a 500 ppm stock solution inMillipore water, with concentrations ranging from 2.0 to 25 ppm. Thediluted, hydrolysed solutions of the complexes were injected into thechromatographic system and the chloride concentration determined.
2.3.4. X-ray crystal structure determinationThree-dimensional X-ray data were collected on a Bruker Kappa
Apex CCD diffractometer at low temperature for L2 and L3, by the ϕ-ωscan method. Reflections were measured from a hemisphere of datacollected from frames, each of them covering 0.3° in ω. A total of66,637 for L2 and 13,277 for L3 reflections measured were correctedfor Lorentz and polarization effects and for absorption by multi-scanmethods based on symmetry-equivalent and repeated reflections. Of thetotal, 3399 for L2 and 2459 for L3 independent reflections exceeded thesignificance level (∣F ∣/σ ∣F ∣) > 4.0, respectively. After data collection,in each case, an empirical absorption correction (SADABS) [17] wasapplied, and the structures were solved by direct methods and refinedby full matrix least-squares on F2 data using SHELX suite of programs[18–20]. In L2, hydrogen atoms were located in difference Fourier mapand left to refine freely, except for C(5) and C(17), which were includedin calculated positions and refined in the riding mode. In L3, hydrogenatoms were located in difference Fourier map and left to refine freely,except for C(5) and C(13), which were included in calculated positionsand refined in the riding mode. Refinements were done with allowancefor thermal anisotropy of all non-hydrogen atoms. A final differenceFourier map showed no residual density outside: 0.414 and−0.323 e·Å−3 for L2 and 0.168 and −0.128 e·Å−3 for L3. A weightingscheme w= 1 / [σ2(Fo2) + (0.085900P)2 + 0.00000P] for L2 andw= 1 / [σ2(Fo2) + (0.034600P)2 + 0.327200P] for L3, where P =(|Fo|2 + 2|Fc|2) / 3, were used in the latter stages of refinement.Further details of the crystal structure determination are given inTable 1. CCDC 1532353–1532354 contain the supplementary crystal-lographic data for the structures reported in this paper. These data canbe obtained free of charge via http://www.ccdc.cam.ac.uk/conts/retrieving.html, or from the Cambridge Crystallographic Data Centre,12 Union Road, Cambridge CB2 1EZ, UK; fax: (+44) 1223 336 033; ore-mail: [email protected].
2.3.5. Stability studies in aqueous mediumStock solutions of the complexes were prepared in DMSO (except
complex C1 which was dissolved in water) with a concentration of500 μM. Dilutions were then prepared containing 125 μL of the stocksolution and 2375 μL of PBS buffer (pH 7.4, 10 mM), having a finalcomplex concentration of 25 μM and 5% DMSO. The UV–Visible spectra(250–700 nm) were recorded for 2½ h, with 5 min between each twoconsecutive measurements. Two other spectra were recorded after 3and 24 h.
N. Ribeiro et al.
2.3.6. Evaluation of the antioxidant activityThe compounds were dissolved in DMSO at an initial concentration
of 1 mM. A 98.5 μM solution of DPPH (1,1-diphenyl-2-picryl-hydrazyl)in methanol (2 mg/50 mL) was prepared as stock, and kept in the darkduring the entire assay. Five samples were prepared with a final volumeof 2500 μL, containing 1500 μL of DPPH and different volumes of thecompounds' solution and methanol, in order to obtain molar ratios n(compound)/n(DPPH) of 0, 25, 50, 75 and 100%. These were vigor-ously shaken and kept in the dark for 30 min. The absorbance was re-corded between 300 and 700 nm. The antioxidant activity (% scaven-ging activity) is calculated as.
⎜ ⎟= ⎛⎝ − ⎞⎠ScavAct% A AA
1000 f
0 (1)
where A0 and Af are the absorbance values at 516 nm in the absenceand presence of the compound, respectively. The IC50 value (the con-centration required to scavenge DPPH radical by 50%) is determined bya linear regression where the % of scavenging activity is 50. The pro-cedure was also done for a known antioxidant: ascorbic acid, the po-sitive control (PC).
2.4. Biological assays
2.4.1. Preparation of solutions for biological assaysStock solutions of DNA were prepared by dissolving the nucleic acid
in PBS buffer (pH 7.4), kept at 4 °C for about 48 h and used within aweek. Solutions of DNA gave ratios of absorbance A260/A280 of ca. 1.9,indicating that the DNA was sufficiently protein free [21,22]. Theconcentration of the prepared ctDNA stock solutions were calculatedbased on their absorbance at 260 nm by using the per nucleotide ex-tinction coefficient ε260 = 6600 M−1 cm−1 [22].
The thiazole orange (TO) solution was prepared by dissolving~1 mg of the compound in 6 mL of deionized water, providing a so-lution with 317 μM concentration, which was used in the same day.
The fatty acid free HSA solutions were prepared by dissolving theprotein in PBS buffer (pH 7.4). The solutions were gently swirled andallowed to equilibrate overnight at 4 °C. They were used within 24 h.The HSA concentrations were estimated spectrophotometrically
considering an extinction coefficient of 36,850 M−1 cm−1 at 280 nm[23]. Typically, the concentration of the HSA stock solution was ca.40 μM.
2.4.2. Thiazole orange displacement assaysPrior to titration with the complexes, DNA was saturated with
thiazole orange. Selected volumes of the ctDNA and TO stock solutionswere added in the fluorescence cuvette, with a total volume of 2500 μLcompleted with PBS buffer, in order to ensure a molar ratio TO/DNA of0.8. The fluorescence emission spectrum was recorded between 520 nmand 700 nm. The following parameters were used: λexc = 509 nm, ex-citation and emission bandwidths of 5 nm.
Successive aliquots of the complexes' stock solutions were addeddirectly to the cuvette and the fluorescence emission spectra were re-corded for each of them. Blank assays were done for each complexwhere the fluorescence under the same concentrations for ctDNA andcomplex was recorded and subtracted from each corresponding emis-sion spectrum.
The decrease of the fluorescence emission intensity at 530 nm, theemission maximum, was analyzed according to the Stern-Volmerequation to determine the fluorescence quenching constant:= +I I 1 K [Q]0 SV (2)
where I0 and I are the fluorescence emission intensities of the TO-ctDNAsolutions in the absence and in the presence of quencher, respectively,KSV is the linear Stern-Volmer quenching constant, dependent on theratio between the bound concentration of TO and the concentration ofDNA, and [Q] is the molar concentration of the quencher. A plot of I0/Iversus [Q] will give KSV as the slope.
2.4.3. DNA cleavage activityThe plasmid DNA (pDNA) used for gel electrophoresis experiments
was pA1, which consists of a full-length cDNA from CytochromeP4baby50 CYP3A1 inserted in the PBS plasmid vector (pBluescribe,Strata-gene, UK) and described elsewhere [24]. See Supplementaryinformation for further details.
2.4.4. HSA binding studiesTo evaluate the interaction of the complexes with HSA, to a solution
of ca. 1.5 μM of HSA in PBS (pH 7.4), successive aliquots of a stocksolution of each complex in DMSO were added directly to the cuvette(optical path 1.0 cm) and the fluorescence emission was recorded be-tween 305 and 700 nm with excitation at 295 nm, and excitation andemission bandwidths of 5 nm. The DMSO % was kept below 2%. Themaximum emission wavelength is close to the Raman peak upon ex-citation at 295 nm. Therefore, for the Stern-Volmer plots, the emissionat 340 nm was used and blank samples (in the absence of HSA) with thesame concentration of the complexes were recorded and subsequentlysubtracted from the corresponding emission spectra containing thefluorophore. Moreover, the fluorescence emission intensity was cor-rected for the absorption and inner filter effects using UV–Visible ab-sorption data recorded for each sample, since all complexes show ab-sorption in the measured region [25,26].
2.4.5. Cell viability assaysThe tumour cell lines MCF7 (breast) and PC3 (prostate) were cul-
tured in DMEM (Dulbecco's Modified Eagle Medium) containingGlutaMax I (MCF7) and RPMI 1640 (PC3) culture medium (Invitrogen)supplemented with 10% FBS and 1% penicillin/streptomycin at 37 °C ina humidified atmosphere of 5% CO2 (Heraeus, Germany). Cell viabilitywas evaluated using a colorimetric method based on the tetrazoliumsalt MTT (MTT = [3-(4,5-dimethylthiazol-2-yl)-2,5-diphenylte-trazolium bromide]), which is reduced in viable cells to yield purpleformazan crystals. Cells were seeded in 96-well plates at a density of2 × 104 cells (PC3) and 5 × 10⁴ cells (MCF7) per well in 200 μL ofculture medium and left to incubate overnight for optimal adherence.
Table 1Crystal data and structure refinement for L2 and L3.
L2 L3
Formula C12H12N4O2 C13H14N4O3
Formula weight 244.26 274.28T, K 100(2) 100(2)Wavelength, Å 0.71073 0.71073Crystal system Monoclinic MonoclinicSpace group P21/c Cca/Å 25.1099(8) 10.9504(4)b/Å 7.4673(3) 10.3636(3)c/Å 12.5831(4) 11.4465(3)β/° 98.503(2) 98.9312(18)V/Å3 2333.44(14) 1283.26(7)Z 8 4F000 1024 576Dcalc/g cm−3 1.391 1.420μ/mm−1 0.099 0.104θ/(°) 0.82 to 26.44 3.10 to 26.38Rint 0.0637 0.0259Crystal size/mm3 0.43 × 0.12 × 0.12 0.28× 0.12× 0.12Flack parameter (x) 0.0(8)Goodness-of-fit on F2 1.062 1.046R1[I > 2σ(I)]a 0.0444 0.0279wR2 (all data)b 0.1382 0.0661Largest differences peak and hole
(e·Å−3)0.414 and −0.323 0.168 and −0.128
a R1 = Σ ∣|Fo| − |Fc|∣ / Σ ∣Fo ∣.b wR2 = {Σ[w(∣|Fo|2 − |Fc|2 ∣)2]∣ / Σ[w(Fo2)2]}1/2.
N. Ribeiro et al.

After removal of the medium, 200 μL of a dilution series of the com-pounds (from stock solutions of 10 or 5 mM in DMSO) in fresh mediumwere added and incubation was performed at 37 °C/5% CO2 for 48 h.For the higher concentrations controls of 1% DMSO were done. At thisconcentration DMSO did not present cytotoxic effects. At the end of theincubation period, the compounds were removed and 200 μL of a MTTsolution (500 μg/mL) was added to the cells. After further incubationfor 3 h at 37 °C/5% CO2, the medium was removed and the purpleformazan crystals were dissolved in 200 μL of DMSO by shaking. Thecell viability was evaluated by measurement of the absorbance at570 nm using a plate spectrophotometer (Power Wave Xs, Bio-Tek). Thecell viability was calculated dividing the absorbance of each well bythat of the control wells (untreated cells) and expressed as a percentage.Each experiment was repeated at least twice and each concentrationwas determined in at least six replicates.
2.4.6. Apoptosis assaysThe effect of selected complexes on caspases 3/7 was determined in
the prostate cancer cells PC3 using the Caspase-Glo® 3/7 Assay(Promega). Briefly, cells, plated in 96 wells were treated with com-plexes C5 and C6 for 48 h at concentrations equivalent to their IC50
values. After 48 h, the medium was removed from each well and thecaspase reagent was added in a 1:1 (v/v) in medium and the plate wasshaken in an orbital shaker for 30 s at 300–500 rpm. The plate wasincubated at room temperature and the luminescence was measuredusing an Infinite 200 Plate Reader (Tecan). Each experiment was re-peated twice and each concentration was tested with at least three re-plicates. Results (mean ± SD) were expressed as RLU (relative lumi-nescent units).
2.4.7. Imaging Cu distribution in cellsPC3 cells (3–6 × 10⁵) were prepared for nuclear microscopy ex-
periments by seeding the cells on silicon frames with 5× 3 windows of0.56 mm2 covered with 100 nm thick silicon nitride membrane (SilsonLtd., UK), in 6-well plates and incubated overnight. The silicon nitridewindows were previously sterilized with UV light. Cells were incubatedwith complex C6 for 24 h at 20 μM (IC50 at 24 h) and 2 h at 200 μM at37 °C in a 5% CO2 incubator. After incubation the medium was re-moved and the windows were washed with cold PBS. Samples werefrozen at −80 °C and then dried in a cryostat at −25 °C for subsequentanalysis.
The elemental distributions were carried out using the nuclear mi-croscopy facility of the CTN/IST [27]. A 2.0 MeV proton beam wasfocused down to of 2 μm2 and scanned across the target cell on thesilicon nitride window. The simultaneous application of PIXE (ParticleInduced X-ray Emission), RBS (Rutherford Backscattering Spectro-scopy) and STIM (Scanning Transmission Ion Microscopy) deliverimages of the sample morphology besides providing information on theelemental distributions of and concentrations. By scanning whole cells,images of the chemical elemental distributions, such as Cu and otherphysiologically relevant elements in individual cells can be produced.Point analyses in selected transepts across cells rendering concentrationprofiles were produced. Spectral and positional information were re-corded using the OMDAQ [28] acquisition system and elemental con-centrations were calculated with the Dan32 program as describedelsewhere [29,30]. Images of whole PC3 cells were taken with
25 × 25 μm2 scan sizes.
3. Results and discussion
3.1. Synthesis and characterization of ligands
The Schiff bases derived from pyrazole were synthesized by con-densation of the corresponding carbohydrazide with different alde-hydes (see Scheme 1). The reactions were carried out in methanol witha catalytic amount of acetic acid to ensure the formation of the azo-methine and separation of the product from the mixture. Moderate togood yields (60–88%) were obtained. They were characterized by ele-mental analysis, spectroscopic techniques and single crystal X-ray dif-fraction — see Experimental part and Table S1 in Supplementary In-formation.
1H NMR spectroscopy confirms the presence of the azomethineproton (HC]N) [31] — see Table S1. Another peak that was clearlyidentified at δ 2.30 ppm, integrating for 3 protons, was unambiguouslyassigned to the methyl group attached to the pyrazole ring. Moreover,the effect of having a pyridine ring as substituent in the nitrogen can beobserved since this signal appears at 2.32 ppm for L5 and at 2.71 ppmfor L6 [16]. FTIR spectroscopy allowed the identification of char-acteristic functional groups [16,32–34]. The band corresponding to thestretching vibration of the azomethine ν(C]N) appears between1592 cm−1 and 1626 cm−1, as expected for a Schiff base coupled to anaromatic ring [35]. The frequency for the CeO stretching in the phenolgroup appears at lower wavenumbers [36].
The UV–visible electronic absorption spectra of the ligands wererecorded in MeOH for L1, DMF for L2 and L6, and DMSO for L3–L5,according to the solubilities of the corresponding complexes, since allligands are soluble in any of these solvents. The spectra of all Schiffbases present two set of bands corresponding to n → π* (325 nm to377 nm) and π→ π* (276 nm to 325 nm) transitions of both the car-bonyl moiety and imine bonds, present in the molecules [37–39].Moreover, for compounds L5 and L6, sharing a naphthalene moiety, itwas also possible to assign the bands corresponding to the π → π*(262 nm to 275 nm) transition of the aromatic rings. Compounds L1–L6were also characterized by electrospray ionization mass spectrometry(ESI-MS) and the peaks corresponding to the molecular ion wereidentified in the positive and/or negative mode, according to the cal-culated exact mass [32]. The assignments are listed in Table S1. Otherpeaks corresponding to species [L + Na]+, [L + Cl]−, [2L + H]+ and[2L − H]− were also identified (see experimental section).
The molecular structure of L1–L6 was further confirmed by thecrystal structure obtained for L2 and L3 by single crystal X-ray dif-fraction — see the ORTEP diagrams of L2 and L3 in Fig. 1. Both mo-lecules crystallize in the monoclinic crystal system (for details seeTable 1). Selected bond distances (Å) and angles (°) are listed in TableS2. The asymmetric unit of L2 contains two molecules, which interactthrough π-π clouds (see Fig. 1). The distances between π clouds of thecentroids between phenyl rings and C]N groups are: dc1–c2 = 3.333(5)Å [c1: C(6)-N(2) and c2: C(19)-C(20)-C(21)-C(22)-C(23)-C(24)] anddc3–c4 = 3.408(6) Å [c3: C(13)-N(5) and c4: C(2)-C(3)-C(4)-N(3)-N(4)].The asymmetric unit of L3 contains only one molecule. The phenyl ring[C(7)-C(8)-C(9)-C(10)-C(11)-C(12)] is almost flat with respect to thepyrazol ring [C(2)-C(3)-C(4)-N(3)-N(4)], the torsion angle being
L2 L3
Fig. 1. ORTEP plot of compound L2 and L3. The asymmetricunit of L2 contains two molecules and the π–π stacking inter-actions in the asymmetric unit of the compound L2 are shown.All the non-hydrogen atoms are presented by their 50% prob-ability ellipsoids.
N. Ribeiro et al.

7.44(12)°. π–π interactions and hydrogen bonds between the molecules,both in L2 and L3 determine the crystal packing (see SI).
3.2. Synthesis and characterization of the complexes
The synthesized compounds L1–L6 were coordinated to copper(II)by stirring a methanolic solution of both reactants, compounds L1–L6and CuCl2·2H2O, for a few hours at ca. 50 °C, in the presence of NaOH(0.5 M) — see Scheme 2. In all syntheses a green compound separatedfrom the reaction mixture (C1–C6) in moderate to good yields(47–87%).
Upon coordination of the ligands to copper(II) changes are expectedin their spectroscopic signatures. In the FTIR spectra the deprotonationand coordination of the phenolic oxygen leads to the disappearance ofits OH stretching band - see SI. It should be noted that the free ligandshave two keto-enol tautomers, in which the proton can be found in theN- or the O-atoms. However, all data supports coordination in the ketoform. Since upon coordination the NH bond cannot stretch with thesame intensity as in the free ligand, this band is included in a broadenvelope centered around 3300–3400 cm−1 due to the presence ofwater molecules in the structure. As expected, the bands correspondingto the carbonyl (C]O) and to the azomethine (C]N) shift to lowerwavenumbers upon coordination to the copper center [34,40].
Characterization of the complexes by UV–Vis electronic absorptionspectroscopy is included in SI and in Fig. 2. Complex C1 is very solublein water and sparingly in DMSO (1 mM). All other complexes are so-luble in DMSO (3 mM) after 1 h under sonication. Overall, bands ran-ging from 280 nm to 460 nm in all the complexes' spectra have similarorigin as the bands from the corresponding ligands, ranging from260 nm to 400 nm, arising mainly from transitions within the imine andcarbonyl moieties. Additionally, the strong band(s) appearing at ca.430–440 nm for complexes C1–C6 are due to charge transfer transitionsbetween metal and ligand [38,41]. Bands for the π→ π* transition ofthe naphthalene moiety of C5 and C6 (at ca. 270 nm) do not suffermuch changes when compared to the respective ligands, since this partof the molecule is not directly involved in the coordination to the metalion. As expected for Cu(II) complexes with a d9 configuration, d–dtransitions appear as broad bands centered around 700 nm in DMSO[37,42].
All complexes were also characterized by electron paramagneticresonance (EPR). The spectra were measured in DMSO (and methanolfor C1) at 77 K — see Fig. 3 and SI section. The spin Hamiltonianparameters were obtained by computer simulation of the experimentalspectra using a program from Rockenbauer and Korecz [43] and arepresented in Table 2.
Due to i) poor solubility of the complexes, ii) high viscosity of theDMSO solutions, and iii) high dielectric constant of DMSO, spectra withpoor resolution and broad bands were obtained in most cases.Moreover, superhyperfine splitting due to coupling of the electron spinwith the 14N nucleus (I= 1) was not observed, but this is often the caseunder these measurement conditions. All complexes, except C2, origi-nate axial spectra. For this compound, only one broad signal at g ~ 2.1(see SI section) is observed, suggesting the presence of extensive ex-change coupling between the molecules [44]. For all other complexesgz > gx,y > 2.0, indicating the presence of a dx2-y2 ground state in
copper(II), located in square-based geometries.The Peisach-Blumberg plot [45], updated by Sakagushi and Addison
[46] correlates Az with gz and introduces the empirical parameter,known as the tetrahedral distortion index, gz/Az. The plot of Az vs. gz,included in SI section, shows that the parameters for complexes C1–C6fall in the region usually found for N4, N2O2 and O4 coordination.Moreover, since for C1–C5, gz/Az = 119–134 (×104 cm), then, squareplanar geometries can be assigned to these complexes, while in C6strong tetrahedral distortions must be present [46].
The complexes were also characterized by ESI-MS (see SI) and theassignment is presented in Table 3. It was always possible to make re-levant assignments. Moreover, in all assigned complexes' peaks, theisotopic pattern due to 63Cu and 65Cu was observed.
Combining all the analytical data on the complexes, namely ele-mental analysis and spectroscopic studies, binding modes involving the
OH
N
ONH
N
N
CH3R
Ar
O
N
N
H
OCu
Cl
N
N
CH3
R
Ar
CuCl2.2H2O nH2O
Scheme 2. General synthetic scheme for the formation of the Cu(II)-complexes. R is H or pyridyl and Ar stands for 1 or 2 fusedaromatic rings.
Fig. 2. UV–visible electronic absorption spectra of a) 0.1 mM solutions of the complexesin DMSO; Inset: Spectra measured in the visible range for 3 mM solutions (DMSO)showing the d-d band (after 1 h of sonication). b) UV–visible electronic absorption spectraof L5 and C5 in (0.1 mM) DMSO solution.
N. Ribeiro et al.

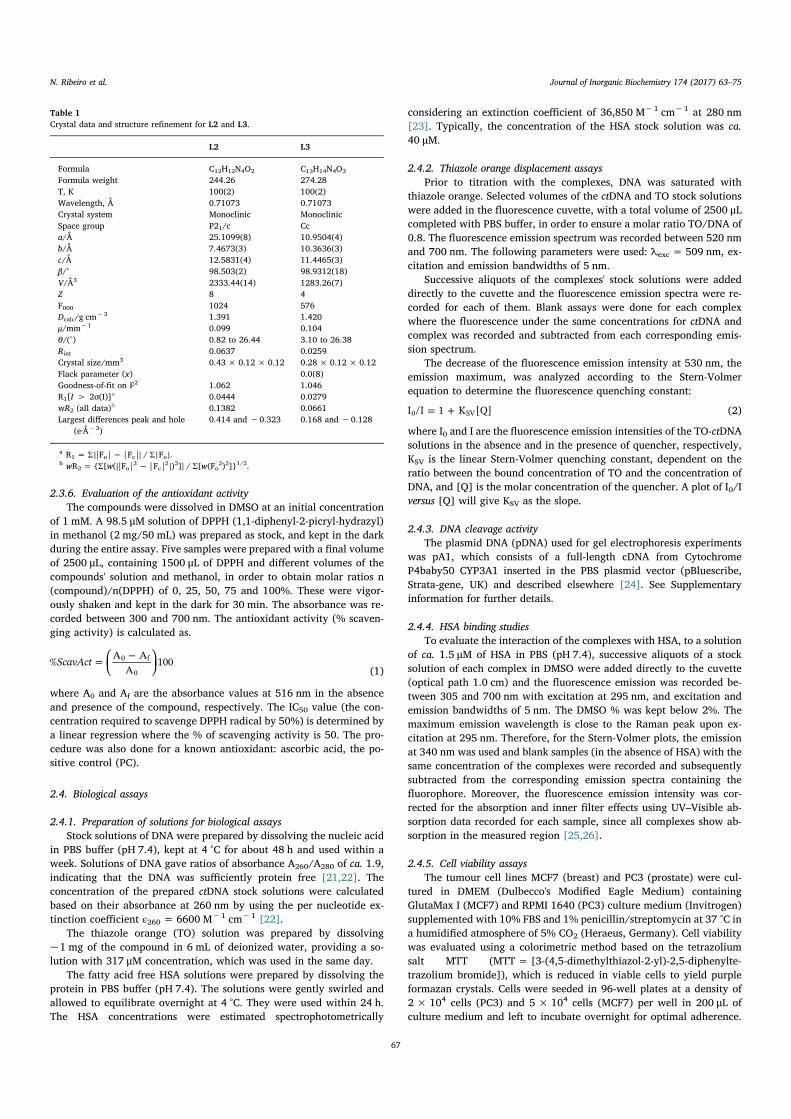
ligand coordinated in a keto form, through O-phenolate, N-imine andO-carbonyl atoms, are proposed. The coordination sphere and neu-trality of the Cu(II)-complexes is achieved through additional co-ordination of a chloride ion. The presence of the chloride ions (eithercoordinated or as counter ions) is suggested by the CNH elementalanalysis and confirmed by ion exchange chromatography. Data (notshown) showed that two chloride ions are present in the structure of C1,while only one was detected in each of the complexes' structures of C3and C5 (Cl− was not analyzed in the other complexes). Therefore wecan conclude that in C1 there is probably a salt (NaCl) molecule trappedin the structure — see Scheme 3.
3.3. Stability studies
Since biological studies are carried out in aqueous media at phy-siological pH it is necessary to ensure that the complexes do not pre-cipitate in the aqueous environment and that they are stable in thetimescale of the studies. Thus, the stability of the complexes wasevaluated by UV–Vis spectroscopy in buffered solutions of pH 7.4containing a minimum amount of organic solvent, needed to solubilizethe metal complexes. Changes observed with time for each complexsolution were followed through UV–Visible spectroscopy. Only C4 andC5 showed some degradation during the time frame of the study (24 h),as depicted in Supplementary Information. C2, C3 and C6 showed somesolubility issues, precipitating after a few hours and therefore lowerabsorbance values were recorded with time. However, in the first 3 honly small changes occurred. Complex C1 maintains its original form insolution, even after a long period of time. Most of the observed changesare due to the low solubility of the complexes in the aqueous media andtherefore since lower concentrations are used in the biological assayswe expect that both the stability and the solubility are not compro-mised.
3.4. Radical scavenging activity
The antioxidant activity of the compounds was evaluated, as it is animportant property for the detoxification of free radicals that areformed in the oxygen metabolism. Schiff base ligands and metal com-plexes have been studied as antioxidant agents against free radicals[10]. Scavenging of the DPPH free radical is the basis of a commonantioxidant assay [47]. The antioxidant activity of all compounds wasdetermined as well as the IC50, the concentration required to scavenge50% of the DPPH activity, the results being presented in Table 4.
None of the tested compounds shows significant antioxidant activityas can be seen from the values included in Table 4. When comparedwith the positive control, ascorbic acid, the IC50 values of the testedcompounds are substantially higher, implying that most of them do notbehave as antioxidants. In some cases, the copper complexes showedbetter activity than the corresponding ligands, as in the case of C2, C3and C5. On the contrary, in C1 and C4 the presence of Cu(II) has anegative effect in the antioxidant power, with C1 showing a higher IC50
value when compared with L1, which is the best among L1–L5; and C4having no activity. Overall, it can be concluded that the best compoundis L1 (IC50 = 49.6 μM), which is the ligand derived from pyridoxal.
When L6 was tested no activity was recorded while with C6 anincrease in the absorbance was obtained, meaning that the concentra-tion of radicals in solution was increased – see SI.
3.5. Interaction with biological molecules
3.5.1. Interaction with ctDNAIn order to investigate if the complexes are able to interact with
DNA, a competition fluorescence quenching study with thiazole orange(TO), a known DNA intercalator, and calf thymus DNA (ctDNA) wasdone for some complexes. Interactions with DNA are of extreme im-portance when evaluating compounds for anti-cancer applications.Since cancer is characterized by a highly genomic instability [2], thegenetic material is a preferential target for anti-cancer drugs. The factthat the mechanism of action of cisplatin involves DNA binding is an-other reason to evaluate this property.
Fluorescence spectroscopy is a simple method to examine the DNAbinding mode of metal complexes, and competitive binding experi-ments based on the displacement of the intercalating probe TO fromctDNA can give valuable information. If the complex displaces TO fromDNA, the fluorescence of TO decreases due to free molecules being lessfluorescent than the DNA bound molecules, since TO becomes moreaccessible to quenching by solvent molecules. However, not only theDNA intercalators but also DNA groove binders can cause the reductionin the emission intensity of DNA bound TO, but to a lower extent [48].
Fig. 4 shows the emission spectra obtained upon addition of com-pound C5 to solutions containing molar ratios of TO:DNA = 0.8. Si-milar studies were conducted with complexes C3–C6 and the quenching% upon their addition is depicted in Fig. 4B.
With the exception of C3, all tested complexes (C4–C6) were able toreduce the fluorescence intensity (to 69–22%), indicating that they areable to compete with TO for the same binding sites, or interact withDNA at different sites, near the bound TO. Since complexes C1 and C2have structures similar to C3 and C4, and these did not show significant
Fig. 3. First derivative X-band EPR spectra of complex C5, 1 mM in DMSO, measured att = 77 K. The experimental spectra are presented in red and the simulated in blue (seeTable 2 for parameters). (For interpretation of the references to colour in this figure le-gend, the reader is referred to the web version of this article.)
Table 2Spin Hamiltonian parameters for the Cu(II)-complexes obtained by computer simulation of the experimental spectra [43].
Complex gx,y gz Ax,y (×10−4 cm−1) Az (×10−4 cm−1) gz/Az (×104 cm)
C1 2.069 2.305 0.7 172.2 134C3 2.083 2.280 1.5 190.3 120C4 2.079 2.283 1.5 192.2 119C5 2.081 2.288 5.8 174.1 131C6 2.062 2.291 0.8 158.1 145
N. Ribeiro et al.
DNA binding ability, C1 and C2 were not tested in this assay.The quenching data was analyzed through the Stern-Volmer plots
(see SI). Generally, the linearity of the Stern-Volmer plot implies theexistence of one type of binding site in the proximity of the fluorophore,or several sites equally accessible. Thus, the deviation from linearity ofthe Stern-Volmer plot indicates the existence of more than one bindingsite with different accessibilities and/or the occurrence of combinedquenching [49].
The apparent binding constant of TO to ctDNA has been determined,KTO-ctDNA = 3.16 × 10⁵ M−1 [50]; and the concentration ratio wherethe fluorescence intensity is 50% quenched ([Q]) can be obtained fromthe experimental data, thus, the apparent binding constant for thecomplex to DNA (Kapp) can be estimated through:
=−K [TO] K [Q]TO ctDNA app (3)
The calculations were done and the results are presented in Table 5.In Supplementary Information details for the evaluation of complexesC3–C6 are given.
Although C3 and C4 are structurally similar, the only differencebeing the length of the substituent on the phenolate ring (methoxy orethoxy), C3 is unable to displace TO from DNA, the fluorescence in-tensity remaining almost unaltered with increasing concentrations ofthe complex, see Figs. 4B and S16(a) — while C4 shows quenchingability. Since C5 and C6 have larger delocalized π systems, due to thepresence of the naphthalene aromatic group, which allows extra vander Waals interactions, they were evaluated following the same pro-cedure. C1 and C2 were not tested.
From the analysis of the data included in Table 5 it can be concludedthat C5 is a better TO competitor than any of the other complexes sincehigher KSV and Kapp values were obtained. Additional evidence is ob-tained from the upward curvature towards the y axis found in the Stern-
Volmer plot of C5 (see Fig. 5A). This behaviour indicates that thequenching process involves a mixed mechanism. Since a similar result isnot obtained with C6, possibly because the pyridine substituent at thepyrazole ring imposes larger steric hindrance, it implies that inter-calation of the naphthalene ligand is not the only binding mode re-sponsible for the interaction; otherwise, roughly the same KSV valuesshould have been obtained.
In general, a variety of processes can result in fluorescencequenching, usually divided in static and dynamic (energy transfer).Static quenching involves the formation of a ground state complex, butsince the emission being monitored is from TO, it can be assumed thatstatic quenching is not driven from the formation of a complex betweenDNA and the complex, but rather from an influence that C5 may haveby becoming closer to the system — sphere of action [49]. A factor, exp(V[C5]) where V is the static constant and [C5] is the total con-centration of the complex, can be introduced into the Stern-Volmerequation in order to describe mixed quenching [51].
= + C5II
(1 K [ ])eV C50D [ ]
(4)
The static, V, and the dynamic, KD, quenching constants can beobtained by plotting [I0/(IeV[C5])] − 1 vs. [C5] till a linear plot is ob-tained.
The values of KD and V found for C5 are (1.05 ± 0.07) × 105 M−1
and (7.46 ± 0.04) × 103 M−1, respectively. It can be seen that themagnitude of the static quenching constant (V) is more than one orderof magnitude smaller than the dynamic quenching constant. Overall, itis clear that complex C5 shows very good ability for interacting with thesystem TO-ctDNA, quenching its fluorescence.
We can therefore conclude that the interaction probably involvesπ–π stacking between the aromatic rings and the DNA base pairs.
DNA cleavage activity studies were also done but with the exceptionof C1, none of the tested compounds L2–L5 or complexes C2–C5showed any relevant nuclease activity in the whole concentration rangemeasured (2.5–200 μM), either in the absence or presence of MPA (seeSupplemental Information).
3.5.2. HSA binding studiesIn order to reach DNA, or any other cellular target, drug needs to
reach the cell. Human serum albumin (HSA) plays a key role inmammal organisms, since it is the main transporter of endogenous andexogenous molecules and therefore the determination of a potentialdrug binding affinity to this protein is crucial. Ceruloplasmin is themajor copper-carrying protein in the blood; it carries> 95% of thetotal copper in healthy human plasma [52]. However, despite the needfor copper in ceruloplasmin function, namely its role in iron metabo-lism, this protein apparently plays no essential role in the transport ormetabolism of copper [52] and most studies consider serum albumin as
Table 3Peak assignment for the copper complexes by ESI-MS.
C1 C2 C3 C4 C5 C6
Peak assignment [M−Cl]+ [M−H]− [M−H]− [M−H]− [M + ACN + Na]+ [M−Cl]+
Calc. exact mass (g/mol) 351.04 339.99 370.00 384.01 455.03 433.94Found m/z 351.22 340.40 370.22 384.31 455.08 433.42
ACN = acetonitrile.
N
O
OH
N
NH NH
N
OCu
Cl NaCl2.5 H2O
Scheme 3. Proposed structure for complex C1.
Table 4IC50 values and molar ratio of compound to DPPH obtained from the DPPH assays for the synthesized compounds.
L1 C1 L2 C2 L3 C3 L4 C4 L5 C5 L6 C6 AC
IC50 (μM) 49.6 364 212 89.2 149 107 156 n.a. n.a. 66.4 n.a. n.a 10.9n(comp)/n(DPPH) 0.84 2.55 3.59 1.56 2.52 1.88 2.65 n.a. n.a. 1.16 n.a. n.a. 0.18
n.a. means that no activity was recorded; AC means ascorbic acid (the positive control).
N. Ribeiro et al.

the major transporter of copper and of Cu-complexes [53–55].Human serum albumin contains only one tryptophan residue in its
structure, Trp214, located in subdomain IIA, near Sudlow's drugbinding site I [56]. This residue confers fluorescence emission to theprotein upon excitation at 295 nm; it is very sensitive to its local en-vironment, and its fluorescence emission easily responds to changes inthe vicinity of the indole ring that may occur upon drugs' binding [56].To evaluate the interaction of compounds C1–C6 with HSA, solutionscontaining HSA were titrated with each complex, fluorescence emissionspectra being measured upon each addition (see experimental part fordetails). For the Stern-Volmer analysis of data the emission at 340 nmwas used and blank samples (in the absence of HSA) with the sameconcentration of the complexes were recorded and subtracted fromeach corresponding emission spectra. The effect of C1–C6 in the HSAfluorescence emission is compared in Fig. 6.
The quenching was evaluated with the Stern-Volmer equation, al-lowing the determination of KSV from the slope of the linear plot of I0/Ivs. [Q]. Knowing that the average lifetime for the Trp214 in HSA isτ0 = 2.04 × 10⁻⁹ s, under the experimental conditions used (thisvalue was measured by us and details will be presented in a publicationunder preparation), the bimolecular constant, kq, can be calculated foreach complex using the relationship kq = KSV / τ0, and the accessibilityof the fluorophore to the quencher evaluated [49].
Titration of HSA with C1 yields a linear relationship in the Stern-
Volmer plot (see Fig. 7), the kq = 3.08× 10¹³ M−1 s−1 value beinglarger than the limiting diffusion constant of the biomolecules(Kdif = 2.0 × 10¹⁰ M−1 s−1) [49], indicating that the fluorescencequenching is consistent with a static mechanism [57]. Assuming that acomplex is formed between the compound and albumin, employment ofthe Scatchard equation enables the determination of the binding con-stant and the number of binding sites for this system. Results are in-cluded in Table 6.
Similarly to that observed with the system TO-ctDNA, complex C3,containing the methoxy derivative, was unable to quench the fluores-cence of albumin (see SI section), meaning that this complex does notbind to the protein, at least in a way affecting the fluorescence of theTrp214 residue. The determination of the parameters for all other Cu(II)-compounds is detailed in the SI section and the values are includedin Table 6.
Fig. 4. a) Emission spectra (λex = 509 nm) ofTO-ctDNA (1.6 μM:2.1 μM) in the absence andpresence of increasing concentrations of C5(0.7–16 μM) in 2% DMSO/PBS pH 7.4, aftersubtraction of blank emission spectra (arrowindicates variation with increasing concentra-tion of the complex). b) Effect of complexesC3–C6 in TO-ctDNA fluorescence emission: re-lative fluorescence intensity (%) at emissionmaxima with increasing complex concentration.
Table 5Thiazole orange (TO) quenching assay results for Cu-complexes C3–C6.
KSV × 104
[M−1]R2 Concentration at 50%
quenching/μMKapp × 104 [M−1]
C3 n.a. n.a. n.a. n.a.C4 4.8 ± 0.8 0.870 16 3.20C5 12.4 ± 0.8 0.956 8.7 6.36C6 5.3 ± 0.2 0.988 14.9 3.44
Fig. 5. a) Stern-Volmer plot at 530 nm for the fluorescencequenching of TO-ctDNA with increasing concentration ofC5 (0–16 μM). (I0/I data were corrected for reabsorptionand inner-filter-effects). b) Modified Stern-Volmer plot at530 nm for the fluorescence quenching of TO-ctDNA withincreasing concentrations of C5, considering both dynamicand static quenching mechanisms.
Fig. 6. Effect of complexes C1–C6 in HSA fluorescence emission. Relative fluorescenceintensity (%) at emission maxima with increasing complexes' concentration.λex = 295 nm and λem = 340 nm.
N. Ribeiro et al.

The bimolecular constants [between (1.08 and15.6) × 1013 M−1 cm−1] support a static mechanism and the resultsclearly show that C6 presents an HSA binding affinity much larger thanany of the other complexes. Additionally, the constants for C5 (logk = 4.94 ± 0.18) are higher than those obtained for C1–C4, showingthe importance of the aromatic delocalization, suggesting that the π–πinteractions play an important role in this process. For the Cu(II)complexes with smaller aromatic systems, C1, the complex derivedfrom pyridoxal stands out, showing values for kq and log K comparableto those of C5.
3.5.3. Cytotoxicity in human tumour cell linesThe cytotoxicity of the complexes C1–C6 and the respective ligands
L1–L6 was evaluated using the MTT assay on PC3 prostate and MCF7breast human cancer cells. The IC50 values were determined and arepresented in Table 7 and Fig. S22.
In general, the anti-cancer activity of C1–C4, as judged from themeasured IC50 values (Table 7), are modest. Noteworthy, the obtainedIC50 values show that the presence of larger aromatic π-systemsstrongly favours the anti-proliferative ability in both cell lines. It isnotorious the difference between the values retrieved for C1–C4, con-taining only one aromatic ring in the respective ligand, and those ob-tained for C5 and C6, both with naphthalene derivatives. These com-pounds present IC50 values far lower than cisplatin (PC3 48 h,IC50 = 57.3 ± 14; MCF7 72 h, IC50 = 28 ± 6) [39]. The presence ofan aromatic substituent at the pyrazole ring appears to have an effect inthe PC3 cells but not in the MCF7 cells, as can be observed by the IC50
values obtained for C5, unsubstituted pyrazole, and C6, with a pyridinering substituent at the pyrazole nitrogen (Table 7). C1, a pyridoxal-containing complex, which showed good water solubility, and mod-erate nuclease activity in the cleavage of plasmid DNA (see SI), waspractically inactive in both tested cancer cell lines.
The results also revealed that the complexes exhibit higher cyto-toxicity when compared to the ligands. The ligands L1 and L3 werefound to be the less cytotoxic among the others (IC50 > 100 μM),while ligands L5 and L6 showed considerably low IC50 values, in par-ticular in the MCF7 cells (Fig. S22). Upon coordination of L5 and L6 to
copper(II), a considerable decrease in the IC50 was observed in the PC3cells. This represented a very interesting result taking into considera-tion that this particular cancer cell line (androgen-independent prostatecells) has been described as resistant to chemotherapeutic regimen.
3.5.4. Apoptotic activityIn an attempt to study the mechanism of cell death, the effect in the
PC3 cells of the most active complexes C5 and C6 on the activation ofcaspases 3/7 was evaluated. After 48 h treatment at a concentrationequivalent to their IC50 values no induction of caspase-3/7 activationwas observed when compared to the untreated cells (controls) (Fig. 8).Results revealed that C5 and C6 with high cytotoxicity in PC3 cellscould probably induce cell death by other mechanisms than apoptosis.
3.5.5. Cu uptake by PC3 cellsThe uptake of compound C6 by PC3 cells was examined using nu-
clear microscopy. The typical ovoid appearance of the cells with acondensed central nucleus is consistent with the mass density (mass)images, and elemental distribution maps of P, K and Ca were obtainedas depicted in Fig. 9. In control PC3 cells, the presence of Cu wasvestigial (Fig. 9A). The PC3 cells incubated with C6 at 20 μM and200 μM for 24 h showed a relatively uneven Cu spatial distribution with
Fig. 7. a) Stern-Volmer plot at 339 nm obtained fromsteady-state (I0/I) measurements for C1 (0–7.78 μM) —[HSA] ~ 1.5 μM, and λex = 295 nm (I0/I data were cor-rected for reabsorption and inner-filter-effects). b)Scatchard plot at 339 nm obtained from steady-state (I0/I)measurements for C1 (0–7.78 μM) — [HSA] ~ 1.5 μM, andλex = 295 nm, obtaining n = (0.93 ± 0.02) and log k =(4.44 ± 0.11).
Table 6Results for HSA binding studies with the synthesized complexes.
C1 C2 C3 C4 C5 C6
KSV × 105 (M−1) 0.63 ± 0.01 0.56 ± 0.04 n.a. 0.22 ± 0.01 1.30 ± 0.04 3.17 ± 0.23kq × 1013 (M−1 s−1) 3.08 2.73 n.a. 1.08 6.39 15.6R2 0.998 0.976 – 0.978 0.991 0.974log K 4.44 ± 0.11 2.88 ± 0.09 n.a. 3.06 ± 0.24 4.94 ± 0.18 9.18 ± 0.30n 0.93 ± 0.02 0.64 ± 0.02 n.a. 0.76 ± 0.05 0.96 ± 0.03 1.68 ± 0.05R2 0.997 0.996 – 0.981 0.993 0.996
n.a. means that no activity was recorded.
Table 7In vitro cytotoxicity measured as the half-inhibitory concentration (IC50) after 48 h in-cubation period for C1–C6, against prostate PC3 and breast MCF7 cancer cells. IC50 valuesreported in μM (± SD). (SD = standard deviation).
IC50 (μM) 48 h
Compounds PC3 MCF7
C1 > 100 > 100C2 42.4 ± 10.8 80.2 ± 14.5C3 > 100 48.1 ± 9.85C4 > 100 49.5 ± 12.6C5 7.71 ± 2.51 2.58 ± 0.63C6 2.61 ± 1.45 2.65 ± 0.87
N. Ribeiro et al.

a preferential localization in nuclear and perinuclear regions (Fig. 9Band C).
Quantitative elemental analysis of PC3 cells showed that in-tracellular Cu increased with C6 concentration. PC3 cells treated with20 μM C6 had an average concentration of Cu of 340 ± 150 μg/g (dryweight), which further increased to 900 ± 500 μg/g (dry weight) incells treated with 200 μM C6. The Cu concentration in control PC3 cellswas vestigial, below 20 μg/g (dry weight). Therefore, it can be deducedthat Cu levels in PC3 cells is correlated with the C6 complex con-centration.
The intracellular Cu increase in treated PC3 cells was accompaniedwith changes in the concentrations of physiologically relevant elementssuch as P, K and Ca in both nuclear and perinuclear regions. Theaverage Ca concentration in cells increased with C6 concentration(controls: 36 ± 6 μg/g; 20 μM C6: 130 ± 30 μg/g; 200 μM C6:300 ± 70 μg/g). A 3-fold increase in P in 20 μM C6 treated cells(1.7 ± 0.6 mg/g versus 0.5–0.8 mg/g range in control and 200 μM C6)and K in 200 μM C6 treated cells (1.6 ± 0.4 mg/g versus 0.4–0.8 mg/grange in control and 200 μM C6) was also observed. In addition, PC3cells treated with 200 μM C6 deviated from the spheroid morphologyand were smaller (see Fig. 9 C).
Results indicated disturbed homeostasis upon incubation with C6with an increase of important physiological elements such as P, K andCa. This effect could be a consequence of complex modulation oftransmembranar transporters that regulate Ca2+ and K+ ion fluxes[58]. This mechanism is in agreement with others recently reportedindicating that blocking the activity of certain ion channels could have
importance for anticancer therapy and hence opens a new field foranticancer drug research [59]. However, further investigations areneeded for understanding the contribution of specific channels for thistype of complexes.
4. Conclusions
In this work six new Schiff-base ligands derived from 5-methyl-1H-pyrazole-3-carbohydrazide and different aldehydes, namely pyridoxal(L1), salicylaldehyde and derivatives (L2–L4) and 2-hydro-xynaphthene-1-carbaldehyde (L5–L6) were synthesized by condensa-tion reactions, and fully characterized by analytical techniques. The Cu(II)-compounds C1–C6 were synthesized by stirring methanolic solu-tions of the corresponding L5–L6 and CuCl2.2H2O. The complexes werecharacterized by elemental analysis and spectroscopic techniques inorder to prove their structural formulae. It was possible to assign a 1:1relationship between metal ion and ligand, and square-based geome-tries with dx2–y2 ground state.
Compounds C1–C6 were screened in biological studies, namely theevaluation of DNA and HSA binding ability, nuclease activity and cy-totoxicity. Their anti-oxidant potential was evaluated in a DPPH assay,however, none of them (or the corresponding ligands) showed relevantanti-oxidant activity.
Although some of the complexes were able to bind ctDNA, only C1showed nuclease activity towards plasmid DNA. The displacement as-says carried out with thiazole orange showed that complexes withlarger delocalized π-systems, such as C5 and C6, were able to partiallyintercalate into DNA in a greater extension than complexes with smalleraromatic systems, thanks to their planarity and ability to participate inπ–π interactions.
It was also possible to prove that larger aromatic systems favor theinteraction with HSA, as shown by fluorescence quenching titrations.However, C1 and C2 also showed HSA binding ability, contrary to C3and C4, which probably relates to the absence of electronegative groupsin the orto-position to the coordinated phenolate. It can thus be as-sumed that HSA can serve as a carrier for these complexes, providingboth transport to cellular targets and protection against clearanceroutes.
The cytotoxicity assays demonstrated the much higher activity ofthe compounds with larger delocalized π-systems, namely compoundsC5 and C6, which showed much better performance than those withsmaller aromatic ligands. It can also be concluded that the effect of theligands and the corresponding Cu(II)-complexes depends not only on
0
5000
10000
15000
20000
25000
30000
35000
control C5 C6
Rel
ativ
e lu
min
esce
nce
units
(R
LU)
Fig. 8. Effect of complexes C5 and C6 on caspase 3/7 in human PC3 prostate cancer cells,after 48 h treatment at a concentration equivalent to their IC50 values.
Fig. 9. Mass density (mass) and elemental maps ofspatial distribution of P, K and Cu in individual PC3cells under control (A), 20 μM (B) and 200 μM (C)of complex C6 conditions. The dotted lines in massand Cu maps indicate the cell contour and nuclearregion. The mass density and elemental distribu-tions are represented by a colour gradient with adynamic scale: high level — black/red, to low level— white/dark blue.
N. Ribeiro et al.

the specific features in the auxiliary ligand and the metal ion, but alsoon the type of cancer cells.
Overall, this work demonstrated the high affinity that pyrazolylderived Schiff bases L1–L6 have to coordinate metal ions, namely Cu(II), forming stable complexes suitable for biological studies. It wasproven that larger aromatic delocalized π-systems in such ligandsprovide more efficient complexes, both in the interaction assays withbiomolecules such as DNA and HSA, and in the cytotoxic action.Moreover, the presence of an aromatic substituent at the pyrazole ringseems to enhance the cytotoxicity against cancer cells. Compounds C5and C6, not presenting relevant nuclease activity or radical scavengerpotential, may have higher ability to interact/cross the cell membraneand accumulate in the nuclear/perinuclear region, in particular C6. Theimbalance in the physiological elements involved in membrane poten-tial and cellular homeostasis is therefore in line with the cytotoxicity ofC6 described above.
Acknowledgements
This work was supported by Fundação para a Ciência e Tecnologia(FCT) (projects UID/QUI/00100/2013, UID/MULTI/04349/2013, UID/BIO/04565/2013, RECI/QEQ-QIN/0189/2012, RECI/QEQ-MED/0330/2012), Programa Operacional Regional de Lisboa (LISBOA-01-0145-FEDER-007317) and programme Investigador FCT. ThePortuguese NMR and Mass Spectrometry IST–UL Centers are acknowl-edged for the access to the equipment. The authors thank FernandoPavan and Débora Leite de Campos for the Anti-MycobacteriumTuberculosis studies.
Appendix A. Supplementary data
Supplementary data to this article can be found online at http://dx.doi.org/10.1016/j.jinorgbio.2017.05.011.
References
[1] C.-H. Zhou, H.-Z. Zhang, S.-F. Cui, J.-S. Lv, C.-Y. Yan, K. Wan, Y.-Y. Zhang, S.-L. Zhang, G.-X. Cai, R.-X. Geng, G.L.V. Damu, M. Prudhomme (Ed.), Advances inAnticancer Agents in Medicinal Chemistry, 2 Bentham e-Books, 2013, pp. 46–129.
[2] H. Khalil, M. Heulot, D. Barras, R. Jastrab, B. Tylkowski (Eds.), New GenerationBioinorganic Complexes, Walter de Gruyter GmbH, Berlin/Boston, 2016, pp.143–159.
[3] B. Rosenberg, L. Vancamp, J.E. Trosko, V.H. Mansour, Nature 222 (1969) 385–391.[4] S.J. Tan, Y.K. Yan, P.P.F. Lee, K.H. Lim, Future Med. Chem. 2 (2010) 1591–1608.[5] C. Santini, M. Pellei, V. Gandin, M. Porchia, F. Tisato, C. Marzano, Chem. Rev. 114
(2014) 815–862.[6] J. Osredkar, N. Sustar, J. Clin. Toxicol. S3 (2011) 001.[7] Z.C. Liu, B.D. Wang, B. Li, Q. Wang, Z.Y. Yang, T.R. Li, Y. Li, Eur. J. Med. Chem. 45
(2010) 5353–5361.[8] C.M. da Silva, D.L. da Silva, L.V. Modolo, R.B. Alves, M.A. de Resende,
C.V.B. Martins, Â. de Fátima, J. Adv. Res. 2 (2011) 1–8.[9] L.-X. Cheng, J.-J. Tang, H. Luo, X.-L. Jin, F. Dai, J. Yang, Y.-P. Qian, X.-Z. Li,
B. Zhou, Bioorg. Med. Chem. Lett. 20 (2010) 2417–2420.[10] Q.M. Hasi, Y. Fan, X.Q. Yao, D.C. Hu, J.C. Liu, Polyhedron 109 (2016) 75–80.[11] Z.-Y. Ma, X. Qiao, C.-Z. Xie, J. Shao, J.-Y. Xu, Z.-Y. Qiang, J.-S. Lou, J. Inorg.
Biochem. 117 (2012) 1–9.[12] X.Q. Zhou, Y. Li, D.Y. Zhang, Y. Nie, Z.J. Li, W. Gu, X. Liu, J.L. Tian, S.P. Yan, Eur. J.
Med. Chem. 114 (2016) 244–256.[13] S.G. Kucukguzel, S. Senkardes, Eur. J. Med. Chem. 97 (2015) 786–815.[14] F.K. Keter, J. Darkwa, Biometals 25 (2012) 9–21.[15] A. Dias, R.R.S. Salvador, Pharmaceuticals 5 (2012) 317–324.[16] T.N. Mandal, S. Roy, A.K. Barik, S. Gupta, R.J. Butcher, S.K. Kar, Polyhedron 7
(2008) 3267–3274.[17] G.M. Sheldrick, SADABS, Version 2.10, University of Göttingen, Germany, 2004.[18] O.V. Dolomanov, L.J. Bourhis, R.J. Gildea, J.A.K. Howard, H. Puschmann, J. Appl.
Crystallogr. 42 (2009) 339–341.[19] G.M. Sheldrick, Acta Crystallogr. Sect. A 64 (2008) 112–122.[20] G.M. Sheldrick, Acta Crystallogr. Sect. C 71 (2015) 3–8.[21] J.M. Teare, R. Islam, R. Flanagan, S. Gallagher, M.G. Davies, C. Grabau,
BioTechniques 22 (1997) 1170–1174.[22] S.R. Gallagher, F.A. Ausubel, R. Brent, R.E. Kingston, D.D. Moore, J.G. Seidman,
J.A. Smith, K. Struhl (Eds.), Current Protocols in Molecular Biology, JohnWiley & Sons, New York, 1989.
[23] D.G. Fasman, Practical Handbook of Biochemistry and Molecular Biology, CRCPress, Boston, 1992.
[24] M.B. Fisher, S.J. Thompson, V. Ribeiro, M.C. Lechner, A.E. Rettie, Arch. Biochem.Biophys. 356 (1998) 63–70.
[25] A. Coutinho, M. Prieto, J. Chem. Educ. 70 (1993) 425–428.[26] J.T. Marques, R.F.M. de Almeida, J. Chem. Educ. 90 (2013) 1522–1527.[27] A. Verissimo, L.C. Alves, P. Filipe, J.N. Silva, R. Silva, M.D. Ynsa, E. Gontier,
P. Moretto, J. Pallon, T. Pinheiro, Microsc. Res. Tech. 70 (2007) 302–309.[28] G.W. Grime, M. Dawson, Nucl. Instrum. Methods B 104 (1995) 107–113.[29] M.S.e.a. Vasco, J. Microsc. (2017).[30] R.M. Godinho, M.T. Cabrita, L.C. Alves, T. Pinheiro, Metallomics 6 (2014)
1626–1631.[31] Y. Xia, C.D. Fan, B.X. Zhao, J. Zhao, D.S. Shin, J.Y. Miao, Eur. J. Med. Chem. 43
(2008) 2347–2353.[32] J. Clayden, N. Greeves, S. Warren, P. Wothers, Organic Chemistry, 1st ed., Oxford
University Press, Oxford, 2001.[33] T. Rosu, E. Pahontu, M. Reka-Stefana, D.C. Ilies, R. Georgescu, S. Shova, A. Gulea,
Polyhedron 31 (2012) 352–360.[34] K. Nakamoto Infrared and Raman Spectra of Inorganic Compounds, Wiley, 5th ed.[35] T. Mukherjee, J.C. Pessoa, A. Kumar, A.R. Sarkar, Inorg. Chim. Acta 426 (2015)
150–159.[36] D.F. Back, G.M. de Oliveira, L.A. Fontana, B.F. Ramao, D. Roman, B.A. Iglesias, J.
Mol. Struct. 1100 (2015) 264–271.[37] I. Correia, J.C. Pessoa, M.T. Duarte, M.F.M. da Piedade, T. Jackush, T. Kiss,
M.M.C.A. Castro, C.F.G.C. Geraldes, F. Avecilla, Eur. J. Inorg. Chem. (2005)732–744.
[38] I. Correia, S. Roy, C.P. Matos, S. Borovic, N. Butenko, I. Cavaco, F. Marques,J. Lorenzo, A. Rodriguez, V. Moreno, J.C. Pessoa, J. Inorg. Biochem. 147 (2015)134–146.
[39] J.C. Pessoa, M.J. Calhorda, I. Cavaco, P.J. Costa, I. Correia, D. Costa, L.F. Vilas-Boas, V. Felix, R.D. Gillard, R.T. Henriques, R. Wiggins, Dalton Trans. (2004)2855–2866.
[40] S. Konar, A. Jana, K. Das, S. Ray, S. Chatterjee, J.A. Golen, A.L. Rheingold, S.K. Kar,Polyhedron 30 (2011) 2801–2808.
[41] J.C. Pessoa, I. Cavaco, I. Correia, I. Tomaz, P. Adao, I. Vale, V. Ribeiro,M.M.C.A. Castro, C.C.F.G. Geraldes, ACS Symp. Ser. 974 (2007) 340–351.
[42] K. Das, T.N. Mandal, S. Roy, S. Gupta, A.K. Barik, P. Mitra, A.L. Rheingold, S.K. Kar,Polyhedron 29 (2010) 2892–2899.
[43] A. Rockenbauer, L. Korecz, Appl. Magn. Reson. 10 (1996) 29–43.[44] A. Sreekanth, M.R.P. Kurup, Polyhedron 22 (2003) 3321–3332.[45] J. Peisach, W.E. Blumberg, Arch. Biochem. Biophys. 165 (1974) 691–708.[46] U. Sakaguchi, A.W. Addison, J. Chem. Soc. Dalton Trans. (1979) 600–608.[47] O.P. Sharma, T.K. Bhat, Food Chem. 113 (2009) 1202–1205.[48] S. Satyanarayana, J.C. Dabrowiak, J.B. Chaires, Biochemistry 32 (1993)
2573–2584.[49] W.R. Lakowicz, Principles of Fluorescence Spectroscopy, 3rd ed., Springer, 2006.[50] J. Nygren, N. Svanvik, M. Kubista, Biopolymers 46 (1998) 39–51.[51] N. Seedher, P. Agarwal, J. Lumin. 130 (2010) 1841–1848.[52] N.E. Hellman, J.D. Gitlin, Annu. Rev. Nutr. 22 (2002) 439–458.[53] W. Bal, J. Christodoulou, P.J. Sadler, A. Tucker, J. Inorg. Biochem. 70 (1998)
33–39.[54] Y. Gou, J.X. Qi, J.P. Ajayi, Y. Zhang, Z.P. Zhou, X.Y. Wu, F. Yang, H. Liang, Mol.
Pharm. 12 (2015) 3597–3609.[55] D. Sanna, P. Buglyo, A.I. Tomaz, J.C. Pessoa, S. Borovic, G. Micera, E. Garribba,
Dalton Trans. 41 (2012) 12824–12838.[56] G. Sudlow, D.J. Birkett, D.N. Wade, Mol. Pharmacol. 12 (1976) 1052–1061.[57] S. Tabassum, M. Ahmad, M. Afzal, M. Zaki, P.K. Bharadwaj, J. Photochem.
Photobiol. B Biol. 140 (2014) 321–331.[58] J.L. Wedding, H.H. Harris, C.A. Bader, S.E. Plush, R. Mak, M. Massi, D.A. Brooks,
B. Lai, S. Vogt, M.V. Werrett, P.V. Simpson, B.W. Skelton, S. Stagni, Metallomics(2017), http://dx.doi.org/10.1039/C6MT00243A.
[59] A. Arcangeli, A. Becchetti, Pharmaceuticals, (2010), pp. 1202–1224.
N. Ribeiro et al.


![Colloids and Surfaces B: Biointerfaceschitosan backbone and carbazochrome separately, forming the Schiff-base bond rapidly under a mild condition [39]. In other words, a well-defined](https://img.dokumen.tips/doc/110x75/60884dc5e8ed395d3d3ba80e/colloids-and-surfaces-b-chitosan-backbone-and-carbazochrome-separately-forming.jpg)


