Embed Size (px)
Citation preview
This project has received funding from the European Union’s Horizon 2020
research and innovation programme under grant agreement No 837752.
7 ANNEX I – NEWCOMERS Deliverable template
New Clean Energy Communities in a
Changing European Energy System
(NEWCOMERS)
Deliverable 3.2
Comparison of national
polycentric settings in the partner
countries
Version: 1.0
WP 3: National polycentric settings: mapping and comparison
Authors: Jenny Palm and Klara Eitrem Holmgren, Lund University

This project has received funding from the European Union’s Horizon 2020
research and innovation programme under grant agreement No 837752.
D1.1: Quality procedures
2
Summary of NEWCOMERS
In its most recent Energy Union package, the European Union puts citizens at the core of the clean
energy transitions. Beyond policy, disruptive innovations in energy sectors are challenging the
traditional business model of large energy utilities. One such disruptive, social innovation is the
emergence of new clean energy communities (“NEWCOMERS”).
The possible benefits of these “NEWCOMERS” for their members and for society at large are still
emerging and their potential to support the goals of the Energy Union is unclear. Using a highly
innovative holistic approach – drawing on cutting edge theories and methods from a broad range of
social sciences coupled with strong technical knowledge and industry insight – the NEWCOMERS
consortium will analyse European energy communities from various angles. By taking an
interdisciplinary approach and through employing co-creation strategies, in which research
participants are actively involved in the design and implementation of the research, the
NEWCOMERS project will deliver practical recommendations about how the European Union as
well as national and local governments can support new clean energy communities to help them
flourish and unfold their potential benefits for citizens and the Energy Union.

This project has received funding from the European Union’s Horizon 2020
research and innovation programme under grant agreement No 837752.
D1.1: Quality procedures
3
Summary of NEWCOMERS’s Objectives
As subsidiary objectives, the NEWCOMERS project aims to
• provide a novel theoretical framework based on polycentric governance theory,
combined with elements from social practice theory, innovation theory and value theory, in
which the emergence and diffusion of new clean energy communities can be analysed and
opportunities for learning in different national and local polycentric settings can be explored;
• develop a typology of new clean energy community business models which allows to
assess the different types of value creation of “newcomers” as well as their economic viability
and potential to be scaled up under various conditions;
• identify the types of clean energy communities that perform best along a variety of
dimensions, such as citizen engagement, value creation, and learning, and their potential to
address energy poverty, while being based on sustainable business models;
• investigate the regulatory, institutional and social conditions, at the national and local
level which are favourable for the emergence, operation and further diffusion of new clean
energy communities and enable them to unfold their benefits in the best possible way;
• explore how new clean energy communities are co-designed with their members’
(i.e. citizens’ and consumers’) needs, in particular whether new clean energy
communities have the potential to increase the affordability of energy, their members’ energy
literacy and efficiency in the use of energy, as well as their members’ and society’s
participation in clean energy transition in Europe;
• deliver practical recommendations based on stakeholder dialogue how the EU as
well as national and local governments can support new clean energy communities to make
them flourish and unfold their benefits in the best possible way;
• offer citizens and members of new clean energy communities a new online platform
‘Our-energy.eu’ on which new clean energy communities can connect and share best
practices and interested citizens can learn about the concept of energy communities and find
opportunities to join an energy community in their vicinity.
Find out more about NEWCOMERS at: https://www.newcomersh2020.eu/

This project has received funding from the European Union’s Horizon 2020
research and innovation programme under grant agreement No 837752.
D1.1: Quality procedures
4
NEWCOMERS Consortium Partners
Logo Organisation Type Country
Institute for Environmental Studies
(IVM), Vrije Universiteit Amsterdam
(VUA)
University The
Netherlands
International Institute for Industrial
Environmental Economics (IIIEE) at
Lund University (LU)
University Sweden
Environmental Change Institute
(ECI), University of Oxford (UOXF)
University United
Kingdom
Institute of Social Sciences,
University of Ljubljana (UL)
University Slovenia
Institute for Advanced Energy
Technologies “Nicola Giordano”
(ITAE), National Research Council
(CNR)
Research
organisation
Italy
Leibniz Institute for Economic
Research (RWI)
Research
organisation
Germany
Consensus Communications
(CONS)
Private for Profit
(SME)
Slovenia
GEN-I Private for Profit
(Large company)
Slovenia

This project has received funding from the European Union’s Horizon 2020
research and innovation programme under grant agreement No 837752.
D1.1: Quality procedures
5
Document information
Delivery Type Report
Deliverable Number 3.2
Deliverable Title Comparison of national polycentric settings
in the partner countries
Due Date 30 Nov 2020
Submission Date 30 Nov 2020
WP/Task related 3.2
Work package leader Jenny Palm
Author(s) Jenny Palm and Klara Eitrem Holmgren
Name (Partner organisation) Lund University
Reviewer(s) Daniela Lazaroska; Maša Mlinarič
Keywords Polycentric setting; energy system, electricity
system, emissions, country comparison
Dissemination level
Project coordinator Julia Blasch (VUA)
Project manager Ruud van Ooijen (VUA)
Contact details Ruud van Ooijen
Cite as Palm, J. and Eitrem Holmgren, K. (2020).
Comparison of national polycentric
settings in the partner countries,
Deliverable D3.2 developed as part of the
NEWCOMERS project, funded under EU
H2020 grant agreement 837752,
November 2020.
This project has received funding from the European Union’s Horizon 2020
research and innovation programme under grant agreement No 837752.
D1.1: Quality procedures
6
Revisions
Version Date Author Status
1.0 30 Nov 2020 Jenny Palm; Klara Eitrem Holmgren First draft
Reviews
Version Date Reviewer Review Title
1.0 3 Nov
2020
Daniela Lazoroska Reviewer 1
1.0 16 Nov
2020
Maša Mlinarič Reviewer 2
Statement of originality:
This deliverable contains original unpublished work except where clearly indicated otherwise.
Acknowledgement of previously published material and of the work of others has been made through
appropriate citation, quotation or both.
Disclaimer
This deliverable reflects only the authors’ views and the European Union is not responsible or liable for any use
that might be made of information contained therein.

This project has received funding from the European Union’s Horizon 2020
research and innovation programme under grant agreement No 837752.
D1.1: Quality procedures
7
TABLE OF CONTENTS
Abbreviations ........................................................................................................................................................................ 9
1 EXECUTIVE SUMMARY ....................................................................................................................................... 11
2 INTRODUCTION ..................................................................................................................................................... 12
2.1 Role of this deliverable in the project ................................................................................................. 13
2.2 Approach ......................................................................................................................................................... 13
2.3 Structure of the document ....................................................................................................................... 13
3 COMPARISON OF THE COUNTRIES ............................................................................................................... 15
3.1 Overview of energy communities in the partner countries ....................................................... 15
3.2 Context: Socio-economic conditions .................................................................................................... 20
3.3 Context: Technical system ....................................................................................................................... 23
3.3.1 Energy production ............................................................................................................................. 23
3.3.2 TPES by source .................................................................................................................................... 24
3.3.3 Energy consumption ......................................................................................................................... 25
3.3.4 Electricity system ............................................................................................................................... 26
3.3.5 Energy related emissions ................................................................................................................ 32
3.4 Context: Institutional settings ................................................................................................................ 33
3.4.1 Subsidies and support ...................................................................................................................... 33
3.5 Action arena: Actors ................................................................................................................................... 36
3.5.1 Government, authorities and other actors .............................................................................. 36
3.5.2 Market actors ....................................................................................................................................... 37
4 DISCUSSION ............................................................................................................................................................. 40
4.1 Energy communities ................................................................................................................................... 40
4.2 Socio-economic conditions ...................................................................................................................... 40
4.3 Technical systems ........................................................................................................................................ 41
4.4 Institutional settings .................................................................................................................................. 42
4.5 Actors ................................................................................................................................................................ 42
5 CONCLUSION ........................................................................................................................................................... 44
6 REFERENCES ........................................................................................................................................................... 45
6.1 Web pages and URL .................................................................................................................................... 46

This project has received funding from the European Union’s Horizon 2020
research and innovation programme under grant agreement No 837752.
D1.1: Quality procedures
8
Figures and Tables
Figure 2.1 The variables of the IAD framework in focus of this report .................................................... 12
Figure 3.1 The countries divided into three segments according to their number of energy
communities ...................................................................................................................................................................... 20
Table 3.1 Overview of characterisations of the countries' energy communities ................................. 15
Table 3.2 GDP per capita .............................................................................................................................................. 20
Table 3.3 Countries' energy communities in relation to population size ................................................ 21
Table 3.4 Population and urban population ........................................................................................................ 21
Table 3.5 Tertiary education ...................................................................................................................................... 22
Table 3.6 Trust in other people ................................................................................................................................. 22
Table 3.7 Trust in political and legal system ....................................................................................................... 22
Table 3.8 Energy production ...................................................................................................................................... 23
Table 3.9 TPES by source ............................................................................................................................................. 24
Table 3.10 Energy consumption ............................................................................................................................... 25
Table 3.11 Electricity production ............................................................................................................................. 26
Table 3.12 Electricity generation mix ..................................................................................................................... 27
Table 3.13 Electricity consumption ......................................................................................................................... 28
Table 3.14 Electricity consumption by sector ..................................................................................................... 29
Table 3.15 Electricity prices ....................................................................................................................................... 29
Table 3.16 Electricity prices as share of household income ......................................................................... 30
Table 3.17 Electricity grids (TSOs, DSOs and smart meters) ....................................................................... 31
Table 3.18 Energy-related emissions ..................................................................................................................... 32
Table 3.19 Renewable energy subsidies and programmes ........................................................................... 33
Table 3.20 Actors in electricity market .................................................................................................................. 37

This project has received funding from the European Union’s Horizon 2020
research and innovation programme under grant agreement No 837752.
D1.1: Quality procedures
9
Abbreviations
Abbreviation Explanation and translation
AU Acquirente Unico, a subsidiary of Gestore dei Servizi Elettrici
(Italy)
CEC
Citizen energy communities, defined in the revised Electricity
Directive (IEMD, 2019/944/EU) in the European Commission’s
‘Clean Energy for all Europeans’ package.
CHP Combined Heat and Power
CO2 Carbon dioxide
DE Germany
DH District heating
DNOs Distribution Network Operators
DSO Distribution System Operators
E.ON German electric utility company
EC Energy community
EEG The Renewable Energy Sources Act (Germany)
Energy intensity
Energy intensity is a measure of a country’s energy (in-) efficiency.
It is measured with primary energy and GDP, namely the amount
of energy used per unit of gross domestic product (GDP).
ENTSO-E European Network of Transmission System Operators
ESO Electricity System Operator
EU European Union
EUR Euro €
FiTs Feed-in tariffs
GB Great Britain
GDP Gross domestic product
GDP per capita ($) Gross domestic product by its total population
GDP PPP Gross domestic product based on purchasing power parity
GHG(s) Greenhouse gas(es)
GW Gigawatt
IEA International Energy Agency
IEMD The revised Electricity Directive (2019/944/EU) in the European
Commission’s ‘Clean Energy for all Europeans’ package.
IT Italy
JRC Joint Research Centre, the European Commission’s science and
knowledge service
kW Kilowatt
kWh Kilowatt-hour
Mt Million tonnes
Mtoe Million tonnes of oil-equivalent
MW Megawatt

This project has received funding from the European Union’s Horizon 2020
research and innovation programme under grant agreement No 837752.
D1.1: Quality procedures
10
NECP National Energy and Climate Plan, part of the EU-package ‘Clean
energy for all Europeans’
NEWCOMERS New Clean Energy Communities in a Changing European Energy
System
NGESO National Grid Electricity System Operator (United Kingdom)
NI Northern Ireland
NL The Netherlands
PPP Purchasing power parity
PV Photovoltaics
REC
Renewable energy communities, defined in the revised Renewable
energy directive (RED II, 2018/2001/EU) in the European
Commission’s ‘Clean Energy for all Europeans’ package.
RED II The revised Renewable energy directive (2018/2001/EU) in the
European Commission’s ‘Clean Energy for all Europeans’ package.
RES Renewable Energy Source(s)
RESC Renewable Energy Source Community (Slovenia)
SDE + The Sustainable Energy Transition Scheme (the Netherlands)
SE Sweden
SI Slovenia
tCO2 Tonnes of carbon dioxide
TFC Total Final Consumption
Toe Tonne of oil equivalent, defined as 107 kilocalories (41.868
gigajoules)
TPES Total primary energy supply
TSO Transmission System Operator
TWh Terawatt-hour
UK United Kingdom
USD US Dollar

This project has received funding from the European Union’s Horizon 2020
research and innovation programme under grant agreement No 837752.
D1.1: Quality procedures
11
1 EXECUTIVE SUMMARY This deliverable compares the national polycentric settings of the six partner countries of the
NEWCOMERS project, i.e. Germany, Italy, the Netherlands, Slovenia, Sweden and the United
Kingdom. The comparison is based on figures from Deliverable 3.1 (D3.1) that described the
countries’ characteristics related to polycentric governance, with specific focus on the countries’
socio-technical systems and actors. The country comparisons in this deliverable focus on socio-
economic conditions, technical systems including energy and electricity production and
consumption, institutional settings of renewable energy support and actors. The deliverable is the
basis for D3.3, which will further discuss factors that hinder or enable the development of energy
communities in the six NEWCOMERS countries.
The figures in D3.1 have been updated when possible and are compared to figures of IEA or EU-
28 averages to enable a broader comparison of the countries’ national characteristics. The figures
are based on existing literature, national reports and statistical information, with sources
containing information about all six partner countries being prioritized.
The following key takeaway messages from D3.2 can be outlined. The countries’ developments of
ECs can be divided into three categories according to their current number of ECs: high (UK, DE);
medium (NL, SE); and low (IT, SI). In relation to their population size, UK and NL have the highest
relative numbers of ECs, followed by DE and SE and finally SI and IT. The comparisons of the six
countries’ socio-economic conditions, technical systems and institutional settings suggest that
there is a complex combination of national characteristics that enable polycentric governance and
the establishment of ECs. When single characteristics were compared, there were seldom strong
correlations between the countries’ relative rankings to one another and their current figures of
ECs. These findings of D3.2 provide an interesting basis for D3.3 in discussions of the combination
of settings that enable polycentric governance of ECs whilst linking to previous literature on EC
development.
This project has received funding from the European Union’s Horizon 2020
research and innovation programme under grant agreement No 837752.
D1.1: Quality procedures
12
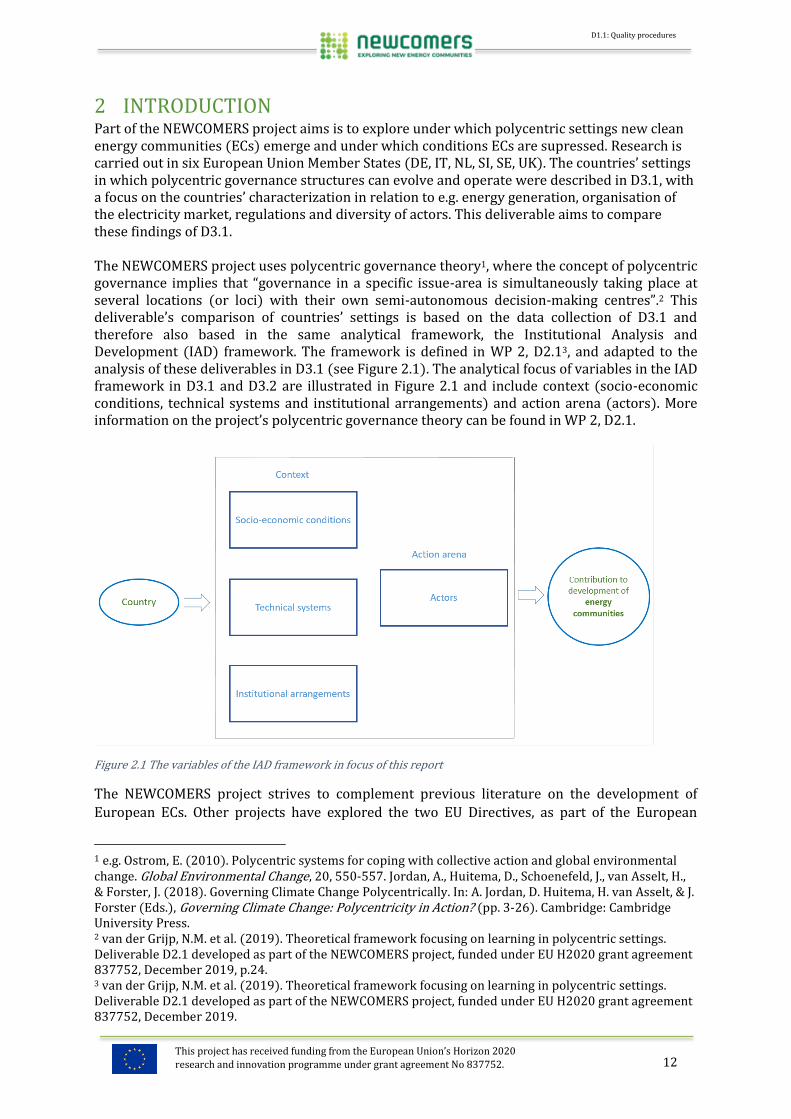
2 INTRODUCTION Part of the NEWCOMERS project aims is to explore under which polycentric settings new clean energy communities (ECs) emerge and under which conditions ECs are supressed. Research is carried out in six European Union Member States (DE, IT, NL, SI, SE, UK). The countries’ settings in which polycentric governance structures can evolve and operate were described in D3.1, with a focus on the countries’ characterization in relation to e.g. energy generation, organisation of the electricity market, regulations and diversity of actors. This deliverable aims to compare these findings of D3.1. The NEWCOMERS project uses polycentric governance theory1, where the concept of polycentric governance implies that “governance in a specific issue-area is simultaneously taking place at several locations (or loci) with their own semi-autonomous decision-making centres”.2 This deliverable’s comparison of countries’ settings is based on the data collection of D3.1 and therefore also based in the same analytical framework, the Institutional Analysis and Development (IAD) framework. The framework is defined in WP 2, D2.13, and adapted to the analysis of these deliverables in D3.1 (see Figure 2.1). The analytical focus of variables in the IAD framework in D3.1 and D3.2 are illustrated in Figure 2.1 and include context (socio-economic conditions, technical systems and institutional arrangements) and action arena (actors). More information on the project’s polycentric governance theory can be found in WP 2, D2.1.
Figure 2.1 The variables of the IAD framework in focus of this report
The NEWCOMERS project strives to complement previous literature on the development of
European ECs. Other projects have explored the two EU Directives, as part of the European
1 e.g. Ostrom, E. (2010). Polycentric systems for coping with collective action and global environmental change. Global Environmental Change, 20, 550-557. Jordan, A., Huitema, D., Schoenefeld, J., van Asselt, H., & Forster, J. (2018). Governing Climate Change Polycentrically. In: A. Jordan, D. Huitema, H. van Asselt, & J. Forster (Eds.), Governing Climate Change: Polycentricity in Action? (pp. 3-26). Cambridge: Cambridge University Press. 2 van der Grijp, N.M. et al. (2019). Theoretical framework focusing on learning in polycentric settings. Deliverable D2.1 developed as part of the NEWCOMERS project, funded under EU H2020 grant agreement 837752, December 2019, p.24. 3 van der Grijp, N.M. et al. (2019). Theoretical framework focusing on learning in polycentric settings. Deliverable D2.1 developed as part of the NEWCOMERS project, funded under EU H2020 grant agreement 837752, December 2019.
This project has received funding from the European Union’s Horizon 2020
research and innovation programme under grant agreement No 837752.
D1.1: Quality procedures
13
Commission’s ‘Clean Energy Package’, that formally recognize certain categories of community
energy initiatives as ECs. See for instance the REScoop report for an analysis of Member States’
draft National Energy and Climate Plans (NECP).4 With its theoretical and empirical focus on
regulatory, institutional and social conditions, the NEWCOMERS project contributes to the field
with an analysis of the settings in which ECs may arise as well as potential barriers to their
development.
2.1 Role of this deliverable in the project This deliverable aims to compare the socio-economic conditions, technical systems, institutional
arrangements and actors in the six partner countries and when relevant compare the national
characterisations with an IEA or EU-28 average. The comparison is a first step to analyse how
different settings linked to polycentric governance influence the emergence and functioning of
new forms of energy communities. This deliverable is the basis for the next step to analyse factors
that hinder or enable new ECs to emerge, what forms of ECs work best in different settings, and
what can be learned from the six NEWCOMERS countries (D3.3).
2.2 Approach The comparison is based on the country descriptions in D3.1. The figures derived from D3.1. have
been updated when possible and we have also added figures on IEA or EU-28 averages to enable a comparison of the six countries on a broader range. We used relevant figures of an IEA average
when available. When IEA lacked a good IEA average comparison, we chose to compare with an
EU-28 average.
The data collection in D3.1 was done in a consistent way that allowed for a comparison between
the countries. Sources that contain information about all six countries were therefore prioritized,
such as data from the European Commission. The IEA reports on country reviews were another
important common source, as the IEA has made reviews for all countries except Slovenia. When
IEA's review reports were outdated or lacked relevant information, we complemented with
information from websites, national reports and statistics. For more information about the data
used, see D3.1.
As this deliverable is based primarily on the figures from D3.1, it shares many of the same
delimitations in terms of which aspects of the countries’ national characteristics that are
compared. The deliverable does therefore not compare characteristics of for instance institutional
settings or actors that are not covered by D3.1. Only a few additional socio-economic characteristics were compared. The two deliverables, D3.1 and D3.2, will be the basis for the
coming analysis (D3.3) of how different settings correlated to polycentric governance influence
whether and what types of ECs are developed, and what enables or hinders the emergence of new
ECs in the different countries. D3.3 will allow a deeper analysis of the findings of D3.2, linking
greater to further literature on ECs.
2.3 Structure of the document This deliverable is structured in the following way: The six countries’ characteristics are
compared in Chapter 3, beginning with an overview of their energy communities in section 3.1.
The countries’ socio-economic conditions are contrasted in section 3.2, followed by a comparison
of their technical systems including energy production and consumption and the electricity
4 Roberts, J & Gauthier, C. (2019) “Energy communities in the draft National Energy and Climate Plans:
encouraging but room for improvements”, REScoop.eu, European University Viadrina, Friends of the Earth
Europe.
This project has received funding from the European Union’s Horizon 2020
research and innovation programme under grant agreement No 837752.
D1.1: Quality procedures
14
system (section 3.3). Section 3.4 presents the countries’ institutional settings, with focus on
energy policy, renewable energy support and subsidies. Section 3.5 compares the actors involved
in the partner countries. Chapter 4 summarises and discusses the findings in sections according
to the themes discussed in chapter 3. The findings are related to the next deliverable, D3.3. The
final chapter 5 draws conclusions.
This project has received funding from the European Union’s Horizon 2020
research and innovation programme under grant agreement No 837752.
D1.1: Quality procedures
15
3 COMPARISON OF THE COUNTRIES In D3.1, socio-economic, technical, and institutional characteristics of the six partner countries
(NL, SE, UK, DE, IT, SI) were described. In this chapter we will do a comparison of the six countries’
characteristics and add a comparison to an IEA average or an EU-28 average. We start by giving
an overview of existing ECs in the NEWCOMERS’ countries.
3.1 Overview of energy communities in the partner countries In D3.1. a short overview of the existing ECs in the countries was given. Fel! Hittar inte
referenskälla.Fel! Hittar inte referenskälla. displays an overview of the countries’ ECs with key
figures.
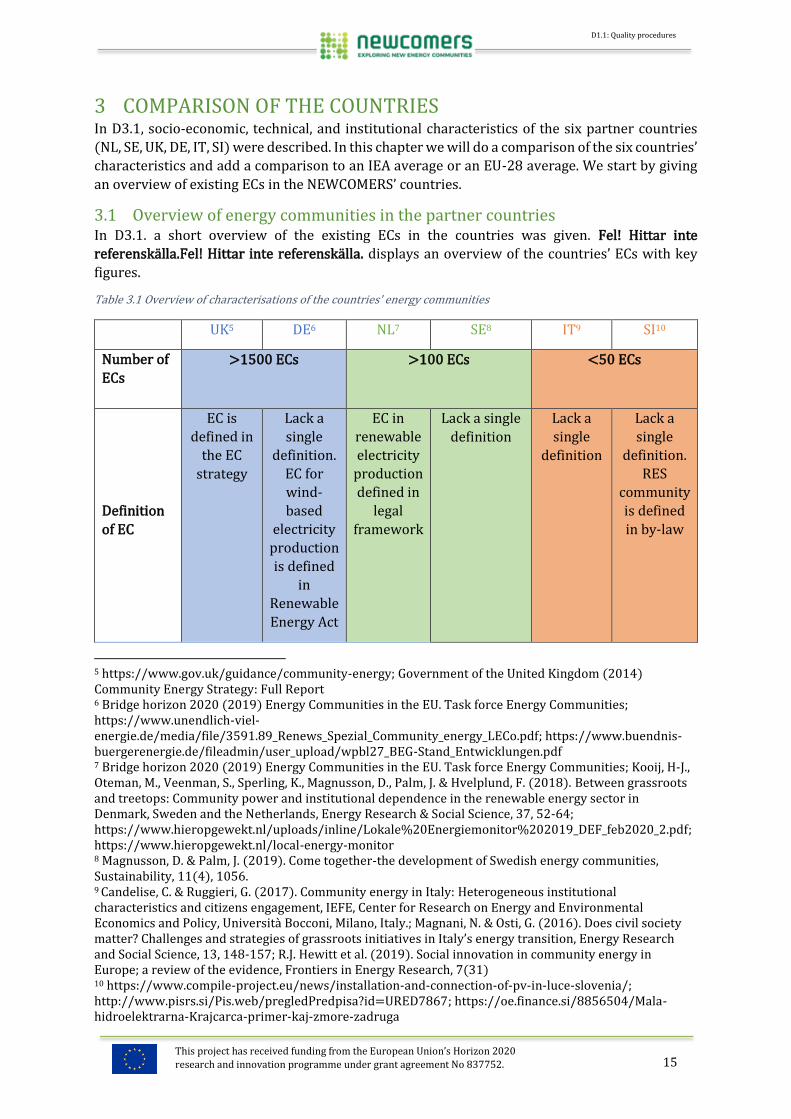
Table 3.1 Overview of characterisations of the countries' energy communities
UK5 DE6 NL7 SE8 IT9 SI10
Number of
ECs
>1500 ECs >100 ECs <50 ECs
Definition
of EC
EC is
defined in
the EC
strategy
Lack a
single
definition.
EC for
wind-
based
electricity
production
is defined
in
Renewable
Energy Act
EC in
renewable
electricity
production
defined in
legal
framework
Lack a single
definition
Lack a
single
definition
Lack a
single
definition.
RES
community
is defined
in by-law
5 https://www.gov.uk/guidance/community-energy; Government of the United Kingdom (2014) Community Energy Strategy: Full Report 6 Bridge horizon 2020 (2019) Energy Communities in the EU. Task force Energy Communities; https://www.unendlich-viel-energie.de/media/file/3591.89_Renews_Spezial_Community_energy_LECo.pdf; https://www.buendnis-buergerenergie.de/fileadmin/user_upload/wpbl27_BEG-Stand_Entwicklungen.pdf 7 Bridge horizon 2020 (2019) Energy Communities in the EU. Task force Energy Communities; Kooij, H-J., Oteman, M., Veenman, S., Sperling, K., Magnusson, D., Palm, J. & Hvelplund, F. (2018). Between grassroots and treetops: Community power and institutional dependence in the renewable energy sector in Denmark, Sweden and the Netherlands, Energy Research & Social Science, 37, 52-64; https://www.hieropgewekt.nl/uploads/inline/Lokale%20Energiemonitor%202019_DEF_feb2020_2.pdf; https://www.hieropgewekt.nl/local-energy-monitor 8 Magnusson, D. & Palm, J. (2019). Come together-the development of Swedish energy communities, Sustainability, 11(4), 1056. 9 Candelise, C. & Ruggieri, G. (2017). Community energy in Italy: Heterogeneous institutional characteristics and citizens engagement, IEFE, Center for Research on Energy and Environmental Economics and Policy, Università Bocconi, Milano, Italy.; Magnani, N. & Osti, G. (2016). Does civil society matter? Challenges and strategies of grassroots initiatives in Italy’s energy transition, Energy Research and Social Science, 13, 148-157; R.J. Hewitt et al. (2019). Social innovation in community energy in Europe; a review of the evidence, Frontiers in Energy Research, 7(31) 10 https://www.compile-project.eu/news/installation-and-connection-of-pv-in-luce-slovenia/; http://www.pisrs.si/Pis.web/pregledPredpisa?id=URED7867; https://oe.finance.si/8856504/Mala-hidroelektrarna-Krajcarca-primer-kaj-zmore-zadruga

This project has received funding from the European Union’s Horizon 2020
research and innovation programme under grant agreement No 837752.
D1.1: Quality procedures
16
First EC
In the
1990s
Has
existed for
at least 2
decades
1980s 1970 1962 1992
Technology
Wind,
solar,
hydro-
electricity,
heat
pump,
biomass
energy
efficiency
Solar,
wind,
biogas, DH,
own grid
Solar,
wind, heat,
but also
car
sharing
Wind, heat,
eco-villages,
solar, “rural
communities”
Hydro-
electricity,
solar,
wind
PV, hydro-
electricity,
(wood
biomass
for) DH
Table 3.1 shows that ECs have developed in the studied countries during the last twenty to sixty
years. The number of registered ECs in the partner countries differ greatly. The United Kingdom
and Germany are in the lead with 5000 and 1747 registered ECs respectively, followed by the
Netherlands (585) and Sweden (140). Italy and Slovenia have substantially fewer ECs developed
compared to the other countries, with 34 and 5 registered respectively.
These numbers of ECs presented in Table 3.1 and Figure 3.1 are collected based on the
NEWCOMERS project’s definition of clean energy communities in D2.1, the deliverable that
provides the project’s theoretical framework. A clean energy community is defined as an
“association of actors engaged in energy system transformation for reduced environmental
impact, through collective, participatory, and engaging processes and seeking collective
outcomes”.11 The NEWCOMERS definition may be broader than the definitions of ECs established
by public actors in the six studied countries. Community initiatives defined by the NEWCOMERS
project as ECs may likewise be described by a different terminology by the countries.
The countries were examined in order to find current national definitions of ECs in place similar
in type to the two official definitions of ECs established at an EU level. Two of the eight legislative
steps of the European Commission’s ‘Clean Energy for all Europeans’ package define ECs, namely
the revised Electricity Directive (IEMD, 2019/944/EU) and the revised Renewable energy
directive (RED II, 2018/2001/EU). The two definitions of ECs are citizen energy communities
(CEC) in IEMD and renewable energy communities (REC) in RED II. Both definitions see ECs as
voluntary, member-controlled initiatives to organize collective cooperation of energy-related
activities in a way that emphasizes a range of community benefits over strictly focusing on
financial profits. RECs can be considered as a subgroup of CECs as they have stricter requirements,
such as only allowing renewable energy production and including proximity conditions of
members.12 The directives are under transposition in all Member States. The full definitions of
CEC and REC and a further discussion on their similarities and differences can be found in D2.1.
As Table 3.1 shows, several of the countries were found to lack a single government-defined
national definition of ECs (DE, SE, IT, SI). This lack of national definitions influences the countries’
data on registered ECs. Germany, the Netherlands, Slovenia and the United Kingdom have legal
11 van der Grijp, N.M. et al. (2019). Theoretical framework focusing on learning in polycentric settings. Deliverable D2.1 developed as part of the NEWCOMERS project, funded under EU H2020 grant agreement 837752, December 2019, p.23. 12 Caramizaru, E. & Uihlein, A. (2020) Energy communities: an overview of energy and social innovation

This project has received funding from the European Union’s Horizon 2020
research and innovation programme under grant agreement No 837752.
D1.1: Quality procedures
17
frameworks in place for some type of ECs. The legal frameworks in DE, NL and UK were
established without the RED II and IEMD definitions in mind but share certain similarities.13
The German Renewable Energy Act (EEG) that entered into force in 2017 defines the concept of
“Bürgerenergiegesellschaft”, or ‘Citizens’ Energy Company’. Citizens Energy Companies cover
solely electricity production from wind and have requirements in place concerning a minimum
number of involved members (ten) and voting rights, where 51 percent of voting rights are
reserved to citizens.14 The EEG was established without the EU Clean Energy package in mind, but
nevertheless gives effect to for instance the right in RED II on a support scheme that accounts for
the specificities of renewable ECs. Overall, Germany does not have a single definition for all types
of ECs. The term often used is “citizen energy” (Bürgerenergie) which can cover both groups and
individuals.15
In the Netherlands, a regulatory sandbank was established in 2015 that focuses primarily on
sustainable energy generation and energy efficient grid use. The framework includes energy
associations or cooperatives who can only operate on the electricity sector and need to be based
in renewable energy sources. Currently, members need to be connected to the same medium or
low voltage network and 80 percent of participants need to be private end-consumers. The
experimental regime is based on an article of the Dutch Electricity Act 1998 and the Crown decree
of 28 February 2015 on experiments on decentralized sustainable electricity generation,
commonly known as the Experiments Electricity Law-regime. The exemptions to the regime are
also further coupled to regulations or restrictions by the Minister of Economic Affairs and Climate.
A revised experiment scheme seems to be underway to broaden to any type of entity within either
electricity or gas without a proximity requirement as well as to allow new possible partnerships.
The regulatory framework was not established with the EU Clean Energy package in mind, but
certain features can be seen as an implementation of some rights under both RED II and IEMD,
such as the right to fair, proportionate, transparent and non-discriminatory procedures.
In 2019, Slovenia adopted a new by-law for Self-supply of Electricity from Renewable Energy
Sources that introduces the concept of Renewable Energy Source Community (RESC). The new
by-law allows RESC to operate on the electricity market to the extent that it is fully based on
renewable energy. The by-law is viewed as an important step towards a later transposition of the
related EU-directives. The RESC differ in several ways from the CEC and REC of the Clean Energy
package. For instance, the Slovenian framework has a considerably narrower scope as it is
primarily focused on RESC as a form of collective self-consumption with more limited rights,
privileges, and responsibilities. The participation criteria are broader than CEC and REC as any
entity can participate, but the proximity requirements are stricter than a REC as all members must
be located behind the same transformer station.16
The United Kingdom defines ‘community energy’ in its national Community Energy strategy from
2014.17 The term includes community projects or initiatives focused on the four strands of
reducing energy use, managing energy better, generating energy (electricity or heat) or
purchasing energy. Both communities of place and of interest are included, and there is an
emphasis on community benefits and community ownership and leadership. In addition, shared
ownership or joint ventures where benefits are shared by the community are included, such as
13 Bridge horizon 2020 (2019) Energy Communities in the EU. Task force Energy Communities 14 Bridge horizon 2020 (2019) Energy Communities in the EU. Task force Energy Communities 15 https://www.unendlich-viel-energie.de/media/file/3591.89_Renews_Spezial_Community_energy_LECo.pdf 16 Bridge horizon 2020 (2019) Energy Communities in the EU. Task force Energy Communities; http://www.pisrs.si/Pis.web/pregledPredpisa?id=URED7867 17 Government of the United Kingdom (2014) Community Energy Strategy: Full Report
This project has received funding from the European Union’s Horizon 2020
research and innovation programme under grant agreement No 837752.
D1.1: Quality procedures
18
co-operatives, social enterprises and development trusts, as well as projects without formal
structures. The UK’s definition of community energy was established prior to EU’s Clean energy
package and the 2014 strategy does not discuss the eligibility requirements of ECs as closely as
the EU directives. The reported number of countries’ ECs differ in studies due to the above
described differing terminology and definitions of ECs. In particular, the number of the United
Kingdom’s ECs differ significantly between studies, where These categories of high, medium and
low numbers of ECs with corresponding colours are used throughout D3.2 in order to analyse the
comparisons of the countries’ national settings of polycentrism in relation to their development
of ECs. These linkages between the three categories and the countries’ national characteristics will
also be furthered explored in D3.3. The three categories are based on the countries’ most current
reported numbers of ECs, which lends itself for a comparison of the countries’ current state of ECs.
The single figure of ECs presently in place in the countries does however not reflect trajectories
of EC development over time.
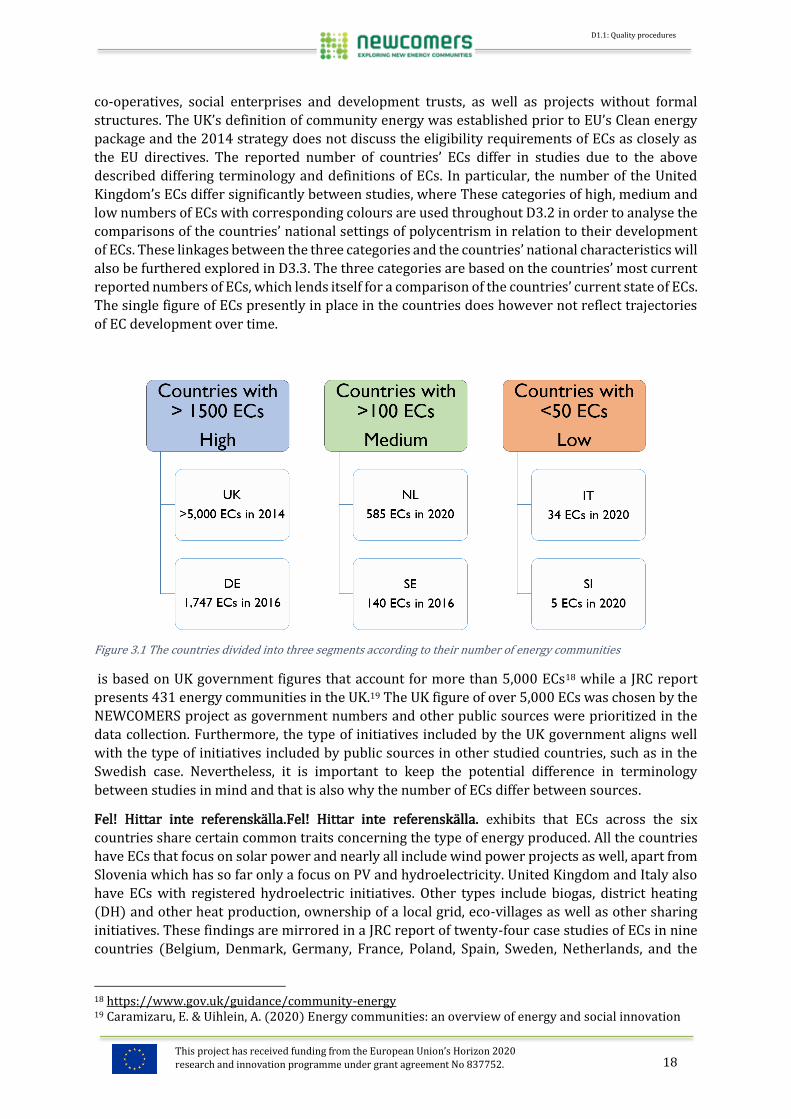
Figure 3.1 The countries divided into three segments according to their number of energy communities
is based on UK government figures that account for more than 5,000 ECs18 while a JRC report
presents 431 energy communities in the UK.19 The UK figure of over 5,000 ECs was chosen by the
NEWCOMERS project as government numbers and other public sources were prioritized in the
data collection. Furthermore, the type of initiatives included by the UK government aligns well
with the type of initiatives included by public sources in other studied countries, such as in the
Swedish case. Nevertheless, it is important to keep the potential difference in terminology
between studies in mind and that is also why the number of ECs differ between sources.
Fel! Hittar inte referenskälla.Fel! Hittar inte referenskälla. exhibits that ECs across the six
countries share certain common traits concerning the type of energy produced. All the countries
have ECs that focus on solar power and nearly all include wind power projects as well, apart from
Slovenia which has so far only a focus on PV and hydroelectricity. United Kingdom and Italy also
have ECs with registered hydroelectric initiatives. Other types include biogas, district heating
(DH) and other heat production, ownership of a local grid, eco-villages as well as other sharing
initiatives. These findings are mirrored in a JRC report of twenty-four case studies of ECs in nine
countries (Belgium, Denmark, Germany, France, Poland, Spain, Sweden, Netherlands, and the
18 https://www.gov.uk/guidance/community-energy 19 Caramizaru, E. & Uihlein, A. (2020) Energy communities: an overview of energy and social innovation

This project has received funding from the European Union’s Horizon 2020
research and innovation programme under grant agreement No 837752.
D1.1: Quality procedures
19
United Kingdom) that found solar power to be the dominant generated energy source, followed
by wind and biomass.20 The findings of D3.1 also showed that one of the most common
organizational structures of ECs among the countries are cooperatives. A more in-depth analysis
of the institutional settings surrounding energy communities can be found in section 3.4. More
information on the countries’ ECs can likewise be found in D3.1.
In These categories of high, medium and low numbers of ECs with corresponding colours are used
throughout D3.2 in order to analyse the comparisons of the countries’ national settings of
polycentrism in relation to their development of ECs. These linkages between the three categories
and the countries’ national characteristics will also be furthered explored in D3.3. The three
categories are based on the countries’ most current reported numbers of ECs, which lends itself
for a comparison of the countries’ current state of ECs. The single figure of ECs presently in place
in the countries does however not reflect trajectories of EC development over time.
Figure 3.1 The countries divided into three segments according to their number of energy communities
, NEWCOMERS’ six partner countries have been divided into three segments based on the number
of ECs established in each country. These categories of high, medium and low numbers of ECs with
corresponding colours are used throughout D3.2 in order to analyse the comparisons of the
countries’ national settings of polycentrism in relation to their development of ECs. These linkages
between the three categories and the countries’ national characteristics will also be furthered
explored in D3.3. The three categories are based on the countries’ most current reported numbers
of ECs, which lends itself for a comparison of the countries’ current state of ECs. The single figure
of ECs presently in place in the countries does however not reflect trajectories of EC development
over time.
20 Caramizaru, E. & Uihlein, A. (2020) Energy communities: an overview of energy and social innovation
This project has received funding from the European Union’s Horizon 2020
research and innovation programme under grant agreement No 837752.
D1.1: Quality procedures
20
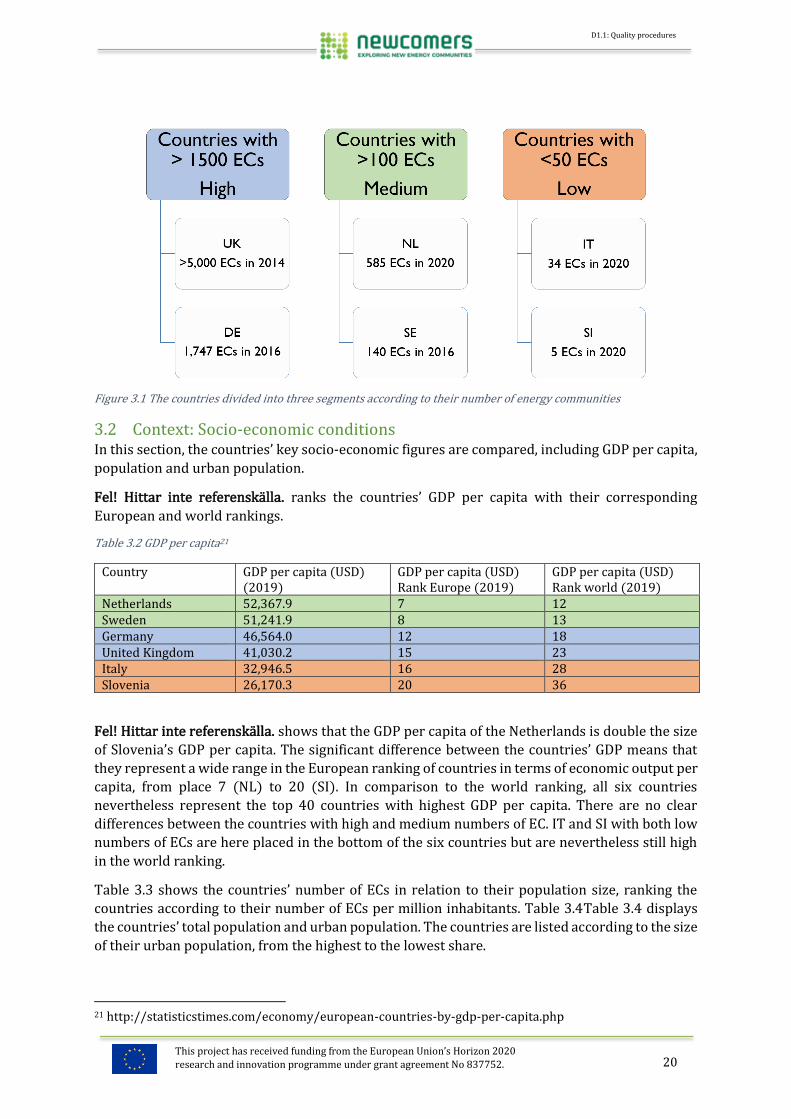
Figure 3.1 The countries divided into three segments according to their number of energy communities
3.2 Context: Socio-economic conditions In this section, the countries’ key socio-economic figures are compared, including GDP per capita,
population and urban population.
Fel! Hittar inte referenskälla. ranks the countries’ GDP per capita with their corresponding
European and world rankings.
Table 3.2 GDP per capita21
Country GDP per capita (USD) (2019)
GDP per capita (USD) Rank Europe (2019)
GDP per capita (USD) Rank world (2019)
Netherlands 52,367.9 7 12 Sweden 51,241.9 8 13 Germany 46,564.0 12 18 United Kingdom 41,030.2 15 23 Italy 32,946.5 16 28 Slovenia 26,170.3 20 36
Fel! Hittar inte referenskälla. shows that the GDP per capita of the Netherlands is double the size
of Slovenia’s GDP per capita. The significant difference between the countries’ GDP means that
they represent a wide range in the European ranking of countries in terms of economic output per
capita, from place 7 (NL) to 20 (SI). In comparison to the world ranking, all six countries
nevertheless represent the top 40 countries with highest GDP per capita. There are no clear
differences between the countries with high and medium numbers of EC. IT and SI with both low
numbers of ECs are here placed in the bottom of the six countries but are nevertheless still high
in the world ranking.
Table 3.3 shows the countries’ number of ECs in relation to their population size, ranking the
countries according to their number of ECs per million inhabitants. Table 3.4Table 3.4 displays
the countries’ total population and urban population. The countries are listed according to the size
of their urban population, from the highest to the lowest share.
21 http://statisticstimes.com/economy/european-countries-by-gdp-per-capita.php

This project has received funding from the European Union’s Horizon 2020
research and innovation programme under grant agreement No 837752.
D1.1: Quality procedures
21
Table 3.3 Countries' energy communities in relation to population size
Country ECs per million inhabitants
Number of ECs Population (2020)22
United Kingdom >73.7 >5000 ECs in 2014 67,886,011 Netherlands 34.1 585 ECs in 2020 17,134,872 Germany 20.9 1,747 ECs in 2016 83,783,942 Sweden 13.9 140 ECs in 2016 10,099,265 Slovenia 2,5 5 ECs in 2020 2,078,938 Italy 0.6 34 ECs in 2020 60,461,826
Table 3.4 Population and urban population
Country Urban population (%) (2020)23
Population (2020)24 Urban population (%) EU Average (2019)25
Netherlands 92 % 17,134,872 75 % Sweden 88 % 10,099,265 United Kingdom 83 % 67,886,011 Germany 76 % 83,783,942 Italy 69 % 60,461,826 Slovenia 55 % 2,078,938
Table 3.3 shows that when the countries’ number of ECs are ranked according to their relative
size, the countries share quite similar placements to the three categories of high, medium and low
numbers of ECs in Figure 3.1. UK is still the leading country with its 73.7 ECs per million
inhabitants and IT and SI have the lowest relative sizes of ECs with 2.5 and 0.6 ECs per million
inhabitants respectively. However, there are also a few noticeable differences between the
countries’ absolute and relative figures of ECs. While DE has the second highest number of ECs in
total, NL has more ECs per million inhabitants than DE. Table 3.3 likewise shows that IT has an
even lower relative number of ECs than SI, despite IT’s longer history of EC development.
As seen in Table 3.4, the countries represent a range of urban population sizes. The majority of
the Dutch population live in urban areas (92 percent) whereas it is only close to half of the
population in Slovenia (55 percent). In comparison to the EU average of a 75 percent urban
population, four of the countries (NL, SE, UK and DE) have slightly or considerably higher
percentages and those are also the one with medium or high numbers of ECs. IT and SI, with the
lowest number of ECs, are both below average.
Table 3.5 ranks the countries according to their share of their population with tertiary education.
22 https://www.worldometers.info/population/countries-in-europe-by-population/ 23 https://www.worldometers.info/population/countries-in-europe-by-population/ 24 https://www.worldometers.info/population/countries-in-europe-by-population/ 25 https://data.worldbank.org/indicator/SP.URB.TOTL.IN.ZS?locations=EU

This project has received funding from the European Union’s Horizon 2020
research and innovation programme under grant agreement No 837752.
D1.1: Quality procedures
22
Table 3.5 Tertiary education
Country Population (15-64 years) with tertiary education (%) (2017)26 United Kingdom 38.7 Sweden 36 Netherlands 32.1 Slovenia 28.7 EU-28 27.9 Germany 24.8 Italy 16.5
As Table 3.5 shows, the majority of countries (UK, SE, NL, SI) had a higher share of their population
with a tertiary education than the average in EU countries in 2017. The table suggests that there
is no strong correlation between the six countries’ shares of populations with higher education
and their number of ECs. While the three countries with the highest shares (UK, SE, NL) also
represent higher numbers of ECs, SI has a higher share of inhabitants with higher education than
the EU average despite its few ECs. DE has the opposite relation, with a lower ranking of higher
education than the EU average despite its large number of ECs.
Table 3.6 displays the countries according to their inhabitants’ levels of trust in other people using
data from World Values Survey (2017-2020)27. The figures are ranked according to the category
“Most people can be trusted”.
Table 3.6 Trust in other people
Country Most people can be trusted (%)
Need to be very careful (%)
Don’t know (%) No answer (%)
Sweden 62.8 35.7 1.2 0.4 Netherlands 58.5 39.8 1.5 0.2 Germany 43.4 52.5 3.2 0.8 United Kingdom 40.2 59.3 0.5 0.0 Italy 26.6 71.3 1.6 0.6 Slovenia 25.3 73.2 1.0 0.5
The countries are in Table 3.7 ranked after the level of trust in the political system. The figures
are from Eurostat (2013)28 and the unit of measure is the average of all individuals' ratings on a
scale from 0 ("not satisfied at all") to 10 ("fully satisfied").
Table 3.7 Trust in political and legal system
Country Trust in political system (2013) Trust in legal system (2013)
Sweden 5.5 6.7
Netherlands 5.5 6.2
Germany 4.9 5.3
United Kingdom 3.8 5.5
EU-28 3.5 4.6
Italy 2.1 3.6
Slovenia 1.8 2.7
26 https://ec.europa.eu/eurostat/web/products-datasets/-/edat_lfs_9903 27 http://www.worldvaluessurvey.org/WVSOnline.jsp 28 https://ec.europa.eu/eurostat/web/products-datasets/-/ilc_pw03

This project has received funding from the European Union’s Horizon 2020
research and innovation programme under grant agreement No 837752.
D1.1: Quality procedures
23
Table 3.6 and 3.7 display similar results where inhabitants in SE and NL express the largest
relative trust in both other inhabitants as well as the political and legal system, followed by DE
and UK. IT and SI have the lowest trust in all three categories. While around sixty percent in SE
and NL believe that most people can be trusted, approximately seventy percent in IT and SI believe
that one needs to be very careful.
In Table 3.7, the countries with high and medium numbers of ECs (SE, NL, DE, UK) have higher
trust in both political and legal systems than the EU average. The countries with low numbers of
ECs (IT, SI) have lower trust in both categories than the EU average. Particularly the trust in the
countries’ political systems are low in both IT and SI, with 2.1 and 1.8 respectively. All countries
displayed a higher trust in the legal system than in the political system.
3.3 Context: Technical system In the following section the countries’ energy systems are described, including energy production
and consumption, the electricity system, and energy-related emissions.
3.3.1 Energy production Table 3.8 displays the countries’ energy production (Total Primary Energy Supply, TPES)
alongside EU and IEA averages. The countries are listed according to their TPES per capita.
Table 3.8 Energy production
Country TPES (toe)/capita (2018)
TPES (Mtoe) (2018)
TPES (toe)/ capita EU average (2018)29
TPES (toe)/ capita IEA average (2018)30
Sweden31 4.9 toe 47.9 Mtoe 3.1 toe
4.2 toe Netherlands32 4.2 toe 71.7 Mtoe
Germany33 3.6 toe 298.3 Mtoe Slovenia34 3.4 toe 6.9 Mtoe United Kingdom35 2.6 toe 176.8 Mtoe Italy36 2.5 toe 150.6 Mtoe
As can be seen in Table 3.8, the countries’ energy productions differ substantially. Sweden’s
highest TPES per capita (4.9 toe) is almost the double of Italy’s figure (2.5 toe). In relation to the
EU and IEA averages, United Kingdom and Italy are below both average values, Germany and
Slovenia are situated in between the two averages and the Netherlands and Sweden have the same
or larger energy supplies than both average values. The difference between the IEA and EU
averages of TPES per capita also suggests that the non-EU members of the IEA have high values of
29 https://www.iea.org/data-and-statistics?country=WEOEUR&fuel=Key%20indicators&indicator=TPESbyPop 30 IEA (2020). Energy Policies of IEA Countries. The Netherlands 2020 Review 31 https://www.iea.org/data-and-statistics/data-tables?country=SWEDEN&energy=Balances&year=2018; https://www.iea.org/countries/sweden 32 https://www.iea.org/data-and-statistics/data-tables?country=NETHLAND&energy=Balances&year=2018; https://www.iea.org/countries/the-netherlands 33 https://www.iea.org/countries/germany 34 https://www.iea.org/countries/Slovenia 35 https://www.iea.org/data-and-statistics/data-tables?country=UK&energy=Balances&year=2018; IEA (2019). Energy policies of IEA countries. United Kingdom 2019 Review 36 https://www.iea.org/data-and-statistics/data-tables?country=ITALY&energy=Balances&year=2016; https://www.iea.org/countries/italy

This project has received funding from the European Union’s Horizon 2020
research and innovation programme under grant agreement No 837752.
D1.1: Quality procedures
24
TPES per capita. There was no obvious trend seen here in relation to how many ECs that exist in
the countries.
3.3.2 TPES by source In Table 3.9, the countries’ TPES by source are displayed. The countries are listed according to the
column 'Total Fossil Fuels' which is the countries' share of fossil fuels in their TPES, i.e. the sum of
the shares in percentage of oil, natural gas and coal.
Table 3.9 TPES by source
Country TotalFossil fuels (%)
Energy sources in TPES (%) Oil Natural
gas Coal Nuc-
lear Wind Solar Bio/
waste Hydro Geothe
-rmal Electr -icity trade
Netherlands
(2017)37 91.8 37.
8 40.3 13.7 1.4 0.9 0.2 5 - 0.1 0.6
Italy (2016)38
79.9 34.1
38.5 7.3 - 1 1.4 8.7 2.4 3.7 2.1
Germany (2018)39
79.3 32.8
24.0 22.5 6.6 3.2 1.6 10.1 0.5 0.1 -1.4
United Kingdom
(2017)40
78.5 34.5
38.6 5.4 10.4 2.4 0.6 7.1 0.3 - 0.7
Slovenia (2017)41
61 33 11 17 24 0.3 0.3 10 5 0.3 N.A.
Sweden (2017)4243
27 21.2
1.9 3.9 34.9 3.1 0.4 26.3 11.4 - -3.3
Although the countries' TPES profiles differ, Table 3.9 displays that there remains a strong
dependence on fossil fuels overall. Oil, natural gas and coal have the three largest shares in the
energy production of several countries (NL, IT, DE, UK). The Netherlands has the largest fossil fuel
dependency with 92 percent of its supply consisting of oil, natural gas or coal. Italy, Germany, and
the United Kingdom have similar shares of fossil fuels of close to 80 percent of their total energy
production, which is similar to the 2018 IEA median. The countries have nevertheless a larger
share of fossil fuels than the EU-28 average of 71 percent in 2018.44 Slovenia's 61 percent of fossil
fuels is thus lower than both IEA and EU averages. The most apparent difference among the
countries' fossil fuel profiles is Sweden's low figure (27 percent) as Sweden has by far the lowest
share of fossil fuels among the IEA countries.45 The large shares of fossil fuels in the majority of
the countries could provide an incentive for the development of ECs. However, no obvious trends
can be identified concerning the countries' shares of fossil fuels and the three categories of ECs.
37 https://www.ieabioenergy.com/wp-content/uploads/2018/10/CountryReport2018_Netherlands_final.pdf 38 https://www.ieabioenergy.com/wp-content/uploads/2018/10/CountryReport2018_Italy_final.pdf 39 IEA (2020). Germany 2020 Energy Policy Review 40 IEA (2019). Energy policies of IEA countries. United Kingdom 2019 Review 41 OECD (2019). Fossil Fuel Support Country Note. Slovenia; http://stats.oecd.org/wbos/fileview2.aspx?IDFile=bd2dc92f-1480-46d3-bd55-850d267aeb8d 42 IEA (2019). Energy Policies of IEA Countries. Sweden 2019 review 43 Sweden's TPES also includes: Peat 0.3 %. 44 https://www.iea.org/data-and-statistics?country=EU28&fuel=Energy%20supply&indicator=TPESbySource. This data excludes electricity and heat trade. 45 IEA (2019). Energy Policies of IEA Countries. Sweden 2019 review

This project has received funding from the European Union’s Horizon 2020
research and innovation programme under grant agreement No 837752.
D1.1: Quality procedures
25
In the countries' profiles of fossil fuels, the large percentages of natural gas of Netherlands, Italy
and the United Kingdom are noteworthy, as these countries have the three largest shares of
natural gas in their TPES among IEA members.46 Sweden's share of nuclear power represents one
of the largest shares of nuclear power in a country's TPES in the IEA.47 Similarly, Table 3.9 shows
that nearly one fourth of Slovenia's energy mix consists of nuclear power.
Although many countries show a more diversified energy mix than previously with a reduced
reliance on fossil fuels, the countries' shares of renewable energy sources remain small. If
excluding the category of bio/waste, as its eligibility as a renewable energy source remains
debated, most countries experience low shares of renewables between one percent (NL) to six
percent (SI). Sweden's energy supply of renewable sources (15 percent) is the largest share
among the countries. All countries have between five to ten percent of bio/waste apart from
Sweden with the largest share of 26 percent.
3.3.3 Energy consumption In Table 3.10 the countries’ energy consumption alongside IEA averages are shown. The countries
are listed according to their total final consumption (TFC) per capita, from highest to lowest.
Table 3.10 Energy consumption
Country TFC/ capita (toe) TFC (Mtoe) Energy intensity (TFC/GDP PPP) Netherlands48 4.2 toe (2018 64.5 Mtoe (2017) 90.2 toe/USD million PPP (2015) Sweden49 3.3 toe (2017) 33.5 Mtoe (2017) 73.7 toe/USD million PPP (2017) IEA50 2.9 toe (2017) N.A. 73.9 toe/USD million PPP (2017) Germany51 2.7 toe (2017) 227.0 Mtoe (2017) 62.3 toe/USD million PPP (2017) Slovenia52 2.4 toe (2018) 5.1 Mtoe (2018) N.A. Italy53 1.9 toe (2014) 116.6 Mtoe (2014) 59.9 toe/USD million PPP (2016)
United Kingdom54 1.9 toe (2017) 127.3 Mtoe (2017) 49.0 toe/USD million PPP (2017)
Comparing the values in Table 3.10, the largest energy consumption by the Netherlands (4.2 toe
per capita) is more than double of the 1.9 toe per capita of Italy and the United Kingdom. The
Netherlands’ high TFC per capita is explained by its large refining and petrochemical industries.55
While the final energy consumption of these three countries (NL, IT, UK) differ noticeably from
the IEA average of 2.9 toe per capita, the other three countries (DE, SI, SE) display values that
correspond more closely to the IEA average.
The ranking of countries according to TFC per capita to a large extent mirrors their order of energy
intensity (TFC/GDP PPP). Similar to the comparison of TFC per capita, Italy and United Kingdom
have considerably lower energy intensity values than the IEA average. However, all countries but
Netherlands have lower energy intensity than the IEA average. The findings in Table 3.10 suggest
46 IEA (2019). Energy policies of IEA countries. United Kingdom 2019 Review 47 IEA (2019). Energy Policies of IEA Countries. Sweden 2019 review 48 https://ec.europa.eu/eurostat/documents/2995521/9549144/8-07022019-AP-EN.pdf/4a5fe0b1-c20f-46f0-8184-e82b694ad492; https://estore.enerdata.net/netherlands-energy.html; https://tradingeconomics.com/netherlands/total-final-energy-consumption-tfec-wb-data.html 49 IEA (2019). Energy Policies of IEA Countries. Sweden 2019 review 50 IEA (2020). Energy Policies of IEA Countries. The Netherlands 2020 Review 51 IEA (2020). Germany 2020 Energy Policy Review 52https://pxweb.stat.si/SiStatDb/pxweb/en/30_Okolje/30_Okolje__18_energetika__01_18179_bilanca_kazalniki/1817902S.px/ 53 IEA (2016). Energy Policies of IEA countries. Italy 2016 review 54 IEA (2019). Energy policies of IEA countries. United Kingdom 2019 Review 55 https://estore.enerdata.net/netherlands-energy.html

This project has received funding from the European Union’s Horizon 2020
research and innovation programme under grant agreement No 837752.
D1.1: Quality procedures
26
that there is no clear relation between a country’s number of ECs and its TFC per capita or energy
intensity.
3.3.4 Electricity system The following section compares key figures in the countries’ electricity systems. In 2018, around
500 million citizens were provided by electricity in the EU through an electricity system with
467 000 gigawatt-hours (GWh) of trade.56
3.3.4.1 Electricity production Table 3.11 presents key figures of the countries’ electricity productions. The countries are listed
by their electricity generation, with the highest value first.
Table 3.11 Electricity production
Country Electricity generation (TWh)
Net export/import (TWh) (2018)
Installed capacity (GW)
Germany57 644 TWh (2018 prov.) 48.7 TWh (net export) 215.5 GW (2017) United Kingdom58 335.5 TWh (2017) 19 TWh (net import) 103.5 GW (2017) Italy59 280.7 TWh (2015) 43.9 TWh (net import) 117.7 GW (2014) Sweden60 159.3 TWh (2018) 17.2 TWh (net export) 39.8 GW (2017) Netherlands61 121 TWh (2019) 8 TWh (net import) 35 GW (2018) Slovenia62 16.3 TWh (2018) 0.5 TWh (net import) 3.6 GW (2017)
Table 3.11 shows that the countries differ in their electricity production, where Germany’s
electricity generation is fortytimes the size of Slovenia’s. The countries’ size of electricity
generation corresponds quite closely with their relative size of installed electricity capacity. The
only countries that change place in their rankings are Italy and the United Kingdom, where IT has
a larger installed capacity, and the UK has a greater electricity generation. The countries likewise
have different profiles concerning their production in relation to the national demand, where
Sweden and Germany are the two sole exporters. As the figures solely represent the outcome of a
single year, the countries’ total electricity import or export may differ over time depending on a
range of factors. In 2018, Slovenia had only a small net import of electricity, but the country’s
dependency of electricity imports has fluctuated greatly between 2009-2017.63
56 IEA (2020) European Union 2020 Energy Policy Review 57 IEA (2020). Germany 2020 Energy Policy Review 58 IEA (2019). Energy policies of IEA countries. United Kingdom 2019 Review; https://www.iea.org/data-and-statistics/data-tables?country=UK&energy=Electricity&year=2018 59 IEA (2016). Energy Policies of IEA countries. Italy 2016 review; https://www.iea.org/data-and-statistics/data-tables?country=ITALY&energy=Electricity&year=2018 60 https://www.iea.org/data-and-statistics/data-tables?country=SWEDEN&energy=Electricity&year=2018; IEA (2019). Energy Policies of IEA Countries. Sweden 2019 review 61 https://www.cbs.nl/en-gb/figures/detail/80030eng; IEA (2020). Energy Policies of IEA Countries. The Netherlands 2020 Review 62 Agencija za energijo (2019). Report on the Energy Sector in Slovenia 2019; https://www.iea.org/data-and-statistics?country=SLOVENIA&fuel=Energy%20supply&indicator=Electricity%20generation%20by%20source; https://ec.europa.eu/eurostat/statistics-explained/index.php?title=Electricity_production_and_supply_statistics&oldid=59327#Production_of_electricity, data from the excel file 63 Agencija za energijo (2017). Report on the energy sector in Slovenia 2017

This project has received funding from the European Union’s Horizon 2020
research and innovation programme under grant agreement No 837752.
D1.1: Quality procedures
27
3.3.4.2 Electricity generation mix Table 3.12 presents the countries’ electricity generation according to their energy source. The
table ranks the countries according to the column 'Total Fossil fuels' which is the countries' share
of fossil fuels in their electricity generation mix, i.e. the sum of the shares in percentage of oil,
natural gas and coal.
Table 3.12 Electricity generation mix
Country
Total Fossil fuels (%)
Total Fossil fuels IEA avg. (%)
Energy sources in electricity generation mix (%)
Oil Natural gas
Coal Nuclear Wind Solar Bio/ waste
Hydro Other
Netherlands (2019)64
73.2 47 0.1 58.7 14.4 3.2 9.5 4.3 4.6 0.1 5.2
Italy (2015)6566
59.7 4.8 38.3 16.6 - 5.2 9.3 7.8 15.6 2.2
Germany (2018 prov.)67
51.5 0.8 13.2 37.5 11.8 17.3 7.4 9.1 2.8 -
United Kingdom (2017)68
48.2 0.5 40.8 6.9 21.0 14.9 3.4 10.7 1.8 -
Slovenia (2018)69
31.4 0.1 2.9 28.4 35.4 - 1.6 1.7 30 4.6
Sweden (2017)70
0 - - - 39 11 0.1 9 40 0.9
The countries’ shares of fossil fuels based on the generation mix presented in Table 3.12 can be
compared to the IEA average of 47 percent fossil fuels. Some countries, such as the United
Kingdom with 48 percent fossil fuels and Germany with 52 percent, are quite close to the IEA
average. Concerning the countries with a low number of ECs, Slovenia displays less fossil fuels in
its generation mix (31 percent) whilst Italy has a higher share (60 percent). The fossil fuel
dependency of the Netherlands and Sweden differ the greatest from the IEA average. The
Netherlands has one of the most carbon-intensive electricity generation mixes in Europe with a
share of 73 percent fossil fuels, whereas Sweden has one of the lowest fossil fuel shares in its mix
among the IEA countries. Overall, the six countries display a substantially lower fossil fuel
dependency in their electricity generation mix than in their TPES (see Table 3.9).
Correspondingly, the countries’ shares of renewable energy sources in the generation mix differ.
If the category of bio/waste is treated separately, the majority of the countries (IT, SI, DE, UK) are situated between 20 to 32 percent of renewable energy: 20 (UK), 28 (DE), and 32 (IT, SI). The
64 https://www.cbs.nl/en-gb/figures/detail/80030eng; https://www.cbs.nl/en-gb/figures/detail/82610ENG 65 IEA (2016). Energy Policies of IEA countries. Italy 2016 review 66 Italy’s category of ’Other’ energy sources represents 2.2 percent geothermal energy 67 IEA (2020). Germany 2020 Energy Policy Review 68 IEA (2019). Energy policies of IEA countries. United Kingdom 2019 Review 69 https://www.iea.org/data-and-statistics?country=SLOVENIA&fuel=Energy%20supply&indicator=Electricity%20generation%20by%20source 70 Swedish Energy Agency (2019). Energy in Sweden. Facts and Figures 2019. Eskilstuna: Swedish Energy Agency

This project has received funding from the European Union’s Horizon 2020
research and innovation programme under grant agreement No 837752.
D1.1: Quality procedures
28
Netherlands and Sweden display more outlying numbers of renewable energy in their mixes, with
14 and 51 percent respectively. The studied countries have different profiles of renewable energy
sources, where for instance Germany and United Kingdom have the largest shares in wind power
among the studied countries whilst Italy has the largest share of solar power among all IEA
countries.71 In total for the six countries, the combined share of hydro power is the largest share
of renewable energy sources as a result of Slovenia’s and Sweden’s high percentages (30 and 40
percent respectively of their total electricity generation). Wind power has the second largest
share of renewable energy sources in total.
If bio/waste is included to make the figures comparable to the IEA average of renewable energy
in electricity generation, all countries apart from the Netherlands place higher than the IEA 2017
average of 24.7 percent renewable energy.72
The countries’ dependency on nuclear energy differ greatly as well, where Sweden and Slovenia
display high shares (39 respectively 35 percent) and Italy and Netherlands have very low or no
nuclear energy included in their electricity mixes.
3.3.4.3 Electricity consumption In Table 3.13 electricity consumption by country is presented. The countries are listed according
to the electricity consumption per capita, from the highest value to the lowest.
Table 3.13 Electricity consumption
Country Consumption/capita (2019)
Consumption/ capita EU Average (2018)73
Electricity consumption (2019)
Sweden74 12.8 MWh 6.0 MWh
131.8 TWh Slovenia75 7.1 MWh 14.9 TWh Germany76 6.7 MWh 558.9 TWh Netherlands77 6.7 MWh 116.9 TWh Italy78 5.2 MWh 311.9 TWh United Kingdom79 4.8 MWh 318.3 TWh
In 2018, the majority of the countries (SE, SI, DE, NL) had higher electricity consumption per capita than the EU average of 6.0 MWh. Sweden's electricity use per capita particularly stands out in Table 3.13 as it is close to double of Slovenia's second highest consumption. Sweden's electricity consumption is one of the highest in the world, due to large electricity-intensive industries and traditionally low electricity prices that have also resulted in widespread use of direct electric heating in detached houses.80
71 IEA (2016). Energy Policies of IEA countries. Italy 2016 review 72 IEA (2019). Energy Policies of IEA Countries. Sweden 2019 review 73 https://www.iea.org/data-and-statistics?country=EU28&fuel=Electricity%20and%20heat&indicator=ElecConsPerCapita 74 https://www.iea.org/data-and-statistics?country=SWEDEN&fuel=Electricity%20and%20heat&indicator=ElecConsPerCapita 75 https://www.iea.org/data-and-statistics?country=SLOVENIA&fuel=Electricity%20and%20heat&indicator=ElecConsPerCapita 76 https://www.iea.org/data-and-statistics?country=GERMANY&fuel=Electricity%20and%20heat&indicator=ElecConsPerCapita 77 https://www.iea.org/data-and-statistics?country=NETHLAND&fuel=Electricity%20and%20heat&indicator=ElecConsPerCapita 78 https://www.iea.org/data-and-statistics?country=ITALY&fuel=Electricity%20and%20heat&indicator=ElecConsPerCapita 79 https://www.iea.org/data-and-statistics?country=UK&fuel=Electricity%20and%20heat&indicator=ElecConsPerCapita 80 IEA (2019). Energy Policies of IEA Countries. Sweden 2019 review

This project has received funding from the European Union’s Horizon 2020
research and innovation programme under grant agreement No 837752.
D1.1: Quality procedures
29
3.3.4.4 Electricity consumption by sector Table 3.14 displays the countries’ electricity consumption by sector. The countries are listed
alphabetically and therefore no colours are used to highlight the countries’ different positions. The category ‘commercial’ includes commercial and public services as well as agriculture and
forestry.
Table 3.14 Electricity consumption by sector
Country Industry (%) Commercial (%) Residential (%) Transport (%) Other (%) Germany (2017)81 43 28 24 2 2 Italy (2018)82 40 34 22 4 N.A. Netherlands (2018)83
33 43 21 2 N.A.
Slovenia (2018)84 50 23 25 2 N.A. Sweden (2017)85 39 22 35 2 2 United Kingdom (2017)86
30 32 34 2 2
While Table 3.14 shows that the industrial, commercial, and residential sectors account for the
largest shares of the final consumption for all countries, the countries’ profiles nevertheless differ.
Industry has the largest share for the majority of countries (DE, IT, SI, SE,). Especially Slovenia’s
and Germany’s electricity consumption are dominated by the industrial sector (50 and 43 percent
respectively). The commercial sector is most pronounced in the Netherlands, which can be
partially explained by the country’s relatively large consumption by its agriculture and forestry
sector (9 percent of total consumption). For the United Kingdom, the industrial, commercial, and
residential sectors each account for around one-third of the final consumption. The United
Kingdom and Sweden have the largest shares of residential electricity consumption among the
countries. For all countries, the transport sector’s consumption is very small.
3.3.4.5 Electricity price Table 3.15 and Table 3.16 display the countries’ electricity prices. In Table 3.15, the countries are
listed according to their share of taxes and levies in the average price, from the highest share to
the lowest.
Table 3.15 Electricity prices87
Country Share of taxes and levies in average price (%) (2017)
Households’ average electricity price per 100 kWh (EUR) (2017)
Germany 54 % 28.7 EUR Italy 38% 21.4 EUR EU-28 37 % 20.4 EUR Sweden 35 % 19.4 EUR Slovenia 31 % 16.1 EUR
81 IEA (2020). Germany 2020 Energy Policy Review 82 https://www.iea.org/data-and-statistics?country=ITALY&fuel=Electricity%20and%20heat&indicator=ElecConsBySector 83 https://www.iea.org/countries/the-netherlands 84 https://www.iea.org/data-and-statistics?country=SLOVENIA&fuel=Electricity%20and%20heat&indicator=ElecConsBySector 85 IEA (2019). Energy Policies of IEA Countries. Sweden 2019 review 86 IEA (2019). Energy policies of IEA countries. United Kingdom 2019 Review 87 https://ec.europa.eu/eurostat/documents/2995521/8489679/8-29112017-AP-EN.pdf/600c794f-c0d8-4b33-b6d9-69e0489409b7

This project has received funding from the European Union’s Horizon 2020
research and innovation programme under grant agreement No 837752.
D1.1: Quality procedures
30
Netherlands 27% 15.6 EUR United Kingdom 24% 17.7 EUR
In Table 3.15, Germany particularly stands out as the country with the highest share of taxes and
levies, as the share represents more than half of its electricity price. Germany pays the third
highest electricity price among all IEA countries, as a result of a high surcharge on electricity
consumers to finance renewable energy among other things.88 All countries have larger shares of
taxes and levies than the median tax rate of IEA member countries (22 percent).89 However,
compared to the EU average of 37 percent of taxes and levies in the average household electricity
price90, the majority of countries have lower shares (SE, SI, NL, UK). For all countries but the
United Kingdom, their share of taxes and levies mirror their situation in the ranking of electricity
price. Despite having the lowest share of taxes and levies, the United Kingdom has higher
electricity prices than Slovenia and the Netherlands. In total, all countries but Germany and Italy
have lower electricity prices than the EU average of 20.4 Euro per kWh.
In Table 3.16, the countries’ average yearly household electricity costs are related to households’
average income. The countries are listed according to the households’ electricity costs as average
share of total household income.
Table 3.16 Electricity prices as share of household income
Country Households’ electricity costs as avg. share of income (%) (2017)
Households’ avg. price per 100 kWh (EUR) (2017)91
Households’ avg. electricity usage (kWh) (2017)92
Households’ avg. electricity cost/year (EUR) (2017)
Households’ mean net income/year (EUR) (2017)93
Sweden 6.7 % 19.4 EUR 9601 kWh 1862.6 EUR 27,916 EUR Slovenia 5.1 % 16.1 EUR 4280 kWh 689.1 EUR 13,585 EUR Germany 3.9 % 28.7 EUR 3334 kWh 956.9 EUR 24,757 EUR EU-28 3.9 % 20.4 EUR 3713 kWh 757.5 EUR 19,384 EUR Italy 3 % 21.4 EUR 2651 kWh 567.3 EUR 18,714 EUR United Kingdom
2.6 % 17.7 EUR 3666 kWh 648.9 EUR 25,244 EUR
Netherlands 1.8 % 15.6 EUR 3051 kWh 476 EUR 26,355 EUR
Table 3.16 shows that Swedish households had the highest average electricity usage in 2017
(9601 kWh/year), substantially higher than Slovenian households’ 4280 kWh per year and the
EU average of 3713 kWh per year. The other four countries all have average electricity
consumptions between 2600-3700 kWh. Sweden and Slovenia also had the highest electricity
consumption per capita, as seen in Table 3.13.
The yearly electricity costs are also the highest shares of household expenses in Sweden and
Slovenia, 6.7 and 5.1 percent respectively. As mentioned previously, Sweden’s high household
electricity consumption can be linked to a traditionally higher usage of electric heating. In 2016,
88 IEA (2020). Germany 2020 Energy Policy Review 89 IEA (2020). Energy Policies of IEA Countries. The Netherlands 2020 Review 90 https://ec.europa.eu/eurostat/documents/2995521/8489679/8-29112017-AP-EN.pdf/600c794f-c0d8-4b33-b6d9-69e0489409b7 91 https://ec.europa.eu/eurostat/documents/2995521/8489679/8-29112017-AP-EN.pdf/600c794f-c0d8-4b33-b6d9-69e0489409b7 92 https://www.odyssee-mure.eu/publications/efficiency-by-sector/households/electricity-consumption-dwelling.html 93 https://ec.europa.eu/eurostat/databrowser/view/ilc_di04/default/table?lang=en

This project has received funding from the European Union’s Horizon 2020
research and innovation programme under grant agreement No 837752.
D1.1: Quality procedures
31
energy consumption for space heat and hot water in buildings comprised of 26 percent electricity
in Sweden.94 The other countries had considerably lower shares of electricity in heating, such as
Germany’s 3 percent95 or UK’s 8 percent in total for storage and non-storage.96 Despite having the
second lowest electricity costs per 100 kWh among the countries, Slovenian households pay the
second highest relative share of electricity costs as a result of having the lowest average yearly
income among the countries. While Table 3.15 showed that Germany had both the highest share
of taxes and levies in its electricity price and a substantially higher average electricity price per
100 kWh than the other countries, the share of electricity costs of German households’ incomes is
the same as the EU average.
Table 3.16 does not show a clear relation between the countries’ numbers of ECs and their relative
share of electricity costs in household expenses. All three categories of high, medium, and low
number of ECs are represented both above and below the EU average of 3.9 percent.
3.3.4.6 The electricity grid In Table 3.17 the countries’ electricity grids and smart grids are contrasted. The countries’
transmission system operators (TSO) and distribution system operators (DSO) are explored. The
countries are listed alphabetically and therefore no colours are used to highlight the countries’
different positions.
Table 3.17 Electricity grids (TSOs, DSOs and smart meters)
Country TSO DSO Smart meters Germany97 4 880 (2013) Smart meter roll-out slowly
occurring. First stage of 2016 Act only targets larger consumers and generation facilities (consumers with an energy consumption exceeding 6 000 kWh per year).
Italy98 1 144 (2013) Almost 32 million installed in homes and businesses in 2015.
Netherlands99 1 8 (2017) In 2018, around 5.2 million (54%) households had a smart meter. Obligation for the DSOs to implement a second round of residential smart meter deployment from 2021 to 2023.
Slovenia100 1 5 (2018) 57% of consumers on the distribution system were equipped with smart meters in 2017.
94 IEA (2019). Energy Policies of IEA Countries. Sweden 2019 review 95 IEA (2020). Germany 2020 Energy Policy Review 96 https://www.statista.com/statistics/426988/united-kingdom-uk-heating-methods/ 97 IEA (2020). Germany 2020 Energy Policy Review; https://publications.jrc.ec.europa.eu/repository/bitstream/JRC113926/jrc113926_kjna29615enn_newer.pdf 98 IEA (2016). Energy Policies of IEA countries. Italy 2016 review; https://publications.jrc.ec.europa.eu/repository/bitstream/JRC113926/jrc113926_kjna29615enn_newer.pdf 99 IEA (2020). Energy Policies of IEA Countries. The Netherlands 2020 Review; https://energiecijfers.info/hoofdstuk-1/ 100 Agencija za energijo (2017). Report on the energy sector in Slovenia 2017; https://publications.jrc.ec.europa.eu/repository/bitstream/JRC113926/jrc113926_kjna29615enn_newer.pdf; https://www.agen-rs.si/izvajalci/elektrika/distribucijsko-omre

This project has received funding from the European Union’s Horizon 2020
research and innovation programme under grant agreement No 837752.
D1.1: Quality procedures
32
Sweden101 1 173 (2013) In the process of rolling out second generation of smart meters by the end of 2024. All DSOs will install smart meters.
United Kingdom102
Great Britain (GB) is operated by a single Electricity system operator (ESO): National Grid Electricity System Operator (NGESO). EirGrid is the TSO for Northern Ireland (NI).
15 Distribution Network Operators (DNOs) in total: 14 DNOs owned by 6 different groups in GB; and one (Northern Ireland Electricity Networks) in Northern Ireland. A process is underway to develop DNOs into DSOs.
Since 2016, a full-scale rollout of smart meters for both electricity and gas in homes and small businesses on a voluntary basis in GB. Planned end-date of 2024. Semi-smart prepayment meters were introduced to NI in 2002 and by 2014 they were used in approx. 40 percent of households. However, fully smart meters are uncommon as of yet.
Table 3.17 shows that the number of TSOs and DSOs differ between the countries. The majority of
the countries have a single TSO (IT, NL, SI, SE), while Germany has four and the UK has an
overarching ESO for Great Britain and a regional TSO present in Northern Ireland. The countries’
systems of DSOs differ likewise, where some countries only have less than ten (SI, NL), and others
have over a hundred (IT, SE) or even closer to a thousand (DE). The United Kingdom has instead
fifteen DNOs that are underway to develop into DSOs.
Table 3.17 also displays that all six countries are currently rolling out smart meters, with some
countries particularly advancing quickly. Slovenia is for instance one of the leading countries in
Europe regarding introducing advanced metering.103 Similarly, the Netherlands had 54 % of
households equipped with a smart meter in 2018.
3.3.5 Energy related emissions Table 3.18 presents the countries’ energy-related emissions. The countries are ranked according
to CO2/population, from the highest to the lowest.
Table 3.18 Energy-related emissions104
Country CO2/Pop (tCO2/capita) (2017)
CO2 emissions (Mt of CO2) (2017)
CO2/TPES (tCO2/toe) (2017)
CO2/GDP (kg CO2/2010 USD) (2017)
Netherlands 9.08 155.6 2.10 0.17 Germany 8.70 718.8 2.31 0.19 Slovenia 6.49 13.4 1.94 0.25 United Kingdom 5.43 371.1 2.04 0.13 Italy 5.31 321.5 2.10 0.15 Sweden 3.74 37.6 0.77 0.07
101IEA (2019). Energy Policies of IEA Countries. Sweden 2019 review; https://publications.jrc.ec.europa.eu/repository/bitstream/JRC113926/jrc113926_kjna29615enn_newer.pdf 102 https://www.ofgem.gov.uk/system/files/docs/2019/06/dso_-_ofgem_regulatory_principles_and_priorities_workshop_notes.pdf; https://www.ofgem.gov.uk/electricity/transmission-networks/gb-electricity-transmission-network; https://eu-sysflex.com/partners/eirgrid-eirgrid-plc/; Darby, S.J. & Liddell, C. (2016). Communicating ‘smartness’: smart meter installers in UK homes, European Council for an Energy-Efficient Economy (eceee). 103 Agencija za energijo (2019). Report on the Energy Sector in Slovenia 2019 104 IEA (2019). Key World Energy Statistics

This project has received funding from the European Union’s Horizon 2020
research and innovation programme under grant agreement No 837752.
D1.1: Quality procedures
33
As Table 3.18 reveals, the carbon-dioxide emissions per capita differ greatly between the
countries. The Netherlands’ CO2 emissions per capita is the highest among the countries (9.08
tCO2 per capita). Sweden has distinctly the lowest energy-related emissions per capita among the
countries (3.74 tCO2), as well as the second-lowest figure in the IEA.105 The EU-28 average in 2017
of 6.3 tCO2/capita106 sits in the middle of the countries; half of the countries have higher carbon-
dioxide emissions per capita than the EU average (NL, DE and SI) and the other half have lower
(UK, IT, SE).
Examining the column of CO2/GDP in Table 3.18, all countries place close to a CO2 intensity of 0.1-
0.2 CO2 where Sweden has the lowest value (0.07). All countries but Slovenia have lower CO2
intensity than the IEA average of 0.24 in 2016.107 One difference between the measures is that
while Slovenia has the highest CO2 intensity in relation to its GDP, its CO2 emissions per capita
(CO2/Pop) and its carbon intensity of the energy mix (CO2/TPES) are noticeably lower than other
countries.
3.4 Context: Institutional settings In this section, the countries’ main subsidy schemes and support for renewables and ECs are
presented. More in-depth descriptions of European countries’ legal and regulatory frameworks
for energy sectors have been presented elsewhere.108
3.4.1 Subsidies and support In Table 3.19, the countries’ main subsidies for renewable energy and feed-in-tariff schemes are
described. The countries are presented in alphabetic order and no colours are used to highlight
the order.
Table 3.19 Renewable energy subsidies and programmes
Country Main subsidies for renewables Feed-in Tariffs (FiT) Germany109 Previous tax incentives on biofuels
have expired and since 2015, biofuels are subsidised solely through EU biofuel targets.
FiTs and feed-in premiums have supported all RES since the 2000s. Set by government initially and eventually moved to market-based through auctions. The Renewable Energy Sources Act (2000) enabled financial support, guaranteed grid connectivity for renewables and preferential dispatch for 20 years.
Italy110 Waste, biomass and other renewable energy are exempt from taxes if used for heat or electricity. Tax credits for instalment costs of solar PV system. Net metering scheme for renewable energy producers.
Had a FiT scheme in place between 2005-2013, especially beneficial for photovoltaic installations.
105 IEA (2019). Energy Policies of IEA Countries. Sweden 2019 review 106 https://www.iea.org/data-and-statistics?country=EU28&fuel=CO2%20emissions&indicator=CO2PerCap 107 IEA (2019). Energy Policies of IEA Countries. Sweden 2019 review 108 Herbart Smith Freehills (2019) European Energy Handbook 2019-2020. A survey of the legal framework and current issues in the European Energy sector 109 IEA (2020). Germany 2020 Energy Policy Review 110 IEA (2016). Energy Policies of IEA countries. Italy 2016 review; Di Dio, V., Favuzza, S., La Cascia, D., Massaro, F. & Zizzo, G. (2015). Critical assessment of support for the evolution of photovoltaics and feed-in tariff(s) in Italy, Sustainable Energy Technologies and Assessments, 9, 95-104.

This project has received funding from the European Union’s Horizon 2020
research and innovation programme under grant agreement No 837752.
D1.1: Quality procedures
34
Between 1999-2012, a green certificate scheme was in place requiring a yearly minimum quota of renewable electricity inserted into the power system.
Netherlands111 Subsidies for renewable energy through the Sustainable Energy Transition Incentive scheme (SDE+, expanded to SDE++ in 2020) which supports renewables and a wide range of technologies that reduce GHG emissions. A net metering scheme allows energy tax incentives for communities that communally produce electricity from renewable sources (the so-called postal code area scheme). There is also a net metering scheme that supports small-scale PV deployment and subsidies e.g. for energy efficiency measures.
A tender-based premium feed-in scheme (SDE+) since 2011. Replaced by SDE++ scheme in 2020, where sustainable energy techniques will compete on the avoidance of CO2 emissions cost-effectively instead of on produced sustainable energy.
Slovenia112 A net metering scheme from 2016 for all renewable energy installations of households and small enterprises, from 2019 for collective self-consumption in multi-apartment buildings and RES communities. Eligiblity for incentives for self-sufficiency in electricity is expanding from individual to small business consumption and community self-sufficiency. A RES and Combined Heat and Power (CHP) support scheme has been in place since 2009. The scheme grants producers state aid for electricity produced using RES and CHP in the form of guaranteed prices or operational support. In the support scheme hydro energy, wind, solar energy, geothermal energy, biomass, biogas, energy from landfill gas, sewage treatment plants and energy from biodegradable waste are included.
A FiT and premium tariff since 2002, granted via tender procedures. Electricity producers can select either a guaranteed FiT or a bonus (premium) on top of the free market price for electricity.
Sweden113 Subsidy programme supporting local and regional infrastructure investments since 2015 with around 1900 projects funded. Investment aid
No FiT scheme in place.
111 IEA (2020). Energy Policies of IEA Countries. The Netherlands 2020 Review; Government of the Netherlands (2016). Energy report. Transition to sustainable society 112 Agencija za energijo (2019). Report on the Energy Sector in Slovenia 2019; http://www.pisrs.si/Pis.web/pregledPredpisa?id=URED7867#; https://www.energetika-portal.si/nc/novica/n/prenovljene-spodbude-eko-sklada-za-naprave-za-samooskrbo-z-elektricno-energijo-za-izvedbo-4224/ 113 Palm, J. (2018). Household installation of solar panels - motives and barriers in a 10-year perspective, Energy Policy, 113, 1-8; IEA (2019). Energy Policies of IEA Countries. Sweden 2019 review
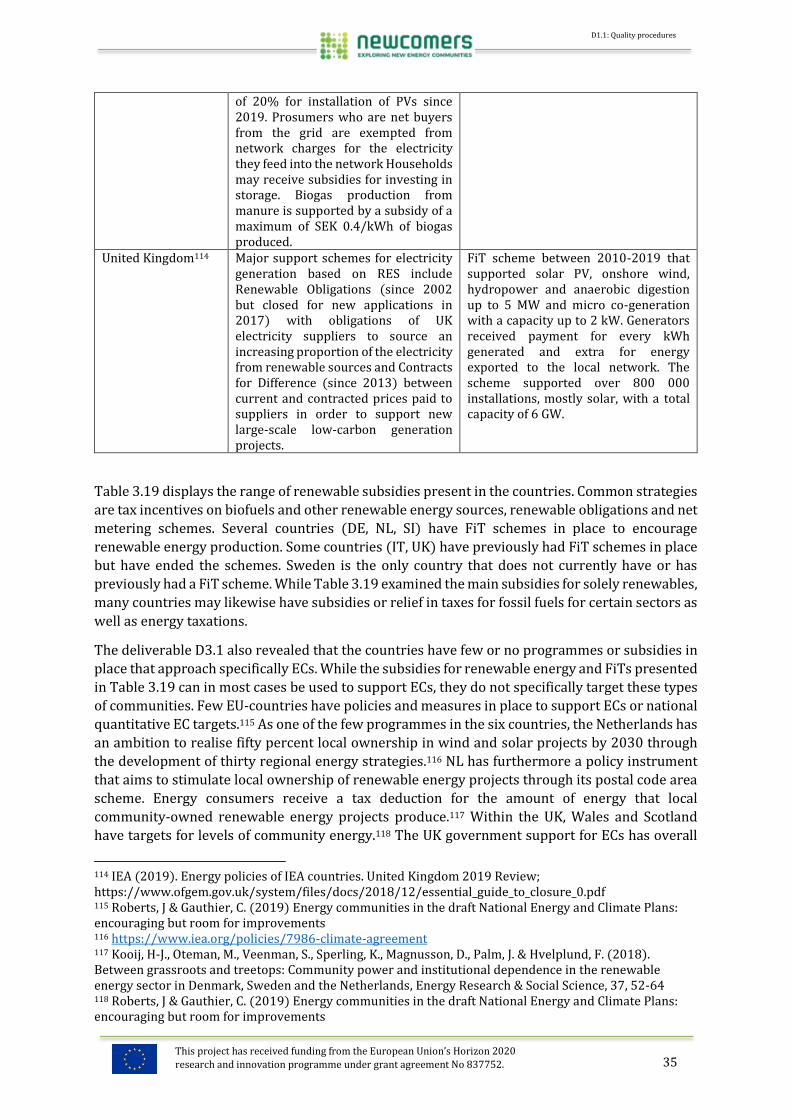
This project has received funding from the European Union’s Horizon 2020
research and innovation programme under grant agreement No 837752.
D1.1: Quality procedures
35
of 20% for installation of PVs since 2019. Prosumers who are net buyers from the grid are exempted from network charges for the electricity they feed into the network Households may receive subsidies for investing in storage. Biogas production from manure is supported by a subsidy of a maximum of SEK 0.4/kWh of biogas produced.
United Kingdom114 Major support schemes for electricity generation based on RES include Renewable Obligations (since 2002 but closed for new applications in 2017) with obligations of UK electricity suppliers to source an increasing proportion of the electricity from renewable sources and Contracts for Difference (since 2013) between current and contracted prices paid to suppliers in order to support new large-scale low-carbon generation projects.
FiT scheme between 2010-2019 that supported solar PV, onshore wind, hydropower and anaerobic digestion up to 5 MW and micro co-generation with a capacity up to 2 kW. Generators received payment for every kWh generated and extra for energy exported to the local network. The scheme supported over 800 000 installations, mostly solar, with a total capacity of 6 GW.
Table 3.19 displays the range of renewable subsidies present in the countries. Common strategies
are tax incentives on biofuels and other renewable energy sources, renewable obligations and net
metering schemes. Several countries (DE, NL, SI) have FiT schemes in place to encourage
renewable energy production. Some countries (IT, UK) have previously had FiT schemes in place
but have ended the schemes. Sweden is the only country that does not currently have or has
previously had a FiT scheme. While Table 3.19 examined the main subsidies for solely renewables,
many countries may likewise have subsidies or relief in taxes for fossil fuels for certain sectors as
well as energy taxations.
The deliverable D3.1 also revealed that the countries have few or no programmes or subsidies in
place that approach specifically ECs. While the subsidies for renewable energy and FiTs presented
in Table 3.19 can in most cases be used to support ECs, they do not specifically target these types
of communities. Few EU-countries have policies and measures in place to support ECs or national
quantitative EC targets.115 As one of the few programmes in the six countries, the Netherlands has
an ambition to realise fifty percent local ownership in wind and solar projects by 2030 through
the development of thirty regional energy strategies.116 NL has furthermore a policy instrument
that aims to stimulate local ownership of renewable energy projects through its postal code area
scheme. Energy consumers receive a tax deduction for the amount of energy that local
community-owned renewable energy projects produce.117 Within the UK, Wales and Scotland
have targets for levels of community energy.118 The UK government support for ECs has overall
114 IEA (2019). Energy policies of IEA countries. United Kingdom 2019 Review; https://www.ofgem.gov.uk/system/files/docs/2018/12/essential_guide_to_closure_0.pdf 115 Roberts, J & Gauthier, C. (2019) Energy communities in the draft National Energy and Climate Plans: encouraging but room for improvements 116 https://www.iea.org/policies/7986-climate-agreement 117 Kooij, H-J., Oteman, M., Veenman, S., Sperling, K., Magnusson, D., Palm, J. & Hvelplund, F. (2018). Between grassroots and treetops: Community power and institutional dependence in the renewable energy sector in Denmark, Sweden and the Netherlands, Energy Research & Social Science, 37, 52-64 118 Roberts, J & Gauthier, C. (2019) Energy communities in the draft National Energy and Climate Plans: encouraging but room for improvements

This project has received funding from the European Union’s Horizon 2020
research and innovation programme under grant agreement No 837752.
D1.1: Quality procedures
36
decreased since 2010, but a few programmes such as the research and development programme
‘Prospering from the Energy Revolution’ have some links with ECs.119 These findings of the
countries’ overall few programmes and measures targeting specifically ECs mirror the results of
the REScoop policy report of all EU Member States’ draft NECPs, that found that very few Member
States put forward any objective or target for supporting ECs. The report furthermore underlines
the importance of separating between self-consumption of renewables as an activity and
renewable ECs, which is not just an activity but also a way of organisation.120
3.5 Action arena: Actors In this section, government and other actors engaged with ECs as well as market actors involved
in electricity generation and the retail market are described and compared. An overview of the
countries’ TSOs and DSOs can be found in Table 3.17.
3.5.1 Government, authorities and other actors In D3.1, the countries’ main government actors and institutions responsible for energy policy and
regulation were presented. As these actors were found to be very similar across the countries, this
deliverable will not discuss these actors in closer detail. In all six countries, ministries and
implementing agencies are responsible for formulating and implementing national climate and
energy policy. Regional and local governments or federal states likewise have responsibilities in
for instance policy implementation or other aspects of energy deliverance. Independent
regulatory authorities exist in some countries, overseeing electricity and energy markets.
Competition and market authorities to safeguard competition are also common in the countries.
For a more detailed outlook on public actors, see D3.1, page 87 and onwards.
The existence of intermediaries and umbrella organisations to support ECs can play an important role in creating visibility and put ECs on the political agenda. A number of the countries (UK, NL
and DE) have different forms of umbrella organisations in place. The umbrella organisation
Community Energy England enables non-financial support to new initiatives in England. Wales
and Scotland have similar organisations.121 There are also some local government bodies and
NGOs that develop and support local energy initiatives in the UK. NL has an umbrella organisation
for ECs, Energie Samen, as well as a knowledge platform for local sustainable energy initiatives.122
Furthermore, the bottom-up Participation Coalition (Participatiecoalitie) has offered to support
municipalities and regions with the implementation of the Regional Energy Strategies under the
National Climate Agreement.123 In DE, there is support for ECs from both the German Cooperative
and Raiffesen Confederation (DGRV) and the Citizens Energy Alliance (BBEn).124
The ten NEWCOMERS case study communities examined in D4.2 also displayed that ECs are often
engaged with a range of actors, particularly energy suppliers, technical delivery partners and
installers, software developers and grid operators.
119 https://www.gov.uk/government/news/prospering-from-the-energy-revolution-full-programme-details 120 Roberts, J & Gauthier, C. (2019) Energy communities in the draft National Energy and Climate Plans: encouraging but room for improvements 121 https://communityenergyengland.org/pages/who-we-are 122 https://energiesamen.nu/ 123 https://departicipatiecoalitie.nl/ 124 https://www.unendlich-viel-energie.de/media/file/3591.89_Renews_Spezial_Community_energy_LECo.pdf

This project has received funding from the European Union’s Horizon 2020
research and innovation programme under grant agreement No 837752.
D1.1: Quality procedures
37
3.5.2 Market actors Table 3.20 displays the main market actors in the electricity grid, with focus on the energy
producers and retail suppliers. The countries are listed alphabetically and therefore no colours
are used to highlight the order.
Table 3.20 Actors in electricity market
Country Production Trade Switching rate of households
Germany125 There are several hundred electricity providers. Over 50 % of conventional electricity comes from the four largest utilities (E.ON, RWE, Vattenfall and EnBW), 25% comes from public utilities that operate at the regional or city level. For renewable power, there is a much larger, more eclectic group of producers.
The market share for the four largest companies on the retail level is large, but still less than 40%. End-users had 143 providers in their network to choose from in 2017, and households could choose from 124 providers.
In 2017, the switching rate for households was 7.2%. 41.2% had contracts with the default supplier.
Italy126 In 2013, Enel Servizio Elettrico was the largest power producer (25 % of total generation). Next five largest companies cover 24 % of the market: Eni (8.5%), Edison (6%) and A2A Energia, ERG and Iren Mercato (3.1% each)
Three retail markets: -Enhanced market: In total 236 suppliers, but Enel serve 85 % of customers. Significant share of purchases from the single buyer, AU. Italy is the only country in Europe to retain the single buyer model. -Open market: the largest number of retail providers (336 in 2016). Enel largest provider with 35 %. -Safeguarded: two companies.
Within the three markets, more and more customers are actively moving from the safeguarded or enhanced protection market to the open market. Switching between retail providers is however more problematic, requiring time and resources.
Netherlands127 The main companies in terms of power generating capacity are Essent, Vattenfall, Eneco and Engie.
In 2019, there were 57 active electricity suppliers on the retail market. The three largest energy suppliers – Essent (RWE), Vattenfall (Nuon) and Eneco –accounted for over 70% of retail electricity sales in 2018.
In 2019, 20 % of retail customers switched suppliers, an increase from around 12.6 % in 2012.
125 IEA (2020). Germany 2020 Energy Policy Review 126 IEA (2016). Energy Policies of IEA countries. Italy 2016 review; Stagnaro, C., Amenta, C., Di Croce, G., & Lavecchia, L. (2020). Managing the liberalization of Italy's retail electricity market: A policy proposal, Energy Policy, 137. 127 IEA (2020). Energy Policies of IEA Countries. The Netherlands 2020 Review; Mulder, M., & Willems, B. (2019). The Dutch retail electricity market, Energy Policy, 127, 228-239; https://www.energievergelijk.nl/onderwerpen/welke-energieleveranciers-zijn-er; https://www.energievergelijk.nl/wp-content/uploads/2018/06/Energieleveranciers_April2019.jpg

This project has received funding from the European Union’s Horizon 2020
research and innovation programme under grant agreement No 837752.
D1.1: Quality procedures
38
Slovenia128 In 2019, nine companies were operating large facilities with an installed capacity of over 10 MW. Most of the major actors in electricity production are owned by the two parent companies, HSE and GEN Energija.
In 2019 there were 22 electricity suppliers active in the retail market, of which 16 supplied electricity to household consumers. The market share of the three largest suppliers (GEN-I, ECE and E3) were 56.7 % of household customers.
In 2019, 4.9 % of households switched suppliers. The number of switches has decreased the last three years and was close to 7 % in 2016.
Sweden129 Electricity generation is dominated by a few large generators. The three biggest generators (Vattenfall, Fortum and Uniper) generate 73% of the total electricity, whereof Vattenfall generates 40% of the total.
There are more than 120 suppliers. At the end of 2017, the largest suppliers were Vattenfall (about 18 % of customers), E.ON (12,5 %) and Fortum (11,5 %), in total about 42 % of customers. Some suppliers operate only locally or regionally.
In 2017, 9.5% of the end-users switched supplier.
United Kingdom130
In 2018, there were 170 licensed electricity generators active. Eight generators provide 71% of the volumes in 2017. In particular dominated by six companies who owned approx. 50 % of the total installed capacity in 2017.
Wholesale market has been dominated by six vertically integrated companies active in generation and retail during the last twenty years In 2018 there were 73 suppliers active in Great Britain’s electricity market. There have been many new entrants to the market over the past 10 years. No small player has reached a 5% market share.
In 2018, around 18.4% of consumers switched suppliers. More than 60% have only switched once or never. 54% have been on default tariffs for more than three years.
Table 3.20 reveals that all six countries are dominated by a few main generators, between two to
eight, that provide the largest share of the electricity volume. Several countries however have a
large number of electricity generators in total, which is the case for instance for Germany and the
United Kingdom. The countries’ retail markets are similarly moderately concentrated, as a few
electricity suppliers had large market shares of the customers. The number of active suppliers
ranges from 22 (SI), 57 (NL), 73 (UK), more than 120 (SE), 143 (DE) to 336 (IT). Italy thus has
the highest number of retail providers among the six countries, both in its open market and
enhanced protection market.
These numbers of retail providers must however be contrasted with the column representing the
rate of households switching energy suppliers. A country’s switching rate can reveal the retail
market’s competitiveness, but also the activity and agency of consumers in their energy choices.
Table 3.20 reveals that while there is an increased number of people making active supplier
choices by moving between markets in Italy, it remains time- and work-consuming to change
supplier.131 The Netherlands’ switching rate of 20 percent of total retail customers is among the
128 Agencija za energijo (2019). Report on the Energy Sector in Slovenia 2019; OECD (2019). Fossil Fuel Support Country Note. Slovenia 129 IEA (2019). Energy Policies of IEA Countries. Sweden 2019 review 130 IEA (2019). Energy policies of IEA countries. United Kingdom 2019 Review 131 IEA (2016). Energy Policies of IEA countries. Italy 2016 review

This project has received funding from the European Union’s Horizon 2020
research and innovation programme under grant agreement No 837752.
D1.1: Quality procedures
39
countries with the highest retail switching rates in Europe.132 The United Kingdom’s rate of 18.4
percent closely follows. However, the rest of the countries exhibit a lower switching rate of
between five to ten percent (DE, SI, SE).
132 IEA (2020) Energy Policies of IEA Countries. The Netherlands 2020 review

This project has received funding from the European Union’s Horizon 2020
research and innovation programme under grant agreement No 837752.
D1.1: Quality procedures
40
4 DISCUSSION The following chapter discusses and summarizes the findings of chapter 3, linking the findings to
the analysis of the upcoming D3.3.
4.1 Energy communities The number of ECs differ, where the United Kingdom and Germany have the largest number of
established ECs in absolute terms, followed by the Netherlands and Sweden. Italy and Slovenia
have substantially fewer ECs. The development of ECs is a process that has been going on for many
years (20-60 years) in all partner countries. During these years the countries have most likely
developed local versions of ECs and that is also why it can be difficult to come up with a single
definition for ECs that fits them all. All countries, except the UK, lack a single government-defined
definition of EC, which opens for localized versions to develop within the countries. Several of the
countries (UK, DE, NL, SI) have legal frameworks in place to support one type of ECs, such as ECs
based solely on electricity production from wind in the case of DE, but these legal frameworks do
not necessarily signify that the countries have a single encompassing definition of ECs beyond the
support from the legal framework. None of the countries have yet transposed the EU Directives
defining ECs in the form of CECs and RECs.
The lack of single definitions of ECs in the countries indicates the development of both national
and local versions of what an EC is within the EU, including how an EC should be interpreted and
what to include and exclude. The terminology may also differ between countries, such as defining
projects as ECs or community energy initiatives. While plural definitions can allow local versions
of community energy initiatives that match the local context to arise, it becomes more difficult to
target ECs for support in policies. A national definition can be easier to communicate and be used
to attract new ECs. The countries’ legal definitions of ECs may be aligned following that all Member
States are to transpose the EU Directives. The lack of definition is most likely both a benefit and a
disadvantage for future development of ECs, which is an important aspect that will be further
discussed in D3.3.
At the same time, it seems like the EC developments within the selected countries are quite similar
in that many ECs are cooperatives and have a focus on solar and/or wind power. This will be
further discussed in D3.3 too, also in relation to WP2 and D2.2 on the project’s typology of new
clean energy communities.
4.2 Socio-economic conditions When the GDP per capita was compared, it was found that Italy and Slovenia are placed in the
bottom of the six countries with the lowest GDP per capita (even if all countries are ranked high
in a global perspective). As Italy and Slovenia are the countries with the fewest ECs in our case
study, this result is interesting to discuss in D3.3 in relation to earlier research on whether ECs
are for all citizens or only for the wealthiest. Italy and Slovenia are also the countries with the
smallest urban population. As ECs are often seen as beneficial for rural areas, this result is likewise
of interest to discuss further in D3.3.
When comparing the relative number of ECs in relation to the countries’ populations, there are a
few differences concerning their placement in the three categories of high, medium and low
numbers of ECs. While DE has the second highest number of ECs in total, NL has more ECs per
million inhabitants than DE. Likewise, IT has an even lower relative number of ECs than SI, despite
IT’s longer history of EC development. The different positions of countries in relation to their
number of ECs and their population size are of interest to discuss further in D3.3.
When comparing levels of higher education, many of the countries with high or medium numbers
of ECs (UK, SE, NL) correspondingly had a higher share of their population with a tertiary

This project has received funding from the European Union’s Horizon 2020
research and innovation programme under grant agreement No 837752.
D1.1: Quality procedures
41
education than the EU average. There is nevertheless no clear relation between a country’s
number of ECs and its share of inhabitants with higher education, as both the relative placements
of DE and SI did not follow this trend. DE had a high number of ECs but a lower share of its
population with a higher education than the EU average and SI displayed the opposite values with
a low number of ECs but a higher ranking of higher education than the EU average.
The comparisons of trust in other people and in political and legal systems showed that SE and NL
had the highest relative trust in all three categories, followed by DE and UK, and finally IT and SI.
The countries with high and medium numbers of ECs (SE, NL, DE, UK) had higher trust in both
political and legal systems than the EU average. The countries with low numbers of ECs, IT and SI,
had substantially lower trust in all three categories. As previous literature has suggested that a
culture of trust and other informal institutions are of significance for the development of ECs, the
countries’ levels of trust will be of interest to explore further in D3.3.
4.3 Technical systems When it comes to the countries’ profiles of TPES, no clear trend could be seen concerning the countries’ share of energy sources and their number of ECs. There remains a strong dependence
on fossil fuels, where the Netherlands, Germany, Italy and the United Kingdom all have around 80
percent of fossil fuels out of their TPES. Following this result, the countries had very low shares
of renewable energy sources in their TPES. Sweden has by far the lowest share of fossil fuels
among the studied countries as well as among IEA countries. Instead, Sweden has a high share of
nuclear power compared to the other partner countries. Slovenia shared a relatively high share of
nuclear power compared to the other case countries. A high share of nuclear power can be a
barrier for the development of new ECs and a high share of renewables can be an enabler. This is
an issue that will be further elaborated upon in D3.3.
The most interesting results concerning the countries' final energy consumption was that the
largest consumption by the Netherlands (4.2 toe per capita) is more than double of that of Italy
and the United Kingdom with 1.9 toe per capita. A related interesting result is that the
Netherlands, Italy and the United Kingdom differ noticeably from the IEA average of 2.9 toe per
capita, where the Netherlands was above average and the other two under. The other countries
(DE, SI, SE) display values that correspond more closely to the IEA average. Based on these results,
the energy consumption figures do not seem to have any influence on the number of ECs, as for
instance Italy and the United Kingdom have the same low TFC per capita but differ greatly in their
number of ECs, from Italy’s 34 and the United Kingdom’s over 5000s ECs respectively.
The countries’ size of electricity production correlates quite well with the countries’ number of
inhabitants. The only exception is that Sweden and the Netherlands have changed places as
Sweden has a larger generation. The countries share the same relative rankings in fossil fuel
shares in their electricity generation as their fossil fuel shares in their TPES. The fossil fuel
dependency in the countries’ electricity generation mix differs most from the IEA average for the
Netherlands and Sweden, where the Netherlands has one of the most carbon-intensive electricity
generations in Europe and Sweden has one of the lowest. This is reflected also in the figures for
renewable energy, where Sweden has a high share of renewables and the Netherlands a low share.
Germany and the United Kingdom have the largest shares in wind power among the studied
countries whilst Italy has the largest share of solar power among the IEA countries. Sweden and
Slovenia have high shares of nuclear power. High fossil fuel dependency could be an enabler for
new ECs to emerge, which will be explored further in D3.3.
The shares of fossil fuel, renewables and nuclear power of the Netherlands and Sweden are also
mirrored in their CO2 emissions per capita, where NL has the highest and SE the lowest. Three
countries have higher carbon-dioxide emissions per capita than the EU average, namely the

This project has received funding from the European Union’s Horizon 2020
research and innovation programme under grant agreement No 837752.
D1.1: Quality procedures
42
Netherlands, Germany and Slovenia, and the other three countries, the United Kingdom, Italy and
Sweden, have lower. Following this ranking of countries, there is no clear trend between the
countries’ energy-related emissions and their number of ECs.
The majority of the countries (SE, SI, DE, NL) have a higher electricity consumption per capita
than the EU average. SE's electricity use per capita stands out as it is close to double of SI with the
second highest consumption. The industrial, commercial, and residential sectors account for the
largest shares of the final consumption for all countries. Industry has the largest share for all
countries but the Netherlands. The electricity consumption in transportation is still low for all
countries.
Germany stands out as the country with the highest electricity price, as it has the third highest
electricity price among all IEA countries. Nevertheless, the share of electricity costs of German households’ incomes is the same as the EU average. All countries but Germany and Italy have
lower electricity prices than the EU average. All countries have larger shares of taxes and levies
than the median tax rate of IEA member countries. Germany has the highest share of taxes and
levies of all six countries. For all countries but the UK, their share of taxes and levies mirror their
ranking of electricity price. Despite having the lowest share of taxes and levies, the United
Kingdom has higher electricity prices than both Slovenia and the Netherlands.
In relation to average incomes, the electricity costs in Sweden and Slovenia reflect substantially
larger shares of the average household income than in the rest of the countries. Sweden has the
largest average electricity usage among the countries as well, which is more than double the size
of Slovenia’s second largest household electricity consumption. Despite having one of the lowest
electricity costs, Slovenian households pay the second highest relative share of electricity costs as
they have the lowest average yearly income among the countries. No clear relation was identified
between the countries’ numbers of ECs and their relative share of electricity costs in household
expenses. All three categories of high, medium, and low number of ECs were represented both
above and below the EU average of 3.9 percent. The impact of high electricity prices as a potential
enabler of new ECs to develop will be further examined in D3.3.
4.4 Institutional settings The countries had a range of renewable subsidies, such as tax incentives on biofuels and other
renewable energy sources, renewable obligations and net metering schemes. DE, NL and SI have
FiT-schemes in place, while Italy and the United Kingdom have ended theirs. Sweden is the only
country that does not currently have or has previously had a FiT scheme. The countries have few
programmes or subsidies in place that target energy communities specifically. Examples of
quantitative targets to advance ECs and other support programmes could be found in NL, Scotland
and Wales. D3.3 will further investigate and discuss the potential effect of generous subsidies for
renewables and ECs on the development of new ECs. All six countries are also currently rolling
out smart meters, with some countries (SI, NL) particularly advancing quickly.
4.5 Actors The countries were found to have similar main government actors and institutions responsible
for energy policy and regulation. The case studies of D4.2 exhibited that ECs are often engaged
with a range of actors, particularly energy suppliers, technical delivery partners and installers
alongside other actors such as software developers and grid operators. A few countries have one
or several umbrella organisations in place that support ECs (UK, NL and DE). Support in the form
of umbrella organisations or intermediaries can be an important factor in order to create
supportive national environments for ECs to develop in. The linkages between these types of
supportive functions and the development of ECs are further discussed in D3.3. The number of
TSOs and DSOs differ between the countries. The majority of countries have a single TSO, apart

This project has received funding from the European Union’s Horizon 2020
research and innovation programme under grant agreement No 837752.
D1.1: Quality procedures
43
from Germany that instead has four and the United Kingdom that has an ESO for Great Britain and
a TSO for Northern Ireland. Slovenia and the Netherlands have up to ten DSOs, Italy and Sweden
have over a hundred and Germany has closer to a thousand. The United Kingdom has instead 15
DNOs that are underway to develop into DSOs. In the electricity market all countries are
dominated by a few main generators, between two and eight. The countries’ retail markets are
similarly moderately concentrated. The number of active retailers ranges from 22 (SI) to 336 (IT).
The rate of households switching energy suppliers differ where the Netherland’s switching rate
of 20% is among the highest in Europe, but also the United Kingdom has a high switching rate.
Germany, Sweden and Slovenia have a lower switching rate. A diversity of actors on the market
together with active customers can both be assumed to enable new ECs to emerge, which is
something that will be further elaborated in D3.3.

This project has received funding from the European Union’s Horizon 2020
research and innovation programme under grant agreement No 837752.
D1.1: Quality procedures
44
5 CONCLUSION The aim of this deliverable was to compare national characteristics in the six studied countries,
Germany, Italy, the Netherlands, Slovenia, Sweden and the United Kingdom in order to explore the
settings in which polycentric governance structures and ECs can evolve. The deliverable is based
on D3.1 where the national contexts for each country were presented in more detail. In this report,
the countries’ current developments of ECs were contrasted and the countries were divided into
three categories according to their current number of ECs: high (UK, DE); medium (NL, SE); low
(IT, SI). These categories served as a basis to analyse the countries’ polycentric settings in relation
to their development of ECs. Each country’s socio-economic conditions, technical system (energy
and electricity), institutional arrangements and relevant actors were compared, when suitable
with IEA or EU averages.
This deliverable is a first step to analyse how different national contexts linking to polycentric
governance forms influence the emergence of new forms of ECs. It also serves as a basis for
delivery D3.3 which aims to evaluate what forms of ECs work best in different polycentric settings
and what potential there is for learning between different polycentric settings. The findings
summarized in the discussion in chapter 4 will be discussed more extensively in relation to earlier
research in D3.3.
This project has received funding from the European Union’s Horizon 2020
research and innovation programme under grant agreement No 837752.
D1.1: Quality procedures
45
6 REFERENCES Agencija za energijo (2017), “Report on the energy sector in Slovenia 2017”, Maribor: Agencija za
energijo.
Agencija za energijo (2019), “Report on the Energy Sector in Slovenia 2019”, Maribor: Agencija za
energijo
Bridge Horizon 2020 (2019) Energy Communities in the EU. Task force Energy Communities.
Available at: https://www.h2020-bridge.eu/wp-
content/uploads/2020/01/D3.12.d_BRIDGE_Energy-Communities-in-the-EU-2.pdf
Candelise, C. & Ruggieri, G. (2017), Community energy in Italy: Heterogenous institutional characteristics and citizens engagement, Working paper n. 93, Milano: IEFE, Center for
Research on Energy and Environmental Economics and Policy, Università Bocconi.
Candelise, C. & Ruggieri, G. (2020), “Status and evolution of the community energy sector in Italy”,
Energies, 13, 1888. doi: 10.3390/en13081888
Caramizaru, E. & Uihlein, A. (2020) “Energy communities: an overview of energy and social
innovation”, Luxembourg, Publications Office of the European Union. doi: 10.2760/180576
Darby, S.J. & Liddell, C. (2016) “Communicating ‘smartness’: smart meter installers in UK homes.
Conference paper”, European Council for an Energy-Efficient Economy (eceee). ISBN:
978-91-980482-6-1
Di Dio, V., Favuzza, S., La Cascia, D. , Massaro, F. & Zizzo, G. (2015) “Critical assessment of support
for the evolution of photovoltaics and feed-in tariff(s) in Italy”, Sustainable Energy Technologies and Assessments, 9, 95-104. doi: 10.1016/j.seta.2014.12.004
Government of the Netherlands (2016) “Energy report. Transition to sustainable society”, The
Hague: Ministry of Economic Affairs of the Netherlands
Government of the United Kingdom (2014) “Community Energy Strategy: Full Report”, London:
Department of Energy and Climate Change. Available at:
https://www.gov.uk/government/publications/community-energy-strategy.
Herbart Smith Freehills (2019) “European Energy Handbook 2019-2020. A survey of the legal
framework and current issues in the European Energy sector”, Herbert Smith Freehills LLP.
11th edition. ISBN: 978-0955503795.
Hewitt, R J, Bradley, N, Baggio Compagnucci, A, Barlagne, C, Ceglarz, A, Cremades, R, McKeen, M,
Otto, M O & Slee, B (2019), “Social innovation in community energy in Europe; a review of
the evidence”, Frontiers in Energy Research, 7(31). doi: 10.3389/fenrg.2019.00031
IEA (2016), “Energy Policies of IEA countries. Italy Review”, Paris: International Energy Agency,
IEA
IEA (2018), “Global Energy & CO2 Status Report”, Paris: International Energy Agency, IEA
IEA (2019), “Energy Policies of IEA Countries. Sweden 2019 Review”, Paris: International Energy
Agency, IEA
IEA (2019), “Energy policies of IEA countries. United Kingdom 2019 Review”, Paris: International
Energy Agency, IEA
IEA (2019), “Key World Energy Statistics”, Paris: International Energy Agency, IEA

This project has received funding from the European Union’s Horizon 2020
research and innovation programme under grant agreement No 837752.
D1.1: Quality procedures
46
IEA (2020), “European Union 2020 Energy Policy Review”, Paris: International Energy Agency,
IEA
IEA (2020), “Germany 2020 Energy Policy Review”, Paris: International Energy Agency, IEA
IEA (2020), “The Netherlands 2020 Energy Policy Review”, Paris: International Energy Agency,
IEA
Jordan, A., Huitema, D., Schoenefeld, J., van Asselt, H., & Forster, J. (2018). Governing Climate
Change Polycentrically. In: A. Jordan, D. Huitema, H. van Asselt, & J. Forster (Eds.), Governing Climate Change: Polycentricity in Action? (pp. 3-26). Cambridge: Cambridge University
Press. Doi:10.1017/9781108284646.002
Kooij, H-J, Oteman, M, Veenman, S, Sperling, K, Magnusson, D, Palm, J & Hvelplund, F (2018),
“Between grassroots and treetops: Community power and institutional dependence in the
renewable energy sector in Denmark, Sweden and the Netherlands”, Energy Research & Social Science, 37, 52-64. doi: 10.1016/j.erss.2017.09.019
Magnani, N & Osti, G (2016), ”Does civil society matter? Challenges and strategies of grassroots
initiatives in Italy’s energy transition”, Energy Research and Social Science, 13, 148-157. doi:
10.1016/j.erss.2015.12.012
Magnusson, D & Palm, J (2019), “Come together-the development of Swedish energy
communities”, Sustainability, 11(4), 1056. doi: 10.3390/su11041056
Mulder, M & Willems, B (2019), “The Dutch retail electricity market”, Energy Policy, 127, 228-239.
doi: 10.1016/j.enpol.2018.12.010
OECD (2019), “Fossil Fuel Support Country Note. Slovenia”, Paris: The Organisation for Economic
Co-operation and Development, OECD.
Ostrom, E. (2010). Polycentric systems for coping with collective action and global environmental
change. Global Environmental Change, 20, 550-557.
Palm, J (2018), “Household installation of solar panels - motives and barriers in a 10-year
perspective”, Energy Policy, 113, 1-8. http://dx.doi.org/10.1016/j.enpol.2017.10.047
Roberts, J & Gauthier, C. (2019) “Energy communities in the draft National Energy and Climate
Plans: encouraging but room for improvements”, REScoop.eu, European University
Viadrina, Friends of the Earth Europe.
Stagnaro, C., Amenta, C., Di Croce, G., Lavecchia, L. (2020) “Managing the liberalization of Italy's
retail electricity market: A policy proposal”, Energy Policy, 137, doi:
10.1016/j.enpol.2019.111150
Swedish Energy Agency (2019). “Energy in Sweden. Facts and Figures 2019”, Eskilstuna: Swedish
Energy Agency.
van der Grijp, N M, Petrovics, D, Roscoe, J, Barnes, J, Blasch, J, Darby, S, Ursa, G & Palm, J (2019),
Theoretical framework focusing on learning in polycentric settings, Deliverable D2, New
Clean Energy Communities in a Changing European Energy System (NEWCOMERS) project,
EU H2020 grant agreement 837752.
6.1 Web pages and URL https://assets.publishing.service.gov.uk/government/uploads/system/uploads/attachment_dat
a/file/820708/Chapter_5.pdf accessed 15 October 2020

This project has received funding from the European Union’s Horizon 2020
research and innovation programme under grant agreement No 837752.
D1.1: Quality procedures
47
https://communityenergyengland.org/pages/who-we-are accessed 9 November 2020
https://data.worldbank.org/indicator/SP.URB.TOTL.IN.ZS?locations=EU accessed 22 October
2020
https://departicipatiecoalitie.nl/ accessed 11 November 2020
https://ec.europa.eu/eurostat/databrowser/view/ilc_di04/default/table?lang=en accessed 20
November 2020
https://ec.europa.eu/eurostat/documents/2995521/8489679/8-29112017-AP-
EN.pdf/600c794f-c0d8-4b33-b6d9-69e0489409b7 accessed 21 October 2020
https://ec.europa.eu/eurostat/documents/2995521/9549144/8-07022019-AP-
EN.pdf/4a5fe0b1-c20f-46f0-8184-e82b694ad492 accessed 22 October2020
https://ec.europa.eu/eurostat/statistics-
explained/index.php?title=Electricity_production_and_supply_statistics&oldid=59327#Pr
oduction_of_electricity accessed 12 October 2020
https://ec.europa.eu/eurostat/web/products-datasets/-/edat_lfs_9903 18 november 2020
https://ec.europa.eu/eurostat/web/products-datasets/-/ilc_pw03 accessed 18 November 2020
https://energiecijfers.info/hoofdstuk-1/ accessed 23 oktober 2020
https://energiesamen.nu/ accessed 9 november 2020
https://estore.enerdata.net/netherlands-energy.html accessed 16 October 2020
https://eu-sysflex.com/partners/eirgrid-eirgrid-plc/ accessed 26 October 2020
https://oe.finance.si/8856504/Mala-hidroelektrarna-Krajcarca-primer-kaj-zmore-zadruga
accessed 17 November 2020
https://publications.jrc.ec.europa.eu/repository/bitstream/JRC113926/jrc113926_kjna29615e
nn_newer.pdf accessed 14 October 2020
https://pxweb.stat.si/SiStatDb/pxweb/en/30_Okolje/30_Okolje__18_energetika__01_18179_bila
nca_kazalniki/1817902S.px/ accessed 14 October 2020
http://statisticstimes.com/economy/european-countries-by-gdp-per-capita.php accessed 16
October 2020
http://stats.oecd.org/wbos/fileview2.aspx?IDFile=bd2dc92f-1480-46d3-bd55-850d267aeb8d
accessed 16 October 2020
https://tradingeconomics.com/netherlands/total-final-energy-consumption-tfec-wb-data.html
accessed 21 October 2020
https://www.agen-rs.si/izvajalci/elektrika/distribucijsko-omre accessed 15 November 2020
https://www.buendnis-buergerenergie.de/fileadmin/user_upload/wpbl27_BEG-
Stand_Entwicklungen.pdf accessed 21 October 2020
https://www.cbs.nl/en-gb/figures/detail/80030eng accessed 21 October 2020
https://www.cbs.nl/en-gb/figures/detail/82610ENG accessed 21 October2020
This project has received funding from the European Union’s Horizon 2020
research and innovation programme under grant agreement No 837752.
D1.1: Quality procedures
48
https://www.energievergelijk.nl/onderwerpen/welke-energieleveranciers-zijn-er accessed 22
October 2020
https://www.energievergelijk.nl/wp-
content/uploads/2018/06/Energieleveranciers_April2019.jpg accessed 22 October 2020
https://www.energetika-
portal.si/fileadmin/dokumenti/publikacije/energetska_bilanca/ebrs_2019.pdf accessed 9
October 2020
https://www.energetika-portal.si/nc/novica/n/prenovljene-spodbude-eko-sklada-za-naprave-
za-samooskrbo-z-elektricno-energijo-za-izvedbo-4224/ accessed 16 November 2020
https://www.entsoe.eu/about/inside-entsoe/members/ accessed 22 October 2020
https://www.gov.uk/government/news/prospering-from-the-energy-revolution-full-
programme-details accessed 11 November 2020
https://www.gov.uk/guidance/community-energy accessed 8 October 2020
https://www.hieropgewekt.nl/local-energy-monitor accessed 13 October 2020
https://www.hieropgewekt.nl/uploads/inline/Lokale%20Energiemonitor%202019_DEF_feb20
20_2.pdf accessed 13 October 2020
https://www.ieabioenergy.com/wp-
content/uploads/2018/10/CountryReport2018_Italy_final.pdf accessed 26 October 2020
https://www.ieabioenergy.com/wp-
content/uploads/2018/10/CountryReport2018_Netherlands_final.pdf accessed 26
October 2020
https://www.iea.org/countries/germany accessed 22 October 2020
https://www.iea.org/countries/italy accessed 27 October 2020
https://www.iea.org/countries/the-netherlands accessed 27 October 2020
https://www.iea.org/countries/Slovenia accessed 22 October 2020
https://www.iea.org/countries/sweden accessed 27 October 2020
https://www.iea.org/data-and-
statistics?country=EU28&fuel=Electricity%20and%20heat&indicator=ElecConsPerCapit
a accessed 19 October 2020
https://www.iea.org/data-and-
statistics?country=GERMANY&fuel=Electricity%20and%20heat&indicator=ElecConsPer
Capita accessed 19 October 2020
https://www.iea.org/data-and-
statistics?country=ITALY&fuel=Electricity%20and%20heat&indicator=ElecConsPerCapi
ta accessed 19 October 2020
https://www.iea.org/data-and-
statistics?country=NETHLAND&fuel=Electricity%20and%20heat&indicator=ElecConsPe
rCapita accessed 19 October 202
This project has received funding from the European Union’s Horizon 2020
research and innovation programme under grant agreement No 837752.
D1.1: Quality procedures
49
https://www.iea.org/data-and-
statistics?country=SLOVENIA&fuel=Electricity%20and%20heat&indicator=ElecConsPer
Capita accessed 19 October 2020
https://www.iea.org/data-and-
statistics?country=SWEDEN&fuel=Electricity%20and%20heat&indicator=ElecConsPerC
apita accessed 19 October 2020
https://www.iea.org/data-and-
statistics?country=UK&fuel=Electricity%20and%20heat&indicator=ElecConsPerCapita
accessed 19 October 2020
https://www.iea.org/data-and-
statistics?country=EU28&fuel=Energy%20supply&indicator=TPESbySource accessed 19
October 2020
https://www.iea.org/data-and-
statistics?country=ITALY&fuel=Electricity%20and%20heat&indicator=ElecConsBySecto
r accessed 25 October 2020
https://www.iea.org/data-and-
statistics?country=SLOVENIA&fuel=Electricity%20and%20heat&indicator=ElecConsByS
ector accessed 19 October 2020
https://www.iea.org/data-and-
statistics?country=SLOVENIA&fuel=Energy%20supply&indicator=Electricity%20genera
tion%20by%20source accessed 19 October 2020
https://www.iea.org/data-and-
statistics?country=WEOEUR&fuel=Key%20indicators&indicator=TPESbyPop accessed
12 October 2020
https://www.iea.org/data-and-statistics/data-
tables?country=ITALY&energy=Balances&year=2016 accessed 19 October 2020
https://www.iea.org/data-and-statistics/data-
tables?country=ITALY&energy=Electricity&year=2018 accessed 27 October 2020
https://www.iea.org/data-and-statistics/data-
tables?country=NETHLAND&energy=Balances&year=2018 accessed 19 October 2020
https://www.iea.org/data-and-statistics/data-
tables?country=SWEDEN&energy=Balances&year=2018 accessed 19 October 2020
https://www.iea.org/data-and-statistics/data-
tables?country=SWEDEN&energy=Electricity&year=2018 accessed 19 October 2020
https://www.iea.org/data-and-statistics/data-
tables?country=UK&energy=Balances&year=2018 accessed 16 October 2020
https://www.iea.org/data-and-statistics/data-
tables?country=UK&energy=Electricity&year=2018 accessed 16 October 2020
https://www.iea.org/data-and-
statistics?country=EU28&fuel=CO2%20emissions&indicator=CO2PerCap accessed 19
October 2020

This project has received funding from the European Union’s Horizon 2020
research and innovation programme under grant agreement No 837752.
D1.1: Quality procedures
50
https://www.iea.org/policies/7986-climate-agreement accessed 12 November 2020
https://www.odyssee-mure.eu/publications/efficiency-by-sector/households/electricity-
consumption-dwelling.html accessed 20 November 2020
https://www.ofgem.gov.uk/electricity/transmission-networks/gb-electricity-transmission-
network accessed 23 October 2020
https://www.ofgem.gov.uk/system/files/docs/2019/06/dso_-
_ofgem_regulatory_principles_and_priorities_workshop_notes.pdf accessed 27 October
2020
http://www.pisrs.si/Pis.web/pregledPredpisa?id=URED7867 accessed 16 November 2020
https://www.statista.com/statistics/426988/united-kingdom-uk-heating-methods/ accessed
23 November 2020
https://www.unendlich-viel-
energie.de/media/file/3591.89_Renews_Spezial_Community_energy_LECo.pdf accessed 21
October 2020
https://www.worldometers.info/population/countries-in-europe-by-population/ accessed 6
October 2020
http://www.worldvaluessurvey.org/WVSOnline.jsp accessed 18 November 2020