Embed Size (px)
Citation preview

Working Paper no.: 2014/3
New classification of urban and rural NUTS 2 regions in Europe
Joop de Beer, Nicole van der Gaag and Rob van der Erf

New classification of urban and rural NUTS 2 regions in Europe
Joop de Beer, Nicole van der Gaag and Rob van der Erf Working Paper no.: 2014/3
Netherlands Interdisciplinary Demographic Institute (NIDI) P.O. Box 11650 2502 AR The Hague Phone: 070 - 3565234 E-mail: [email protected] This paper has been funded by the European Commission in the context of the 7th Framework Programme project NEUJOBS: creating and adapting jobs in Europe in the context of a socio-ecological transition. The authors are solely responsible for the content of the Working Paper. April 2014

1
ABSTRACT
In 2010 Eurostat developed an urban-rural typology for NUTS 3 regions. However, EU
regional policies are often founded on statistics and population projections at NUTS 2 level.
Based on the Eurostat typology this paper develops an urban-rural classification of NUTS 2
regions. We use the new classification to examine differences in population change between
urban and rural regions in all EU countries during the last twenty years and in the next twenty
years. Half of the EU population is living in urban NUTS 2 regions. In the next two decades
population ageing will lead to a slowing down in population growth in European countries,
but urban regions will maintain a considerable growth rate.
Keywords: urban; rural; classification; NUTS 2 regions; Europe
INTRODUCTION
Though the strongest urbanisation in Europe took place in the 1950s and 1960s, the
proportion of the population living in urban areas has continued to grow. According to the
United Nations (2012) the percentage increased from 51 to 63 between 1950 and 1970. The
proportion has increased further to 73 per cent in 2011. The rate of urbanisation has decreased
from 1.0 between 1950 and 1970 to 0.4 between 1970 and 2011 (United Nations 2012). The
UN estimates of the urban population are based on national classifications. Various European
countries have different ways of classifying urban and rural areas. As a consequence these
classifications are specific to the countries concerned and therefore not strictly comparable
across countries. In the 1990s the OECD developed a classification based on the same
criterion for all OECD countries. In addition to urban and rural regions, the OECD
distinguished intermediate regions. The OECD typology is based on population density and
size of urban centres within regions. To cover all countries of the European Union, Eurostat
developed a rural-urban typology for NUTS 3 regions based on the OECD regional typology
(Eurostat, 2010). According to the Eurostat classification 41 per cent of the EU population
lives in urban regions and 24 per cent in rural regions. Thus there is a considerable
discrepancy between the Eurostat and the UN estimates of the size of urban populations in
Europe. One main cause of the difference is that the UN uses an urban-rural dichotomy,
whereas OECD and Eurostat distinguish an intermediate category as well.
2
Eurostat does not publish an urban-rural typology at NUTS 2 level. However, there is
need of data at NUTS 2 level. Regional policy instruments such as the Structural Funds and
the Cohesion Funds aim to reduce regional disparities in terms of income, wealth and
opportunities at NUTS 2 rather than NUTS 3 level. Moreover, it is difficult to assess future
changes in the size and distribution of the population living in urban and rural regions, since
internationally consistent population projections are available at the NUTS 2 level only. In
order to make it possible to provide this kind of information, this paper develops an urban-
rural typology for NUTS 2 regions. The distribution of the population over different types of
NUTS 3 regions is used as criterion for classifying NUTS 2 regions. We use the typology to
analyse NUTS 2 settlement patterns in the member states of the European Union during the
last two decades and to assess future changes in the population of urban and rural regions in
the next two decades.
URBAN-RURAL CLASSIFICATIONS
Cities are focal points of economic growth, innovation and paid employment (Bettencourt et
al., 2007; Brezzi et al., 2011). On average, urban residents have better access to education,
health care and transportation than rural populations. The concentration of population in a
region and economies of scale contribute to higher GDP per capita. However, cross-country
comparisons of urban and rural regions are hampered by the use of different criteria for urban-
rural classifications (Hugo et al., 2003). Some countries use administrative units and other
built-up areas; some countries focus on population size or density, others on land use.
Due to suburbanisation and urban sprawl and due to transport and information
technology the distinction between urban and rural areas has become less clear-cut. Bengs and
Schmidt-Thomé (2006) note that the “clear-cut visual divide is simply gone”. More people
divide lives between urban and rural areas, as commuting has increased greatly (Hugo et al.,
2003). As a consequence, urban-rural differences have tended to narrow. However, there are
still big differences, e.g. in GDP per capita and ethnicity. Thus urban-rural differences are still
relevant. Hugo et al.(2003) state that an urban-rural dichotomy is overly simplistic. Urban and
rural can be considered as two opposite ends of an urban-rural continuum. As a reaction to the
blurring of the difference between urban and rural areas, more detailed classifications were
proposed. Butler and Beale (1994) classified US regions into ten categories on the basis of
population size and proximity to metropolitan areas. Cromantle and Swanson (1996)
3
classified regions into five categories based on population size, population density,
commuting patterns and adjacency. Coombes and Raybould (2001) and Coombes (2004)
suggest that three dimensions of human settlement should be taken into account: settlement
size, concentration and accessibility (e.g. access to goods and services). Hugo et al. (2003)
also emphasize that the urban-rural difference is multidimensional. In addition to
demographic differences, they mention differences in the economic structure (agriculture vs.
industry and services), educational opportunities, access to services, and ethnicity. Bengs and
Schmidt-Thomé (2006) distinguish six types of regions based on two dimensions. The first
dimension is urban influence, measured by population density and status of the leading urban
centre. The second dimension is human intervention and is measured by type of land cover.
Two classes of the first dimension (high and low) and three classes of the second dimension
(high, medium, and low) lead to six types of regions. A region is considered to have high
urban influence if the population density exceeds the European average and the leading urban
centre of the NUTS 3 area has been labelled Metropolitan European growth Area (MEGA).
This is based on a typology of functional urban areas developed for ESPON. A region has
high human intervention if the share of artificial surface is above the European average. Such
detailed classifications take into account that other aspects than population density and
population size are relevant as well. However, such detailed classifications make it more
difficult to obtain internationally consistent classifications than distinguishing two or three
categories based on simple criteria.
In the 1990s the OECD developed a classification using the same criteria for all
OECD countries based on population density and the size of the urban centres located within
a region (OECD, 2010). The OECD distinguishes three types of regions: “Predominantly
Urban”, “Intermediate” and “Predominantly Rural” areas. Brezzi et al. (2011) extend the
OECD definition by distinguishing two types of rural areas, viz. remote rural areas and rural
areas that are close to a city. They find that remote rural areas have a stronger decline in
population and faster ageing than rural areas close to a city. The remoteness is a significant
factor explaining outflow of working age population. Rural areas that are close to large urban
centres can benefit from access to services, educational opportunities and logistics for firms
(Dijkstra and Poelman, 2008). The OECD uses low level administrative units for the
classification of rural areas (OECD, 2010). The effect of suburbanisation and the enlargement
of the size of local units by merging municipalities has made the division in town and country
in many regions blurred (Champion, 2007). For that reason Bengs and Schmidt-Thomé (2006)
argue that urban-rural differences should not be examined in terms of very small regional
4
zones. The population of small rural areas close to cities should be considered as urban
population, while people living in scattered, small towns in a rural region should be regarded
as rural population. Bengs and Schmidt-Thomé propose to classify NUTS 3 regions. Another
reason for classifying NUTS 3 regions rather than regions at the so-called Territorial 3 level
distinguished by the OECD is that the surface of the latter regions tends to vary strongly.
In 2010 Eurostat published an urban-rural typology for NUTS 3 regions (Eurostat,
2010), following a similar approach as OECD (2010). Thus regions are classified by the share
of the population living in urban and rural areas rather than on the basis of territorial
characteristics, such as land use. The Eurostat classification is made in three steps (Dijkstra
and Poelman, 2011). First, the rural area population is identified on the basis of population
density in grid cells of 1 km2 and population size of adjacent areas. Secondly, NUTS 3
regions are classified based on the percentage of the population living in rural areas. Thirdly,
the classification is adjusted based on the presence of cities. A NUTS 3 region is classified as
predominantly urban if the share of the population living in rural areas is below 20. A region
is classified as intermediate if the share of population living in rural areas is between 20% and
50% and as predominantly rural if the share of population living in rural areas is higher than
50%. One additional criterion is the size of urban centres. A region classified as
predominantly rural becomes intermediate if it contains an urban centre of more than 200,000
inhabitants representing at least 25% of the population of the region and a region classified as
intermediate becomes predominantly urban if it contains an urban centre of more than
500,000 inhabitants representing at least 25% of the population of the region.
According to the Eurostat classification 41 per cent of the EU population lives in
urban regions. This is considerably lower than the 74 per cent estimated by the UN. One
cause of the difference is that the UN uses an urban-rural dichotomy. In the national
definitions of many European countries used by the UN people living in a town with 2,000
inhabitants or more are classified as urban. This implies that many small areas are classified
as urban, and this leads to a high estimate of the total size of the urban population.
A NEW URBAN-RURAL TYPOLOGY OF NUTS 2 REGIONS
Eurostat does not publish an urban-rural typology at the NUTS 2 level. Eurostat (2010) argues
that this would hide significant differences at a low regional level. Application of the Eurostat
method at NUTS 2 level would lead to a considerably lower share of the population living in
rural regions, since there are relatively few NUTS 2 regions where more than half of the
5
population lives in a rural area. Nevertheless an urban-rural typology of NUTS 2 regions
would be useful since for many EU countries considerably less data on demographic flows are
available at the NUTS 3 than at the NUTS 2 level. Eurostat (2010) acknowledges that “some”
indicators are only available at aggregated geographical level and suggests that small area
estimation techniques can be used to estimate NUTS 3 values based on NUTS 2 data.
However, for certain indicators these estimation techniques are not immediately available
(Eurostat, 2010). For that reason we follow an alternative approach. By developing an urban-
rural typology for NUTS 2 regions we make it possible to use all data that are available at
NUTS 2 level for analysing urban-rural differences.
Our method is based on the Eurostat typology for NUTS 3 regions and comes down to
labelling a NUTS 2 region as predominantly urban if that region includes considerably more
people living in urban NUTS 3 regions than in rural NUTS 3 regions, and we define rural
NUTS 2 regions in a similar way. Similarly to the Eurostat classification the focus of our
typology is on population size, i.e. we make a classification of the population in different
types of regions rather than classifying the regions on the basis of territorial characteristics. If
a region includes a big city where most inhabitants of the region live surrounded by a large
rural area where only few people live, a large share of the surface of the region may include
agriculture land or natural landscapes, while most residents live in an urban environment. We
classify such a region as urban. For example, more than 70 per cent of the population of the
NUTS 2 region Catalonia lives in the NUTS 3 region Barcelona, whereas the latter region
occupies less than 25 per cent of the surface of Catalonia. We classify Catalonia as a
predominantly urban region since the majority of the population lives in an urban
environment. For analyses of the size and growth rate of the population, numbers of people
living in urban and rural areas are relevant rather than the surface of urban and rural areas.
Note that the difference between the share of the population living in rural areas and the share
of the surface which is rural applies to the NUTS 3 classification as well. Whereas according
to the Eurostat classification a quarter of the population lives in a rural region, more than half
of the area of the EU is rural (Eurostat, 2010).
We classify a NUTS 2 region as predominantly urban if the difference between the
percentages of the population living in urban and rural NUTS 3 regions that are part of that
NUTS 2 region exceeds a certain threshold value. Similarly a NUTS 2 region is classified as
predominantly rural if the differences between the percentages of the population living in
rural and urban NUTS 3 regions exceeds another threshold value. We determine both
threshold values in such a way that in each country the percentages of the population living in
6
urban and rural regions at NUTS 2 level are as close as possible to those at the NUTS 3 level.
The threshold value for predominantly urban regions turns out to equal 40 percentage points.
Thus if in a given NUTS 2 region 60 per cent of the population is living in urban NUTS 3
regions, whereas 10 per cent is living in rural NUTS 3 regions, the NUTS 2 region is
considered as predominantly urban. In contrast, if 30 per cent is living in rural NUTS 3
regions, the NUTS 2 region is considered as intermediate. The threshold value for rural
regions equals 33 percentage points. Thus if in a NUTS 2 region, 50 per cent of the
population is living in rural NUTS 3 regions and 10 per cent in urban regions, the region is
considered as predominantly rural, whereas if 20 percent is living in urban regions, the region
is considered as intermediate.
Based on this classification 42 per cent of the population of EU countries on 1
January 2010 lives in a predominantly urban region compared with 41 per cent according to
the NUTS 3 typology. For rural regions the percentages based on both classifications are the
same: 24 per cent of the population lives in predominantly rural regions. For the large
countries the distributions of the population based on the classification at NUTS 3 and NUTS
2 levels are close. For example, for Germany 43 per cent of the population is living in a
predominantly urban region according to the NUTS 3 classification and 41 per cent according
to the NUTS 2 classification. For France the percentages are 35 and 33 respectively. For some
smaller countries there are big differences. This has to do with the small number of NUTS 2
regions in those countries. For Ireland one may question whether the absence of an urban
NUTS 2 region is satisfactory. The reason is that Ireland has only two NUTS 2 regions which
are relatively large. Thus for analysing regional differences in Ireland, the NUTS 2
classification has severe limitations.
Correspondence of the percentages of people living in urban and rural regions at the
NUTS 2 and NUTS 3 levels is not sufficient to decide whether our NUTS 2 classification is
reasonable compared with the Eurostat classification. If the NUTS 2 classification would
imply that a large proportion of the population living in predominantly rural NUTS 3 regions
would be classified as living in predominantly urban NUTS 2 regions or vice versa, the NUTS
2 classification would not be satisfactory. Even though it is inevitable that a part of the
population will be classified in another category at the NUTS 3 level than at the NUTS 2
level, this part should not be too large. It turns out that two thirds of the population living in a
rural NUTS 3 region lives in a rural NUTS 2 region, whereas 30 per cent lives in an
intermediate NUTS 2 region. Less than 5 per cent lives in an urban NUTS 2 region. From the
urban NUTS 3 population less than 1 per cent is classified as rural based on the NUTS 2
7
typology. Thus we can conclude that the classification of only very few people changes from
rural to urban, or vice versa when we move from the NUTS 3 to the NUTS 2 classification.
The main differences apply to intermediate regions.
Two types of intermediate NUTS 2 regions can be distinguished. First, regions where
a large share of the population lives in intermediate NUTS 3 regions. In three quarters of all
intermediate regions at the NUTS 2 level the majority of the population lives in an
intermediate region at the NUTS 3 level. For these regions it is obvious that they should be
classified as intermediate at the NUTS 2 level. The remaining intermediate NUTS 2 regions
include a mix of predominantly urban and predominantly rural NUTS 3 regions. In these
regions 44 per cent of the population lives in a predominantly urban NUTS 3 region and 36
per cent in a predominantly rural NUTS 3 region. Thus a considerable share of the population
in these intermediate NUTS 2 regions lives in an urban NUTS 3 region, and that share
exceeds the share living in rural regions. One may question whether part of these intermediate
regions should be classified as urban rather than intermediate, particularly intermediate NUTS
2 regions including big cities. People living in a big city can be considered to live in an urban
region, especially if they outnumber the people living in a rural area in the same NUTS 2
region. The access to services, education opportunities and the labour market for inhabitants
of intermediate regions who live close to big cities can be considered to be comparable to that
of people living in urban areas (Brezzi et al., 2011). Hugo et al. (2003) note that areas
adjoining cities include large numbers of residents who have much in common with residents
of the central city although they do not live in a central-city landscape. Brezzi et al. (2011)
include the distance to a city as a criterion for distinguishing between two types of
intermediate and rural regions at the NUTS 3 level, viz. remote regions and regions that are
close to a city. Thus it seems justified to label intermediate NUTS 2 regions with a big city as
urban, since people living in rural NUTS 3 regions within these NUTS 2 regions can be
regarded as comparable to people living in an urban NUTS 2 region.
Therefore we add a criterion for the classification of urban and intermediate regions.
We consider an intermediate NUTS 2 region as predominantly urban if it includes a city with
more than 500,000 inhabitants and if the proportion of the population living in urban NUTS 3
regions exceeds that of living in rural NUTS 3 regions. Note that this additional criterion is
similar to the criterion considering urban centres in the Eurostat typology. This additional
criterion implies that 11 NUTS 2 regions that were originally classified as intermediate were
re-classified as predominantly urban. Among these regions are three German regions (the
8
NUTS 2 regions containing the cities Munich, Nürnberg and Hannover), two French regions
(including Bordeaux and Lyon) and two Polish regions (including Warsaw and Krakow).
Based on the new classification of NUTS 2 regions, 51 percent of the EU population
lives in an urban region. The proportion of the population living in urban regions increases by
9 percentage points by adding the presence of big cities as additional criterion at the cost of
intermediate regions. Thus the share of the population living in urban regions at the NUTS 2
level exceeds that at the NUTS 3 level. This is caused by the fact that a number of people
living in intermediate NUTS 3 regions in the neighbourhood of big cities are considered to
live in an urban environment at the NUTS 2 region. Note that this does not affect the share of
the population living in rural regions.
We conclude that it is possible to develop an urban-rural classification at the NUTS 2
level without changing the classification of a substantial share of the population from rural at
the NUTS 3 level to urban at the NUTS 2 level, or the other way around. One way of
assessing the validity of our classification is to examine whether the types of regions
classified on the basis of demographic criteria, differ in other respects as well. An appropriate
classification should show economic differences between urban and rural regions. The
concentration of population in a region spurs economic agglomerations and economies of
scale which is a plausible explanation why urban centres have a higher GDP per capita than
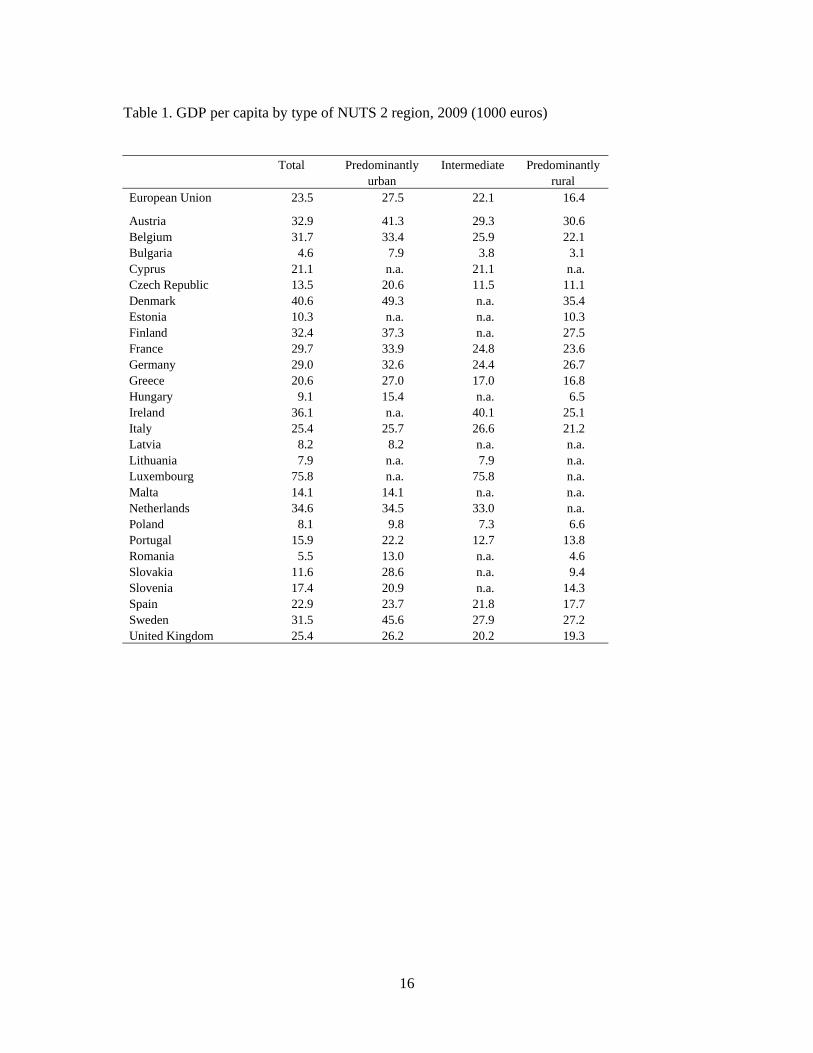
rural regions (Brezzi et al., 2011). Table 1 shows that based on our urban-rural classification
of NUTS 2 regions, in most countries the GDP per capita turns out to be higher in urban
NUTS 2 regions than in other regions. Italy is an exception: intermediate regions have a
somewhat higher GDP per capita. One explanation is the sharp north-south divide. Most
intermediate regions in Italy are in the Northern part of the country and have a relatively high
GDP per capita, whereas the South of Italy includes two urban regions with a relatively low
GDP per capita. Thus even though our classification is based on larger regions than the
Eurostat classification, it shows differentiation between urban and rural regions.
SETTLEMENT PATTERNS SINCE 1990
While on average in the European Union 51 per cent of the population is living in urban
NUTS 2 regions, and 24 per cent in rural regions, there are large differences between
countries. Based on the UN definition Champion (2011) points at the differences among the
four regions of Europe, with high percentages of urban populations in Northern and Western
Europe (around 80 per cent) and relatively low percentages in Eastern and Southern Europe
9
(around 60 per cent). Table 2 shows low percentages of the urban population in Eastern
European countries, but not a clear pattern from North to South. Disregarding the countries
for which the NUTS 2 level coincides with the country level, the most urban countries are the
Netherlands, Belgium and the United Kingdom, with about 80 to 90 per cent of their
population living in predominantly urban NUTS 2 regions. In Spain and Italy the percentages
are higher than the European average, but in Northern Europe they are lower. Ireland does not
have an urban region. Even the NUTS 2 region Southern and Eastern Ireland which includes
Dublin is not an urban region, since two thirds of the population of that region lives in rural
NUTS 3 regions. Again disregarding the countries including only one NUTS 2 region, six
countries have a small rural population: four in Western Europe (Netherlands, Belgium, UK,
and Germany) and two in Southern Europe (Italy and Spain). Eastern European countries
have large rural populations. Romania and Slovakia are the most rural countries in the EU
with almost 90 per cent of its population living in rural NUTS 2 regions.
During the last two decades the distribution of the total population over the three types
of regions has changed slightly. There has only been moderate urbanisation in most countries.
The percentage of the population living in urban regions increased from 49.8 per cent in 1990
to 51.0 per cent in 2010. However, there have been changes in the age pattern. Two causes of
change in the age distribution of the adult population can be distinguished: cohort effects and
changes due to migration and mortality. Cohort effects result from differences in the size of
successive generations. In closed populations where no people enter or leave, or move
between different types of regions, we can estimate the cohort effects on the age pattern in a
region between 1990 and 2010 by shifting the age pattern of 1990 twenty years forward.
Figure 1 shows the shares of the population in urban, intermediate and rural regions in the
European Union in 2010. The solid lines show the observed age patterns in 2010. The dotted
lines show the age pattern that would have occurred if no people entered or left a region (in
other words there was no migration and no death) or if there were changes but no regional
differences in the period 1990-2010. Thus differences between the solid and dotted lines
indicate that there have been regional differences in migration and/or death. For middle ages
the effects of migration are considerably larger than of death.
From Figure 1 we learn that due to migration the share of young people aged 20 to 40
has increased in urban regions at the expense of rural regions. At the same time, the share of
people aged 40 and over has increased in both the intermediate and rural regions at the
expense of urban regions. We can distinguish three types of settlement patterns (Champion,
2011; Piorr et al., 2010; Lambert, 2011; Mitchell, 2004; UN, 2012, Kontuly and Geyer,
10
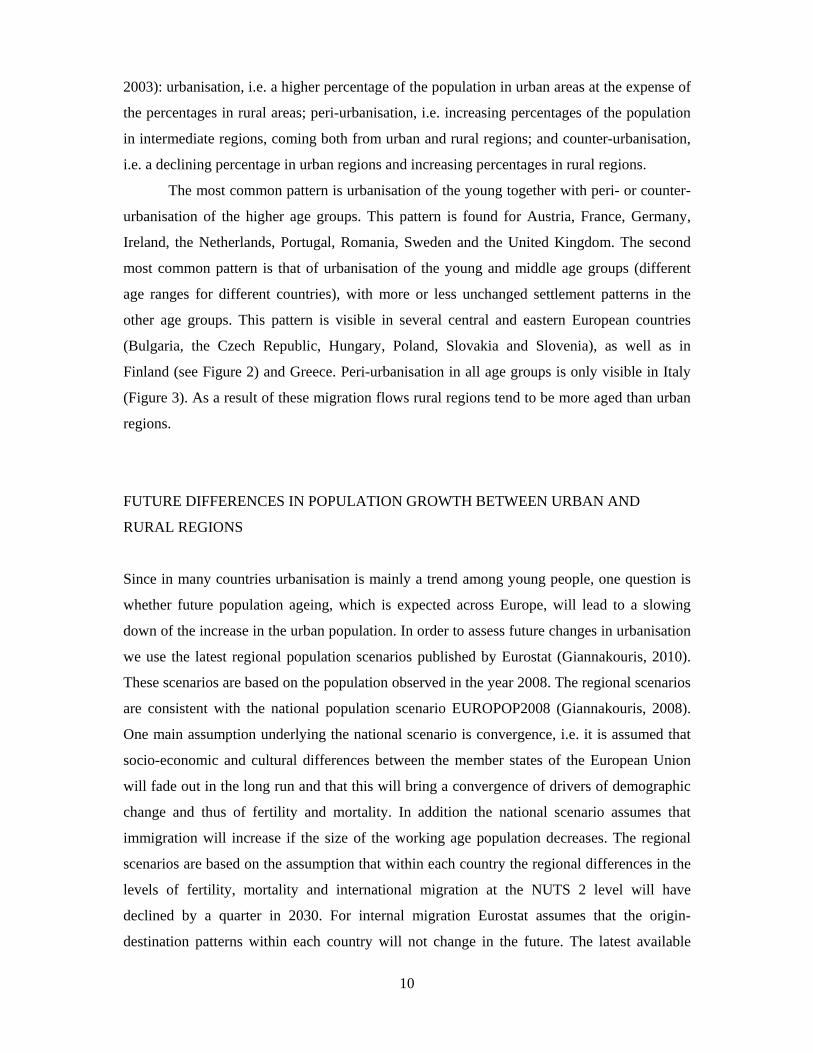
2003): urbanisation, i.e. a higher percentage of the population in urban areas at the expense of
the percentages in rural areas; peri-urbanisation, i.e. increasing percentages of the population
in intermediate regions, coming both from urban and rural regions; and counter-urbanisation,
i.e. a declining percentage in urban regions and increasing percentages in rural regions.
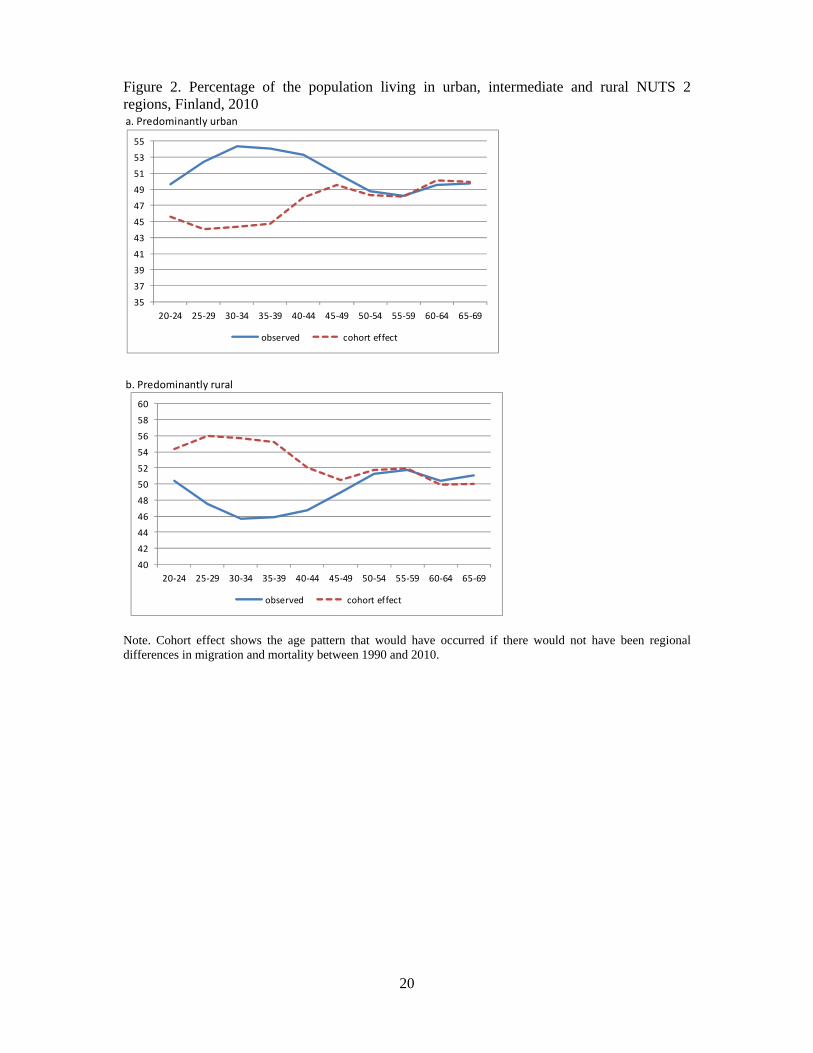
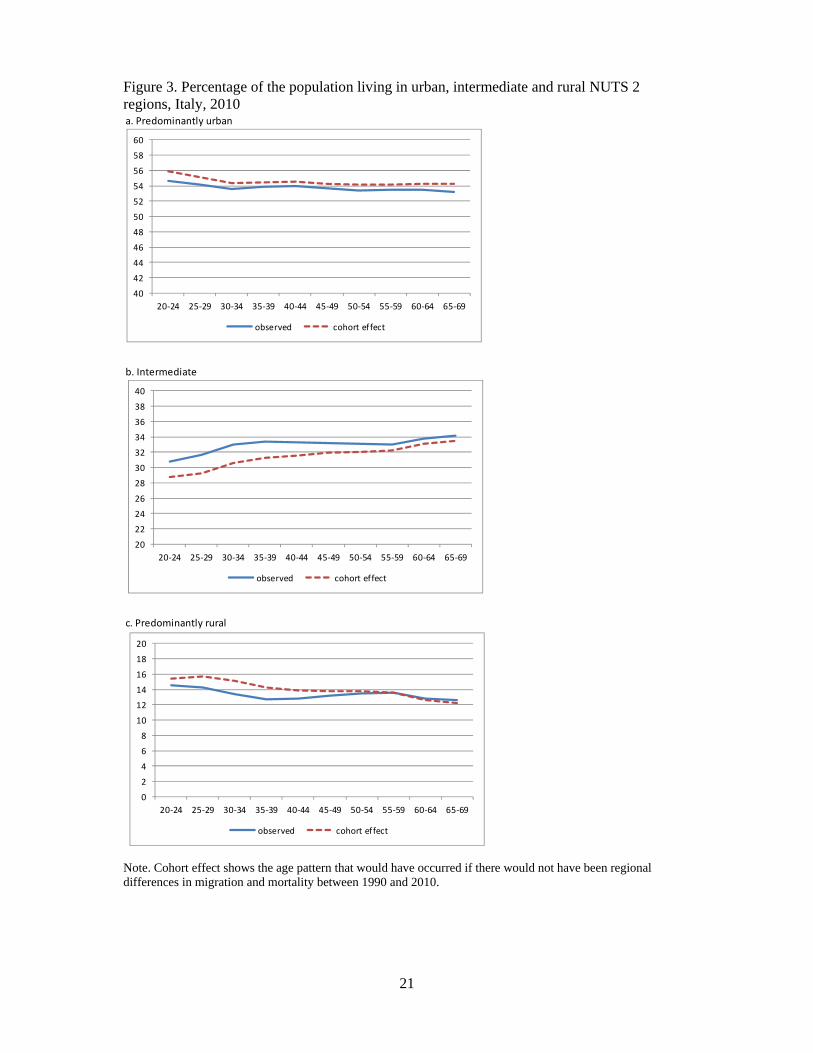
The most common pattern is urbanisation of the young together with peri- or counter-
urbanisation of the higher age groups. This pattern is found for Austria, France, Germany,
Ireland, the Netherlands, Portugal, Romania, Sweden and the United Kingdom. The second
most common pattern is that of urbanisation of the young and middle age groups (different
age ranges for different countries), with more or less unchanged settlement patterns in the
other age groups. This pattern is visible in several central and eastern European countries
(Bulgaria, the Czech Republic, Hungary, Poland, Slovakia and Slovenia), as well as in
Finland (see Figure 2) and Greece. Peri-urbanisation in all age groups is only visible in Italy
(Figure 3). As a result of these migration flows rural regions tend to be more aged than urban
regions.
FUTURE DIFFERENCES IN POPULATION GROWTH BETWEEN URBAN AND
RURAL REGIONS
Since in many countries urbanisation is mainly a trend among young people, one question is
whether future population ageing, which is expected across Europe, will lead to a slowing
down of the increase in the urban population. In order to assess future changes in urbanisation
we use the latest regional population scenarios published by Eurostat (Giannakouris, 2010).
These scenarios are based on the population observed in the year 2008. The regional scenarios
are consistent with the national population scenario EUROPOP2008 (Giannakouris, 2008).
One main assumption underlying the national scenario is convergence, i.e. it is assumed that
socio-economic and cultural differences between the member states of the European Union
will fade out in the long run and that this will bring a convergence of drivers of demographic
change and thus of fertility and mortality. In addition the national scenario assumes that
immigration will increase if the size of the working age population decreases. The regional
scenarios are based on the assumption that within each country the regional differences in the
levels of fertility, mortality and international migration at the NUTS 2 level will have
declined by a quarter in 2030. For internal migration Eurostat assumes that the origin-
destination patterns within each country will not change in the future. The latest available

11
regional scenarios project the population for the member states of the EU at NUTS 2 level for
the period 2008-2030. Because the Eurostat scenarios refer to NUTS 2 regions we can use our
urban-rural typology of NUTS 2 regions to assess future changes in the urban and rural
population.
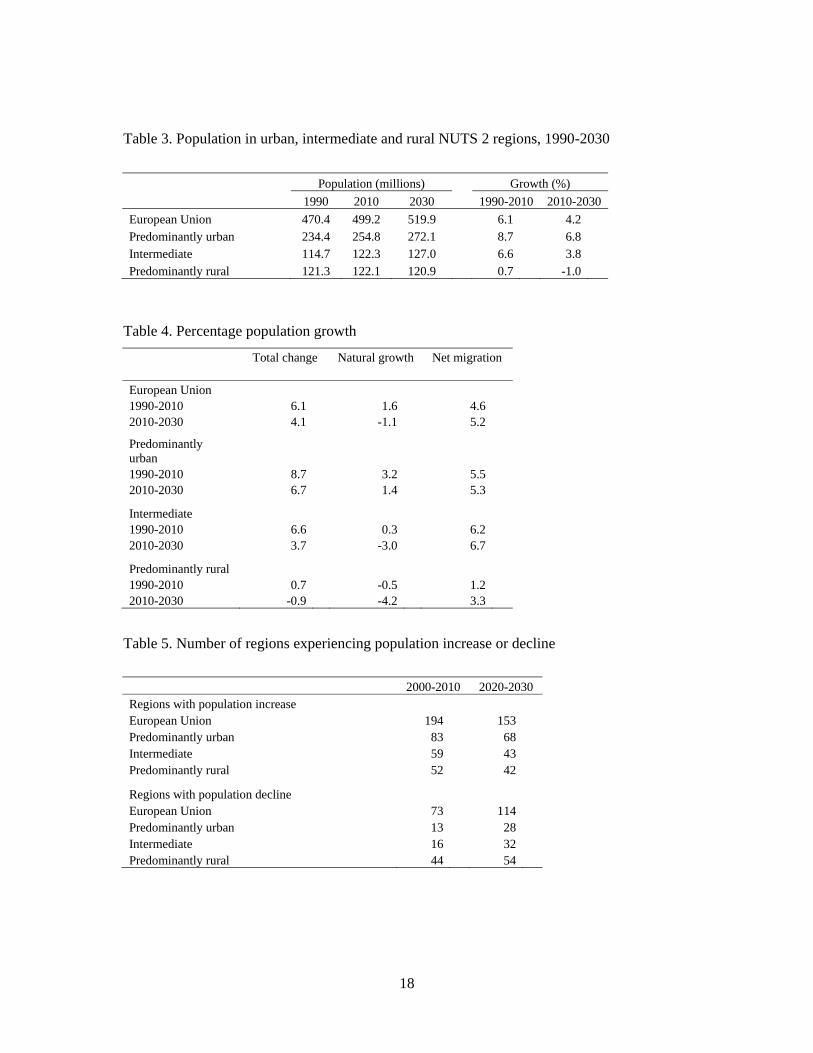
Table 3 shows that the rate of population growth of the EU will decrease. During the
last two decades population has grown by 6.1 per cent, whereas in the next 20 years
population will grow by 4.2 per cent. In urban regions population has grown faster than in
other regions: by 8.7 per cent since 1990. According to the Eurostat scenarios in the next two
decades the urban population will grow by 6.8 per cent. In contrast, the size of the rural
population will decline, by 1.0 per cent in the coming two decades. Thus whereas population
ageing will lead to a slowing down of population growth in the European Union, urban
regions will be affected only moderately. Despite a slight slowing down of population growth,
in the next twenty years urban populations will maintain a considerable growth rate that is
even higher than the growth rate of the total EU population in the last two decades.
The main causes of the decline in population growth across Europe are population
ageing and low fertility levels. Both will have a downward effect on natural population
growth (the balance of the annual numbers of births and deaths). Table 4 shows that according
to the Eurostat population scenario between 2010 and 2030 natural population growth in the
EU will be negative and migration will be the only cause of population growth. In urban
regions, natural growth will slow down, but will not become negative. The main explanation
is that urban populations are relatively young, due to the inflow of young migrants both from
other regions and from other countries, and the outflow of older migrants. In the next decades
in rural regions negative natural growth will be the cause of population decline. Even though
in these regions net migration will be smaller than in urban regions, its effect on population
growth will remain positive.
Because on average urban populations will grow more strongly than the population in
other regions, the percentage of the population living in urban regions will continue to
increase. According to the Eurostat scenario the increase in the urban population in the next
twenty years will be almost the same as in the last twenty years, viz. an increase by 1.3
percentage points. However, table 2 shows that there are considerable differences across
countries. In seven countries the degree of urbanisation in the next two decades will exceed
that in the last two decades, whereas in seven other countries the opposite is true. The
expected future increase in the share of the urban population tends to be higher in countries
with a relatively small percentage of urban populations. In the six countries where the share of
12
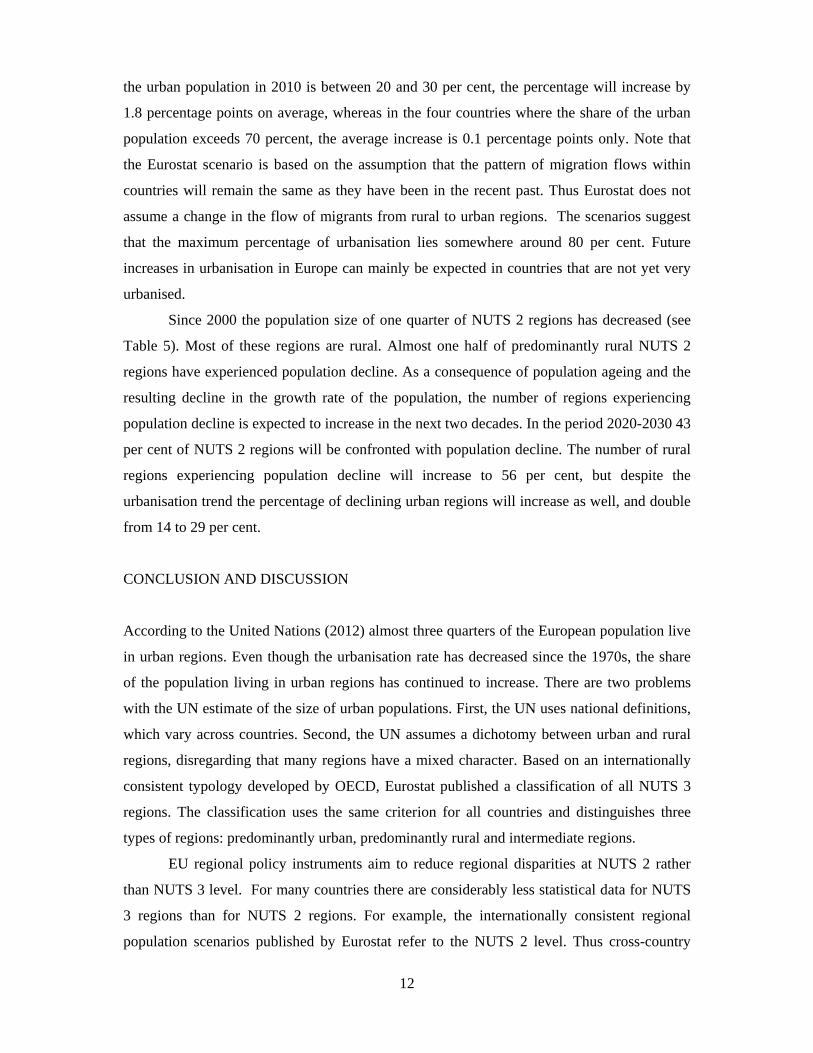
the urban population in 2010 is between 20 and 30 per cent, the percentage will increase by
1.8 percentage points on average, whereas in the four countries where the share of the urban
population exceeds 70 percent, the average increase is 0.1 percentage points only. Note that
the Eurostat scenario is based on the assumption that the pattern of migration flows within
countries will remain the same as they have been in the recent past. Thus Eurostat does not
assume a change in the flow of migrants from rural to urban regions. The scenarios suggest
that the maximum percentage of urbanisation lies somewhere around 80 per cent. Future
increases in urbanisation in Europe can mainly be expected in countries that are not yet very
urbanised.
Since 2000 the population size of one quarter of NUTS 2 regions has decreased (see
Table 5). Most of these regions are rural. Almost one half of predominantly rural NUTS 2
regions have experienced population decline. As a consequence of population ageing and the
resulting decline in the growth rate of the population, the number of regions experiencing
population decline is expected to increase in the next two decades. In the period 2020-2030 43
per cent of NUTS 2 regions will be confronted with population decline. The number of rural
regions experiencing population decline will increase to 56 per cent, but despite the
urbanisation trend the percentage of declining urban regions will increase as well, and double
from 14 to 29 per cent.
CONCLUSION AND DISCUSSION
According to the United Nations (2012) almost three quarters of the European population live
in urban regions. Even though the urbanisation rate has decreased since the 1970s, the share
of the population living in urban regions has continued to increase. There are two problems
with the UN estimate of the size of urban populations. First, the UN uses national definitions,
which vary across countries. Second, the UN assumes a dichotomy between urban and rural
regions, disregarding that many regions have a mixed character. Based on an internationally
consistent typology developed by OECD, Eurostat published a classification of all NUTS 3
regions. The classification uses the same criterion for all countries and distinguishes three
types of regions: predominantly urban, predominantly rural and intermediate regions.
EU regional policy instruments aim to reduce regional disparities at NUTS 2 rather
than NUTS 3 level. For many countries there are considerably less statistical data for NUTS
3 regions than for NUTS 2 regions. For example, the internationally consistent regional
population scenarios published by Eurostat refer to the NUTS 2 level. Thus cross-country
13
analyses of differences in current trends and future prospects between urban and rural regions
are severely hampered by the lack of data at the NUTS 3 level. For that reason this paper
presents a new urban-rural typology for NUTS 2 regions. We assume that if in a NUTS 2
region considerably more people live in urban NUTS 3 regions than in rural NUTS 3 regions,
the NUTS 2 region can be considered as predominantly urban. Even though our classification
of NUTS 2 regions does not include all details of the NUTS 3 level, the NUTS 2 typology
seems to give an adequate description of the way the European population is distributed over
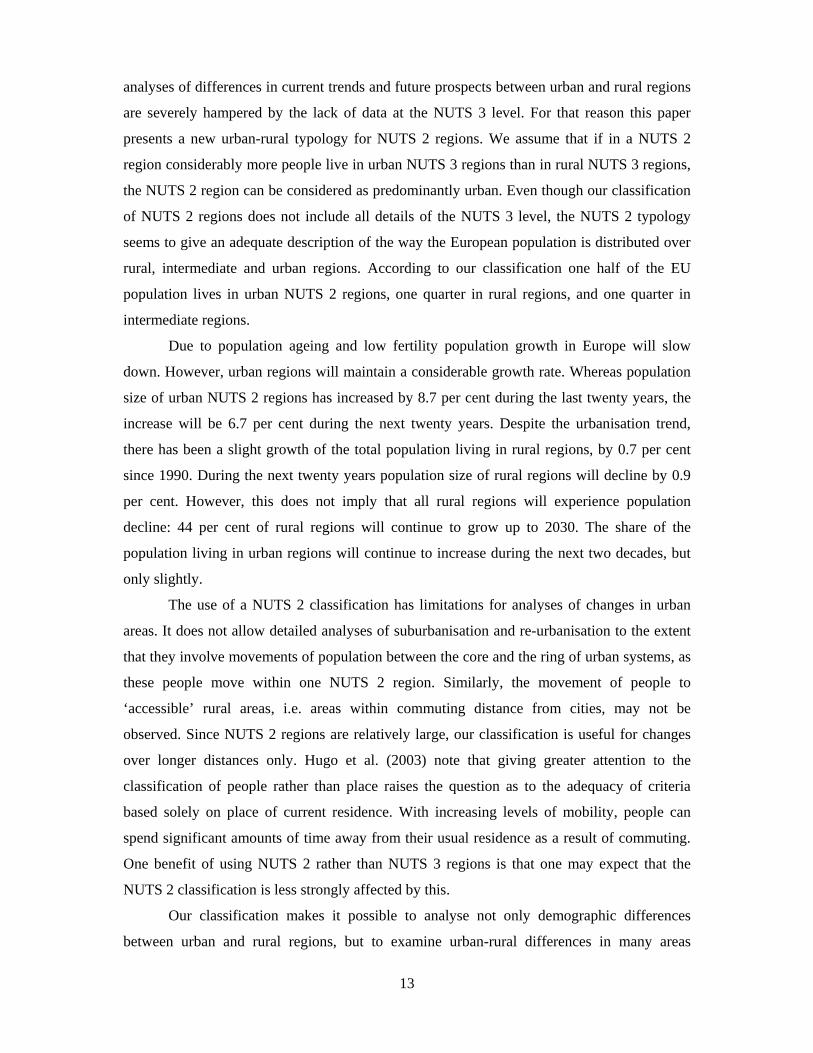
rural, intermediate and urban regions. According to our classification one half of the EU
population lives in urban NUTS 2 regions, one quarter in rural regions, and one quarter in
intermediate regions.
Due to population ageing and low fertility population growth in Europe will slow
down. However, urban regions will maintain a considerable growth rate. Whereas population
size of urban NUTS 2 regions has increased by 8.7 per cent during the last twenty years, the
increase will be 6.7 per cent during the next twenty years. Despite the urbanisation trend,
there has been a slight growth of the total population living in rural regions, by 0.7 per cent
since 1990. During the next twenty years population size of rural regions will decline by 0.9
per cent. However, this does not imply that all rural regions will experience population
decline: 44 per cent of rural regions will continue to grow up to 2030. The share of the
population living in urban regions will continue to increase during the next two decades, but
only slightly.
The use of a NUTS 2 classification has limitations for analyses of changes in urban
areas. It does not allow detailed analyses of suburbanisation and re-urbanisation to the extent
that they involve movements of population between the core and the ring of urban systems, as
these people move within one NUTS 2 region. Similarly, the movement of people to
‘accessible’ rural areas, i.e. areas within commuting distance from cities, may not be
observed. Since NUTS 2 regions are relatively large, our classification is useful for changes
over longer distances only. Hugo et al. (2003) note that giving greater attention to the
classification of people rather than place raises the question as to the adequacy of criteria
based solely on place of current residence. With increasing levels of mobility, people can
spend significant amounts of time away from their usual residence as a result of commuting.
One benefit of using NUTS 2 rather than NUTS 3 regions is that one may expect that the
NUTS 2 classification is less strongly affected by this.
Our classification makes it possible to analyse not only demographic differences
between urban and rural regions, but to examine urban-rural differences in many areas

14
covered by the Eurostat database, such as incomes, education, health, labour market, poverty,
and land use.
REFERENCES
Bengs C, Schmidt-Thomé K. (eds.) 2006. Urban-rural relations in Europe. ESPON 1.1.2 Final
report. ESPON Monitoring Committee: Brussels
Bettencourt L, Lobo J, Helbing D, Kühnert C, West G. 2007. Growth, innovation, scaling,
and the pace of life in cities. Proceedings of the National Academy of Sciences of the
United states of America 104 (17): 7301-7306.
Brezzi M, Dijkstra L, Ruiz V. 2011. OECD extended regional typology: The economic
performance of remote rural regions. OECD Regional Development Working Papers
2011/06, OECD Publishing.
Butler M, Beale C. 1994. Rural-urban continuum codes for Metro and non-Metro counties
1993. ERS Staff Paper 9425. US Department of Agriculture: Washington DC.
Champion T. 2007, Defining “urban”: the disappearing urban-rural divide. In International
Handbook of Urban Policy, vol. 1: Continuous global issues, H.S. Geyer (ed.) .
Edward Elgar: Cheltenham; 22-37
Champion A. 2011. The changing nature of urban and rural areas in the United Kingdom and
other European countries. In Population distribution, urbanisation, internal migration
and development: an international perspective. United Nations Department of
Economic and Social Affairs, Population Division: New York; 144-160.
Coombes M, Raybould S. 2001. Public policy and population distribution: Developing
appropriate indicators of settlement patterns. Environment and Planning C:
Government and Policy 19: 223-248. DOI 1068/c9826.
Coombes M. 2004. Multiple dimensions of settlement systems: coping with complexity. In
New forms of urbanisation: beyond the urban-rural dichotomy, Champion T, Hugo G.
(eds.). Ashgate: Aldershot; 307-324.
Cromartle J, Swanson L. 1996. Defining Metropolitan areas and the rural-urban continuum: a
comparison of statistical areas based on county and sub-county geography. ERS Staff
Paper no. 9603. US Department of Agriculture: Washington, DC.
Dijkstra L, Poelman H. 2008. Remote rural regions: how promixity to a city influences the
performances of rural regions. Regional Focus 01/2008.
Dijkstra L, Poelman H. 2011. Regional typologies: a compilation. Regional Focus 01/2011.
15
Eurostat 2007. Regions in the European Union– Nomenclature of territorial units for statistics
–NUTS 2006 /EU-27: Luxembourg.
Eurostat 2010. A revised urban-rural typology. In Eurostat regional yearbook 2010.
Publication Office of the European Union: Luxembourg; 240-253.
Giannakouris K. 2008. Ageing characterises the demographic perspectives of the European
societies. Eurostat Statistics in Focus 72/2008.
Giannakouris K. 2010. Regional population projections EUROPOP2008: Most EU regions
face older population profile in 2030. Eurostat Statistics in Focus 1/2010.
Hugo G, Champion T, Lattes A. 2003. Toward a new conceptualization of settlements for
demography. Population and Development Review 29: 277-297. DOI: 10.1111/j.1728-
4457.2003.00277.x
Kontuly T, Geyer H. 2003. Lessons learned from testing the differential urbanisation model in
developed and less developed countries. Tijdschrift voor Economische en Sociale
Geografie 94: 124-128. DOI: 10.1111/1467-9663.00242.
Lambert A. 2011. The (mis)measurement of periurbanisation. Metropolitics, 11 May 2011.
Mitchell C. 2004. Making sense of counterurbanisation. Journal of Rural Studies 20: 15-34.
doi.org/10.1016/S0743-0167(03)00031-7.
Piorr A, Ravetz J, Tosics I. (eds.) 2010. Peri‐urbanisation in Europe. Towards European
policies to sustain urban‐rural futures. University of Copenhagen/Academic Books
Life Sciences: Copenhagen.
OECD 2010. OECD regional typology. OECD Directorate for Public Governance and
Territorial Development.
United Nations 2012. World Urbanisation Prospects. The 2011 Revision. United Nations,
department of Economic and Social Affairs.
16
Table 1. GDP per capita by type of NUTS 2 region, 2009 (1000 euros)
Total Predominantly Intermediate Predominantly urban rural European Union 23.5 27.5 22.1 16.4
Austria 32.9 41.3 29.3 30.6 Belgium 31.7 33.4 25.9 22.1 Bulgaria 4.6 7.9 3.8 3.1 Cyprus 21.1 n.a. 21.1 n.a. Czech Republic 13.5 20.6 11.5 11.1 Denmark 40.6 49.3 n.a. 35.4 Estonia 10.3 n.a. n.a. 10.3 Finland 32.4 37.3 n.a. 27.5 France 29.7 33.9 24.8 23.6 Germany 29.0 32.6 24.4 26.7 Greece 20.6 27.0 17.0 16.8 Hungary 9.1 15.4 n.a. 6.5 Ireland 36.1 n.a. 40.1 25.1 Italy 25.4 25.7 26.6 21.2 Latvia 8.2 8.2 n.a. n.a. Lithuania 7.9 n.a. 7.9 n.a. Luxembourg 75.8 n.a. 75.8 n.a. Malta 14.1 14.1 n.a. n.a. Netherlands 34.6 34.5 33.0 n.a. Poland 8.1 9.8 7.3 6.6 Portugal 15.9 22.2 12.7 13.8 Romania 5.5 13.0 n.a. 4.6 Slovakia 11.6 28.6 n.a. 9.4 Slovenia 17.4 20.9 n.a. 14.3 Spain 22.9 23.7 21.8 17.7 Sweden 31.5 45.6 27.9 27.2 United Kingdom 25.4 26.2 20.2 19.3

17
Table 2. Population by type of NUTS 2 region, 1990, 2010 and 2030 (%)
Predominantly urban Intermediate Predominantly rural 1990 2010 2030 1990 2010 2030 1990 2010 2030 European Union 49.8 51.0 52.3 24.4 24.5 24.4 25.8 24.5 23.3
Austria 23.8 24.7 26.6 27.1 27.6 28.2 49.1 47.7 45.2 Belgium 80.2 79.8 79.0 13.2 13.4 13.8 6.6 6.8 7.2 Bulgaria 25.3 27.9 30.8 27.2 27.8 27.9 47.6 44.2 41.3 Cyprus n.a n.a n.a 100.0 100.0 100.0 n.a n.a n.a Czech Republic 22.5 23.8 25.8 39.5 38.6 37.2 38.0 37.6 36.9 Denmark 30.3 30.4 30.2 n.a n.a n.a 69.7 69.6 69.8 Estonia n.a n.a n.a n.a n.a n.a 100.0 100.0 100.0 Finland 47.0 49.9 51.3 n.a n.a n.a 53.0 50.1 48.7 France 47.7 48.1 48.9 19.7 19.9 19.8 32.6 32.0 31.3 Germany 50.0 50.8 52.5 32.5 32.2 31.3 17.5 17.0 16.1 Greece 34.9 36.4 36.4 21.9 22.7 23.8 43.2 40.9 39.8 Hungary 28.6 29.5 32.2 n.a n.a n.a 71.4 70.5 67.8 Ireland n.a n.a n.a 73.4 73.0 71.8 26.6 27.0 28.2 Italy 53.9 53.8 53.7 32.4 33.0 33.5 13.7 13.3 12.8 Latvia 100.0 100.0 100.0 n.a n.a n.a n.a n.a n.a Lithuania n.a n.a n.a 100.0 100.0 100.0 n.a n.a n.a Luxembourg n.a n.a n.a 100.0 100.0 100.0 n.a n.a n.a Malta 100.0 100.0 100.0 n.a n.a n.a n.a n.a n.a Netherlands 86.9 87.4 87.7 13.1 12.6 12.3 n.a n.a n.a Poland 42.1 42.0 42.4 25.0 25.0 24.9 32.9 33.0 32.7 Portugal 28.3 28.9 28.7 37.8 37.5 36.8 33.9 33.5 34.5 Romania 10.0 10.5 10.7 n.a n.a n.a 90.0 89.5 89.3 Slovakia 11.5 11.5 11.7 n.a n.a n.a 88.5 88.5 88.3 Slovenia 45.0 47.0 47.8 n.a n.a n.a 55.0 53.0 52.2 Spain 68.6 70.7 72.1 24.4 22.5 20.9 7.0 6.8 7.0 Sweden 19.1 21.6 22.9 50.8 51.5 52.1 30.0 26.9 24.9 United Kingdom 79.8 79.3 78.9 19.5 19.9 20.5 0.7 0.7 0.7
18
Table 3. Population in urban, intermediate and rural NUTS 2 regions, 1990-2030
Population (millions) Growth (%)
1990 2010 2030 1990-2010 2010-2030
European Union 470.4 499.2 519.9 6.1 4.2 Predominantly urban 234.4 254.8 272.1 8.7 6.8 Intermediate 114.7 122.3 127.0 6.6 3.8 Predominantly rural 121.3 122.1 120.9 0.7 -1.0
Table 4. Percentage population growth
Total change Natural growth Net migration European Union 1990-2010 6.1 1.6 4.6 2010-2030 4.1 -1.1 5.2
Predominantly urban 1990-2010 8.7 3.2 5.5 2010-2030 6.7 1.4 5.3
Intermediate 1990-2010 6.6 0.3 6.2 2010-2030 3.7 -3.0 6.7
Predominantly rural 1990-2010 0.7 -0.5 1.22010-2030 -0.9 -4.2 3.3
Table 5. Number of regions experiencing population increase or decline
2000-2010 2020-2030 Regions with population increase European Union 194 153 Predominantly urban 83 68 Intermediate 59 43 Predominantly rural 52 42
Regions with population decline European Union 73 114 Predominantly urban 13 28 Intermediate 16 32 Predominantly rural 44 54

19
Figure 1. Percentage of the population living in urban, intermediate and rural NUTS 2 regions, EU, 2010
Note. Cohort effect shows the age pattern that would have occurred if there would not have been regional differences in migration and mortality between 1990 and 2010.
a. Predominantly urban
b. Intermediate
c. Predominantly rural
45
46
47
48
49
50
51
52
53
54
55
20‐24 25‐29 30‐34 35‐39 40‐44 45‐49 50‐54 55‐59 60‐64 65‐69
observed cohort effect
20
21
22
23
24
25
26
27
28
29
30
20‐24 25‐29 30‐34 35‐39 40‐44 45‐49 50‐54 55‐59 60‐64 65‐69
observed cohort effect
20
21
22
23
24
25
26
27
28
29
30
20‐24 25‐29 30‐34 35‐39 40‐44 45‐49 50‐54 55‐59 60‐64 65‐69
observed cohort effect
20
Figure 2. Percentage of the population living in urban, intermediate and rural NUTS 2 regions, Finland, 2010
Note. Cohort effect shows the age pattern that would have occurred if there would not have been regional differences in migration and mortality between 1990 and 2010.
a. Predominantly urban
b. Predominantly rural
35
37
39
41
43
45
47
49
51
53
55
20‐24 25‐29 30‐34 35‐39 40‐44 45‐49 50‐54 55‐59 60‐64 65‐69
observed cohort effect
40
42
44
46
48
50
52
54
56
58
60
20‐24 25‐29 30‐34 35‐39 40‐44 45‐49 50‐54 55‐59 60‐64 65‐69
observed cohort effect
21
Figure 3. Percentage of the population living in urban, intermediate and rural NUTS 2 regions, Italy, 2010
Note. Cohort effect shows the age pattern that would have occurred if there would not have been regional differences in migration and mortality between 1990 and 2010.
a. Predominantly urban
b. Intermediate
c. Predominantly rural
40
42
44
46
48
50
52
54
56
58
60
20‐24 25‐29 30‐34 35‐39 40‐44 45‐49 50‐54 55‐59 60‐64 65‐69
observed cohort effect
20
22
24
26
28
30
32
34
36
38
40
20‐24 25‐29 30‐34 35‐39 40‐44 45‐49 50‐54 55‐59 60‐64 65‐69
observed cohort effect
0
2
4
6
8
10
12
14
16
18
20
20‐24 25‐29 30‐34 35‐39 40‐44 45‐49 50‐54 55‐59 60‐64 65‐69
observed cohort effect

In 2010 Eurostat developed an urban-rural typology for NUTS 3 regions. However, EU regional policies are often founded on statistics and population projections at NUTS 2 level. Based on the Eurostat typology this paper develops an urban-rural
classification of NUTS 2 regions. We use the new classification to examine differences in population change between urban and rural regions in all EU countries during the last twenty years and in the next twenty years. Half of the EU population is living in
urban NUTS 2 regions. In the next two decades population ageing will lead to a slowing down in population growth in European countries, but urban regions will
maintain a considerable growth rate.