Embed Size (px)
Citation preview
Annual Report 2009Fiscal Year Ended March 2009
New Business Frontiersof the Environment
Nisshinbo Holdings Inc.2-31-11, Ningyo-cho, Nihonbashi, Chuo-ku, Tokyo 103-8650, JapanTel: 03-5695-8833 Fax: 03-5695-8970http://www.nisshinbo.co.jp/english/
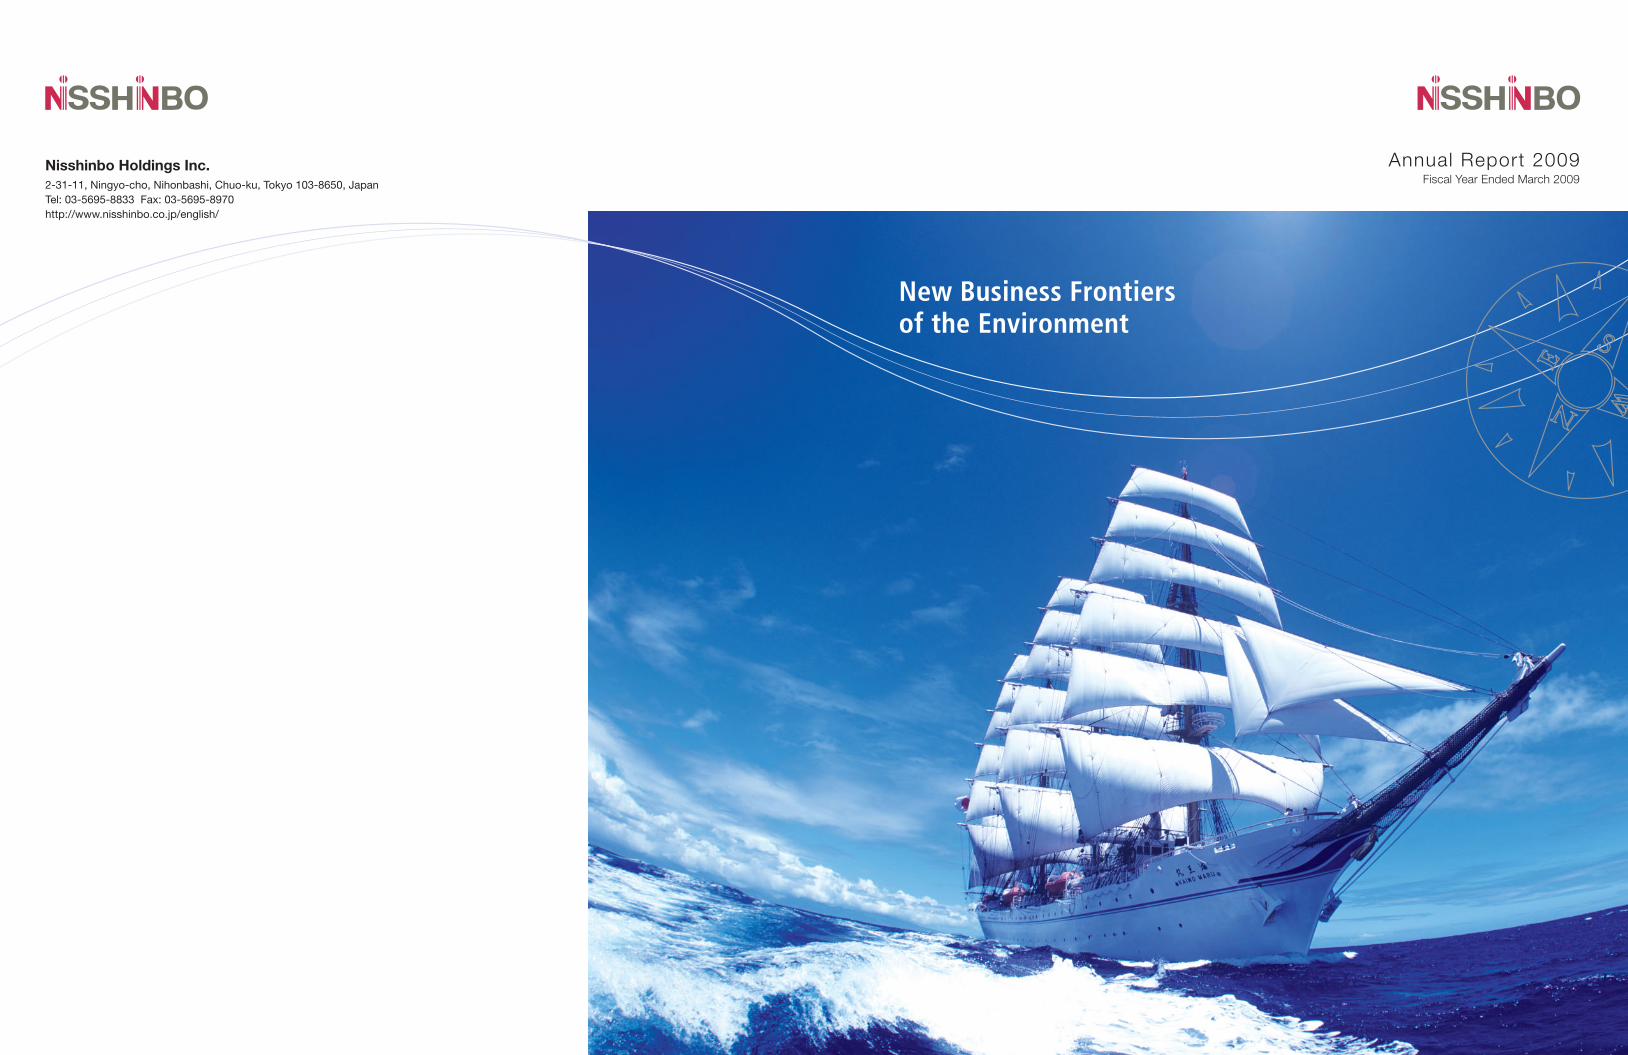
Nisshinbo was established in 1907 as a manufacturer of cotton yarn and thread. In over a century
since then, we have consistently created value that meets the demands of society. We have done
this by supplying goods and services that contribute to quality of life in a wide range of fields
including textiles, brakes, paper products, mechatronics, chemicals, and electronics. In April 2009,
Nisshinbo Industries, Inc. implemented a corporate split and made a new start as a corporate group
with Nisshinbo Holdings Inc. as its holding company. We are now striving to be an environmental
company. The Nisshinbo Group will chart its way through this new business frontier, the environment,
by making use of the technology and human strengths that it has accumulated since its foundation.
(millions of yen)
(%)
(yen)
(thousands ofUS dollars)
(dollars)
Consolidated:
Key Ratio:
Per Share:
Net Sales
Return on Assets (ROA)
Net Income (loss)
Operating Income
Net Income (loss)
Equity
Textiles
Return on Equity (ROE)
Shareholders’ Equity
Automobile Brakes
Cash Dividends
Papers
Chemicals
Electronics
Real Estate Leasing
Other Businesses
Mechatronics
¥ 243,421
2.2
¥ 39.03
9,651
8,199
222,771
82,164
3.8
1,072.54
54,306
10.00
28,585
34,199
16,843
4,945
16,818
5,561
¥ 312,825
3.1
¥ 74.19
11,551
15,107
282,015
82,243
5.7
1,301.14
61,764
15.00
29,908
37,671
76,068
4,788
13,539
6,844
¥ 286,167
(0.3)
¥ (7.08)
408
(1,286)
193,698
67,593
(0.6)
985.19
53,261
15.00
34,214
32,624
60,550
6,433
16,754
14,738
¥ 278,617
2.6
¥ 53.21
10,524
11,183
266,434
82,879
4.6
1,283.21
58,130
10.00
28,612
36,007
45,858
4,781
14,778
7,572
¥ 322,412
2.7
¥ 63.34
12,034
12,290
245,909
78,816
5.1
1,179.43
66,397
15.00
33,547
38,528
76,475
5,446
15,120
8,083
$ 2,861,670
$ (0.07)
4,080
(12,860)
1,936,980
675,930
9.85
532,610
0.15
342,140
326,240
605,500
64,330
167,540
147,380
Using a Century of Experiencefor a New Era
1
Nis
shin
bo
Ann
ual R
epor
t 20
09
2005 2007 20092006 2008 2009
Note: The United States dollar amounts in this report are given for convenience only and represent translations of Japanese yen at the rate of ¥100 = US$1.
Financial Highlights (Years ended March 31)
C O N T E N T SExecutive Message2
Five Questions for President Uzawa3
Feature:Striving to Be an Environmental Company8
Overview and Business Results of Individual Business Segments14
Textiles16
Automobile Brakes18
Papers20
Electronics24
Chemicals23
Mechatronics22
Real Estate Leasing26
The Nisshinbo Group’s CSRActivities27
Financial Section31
Board of Directors54
History & Corporate Data 55
Main Group Companies56
’05 ’06 ’07 ’08 ’09
Textiles
Automobile Brakes
Papers
Mechatronics
Chemicals
Electronics
Real Estate Leasing
Other Businesses
(billions of yen)
0
50
100
150
200
250
300
350
’05 ’06 ’07 ’08 ’09
0
-5
-10
5
10
15 Textiles
Automobile Brakes
Papers
Mechatronics
Chemicals
Electronics
Real Estate Leasing
Other Businesses
(billions of yen)
Consolidated Net Sales by Segment
Consolidated Operating Income by Segment
Note: The mechatronics segment, which previously was included in the other business segment, has increased in significance, and accordingly, is now presented as a separate category. The table shows the categories following this change for fiscal 2008 and 2009, but data for fiscal 2007 and earlier has not been modified.

The Nisshinbo Group Has Set Course to Overcome Global Economic Turmoil and Become an Environmental Company
The fiscal year ended March 2009 was extremely trying for the global economy. The financial crisis sparked by the subprime loan problem in the United States caused a severe global recession the like of which occurs only once a century. It was unavoidable for the Nisshinbo Group to post lower net sales and income. Despite these hard times, the Nisshinbo Group has set a new course to become a collective of environmental companies. The photovoltaic module manufacturing equipment business continues to grow at a rapid pace, and other new business fields that can contribute to alleviating global warming are also showing signs of steady growth. Meanwhile, Nisshinbo Industries, Inc. implemented a corporate split in April 2009 and was reborn as Nisshinbo Holdings Inc., a holding company at the center of a corporate group active in six main business areas. I look forward to receiving your continued support for the new Nisshinbo Group in the coming year.
5-Questions
Shizuka Uzawa was appointed president of Nisshinbo
Holdings Inc. in June 2009. How will he steer the Nisshinbo
Group, which recently embarked on a new course amid
extremely difficult economic conditions? In this section,
President Uzawa responds to five key questions.Five Questions for President Uzawa
I am honored to have been appointed president of the new Nisshinbo
Holdings Inc., and I ask for the continued support and guidance of our
shareholders and investors.
On April 1, 2009, the Nisshinbo Group spun off five business
segments: textiles, automobile brakes, papers, mechatronics, and
chemicals. It adopted a holding company structure with six business
companies including an electronics company under the management of
Nisshinbo Holdings Inc.
We decided to split the Group into separate companies to raise
overall corporate value. The Nisshinbo Group has a history of more than a
century and has expanded from its initial textile business to a wide range
of business areas. In the past, if the textile business performed poorly,
for example, the brake business was able to make up the difference,
and we were able to maintain a well-balanced, integrated management.
Changes in the economic environment, however, have become faster and
more extreme, and this means that rapid decision-making is essential
for achieving continuous growth. We therefore determined that our
management format had to be reformed, and we decided to split the
company and transfer management authority to the individual companies.
We sought to raise overall corporate value by giving each of the main
subsidiaries more maneuverability, thereby enhancing competitiveness.
Nisshinbo’s financial foundations are solid, but this can lead to
complacency and lagging profitability at underperforming business sectors.
Following the corporate split, the profitability of each business segment will
be much clearer. By reforming the repeated selection of priority areas and
concentration of resources, each group company can focus its managerial
resources in areas that can be expected to generate high returns. This
continuous reform will mean higher profitability for the entire Group. We
used the corporate split to give each group company a greater sense
of urgency and to clarify responsibilities and authority in each business
segment. By supporting independent and agile operations at each unit,
Nisshinbo will be reborn as a group in which every business can survive
and thrive even amid harsh economic conditions.
Since the corporate split was announced in November 2007, the
Group has disseminated information concerning its vision throughout
all group companies. The categorization of “textile” and “non-textile”
businesses that has been in place since our foundation will no longer be
used. Each business segment will be given the managerial freedom to
operate independently. Expect great things from the new Nisshinbo Group.
NisshinboHoldings Inc.
Textiles Nisshinbo Textile Inc.
Automobile Brakes Nisshinbo Brake Inc.
Papers Nisshinbo Paper Products Inc.
Mechatronics Nisshinbo Mechatronics Inc.
Chemicals Nisshinbo Chemical Inc.
Electronics New Japan Radio Co., Ltd.
Q.1 The Nisshinbo Group made a new start with a corporate split in April 2009. Could you explain the background of the split and the prospects for Nisshinbo’s future?
A.1 The corporate split was designed to raise overall corporate value by enabling each business to respond rapidly to market changes through autonomous management.
3
Nis
shin
bo
Ann
ual R
epor
t 20
09
2
Nisshinb
oA
nnual Rep
ort 2009
Shizuka Uzawa, PresidentNisshinbo Holdings Inc.
0
50
100
150
200
250
300
350
’05 ’06 ’07 ’08 ’09
(billions of yen)
Textiles
Automobile Brakes
Papers
Mechatronics
Chemicals
Electronics
Real Estate Leasing
Other Businesses
Sales by Business Segment
Five Questions for President Uzawa
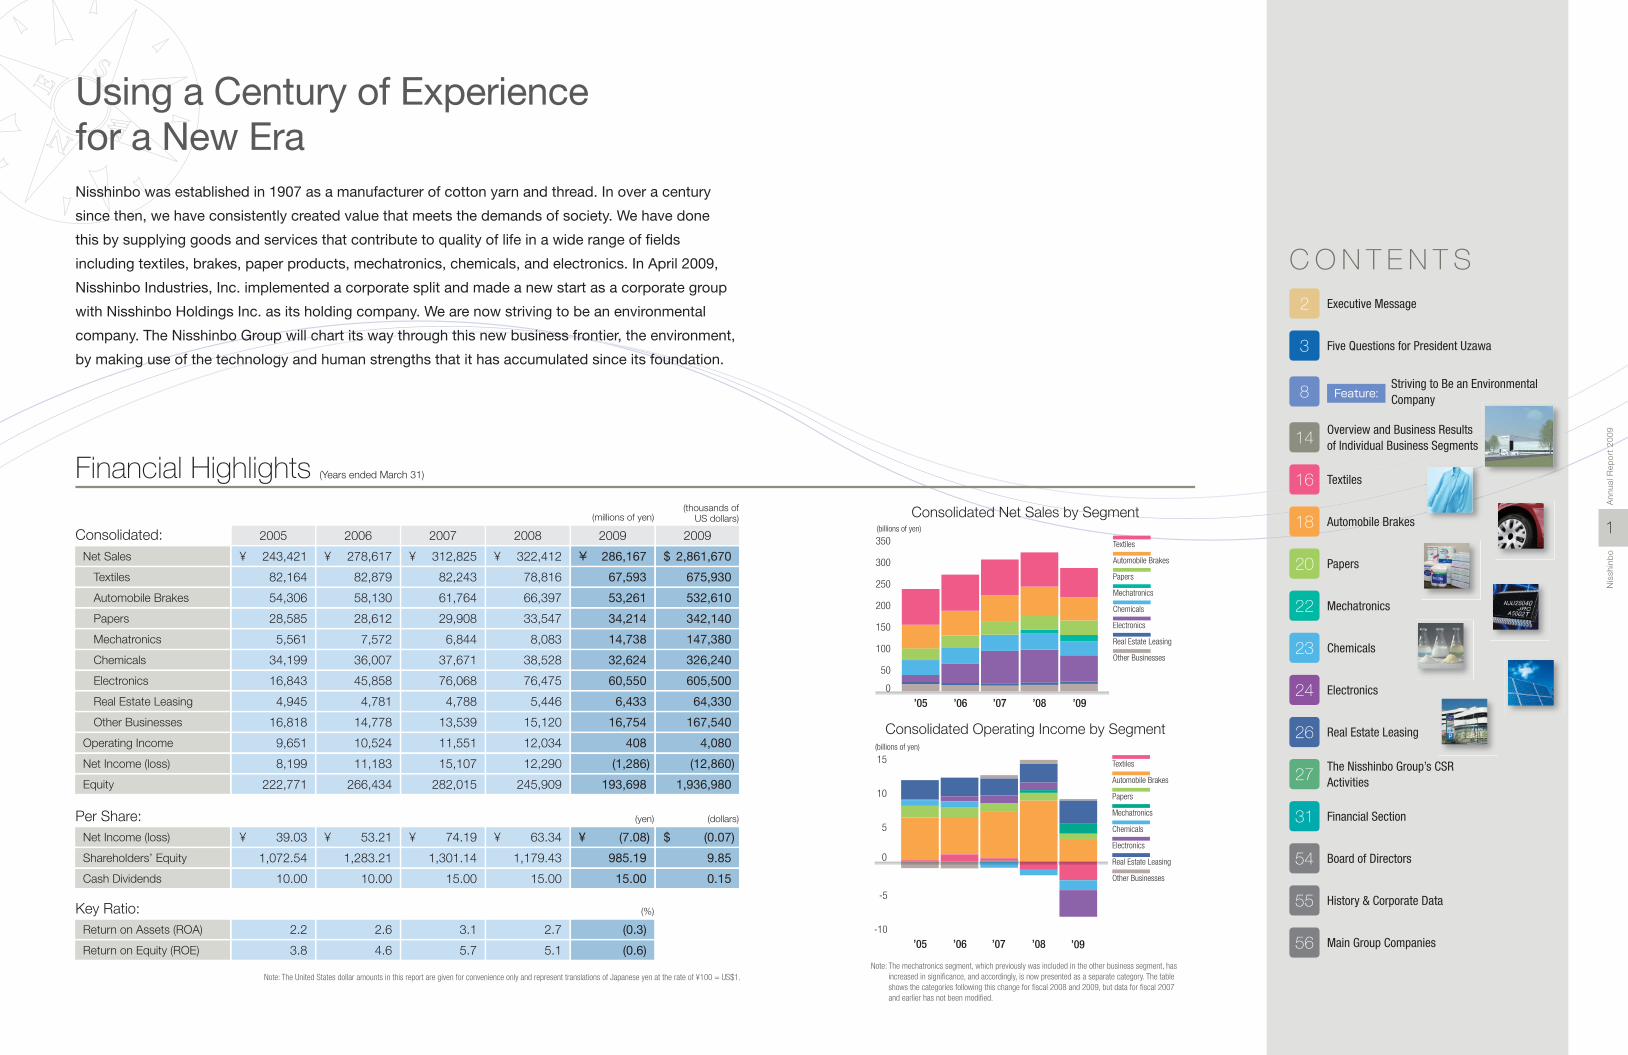
Targets for the Fiscal Year Ending March 2010
¥262,000 million
¥5,000 millionOperating income
Net sales
¥7,000 millionNet income
The rapid changes in the global environment following the Lehman Brothers
shock have had a major impact on the automobile brake business, one of
our main business lines.
Under this environment, our consolidated financial performance for
the fiscal year ended March 2009 was as follows: Sales were ¥286,167
million (down 11.2% from the previous year) and operating income was
¥408 million (down 96.6%). Thus, we experienced declines in both sales
and income. Ordinary income was ¥7,151 million (down 62.2%) due to
dividends received and equity method investment income, but we posted
extraordinary losses for special severance payments under an early
retirement incentive program and for other expenditures. As a result, we
posted a net loss of ¥1,286 million (compared to net income of ¥12,290
million in the previous fiscal year).
Although operating income in the automobile brake business was
only about 70% that of the previous year and the electronics business also
deteriorated, sales of photovoltaic module manufacturing equipment were
strong and the mechatronics business posted substantially higher sales and
income. Also, the paper products business, which consists of household
paper products, high-quality printing paper, and processed paper products,
maintained its results from the previous year despite the difficult economic
environment, and the real estate leasing business was strong. Other
businesses compensated for the slowdown in the automobile brake business.
The ability of a wide range of business sectors to complement
each other and support our financial results is one of the strengths of the
Nisshinbo Group. Our businesses have a flexible structure, and by linking
units with different characteristics, we are able to absorb a variety of
risks caused by the recession as well as factors such as exchange rate
fluctuations and high materials costs. In addition, the cash flows generated
from the effective use of real estate assets serve to support the Group’s
financial results, becoming a source of capital to develop high-growth
sectors. The corporate split will strengthen each business segment and
make it better adapted to the times.
The current fiscal year (ending March 2010) is the initial period of our new
medium-term management plan, but we have postponed announcement of
the plan. Under these unclear economic conditions, we cannot know what
circumstances will be in six months, so we determined that announcing
quantitative targets for the next three years may mislead investors. This
does not mean, however, that we are standing idly by. We are rapidly
implementing measures to overcome these economic conditions.
First, in conjunction with the corporate split, we implemented an
early retirement incentive program and streamlined the personnel structure
of Nisshinbo Industries during the previous fiscal year. As a result, the
personnel expenses will decrease this year by approximately ¥2.6 billion.
We have created a structure that will allow our human resources to exhibit
their full potential.
Also, we switched our depreciation calculation method from the
declining balance method to the straight line method, which is the global
standard, making it consistent with the method used by our overseas
subsidiaries. The result is a reduction in depreciation expenses of
approximately ¥3.4 billion. Moreover, New Japan Radio Co., Ltd., which
is one of our main subsidiaries, is expected to reduce fixed expenses by
approximately ¥5.0 billion, and other group companies will reduce fixed
expenses by a total of ¥1.0 billion, for a combined decrease in fixed
expenses of approximately ¥12.0 billion.
In conjunction with the structural reforms, we are also creating
and expanding new businesses. We’re starting to see results in a number
of new businesses that will support the Nisshinbo Group’s growth as an
environmental company, such as the photovoltaic module manufacturing
equipment business, which achieved substantial increases in sales and
income in the fiscal year ended March 2009. Expanding new businesses
will also set us on a course for new growth in three years.
As a result of these measures, the outlook for the fiscal year ending
March 2010, under the anticipated ongoing financial difficulties and with the
effects of the lower fixed costs, is for lower revenues but higher income. We
are projecting sales of ¥262,000 million, operating income of ¥5,000 million,
and net income of ¥7,000 million. We postponed the announcement of our
new medium-term management plan this term. Based on group corporate
principle and philosophy, and management principle adopted in conjunction
with the corporate split, however, our long-term goals are to achieve an ROE
in excess of 9% and sales in excess of ¥600 billion by the fiscal year ending
March 2018 by achieving both dynamic implementation of business and
proper governance.
During Nisshinbo’s century-long history, we have overcome major
recessions as well as a war that devastated Japan. Now, we must overcome
a global recession. A period of downturn is an opportunity to eliminate all
excess from the company and make preparations for future growth. We
must not neglect this chance.
Q.2 Please explain the Nisshinbo Group’s financial results for the fiscal year ended March 2009 amid the global recession.
A.2 We were able to support our financial results with a well-balanced business portfolio despite the difficult business environment.
Q.3 What are the medium- to long-term prospects for the Nisshinbo Group’s business?
A.3 A downturn is preparation for recovery. By establishing a high-profit structure, the Group will embark on a course to new growth in three years.
5
Nis
shin
bo
Ann
ual R
epor
t 20
09
4
Nisshinb
oA
nnual Rep
ort 2009
The “environmental company” that we seek to become is based on the idea
of contributing to society through our business activities by employing our
technologies to address environmental issues such as global warming. In this
way, we can carry out our corporate principle of serving as a “public entity.”
We are currently working to develop environmental technologies that
use solar energy and carbon to prevent global warming. By focusing all
business segments including new businesses on the environment and energy,
the Nisshinbo Group can achieve rapid growth as an environmental company.
One of our main environmental businesses is photovoltaic module
manufacturing equipment, which is essential for solar power generation.
We have the highest domestic market share in this business and are
rapidly expanding sales channels to increase global market share. We will
expand our business in response to America’s Green New Deal and the
environmental policies of other countries.
The carbon bipolar plates that are necessary for fuel cells are also
one of Nisshinbo’s core environmental businesses. Our bipolar plates for
fuel cells are at the world’s highest levels in terms of both quality and
quantity, and demand has been increasing since the launch of the Ene-
Farm household fuel cells in May 2009. Construction of a new plant is to be
completed in September 2009, and we hope to increase production even
further. We are conducting research and development on bipolar plates for
fuel cells for motor vehicle use, and we expect rapid growth in conjunction
with the widespread use of next-generation fuel cell vehicles. We are also
developing a carbon alloy catalyst that can replace platinum catalyst, which
is the key to reducing the cost of fuel cells. Our carbon bipolar plates and a
carbon alloy catalyst will play crucial roles in expanding the use of fuel cells.
In addition, Carbodilite, a modifying material that is essential for the
manufacture of green plastics, and electric double-layer capacitors that can
recover energy from automobiles, industrial equipment, and construction
equipment and contribute to stabilizing the output of natural energy are
expected to contribute to Nisshinbo’s future growth along with other new
products. The beginnings of our environmental business can be seen in
various areas.
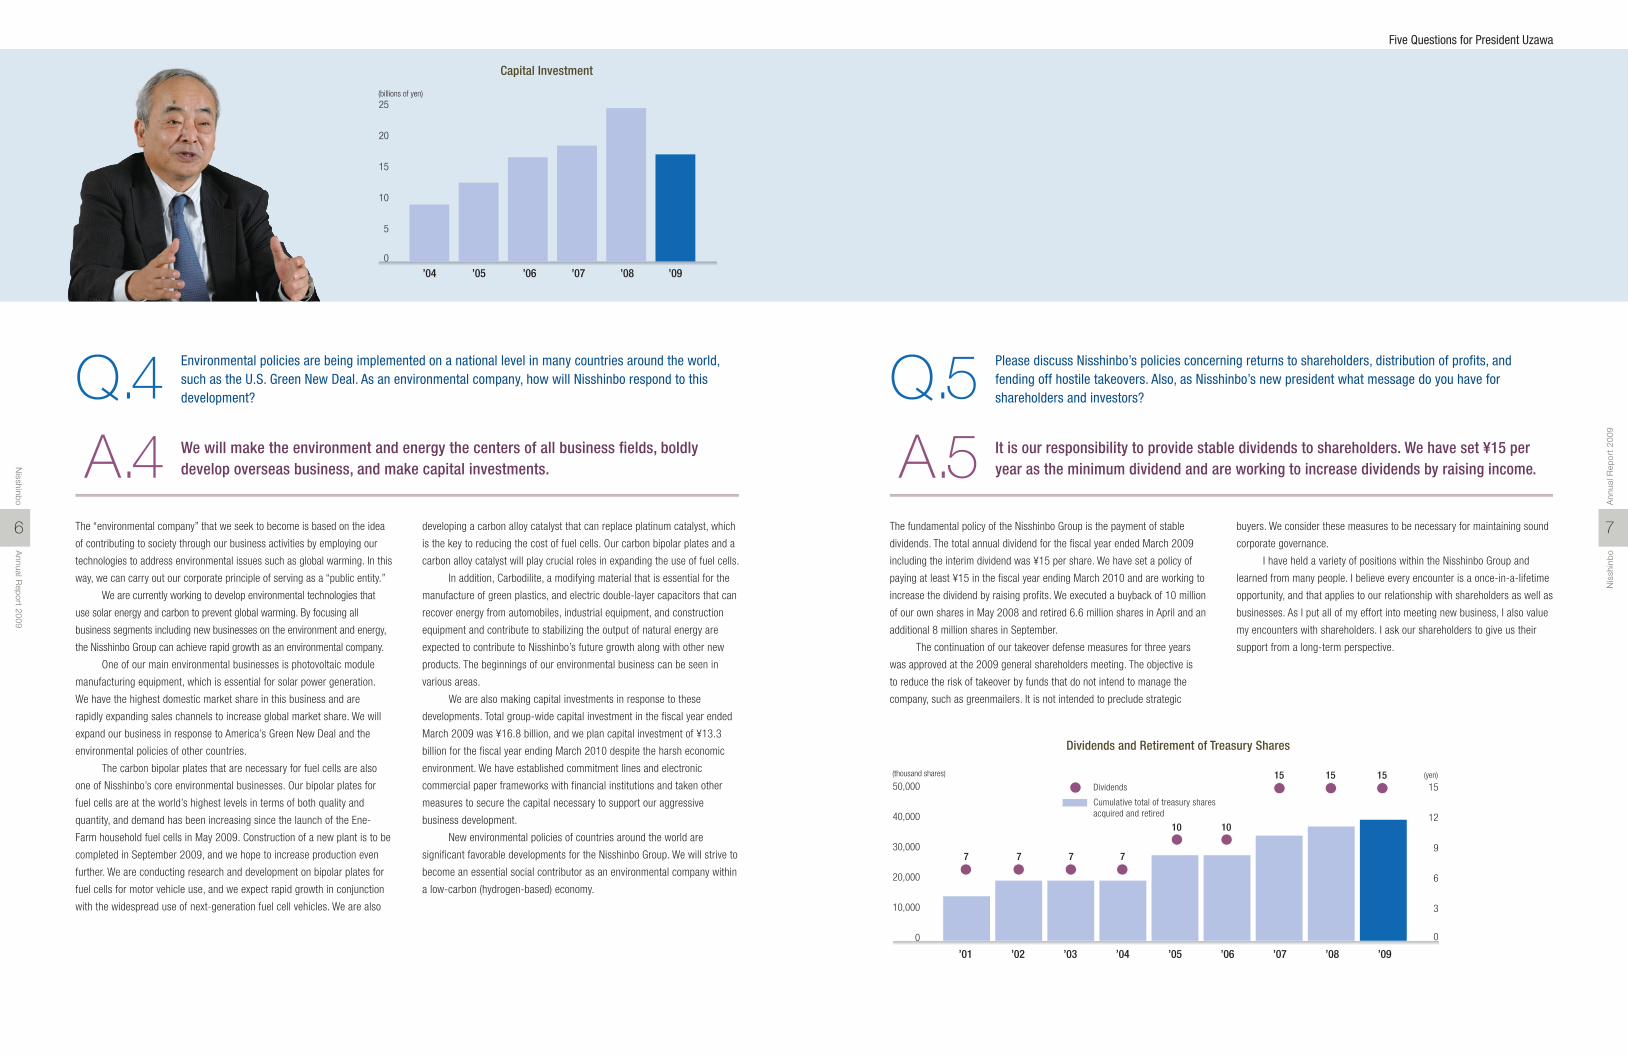
We are also making capital investments in response to these
developments. Total group-wide capital investment in the fiscal year ended
March 2009 was ¥16.8 billion, and we plan capital investment of ¥13.3
billion for the fiscal year ending March 2010 despite the harsh economic
environment. We have established commitment lines and electronic
commercial paper frameworks with financial institutions and taken other
measures to secure the capital necessary to support our aggressive
business development.
New environmental policies of countries around the world are
significant favorable developments for the Nisshinbo Group. We will strive to
become an essential social contributor as an environmental company within
a low-carbon (hydrogen-based) economy.
The fundamental policy of the Nisshinbo Group is the payment of stable
dividends. The total annual dividend for the fiscal year ended March 2009
including the interim dividend was ¥15 per share. We have set a policy of
paying at least ¥15 in the fiscal year ending March 2010 and are working to
increase the dividend by raising profits. We executed a buyback of 10 million
of our own shares in May 2008 and retired 6.6 million shares in April and an
additional 8 million shares in September.
The continuation of our takeover defense measures for three years
was approved at the 2009 general shareholders meeting. The objective is
to reduce the risk of takeover by funds that do not intend to manage the
company, such as greenmailers. It is not intended to preclude strategic
buyers. We consider these measures to be necessary for maintaining sound
corporate governance.
I have held a variety of positions within the Nisshinbo Group and
learned from many people. I believe every encounter is a once-in-a-lifetime
opportunity, and that applies to our relationship with shareholders as well as
businesses. As I put all of my effort into meeting new business, I also value
my encounters with shareholders. I ask our shareholders to give us their
support from a long-term perspective.
Q.4 Environmental policies are being implemented on a national level in many countries around the world, such as the U.S. Green New Deal. As an environmental company, how will Nisshinbo respond to this development?
A.4 We will make the environment and energy the centers of all business fields, boldly develop overseas business, and make capital investments.
Q.5 Please discuss Nisshinbo’s policies concerning returns to shareholders, distribution of profits, and fending off hostile takeovers. Also, as Nisshinbo’s new president what message do you have for shareholders and investors?
A.5 It is our responsibility to provide stable dividends to shareholders. We have set ¥15 per year as the minimum dividend and are working to increase dividends by raising income.
7
Nis
shin
bo
Ann
ual R
epor
t 20
09
6
Nisshinb
oA
nnual Rep
ort 2009
Capital Investment
’06’05’04 ’07 ’08 ’09
(billions of yen)
0
5
10
15
20
25
Dividends and Retirement of Treasury Shares
0
10,000
20,000
30,000
40,000
50,000
0
3
6
9
12
15Dividends
Cumulative total of treasury sharesacquired and retired
’05’04’01 ’02 ’03 ’06 ’07 ’08 ’09
(thousand shares) (yen)
7 7 7 7
1010
1515 15
Five Questions for President Uzawa

First, we completed construction of the Miai Machinery Plant, a specialized
photovoltaic manufacturing equipment plant in Okazaki City, Aichi
Prefecture, in April 2009. When this plant goes online, production capacity
is expected to double.
We are also working on expanding and improving our global sales
and service network. We established a business site in the Netherlands in
October 2008, bolstering our sales and service structures in the European
market, which has the world’s highest demand. In Taiwan, where sales
are expected to increase to ¥2.5 billion in the fiscal year ending March
2010, we established a local subsidiary in May 2009. In South Korea, we
began providing maintenance services by concluding a service outsourcing
agreement with a local company and plan to establish a sales base during
the fiscal year ending March 2010. We are also cooperating with local
sales companies in the Middle East and India and have started marketing
activities in these regions. In China, Asia’s largest producer country, we
opened a marketing office in Shanghai and plan to establish service sites
in the Shenzhen and Tianjin regions. In the United States, we established a
sales office on the West Coast this summer.
As that solar cell panel manufacturers adopt on-demand structures
and increase local production around the world, we are considering global
production structures for manufacturing and producing equipment overseas.
Core devices such as laminators and simulators would be produced at
mother plants in Japan such as the Miai Machinery Plant, and other units
will be produced overseas, and we would be able to reduce business risks
by operating our own plants.
The local procurement and local production model will allow us
to respond immediately to increases in overseas demand while avoiding
currency exchange rate risks and reducing costs. We have implemented
the local production concept in Taiwan as a model case and anticipate two
bases in Asia and the United States.
The photovoltaic module manufacturing line market leveled off in the fiscal
year ending March 2010, but we are confident that it will grow over the
medium- to long-term, and projects are that the market will reach ¥3 trillion
in 2030. The back-end market is expected to reach ¥120 billion in the fiscal
year ending March 2012, and we have set a target of capturing 30% of the
market or achieving sales of at least ¥30 billion. This is a very ambitious
target, but I believe we can achieve it by reacting quickly to developments
in global markets.
For example, in the United States, which is currently implementing
the Green New Deal policies, use of new energy sources centered on solar
cells is expected to become obligatory, and use of solar cells is expected
to increase to 30 GW (gigawatts) by about 2030. Total global solar cell
installations are currently 6 GW, so the United States will be using five times
that volume. Use of solar cells is likely to
expand rapidly throughout the world. We
have therefore set targets of capturing
10% of the market for back-end lines
and 30% of the market for laminators
and simulators, the key units on back-
end manufacturing lines. If we can do
this, our annual sales revenues in the
U.S. market alone will increase from
¥3 billion to ¥8 billion. We are currently
aggressively developing our global
business to achieve these targets.
Solar cell manufacturing includes the initial process (front-end) of making
the solar cells and the subsequent process (back-end) of assembling them
into a module in panel format. Nisshinbo Mechatronics Inc. produces core
back-end equipment, including solar simulators, module laminators, electro-
luminescence (EL) cell inspection equipment for detecting cracks in panels
from manufacturing, and manufacturing lines that integrate these devices,
and supplies them to manufacturers in Japan, Asia, Europe, and the United
States. In Japan, we command overwhelming market shares for laminators
(more than 70%) and simulators (more than 90%), and we have a roughly
10% share of the global market. Our product reliability and our overall
capabilities have been praised by solar cell manufacturers worldwide.
The Nisshinbo Group began developing and manufacturing
specialized machine tools in the 1940s and has built solid foundations for
producing photovoltaic module
manufacturing equipment.
Starting in 1998, we made use
of this accumulated experience
and introduced technology from
overseas to introduce simulators
and laminators to the domestic
market. The business has
experienced rapid growth over the
past 2 to 3 years.
We are also working to increase the added-value of our products so we can
establish a position of market superiority. We will propose new solar cell
sealing technologies that improve durability to increase the lifespan of solar
cells, which is currently said to be approximately 20 years, to as long as 60
or even 100 years. To do this, we are investigating the module production
and installation business in collaboration with a front-end manufacturer.
We are also developing manufacturing equipment that
allows changes in workpieces from manufacturing to be visible to
eliminate defective products. Development of products that integrate
manufacturing and inspection is proceeding, and we hope to reinforce
total solar cell manufacturing solutions by covering everything from line
design to maintenance.
Some manufacturers predict solar cells will account for 75% of all
energy in 100 years, suggesting they are a potential source of tremendous
wealth with numerous new business opportunities. We are striving to
continuously improve photovoltaic module manufacturing equipment to
meet customer needs and to make Nisshinbo Mechatronics a leading force
in the solar cell industry.
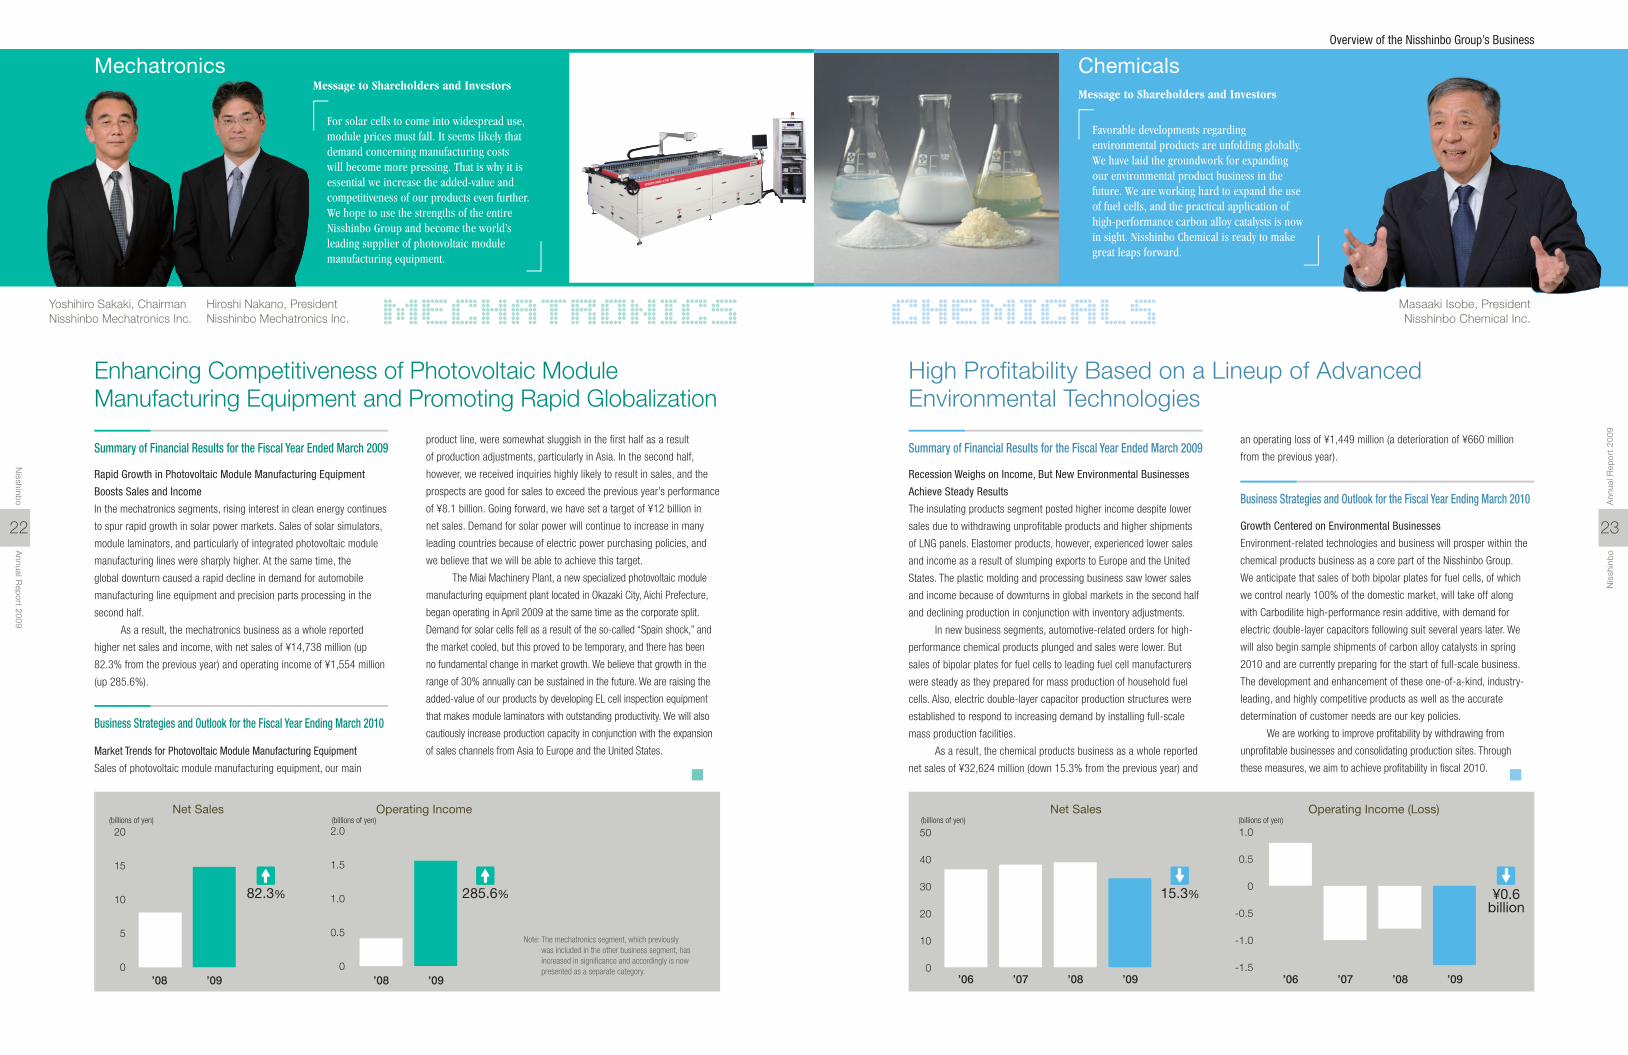
Hiroshi Nakano, PresidentNisshinbo Mechatronics Inc.
0
2,000
4,000
6,000
8,000
10,000
’09’08’07’06’05’04’03’02’01’00’99’98
’98
’05
’07
’08
’09(Sales: millions of yen)
Technology from Spire Corp. (U.S.A.) introducedand domestic sales of laminators and simulators started
Sales in Asia reinforced
Products supplied to all leading domestic manufacturersFirst orders for module manufacturing lines received
Multi-stage laminator developmentContract with Spire Corp. terminated
Sales base established in Europe
Fourth Plant begins operatingSubsidiary established in Taiwan
Sales base established in North America
Striving to Be an Environmental Company
Solar cells are attracting increasing attention around the world as a source of renewable energy that does not produce carbon dioxide and has no impact on the global environment. The Nisshinbo Group is developing its photovoltaic module manufacturing equipment business based on mechatronics technologies accumulated over half a century. Nisshinbo Mechatronics has already generated substantial income as a core business in Nisshinbo’s environmental strategy. Hiroshi Nakano, President of Nisshinbo Mechatronics Inc., discusses the current status and future prospects of the rapidly growing manufacturing equipment business.
U.S.A.Sales base established
in July 2009South Korea
Maintenance services begin under outsourcingagreement with local company
Taiwan
Local subsidiary establishedin May 2009
Netherlands
Sales base establishedin October 2008
India
Middle East
Cooperation with local sales companyMarketing activities start
China
Site established in ShanghaiSites planned for Shenzhen and Tianjin
Sales and Business Plan
Global Sales and Service Sites
Becoming a Leading Player in the Solar Cell Business, a Key Factor in Renewable Energy
Feature
Photovoltaic Module Manufacturing Equipment
1ANSWER
The Leading Domestic Back-End Manufacturer We Aim to Control 30% of the Rapidly Growing Back-End Market
Aggressive Manufacturing and Sales Strategiesto Win Global Markets
Total Photovoltaic Module Manufacturing Equipment Solutions Supported by High Added-Value
Projection of PhotovoltaicModule ManufacturingLine Market in 2022
Projection of PhotovoltaicModule ManufacturingLine Market in 2010
¥2,835 billion
Back-endprocess
¥405 billion
Front-end(film formation) process
¥280 billion
¥40 billion
Back-endprocess
Front-end(film formation) process
Scale of Markets for Solar CellManufacturing Equipment in the Future
9
Nis
shin
bo
Ann
ual R
epor
t 20
09
8
Nisshinb
oA
nnual Rep
ort 2009
A Thin-Film Photovoltaic Module Manufacturing Line
Striving to Be an Environmental CompanyFeature
11
Nis
shin
bo
Ann
ual R
epor
t 20
09
10
Nisshinb
oA
nnual Rep
ort 2009
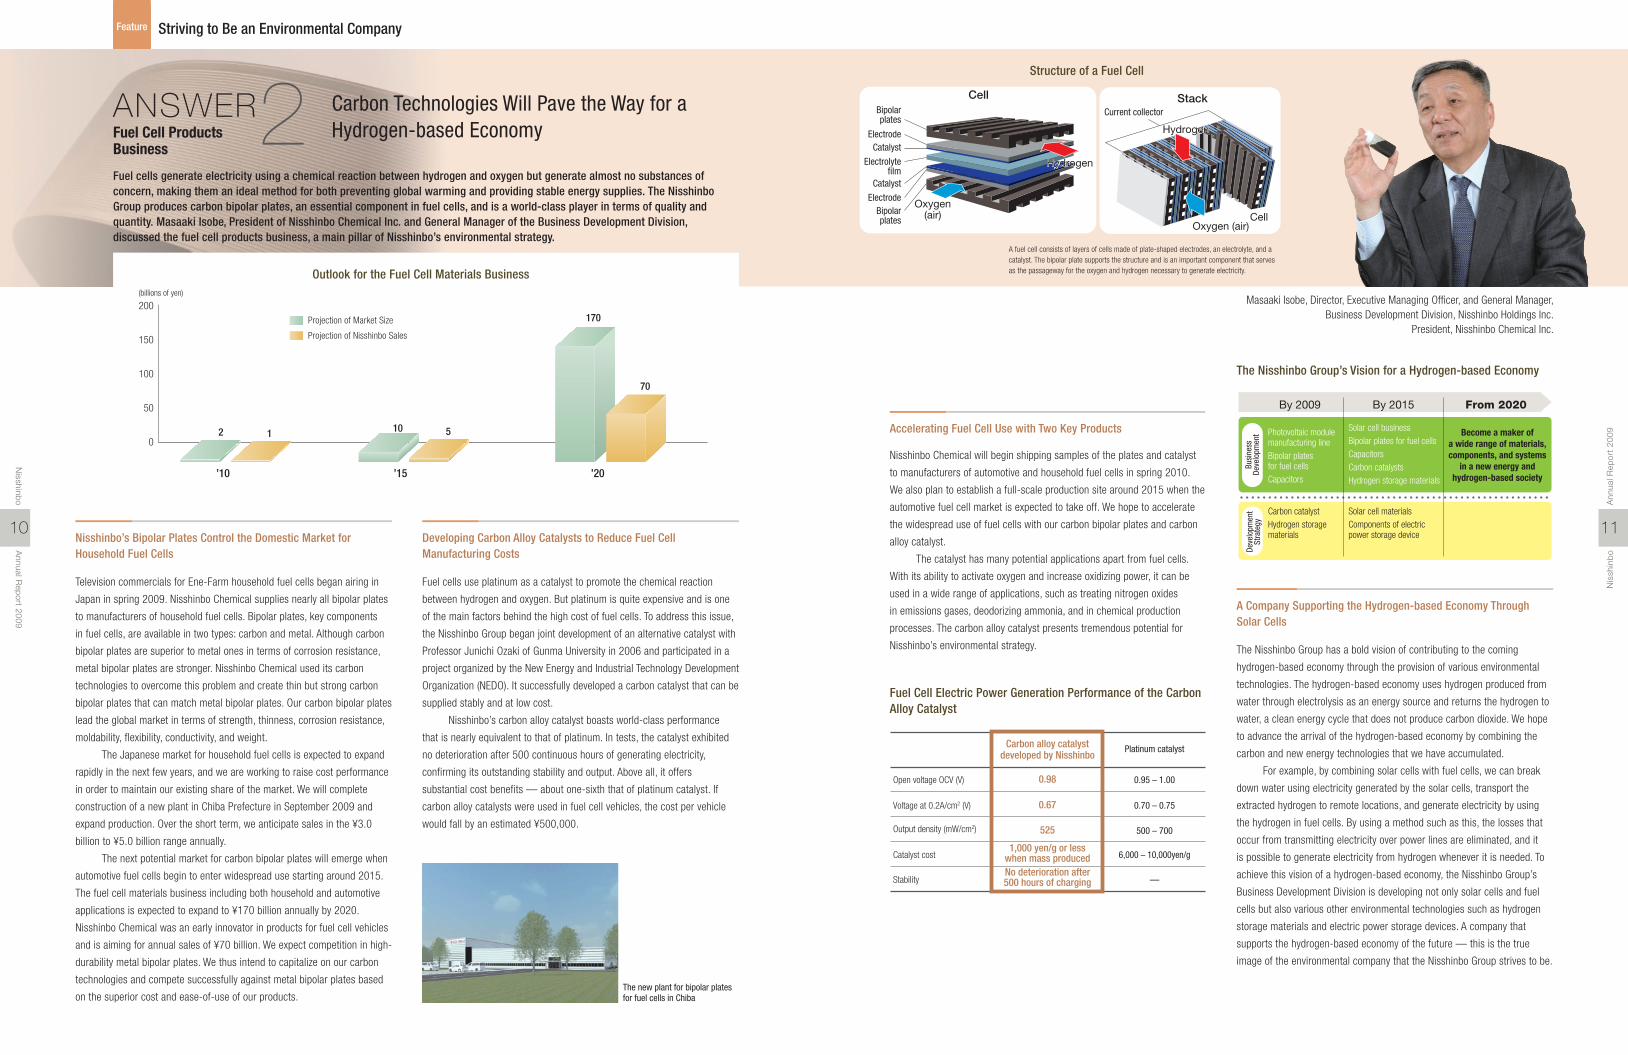
Fuel cells generate electricity using a chemical reaction between hydrogen and oxygen but generate almost no substances of concern, making them an ideal method for both preventing global warming and providing stable energy supplies. The Nisshinbo Group produces carbon bipolar plates, an essential component in fuel cells, and is a world-class player in terms of quality and quantity. Masaaki Isobe, President of Nisshinbo Chemical Inc. and General Manager of the Business Development Division, discussed the fuel cell products business, a main pillar of Nisshinbo’s environmental strategy.
Carbon Technologies Will Pave the Way for a Hydrogen-based EconomyFuel Cell Products
Business2ANSWER
Masaaki Isobe, Director, Executive Managing Officer, and General Manager,Business Development Division, Nisshinbo Holdings Inc.
President, Nisshinbo Chemical Inc.
Nisshinbo Chemical will begin shipping samples of the plates and catalyst
to manufacturers of automotive and household fuel cells in spring 2010.
We also plan to establish a full-scale production site around 2015 when the
automotive fuel cell market is expected to take off. We hope to accelerate
the widespread use of fuel cells with our carbon bipolar plates and carbon
alloy catalyst.
The catalyst has many potential applications apart from fuel cells.
With its ability to activate oxygen and increase oxidizing power, it can be
used in a wide range of applications, such as treating nitrogen oxides
in emissions gases, deodorizing ammonia, and in chemical production
processes. The carbon alloy catalyst presents tremendous potential for
Nisshinbo’s environmental strategy.
Fuel cells use platinum as a catalyst to promote the chemical reaction
between hydrogen and oxygen. But platinum is quite expensive and is one
of the main factors behind the high cost of fuel cells. To address this issue,
the Nisshinbo Group began joint development of an alternative catalyst with
Professor Junichi Ozaki of Gunma University in 2006 and participated in a
project organized by the New Energy and Industrial Technology Development
Organization (NEDO). It successfully developed a carbon catalyst that can be
supplied stably and at low cost.
Nisshinbo’s carbon alloy catalyst boasts world-class performance
that is nearly equivalent to that of platinum. In tests, the catalyst exhibited
no deterioration after 500 continuous hours of generating electricity,
confirming its outstanding stability and output. Above all, it offers
substantial cost benefits — about one-sixth that of platinum catalyst. If
carbon alloy catalysts were used in fuel cell vehicles, the cost per vehicle
would fall by an estimated ¥500,000.
Television commercials for Ene-Farm household fuel cells began airing in
Japan in spring 2009. Nisshinbo Chemical supplies nearly all bipolar plates
to manufacturers of household fuel cells. Bipolar plates, key components
in fuel cells, are available in two types: carbon and metal. Although carbon
bipolar plates are superior to metal ones in terms of corrosion resistance,
metal bipolar plates are stronger. Nisshinbo Chemical used its carbon
technologies to overcome this problem and create thin but strong carbon
bipolar plates that can match metal bipolar plates. Our carbon bipolar plates
lead the global market in terms of strength, thinness, corrosion resistance,
moldability, flexibility, conductivity, and weight.
The Japanese market for household fuel cells is expected to expand
rapidly in the next few years, and we are working to raise cost performance
in order to maintain our existing share of the market. We will complete
construction of a new plant in Chiba Prefecture in September 2009 and
expand production. Over the short term, we anticipate sales in the ¥3.0
billion to ¥5.0 billion range annually.
The next potential market for carbon bipolar plates will emerge when
automotive fuel cells begin to enter widespread use starting around 2015.
The fuel cell materials business including both household and automotive
applications is expected to expand to ¥170 billion annually by 2020.
Nisshinbo Chemical was an early innovator in products for fuel cell vehicles
and is aiming for annual sales of ¥70 billion. We expect competition in high-
durability metal bipolar plates. We thus intend to capitalize on our carbon
technologies and compete successfully against metal bipolar plates based
on the superior cost and ease-of-use of our products.
The Nisshinbo Group has a bold vision of contributing to the coming
hydrogen-based economy through the provision of various environmental
technologies. The hydrogen-based economy uses hydrogen produced from
water through electrolysis as an energy source and returns the hydrogen to
water, a clean energy cycle that does not produce carbon dioxide. We hope
to advance the arrival of the hydrogen-based economy by combining the
carbon and new energy technologies that we have accumulated.
For example, by combining solar cells with fuel cells, we can break
down water using electricity generated by the solar cells, transport the
extracted hydrogen to remote locations, and generate electricity by using
the hydrogen in fuel cells. By using a method such as this, the losses that
occur from transmitting electricity over power lines are eliminated, and it
is possible to generate electricity from hydrogen whenever it is needed. To
achieve this vision of a hydrogen-based economy, the Nisshinbo Group’s
Business Development Division is developing not only solar cells and fuel
cells but also various other environmental technologies such as hydrogen
storage materials and electric power storage devices. A company that
supports the hydrogen-based economy of the future — this is the true
image of the environmental company that the Nisshinbo Group strives to be.
’10
0
50
100
150
200
’15
2 1 10 5
170
70
’20
Projection of Market Size
Projection of Nisshinbo Sales
(billions of yen)
Hydrogen
Current collector
CellOxygen
(air)Oxygen (air)
Bipolarplates
ElectrodeCatalyst
Electrolytefilm
Catalyst
ElectrodeBipolarplates
Cell Stack
Hydrogen
HydrogenHydrogen
Outlook for the Fuel Cell Materials Business
Structure of a Fuel Cell
Nisshinbo’s Bipolar Plates Control the Domestic Market for Household Fuel Cells
Developing Carbon Alloy Catalysts to Reduce Fuel Cell Manufacturing Costs
Accelerating Fuel Cell Use with Two Key Products
A Company Supporting the Hydrogen-based Economy Through Solar Cells
Fuel Cell Electric Power Generation Performance of the Carbon Alloy Catalyst
The Nisshinbo Group’s Vision for a Hydrogen-based Economy
A fuel cell consists of layers of cells made of plate-shaped electrodes, an electrolyte, and a catalyst. The bipolar plate supports the structure and is an important component that serves as the passageway for the oxygen and hydrogen necessary to generate electricity.
Open voltage OCV (V)
Carbon alloy catalystdeveloped by Nisshinbo
Platinum catalyst
0.98 0.95 – 1.00
Voltage at 0.2A/cm2 (V) 0.67 0.70 – 0.75
Output density (mW/cm2) 525 500 – 700
Catalyst cost1,000 yen/g or less
when mass produced 6,000 – 10,000yen/g
StabilityNo deterioration after500 hours of charging —
Photovoltaic modulemanufacturing lineBipolar platesfor fuel cellsCapacitors
Solar cell businessBipolar plates for fuel cellsCapacitorsCarbon catalystsHydrogen storage materials
Become a maker ofa wide range of materials,components, and systems
in a new energy andhydrogen-based society
By 2009 By 2015 From 2020
Carbon catalystHydrogen storagematerials
Solar cell materialsComponents of electricpower storage device
Busi
ness
Deve
lopm
ent
Deve
lopm
ent
Stra
tegy
The new plant for bipolar plates for fuel cells in Chiba
Striving to Be an Environmental CompanyFeature
13
Nis
shin
bo
Ann
ual R
epor
t 20
09
12
Nisshinb
oA
nnual Rep
ort 2009
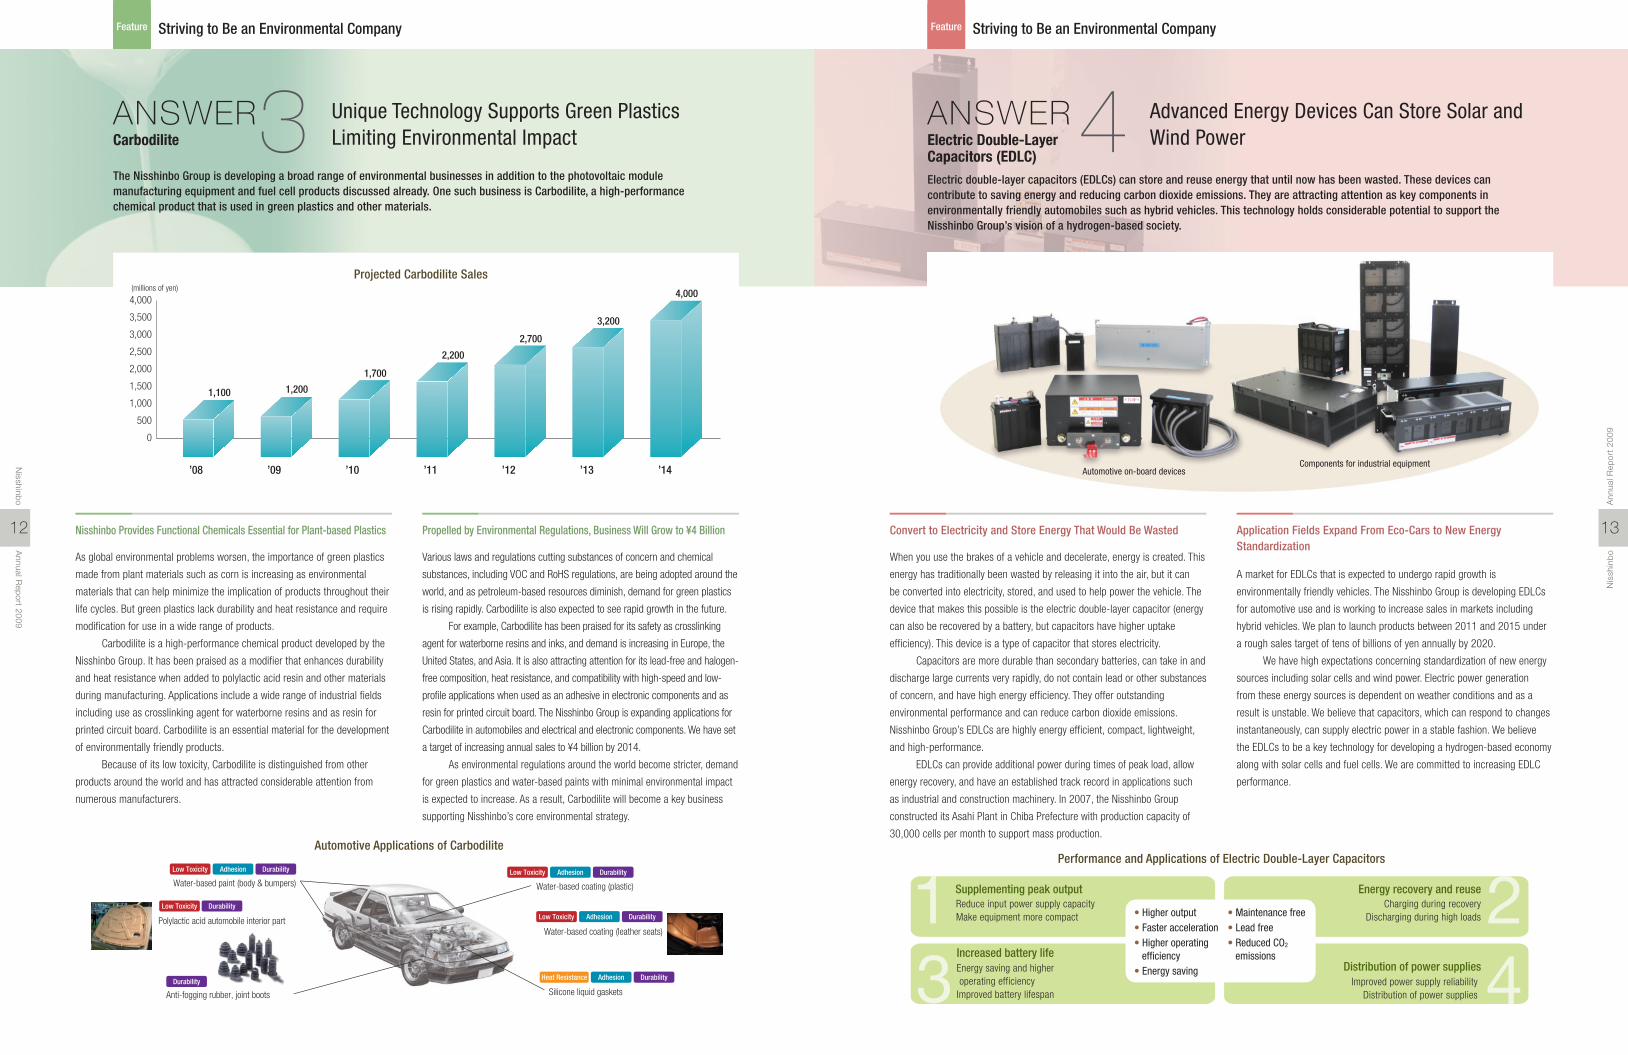
The Nisshinbo Group is developing a broad range of environmental businesses in addition to the photovoltaic module manufacturing equipment and fuel cell products discussed already. One such business is Carbodilite, a high-performance chemical product that is used in green plastics and other materials.
Unique Technology Supports Green Plastics Limiting Environmental ImpactCarbodilite 3ANSWER
Electric double-layer capacitors (EDLCs) can store and reuse energy that until now has been wasted. These devices can contribute to saving energy and reducing carbon dioxide emissions. They are attracting attention as key components in environmentally friendly automobiles such as hybrid vehicles. This technology holds considerable potential to support the Nisshinbo Group’s vision of a hydrogen-based society.
Advanced Energy Devices Can Store Solar and Wind PowerElectric Double-Layer
Capacitors (EDLC)4ANSWER
Various laws and regulations cutting substances of concern and chemical
substances, including VOC and RoHS regulations, are being adopted around the
world, and as petroleum-based resources diminish, demand for green plastics
is rising rapidly. Carbodilite is also expected to see rapid growth in the future.
For example, Carbodilite has been praised for its safety as crosslinking
agent for waterborne resins and inks, and demand is increasing in Europe, the
United States, and Asia. It is also attracting attention for its lead-free and halogen-
free composition, heat resistance, and compatibility with high-speed and low-
profile applications when used as an adhesive in electronic components and as
resin for printed circuit board. The Nisshinbo Group is expanding applications for
Carbodilite in automobiles and electrical and electronic components. We have set
a target of increasing annual sales to ¥4 billion by 2014.
As environmental regulations around the world become stricter, demand
for green plastics and water-based paints with minimal environmental impact
is expected to increase. As a result, Carbodilite will become a key business
supporting Nisshinbo’s core environmental strategy.
As global environmental problems worsen, the importance of green plastics
made from plant materials such as corn is increasing as environmental
materials that can help minimize the implication of products throughout their
life cycles. But green plastics lack durability and heat resistance and require
modification for use in a wide range of products.
Carbodilite is a high-performance chemical product developed by the
Nisshinbo Group. It has been praised as a modifier that enhances durability
and heat resistance when added to polylactic acid resin and other materials
during manufacturing. Applications include a wide range of industrial fields
including use as crosslinking agent for waterborne resins and as resin for
printed circuit board. Carbodilite is an essential material for the development
of environmentally friendly products.
Because of its low toxicity, Carbodilite is distinguished from other
products around the world and has attracted considerable attention from
numerous manufacturers.
’14’13’12’11’10’09’08
1,100 1,200
1,700
2,200
2,700
3,200
4,000(millions of yen)
0
500
1,000
1,500
2,000
2,500
3,000
3,500
4,000
Projected Carbodilite Sales
Nisshinbo Provides Functional Chemicals Essential for Plant-based Plastics Propelled by Environmental Regulations, Business Will Grow to ¥4 Billion
A market for EDLCs that is expected to undergo rapid growth is
environmentally friendly vehicles. The Nisshinbo Group is developing EDLCs
for automotive use and is working to increase sales in markets including
hybrid vehicles. We plan to launch products between 2011 and 2015 under
a rough sales target of tens of billions of yen annually by 2020.
We have high expectations concerning standardization of new energy
sources including solar cells and wind power. Electric power generation
from these energy sources is dependent on weather conditions and as a
result is unstable. We believe that capacitors, which can respond to changes
instantaneously, can supply electric power in a stable fashion. We believe
the EDLCs to be a key technology for developing a hydrogen-based economy
along with solar cells and fuel cells. We are committed to increasing EDLC
performance.
When you use the brakes of a vehicle and decelerate, energy is created. This
energy has traditionally been wasted by releasing it into the air, but it can
be converted into electricity, stored, and used to help power the vehicle. The
device that makes this possible is the electric double-layer capacitor (energy
can also be recovered by a battery, but capacitors have higher uptake
efficiency). This device is a type of capacitor that stores electricity.
Capacitors are more durable than secondary batteries, can take in and
discharge large currents very rapidly, do not contain lead or other substances
of concern, and have high energy efficiency. They offer outstanding
environmental performance and can reduce carbon dioxide emissions.
Nisshinbo Group’s EDLCs are highly energy efficient, compact, lightweight,
and high-performance.
EDLCs can provide additional power during times of peak load, allow
energy recovery, and have an established track record in applications such
as industrial and construction machinery. In 2007, the Nisshinbo Group
constructed its Asahi Plant in Chiba Prefecture with production capacity of
30,000 cells per month to support mass production.
Performance and Applications of Electric Double-Layer Capacitors
Convert to Electricity and Store Energy That Would Be Wasted Application Fields Expand From Eco-Cars to New Energy Standardization
Feature Striving to Be an Environmental Company
Distribution of power supplies4Increased battery life
3
Energy recovery and reuse2Supplementing peak outputReduce input power supply capacityMake equipment more compact
Energy saving and higher operating efficiencyImproved battery lifespan
Charging during recoveryDischarging during high loads
Improved power supply reliabilityDistribution of power supplies
1 • Higher output• Faster acceleration• Higher operating efficiency• Energy saving
• Maintenance free• Lead free• Reduced CO2
emissions
Water-based paint (body & bumpers)
Anti-fogging rubber, joint boots
Water-based coating (plastic)
Water-based coating (leather seats)
Silicone liquid gaskets
Low Toxicity Adhesion Durability Low Toxicity Adhesion Durability
Low Toxicity Adhesion Durability
Heat Resistance Adhesion Durability
Low Toxicity Durability
Durability
Polylactic acid automobile interior part
Automotive Applications of Carbodilite
Components for industrial equipmentAutomotive on-board devices
15
Nis
shin
bo
Ann
ual R
epor
t 20
09
14
Nisshinb
oA
nnual Rep
ort 2009
Overview and Business Results of Individual Business Segments
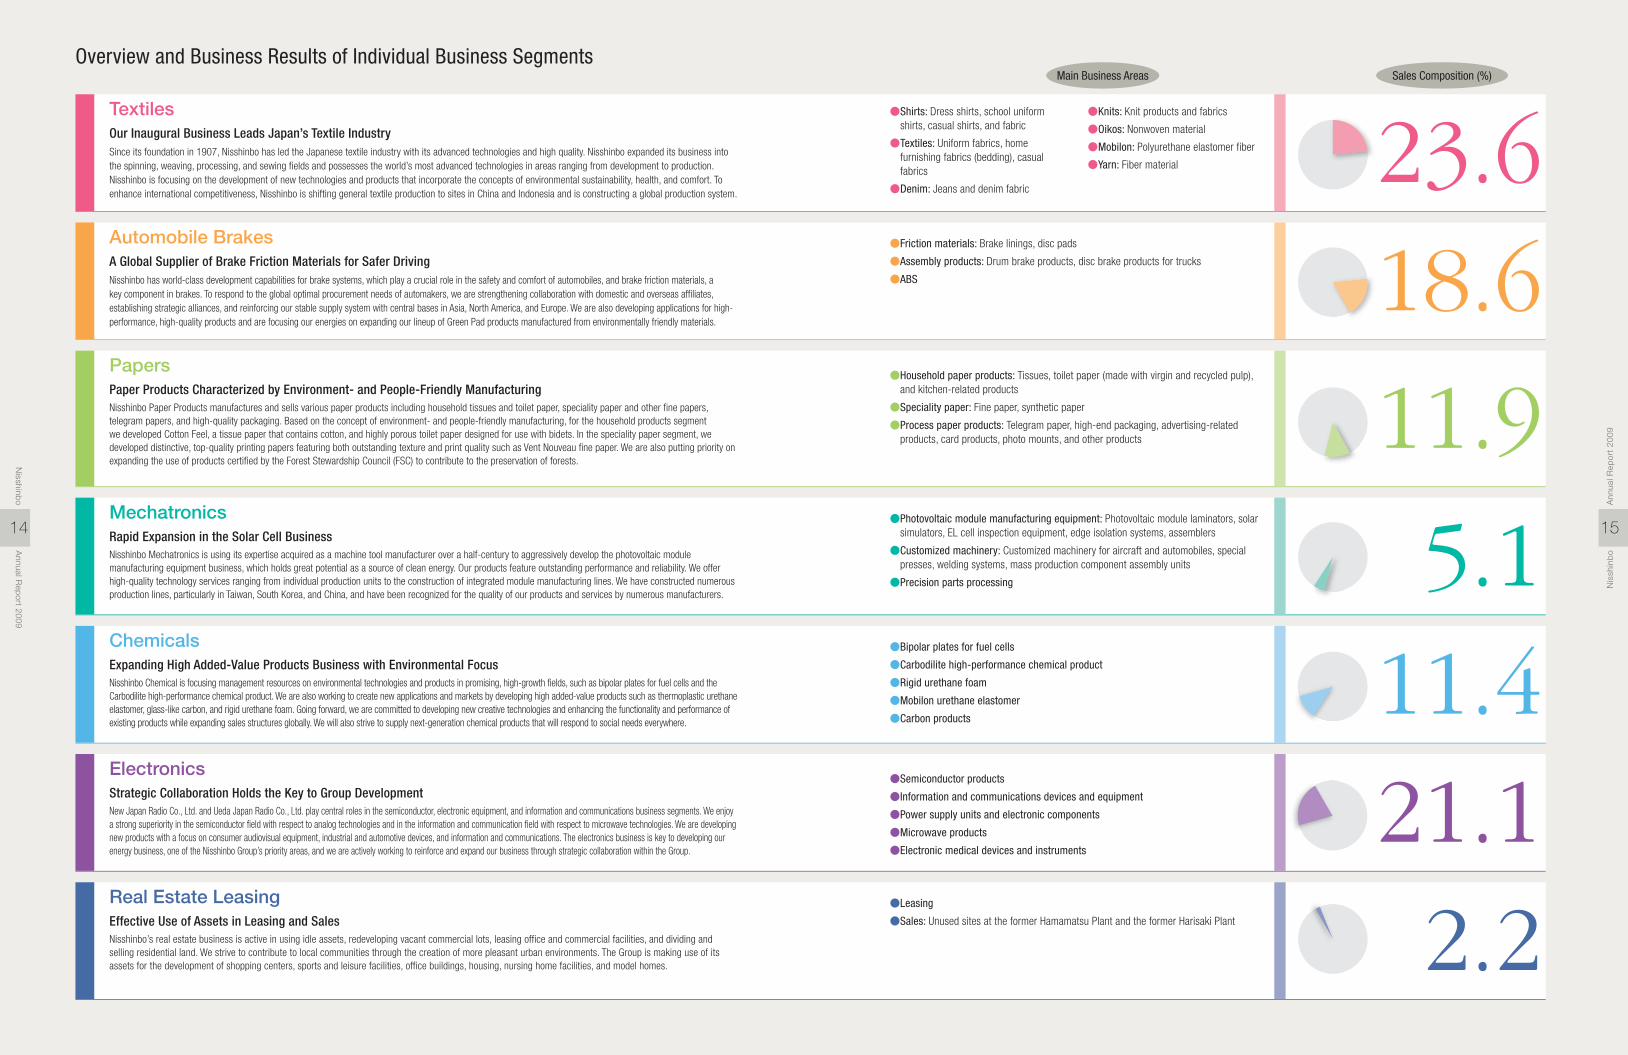
TextilesOur Inaugural Business Leads Japan’s Textile IndustrySince its foundation in 1907, Nisshinbo has led the Japanese textile industry with its advanced technologies and high quality. Nisshinbo expanded its business into the spinning, weaving, processing, and sewing fields and possesses the world’s most advanced technologies in areas ranging from development to production. Nisshinbo is focusing on the development of new technologies and products that incorporate the concepts of environmental sustainability, health, and comfort. To enhance international competitiveness, Nisshinbo is shifting general textile production to sites in China and Indonesia and is constructing a global production system.
Automobile BrakesA Global Supplier of Brake Friction Materials for Safer DrivingNisshinbo has world-class development capabilities for brake systems, which play a crucial role in the safety and comfort of automobiles, and brake friction materials, a key component in brakes. To respond to the global optimal procurement needs of automakers, we are strengthening collaboration with domestic and overseas affiliates, establishing strategic alliances, and reinforcing our stable supply system with central bases in Asia, North America, and Europe. We are also developing applications for high-performance, high-quality products and are focusing our energies on expanding our lineup of Green Pad products manufactured from environmentally friendly materials.
PapersPaper Products Characterized by Environment- and People-Friendly ManufacturingNisshinbo Paper Products manufactures and sells various paper products including household tissues and toilet paper, speciality paper and other fine papers, telegram papers, and high-quality packaging. Based on the concept of environment- and people-friendly manufacturing, for the household products segment we developed Cotton Feel, a tissue paper that contains cotton, and highly porous toilet paper designed for use with bidets. In the speciality paper segment, we developed distinctive, top-quality printing papers featuring both outstanding texture and print quality such as Vent Nouveau fine paper. We are also putting priority on expanding the use of products certified by the Forest Stewardship Council (FSC) to contribute to the preservation of forests.
ChemicalsExpanding High Added-Value Products Business with Environmental FocusNisshinbo Chemical is focusing management resources on environmental technologies and products in promising, high-growth fields, such as bipolar plates for fuel cells and the Carbodilite high-performance chemical product. We are also working to create new applications and markets by developing high added-value products such as thermoplastic urethane elastomer, glass-like carbon, and rigid urethane foam. Going forward, we are committed to developing new creative technologies and enhancing the functionality and performance of existing products while expanding sales structures globally. We will also strive to supply next-generation chemical products that will respond to social needs everywhere.
Real Estate LeasingEffective Use of Assets in Leasing and SalesNisshinbo’s real estate business is active in using idle assets, redeveloping vacant commercial lots, leasing office and commercial facilities, and dividing and selling residential land. We strive to contribute to local communities through the creation of more pleasant urban environments. The Group is making use of its assets for the development of shopping centers, sports and leisure facilities, office buildings, housing, nursing home facilities, and model homes.
● Shirts: Dress shirts, school uniform shirts, casual shirts, and fabric
● Textiles: Uniform fabrics, home furnishing fabrics (bedding), casual fabrics
●Denim: Jeans and denim fabric
●Knits: Knit products and fabrics
●Oikos: Nonwoven material
●Mobilon: Polyurethane elastomer fiber
●Yarn: Fiber material
●Friction materials: Brake linings, disc pads
●Assembly products: Drum brake products, disc brake products for trucks
●ABS
● Household paper products: Tissues, toilet paper (made with virgin and recycled pulp), and kitchen-related products
●Speciality paper: Fine paper, synthetic paper
● Process paper products: Telegram paper, high-end packaging, advertising-related products, card products, photo mounts, and other products
●Bipolar plates for fuel cells
●Carbodilite high-performance chemical product
●Rigid urethane foam
●Mobilon urethane elastomer
●Carbon products
●Leasing
●Sales: Unused sites at the former Hamamatsu Plant and the former Harisaki Plant
Main Business Areas Sales Composition (%)
18.6
11.9
11.4
2.2
23.6
ElectronicsStrategic Collaboration Holds the Key to Group DevelopmentNew Japan Radio Co., Ltd. and Ueda Japan Radio Co., Ltd. play central roles in the semiconductor, electronic equipment, and information and communications business segments. We enjoy a strong superiority in the semiconductor field with respect to analog technologies and in the information and communication field with respect to microwave technologies. We are developing new products with a focus on consumer audiovisual equipment, industrial and automotive devices, and information and communications. The electronics business is key to developing our energy business, one of the Nisshinbo Group’s priority areas, and we are actively working to reinforce and expand our business through strategic collaboration within the Group.
●Semiconductor products
●Information and communications devices and equipment
●Power supply units and electronic components
●Microwave products
●Electronic medical devices and instruments21.1
MechatronicsRapid Expansion in the Solar Cell BusinessNisshinbo Mechatronics is using its expertise acquired as a machine tool manufacturer over a half-century to aggressively develop the photovoltaic module manufacturing equipment business, which holds great potential as a source of clean energy. Our products feature outstanding performance and reliability. We offer high-quality technology services ranging from individual production units to the construction of integrated module manufacturing lines. We have constructed numerous production lines, particularly in Taiwan, South Korea, and China, and have been recognized for the quality of our products and services by numerous manufacturers.
● Photovoltaic module manufacturing equipment: Photovoltaic module laminators, solar simulators, EL cell inspection equipment, edge isolation systems, assemblers
● Customized machinery: Customized machinery for aircraft and automobiles, special presses, welding systems, mass production component assembly units
●Precision parts processing 5.1
Overview of the Nisshinbo Group’s Business
Sluggish Personal Consumption Leads to Lower Revenues and Income;
Overseas Business Shows Positive Signs
The textile business continued to face an extremely difficult business
environment including a substantial drop in demand for finished
clothing products along with sluggish personal consumption caused by
the economic recession.
In Japan, uniform fabrics generated higher income due to efforts
to lower costs. However, sales of shirt fabrics and spandex products fell
in both the domestic and overseas markets. Sales of denim were weak
because of slumping sales to major jeans makers, and as a result both
sales revenues and income were down.
Overseas, P.T. Gistex Nisshinbo Indonesia’s sales and income
declined because of higher raw materials and fuel costs and other
factors. Nisshinbo Do Brasil Industria Textil LTDA. performed well,
though, while P.T. Nikawa Textile Industry in Indonesia reported lower
sales but higher income as a result of shifting from unprofitable
products to high added-value products.
As a result, the textile business as a whole recorded lower net
sales and lower income, with net sales of ¥67,593 million (down 14.3%
from the previous year) and an operating loss of ¥2,743 million (a
deterioration of ¥1,527 million from the previous year).
An Organization That Integrates Manufacturing and Sales
At the time of the corporate split, the textile business carefully
examined and reviewed the content of its business and took measures
to eliminate all waste including withdrawal from unprofitable
businesses. Amid the ongoing deterioration of the business
environment, the transition to an organization that can generate profits
Reforms, New Products to Power Return toProfitability Following the Split
Textiles
Summary of Financial Results for the Fiscal Year Ended March 2009
Business Strategies and Outlook for the Fiscal Year Ending March 2010
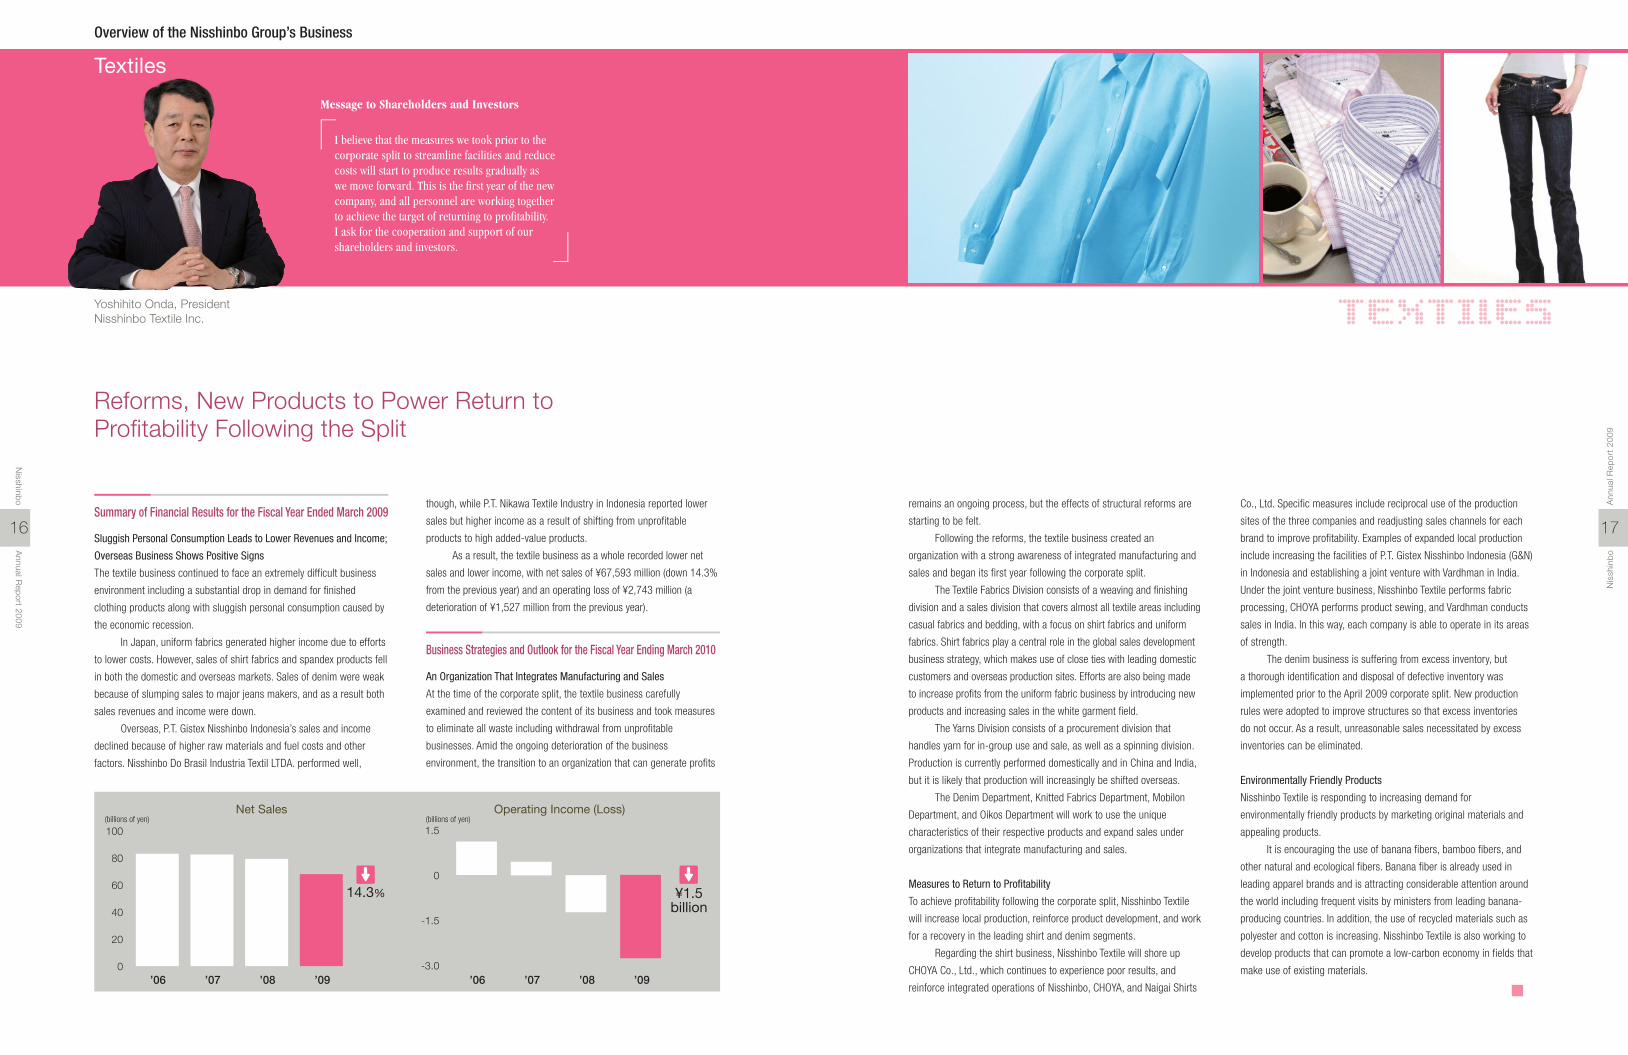
Yoshihito Onda, PresidentNisshinbo Textile Inc.
0
20
40
60
80
100
’06 ’07 ’08 ’09 ’06 ’07 ’08 ’09
14.3%
(billions of yen)
-3.0
-1.5
0
1.5
¥1.5billion
(billions of yen)Net Sales Operating Income (Loss)
17
Nis
shin
bo
Ann
ual R
epor
t 20
09
16
Nisshinb
oA
nnual Rep
ort 2009
TEXTIlES
remains an ongoing process, but the effects of structural reforms are
starting to be felt.
Following the reforms, the textile business created an
organization with a strong awareness of integrated manufacturing and
sales and began its first year following the corporate split.
The Textile Fabrics Division consists of a weaving and finishing
division and a sales division that covers almost all textile areas including
casual fabrics and bedding, with a focus on shirt fabrics and uniform
fabrics. Shirt fabrics play a central role in the global sales development
business strategy, which makes use of close ties with leading domestic
customers and overseas production sites. Efforts are also being made
to increase profits from the uniform fabric business by introducing new
products and increasing sales in the white garment field.
The Yarns Division consists of a procurement division that
handles yarn for in-group use and sale, as well as a spinning division.
Production is currently performed domestically and in China and India,
but it is likely that production will increasingly be shifted overseas.
The Denim Department, Knitted Fabrics Department, Mobilon
Department, and Oikos Department will work to use the unique
characteristics of their respective products and expand sales under
organizations that integrate manufacturing and sales.
Measures to Return to Profitability
To achieve profitability following the corporate split, Nisshinbo Textile
will increase local production, reinforce product development, and work
for a recovery in the leading shirt and denim segments.
Regarding the shirt business, Nisshinbo Textile will shore up
CHOYA Co., Ltd., which continues to experience poor results, and
reinforce integrated operations of Nisshinbo, CHOYA, and Naigai Shirts
Co., Ltd. Specific measures include reciprocal use of the production
sites of the three companies and readjusting sales channels for each
brand to improve profitability. Examples of expanded local production
include increasing the facilities of P.T. Gistex Nisshinbo Indonesia (G&N)
in Indonesia and establishing a joint venture with Vardhman in India.
Under the joint venture business, Nisshinbo Textile performs fabric
processing, CHOYA performs product sewing, and Vardhman conducts
sales in India. In this way, each company is able to operate in its areas
of strength.
The denim business is suffering from excess inventory, but
a thorough identification and disposal of defective inventory was
implemented prior to the April 2009 corporate split. New production
rules were adopted to improve structures so that excess inventories
do not occur. As a result, unreasonable sales necessitated by excess
inventories can be eliminated.
Environmentally Friendly Products
Nisshinbo Textile is responding to increasing demand for
environmentally friendly products by marketing original materials and
appealing products.
It is encouraging the use of banana fibers, bamboo fibers, and
other natural and ecological fibers. Banana fiber is already used in
leading apparel brands and is attracting considerable attention around
the world including frequent visits by ministers from leading banana-
producing countries. In addition, the use of recycled materials such as
polyester and cotton is increasing. Nisshinbo Textile is also working to
develop products that can promote a low-carbon economy in fields that
make use of existing materials.
Message to Shareholders and Investors
I believe that the measures we took prior to the corporate split to streamline facilities and reduce costs will start to produce results gradually as we move forward. This is the first year of the new company, and all personnel are working together to achieve the target of returning to profitability. I ask for the cooperation and support of our shareholders and investors.

Overview of the Nisshinbo Group’s Business
Plummeting Automobile Sales Worldwide Drive Net Sales and
Income Down
Net sales of brake products in Japan and by our subsidiaries abroad
fell as domestic and overseas production by Japanese and South
Korean manufacturers plunged amid the deepening global recession
and declining auto sales in Japan, North America, and emerging
markets in the second half. Also, factors including higher domestic
depreciation costs in conjunction with a review of the useful lives of
assets at the time of changes to the tax system pushed operating
income down substantially.
ABS products also posted lower net sales and income as a result
of the completion of the transfer of business to Continental Automotive
Corporation, a joint venture company, at the end of December 2008.
As a result, the automobile brake business as a whole reported
lower net sales and lower income, with net sales of ¥53,261 million
(down 19.8% from the previous year) and operating income of ¥3,310
million (down 62.7% from the previous year).
Transforming to Profitable Structures in Difficult Times
The current economic recession, said to be a once-in-a-century
occurrence, has had a severe impact on the automobile industry. At this
time there are no signs of recovery in production for domestic sales
or export. The brake business has grown in step with the growth and
global expansion of Japanese automobile manufacturers. It has made
significant contributions to the profitability of the Nisshinbo Group, so
the rapid decline in orders since October 2008 represents a drastic
change in the business environment.
In response, the brake business proposed the rapid
Urgently Raising Cost Competitiveness Ahead of Production Recovery at Automakers
establishment of a “70% structure”* in November 2008. Considering
that the downturn is the result of extreme change in the demand
structure and an unprecedented drop in automobile demand throughout
the world, it may be some time before demand returns to previous
levels, particularly in developed countries. Thus, we reorganized our
business structures so we can generate a profit even with orders at
levels lower than they have been in the past.
Specifically, we are constructing flexible production structures
that can adapt to changes in order volumes, eliminating all non-
essential and non-urgent investment, and implementing cost-
cutting measures with no areas off-limits. Overseas business
sites are implementing similar measures to reduce fixed costs,
increasing local procurement of raw materials and components and
streamlining production sites according to the cost structures of
each site. More than six months have passed since these reform
measures went into effect, and we are starting to see some results
both in Japan and abroad.
Advancing in Emerging Markets
In addition to structural reforms, we are making active advances into
emerging countries, which are expected to act as a driving force for
new demand when automobile markets recover. For example, Japanese
and Korean makers have established full-scale operations in India. In
1984 we concluded a technology support agreement with Rane Brake
Lining Ltd. (RBL), the leading friction material manufacturer in India. In
1996, we acquired 10% of RBL’s shares, and we are now cooperating
with RBL to expand sales in the Indian market. We plan to increase our
holdings of RBL shares to strengthen our relationship.
We are committed to making the most of our good relationships
with Japanese and Korean makers and maintaining our leadership
position while developing cost-competitive products tailored to
specific markets.
New Friction Materials for Next-Generation Automobile Technologies
The next-generation brake systems needed by hybrid vehicles, electric
vehicles, and fuel cell vehicles will vary greatly depending on advances
in automotive electronic controls and trends in the use of electronic
components. Auto parts manufacturers are focusing technology
developments on electronically controlled brake systems (EBS), and
there will likely be little change in the importance of friction materials
themselves for the time being. We will continue intensive research on
technologies related to friction materials for brake performance.
Our environmental responses are focused on compliance with
regulations concerning chemical substances in the EU, the adoption
of our own stricter standards, and the development of green friction
materials that do not use substances of concern. We are also working to
develop production technologies that reduce carbon dioxide emissions.
Automobile Brakes
Masaya Kawata, PresidentNisshinbo Brake Inc.
Summary of Financial Results for the Fiscal Year Ended March 2009
Business Strategies and Outlook for the Fiscal Year Ending March 2010
Kunihiro Toda, ChairmanNisshinbo Brake Inc.
0
20
40
60
80
0
2
4
6
10
8
19.8% 62.7%
(billions of yen) (billions of yen)
’06 ’07 ’08 ’09 ’06 ’07 ’08 ’09
Net Sales Operating Income
19
Nis
shin
bo
Ann
ual R
epor
t 20
09
18
Nisshinb
oA
nnual Rep
ort 2009
AUTOMOBILE BRAKES
Message to Shareholders and Investors
Current conditions are, on the whole, extremely challenging, but our structural reform efforts are producing results. If we are able to establish the “70% structure”* that we are aiming for, the brake business will be transformed into an even more profitable business when a recovery in auto production occurs. The entire Group is committed to efforts to establish this “70% structure”* as soon as possible.
* Seventy percent structure: A Group effort to reorganize business structures in a manner that a profit can be generated even with orders at 70% of their level in fiscal 2007 with the assumption that this will continue for at least three years.

Household Paper Flat, Speciality Papers Down for Higher Sales and
Lower Income Overall
Net sales of household paper products were higher due to increased
sales of core products including toilet paper designed for bidets and
recycled toilet paper. But operating income remained flat because of
higher costs for pulp and fuel and rising prices for various materials.
In the speciality papers segment, sales of packaging-related
products for sweets by Daiwa Shiko Co., Ltd., a subsidiary, and of
processed telegram paper were strong. Sales of the main fine paper
products, however, were down as a result of the recession, and sales
of printer-related products by Nisshinbo Postal Chemical Co., Ltd. fell,
resulting in lower net sales and income.
As a result, the paper products business as a whole recorded
higher net sales and lower income, with net sales of ¥34,214 million
(up 2.0% from the previous year) and operating income of ¥780 million
(down 32.8%).
Increasing Profitability and Establishing a New Business Model
As paper product prices continue to fall and demand declines, we will
carry out responses tailored to each business segment in the fiscal
year ending March 2010 to raise overall profitability.
In the household paper products segment, we will increase
sales with a focus on toilet paper designed for bidets. We will also
improve distinctive pulp products and enhance the quality of recycled
paper products by improving facilities, particularly raw material
processing, to increase income. In addition, we will raise international
cost competitiveness by forming alliances with overseas companies in
relation to products that we market in the future.
Boosting Product Added-Value with Other Group Companies to Raise Profitability
In the speciality papers segment, we will prioritize increasing
sales of high added-value products and marketing new products. We
will offer more environmentally friendly products and add new functions
to fine papers to make them more distinctive and stimulate demand. In
the synthetic papers segment, we will shift from unprofitable products
to high-profit products and take other steps to reorganize the business.
In the processed paper products segment, we will strive
to increase sales of telegram-related products, which have
generated stable income, by proposing new projects. With respect
to packaging products, we will strengthen collaboration with Daiwa
Shiko Co., Ltd., a subsidiary, and expand our range of business. In
the label business, we will integrate business with Nisshinbo Postal
Chemical Co., Ltd. to raise profitability.
Further Advances in High Added-Value Products
Until now, the paper products business has maintained and improved
its financial performance by developing distinctive products with high
added-value. Going forward, we will strengthen this trend.
Cotton Feel is a high-quality tissue product using the attributes
of natural cotton fibers that has enhanced our product lineup. We will
continue to create distinctive products such as Shower Roll, a rolled
paper product, and market new high added-value products such as
new printed and embossed products.
Nisshinbo Paper Products is also actively developing
environmentally friendly products. In the household paper segment, we
are expanding sales of Cotton Feel, which uses some natural materials,
and of resource-saving Shower Roll. Tokai Seishi Co., Ltd., a subsidiary
that manufactures recycled toilet paper, is increasing the use of
recycled paper by updating its raw material processing facilities.
With respect to speciality papers, we are increasing products
that use natural materials as well as products that incorporate pulp
made from recycled paper. Also, we have positioned products certified
by the Forest Stewardship Council (FSC) as priority products.
Becoming a Core Member of Nisshinbo Through Synergy Effects
with Subsidiaries
Nisshinbo Paper Products is collaborating with subsidiaries with the aim
of becoming a highly profitable, core member of the Nisshinbo Group.
The operations of Tokai Seishi Co., Ltd. were integrated in the
fiscal year ended March 2009, and with updates to its raw material
processing facilities, we expect significant improvements in product
quality and cost competitiveness. We are also working to integrate
the label business with Nisshinbo Postal Chemical Co., Ltd. to raise
profitability. In the packaging products segment, we are working
to generate synergy effects with Daiwa Shiko Co., Ltd., which was
acquired in the fiscal year ended March 2008, to increase income. With
respect to telegram products, we are collaborating with Shanghai Sun-
Rich Arts & Crafts Co., Ltd., a production site, to raise income.
Papers
Summary of Financial Results for the Fiscal Year Ended March 2009
Business Strategies and Outlook for the Fiscal Year Ending March 2010
Shinji Takeuchi, PresidentNisshinbo Paper Products Inc.
0
0.5
1.0
1.5
2.0
0
10
20
30
40
50
2.0%
(billions of yen)
32.8%
(billions of yen)
’06 ’07 ’08 ’09 ’06 ’07 ’08 ’09
Net Sales Operating Income
21
Nis
shin
bo
Ann
ual R
epor
t 20
09
20
Nisshinb
oA
nnual Rep
ort 2009
PAPERS
Message to Shareholders and Investors
We are working to increase profitability and expand business in the household paper products, speciality papers, and processed paper segments by collaborating with other group companies. We have implemented a policy of selecting target areas and focusing resources on them. Although demand conditions remain unfavorable, we aim to be a company with a strong market presence. Our shareholders and investors can expect significant developments from new Nisshinbo Paper Products.
Overview of the Nisshinbo Group’s Business
23
Nis
shin
bo
Ann
ual R
epor
t 20
09
22
Nisshinb
oA
nnual Rep
ort 2009
MECHATRONICS
Rapid Growth in Photovoltaic Module Manufacturing Equipment
Boosts Sales and Income
In the mechatronics segments, rising interest in clean energy continues
to spur rapid growth in solar power markets. Sales of solar simulators,
module laminators, and particularly of integrated photovoltaic module
manufacturing lines were sharply higher. At the same time, the
global downturn caused a rapid decline in demand for automobile
manufacturing line equipment and precision parts processing in the
second half.
As a result, the mechatronics business as a whole reported
higher net sales and income, with net sales of ¥14,738 million (up
82.3% from the previous year) and operating income of ¥1,554 million
(up 285.6%).
Market Trends for Photovoltaic Module Manufacturing Equipment
Sales of photovoltaic module manufacturing equipment, our main
product line, were somewhat sluggish in the first half as a result
of production adjustments, particularly in Asia. In the second half,
however, we received inquiries highly likely to result in sales, and the
prospects are good for sales to exceed the previous year’s performance
of ¥8.1 billion. Going forward, we have set a target of ¥12 billion in
net sales. Demand for solar power will continue to increase in many
leading countries because of electric power purchasing policies, and
we believe that we will be able to achieve this target.
The Miai Machinery Plant, a new specialized photovoltaic module
manufacturing equipment plant located in Okazaki City, Aichi Prefecture,
began operating in April 2009 at the same time as the corporate split.
Demand for solar cells fell as a result of the so-called “Spain shock,” and
the market cooled, but this proved to be temporary, and there has been
no fundamental change in market growth. We believe that growth in the
range of 30% annually can be sustained in the future. We are raising the
added-value of our products by developing EL cell inspection equipment
that makes module laminators with outstanding productivity. We will also
cautiously increase production capacity in conjunction with the expansion
of sales channels from Asia to Europe and the United States.
Enhancing Competitiveness of Photovoltaic Module Manufacturing Equipment and Promoting Rapid Globalization
Summary of Financial Results for the Fiscal Year Ended March 2009
Business Strategies and Outlook for the Fiscal Year Ending March 2010
0
5
10
15
20
0
0.5
1.0
1.5
2.0
82.3%
(billions of yen) (billions of yen)
285.6%
’08 ’09 ’08 ’09
Net Sales Operating Income
CHEMICALS
Recession Weighs on Income, But New Environmental Businesses
Achieve Steady Results
The insulating products segment posted higher income despite lower
sales due to withdrawing unprofitable products and higher shipments
of LNG panels. Elastomer products, however, experienced lower sales
and income as a result of slumping exports to Europe and the United
States. The plastic molding and processing business saw lower sales
and income because of downturns in global markets in the second half
and declining production in conjunction with inventory adjustments.
In new business segments, automotive-related orders for high-
performance chemical products plunged and sales were lower. But
sales of bipolar plates for fuel cells to leading fuel cell manufacturers
were steady as they prepared for mass production of household fuel
cells. Also, electric double-layer capacitor production structures were
established to respond to increasing demand by installing full-scale
mass production facilities.
As a result, the chemical products business as a whole reported
net sales of ¥32,624 million (down 15.3% from the previous year) and
an operating loss of ¥1,449 million (a deterioration of ¥660 million
from the previous year).
Growth Centered on Environmental Businesses
Environment-related technologies and business will prosper within the
chemical products business as a core part of the Nisshinbo Group.
We anticipate that sales of both bipolar plates for fuel cells, of which
we control nearly 100% of the domestic market, will take off along
with Carbodilite high-performance resin additive, with demand for
electric double-layer capacitors following suit several years later. We
will also begin sample shipments of carbon alloy catalysts in spring
2010 and are currently preparing for the start of full-scale business.
The development and enhancement of these one-of-a-kind, industry-
leading, and highly competitive products as well as the accurate
determination of customer needs are our key policies.
We are working to improve profitability by withdrawing from
unprofitable businesses and consolidating production sites. Through
these measures, we aim to achieve profitability in fiscal 2010.
High Profitability Based on a Lineup of Advanced Environmental Technologies
Summary of Financial Results for the Fiscal Year Ended March 2009
0
10
20
30
40
50
-1.5
-1.0
-0.5
0
0.5
1.0
15.3%
(billions of yen)
¥0.6billion
(billions of yen)
’06 ’07 ’08 ’09 ’06 ’07 ’08 ’09
Net Sales Operating Income (Loss)
Business Strategies and Outlook for the Fiscal Year Ending March 2010
Chemicals
Note: The mechatronics segment, which previously was included in the other business segment, has increased in significance and accordingly is now presented as a separate category.
Message to Shareholders and Investors
Favorable developments regarding environmental products are unfolding globally. We have laid the groundwork for expanding our environmental product business in the future. We are working hard to expand the use of fuel cells, and the practical application of high-performance carbon alloy catalysts is now in sight. Nisshinbo Chemical is ready to make great leaps forward.
Hiroshi Nakano, President Nisshinbo Mechatronics Inc.
Yoshihiro Sakaki, Chairman Nisshinbo Mechatronics Inc.
Masaaki Isobe, PresidentNisshinbo Chemical Inc.
MechatronicsMessage to Shareholders and Investors
For solar cells to come into widespread use, module prices must fall. It seems likely that demand concerning manufacturing costs will become more pressing. That is why it is essential we increase the added-value and competitiveness of our products even further. We hope to use the strengths of the entire Nisshinbo Group and become the world’s leading supplier of photovoltaic module manufacturing equipment.
Overview of the Nisshinbo Group’s Business

24
Nisshinb
oA
nnual Rep
ort 2009
25
Nis
shin
bo
Ann
ual R
epor
t 20
09
Slump in Global Demand Causes Larger Operating Loss
In the fiscal year ended March 2009, the electronics industry
performed sluggishly as a result of a global slump in demand and a
major drop in exports, which had been a driving industry force. New
Japan Radio Co., Ltd. saw its sales fall considerably as a result of
lower production by customers in the main semiconductor segment,
lower sales of large electron tubes, and a decline in sales of microwave
application products including satellite communication component
products. This resulted in an overall extremely poor performance.
The electronics product business had net sales of ¥60,550
million (down 20.8% from the previous year) and an operating
loss of ¥3,918 million (a deterioration of ¥5,021 million from the
previous year).
New Japan Radio Co., Ltd., which plays a central role in the
electronics business, will strive to become profitable in fiscal 2010
Raising corporate value by eliminating New Japan Radio’s losses is
an urgent task for the future development of the Group’s electronics
business. In the current term year ending March 2010, we expect
that inventory adjustments will end and markets will begin to recover
in the second quarter. A large-scale recovery of demand cannot be
anticipated in the near future, so we are planning on sales at levels
of the previous year. Even so, we anticipate increases in sales of
microwave devices (GaAs ICs) for mobile phone use in Japan and
for third-generation mobile markets in China. In addition, we will
improve performance and return to profitability by reconstructing sales
strategies by formulating and implementing new product development
strategies, reorganizing production structures, reconstructing and
New Japan Radio Co., Ltd. and Ueda Japan Radio Co., Ltd. Play Central Roles in the Semiconductor, Electronic Equipment, and Other Business Segments
Summary of Financial Results for the Fiscal Year Ended March 2009 Business Strategies and Outlook for the Fiscal Year Ending March 2010
Kazuo Hirata, PresidentNew Japan Radio Co., Ltd.
0
20
40
60
80
100
-4
-3
-2
-1
0
1
2
20.8%
(billions of yen)
¥5billion
(billions of yen)
’06 ’07 ’08 ’09 ’06 ’07 ’08 ’09
Net Sales Operating Income (Loss)
implementing cost-cutting strategies, and raising process quality.
Our medium- to long-term strategy for our main semiconductor
business calls for us to bolster marketing capabilities, maintain
marketing structures, and develop new competitive products. To do
this, we will reinforce marketing activities closely tied to customers
through our design centers in Osaka and Singapore. We will also
expand sales in the north and east of China through NJR Shanghai Co.,
Ltd., a group business established in January 2008, and take steps
in new application fields with respect to communications, industrial
equipment, and automotive devices so we can respond accurately to
customer needs.
World-Leading Product Strategies
New Japan Radio Co., Ltd. is also implementing integrated product
strategies to achieve dominant positions in markets with high added-
value. In fiscal 2010, we will focus on expanding sales of highly reliable
automotive operational amplifiers, high-precision, stable operational
amplifiers for industrial equipment, MUSES operational amplifiers for
higher-end audio devices, microwave devices (GaAs ICs) in domestic
and overseas markets, and the world’s smallest reflectors for camera
modules used in increasingly compact mobile phones.
We are also working on development of a number of new devices
with which we hope to expand business over the medium to long
term. These products include digital power supply control ICs, digital
video decoders used primarily in car navigation systems, and micro-
electro-mechanical systems used in electronic switches and silicon
microphones. In addition, we are developing SiC devices and GaN
devices as wide-gap semiconductor devices.
In addition, Ueda Japan Radio Co., Ltd. supplies new products
based on original wireless and ultrasonic technologies in a wide
range of fields including marine radar and medical ultrasound
imaging equipment.
Evolving As an Environmental Company with Group Companies
Collaborating with other Nisshinbo Group firms is an important priority.
For example, in the core photovoltaic module manufacturing equipment
business, electric power storage technologies and control technologies
are crucial for expanding business. We anticipate collaboration with
the electronics products business in the future. We are expanding the
electronics products business by collaborating with other Nisshinbo
Group companies in a wide range of fields and are making every effort
to maintain our status as a highly valued company benefiting society.
ELECTRONICS
ElectronicsMessage to Shareholders and Investors
Fiscal 2010 marks the 50th anniversary of New Japan Radio’s establishment. Based on our accumulated know-how, we have engaged in business ranging from research and development to manufacturing and sales with a focus on analog semiconductors, one of our strengths, and boast world-leading sales volume of operational amplifiers, our main product line. As the functionality of semiconductors and wireless communications equipment increases, we will raise our corporate value by using our original technologies to provide optimal components.
Overview of the Nisshinbo Group’s Business
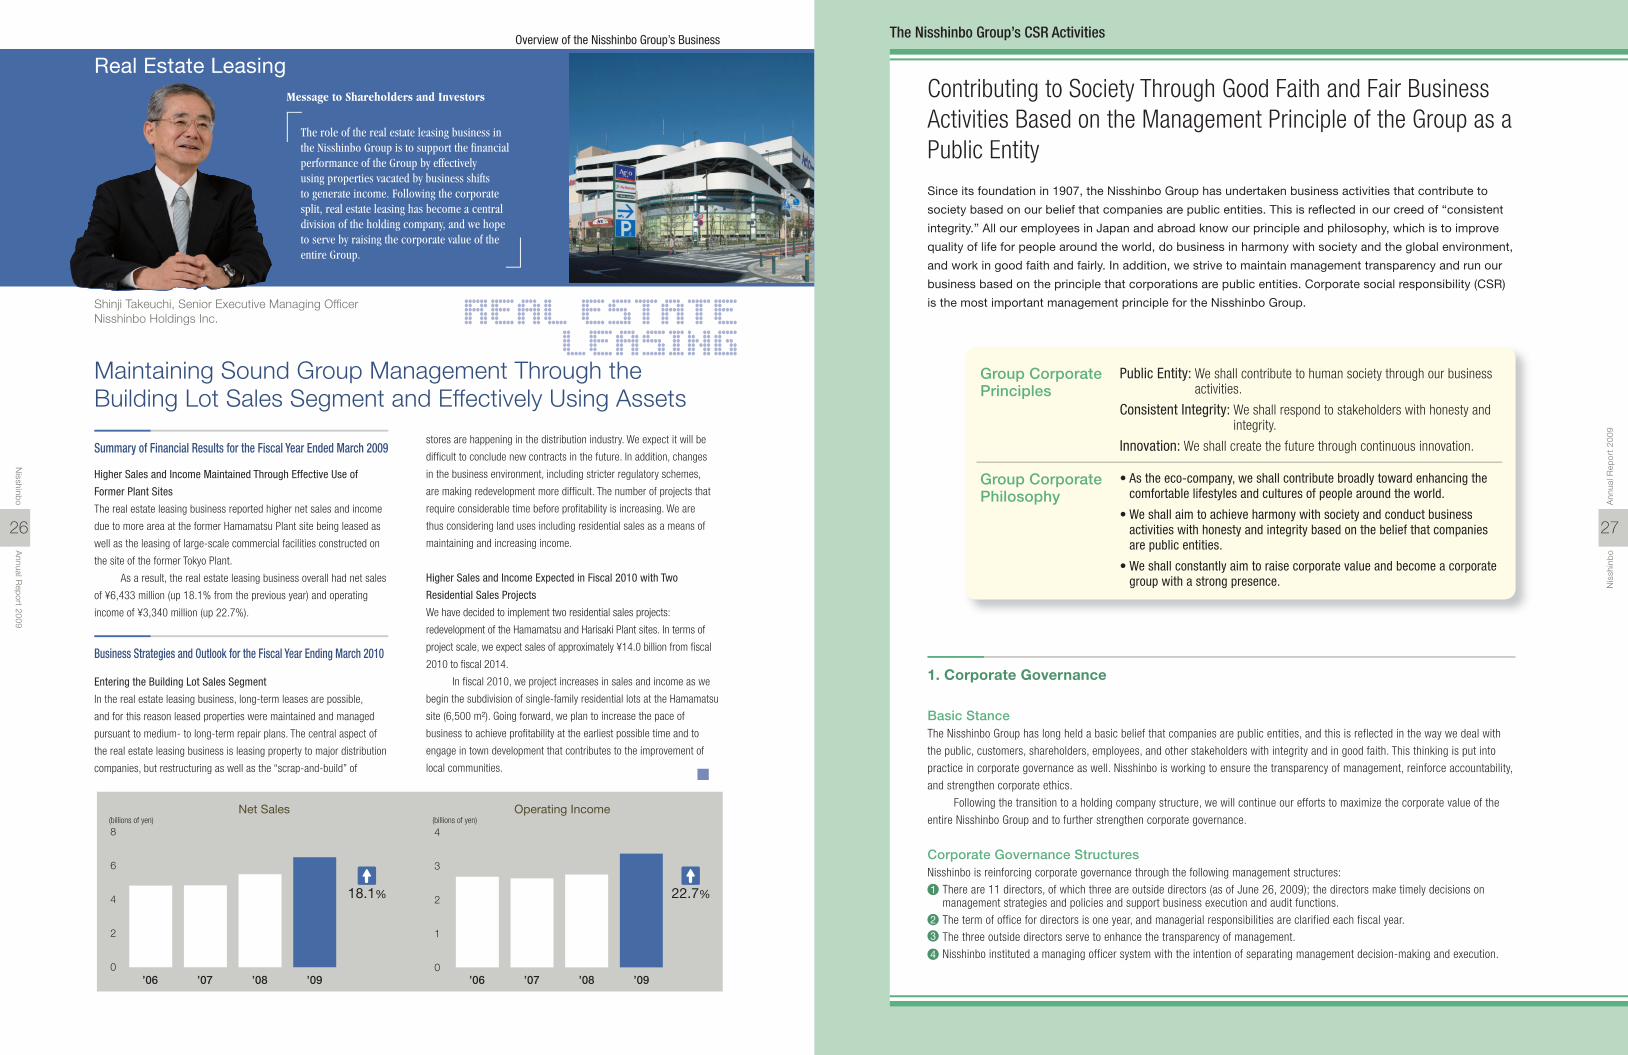
Contributing to Society Through Good Faith and Fair Business Activities Based on the Management Principle of the Group as a Public Entity
Since its foundation in 1907, the Nisshinbo Group has undertaken business activities that contribute to
society based on our belief that companies are public entities. This is reflected in our creed of “consistent
integrity.” All our employees in Japan and abroad know our principle and philosophy, which is to improve
quality of life for people around the world, do business in harmony with society and the global environment,
and work in good faith and fairly. In addition, we strive to maintain management transparency and run our
business based on the principle that corporations are public entities. Corporate social responsibility (CSR)
is the most important management principle for the Nisshinbo Group.
The Nisshinbo Group’s CSR Activities
Basic StanceThe Nisshinbo Group has long held a basic belief that companies are public entities, and this is reflected in the way we deal with
the public, customers, shareholders, employees, and other stakeholders with integrity and in good faith. This thinking is put into
practice in corporate governance as well. Nisshinbo is working to ensure the transparency of management, reinforce accountability,
and strengthen corporate ethics.
Following the transition to a holding company structure, we will continue our efforts to maximize the corporate value of the
entire Nisshinbo Group and to further strengthen corporate governance.
Corporate Governance StructuresNisshinbo is reinforcing corporate governance through the following management structures:
There are 11 directors, of which three are outside directors (as of June 26, 2009); the directors make timely decisions on management strategies and policies and support business execution and audit functions.
The term of office for directors is one year, and managerial responsibilities are clarified each fiscal year.
The three outside directors serve to enhance the transparency of management.
Nisshinbo instituted a managing officer system with the intention of separating management decision-making and execution.
1. Corporate Governance
27
Nis
shin
bo
Ann
ual R
epor
t 20
09
26
Nisshinb
oA
nnual Rep
ort 2009
Public Entity: We shall contribute to human society through our business activities.
Consistent Integrity: We shall respond to stakeholders with honesty and integrity.
Innovation: We shall create the future through continuous innovation.
Group Corporate Philosophy
• As the eco-company, we shall contribute broadly toward enhancing the comfortable lifestyles and cultures of people around the world.
• We shall aim to achieve harmony with society and conduct business activities with honesty and integrity based on the belief that companies are public entities.
• We shall constantly aim to raise corporate value and become a corporate group with a strong presence.
Group Corporate Principles
Higher Sales and Income Maintained Through Effective Use of
Former Plant Sites
The real estate leasing business reported higher net sales and income
due to more area at the former Hamamatsu Plant site being leased as
well as the leasing of large-scale commercial facilities constructed on
the site of the former Tokyo Plant.
As a result, the real estate leasing business overall had net sales
of ¥6,433 million (up 18.1% from the previous year) and operating
income of ¥3,340 million (up 22.7%).
Entering the Building Lot Sales Segment
In the real estate leasing business, long-term leases are possible,
and for this reason leased properties were maintained and managed
pursuant to medium- to long-term repair plans. The central aspect of
the real estate leasing business is leasing property to major distribution
companies, but restructuring as well as the “scrap-and-build” of
stores are happening in the distribution industry. We expect it will be
difficult to conclude new contracts in the future. In addition, changes
in the business environment, including stricter regulatory schemes,
are making redevelopment more difficult. The number of projects that
require considerable time before profitability is increasing. We are
thus considering land uses including residential sales as a means of
maintaining and increasing income.
Higher Sales and Income Expected in Fiscal 2010 with Two
Residential Sales Projects
We have decided to implement two residential sales projects:
redevelopment of the Hamamatsu and Harisaki Plant sites. In terms of
project scale, we expect sales of approximately ¥14.0 billion from fiscal
2010 to fiscal 2014.
In fiscal 2010, we project increases in sales and income as we
begin the subdivision of single-family residential lots at the Hamamatsu
site (6,500 m²). Going forward, we plan to increase the pace of
business to achieve profitability at the earliest possible time and to
engage in town development that contributes to the improvement of
local communities.
Maintaining Sound Group Management Through the Building Lot Sales Segment and Effectively Using Assets
Real Estate Leasing
Summary of Financial Results for the Fiscal Year Ended March 2009
Business Strategies and Outlook for the Fiscal Year Ending March 2010
Shinji Takeuchi, Senior Executive Managing OfficerNisshinbo Holdings Inc.
0
2
4
6
8
0
1
2
3
4
18.1%
(billions of yen)
22.7%
(billions of yen)
’06 ’07 ’08 ’09 ’06 ’07 ’08 ’09
Net Sales Operating Income
REAL ESTATE LEASING
1
2
3
4
Message to Shareholders and Investors
The role of the real estate leasing business in the Nisshinbo Group is to support the financial performance of the Group by effectively using properties vacated by business shifts to generate income. Following the corporate split, real estate leasing has become a central division of the holding company, and we hope to serve by raising the corporate value of the entire Group.
Overview of the Nisshinbo Group’s Business
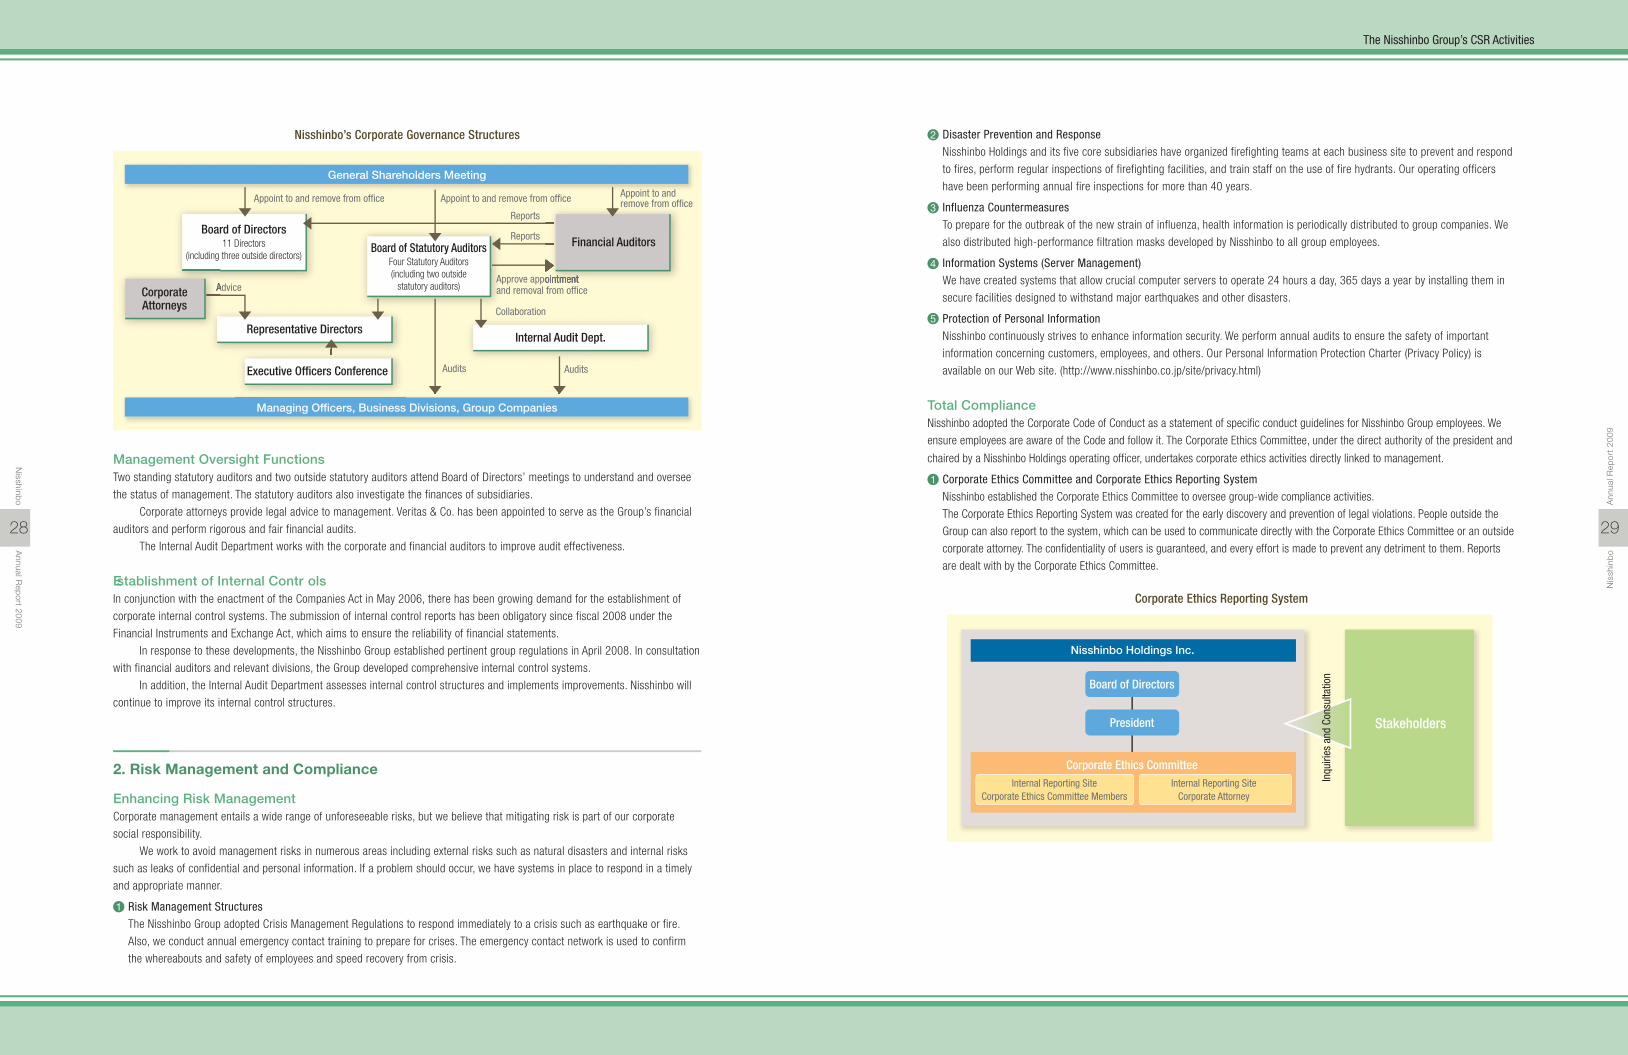
Enhancing Risk ManagementCorporate management entails a wide range of unforeseeable risks, but we believe that mitigating risk is part of our corporate
social responsibility.
We work to avoid management risks in numerous areas including external risks such as natural disasters and internal risks
such as leaks of confidential and personal information. If a problem should occur, we have systems in place to respond in a timely
and appropriate manner.
Risk Management Structures
The Nisshinbo Group adopted Crisis Management Regulations to respond immediately to a crisis such as earthquake or fire.
Also, we conduct annual emergency contact training to prepare for crises. The emergency contact network is used to confirm
the whereabouts and safety of employees and speed recovery from crisis.
Disaster Prevention and Response
Nisshinbo Holdings and its five core subsidiaries have organized firefighting teams at each business site to prevent and respond
to fires, perform regular inspections of firefighting facilities, and train staff on the use of fire hydrants. Our operating officers
have been performing annual fire inspections for more than 40 years.
Influenza Countermeasures
To prepare for the outbreak of the new strain of influenza, health information is periodically distributed to group companies. We
also distributed high-performance filtration masks developed by Nisshinbo to all group employees.
Information Systems (Server Management)
We have created systems that allow crucial computer servers to operate 24 hours a day, 365 days a year by installing them in
secure facilities designed to withstand major earthquakes and other disasters.
Protection of Personal Information
Nisshinbo continuously strives to enhance information security. We perform annual audits to ensure the safety of important
information concerning customers, employees, and others. Our Personal Information Protection Charter (Privacy Policy) is
available on our Web site. (http://www.nisshinbo.co.jp/site/privacy.html)
Total ComplianceNisshinbo adopted the Corporate Code of Conduct as a statement of specific conduct guidelines for Nisshinbo Group employees. We
ensure employees are aware of the Code and follow it. The Corporate Ethics Committee, under the direct authority of the president and
chaired by a Nisshinbo Holdings operating officer, undertakes corporate ethics activities directly linked to management.
Corporate Ethics Committee and Corporate Ethics Reporting System
Nisshinbo established the Corporate Ethics Committee to oversee group-wide compliance activities.
The Corporate Ethics Reporting System was created for the early discovery and prevention of legal violations. People outside the
Group can also report to the system, which can be used to communicate directly with the Corporate Ethics Committee or an outside
corporate attorney. The confidentiality of users is guaranteed, and every effort is made to prevent any detriment to them. Reports
are dealt with by the Corporate Ethics Committee.
Appoint to and remove from office
Reports
Appoint to and remove from office
Reports
Collaboration
Audits
Advice
Audits
Approve appointmentand removal from office
Internal Audit Dept.
General Shareholders Meeting
Managing Officers, Business Divisions, Group Companies
Board of Statutory AuditorsFour Statutory Auditors(including two outside
statutory auditors)
Board of Directors11 Directors
(including three outside directors)Financial Auditors
CorporateAttorneys
Representative Directors
Executive Officers Conference
Appoint to andremove from office
Nisshinbo’s Corporate Governance Structures
29
Nis
shin
bo
Ann
ual R
epor
t 20
09
28
Nisshinb
oA
nnual Rep
ort 2009
Board of Directors
President Stakeholders
Nisshinbo Holdings Inc.
Corporate Ethics CommitteeInternal Reporting Site
Corporate Ethics Committee MembersInternal Reporting Site
Corporate Attorney
Inqu
iries
and
Con
sulta
tion
Corporate Ethics Reporting System
Management Oversight FunctionsTwo standing statutory auditors and two outside statutory auditors attend Board of Directors’ meetings to understand and oversee
the status of management. The statutory auditors also investigate the finances of subsidiaries.
Corporate attorneys provide legal advice to management. Veritas & Co. has been appointed to serve as the Group’s financial
auditors and perform rigorous and fair financial audits.
The Internal Audit Department works with the corporate and financial auditors to improve audit effectiveness.
Establishment of Internal Contr olsIn conjunction with the enactment of the Companies Act in May 2006, there has been growing demand for the establishment of
corporate internal control systems. The submission of internal control reports has been obligatory since fiscal 2008 under the
Financial Instruments and Exchange Act, which aims to ensure the reliability of financial statements.
In response to these developments, the Nisshinbo Group established pertinent group regulations in April 2008. In consultation
with financial auditors and relevant divisions, the Group developed comprehensive internal control systems.
In addition, the Internal Audit Department assesses internal control structures and implements improvements. Nisshinbo will
continue to improve its internal control structures.
2. Risk Management and Compliance
1
2
3
4
5
1
The Nisshinbo Group’s CSR Activities

Contents
Financial Section
43
32 Management Discussion and Analysis
37
38
Six-Year Summary
Consolidated Financial Statements
Notes to Consolidated Financial Statements
More detailed information concerning the Nisshinbo Group’s environmental and social activities can be found in its CSR Report (http://www.nisshinbo.co.jp).
31
Nis
shin
bo
Ann
ual R
epor
t 20
09
30
Nisshinb
oA
nnual Rep
ort 2009
Legal Risk Management
The Nisshinbo Group conducts legal risk management as one aspect of its activities to ensure compliance in all of its business
undertakings. Checklists are used to conduct periodic inspections concerning major laws and regulations. Making the requirements
of major laws and regulations more visible has facilitated confirmation and raised worksite awareness concerning compliance.
Compliance Education
The Nisshinbo Group prepared Corporate Vision of the Nisshinbo Group as an educational tool concerning compliance-related
topics. The handbook is available to all employees on the Group intranet in Japanese and English. It has been translated into local
languages in non-English-speaking countries for employee training.
Nisshinbo has adopted a set of rules for parties making large purchases of our stock that include purchase information provision
requirements. The Company also has antitakeover defenses in place. For instance, the Board of Directors can issue new share
warrants when a party does not comply with the rules. This can also occur when a company deemed unsuitable by the Company is
in compliance with the rules while seeking to gain control of it.
These antitakeover defenses are aimed at ensuring shareholders get enough information to appropriately respond to large
stock purchases and we believe that they contribute to the shared interests of shareholders. If the Board of Directors issues new
share warrants or takes other defensive measures, a corporate value committee consisting of the outside directors and outside
statutory auditors will review its actions and make a recommendation. The Board will comply with that recommendation to the
greatest possible extent.
The antitakeover defenses were approved at the general shareholders meeting in June 2009. They will remain in effect for three
years, but they can be rescinded at any time before expiration of their term by a resolution of the general shareholders meeting.
2
3
3. Antitakeover Defenses
Corporate Vision of theNisshinbo Group
The Nisshinbo Group’s CSR Activities
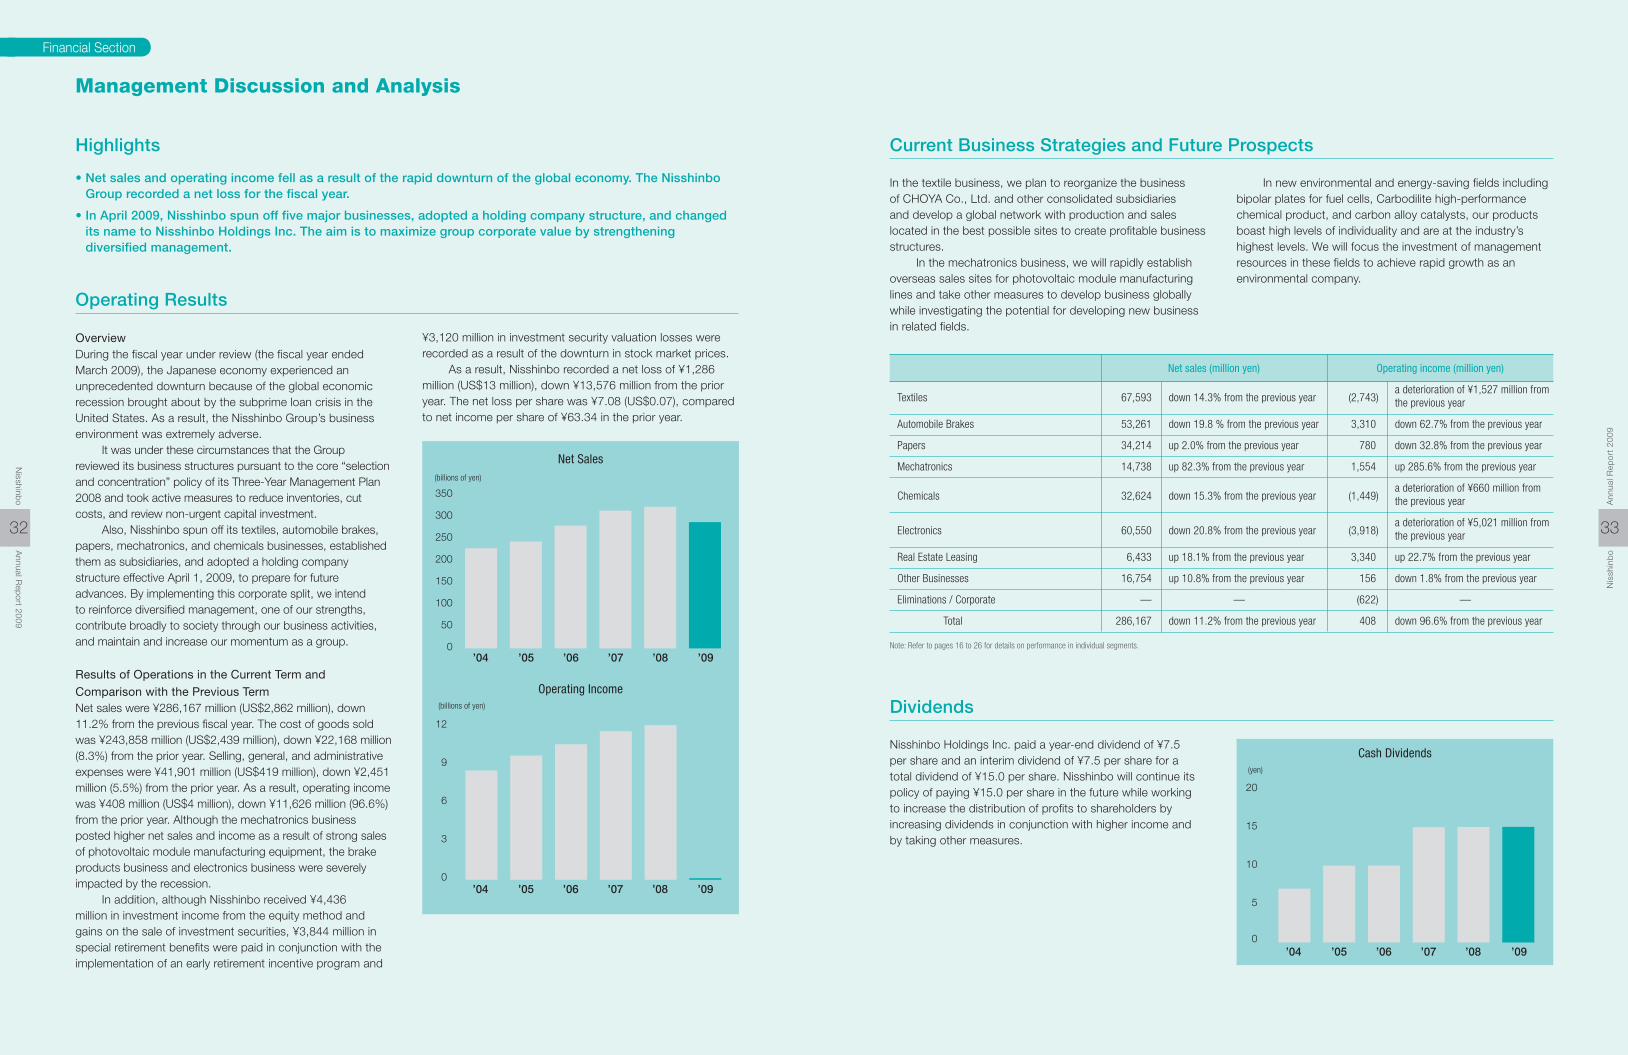
Financial Section
33
Nis
shin
bo
Ann
ual R
epor
t 20
09
32
Nisshinb
oA
nnual Rep
ort 2009
Management Discussion and Analysis
OverviewDuring the fiscal year under review (the fiscal year ended March 2009), the Japanese economy experienced an unprecedented downturn because of the global economic recession brought about by the subprime loan crisis in the United States. As a result, the Nisshinbo Group’s business environment was extremely adverse. It was under these circumstances that the Group reviewed its business structures pursuant to the core “selection and concentration” policy of its Three-Year Management Plan 2008 and took active measures to reduce inventories, cut costs, and review non-urgent capital investment. Also, Nisshinbo spun off its textiles, automobile brakes,papers, mechatronics, and chemicals businesses, established them as subsidiaries, and adopted a holding company structure effective April 1, 2009, to prepare for future advances. By implementing this corporate split, we intend to reinforce diversified management, one of our strengths, contribute broadly to society through our business activities, and maintain and increase our momentum as a group.
Results of Operations in the Current Term and Comparison with the Previous TermNet sales were ¥286,167 million (US$2,862 million), down 11.2% from the previous fiscal year. The cost of goods sold was ¥243,858 million (US$2,439 million), down ¥22,168 million (8.3%) from the prior year. Selling, general, and administrative expenses were ¥41,901 million (US$419 million), down ¥2,451 million (5.5%) from the prior year. As a result, operating income was ¥408 million (US$4 million), down ¥11,626 million (96.6%) from the prior year. Although the mechatronics business posted higher net sales and income as a result of strong sales of photovoltaic module manufacturing equipment, the brake products business and electronics business were severely impacted by the recession. In addition, although Nisshinbo received ¥4,436 million in investment income from the equity method and gains on the sale of investment securities, ¥3,844 million in special retirement benefits were paid in conjunction with the implementation of an early retirement incentive program and
¥3,120 million in investment security valuation losses were recorded as a result of the downturn in stock market prices. As a result, Nisshinbo recorded a net loss of ¥1,286 million (US$13 million), down ¥13,576 million from the prior year. The net loss per share was ¥7.08 (US$0.07), compared to net income per share of ¥63.34 in the prior year.
Operating Results
Net Sales
0
50
100
150
200
250
300
350
’04 ’05 ’06 ’07 ’08 ’09
Operating Income
0
3
6
9
12
’04 ’05 ’06 ’07 ’08 ’09
(billions of yen)
(billions of yen)
Highlights
• Net sales and operating income fell as a result of the rapid downturn of the global economy. The Nisshinbo Group recorded a net loss for the fiscal year.
• In April 2009, Nisshinbo spun off five major businesses, adopted a holding company structure, and changed its name to Nisshinbo Holdings Inc. The aim is to maximize group corporate value by strengthening diversified management.
In the textile business, we plan to reorganize the business of CHOYA Co., Ltd. and other consolidated subsidiaries and develop a global network with production and sales located in the best possible sites to create profitable business structures. In the mechatronics business, we will rapidly establish overseas sales sites for photovoltaic module manufacturing lines and take other measures to develop business globally while investigating the potential for developing new business in related fields.
In new environmental and energy-saving fields including bipolar plates for fuel cells, Carbodilite high-performance chemical product, and carbon alloy catalysts, our products boast high levels of individuality and are at the industry’s highest levels. We will focus the investment of management resources in these fields to achieve rapid growth as an environmental company.
Current Business Strategies and Future Prospects
Nisshinbo Holdings Inc. paid a year-end dividend of ¥7.5 per share and an interim dividend of ¥7.5 per share for a total dividend of ¥15.0 per share. Nisshinbo will continue its policy of paying ¥15.0 per share in the future while working to increase the distribution of profits to shareholders by increasing dividends in conjunction with higher income and by taking other measures.
Dividends
Cash Dividends
0
5
10
15
20
’04 ’05 ’06 ’07 ’08 ’09
(yen)
Textiles 67,593 down 14.3% from the previous year (2,743) a deterioration of ¥1,527 million from
the previous year
Automobile Brakes 53,261 down 19.8 % from the previous year 3,310 down 62.7% from the previous year
Papers 34,214 up 2.0% from the previous year 780 down 32.8% from the previous year
Mechatronics 14,738 up 82.3% from the previous year 1,554 up 285.6% from the previous year
Chemicals 32,624 down 15.3% from the previous year (1,449) a deterioration of ¥660 million from
the previous year
Electronics 60,550 down 20.8% from the previous year (3,918) a deterioration of ¥5,021 million from
the previous year
Real Estate Leasing 6,433 up 18.1% from the previous year 3,340 up 22.7% from the previous year
Other Businesses 16,754 up 10.8% from the previous year 156 down 1.8% from the previous year
Eliminations / Corporate — — (622) —
Total 286,167 down 11.2% from the previous year 408 down 96.6% from the previous year
Net sales (million yen) Operating income (million yen)
Note: Refer to pages 16 to 26 for details on performance in individual segments.
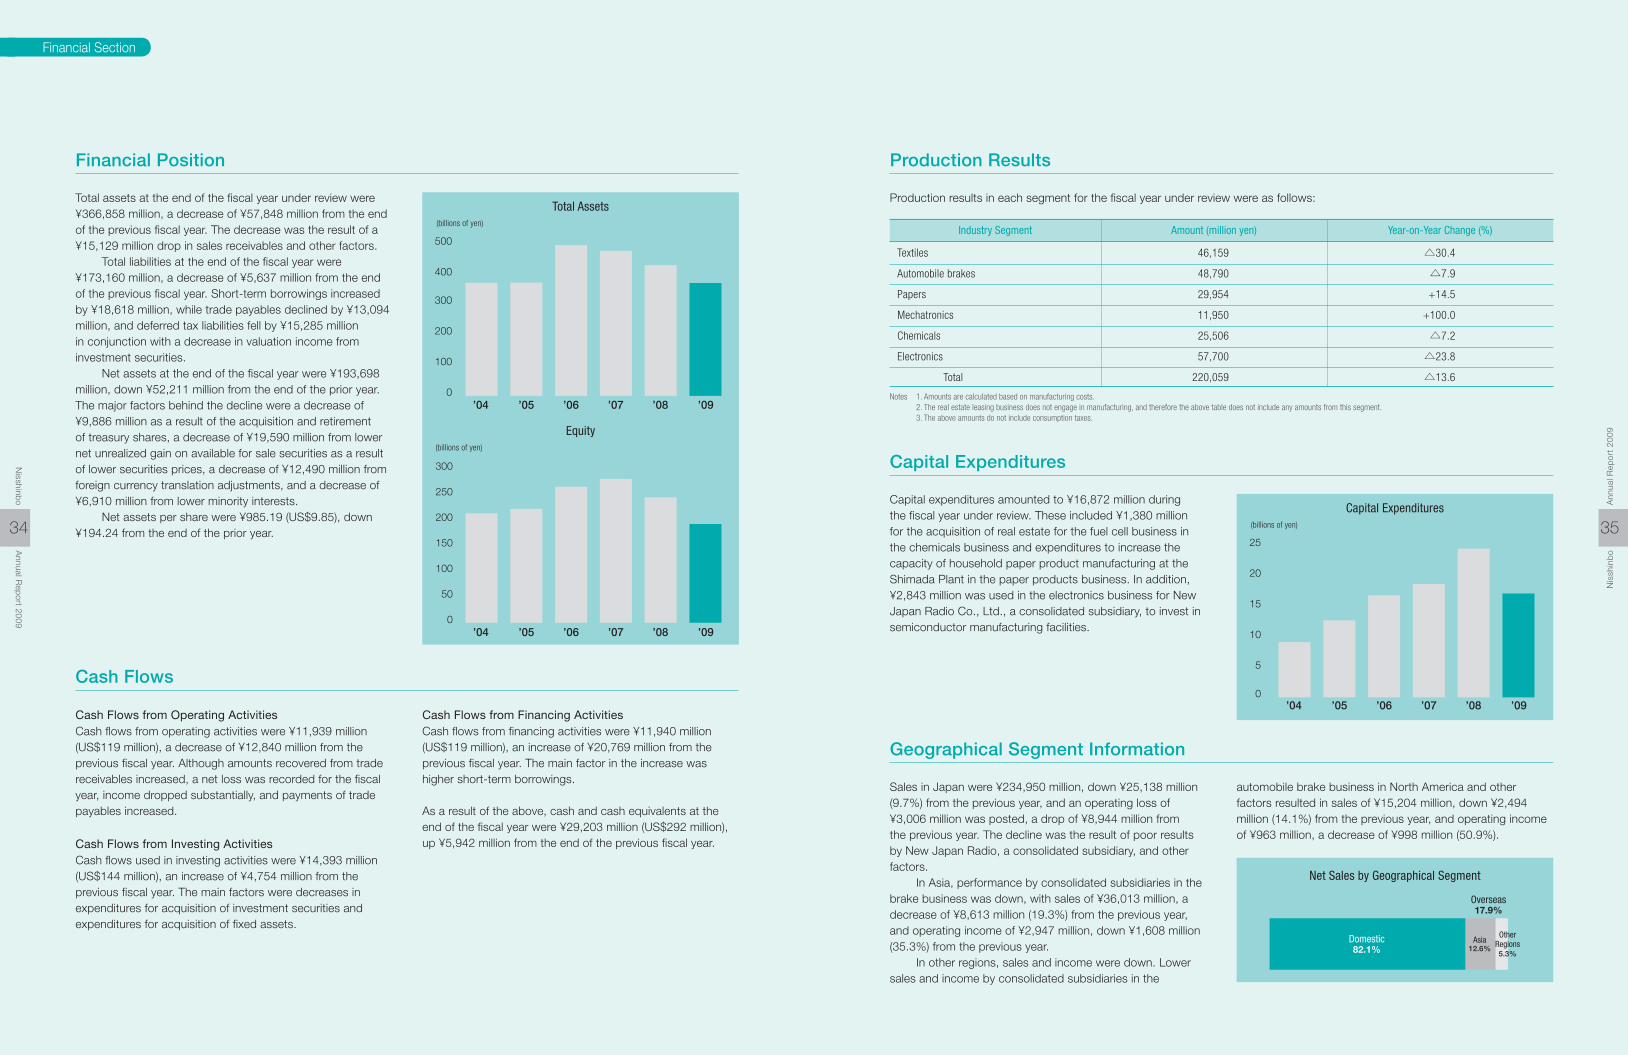
Total Assets
0
100
200
300
400
500
’04 ’05 ’06 ’07 ’08 ’09
(billions of yen)
Equity
0
50
100
150
200
250
300
’04 ’05 ’06 ’07 ’08 ’09
(billions of yen)
Financial Section
35
Nis
shin
bo
Ann
ual R
epor
t 20
09
34
Nisshinb
oA
nnual Rep
ort 2009
Total assets at the end of the fiscal year under review were ¥366,858 million, a decrease of ¥57,848 million from the end of the previous fiscal year. The decrease was the result of a ¥15,129 million drop in sales receivables and other factors. Total liabilities at the end of the fiscal year were ¥173,160 million, a decrease of ¥5,637 million from the end of the previous fiscal year. Short-term borrowings increased by ¥18,618 million, while trade payables declined by ¥13,094 million, and deferred tax liabilities fell by ¥15,285 million in conjunction with a decrease in valuation income from investment securities. Net assets at the end of the fiscal year were ¥193,698 million, down ¥52,211 million from the end of the prior year. The major factors behind the decline were a decrease of ¥9,886 million as a result of the acquisition and retirement of treasury shares, a decrease of ¥19,590 million from lower net unrealized gain on available for sale securities as a result of lower securities prices, a decrease of ¥12,490 million from foreign currency translation adjustments, and a decrease of ¥6,910 million from lower minority interests. Net assets per share were ¥985.19 (US$9.85), down ¥194.24 from the end of the prior year.
Cash Flows from Operating ActivitiesCash flows from operating activities were ¥11,939 million (US$119 million), a decrease of ¥12,840 million from the previous fiscal year. Although amounts recovered from trade receivables increased, a net loss was recorded for the fiscal year, income dropped substantially, and payments of trade payables increased.
Cash Flows from Investing ActivitiesCash flows used in investing activities were ¥14,393 million (US$144 million), an increase of ¥4,754 million from the previous fiscal year. The main factors were decreases in expenditures for acquisition of investment securities and expenditures for acquisition of fixed assets.
Cash Flows
Financial Position
Cash Flows from Financing ActivitiesCash flows from financing activities were ¥11,940 million (US$119 million), an increase of ¥20,769 million from the previous fiscal year. The main factor in the increase was higher short-term borrowings.
As a result of the above, cash and cash equivalents at the end of the fiscal year were ¥29,203 million (US$292 million), up ¥5,942 million from the end of the previous fiscal year.
Production results in each segment for the fiscal year under review were as follows:
Capital expenditures amounted to ¥16,872 million during the fiscal year under review. These included ¥1,380 million for the acquisition of real estate for the fuel cell business in the chemicals business and expenditures to increase the capacity of household paper product manufacturing at the Shimada Plant in the paper products business. In addition, ¥2,843 million was used in the electronics business for New Japan Radio Co., Ltd., a consolidated subsidiary, to invest in semiconductor manufacturing facilities.
Production Results
Notes 1. Amounts are calculated based on manufacturing costs. 2. The real estate leasing business does not engage in manufacturing, and therefore the above table does not include any amounts from this segment. 3. The above amounts do not include consumption taxes.
Textiles 46,159 △30.4
Automobile brakes 48,790 △7.9
Papers 29,954 +14.5
Mechatronics 11,950 +100.0
Chemicals 25,506 △7.2
Electronics 57,700 △23.8
Total 220,059 △13.6
Industry Segment Amount (million yen) Year-on-Year Change (%)
Capital Expenditures
Capital Expenditures
0
5
10
15
20
25
’04 ’05 ’06 ’07 ’08 ’09
(billions of yen)
Geographical Segment Information
Sales in Japan were ¥234,950 million, down ¥25,138 million (9.7%) from the previous year, and an operating loss of ¥3,006 million was posted, a drop of ¥8,944 million from the previous year. The decline was the result of poor results by New Japan Radio, a consolidated subsidiary, and other factors. In Asia, performance by consolidated subsidiaries in the brake business was down, with sales of ¥36,013 million, a decrease of ¥8,613 million (19.3%) from the previous year, and operating income of ¥2,947 million, down ¥1,608 million (35.3%) from the previous year. In other regions, sales and income were down. Lower sales and income by consolidated subsidiaries in the
automobile brake business in North America and other factors resulted in sales of ¥15,204 million, down ¥2,494 million (14.1%) from the previous year, and operating income of ¥963 million, a decrease of ¥998 million (50.9%).
Net Sales by Geographical Segment
Overseas17.9%
Domestic82.1%
Asia12.6%
OtherRegions5.3%
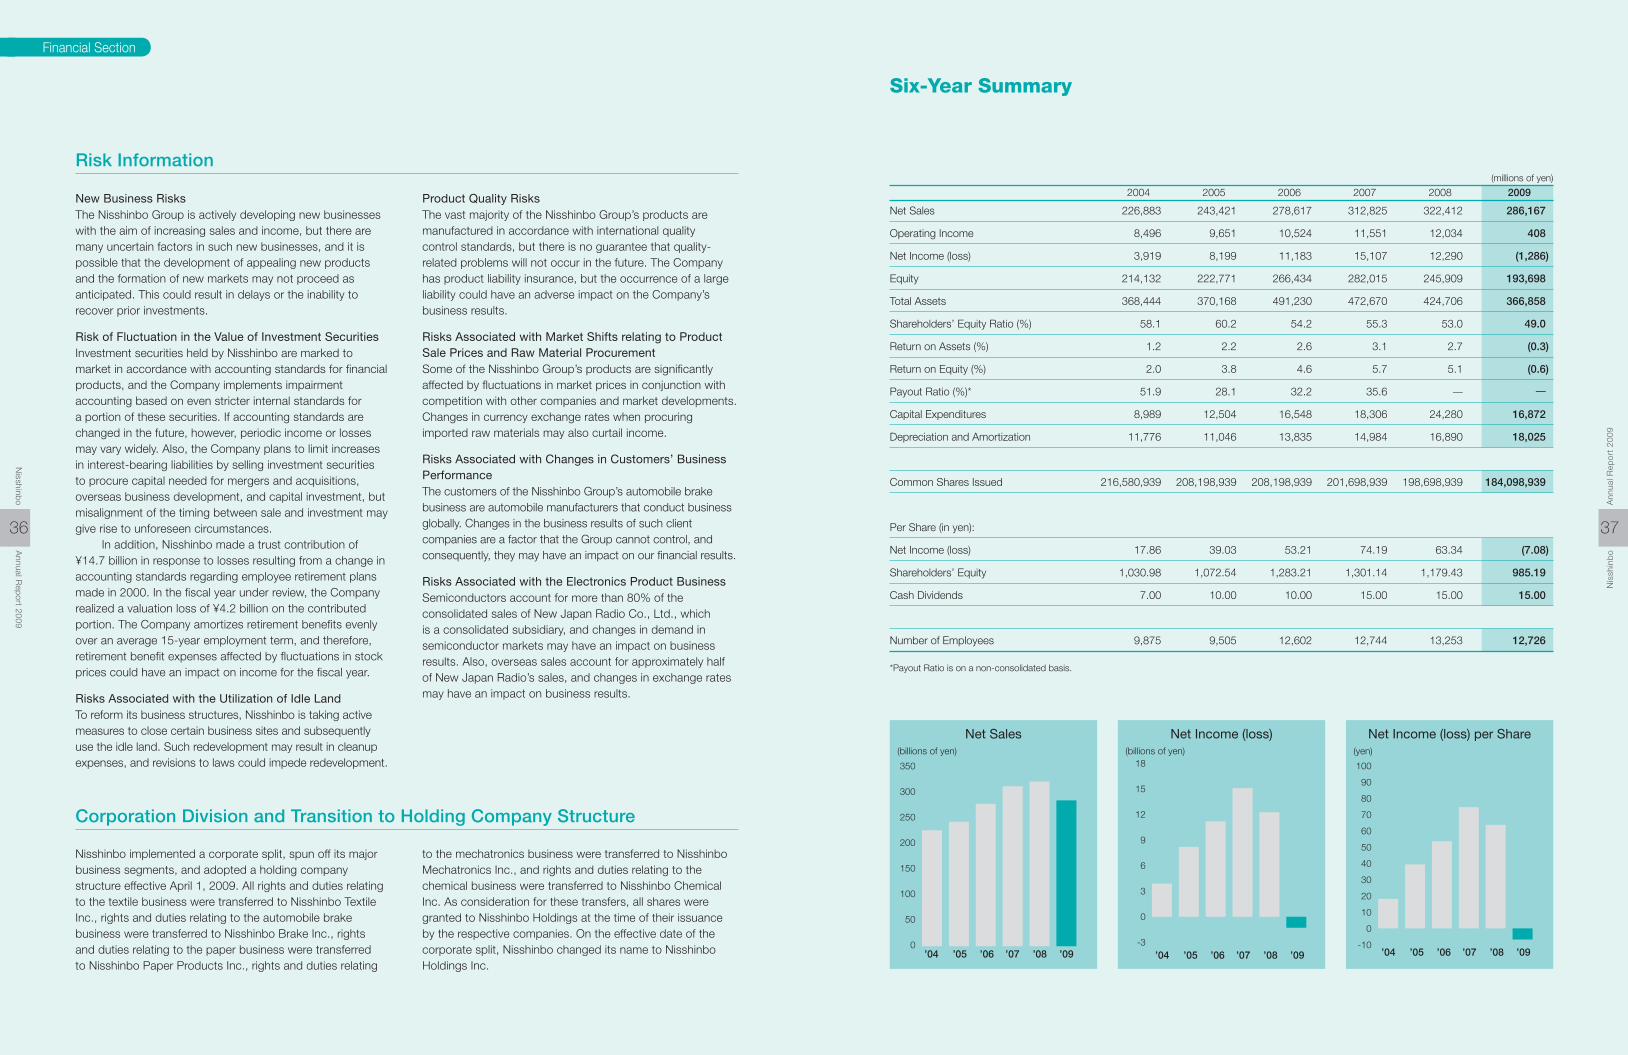
Financial Section
37
Nis
shin
bo
Ann
ual R
epor
t 20
09
36
Nisshinb
oA
nnual Rep
ort 2009
New Business RisksThe Nisshinbo Group is actively developing new businesses with the aim of increasing sales and income, but there are many uncertain factors in such new businesses, and it is possible that the development of appealing new products and the formation of new markets may not proceed as anticipated. This could result in delays or the inability to recover prior investments.
Risk of Fluctuation in the Value of Investment SecuritiesInvestment securities held by Nisshinbo are marked to market in accordance with accounting standards for financial products, and the Company implements impairment accounting based on even stricter internal standards for a portion of these securities. If accounting standards are changed in the future, however, periodic income or losses may vary widely. Also, the Company plans to limit increases in interest-bearing liabilities by selling investment securities to procure capital needed for mergers and acquisitions, overseas business development, and capital investment, but misalignment of the timing between sale and investment may give rise to unforeseen circumstances. In addition, Nisshinbo made a trust contribution of ¥14.7 billion in response to losses resulting from a change in accounting standards regarding employee retirement plans made in 2000. In the fiscal year under review, the Company realized a valuation loss of ¥4.2 billion on the contributed portion. The Company amortizes retirement benefits evenly over an average 15-year employment term, and therefore, retirement benefit expenses affected by fluctuations in stock prices could have an impact on income for the fiscal year.
Risks Associated with the Utilization of Idle LandTo reform its business structures, Nisshinbo is taking active measures to close certain business sites and subsequently use the idle land. Such redevelopment may result in cleanup expenses, and revisions to laws could impede redevelopment.
Product Quality RisksThe vast majority of the Nisshinbo Group’s products are manufactured in accordance with international quality control standards, but there is no guarantee that quality-related problems will not occur in the future. The Company has product liability insurance, but the occurrence of a large liability could have an adverse impact on the Company’s business results.
Risks Associated with Market Shifts relating to Product Sale Prices and Raw Material ProcurementSome of the Nisshinbo Group’s products are significantly affected by fluctuations in market prices in conjunction with competition with other companies and market developments. Changes in currency exchange rates when procuring imported raw materials may also curtail income.
Risks Associated with Changes in Customers’ Business PerformanceThe customers of the Nisshinbo Group’s automobile brake business are automobile manufacturers that conduct business globally. Changes in the business results of such client companies are a factor that the Group cannot control, and consequently, they may have an impact on our financial results.
Risks Associated with the Electronics Product BusinessSemiconductors account for more than 80% of the consolidated sales of New Japan Radio Co., Ltd., which is a consolidated subsidiary, and changes in demand in semiconductor markets may have an impact on business results. Also, overseas sales account for approximately half of New Japan Radio’s sales, and changes in exchange rates may have an impact on business results.
Risk Information
Nisshinbo implemented a corporate split, spun off its major business segments, and adopted a holding company structure effective April 1, 2009. All rights and duties relating to the textile business were transferred to Nisshinbo Textile Inc., rights and duties relating to the automobile brake business were transferred to Nisshinbo Brake Inc., rights and duties relating to the paper business were transferred to Nisshinbo Paper Products Inc., rights and duties relating
Corporation Division and Transition to Holding Company Structure
to the mechatronics business were transferred to Nisshinbo Mechatronics Inc., and rights and duties relating to the chemical business were transferred to Nisshinbo Chemical Inc. As consideration for these transfers, all shares were granted to Nisshinbo Holdings at the time of their issuance by the respective companies. On the effective date of the corporate split, Nisshinbo changed its name to Nisshinbo Holdings Inc.
Six-Year Summary
(millions of yen)
2004 2005 2006 2007 2008 2009
Net Sales 226,883 243,421 278,617 312,825 322,412 286,167
Operating Income 8,496 9,651 10,524 11,551 12,034 408
Net Income (loss) 3,919 8,199 11,183 15,107 12,290 (1,286)
Equity 214,132 222,771 266,434 282,015 245,909 193,698
Total Assets 368,444 370,168 491,230 472,670 424,706 366,858
Shareholders’ Equity Ratio (%) 58.1 60.2 54.2 55.3 53.0 49.0
Return on Assets (%) 1.2 2.2 2.6 3.1 2.7 (0.3)
Return on Equity (%) 2.0 3.8 4.6 5.7 5.1 (0.6)
Payout Ratio (%)* 51.9 28.1 32.2 35.6 ̶ ―
Capital Expenditures 8,989 12,504 16,548 18,306 24,280 16,872
Depreciation and Amortization 11,776 11,046 13,835 14,984 16,890 18,025
Common Shares Issued 216,580,939 208,198,939 208,198,939 201,698,939 198,698,939 184,098,939
Per Share (in yen):
Net Income (loss) 17.86 39.03 53.21 74.19 63.34 (7.08)
Shareholders’ Equity 1,030.98 1,072.54 1,283.21 1,301.14 1,179.43 985.19
Cash Dividends 7.00 10.00 10.00 15.00 15.00 15.00
Number of Employees 9,875 9,505 12,602 12,744 13,253 12,726
*Payout Ratio is on a non-consolidated basis.
0
50
100
150
200
250
300
350
’04 ’05 ’06 ’07 ’08 ’09-10
0
10
20
30
40
50
60
70
80
90
100
’04 ’05 ’06 ’07 ’08 ’09-3
0
3
6
9
12
15
18
’04 ’05 ’06 ’07 ’08 ’09
Net Sales Net Income (loss) Net Income (loss) per Share(billions of yen) (yen)(billions of yen)

Financial Section
39
Nis
shin
bo
Ann
ual R
epor
t 20
09
38
Nisshinb
oA
nnual Rep
ort 2009
Consolidated Balance Sheets(March 31, 2009 and 2008)
ASSETS (thousands of US dollars) (millions of yen) (Note 1)
2009 2008 2009
Current assets: Cash and cash equivalents ............................................................. ¥ 29,203 ¥ 23,261 $ 292,030 Time deposits (Note 5) .................................................................... 3,202 2,505 32,020 Marketable securities (Note 4) ......................................................... 1,637 1,858 16,370
Receivables Notes receivable, trade ............................................................... 9,415 11,063 94,150 Accounts receivable, trade .......................................................... 45,067 58,922 450,670 Unconsolidated subsidiaries and affiliates .................................... 6,649 7,342 66,490 Other .......................................................................................... 2,182 1,344 21,820 63,313 78,671 633,130
Less allowance for doubtful accounts ......................................... (320) (549) (3,200) 62,993 78,122 629,930
Inventories (Note 3) ......................................................................... 48,217 52,179 482,170 Deferred tax assets (Note 7) ............................................................ 1,665 2,853 16,650 Other current assets........................................................................ 2,948 2,510 29,480 Total current assets .......................................................... 149,865 163,288 1,498,650
Property, plant and equipment (Note 5): Land ............................................................................................... 28,063 26,987 280,630 Buildings and structures .................................................................. 127,373 131,627 1,273,730 Machinery, equipment and tools ...................................................... 232,833 256,442 2,328,330 Construction in progress ................................................................. 2,542 2,562 25,420 390,811 417,618 3,908,110
Less accumulated depreciation ....................................................... (272,632) (290,422) (2,726,320) 118,179 127,196 1,181,790
Investments and other assets: Investment securities (Notes 4 and 5) .............................................. 51,565 91,020 515,650 Investments in and advances to unconsolidated subsidiaries and affiliates ... 35,640 32,978 356,400 Deferred tax assets (Note 7) ............................................................ 4,000 1,743 40,000 Goodwill .......................................................................................... 329 438 3,290 Other .............................................................................................. 7,280 8,043 72,800 98,814 134,222 988,140 ¥ 366,858 ¥ 424,706 $ 3,668,580
See Notes to Consolidated Financial Statements.
LIABILITIES AND EQUITY (thousands of US dollars) (millions of yen) (Note 1)
2009 2008 2009
Current liabilities: Short-term bank loans (Note 5) ....................................................... ¥ 60,070 ¥ 41,452 $ 600,700 Commercial paper........................................................................... 18,000 10,000 180,000 Current portion of long-term debt (Note 5) ...................................... 2,432 2,880 24,320 Payables Notes and accounts payable, trade (Note 5) ............................... 21,826 32,529 218,260 Unconsolidated subsidiaries and affiliates .................................... 547 1,118 5,470 Other .......................................................................................... 6,530 8,350 65,300 28,903 41,997 289,030
Employees’ savings deposits .......................................................... 185 242 1,850 Accrued expenses .......................................................................... 6,307 7,648 63,070 Accrued income taxes .................................................................... 929 2,546 9,290 Deferred tax liabilities (Note 7) ......................................................... 1 1 10 Other current liabilities (Note 5) ........................................................ 3,348 2,708 33,480 Total current liabilities ....................................................... 120,175 109,474 1,201,750
Long-term liabilities: Long-term debt (Note 5).................................................................. 4,601 3,949 46,010 Accrued severance benefits (Note 6) ............................................... 25,634 28,573 256,340 Deferred tax liabilities (Note 7) ......................................................... 4,748 20,033 47,480 Other long-term liabilities (Note 5) .................................................... 18,002 16,768 180,020 52,985 69,323 529,850
Commitments and contingencies (Note 11)
Equity (Note 12): Common stock: Authorized ̶ 371,755,000 shares Issued 2009 ― 184,098,939 shares 2008 ̶ 198,698,939 shares ................................................. 27,588 27,588 275,880 Capital surplus ................................................................................ 20,401 20,401 204,010 Stock acquisition rights ................................................................... 107 59 1,070 Retained earnings ........................................................................... 130,521 153,746 1,305,210 Net unrealized gain on available-for-sale securities .......................... 10,555 30,145 105,550 Deferred gain (loss) on derivatives under hedge accounting ............ (42) (112) (420) Foreign currency translation adjustments ........................................ (8,168) 4,322 (81,680) Less shares in treasury 2009 ̶ 1,567,705 shares 2008 ̶ 7,771,654 shares ...................................................... (1,018) (10,904) (10,180) 179,944 225,245 1,799,440 Minority interests ............................................................................. 13,754 20,664 137,540 193,698 245,909 1,936,980 ¥ 366,858 ¥ 424,706 $ 3,668,580
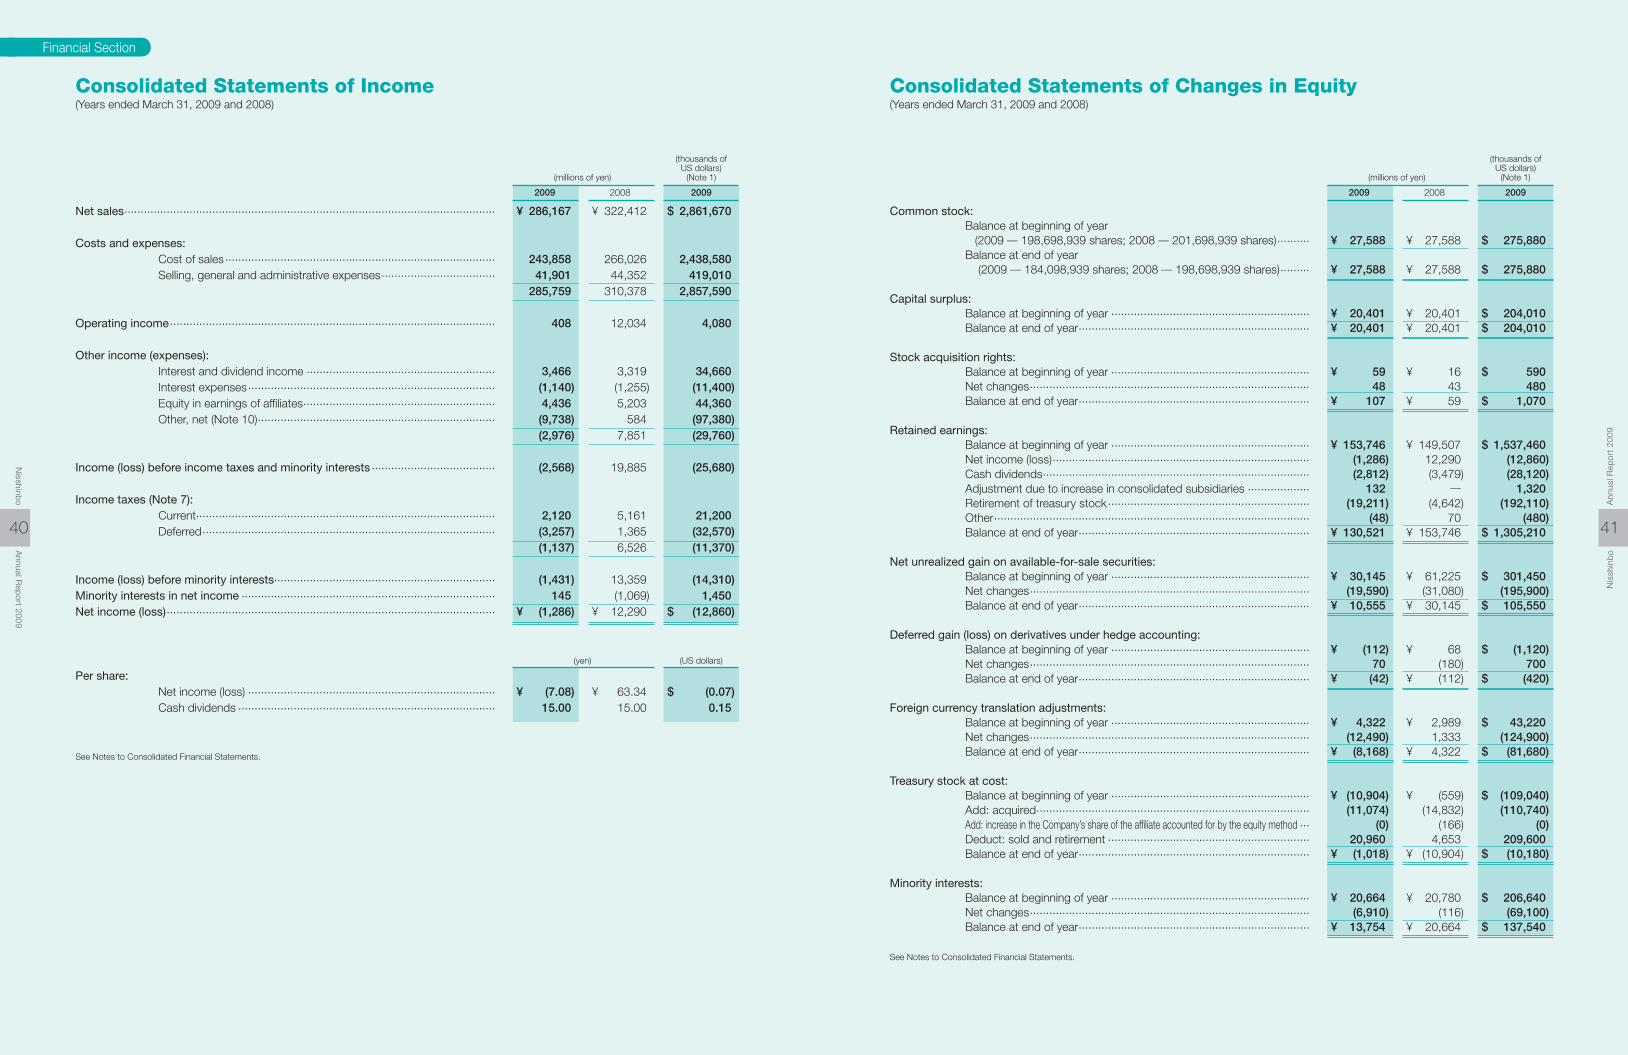
Financial Section
41
Nis
shin
bo
Ann
ual R
epor
t 20
09
40
Nisshinb
oA
nnual Rep
ort 2009
(thousands of US dollars) (millions of yen) (Note 1)
2009 2008 2009
Consolidated Statements of Income(Years ended March 31, 2009 and 2008)
Net sales .................................................................................................................. ¥ 286,167 ¥ 322,412 $ 2,861,670
Costs and expenses: Cost of sales ................................................................................... 243,858 266,026 2,438,580 Selling, general and administrative expenses ................................... 41,901 44,352 419,010 285,759 310,378 2,857,590
Operating income .................................................................................................... 408 12,034 4,080
Other income (expenses): Interest and dividend income .......................................................... 3,466 3,319 34,660 Interest expenses ............................................................................ (1,140) (1,255) (11,400) Equity in earnings of affiliates ........................................................... 4,436 5,203 44,360 Other, net (Note 10) ......................................................................... (9,738) 584 (97,380) (2,976) 7,851 (29,760)
Income (loss) before income taxes and minority interests ...................................... (2,568) 19,885 (25,680)
Income taxes (Note 7): Current............................................................................................ 2,120 5,161 21,200 Deferred .......................................................................................... (3,257) 1,365 (32,570) (1,137) 6,526 (11,370)
Income (loss) before minority interests.................................................................... (1,431) 13,359 (14,310)Minority interests in net income .............................................................................. 145 (1,069) 1,450Net income (loss) ..................................................................................................... ¥ (1,286) ¥ 12,290 $ (12,860)
(yen) (US dollars)
Per share: Net income (loss) ............................................................................ ¥ (7.08) ¥ 63.34 $ (0.07) Cash dividends ............................................................................... 15.00 15.00 0.15
See Notes to Consolidated Financial Statements.
Consolidated Statements of Changes in Equity(Years ended March 31, 2009 and 2008)
Common stock: Balance at beginning of year (2009 ̶ 198,698,939 shares; 2008 ̶ 201,698,939 shares) .......... ¥ 27,588 ¥ 27,588 $ 275,880 Balance at end of year (2009 ̶ 184,098,939 shares; 2008 ̶ 198,698,939 shares) ......... ¥ 27,588 ¥ 27,588 $ 275,880
Capital surplus: Balance at beginning of year ............................................................. ¥ 20,401 ¥ 20,401 $ 204,010 Balance at end of year ....................................................................... ¥ 20,401 ¥ 20,401 $ 204,010
Stock acquisition rights: Balance at beginning of year ............................................................. ¥ 59 ¥ 16 $ 590 Net changes ...................................................................................... 48 43 480 Balance at end of year ....................................................................... ¥ 107 ¥ 59 $ 1,070
Retained earnings: Balance at beginning of year ............................................................. ¥ 153,746 ¥ 149,507 $ 1,537,460 Net income (loss) ............................................................................... (1,286) 12,290 (12,860) Cash dividends .................................................................................. (2,812) (3,479) (28,120) Adjustment due to increase in consolidated subsidiaries ................... 132 ― 1,320 Retirement of treasury stock .............................................................. (19,211) (4,642) (192,110) Other ................................................................................................. (48) 70 (480) Balance at end of year ....................................................................... ¥ 130,521 ¥ 153,746 $ 1,305,210
Net unrealized gain on available-for-sale securities: Balance at beginning of year ............................................................. ¥ 30,145 ¥ 61,225 $ 301,450 Net changes ...................................................................................... (19,590) (31,080) (195,900) Balance at end of year ....................................................................... ¥ 10,555 ¥ 30,145 $ 105,550
Deferred gain (loss) on derivatives under hedge accounting: Balance at beginning of year ............................................................. ¥ (112) ¥ 68 $ (1,120) Net changes ...................................................................................... 70 (180) 700 Balance at end of year ....................................................................... ¥ (42) ¥ (112) $ (420)
Foreign currency translation adjustments: Balance at beginning of year ............................................................. ¥ 4,322 ¥ 2,989 $ 43,220 Net changes ...................................................................................... (12,490) 1,333 (124,900) Balance at end of year ....................................................................... ¥ (8,168) ¥ 4,322 $ (81,680)
Treasury stock at cost: Balance at beginning of year ............................................................. ¥ (10,904) ¥ (559) $ (109,040) Add: acquired .................................................................................... (11,074) (14,832) (110,740) Add: increase in the Company’s share of the affiliate accounted for by the equity method ... (0) (166) (0) Deduct: sold and retirement .............................................................. 20,960 4,653 209,600 Balance at end of year ....................................................................... ¥ (1,018) ¥ (10,904) $ (10,180)
Minority interests: Balance at beginning of year ............................................................. ¥ 20,664 ¥ 20,780 $ 206,640 Net changes ...................................................................................... (6,910) (116) (69,100) Balance at end of year ....................................................................... ¥ 13,754 ¥ 20,664 $ 137,540
See Notes to Consolidated Financial Statements.
(thousands of US dollars) (millions of yen) (Note 1)
2009 2008 2009

Financial Section
43
Nis
shin
bo
Ann
ual R
epor
t 20
09
42
Nisshinb
oA
nnual Rep
ort 2009
Consolidated Statements of Cash Flows(Years ended March 31, 2009 and 2008)
Cash flows from operating activities: Income (loss) before income taxes and minority interests ........................ ¥ (2,568) ¥ 19,885 $ (25,680) Adjustments to reconcile net income to net cash provided by operating activities: Income taxes-paid .......................................................................... (4,914) (6,126) (49,140) Depreciation and amortization ......................................................... 18,025 16,890 180,250 Amortization of goodwill .................................................................. 1,280 3,212 12,800 Equity in earnings of affiliates ........................................................... (4,436) (5,203) (44,360) Provision for (reversal of) doubtful receivables .................................. (1,076) 36 (10,760) Provision for accrued pension and severance benefits .................... 3,564 3,145 35,640 Payment of accrued pension and severance benefits ...................... (6,147) (2,530) (61,470) (Gain) loss on sale of property, plant and equipment........................ 1,818 (2,250) 18,180 Gain on sale of investment securities and investments in and advances to unconsolidated subsidiaries and affiliates .......... (3,948) (3,678) (39,480) Loss on write-down of investments in and advances to unconsolidated subsidiaries and affiliates ................................. 3,120 5 31,200 Loss on plant closures .................................................................... 2,004 1,403 20,040 Other, net ........................................................................................ 848 666 8,480 Changes in operating assets and liabilities: Receivables..................................................................................... 14,540 3,085 145,400 Inventories ...................................................................................... 1,602 2,060 16,020 Payables ......................................................................................... (9,974) (4,383) (99,740) Other, net ........................................................................................ (1,799) (1,438) (17,990) Net cash provided by operating activities ......................... 11,939 24,779 119,390
Cash flows from investing activities: Proceeds from sale of property, plant and equipment .............................. 770 3,776 7,700 Proceeds from sale of investment securities and investments in and advances to unconsolidated subsidiaries and affiliates ................... 7,644 8,014 76,440 Payment for purchase of property, plant and equipment .......................... (17,669) (21,331) (176,690) Payment for purchase of investment securities and investments in and advances to unconsolidated subsidiaries and affiliates ................... (2,095) (7,669) (20,950) Increase in time deposits ......................................................................... (1,317) (489) (13,170) Cash acquired from newly consolidated subsidiaries, net of payment for purchase of companies ........................................... ― (792) ― Other, net ................................................................................................ (1,726) (656) (17,260) Net cash used in investing activities ................................. (14,393) (19,147) (143,930)
Cash flows from financing activities: Proceeds from issuance of long-term debt .............................................. 3,570 1,859 35,700 Repayment of long-term debt ................................................................. (2,420) (3,972) (24,200) Increase (decrease) in short-term bank loans........................................... 19,196 (2,710) 191,960 Increase in commercial paper ................................................................. 8,000 10,000 80,000 Cash dividends paid ................................................................................ (2,812) (3,479) (28,120) Payment for purchase of treasury stock .................................................. (11,074) (14,832) (110,740) Increase (decrease) in other long-term liabilities ....................................... (402) 4,702 (4,020) Other, net ................................................................................................ (2,118) (397) (21,180) Net cash provided by (used in) investing activities ............ 11,940 (8,829) 119,400
Effect of exchange rate changes on cash ............................................................... (3,947) 693 (39,470)Net increase (decrease) in cash and cash equivalents ........................................... 5,539 (2,504) 55,390Cash and cash equivalents of newly consolidated subsidiaries at beginning of year .... 403 1 4,030
Cash and cash equivalents at beginning of year .................................................... 23,261 25,764 232,610Cash and cash equivalents at end of year .............................................................. ¥ 29,203 ¥ 23,261 $ 292,030
See Notes to Consolidated Financial Statements.
(thousands of US dollars) (millions of yen) (Note 1)
2009 2008 2009
Notes to Consolidated Financial Statements
1. BASIS OF PRESENTING CONSOLIDATED FINANCIAL STATEMENTSThe accompanying consolidated financial statements have been prepared in accordance with the provisions set forth in the Japanese Securities and Exchange Law and its related accounting regulations, and in conformity with accounting principles and practices generally accepted in Japan, which are different in certain respects as to application and disclosure requirements of International Financial Reporting Standards. In addition, the accompanying footnotes include information which is not required under generally accepted accounting principles and practices in Japan but is presented herein as additional information. The United States dollar ($) amounts included herein are given solely for convenience and are stated, as a matter of arithmetical computation only, at the rate of ¥100 = $1, the approximate exchange rate at March 31, 2009. The translations should not be construed as representations that the Japanese yen amounts have been, could have been, or could in the future be, converted into United States dollars.
2. SUMMARY OF SIGNIFICANT ACCOUNTING POLICIES(a) Consolidation
The consolidated financial statements include the accounts of Nisshinbo Industries, Inc. (hereinafter the “Company”) and its significant subsidiaries (together, the “Group”). Under the control or influence concept, those companies in which the Parent, directly or indirectly, is able to exercise control over operations are fully consolidated, and those companies over which the Group has the ability to exercise significant influence are accounted for by the equity method. Investments in unconsolidated subsidiaries and associated companies are accounted for by the equity method. Investments in the remaining unconsolidated subsidiaries and associated companies are stated at cost. If the equity method of accounting had been applied to the investments in these companies, the effect on the accompanying consolidated financial statements would not be material. All significant intercompany balances and transactions have been eliminated in consolidation. All material unrealized profit included in assets resulting from transactions within the Group is eliminated.
(b) Foreign currency transactions
All short-term and long-term monetary receivables and payables denominated in foreign currencies are translated into Japanese yen at the exchange rates at the balance sheet date. The foreign exchange gains and losses from translation are recognized in the income statement to the extent that they are not hedged by forward exchange contracts. Investments in and advances to unconsolidated subsidiaries and affiliates in foreign currencies are translated at the historical rates effective at the dates of transaction from which such accounts were originated.
(c) Foreign currency financial statements
The balance sheet accounts of the consolidated foreign subsidiaries are translated into Japanese yen at the current exchange rate. Revenue and expense accounts of consolidated foreign subsidiaries are translated into yen at the average exchange rate.
(d) Cash and cash equivalents
Cash and cash equivalents include cash on hand, deposits placed with banks on demand and highly liquid investments with insignificant risk of changes in value which have maturities of six months or less when purchased.
(e) Inventories
Inventories are stated principally at the lower of cost or market, cost being substantially determined by the average cost method.
(f) Marketable securities and other investments
The Group classifies all of its marketable securities as available-for-sale which are reported at fair value, with unrealized gains and losses included in equity as net unrealized gain on available-for-sale securities. Other investments without quoted market prices are stated at cost. Realized gains or losses on the sale of securities are based on the average cost of a particular security held at the time of sale. Marketable securities and other investment securities are regularly reviewed for other-than-temporary declines in carrying amount based on criteria that include the length of time and the extent to which the market value has been less than cost, the financial condition and near-term prospects of the issuer and the Company’s intent and ability to retain marketable securities and investment securities for a period of time sufficient to allow for any anticipated recovery in market value. When such a decline exists, the Company recognizes an impairment loss to the extent of such decline.
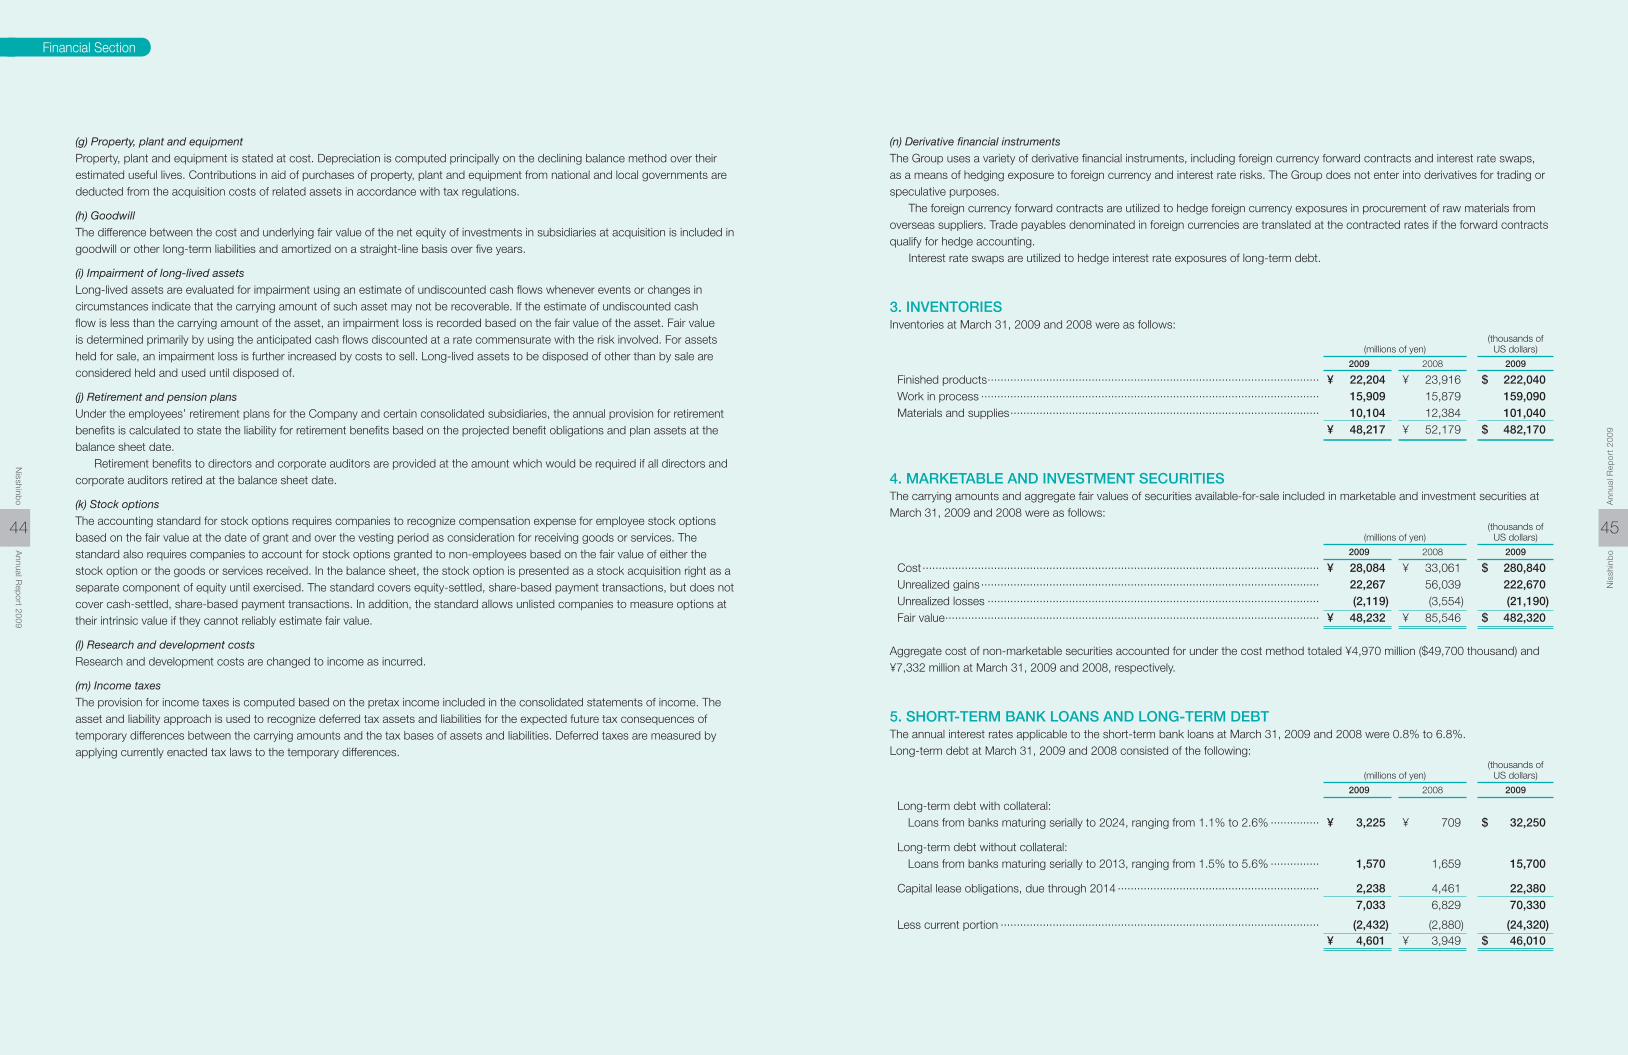
Financial Section
45
Nis
shin
bo
Ann
ual R
epor
t 20
09
44
Nisshinb
oA
nnual Rep
ort 2009
(g) Property, plant and equipment
Property, plant and equipment is stated at cost. Depreciation is computed principally on the declining balance method over their estimated useful lives. Contributions in aid of purchases of property, plant and equipment from national and local governments are deducted from the acquisition costs of related assets in accordance with tax regulations.
(h) Goodwill
The difference between the cost and underlying fair value of the net equity of investments in subsidiaries at acquisition is included in goodwill or other long-term liabilities and amortized on a straight-line basis over five years.
(i) Impairment of long-lived assets
Long-lived assets are evaluated for impairment using an estimate of undiscounted cash flows whenever events or changes in circumstances indicate that the carrying amount of such asset may not be recoverable. If the estimate of undiscounted cash flow is less than the carrying amount of the asset, an impairment loss is recorded based on the fair value of the asset. Fair value is determined primarily by using the anticipated cash flows discounted at a rate commensurate with the risk involved. For assets held for sale, an impairment loss is further increased by costs to sell. Long-lived assets to be disposed of other than by sale are considered held and used until disposed of.
(j) Retirement and pension plans
Under the employees’ retirement plans for the Company and certain consolidated subsidiaries, the annual provision for retirement benefits is calculated to state the liability for retirement benefits based on the projected benefit obligations and plan assets at the balance sheet date. Retirement benefits to directors and corporate auditors are provided at the amount which would be required if all directors and corporate auditors retired at the balance sheet date.
(k) Stock options
The accounting standard for stock options requires companies to recognize compensation expense for employee stock options based on the fair value at the date of grant and over the vesting period as consideration for receiving goods or services. The standard also requires companies to account for stock options granted to non-employees based on the fair value of either the stock option or the goods or services received. In the balance sheet, the stock option is presented as a stock acquisition right as a separate component of equity until exercised. The standard covers equity-settled, share-based payment transactions, but does not cover cash-settled, share-based payment transactions. In addition, the standard allows unlisted companies to measure options at their intrinsic value if they cannot reliably estimate fair value.
(l) Research and development costs
Research and development costs are changed to income as incurred.
(m) Income taxes
The provision for income taxes is computed based on the pretax income included in the consolidated statements of income. The asset and liability approach is used to recognize deferred tax assets and liabilities for the expected future tax consequences of temporary differences between the carrying amounts and the tax bases of assets and liabilities. Deferred taxes are measured by applying currently enacted tax laws to the temporary differences.
(n) Derivative financial instruments
The Group uses a variety of derivative financial instruments, including foreign currency forward contracts and interest rate swaps, as a means of hedging exposure to foreign currency and interest rate risks. The Group does not enter into derivatives for trading or speculative purposes. The foreign currency forward contracts are utilized to hedge foreign currency exposures in procurement of raw materials from overseas suppliers. Trade payables denominated in foreign currencies are translated at the contracted rates if the forward contracts qualify for hedge accounting. Interest rate swaps are utilized to hedge interest rate exposures of long-term debt.
3. INVENTORIESInventories at March 31, 2009 and 2008 were as follows: (thousands of (millions of yen) US dollars)
2009 2008 2009
Finished products ...................................................................................................... ¥ 22,204 ¥ 23,916 $ 222,040 Work in process ........................................................................................................ 15,909 15,879 159,090 Materials and supplies ............................................................................................... 10,104 12,384 101,040 ¥ 48,217 ¥ 52,179 $ 482,170
4. MARKETABLE AND INVESTMENT SECURITIESThe carrying amounts and aggregate fair values of securities available-for-sale included in marketable and investment securities at March 31, 2009 and 2008 were as follows: (thousands of (millions of yen) US dollars)
2009 2008 2009
Cost .......................................................................................................................... ¥ 28,084 ¥ 33,061 $ 280,840 Unrealized gains ........................................................................................................ 22,267 56,039 222,670 Unrealized losses ...................................................................................................... (2,119) (3,554) (21,190) Fair value ................................................................................................................... ¥ 48,232 ¥ 85,546 $ 482,320
Aggregate cost of non-marketable securities accounted for under the cost method totaled ¥4,970 million ($49,700 thousand) and ¥7,332 million at March 31, 2009 and 2008, respectively.
5. SHORT-TERM BANK LOANS AND LONG-TERM DEBTThe annual interest rates applicable to the short-term bank loans at March 31, 2009 and 2008 were 0.8% to 6.8%.Long-term debt at March 31, 2009 and 2008 consisted of the following: (thousands of (millions of yen) US dollars)
2009 2008 2009
Long-term debt with collateral: Loans from banks maturing serially to 2024, ranging from 1.1% to 2.6% ............... ¥ 3,225 ¥ 709 $ 32,250
Long-term debt without collateral: Loans from banks maturing serially to 2013, ranging from 1.5% to 5.6% ............... 1,570 1,659 15,700
Capital lease obligations, due through 2014 .............................................................. 2,238 4,461 22,380 7,033 6,829 70,330
Less current portion .................................................................................................. (2,432) (2,880) (24,320) ¥ 4,601 ¥ 3,949 $ 46,010

Financial Section
Annual maturities of long-term debt were as follows:
Year ending March 31, (millions of yen) (thousands of US dollars)
2010 ................................................................................................................................. ¥ 2,432 $ 24,320
2011 ................................................................................................................................. 1,229 12,290
2012 ................................................................................................................................. 637 6,370
2013 ................................................................................................................................ 1,035 10,350
2014 and thereafter........................................................................................................... 1,700 17,000
¥ 7,033 $ 70,330
At March 31, 2009 and 2008, net book value of assets pledged as collateral for short-term bank loans and long-term debt were as follows: (thousands of (millions of yen) US dollars)
2009 2008 2009
Property, plant and equipment ..................................................................................... ¥ 9,272 ¥ 8,861 $ 92,720
In addition, pledged assets as collateral for liabilities other than the above were as follows:
Assets pledged: (thousands of (millions of yen) US dollars)
2009 2008 2009
Property, plant and equipment ............................................................................. ¥ 8,692 ¥ 9,225 $ 86,920 Investment securities ........................................................................................... 402 405 4,020 Time deposits ...................................................................................................... 209 209 2,090 ¥ 9,303 ¥ 9,839 $ 93,030
Liabilities with collateral: (thousands of (millions of yen) US dollars)
2009 2008 2009
Other long-term liabilities ..................................................................................... ¥ 9,396 ¥ 9,396 $ 93,960 Notes and accounts payable, trade ..................................................................... 313 181 3,130 Other current liabilities ......................................................................................... 185 187 1,850 ¥ 9,894 ¥ 9,764 $ 98,940
47
Nis
shin
bo
Ann
ual R
epor
t 20
09
46
Nisshinb
oA
nnual Rep
ort 2009
6. RETIREMENT AND PENSION PLANSUnder most circumstances, employees terminating their employment are entitled to retirement benefits determined based on the rate of pay at termination, years of service and certain other factors. The Company and certain domestic subsidiaries have basically two types of pension plans for employees: a non-contributory and a contributory funded defined benefit pension plan. The plan also provides for lump-sum retirement benefits, payable upon earlier termination of employment. The Company has established an employee retirement benefit trust. The liability for retirement benefits for directors and corporate auditors at March 31, 2009 and 2008 were ¥478 million ($4,780 thousand) and ¥455 million. The retirement benefits for directors and corporate auditors are paid subject to the approval of the shareholders. The liability for employees’ retirement benefits at March 31, 2009 and 2008 consisted of the following:
(thousands of (millions of yen) US dollars)
2009 2008 2009
Projected benefit obligation ....................................................................................... ¥ 50,401 ¥ 52,531 $ 504,010 Fair value of plan assets ............................................................................................ (17,758) (23,296) (177,580) 32,643 29,235 326,430
Unrecognized prior service cost ................................................................................ 2,252 2,492 22,520 Unrecognized actuarial loss ....................................................................................... (12,482) (6,644) (124,820) Unrecognized transitional obligation .......................................................................... (87) (144) (870) 22,326 24,939 223,260
Prepaid pension cost................................................................................................. 2,830 3,179 28,300 Net liability ........................................................................................................... ¥ 25,156 ¥ 28,118 $ 251,560
The components of net periodic retirement benefit costs for the years ended March 31, 2009 and 2008 were as follows: (thousands of (millions of yen) US dollars)
2009 2008 2009
Service cost .............................................................................................................. ¥ 2,447 ¥ 2,526 $ 24,470 Interest cost .............................................................................................................. 1,095 1,053 10,950 Expected return on plan assets ................................................................................. (508) (460) (5,080) Amortization of prior service cost............................................................................... (240) (242) (2,400) Recognized actuarial loss .......................................................................................... 698 232 6,980 Amortization of transitional obligation ........................................................................ 56 48 560 Net periodic benefit costs ...................................................................................... 3,548 3,157 35,480 Defined contribution pension cost ............................................................................. 94 94 940 Retirement benefits paid due to restructuring of business operations ........................ 3,844 32 38,440 Total ....................................................................................................................... ¥ 7,486 ¥ 3,283 $ 74,860
Assumptions used for the years ended March 31, 2009 and 2008 were set forth as follows: 2009 2008
Discount rate ............................................................................................................. 2.0% 2.0%–2.5% Expected rate of return on plan assets ...................................................................... 1.9%–3.3% 1.4%–2.5% Amortization period of prior service cost .................................................................... 10–15 years 10–15 years Recognition period of actuarial gain / loss ................................................................. 10–15 years 10–15 years Amortization period of transitional obligation .............................................................. 10 years 10 years
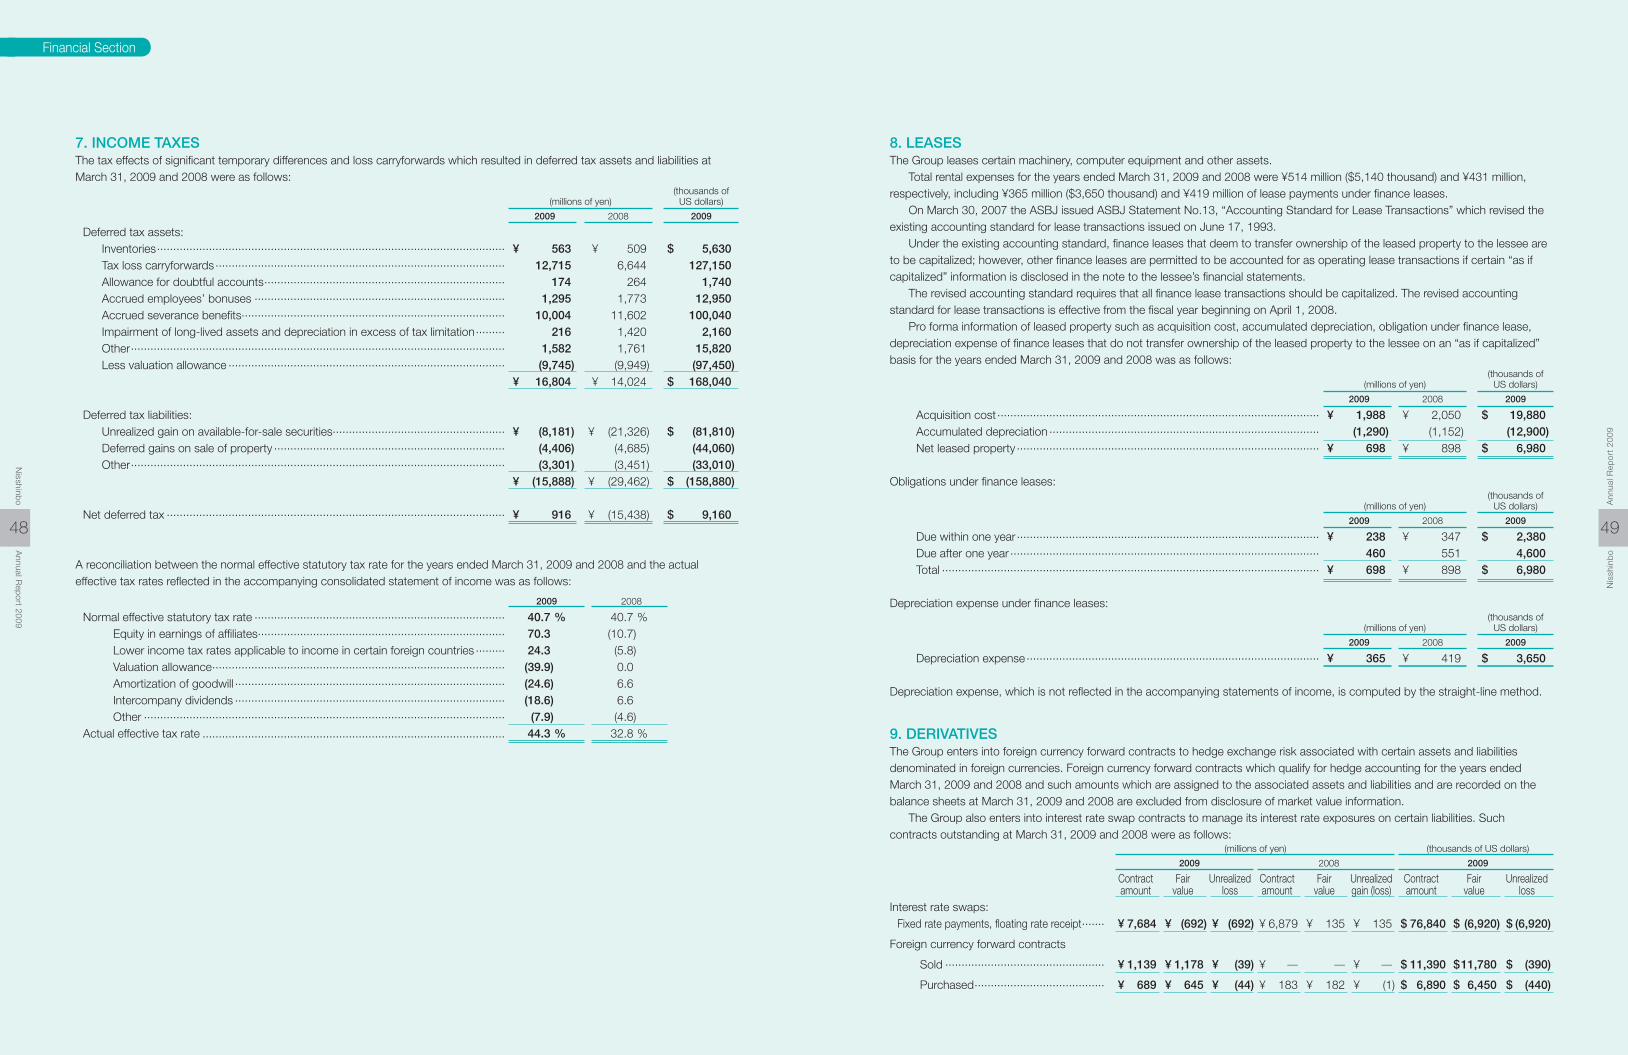
Financial Section
7. INCOME TAXESThe tax effects of significant temporary differences and loss carryforwards which resulted in deferred tax assets and liabilities at March 31, 2009 and 2008 were as follows: (thousands of (millions of yen) US dollars)
2009 2008 2009
Deferred tax assets: Inventories ........................................................................................................... ¥ 563 ¥ 509 $ 5,630 Tax loss carryforwards ......................................................................................... 12,715 6,644 127,150 Allowance for doubtful accounts .......................................................................... 174 264 1,740 Accrued employees’ bonuses ............................................................................. 1,295 1,773 12,950 Accrued severance benefits................................................................................. 10,004 11,602 100,040 Impairment of long-lived assets and depreciation in excess of tax limitation ......... 216 1,420 2,160 Other ................................................................................................................... 1,582 1,761 15,820 Less valuation allowance ..................................................................................... (9,745) (9,949) (97,450) ¥ 16,804 ¥ 14,024 $ 168,040
Deferred tax liabilities: Unrealized gain on available-for-sale securities..................................................... ¥ (8,181) ¥ (21,326) $ (81,810) Deferred gains on sale of property ....................................................................... (4,406) (4,685) (44,060) Other ................................................................................................................... (3,301) (3,451) (33,010) ¥ (15,888) ¥ (29,462) $ (158,880)
Net deferred tax ........................................................................................................ ¥ 916 ¥ (15,438) $ 9,160
A reconciliation between the normal effective statutory tax rate for the years ended March 31, 2009 and 2008 and the actual effective tax rates reflected in the accompanying consolidated statement of income was as follows:
2009 2008
Normal effective statutory tax rate ............................................................................. 40.7 % 40.7 % Equity in earnings of affiliates............................................................................ 70.3 (10.7) Lower income tax rates applicable to income in certain foreign countries ......... 24.3 (5.8) Valuation allowance .......................................................................................... (39.9) 0.0 Amortization of goodwill ................................................................................... (24.6) 6.6 Intercompany dividends ................................................................................... (18.6) 6.6 Other ............................................................................................................... (7.9) (4.6) Actual effective tax rate ............................................................................................. 44.3 % 32.8 %
49
Nis
shin
bo
Ann
ual R
epor
t 20
09
48
Nisshinb
oA
nnual Rep
ort 2009
8. LEASESThe Group leases certain machinery, computer equipment and other assets. Total rental expenses for the years ended March 31, 2009 and 2008 were ¥514 million ($5,140 thousand) and ¥431 million, respectively, including ¥365 million ($3,650 thousand) and ¥419 million of lease payments under finance leases. On March 30, 2007 the ASBJ issued ASBJ Statement No.13, “Accounting Standard for Lease Transactions” which revised the existing accounting standard for lease transactions issued on June 17, 1993. Under the existing accounting standard, finance leases that deem to transfer ownership of the leased property to the lessee are to be capitalized; however, other finance leases are permitted to be accounted for as operating lease transactions if certain “as if capitalized” information is disclosed in the note to the lessee’s financial statements. The revised accounting standard requires that all finance lease transactions should be capitalized. The revised accounting standard for lease transactions is effective from the fiscal year beginning on April 1, 2008. Pro forma information of leased property such as acquisition cost, accumulated depreciation, obligation under finance lease, depreciation expense of finance leases that do not transfer ownership of the leased property to the lessee on an “as if capitalized” basis for the years ended March 31, 2009 and 2008 was as follows: (thousands of (millions of yen) US dollars)
2009 2008 2009
Acquisition cost ................................................................................................... ¥ 1,988 ¥ 2,050 $ 19,880 Accumulated depreciation ................................................................................... (1,290) (1,152) (12,900) Net leased property ............................................................................................. ¥ 698 ¥ 898 $ 6,980
Obligations under finance leases: (thousands of (millions of yen) US dollars)
2009 2008 2009
Due within one year ............................................................................................. ¥ 238 ¥ 347 $ 2,380 Due after one year ............................................................................................... 460 551 4,600 Total .................................................................................................................... ¥ 698 ¥ 898 $ 6,980
Depreciation expense under finance leases: (thousands of (millions of yen) US dollars)
2009 2008 2009
Depreciation expense .......................................................................................... ¥ 365 ¥ 419 $ 3,650 Depreciation expense, which is not reflected in the accompanying statements of income, is computed by the straight-line method.
9. DERIVATIVESThe Group enters into foreign currency forward contracts to hedge exchange risk associated with certain assets and liabilities denominated in foreign currencies. Foreign currency forward contracts which qualify for hedge accounting for the years ended March 31, 2009 and 2008 and such amounts which are assigned to the associated assets and liabilities and are recorded on the balance sheets at March 31, 2009 and 2008 are excluded from disclosure of market value information. The Group also enters into interest rate swap contracts to manage its interest rate exposures on certain liabilities. Such contracts outstanding at March 31, 2009 and 2008 were as follows: (millions of yen) (thousands of US dollars)
2009 2008 2009
Contract Fair Unrealized Contract Fair Unrealized Contract Fair Unrealized amount value loss amount value gain (loss) amount value lossInterest rate swaps: Fixed rate payments, floating rate receipt ....... ¥ 7,684 ¥ (692) ¥ (692) ¥ 6,879 ¥ 135 ¥ 135 $ 76,840 $ (6,920) $ (6,920)
Foreign currency forward contracts
Sold ................................................. ¥ 1,139 ¥ 1,178 ¥ (39) ¥ ̶ ̶ ¥ ̶ $ 11,390 $ 11,780 $ (390)
Purchased ........................................ ¥ 689 ¥ 645 ¥ (44) ¥ 183 ¥ 182 ¥ (1) $ 6,890 $ 6,450 $ (440)
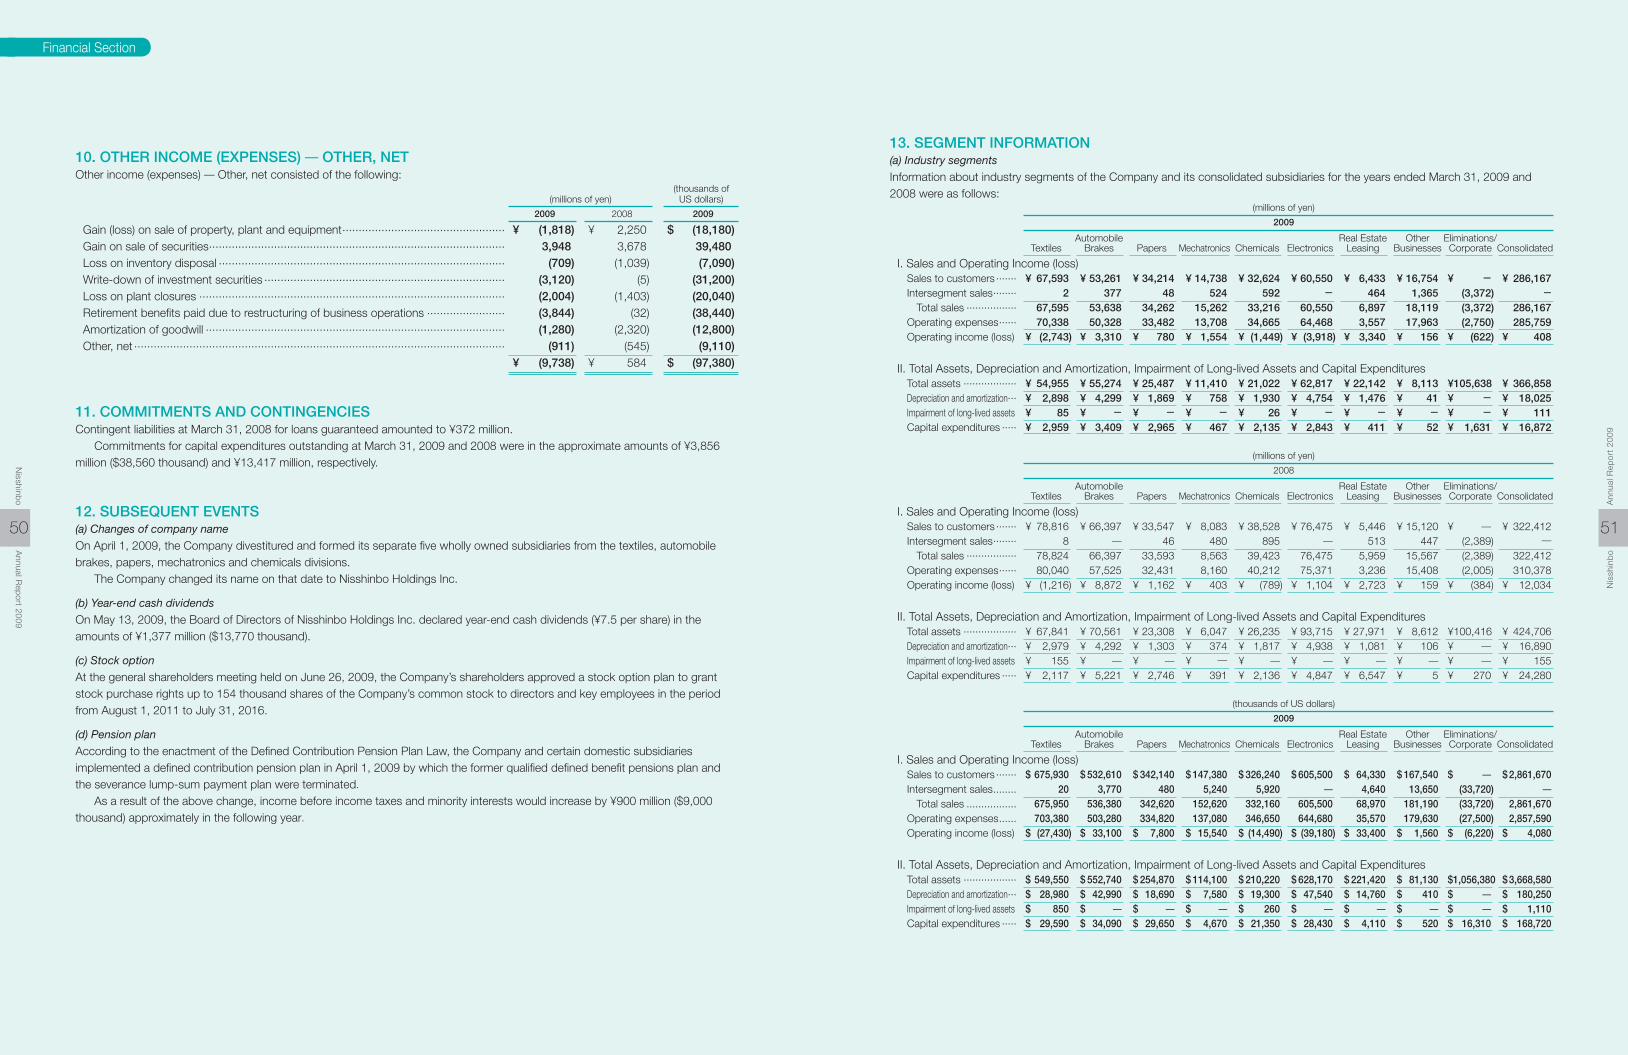
Financial Section
10. OTHER INCOME (EXPENSES) ̶ OTHER, NETOther income (expenses) ̶ Other, net consisted of the following: (thousands of (millions of yen) US dollars)
2009 2008 2009
Gain (loss) on sale of property, plant and equipment .................................................. ¥ (1,818) ¥ 2,250 $ (18,180) Gain on sale of securities ........................................................................................... 3,948 3,678 39,480 Loss on inventory disposal ........................................................................................ (709) (1,039) (7,090) Write-down of investment securities .......................................................................... (3,120) (5) (31,200) Loss on plant closures .............................................................................................. (2,004) (1,403) (20,040) Retirement benefits paid due to restructuring of business operations ........................ (3,844) (32) (38,440) Amortization of goodwill ............................................................................................ (1,280) (2,320) (12,800) Other, net .................................................................................................................. (911) (545) (9,110) ¥ (9,738) ¥ 584 $ (97,380)
11. COMMITMENTS AND CONTINGENCIESContingent liabilities at March 31, 2008 for loans guaranteed amounted to ¥372 million. Commitments for capital expenditures outstanding at March 31, 2009 and 2008 were in the approximate amounts of ¥3,856 million ($38,560 thousand) and ¥13,417 million, respectively.
12. SUBSEQUENT EVENTS(a) Changes of company name
On April 1, 2009, the Company divestitured and formed its separate five wholly owned subsidiaries from the textiles, automobile brakes, papers, mechatronics and chemicals divisions. The Company changed its name on that date to Nisshinbo Holdings Inc.
(b) Year-end cash dividends
On May 13, 2009, the Board of Directors of Nisshinbo Holdings Inc. declared year-end cash dividends (¥7.5 per share) in the amounts of ¥1,377 million ($13,770 thousand).
(c) Stock option
At the general shareholders meeting held on June 26, 2009, the Company’s shareholders approved a stock option plan to grant stock purchase rights up to 154 thousand shares of the Company’s common stock to directors and key employees in the period from August 1, 2011 to July 31, 2016.
(d) Pension plan
According to the enactment of the Defined Contribution Pension Plan Law, the Company and certain domestic subsidiaries implemented a defined contribution pension plan in April 1, 2009 by which the former qualified defined benefit pensions plan and the severance lump-sum payment plan were terminated. As a result of the above change, income before income taxes and minority interests would increase by ¥900 million ($9,000 thousand) approximately in the following year.
51
Nis
shin
bo
Ann
ual R
epor
t 20
09
50
Nisshinb
oA
nnual Rep
ort 2009
13. SEGMENT INFORMATION(a) Industry segments
Information about industry segments of the Company and its consolidated subsidiaries for the years ended March 31, 2009 and 2008 were as follows: (millions of yen)
2009
Automobile Real Estate Other Eliminations/ Textiles Brakes Papers Mechatronics Chemicals Electronics Leasing Businesses Corporate Consolidated
I. Sales and Operating Income (loss) Sales to customers ....... ¥ 67,593 ¥ 53,261 ¥ 34,214 ¥ 14,738 ¥ 32,624 ¥ 60,550 ¥ 6,433 ¥ 16,754 ¥ - ¥ 286,167 Intersegment sales ........ 2 377 48 524 592 - 464 1,365 (3,372) - Total sales ................. 67,595 53,638 34,262 15,262 33,216 60,550 6,897 18,119 (3,372) 286,167 Operating expenses ...... 70,338 50,328 33,482 13,708 34,665 64,468 3,557 17,963 (2,750) 285,759 Operating income (loss) ¥ (2,743) ¥ 3,310 ¥ 780 ¥ 1,554 ¥ (1,449) ¥ (3,918) ¥ 3,340 ¥ 156 ¥ (622) ¥ 408
II. Total Assets, Depreciation and Amortization, Impairment of Long-lived Assets and Capital Expenditures Total assets .................. ¥ 54,955 ¥ 55,274 ¥ 25,487 ¥ 11,410 ¥ 21,022 ¥ 62,817 ¥ 22,142 ¥ 8,113 ¥ 105,638 ¥ 366,858 Depreciation and amortization... ¥ 2,898 ¥ 4,299 ¥ 1,869 ¥ 758 ¥ 1,930 ¥ 4,754 ¥ 1,476 ¥ 41 ¥ - ¥ 18,025 Impairment of long-lived assets ¥ 85 ¥ - ¥ - ¥ - ¥ 26 ¥ - ¥ - ¥ - ¥ - ¥ 111 Capital expenditures ..... ¥ 2,959 ¥ 3,409 ¥ 2,965 ¥ 467 ¥ 2,135 ¥ 2,843 ¥ 411 ¥ 52 ¥ 1,631 ¥ 16,872
(millions of yen)
2008
Automobile Real Estate Other Eliminations/ Textiles Brakes Papers Mechatronics Chemicals Electronics Leasing Businesses Corporate Consolidated
I. Sales and Operating Income (loss) Sales to customers ....... ¥ 78,816 ¥ 66,397 ¥ 33,547 ¥ 8,083 ¥ 38,528 ¥ 76,475 ¥ 5,446 ¥ 15,120 ¥ ̶ ¥ 322,412 Intersegment sales ........ 8 ̶ 46 480 895 ̶ 513 447 (2,389) ― Total sales ................. 78,824 66,397 33,593 8,563 39,423 76,475 5,959 15,567 (2,389) 322,412 Operating expenses ...... 80,040 57,525 32,431 8,160 40,212 75,371 3,236 15,408 (2,005) 310,378 Operating income (loss) ¥ (1,216) ¥ 8,872 ¥ 1,162 ¥ 403 ¥ (789) ¥ 1,104 ¥ 2,723 ¥ 159 ¥ (384) ¥ 12,034
II. Total Assets, Depreciation and Amortization, Impairment of Long-lived Assets and Capital Expenditures Total assets .................. ¥ 67,841 ¥ 70,561 ¥ 23,308 ¥ 6,047 ¥ 26,235 ¥ 93,715 ¥ 27,971 ¥ 8,612 ¥ 100,416 ¥ 424,706 Depreciation and amortization... ¥ 2,979 ¥ 4,292 ¥ 1,303 ¥ 374 ¥ 1,817 ¥ 4,938 ¥ 1,081 ¥ 106 ¥ ̶ ¥ 16,890 Impairment of long-lived assets ¥ 155 ¥ ̶ ¥ ̶ ¥ ― ¥ ̶ ¥ ̶ ¥ ̶ ¥ ̶ ¥ ̶ ¥ 155 Capital expenditures ..... ¥ 2,117 ¥ 5,221 ¥ 2,746 ¥ 391 ¥ 2,136 ¥ 4,847 ¥ 6,547 ¥ 5 ¥ 270 ¥ 24,280
(thousands of US dollars)
2009
Automobile Real Estate Other Eliminations/ Textiles Brakes Papers Mechatronics Chemicals Electronics Leasing Businesses Corporate Consolidated
I. Sales and Operating Income (loss) Sales to customers ....... $ 675,930 $ 532,610 $ 342,140 $ 147,380 $ 326,240 $ 605,500 $ 64,330 $ 167,540 $ ̶ $ 2,861,670 Intersegment sales ........ 20 3,770 480 5,240 5,920 ̶ 4,640 13,650 (33,720) ̶ Total sales ................. 675,950 536,380 342,620 152,620 332,160 605,500 68,970 181,190 (33,720) 2,861,670 Operating expenses ...... 703,380 503,280 334,820 137,080 346,650 644,680 35,570 179,630 (27,500) 2,857,590 Operating income (loss) $ (27,430) $ 33,100 $ 7,800 $ 15,540 $ (14,490) $ (39,180) $ 33,400 $ 1,560 $ (6,220) $ 4,080
II. Total Assets, Depreciation and Amortization, Impairment of Long-lived Assets and Capital Expenditures Total assets .................. $ 549,550 $ 552,740 $ 254,870 $ 114,100 $ 210,220 $ 628,170 $ 221,420 $ 81,130 $ 1,056,380 $ 3,668,580 Depreciation and amortization... $ 28,980 $ 42,990 $ 18,690 $ 7,580 $ 19,300 $ 47,540 $ 14,760 $ 410 $ ̶ $ 180,250 Impairment of long-lived assets $ 850 $ ̶ $ ̶ $ ̶ $ 260 $ ̶ $ ̶ $ ̶ $ ̶ $ 1,110 Capital expenditures ..... $ 29,590 $ 34,090 $ 29,650 $ 4,670 $ 21,350 $ 28,430 $ 4,110 $ 520 $ 16,310 $ 168,720

Financial Section
(b) Geographical segments
The geographical segments of the Company and its consolidated subsidiaries for the years ended March 31, 2009 and 2008 were as follows:
(millions of yen) 2009 Eliminations/ Japan Asia Other Regions Corporate Consolidated
Sales to customers ........................... ¥ 234,950 ¥ 36,013 ¥ 15,204 ¥ ― ¥ 286,167 Interarea transfer ............................... 9,405 11,001 349 (20,755) ― Total sales ..................................... 244,355 47,014 15,553 (20,755) 286,167
Operating expenses .......................... 247,361 44,067 14,590 (20,259) 285,759 Operating income (loss) .................... ¥ (3,006) ¥ 2,947 ¥ 963 ¥ (496) ¥ 408
Total assets ...................................... ¥ 224,937 ¥ 29,546 ¥ 12,955 ¥ 99,420 ¥ 366,858
(millions of yen) 2008 Eliminations/ Japan Asia Other Regions Corporate Consolidated
Sales to customers ........................... ¥ 260,088 ¥ 44,626 ¥ 17,698 ¥ ̶ ¥ 322,412 Interarea transfer ............................... 11,432 13,949 54 (25,435) ̶ Total sales ..................................... 271,520 58,575 17,752 (25,435) 322,412
Operating expenses .......................... 265,582 54,020 15,791 (25,015) 310,378 Operating income (loss) .................... ¥ 5,938 ¥ 4,555 ¥ 1,961 ¥ (420) ¥ 12,034
Total assets ...................................... ¥ 267,150 ¥ 42,362 ¥ 20,160 ¥ 95,034 ¥ 424,706
(thousands of US dollars) 2009 Eliminations/ Japan Asia Other Regions Corporate Consolidated
Sales to customers ........................... $ 2,349,500 $ 360,130 $ 152,040 $ ̶ $ 2,861,670 Interarea transfer ............................... 94,050 110,010 3,490 (207,550) ― Total sales ......................................... 2,443,550 470,140 155,530 (207,550) 2,861,670
Operating expenses .......................... 2,473,610 440,670 145,900 (202,590) 2,857,590 Operating income (loss) .................... $ (30,060) $ 29,470 $ 9,630 $ (4,960) $ 4,080
Total assets ...................................... $ 2,249,370 $ 295,460 $ 129,550 $ 994,200 $ 3,668,580
(c) Sales to foreign customers
Sales to foreign customers for the years ended March 31, 2009 and 2008 amounted to ¥80,528 million ($805,280 thousand) and ¥93,827 million, respectively.
53
Nis
shin
bo
Ann
ual R
epor
t 20
09
52
Nisshinb
oA
nnual Rep
ort 2009
Independent Auditors’ Report
To the Board of Directors ofNisshinbo Holdings Inc.
We have audited the consolidated balance sheet of Nisshinbo Holdings Inc. (formerly Nisshinbo Industries, Inc.) and consolidated subsidiaries as of March 31, 2009, and the related consolidated statements of income, changes in equity, and cash flows for the year then ended, all expressed in Japanese yen. These consolidated financial statements are the responsibility of the Company’s management. Our responsibility is to express an opinion on these consolidated financial statements based on our audits. We conducted our audits in accordance with auditing standards generally accepted and applied in Japan. Those standards require that we plan and perform the audit to obtain reasonable assurance about whether the consolidated financial statements are free of material misstatement. An audit includes examining, on a test basis, evidence supporting the amounts and disclosures in the consolidated financial statements. An audit also includes assessing the accounting principles used and significant estimates made by management, as well as evaluating the overall consolidated financial statement presentation. We believe that our audits provide a reasonable basis for our opinion. In our opinion, the consolidated financial statements referred to above present fairly, in all material respects, the financial position of Nisshinbo Holdings Inc. and consolidated subsidiaries as of March 31, 2009, and the results of their operations and their cash flows for the year then ended, in conformity with accounting principles and practices generally accepted in Japan. The United States dollar amounts shown in the consolidated financial statements have been translated solely for convenience. We have reviewed this translation and, in our opinion, the consolidated financial statements expressed in Japanese yen have been translated into US dollars on the basis described in Note 1.
June 26, 2009Tokyo, Japan
VERITAS & Co.
Independent Auditors’ Report
To the Board of Directors ofNisshinbo Industries, Inc.
We have audited the consolidated balance sheet of Nisshinbo Industries, Inc. and consolidated subsidiaries as of March 31, 2008, and the related consolidated statements of income, changes in equity, and cash flows for the year then ended, all expressed in Japanese yen. These consolidated financial statements are the responsibility of the Company’s management. Our responsibility is to express an opinion on these consolidated financial statements based on our audits. We conducted our audits in accordance with auditing standards generally accepted and applied in Japan. Those standards require that we plan and perform the audit to obtain reasonable assurance about whether the consolidated financial statements are free of material misstatement. An audit includes examining, on a test basis, evidence supporting the amounts and disclosures in the consolidated financial statements. An audit also includes assessing the accounting principles used and significant estimates made by management, as well as evaluating the overall consolidated financial statement presentation. We believe that our audits provide a reasonable basis for our opinion. In our opinion, the consolidated financial statements referred to above present fairly, in all material respects, the financial position of Nisshinbo Industries, Inc. and consolidated subsidiaries as of March 31, 2008, and the results of their operations and their cash flows for the year then ended, in conformity with accounting principles and practices generally accepted in Japan.
June 27, 2008Tokyo, Japan
Etsuko NagashimaCertified Public Accountant
Takeshi TakuboCertified Public Accountant

55
Nis
shin
bo
Ann
ual R
epor
t 20
09
54
Nisshinb
oA
nnual Rep
ort 2009
(As of June 26, 2009)
Board of Directors (As of June 26, 2009)
Director, Chairman
Takashi IwashitaDirector *1, President
Shizuka UzawaDirector *1,Senior Executive Vice President
Kunihiro Toda
Director, Senior Executive Managing Officer
Shinji Takeuchi
Director,Executive Managing Officer
Yoshihito Onda
Director,Executive Managing Officer
Yoshihiro Sakaki
Director,Executive Managing Officer
Masaaki Isobe
Director, Managing Officer
Masaya KawataDirector *2
Tomofumi AkiyamaDirector *2
Toshiya HanawaDirector *2
Koji Kato
President
Shizuka Uzawa *1
Vice President
Kunihiro Toda *1
Senior Executive Managing Officer
Shinji Takeuchi *1
Executive Managing Officers
Yoshihito Onda *1
Yoshihiro Sakaki *1
Masaaki Isobe *1
Managing Officers
Masaya Kawata *1
Masahiro MurakamiKazunori Baba
Standing Statutory Auditors
Yoshio IdeMasao Satsuka
Statutory Auditors
Yo Kawakami *2
Toshihiko Tomita *2
1907 Established Nisshin Cotton Spinning Co., Ltd.
1937 Acquired Kawagoe Cotton Spinning Co., Ltd. (now the Kawagoe Business Office)
1938 Merged with Nisshin Rayon Co., Ltd. (now the Miai Business Office)
1940 Established Toa Jitsugyo Co., Ltd. (name changed to Nisshin Toa Co., Ltd. in 1990)
1945 Acquired Meiji Plant, Nanshin Seiki Co., Ltd. (now the Fuji Business Office)
1949 Established Nihon Postal Franker Co., Ltd. (name changed to Nisshinbo Postal Chemical Co., Ltd. in 2006)
1958 Established Nippon Kohbunshikan Co., Ltd. (name changed to Nippon Kohbunshi Co., Ltd. in 1986)
1962 English name of company changed to Nisshin Spinning Co., Ltd.
1972 Established Nisshinbo Do Brasil Industria Textil LTDA.
1978 Acquired Tokai Seishi Co., Ltd.
1985 Acquired Nisshin Denim Co., Ltd.
1989 Established Kohbunshi (Thailand) Ltd.
1993 Established Pudong Kohbunshi (Shanghai) Co., Ltd.
1995 Established Nisshinbo Automotive Corporation (U.S.A.) Established Nisshinbo Urban Development Co., Ltd.
1996 Established Nisshinbo Somboon Automotive Co., Ltd. (Thailand)
1997 Established Nisshinbo Automotive Manufacturing Inc. (U.S.A.)
1998 Established P.T. Gistex Nisshinbo Indonesia
1999 Established Saeron Automotive Corporation (South Korea)
2000 Purchased additional shares of P.T. Nikawa Textile Industry (Indonesia) Established Continental Teves Co., Ltd. through merger with Continental Teves AG & Co. oHG (name changed to Continental Automotive Co., Ltd. in 2007)
2002 Acquired all shares of Iwao Co., Ltd. Established NISSHINBO (SHANGHAI) CO., LTD.
2003 Established Saeron Automotive Beijing Corporation (China)
2004 Established Continental Teves Corporation (Lian Yun Gang) (China)
2005 Acquired additional shares of ALOKA Co., Ltd. Made tender offer for additional shares of New Japan Radio Co., Ltd.
2006 Acquired additional shares of Japan Radio Co., Ltd. and Nagano Japan Radio Co., Ltd.
2007 Acquired all shares of Daiwa Shiko Co., Ltd.
2008 Acquired all shares of CHOYA Co., Ltd. Acquired all shares of Nisshinbo Brake Sales Co., Ltd.
2009 Spun off five businesses̶Textiles, Automobile Brakes, Papers, Mechatronics, and Chemicals̶and converted to holding company; corporate name changed to Nisshinbo Holdings Inc.
Founded: Feb. 5, 1907
Head Office: 2-31-11, Ningyo-cho, Nihonbashi, Chuo-ku, Tokyo 103-8650, Japan Tel: 03-5695-8833 Fax: 03-5695-8970
Osaka Branch: 2-4-2, Kitakyuhouji-machi, Chuo-ku, Osaka 541-0057, Japan Tel: 06-6267-5501 Fax: 06-6267-5529
Nagoya Branch: 5-2-38, Sakae, Nakaku, Nagoya 460-0008, Japan Tel: 052-261-6151 Fax: 052-263-9480
Employees: Parent Company 2,484 Subsidiaries 10,242 Total 12,726
Common Stock: Authorized 371,755,000 shares Issued 184,098,939 shares ¥27,588 million - US$276 million
Shareholders: 13,153
Listings: Tokyo, Osaka, Nagoya, Fukuoka, and Sapporo
Transfer Agent: Mitsubishi UFJ Trust and Banking Corporation 1-4-5, Marunouchi, Chiyoda-ku, Tokyo 100-8212, Japan
(As of March 31, 2009)
History
Corporate Data
*1 Board member as well*2 Outside auditor
Managing Officers and Auditors
*1 Representative director
*2 Outside director

• CHOYA Co., Ltd.
• Nisshin Denim Inc.
• Nisshinbo Do Brasil Industria Textil LTDA.
• P.T. Gistex Nisshinbo Indonesia
• P.T. Nikawa Textile Industry
• NISSHINBO (SHANGHAI) CO., LTD.
• P.T. Naigai Shirts Indonesia
Textiles
• Nisshinbo Brake Sales Co., Ltd.
• Nisshinbo Automotive Corporation
• Nisshinbo Automotive Manufacturing Inc.
• Nisshinbo Somboon Automotive Co., Ltd.
• Saeron Automotive Corporation
Automobile Brakes
• Tokai Seishi Kougyou Co., Ltd.
• Daiwa Shiko Co., Ltd.
• Nisshinbo Postal Chemical Co., Ltd.
Papers
Development, manufacture, processing, trading, and import/export of thread, woven fabric, nonwoven fabric, apparel, industrial textile materials, and other fiber products.
Development, manufacture, processing, trading, and import/export of friction materials, brake equipment, and brake parts for automobiles and transport machinery.
Development, manufacture, processing, trading, and import/export of paper and processed paper products and processing of industrial waste.
• Nippon Kohbunshi Co., Ltd.
• Nisshinbo Precision Instrument & Machinery Hiroshima Corporation
• Nisshinbo Alps tech Co., Ltd.
• Taiwan Nisshinbo Photovoltaic Co., Ltd.
• Pudong Kohbunshi (Shanghai) Co., Ltd.
• Kohbunshi (Thailand) Ltd.
Mechatronics
Development, manufacture, processing, trading, and import/export of special-purpose industrial machinery, general industrial machinery, other equipment, and parts for these products.
• Iwao & Co., Ltd.
Chemicals
Development, manufacture, processing, trading, and import/export of inorganic chemical industrial products, organic chemical industrial products, medical products, and other industrial chemical products as well as construction and civil engineering design, implementation, and management.
• Ueda Japan Radio Co., Ltd.
Electronics
Real Estate LeasingOther Businesses
Development, manufacture, processing, trading, and import/export of electron tubes, semiconductor elements, integrated circuits, and other electronic components and electrical machinery using these products.
• Nisshinbo Urban Development Co., Ltd.
• Nisshinbo Europe B.V.
• Nisshin Toa Inc.
Nisshinbo Textile Inc.
Nisshinbo Brake Inc.
Nisshinbo Paper Products Inc.
Nisshinbo Mechatronics Inc.
Nisshinbo Chemical Inc.
New Japan Radio Co., Ltd.
Other Group Companies
Nisshinbo Holdings Inc.
Corporate Strategy Center
Business Support Center
Business Development Division
Property Management Department
Board of Directors
General Shareholders Meeting
Chairman
President
Board of Management
Board of Statutory Auditors
Statutory Auditor
(As of April 1, 2009)Main Group Companies
57
Nis
shin
bo
Ann
ual R
epor
t 20
09
56
Nisshinb
oA
nnual Rep
ort 2009