Embed Size (px)
Citation preview

ORIGINAL ARTICLE
New breeding value evaluation of fertility traits in Finnish mink
M. KOIVULA, E. A. MANTYSAARI & I. STRANDEN
MTT Agrifood Research Finland, Biotechnology and Food Research, Biometrical Genetics, FI-31600 Jokioinen, Finland
AbstractLitter size (LS) has been included in the Finnish mink breeding goal for several generations. Still, the phenotypic trend inthe average number of pups per mated female has slightly decreased while animal size (AS) has increased. The aim of thisstudy was to estimate genetic parameters for pregnancy rate (PREG) and felicity (FEL), and their genetic correlations to LSand AS. The estimated heritabilities were low for PREG (0.032) and FEL (0.026). The genetic correlations between LS andPREG (0.34), and LS and FEL (0.53) were clearly positive. Thus, on average females having genetically larger LS havehigher PREG and FEL. The genetic correlation between AS and PREG was low (�0.13), and correlation between AS andFEL was moderate (�0.27) indicating that larger animals are more likely barren or lose their kits during pregnancy or rightafter birth.
Keywords: Fertility, litter size, mink, pregnancy.
Introduction
The main goals in Finnish mink breeding have been
improved fur quality, and increase in body size and
litter size (LS). Consequently, average pelt size has
increased considerably. However, at the same time
the average number of kits per mated female has
slightly decreased in Finland as well as in other
countries (Hansen & Berg, 2007, 2008; Hansen,
2009). Increase in body size may have lead to smaller
LS (Hansen & Berg, 2007, 2008; Hansen, 2009;
Koivula et al., 2009b, 2010). This seems to be a
problem also in other species because when selecting
for body size negative genetic trend has often been
observed in traits measuring reproduction and
survival despite their importance to profitability
(Peura et al., 2007; Goddard, 2009; Koivula et al.,
2009a). One reason is a strong negative genetic
correlation between large animal size (AS) and LS.
For example in minks this correlation has varied
from �0.18 to �0.28, (Lagerkvist et al., 1994;
Rozempolska-Rucinsca, 2004; Peura et al., 2007;
Koivula et al., 2009b, 2010), and in blue foxes
negative correlation has been even higher (�0.36 to
�0.43) (Peura et al., 2007; Koivula et al., 2009a).
Fertility can be measured in many ways. In
Finland, farmers record mink LS at two weeks after
whelping, but also barren females, aborting females
or females losing their kits are recorded in a routine
recording scheme. However, breeding values are
based on LS only, and barren females or females
aborting or losing their kits are not included in the
breeding value evaluation. In blue foxes heritability
of pregnancy rate (PREG) was 0.028 and felicity
(FEL) 0.049, and the genetic correlations between
LS and PREG and LS and FEL were clearly positive
(Koivula et al., 2009a). Thus, it was possible to
include these traits in breeding programmes of
Finnish blue foxes.
The aim of this study was to estimate genetic
parameters for PREG (representing the proportion
of females whelping, i.e. the non-barren females)
and FEL (including both aborting females and
females losing all kits after birth), and their genetic
correlations to LS and AS. In addition, we examined
genetic trends in the traits studied.
Correspondence: M. Koivula, MTT Agrifood Research Finland, Biotechnology and Food Research, Biometrical Genetics, FI-31600 Jokioinen, Finland.
Tel: � 358-40-1960986. Fax: �358-3-4188-3244. E-mail: [email protected]
Acta Agriculturae Scand Section A, 2011; 61: 1�6
(Received 14 September 2010; revised 1 November 2010; accepted 2 November 2010)
ISSN 0906-4702 print/ISSN 1651-1972 online # 2011 Taylor & Francis
DOI: 10.1080/09064702.2010.538715

Material and methods
Mink data were obtained from the Finnish Fur
Breeders’ Association. The data had information
from 3.7 million animals. Data for the variance
component estimation were sampled from the full
data. Sampling was done by farm. The complete
pedigree contained about 4.1 million animals from
136 farms. The pedigree had many disconnected
subpopulations, so it had to be pruned with Relax2
(Stranden & Vuori, 2006) to have only informative
animals. In the end, the sample had observations
from 12 farms having 69,441 animals born in years
1998�2006. The pedigree file contained 93,632
animals.
The analysed traits were the first parity LS,
PREG, FEL and AS. LS was recorded as numbers
of kits alive two weeks after whelping. PREG and
FEL were binary (1/0) traits, value 0 representing
the event when the female was barren or aborted/
lost her kits. Females were scored as pregnant when
she showed visual signs of pregnancy. If pregnancy
was recorded, PREG�1, and also if PREG record
was missing but FEL and LS records exist. If
abortion or kit loss was observed, females were
recorded as FEL�0, similarly if she was recorded
as pregnant and LS was missing. Because all
pregnant females and all females giving birth or
losing kits are not observed, PREG and FEL are
always approximations. Abortion and kit loss after
birth was treated as a single FEL trait, because the
number of observations for aborting females was so
low that it would have been difficult to analyse it as a
separate trait. AS was graded subjectively by the
farmer. The grading scale ranged from 1 (smallest)
to 5 (largest). The recommendation was that the
average AS should be close to 3 within farm and
year.
Restricted maximum likelihood (REML) esti-
mates of (co)variance components were calculated
using DMU software (Madsen & Jensen, 2000). The
multi-trait animal model was:
y�Xb�Wc�Za�e
where y is a vector of observations, b is the vector of
fixed effects, c is the vector of random effect of the
litter in which the female is born, and a is the vector
of random genetic effects for animal and e is the
random residual, and X, W and Z are known
incidence matrices for the fixed and random effects.
Random effects were assumed to be independent
and normally distributed. In particular, c �
N(0;C0�I); a � N (0;G0�A); e � N (0;R0�I)where C0 is common litter effect (co)variance
matrix, G0 is direct additive genetic (co)variance
matrix, A is numerator relationship matrix and R0
residual (co)variance matrix.
The fertility traits were exclusive by nature of their
definition: when PREG had value 0, both FEL and
LS information were missing; when PREG had value
1, and FEL had value 0, then LS was missing. Thus,
LS was observed only when both PREG and FEL
had value 1. Consequently, the residual covariance
between LS and PREG, LS and FEL, and PREG
and FEL was assigned as non-existing (zero) because
these trait combinations are not present in the data,
and thus, cannot be estimated.
Fixed effects for the traits were studied with the
general linear model by excluding random effects
other than the residual (SAS, 2004). Fixed effects
for LS, PREG and FEL were farm�year, time of
birth for animal (three classes: 99�119, 120�140 and
141�160 days from the beginning of the year,
reflecting timing of birth and thus also age of animal)
and number of matings (three classes: 1, 2 or �2
mating/season). Fixed effects for AS were farm�year,
time of birth for animal, sex of animal (three classes:
male, female and unknown) and age of dam (three
class: 1, 2 or �3-years-old).
Heritability (h2) and proportion of common litter
variance (c2) for the traits were calculated as h2�s2
a=(s2a�s2
c �s2e ); and c2�s2
c =(s2a�s2
c �s2e );
where s2a; s2
c and s2e are trait variances of additive
genetic, common litter environment and residual,
respectively. Linear animal model was used to
analyse PREG and FEL, although theoretically a
threshold model would be more appropriate for
analysis of binary data (Gianola, 1982). Heritability
calculated on the observed binary scale varies with
incidence because the amount of variance due to
measurement error depends on the incidence. To
overcome this, heritabilities were converted from the
binary to the continous scale using Dempster and
Lerner (1950) formula:
h2�h201p(1�p)=z2;
where h2 is the heritability in the continuous scale,
h201 is the corresponding heritability calculated on the
binary scale, p is the incidence of affected individuals
in the population, and z is the ordinate of the
standard normal density function on the threshold
corresponding to the incidence p.
In addition to the genetic parameters, genetic
trends for the studied traits were assessed by
examining standardised estimated breeding values
(EBV). EBVs were calculated with MiX99
(Stranden & Lidauer, 1999; Vuori et al., 2006).
The largest subpopulation was used for EBV calcu-
lations. The data included observations from
395,233 animals and the pedigree had 451,643
animals from years 1988�2006 in 59 farms. The
2 M. Koivula et al.
model used in the EBV calculation was the same
as in the variance component analysis but the
variances were the obtained REML estimates.
Breeding values were standardised to year 2003
with mean 100 and SD 10 in order to make
comparison of years and EBVs of different traits
easier.
Results and discussion
Table I gives the number of observations in each trait
pair. Descriptive statistics for LS, PREG, FEL and
AS are given in Table II. The mean LS was 5.47 and
SD was 2.10. Mean PREG was 0.89, indicating that
11% of the young mink females were barren.
Average FEL was 0.96, indicating that 4% of females
getting pregnant lost or aborted their kits. Mean AS
was 4.06 in the current data. The recommendation
given to grader is that the average for AS should be
close to three within a farm�year. However, the
mean 4.06 shows that higher scores are commonly
used. Males comprised 30% of the graded indivi-
duals, their average of AS being 4.60, females
average AS was 3.82, and that with unknown sex
(3.5% of the individuals) 3.97.
Proportion of litter variance was low for PREG
and FEL (0.0032 and 0.0009, respectively). Thus,
littermates do not have great impact on these traits.
For the LS the c2 was 0.07 and AS 0.03. Koivula
et al. (2009b) suggested that litter effects were larger
than maternal heritabilities for litter size and animal
size. This implies that it is important to estimate also
environmental effects common to littermates for
these traits.
Heritability (h2) and litter variance proportion (c2)
for the traits are in Table III. Heritability estimate of
LS was 0.11. In other studies heritability for LS in
mink has varied from 0.02 to 0.20 (Berg, 1993;
Lagerkvist et al., 1994; Rozempolska-Rucinsca,
2004; Koivula et al., 2009b, 2010). Thus, the
obtained heritability estimate in this study is within
the range reported for mink. Heritability estimates for
LS in other fur animals have also been similar to those
for mink. In blue fox, heritability estimates of LS
have varied from 0.03 to 0.17 (Kenttamies, 1996;
Wierzbicki & Jagusiak, 2006; Peura et al., 2007;
Koivula et al., 2009a), for raccoon dog LS heritability
has been 0.08 (Slaska, 2002).
The heritabilities estimated on the observed bin-
ary scale for the PREG and FEL were low, 0.032
and 0.026, respectively. Because of the low herit-
ability, genetic change in PREG and FEL will be
expected to be slow. In the underlying continuous
scale (Dempster & Lerner, 1950), the heritability
estimates were higher, 0.092 for PREG and 0.046
for FEL. The results suggest some benefit for using a
threshold model over a linear model so that the
binary nature of the response variable in PREG and
FEL is accounted. However, the low heritability
suggests that both models give the same ranking of
animals (Meijering & Gianola, 1985; Hoeschele,
1988; Foulley et al., 1990).
Reproductive traits like PREG and FEL have been
studied in other production animals as well. In other
species heritability estimates for traits similar to
PREG and FEL in mink have varied considerably.
In blue fox, heritability of PREG and FEL were
0.029 and 0.049 (estimated on continuous scale),
respectively (Koivula et al., 2009a). Heritability
estimates from threshold models for heifer PREG
have ranged from 0.13 to 0.66 (Evans et al., 1999;
Bormann et al., 2006; Eler et al., 2006). In pig,
heritability estimate of return rate has been 0.03 with
a threshold model (Holm et al., 2005), and in sheep
heritability estimate of fertility (ewes lambing per
ewes joined) has been 0.02, estimated on continuous
scale (Brash et al., 1994). Thus, the heritability
estimates of mink fertility traits are similar to
estimates from other species, although estimates
from the linear model depend on frequency and
are not directly comparable to threshold model
estimates.
The genetic correlations between the traits are in
Table IV. The genetic correlation between AS and
LS was antagonistic (�0.26). This result is sup-
ported by the earlier studies in mink (Lagerkvist
et al., 1993, 1994; Rozempolska-Rucinsca, 2004;
Koivula et al., 2009b), and blue fox (Peura et al.,
2007; Koivula et al., 2009a). Negative correlation
between body size and reproduction is seen also in
Table I. Number of observations in each trait pair in multi-trait
analysis. Pregnancy rate (PREG), felicity (FEL), first parity litter
size (LS) and animal size (AS).
PREG FEL LS, no AS, score
PREG 50,200
FEL 45,154 45,154
LS, no 40,523 40,523 40,523
AS, score 21,756 19,421 15,961 40,983
Table II. Number of observations (n), mean and standard
deviation (SD) for the pregnancy rate (PREG), felicity (FEL),
first parity litter size (LS) and animal size (AS).
Trait n Mean SD
PREG 50,200 0.89 0.30
FEL 45,154 0.96 0.20
LS, no 40,523 5.47 2.10
AS, score 40,983 4.06 0.72
New breeding value evaluation of fertility traits 3

practise because phenotypic LS has somewhat de-
creased at the same time as AS has increased
(Figure 1). The negative genetic correlation between
AS and PREG was low (�0.13), and between AS
and FEL moderate (�0.27), indicating that large
animals will more likely lose their kits during
pregnancy or immediately after birth. Similar inter-
action has been observed in blue foxes (Koivula
et al., 2009a), and in Holstein�Friesian cows where
larger animals tend to be relatively less fertile than
smaller animals (Haile-Mariam et al., 2004).
The genetic correlations between LS and PREG,
and LS and FEL were 0.33 and 0.53, respectively.
Thus, females having genetically larger LS have
lower risk to be barren or abort/lose their kits. The
positive genetic correlation is favourable when selec-
tion goal is to increase LS: the results from our study
indicate that selection for increased LS could in-
crease the PREG or decrease kit loss. Similar
correlation has also been observed in pigs, where
genetic correlation between return rate of gilts and
number of piglets born alive in the first litter was
�0.22 (Holm et al., 2005). The genetic correlation
between PREG and FEL was positive (0.46).
Despite reasonably high genetic correlation be-
tween LS and other fertility traits and between
PREG and FEL, correlations were clearly less than
1. Therefore, LS, PREG and FEL are undoubtedly
different traits, and accuracy of fertility evaluations
will increase when more traits are included into the
breeding programme. Females without LS observa-
tion are expected to gain more than females with LS
observation from including PREG and FEL infor-
mation into genetic evaluation. A simple example
illustrates this. Assume phenotypic selection. If
female has no LS observation, accuracy of EBV
increases from zero to 0.11 when PREG and FEL
observations are available. For a female with a LS
observation, accuracy increases from 0.33 to 0.34. In
practice, increase in accuracy is not as large because
no relationship information was accounted in the
calculations. Note that LS was observed only for
animals for which PREG and FEL had value 1, i.e.
female was pregnant and did not lose/abort all kits. A
similar consecutive relationship exists for PREG and
FEL. Thus, some model assumptions are violated,
Table IV. Estimated genetic correlations (rg) between the first
parity litter size (LS), pregnancy rate (PREG), felicity (FEL) and
animal size (AS) with standard errors, and phenotypic (rp)
correlations with AS.
rg rp
Trait FEL LS AS AS
PREG 0.4690.13 0.3490.08 �0.1390.09 �0.02
FEL 0.5390.08 �0.2790.10 �0.05
LS �0.2690.06 �0.05
R2 = 0.54
R2 = 0.59
4.2
4.4
4.6
4.8
5.0
5.2
5.4
1995 1996 1997 1998 1999 2000 2001 2002 2003 2004 2005 2006
Birth year
Mea
n li
tter
siz
e, n
o
3.0
3.4
3.8
4.2
4.6
Mea
n a
nim
al s
ize,
sco
re
Figure 1. Phenotypic trend and coefficient of determination R2 in litter size (--j--) and animal size (score, 1�5) (--I--) by birth year in
Finnish mink
Table III. Estimated additive genetic variance (s2a); litter variance (s2
c ); phenotypic variance (s2p ); and proportion of litter variance (c2) and
heritability (h2) with standard error for the first parity litter size (LS), pregnancy rate (PREG), felicity (FEL) and animal size (AS).
Trait s2a s2
c s2p c2 h2
PREG 0.0028 0.0032 0.0877 0.0490.006 0.0390.01
FEL 0.0010 0.0009 0.0398 0.0290.007 0.0390.01
LS 0.4683 0.0704 4.2789 0.0290.008 0.1190.01
AS 0.0617 0.0296 0.3271 0.0990.006 0.1990.01
4 M. Koivula et al.
or at least interpretation of genetic correlation
parameters is not as straightforward as described.
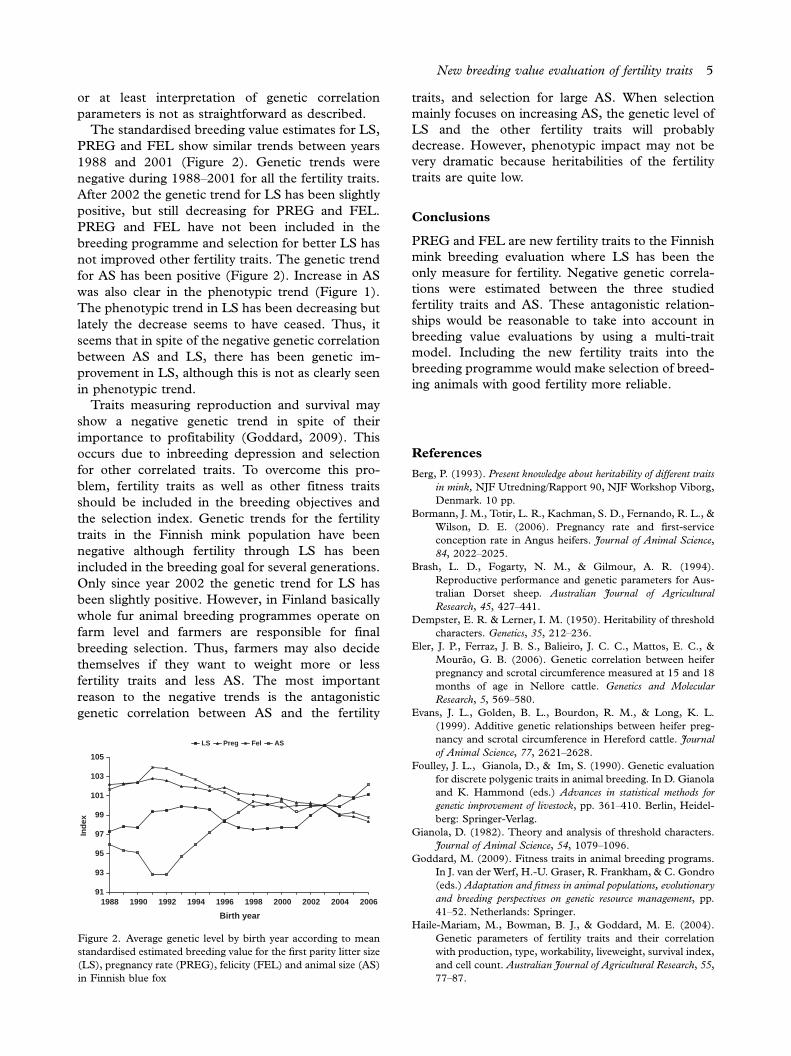
The standardised breeding value estimates for LS,
PREG and FEL show similar trends between years
1988 and 2001 (Figure 2). Genetic trends were
negative during 1988�2001 for all the fertility traits.
After 2002 the genetic trend for LS has been slightly
positive, but still decreasing for PREG and FEL.
PREG and FEL have not been included in the
breeding programme and selection for better LS has
not improved other fertility traits. The genetic trend
for AS has been positive (Figure 2). Increase in AS
was also clear in the phenotypic trend (Figure 1).
The phenotypic trend in LS has been decreasing but
lately the decrease seems to have ceased. Thus, it
seems that in spite of the negative genetic correlation
between AS and LS, there has been genetic im-
provement in LS, although this is not as clearly seen
in phenotypic trend.
Traits measuring reproduction and survival may
show a negative genetic trend in spite of their
importance to profitability (Goddard, 2009). This
occurs due to inbreeding depression and selection
for other correlated traits. To overcome this pro-
blem, fertility traits as well as other fitness traits
should be included in the breeding objectives and
the selection index. Genetic trends for the fertility
traits in the Finnish mink population have been
negative although fertility through LS has been
included in the breeding goal for several generations.
Only since year 2002 the genetic trend for LS has
been slightly positive. However, in Finland basically
whole fur animal breeding programmes operate on
farm level and farmers are responsible for final
breeding selection. Thus, farmers may also decide
themselves if they want to weight more or less
fertility traits and less AS. The most important
reason to the negative trends is the antagonistic
genetic correlation between AS and the fertility
traits, and selection for large AS. When selection
mainly focuses on increasing AS, the genetic level of
LS and the other fertility traits will probably
decrease. However, phenotypic impact may not be
very dramatic because heritabilities of the fertility
traits are quite low.
Conclusions
PREG and FEL are new fertility traits to the Finnish
mink breeding evaluation where LS has been the
only measure for fertility. Negative genetic correla-
tions were estimated between the three studied
fertility traits and AS. These antagonistic relation-
ships would be reasonable to take into account in
breeding value evaluations by using a multi-trait
model. Including the new fertility traits into the
breeding programme would make selection of breed-
ing animals with good fertility more reliable.
References
Berg, P. (1993). Present knowledge about heritability of different traits
in mink, NJF Utredning/Rapport 90, NJF Workshop Viborg,
Denmark. 10 pp.
Bormann, J. M., Totir, L. R., Kachman, S. D., Fernando, R. L., &
Wilson, D. E. (2006). Pregnancy rate and first-service
conception rate in Angus heifers. Journal of Animal Science,
84, 2022�2025.
Brash, L. D., Fogarty, N. M., & Gilmour, A. R. (1994).
Reproductive performance and genetic parameters for Aus-
tralian Dorset sheep. Australian Journal of Agricultural
Research, 45, 427�441.
Dempster, E. R. & Lerner, I. M. (1950). Heritability of threshold
characters. Genetics, 35, 212�236.
Eler, J. P., Ferraz, J. B. S., Balieiro, J. C. C., Mattos, E. C., &
Mourao, G. B. (2006). Genetic correlation between heifer
pregnancy and scrotal circumference measured at 15 and 18
months of age in Nellore cattle. Genetics and Molecular
Research, 5, 569�580.
Evans, J. L., Golden, B. L., Bourdon, R. M., & Long, K. L.
(1999). Additive genetic relationships between heifer preg-
nancy and scrotal circumference in Hereford cattle. Journal
of Animal Science, 77, 2621�2628.
Foulley, J. L., Gianola, D., & Im, S. (1990). Genetic evaluation
for discrete polygenic traits in animal breeding. In D. Gianola
and K. Hammond (eds.) Advances in statistical methods for
genetic improvement of livestock, pp. 361�410. Berlin, Heidel-
berg: Springer-Verlag.
Gianola, D. (1982). Theory and analysis of threshold characters.
Journal of Animal Science, 54, 1079�1096.
Goddard, M. (2009). Fitness traits in animal breeding programs.
In J. van der Werf, H.-U. Graser, R. Frankham, & C. Gondro
(eds.) Adaptation and fitness in animal populations, evolutionary
and breeding perspectives on genetic resource management, pp.
41�52. Netherlands: Springer.
Haile-Mariam, M., Bowman, B. J., & Goddard, M. E. (2004).
Genetic parameters of fertility traits and their correlation
with production, type, workability, liveweight, survival index,
and cell count. Australian Journal of Agricultural Research, 55,
77�87.
91
93
95
97
99
101
103
105
Birth year
Ind
ex
LS Preg Fel AS
19981988 1990 1992 1994 1996 2000 2002 2004 2006
Figure 2. Average genetic level by birth year according to mean
standardised estimated breeding value for the first parity litter size
(LS), pregnancy rate (PREG), felicity (FEL) and animal size (AS)
in Finnish blue fox
New breeding value evaluation of fertility traits 5

Hansen, B. K. (2009). Litter size and kit survival. Scientifur, 33,
19�21.
Hansen, B. K. & Berg, P. (2007). Low kit survival � consequences
of selection for high body weight. Scientifur, 31, 104
Hansen, B. K. & Berg, P. (2008). Reduced litter size and percent
kits alive is a consequences of selecting for high body weight.
Scientifur, 32, 15.
Hoeschele, I. (1988). Comparison of ‘‘maximum a-posteriori
estimation’’ and ‘‘quasi best linear unbiased prediction’’
with threshold characters. Journal of Animal Breeding and
Genetics, 105, 327�361.
Holm, B., Bakken, M., Vangen, O., & Rekaya, R. (2005). Genetic
analysis of age at first service, return rate, litter size, and
weaning-to-first service interval of gilts and sows. Journal of
Animal Science, 83, 41�48.
Kenttamies, H. (1996). Genetics and environmental factors
affecting fertility traits in foxes. Animal Production Review
Applied Science, 27, 63�66.
Koivula, M., Mantysaari, E. A., & Stranden, I. (2009a). New
fertility traits in breeding value evaluation of Finnish blue
fox. Acta Agriculturae Scandinavica. Section A � Animal
Science, 59, 131�136.
Koivula, M., Stranden, I., & Mantysaari, E. A. (2009b). Direct
and maternal genetic effects on first litter size, maturation
age, and animal size in Finnish minks. Journal of Animal
Science, 87, 3083�3088.
Koivula, M., Stranden, I., & Mantysaari, E. A. (2010). Genetic
and phenotypic parameters of age at first mating, litter size
and animal size in Finnish mink. Animal, 4, 183�188.
Lagerkvist, G., Johansson, K., & Lundeheim, N. (1993). Selection
for litter size, body weight and pelt quality in mink (Mustela
vison): Experimental design and direct response of each trait.
Journal of Animal Science, 71, 3261�3272.
Lagerkvist, G., Johansson, K., & Lundeheim, N. (1994). Selection
for litter size, body weight, and pelt quality in mink (Mustela
vison): Correlated responses. Journal of Animal Science, 72,
1126�1137.
Madsen, P. & Jensen, J. (2000). A user’s guide to DMU, a package
for analyzing multivariate mixed models, Mimeo 22 p. Tjele,
Denmark: Danish Institute of Agricultural Sciences (DIAS).
Meijering, A. & Gianola, D. (1985). Linear versus nonlinear
methods of sire evaluation for categorical traits: A simulation
study. Genetics Selection Evolution, 17, 115�132.
Peura, J., Stranden, I., & Mantysaari, E. A. (2007). Genetic
parameters for Finnish blue fox population: Litter size, age at
first insemination and pelt size. Agricultural and Food Science,
16, 136�146.
Rozempolska-Rucinsca, I. (2004). Genetic background of perfor-
mance and functional traits in mink. Electronic Journal of
Polish Agricultural Universities, Animal Husbandry. Accessed
3 September 2010, available at: http://www.ejpau.media.pl/
volume7/issue2/animal/art-03.html
SAS. (2004). Statistical analysis system. Release 9.1 ed. Cary, NC:
SAS Institute.
Slaska, B. (2002). Genetic and environmental factors of raccoon
dog reproduction traits. Electronic Journal of Polish
Agricultural Universities, Animal Husbandry. Available at:
http://www.ejpau.media.pl/volume5/issue2/animal/art-06.html
(Accessed 3 September 2010)
Stranden, I. & Lidauer, M. (1999). Solving large mixed models
using preconditioned conjugate gradient iteration. Journal of
Dairy Science, 82, 2779�2787.
Stranden, I. & Vuori, K. (2006). RelaX2: Pedigree analysis
program. In Proceedings of the 8th world congress on Genetics
Applied to Livestock Production. 13�18 August, 2006, Belo
Horizonte, MG, Brazil, CD-ROM communication No.
27-30.
Vuori, K., Stranden, I., Lidauer, M. & Mantysaari, E. A. (2006).
MiX99-Effective solver for large and complex linear mixed
models. In Proceedings of the 8th world congress on Genetics
Applied to Livestock Production. 13�18 August, 2006, Belo
Horizonte, MG, Brazil, CD-ROM communication No.
27-33.
Wierzbicki, H. & Jagusiak, W. (2006). Breeding value evaluation
in Polish fur animals: Estimates of (co)variances due to direct
and litter effects for fur coat and reproduction traits. Czech
Journal of Animal Science, 51, 39�46.
6 M. Koivula et al.