Embed Size (px)
Citation preview

New Approaches to Improving the Quality of Care:
Becoming a Learning Health System
Karl Bilimoria MD MS Surgical Outcomes and Quality Improvement Center (SOQIC)
Department of Surgery and Center for Healthcare Studies Feinberg School of Medicine, Northwestern University
@kbilimoria

Disclosures
• No financial disclosures
• Supported by NIH, AHRQ, HCSC, ACS, NCCN, ACoS, ABS, ACGME, CHCF, NU

Not “Surgical Outcomes and Quality Improvement Research Center”
SOQuIR
Your Center’s Acronym Is Important

Northwestern Department of Surgery
Department of Medical Social
Sciences
Lurie Comprehensive Cancer Center
Center for Healthcare
Studies
NICER Oncology
VA Center for Complex
Chronic Care
American College of Surgeons
Northwestern Memorial Hospital

Surgical Outcomes and Quality Improvement Center
• Better measures – Hospital quality comparisons – Quality measurement development/testing
• Better levers
– Public reporting – Pay for performance – Health policy evaluations
• Better evidence
– Effectiveness of quality improvement initiatives http://www.SOQIC.org

The Team
• Surgeons – 6 surgeons – ENT, GI, Anesthesia, Orthopedics,
Plastics, Gynecology, Oncology
• Health Services Researchers – 3 PhDs
• 15 staff – Statisticians, analysts, programmers,
project coordinators, grants

Training Residents to Be Health Services Researchers
• Surgical resident research fellows – 10 prior – 7 current
• Funding: T32, F32, other grants
• Ongoing national recruitment

Co-location
• 250 health services researchers and staff on 3 floors

Center for Healthcare Studies

ACS Collaboration
• Statewide quality collaborative
• FIRST Trial
• Special projects – Risk calculator – Measure development: PQRS, CoC, NQF
• Clinical Scholars (research fellows)
• 5 grants together

Prospective Cluster-Randomized Trials of QI and Policy Interventions
25 Hospitals 25 Hospitals vs.
QI Intervention/Policy: • Checklist • Implement bundle of
best practices • Financial motivation • Public reporting
No Intervention or Other intervention

High
U.S. Postal Service
Hotels
Health Services
Auto Manufacturing
Food Services
Airlines
Tobacco
Computers
Industries by Size, Productivity, and Efficiency
How does the quality of care compare?
• Source: Advisory Board Company, 2005

• 439 indicators of quality
• 30 acute and chronic conditions
• Considerable variability in care

Birkmeyer et al, NEJM 2003


Evil or Genius
End Results Registry
Honors, except those I have thrust upon myself, are conspicuously absent..., but I am able to enjoy the hypothesis that I may receive some more from a more receptive generation.

100 Years of Improving Quality
1913 1922 1950
1951
1998
2004
2005
2011
Minimum Standard for
Hospitals
COMMITTEE ON TRAUMA
SSR 2012
TQIP

ACS Approach to Improving Quality
• Accreditation
• Research / trials
• Education
• Quality measurement and feedback


Developing a Learning Health System

• Surgical quality measurement and improvement tool
• 500+ hospitals
• All surgical subspecialties
• Short-term outcomes
• Endorsed by CMS, Joint Commission, CDC, AMA, AHA, and many others
American College of Surgeons National Surgical Quality Improvement Program

Hospital ACS NSQIP Team
• Surgeon Champion
• Surgical Clinical Reviewer – Data abstractor – QI/PI project manager
• Hospital QI / PI staff
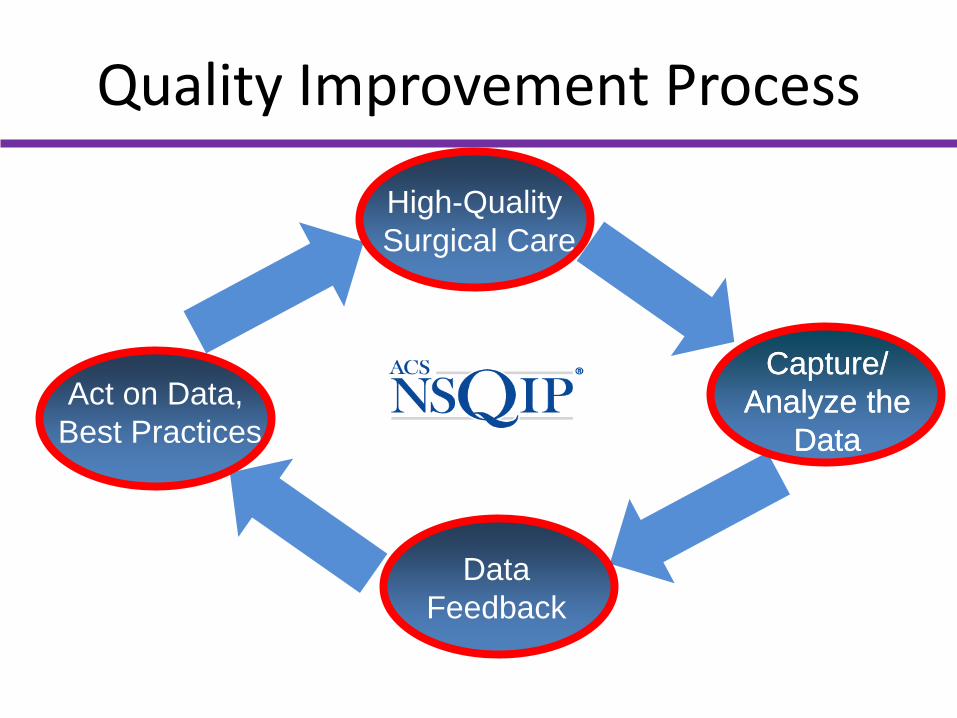
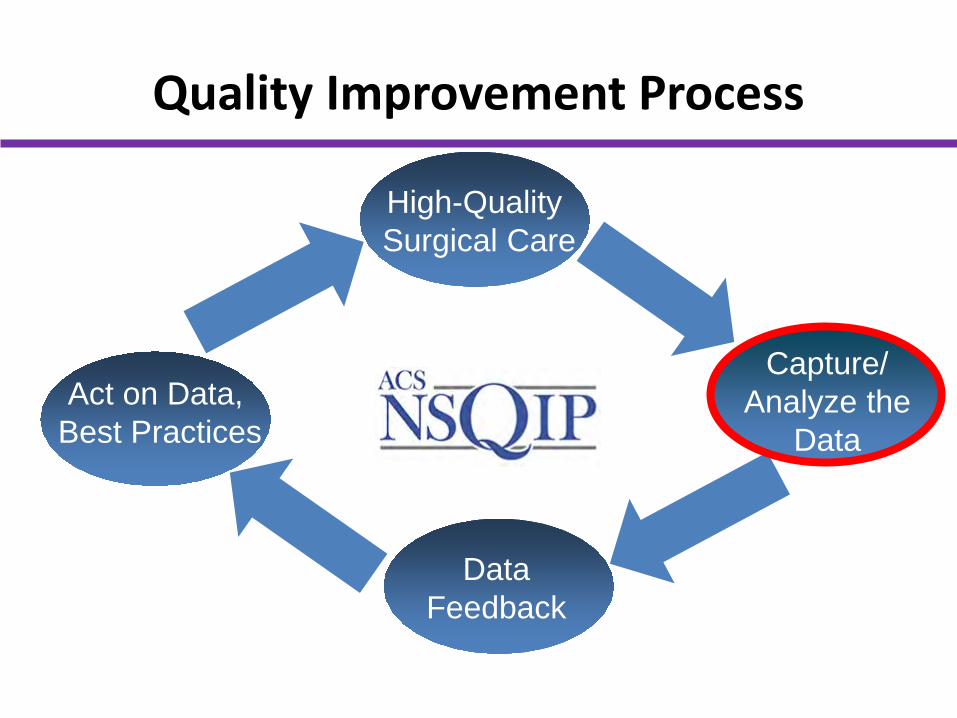
Quality Improvement Process
High-Quality Surgical Care
Capture/ Analyze the
Data
Data Feedback
Act on Data, Best Practices
Capture/ Analyze the
Data

Performance Relative to Other Hospitals O
dds
Rat
io
Observed Rate: 6.41% Expected Rate: 3.91% O/E Ratio: 1.64 Status: Needs Improvement

History of NSQIP
October 2004 27% decline in post-operative mortality 45% drop in post-operative morbidity Median post-operative length of stay 9 to
4 days Patient satisfaction improved

Participating Hospitals: 600 and increasing

ASC NSQIP Key Features • Rigorous Clinical Data Abstraction
– Standardized data definitions – Trained data abstractor-Surgical Clinical Reviewer (SCR) – Comprehensive set of >70 risk factors – Intraoperative data – Externally audited data – Allows for rigorous risk adjustment
• All surgical subspecialties
• Risk-Adjusted Outcomes
– 30-day morbidity, mortality, readmission & LOS – 30+ Outcomes
Quality Improvement Process
High-Quality Surgical Care
Capture/ Analyze the
Data
Data Feedback
Act on Data, Best Practices
Capture/ Analyze the
Data

ACS NSQIP Surgical Specialties
General Surgery Vascular Gynecologic Urologic Plastic & Reconstructive Surgery Otolaryngology Orthopedic Surgery Neurosurgery Thoracic Surgery

Preoperative data: 70+ • Demographics • Comorbidities • Preop labs:
Intraoperative data: 20+ • Procedure (CPT) and Indication (ICD-9) • Intraoperative complications and events
Postoperative data: 25+ • Death • DVT/PE, MI, SSI, UTI, pneumonia, renal failure • Length of stay, reoperation, readmission
Data Collected

Types of Data Used in QI Programs
• Administrative – Medicare – “Cheap” but often inaccurate
• Clinical / Registry
– ACS NSQIP, STS – Expensive and more reliable

Administrative vs. Clinical Data
Lawson et al, Ann Surg 2012
Missed in Administrative
Data
False Positives in Admin Data
Superficial SSI 73% 71%
Organ-space SSI 66% 74%
UTI 55% 79%
Pneumonia 50% 63%
Sepsis 54% 63%
VTE 47% 58%
MI 22% 84%

Validation with Audits • Audit procedure: highly reliable data
– Overall 1.6% disagreement rate
• Quality of data improves each year
Shiloach et al, JACS 2009

Do we need post-discharge data?
• Shorter LOS • Emphasis on readmissions
• SCRs obtain post-discharge data – Outpatient charts – Call patients
Index Operation 30 Days Discharge
Inpatient Outpatient

ACS NSQIP Captures Post-Discharge Events
• 40% had only post-discharge complications
• 33% of all complications were after discharge
• 25% of deaths occurred after discharge
Bilimoria et al, Ann Surg 2010

Quality Improvement Process
High-Quality Surgical Care
Capture/ Analyze the
Data
Data Feedback
Act on Data, Best Practices
Capture/ Analyze the
Data

01 04
08
12
16
20
24
28
32
36
40
44
Rank by unadjusted Outcomes
01 04
08
12
16
20
24
28
32
36
40
44
Rank by risk-adjusted Outcomes
Patient Comorbidity and Casemix
Adjustment Does Matter
Best
Worst
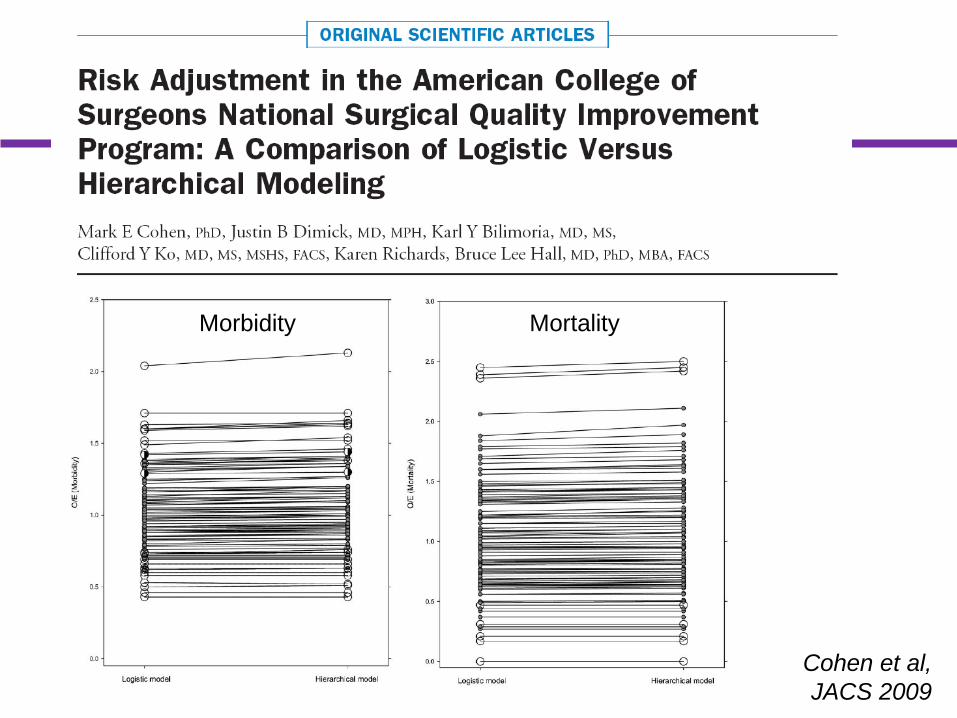
Cohen et al, JACS 2009
Morbidity Mortality

ASA Class and Functional Status
MORBIDITY MORTALITY
Cohen et al, Ann Surg 2009

Risk Adjustment with Fewer Variables

Quality Improvement Process
High-Quality Surgical Care
Capture/ Analyze the
Data
Data Feedback
Act on Data, Best Practices
Capture/ Analyze the
Data

Data Feedback

Observed Rate: 6.41% Expected Rate: 3.91% O/E Ratio: 1.64 Status: Needs Improvement
z
Odd
s R
atio
Risk-Adjusted Outcome Report

Can see multiple risk-adjusted outcomes on a single page
Colorectal Surgery Outcomes

Quality Improvement Process
High-Quality Surgical Care
Capture/ Analyze the
Data
Data Feedback
Act on Data, Best Practices
Capture/ Analyze the
Data

Acting on the data
I think you should be more explicit here in Step 2.
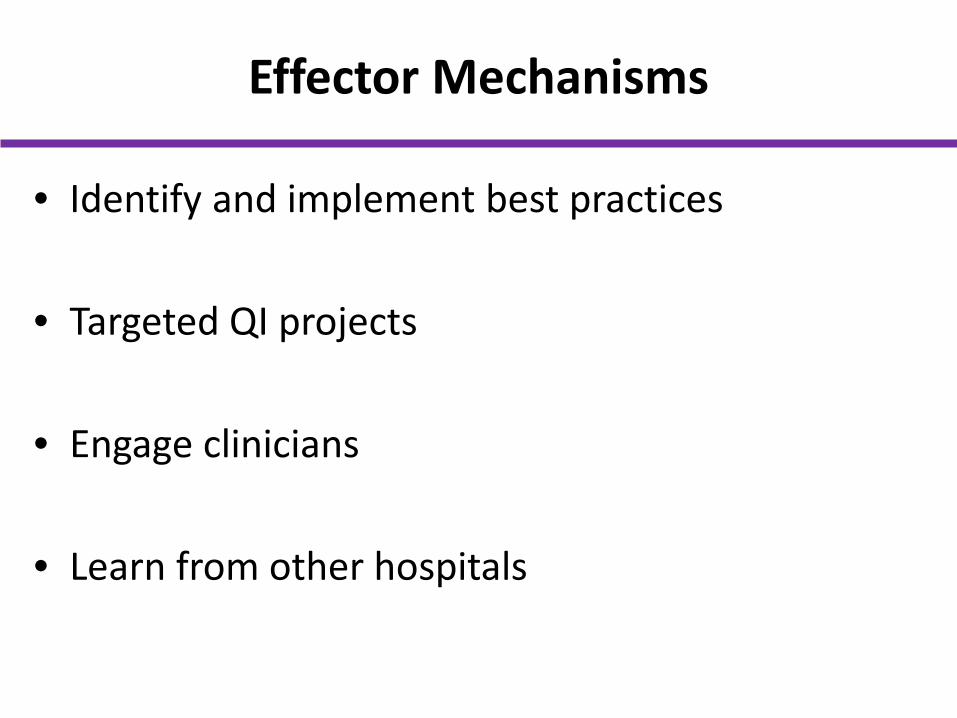
Effector Mechanisms
• Identify and implement best practices
• Targeted QI projects
• Engage clinicians
• Learn from other hospitals

Best Practices Clinical/QI Topics
• SSI, VTE, UTI, pulmonary • Catheter-Related Blood Stream Infection • Many more
SSI Best Practices Guidelines – Preop – Intraop – Postop – Things NOT to do!

Case Studies describing real improvement
Volume 1 • Postop Stroke
– Cuyuna • O/E Ratio
– Danbury • UTI
– Decatur • DVT
– Henry Ford • Pulmonary Conditioning
– St John
Volume 2 FMEA Process Advocate Good
Samaritan Glucose/Temp Control Kaiser Sunnyside
Safety/SSI Morristown Memorial
SSI (Vascular) Scripps
SSI (Breast) Surrey Memorial


Does ACS NSQIP Work??

ACS NSQIP: Data Matters
82% OF HOSPITALS DECREASED COMPLICATIONS
66% OF HOSPITALS DECREASED MORTALITY
250-500 COMPLICATIONS PREVENTED ANNUALLY PER HOSPTAL

Potential Cost Savings if U.S. Hospitals Adopt ACS NSQIP
• Reduction in complications: 250-500 • Average cost per complication: $11,626 • Average savings per hospital: $2,906,500 -
$5,813,000 • Potential yearly savings across 4,500 hospitals:
$13 - $26 billion/year

St. Francis Hospital in Connecticut
UTI reduction of 1% resulted in >$1 million saved
2008 2009
2010
2011 2010
2009
2008
62% reduction
Instituted ACS NSQIP Best Practice Guidelines in late 2008 to reduce the incidence of postoperative catheter-associated UTIs
2012

CMS Rule Regarding Participation in General Surgery Registry


Registry Participation to be Tied to CMS Reimbursement
• Taxpayer Relief Act of 2013 – Government Accountability Office (GAO) to
develop strategies to link clinical registry participation to payment incentives


NSQIP Not Associated with Improved Outcomes


ACS NSQIP Collaboratives
• More than 20 currently
• Benefits – Customized benchmarking – Share experiences / best practices – Perform collaborative studies

Statewide Collaboratives
• Michigan
• Florida
• Tennessee
• Hospitals in collaboratives improve more than hospitals working alone.
• Tremendous cost savings that far outweigh costs of the program.
• Hospitals already in NSQIP also improve.

Improvement in Michigan
Sepsis ↓34% Pneumonia ↓29% Vent >48h ↓22% SSI ↓13% Cardiac arrest ↓33%
• Reduced postoperative VAP rate by 70%
• $14 million in
savings for the state in 1 year

Early Improvement in Tennessee
Acute renal failure
↓25%
Sepsis ↓10% Vent >48h ↓15% SSI ↓19%
• Estimated $8 million in savings per year

ACS NSQIP in Illinois
• 20 hospitals in 2013
• 75+ hospitals not participating
• Many had shown some interest
• Interviews with current, interested, and other hospitals to identify barriers to participation and improvement

Comments from Hospitals
• Unsure if worth the startup costs
• Unsure how to act on the data
• Surgeon Champion unsure of what to do
• SCRs wanted community to discuss issues
• Little opportunity to learn from other hospitals

• To facilitate hospitals working together to improve the quality of surgical care in Illinois
• To create a novel research platform
Mission

Collaborative Effort Between
• ACS NSQIP
• ACS Metro Chicago and Illinois Chapters
• Blue Cross Blue Shield of Illinois (BCBSIL)
• Northwestern SOQIC

Advisory Committee
• New hospitals – Surgeon Champions – SCRs – Administrators
• Current hospitals
– Surgeon Champions – SCRs – Administrators
• ACS Chapter representatives
• ACS NSQIP staff
• Coordinating center
• BCBS-IL
representative

Illinois Surgical Quality Improvement Collaborative (ISQIC)
• ACS NSQIP data collection/reporting infrastructure
• Model other successful statewide collaborations
• Recruit new hospitals and current ACS NSQIP hospitals in Illinois
• Novel approaches to facilitate improvement

55 ISQIC Hospitals


ISQIC Baseline Assessment
•Assesses ISQIC Team’s familiarity with QI/PI
•Comparative data will be provided
•Average scores
• Overall 66% • New hospitals 64% • Old hospitals 69%
• Areas of Strength: • Creating a problem statement • Identifying key stakeholders • Creating project team
• Areas of Weakness:
• Identifying drivers of poor performance • Implementing a strong change to
improve quality

Novel Approaches to Facilitate Using Your Data Effectively
• Mentor
• Coach
• Formal QI/PI curriculum
• Site visits – Culture and quality assessments

The ISQIC Team

ISQIC Curriculum: Online Modules
• YEAR 1 – Introduction to NSQIP and ISQIC – Define (What are we trying to accomplish?) – Measure (How will we know that a change is an improvement) – Analyze (What change can we make that will result in an
improvement) – Improve (Executing/testing the change) – Control (How do we ensure sustained performance?)
• YEAR 2 – How to use and interpret ACS NSQIP reports – Key Features of Quality and Stakeholder Interests – Organizational Knowledge and Leadership Skills – Patient Safety Principles – Teamwork and Communication – Change Management

ISQIC Curriculum: In-Person Training
• Brief talks to synthesize modules
• Half day of practical exercises
• Work through a project with coaches

Novel Approaches to Facilitate Using Your Data Effectively
• Customized, Illinois-Specific benchmark reports
• Surgeon-specific reports
• Over time improvement reports for your hospital and for the state
• Focus on process measures

Quality Improvement Projects
• 1 local project per year
• 1 statewide project per year
• Pilot grants

Semi-Annual Collaborative Meetings

Platform for Research
• Impact of our interventions
• Barriers to improvement
• Collaborative Quality Improvement Projects

Impact of Our Interventions
• QI/PI Curriculum
• Mentor / coach
• Projects
• All interventions

Do these interventions result in better improvement?
6%
7%
8%
9%
10%
11%
12%
13%
Year 1 Year 2 Year 3
Ove
rall
Risk
-Adj
uste
d M
orbi
dity
Rat
e
Year of ACS NSQIP Participation
Early NSQIP Hospitals (n=20)
ISQIC Enrolled (n=26)

Who is more likely to improve?
• Baseline assessments of – QI/PI capabilities – Quality/Safety Culture – Processes – Outcomes – Surgeon Champion
• Skills, respect, social network

Changes with ISQIC Participation
• QI capabilities
• Culture
• Postoperative outcomes – Individual hospitals – State
• Other available surgery-related measures
– Process, outcomes, HCAPHS

Barriers to Improvement
• Study current NSQIP hospitals that have not improved – Site visits – Key informant interviews – Design interventions for new hospitals
• Identify barriers to improvement in advance for new hospitals
Collaborative Quality Improvement Projects
• One per year
• Study of QI initiative or policy
• Platform for QI trials

Prospective Cluster-Randomized Trials of QI and Policy Interventions
INTERVENTION ARM: 25 Hospitals
USUAL CARE ARM: 25 Hospitals vs.
QI Intervention: • Checklist • Implement bundle of
best practices • Policy change • Financial motivation • Public reporting
No Intervention
Alternate Intervention
or

Potential Interventions
• OR Briefings
• Emergency Manuals Checklist
• Enhanced Recovery After Surgery (ERAS)
• Strong for Surgery
• UTI or VTE prevention bundle
• Surgeon 360 reviews
• What else?

VTE Rate by Imaging Frequency
5.00*
7.53*
10.17*
13.48
0.00
2.00
4.00
6.00
8.00
10.00
12.00
14.00
16.00
Quartile 1N=697 Hospitals
Quartile 2N=696 Hospitals
Quartile 3N=708 Hospitals
Quartile 4N=685 Hospitals
Mea
n R
isk-
Adju
sted
VTE
Rat
e
per 1
,000
Dis
char
ges
VTE Surveillance Imaging Quartile (N=2,786 Hospitals)
P<0.001 pairwise/trend
Bilimoria et al, JAMA 2013

Ideal VTE Prophylaxis
• Early ambulation • Mechanical prophylaxis • Chemoprophylaxis
• All doses • Correct dose • Correct frequency

Northwestern Performance on New VTE Measure

ISQIC Offers Tremendous Opportunity
• True Learning Health System
• Statewide quality improvement
• Cost reduction
• Novel research platform

New Approaches to Improving the Quality of Care:
Becoming a Learning Health System
Karl Bilimoria MD MS Surgical Outcomes and Quality Improvement Center (SOQIC)
Department of Surgery and Center for Healthcare Studies Feinberg School of Medicine, Northwestern University
@kbilimoria


Illinois Surgical Quality Improvement Collaborative
Karl Bilimoria MD MS Vice Chair for Quality, Department of Surgery
Director, Surgical Outcomes and Quality Improvement Center Feinberg School of Medicine, Northwestern University
Lurie Children’s Hospital Surgical Grand Rounds
Illinois Surgical Quality Improvement Collaborative
Karl Bilimoria MD MS Vice Chair for Quality, Department of Surgery
Director, Surgical Outcomes and Quality Improvement Center Feinberg School of Medicine, Northwestern University
Lurie Children’s Hospital Surgical Grand Rounds