Embed Size (px)
Citation preview

Leadership, Energy, and Execution 1UNCLASSIFIED 7 NOV 2017
New and Emerging
Technologies
Mission Resilience & Sustainability Training
Bill Chvala, Anne Wagner, Ben Ford, Emily Wendel Pacific Northwest National Laboratory
Leadership, Energy, and Execution 2UNCLASSIFIED 7 NOV 2017
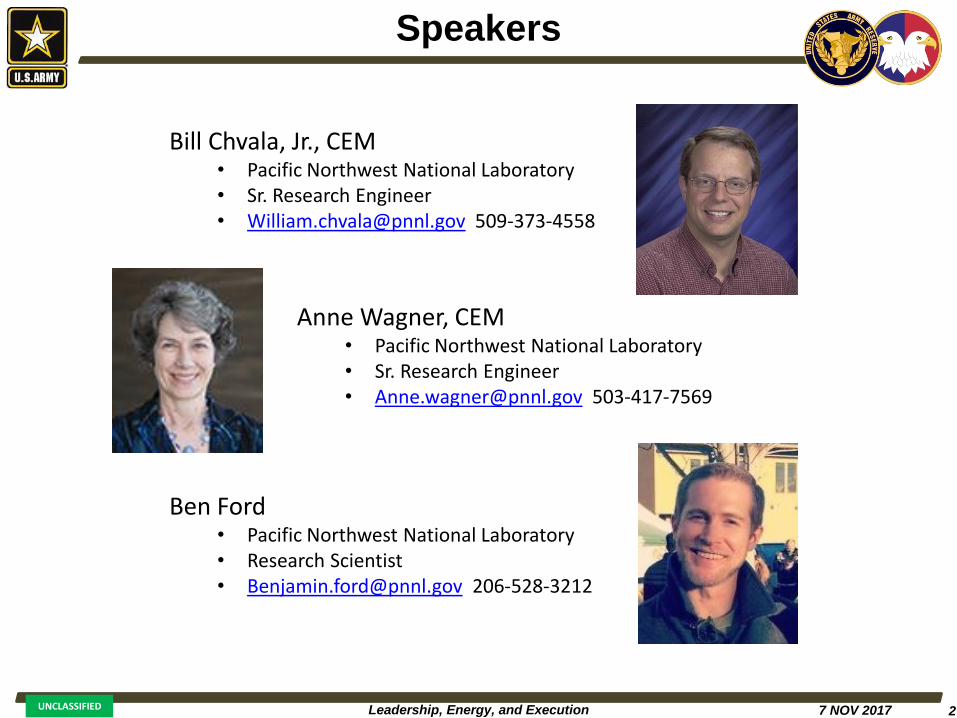
Speakers
Bill Chvala, Jr., CEM• Pacific Northwest National Laboratory• Sr. Research Engineer• [email protected] 509-373-4558
Anne Wagner, CEM• Pacific Northwest National Laboratory• Sr. Research Engineer• [email protected] 503-417-7569
Ben Ford• Pacific Northwest National Laboratory• Research Scientist• [email protected] 206-528-3212

Leadership, Energy, and Execution 3UNCLASSIFIED 7 NOV 2017
Learning Objectives
• Objective 1: Understand how the Army Reserve is working to promote application of advanced technologies.
• Objective 2: Understand what makes a successful demonstration and how to leverage other resources.
• Objective 3: Discuss how a proposed machine learning demonstration can utilize our MDMS and EBCS data to teach us about our buildings.
Leadership, Energy, and Execution 4UNCLASSIFIED 7 NOV 2017
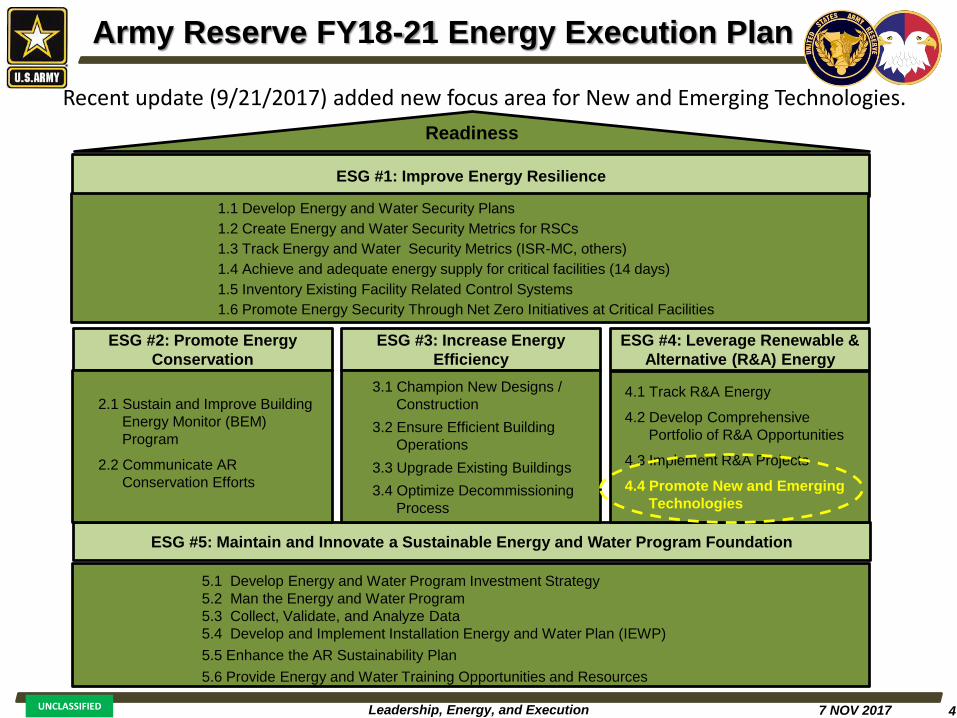
Army Reserve FY18-21 Energy Execution Plan
ESG #5: Maintain and Innovate a Sustainable Energy and Water Program Foundation
ESG #2: Promote Energy
Conservation
ESG #3: Increase Energy
Efficiency
ESG #4: Leverage Renewable &
Alternative (R&A) Energy
5.1 Develop Energy and Water Program Investment Strategy
5.2 Man the Energy and Water Program
5.3 Collect, Validate, and Analyze Data
5.4 Develop and Implement Installation Energy and Water Plan (IEWP)
5.5 Enhance the AR Sustainability Plan
5.6 Provide Energy and Water Training Opportunities and Resources
2.1 Sustain and Improve Building
Energy Monitor (BEM)
Program
2.2 Communicate AR
Conservation Efforts
3.1 Champion New Designs /
Construction
3.2 Ensure Efficient Building
Operations
3.3 Upgrade Existing Buildings
3.4 Optimize Decommissioning
Process
4.1 Track R&A Energy
4.2 Develop Comprehensive
Portfolio of R&A Opportunities
4.3 Implement R&A Projects
4.4 Promote New and Emerging
Technologies
Readiness
ESG #1: Improve Energy Resilience
1.1 Develop Energy and Water Security Plans
1.2 Create Energy and Water Security Metrics for RSCs
1.3 Track Energy and Water Security Metrics (ISR-MC, others)
1.4 Achieve and adequate energy supply for critical facilities (14 days)
1.5 Inventory Existing Facility Related Control Systems
1.6 Promote Energy Security Through Net Zero Initiatives at Critical Facilities
Recent update (9/21/2017) added new focus area for New and Emerging Technologies.

Leadership, Energy, and Execution 5UNCLASSIFIED 7 NOV 2017
Army Reserve FY18-21 Energy Execution Plan
ESG 4.4. Promote New and Emerging Technologies• Description: Champion New and Emerging Technologies
• End-State: Provide factual performance data and application notes to encourage adoption of technologies
• Challenges: Pilots and demonstrations require funding. Long lead time on some of these.
• Roadmap:– Develop list of “emerging technologies“ and track product life-cycle
– Highlight 1 new technology on Monthly EM Calls
– Develop communications plan.
• Produce "Technology Fact Sheet" for technologies not in full scale demo
• Develop deployment strategy for validated technologies
– Promote programs that provide support for new technologies
– Fund Army Reserve-specific pilots and demos:
• Phase Change Material (PCM) demonstration
• Combined Heat and Power (CHP) demonstration
Leadership, Energy, and Execution 6UNCLASSIFIED 7 NOV 2017
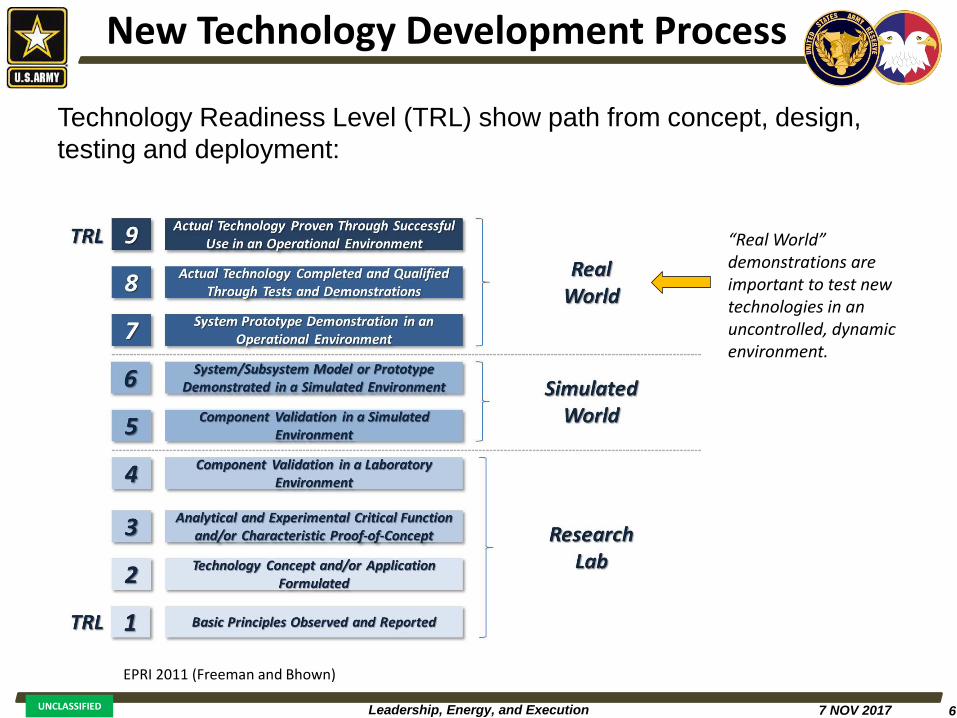
New Technology Development Process
Technology Readiness Level (TRL) show path from concept, design,
testing and deployment:
EPRI 2011 (Freeman and Bhown)
“Real World” demonstrations are important to test new technologies in an uncontrolled, dynamic environment.
Leadership, Energy, and Execution 7UNCLASSIFIED 7 NOV 2017
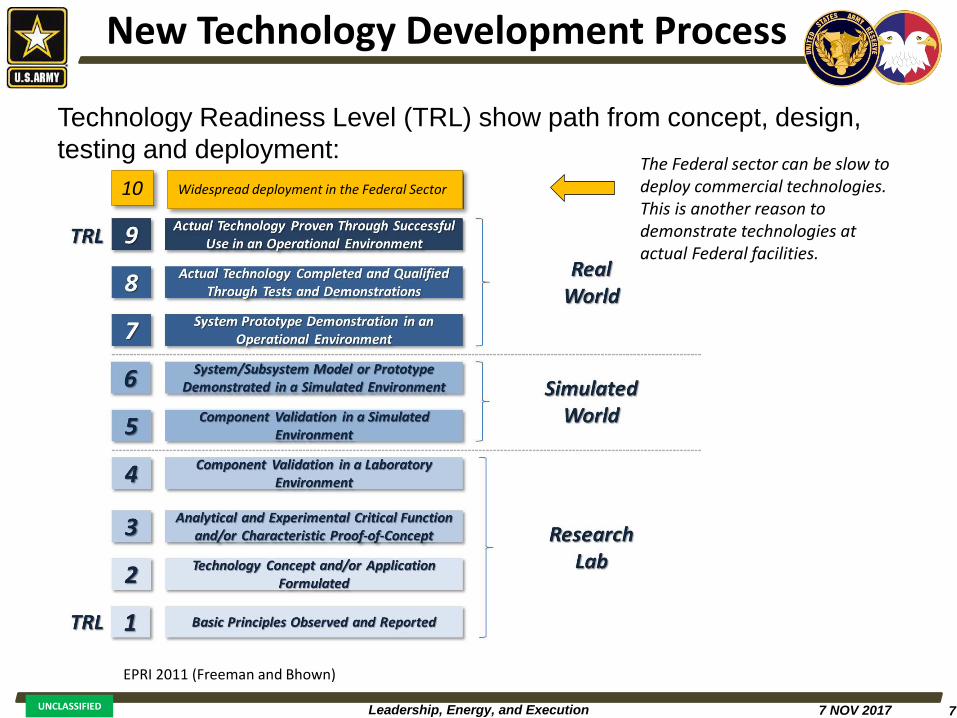
New Technology Development Process
Technology Readiness Level (TRL) show path from concept, design,
testing and deployment:
EPRI 2011 (Freeman and Bhown)
10 Widespread deployment in the Federal Sector
The Federal sector can be slow to deploy commercial technologies. This is another reason to demonstrate technologies at actual Federal facilities.
Leadership, Energy, and Execution 8UNCLASSIFIED 7 NOV 2017
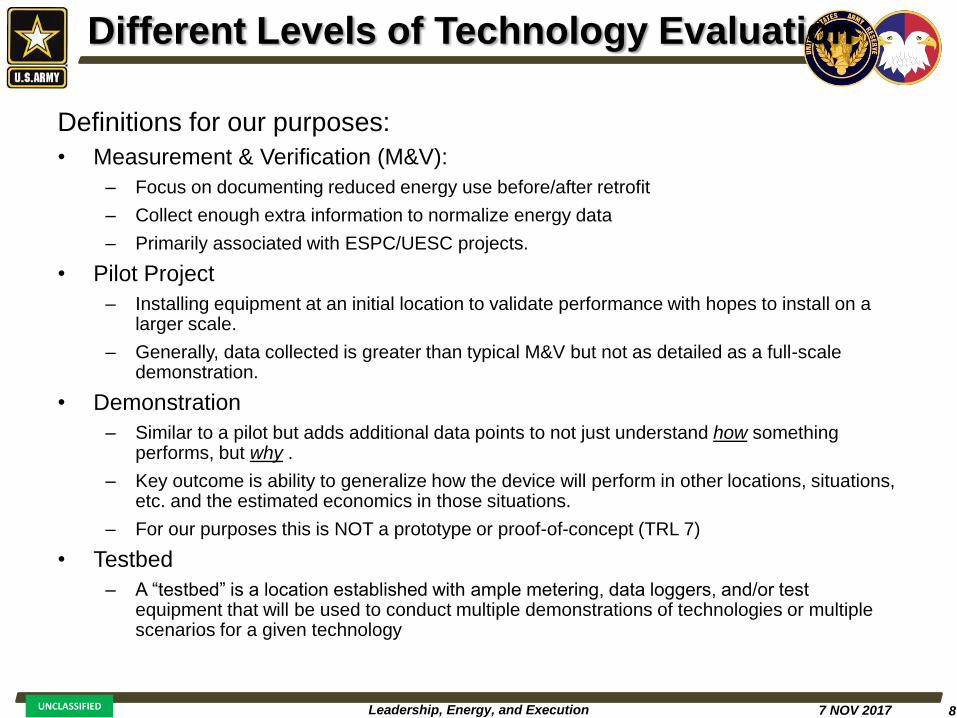
Different Levels of Technology Evaluation
Definitions for our purposes:
• Measurement & Verification (M&V):
– Focus on documenting reduced energy use before/after retrofit
– Collect enough extra information to normalize energy data
– Primarily associated with ESPC/UESC projects.
• Pilot Project
– Installing equipment at an initial location to validate performance with hopes to install on a larger scale.
– Generally, data collected is greater than typical M&V but not as detailed as a full-scale demonstration.
• Demonstration
– Similar to a pilot but adds additional data points to not just understand how something performs, but why .
– Key outcome is ability to generalize how the device will perform in other locations, situations, etc. and the estimated economics in those situations.
– For our purposes this is NOT a prototype or proof-of-concept (TRL 7)
• Testbed
– A “testbed” is a location established with ample metering, data loggers, and/or test equipment that will be used to conduct multiple demonstrations of technologies or multiple scenarios for a given technology

Leadership, Energy, and Execution 9UNCLASSIFIED 7 NOV 2017
Active Technology Evaluations
• Phase Change Materials (PCM)– 63d RSC, Sacramento California
• Combined Heat and Power (CHP) – Planned for FY18, location TBD
• Waste-to-Energy (WTE): ESTCP/SERDP – Fort Hunter Liggett
• Rainwater Harvesting – Fort Buchanan, PR (with solar ITTP)
– 63rd RSC, Grand Prairie, Texas
– 81st RSC, Savannah, Georgia
• CEC microgrid grant (co-funding)– Submitted FY18, Camp Parks
– Submitted FY18, 63rd RSC
• Deep data dive / machine learning on EBCS/MDMS data– Proposed, TBD?
Leadership, Energy, and Execution 10UNCLASSIFIED 7 NOV 2017
Demonstration Projects
• Demonstration Project Process
• Federal Demonstration Programs
• Lessons Learned
– Forrestal Project
– Other Projects
• Current Emerging Technologies
• Resources
Leadership, Energy, and Execution 11UNCLASSIFIED 7 NOV 2017
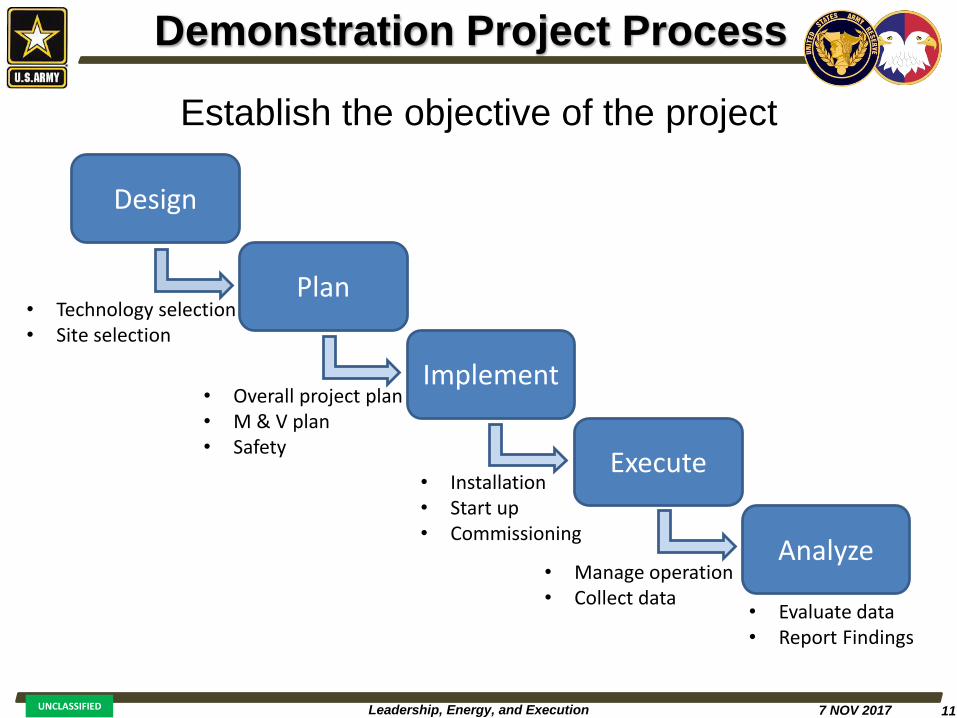
Demonstration Project Process
Establish the objective of the project
Design
Plan
Implement
Execute
Analyze
• Technology selection• Site selection
• Overall project plan• M & V plan• Safety
• Installation• Start up• Commissioning
• Manage operation• Collect data
• Evaluate data• Report Findings
Leadership, Energy, and Execution 12UNCLASSIFIED 7 NOV 2017
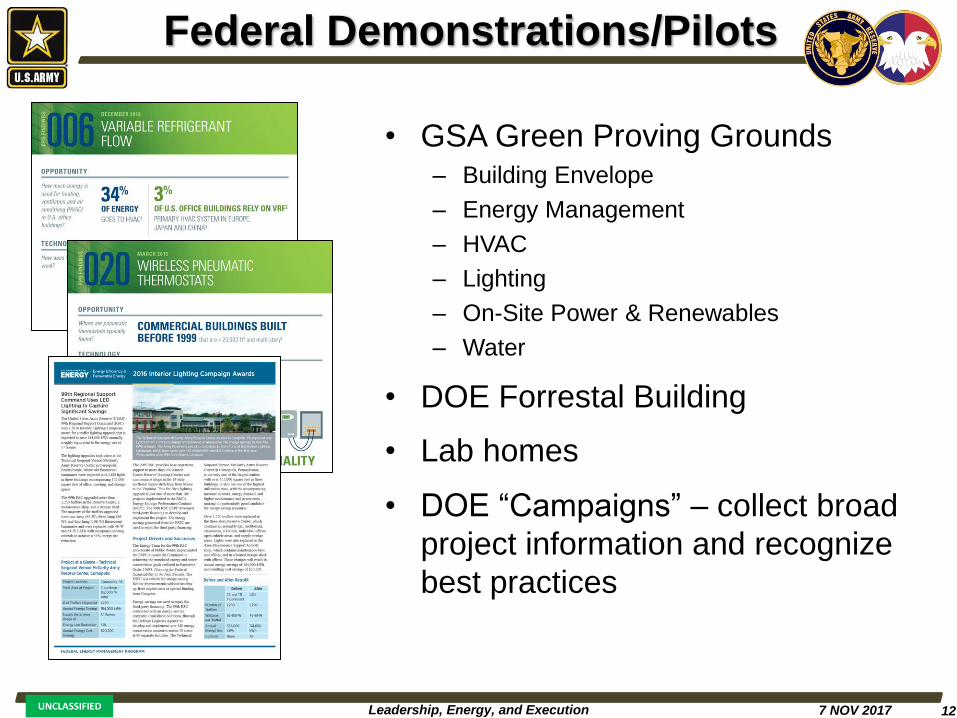
Federal Demonstrations/Pilots
• GSA Green Proving Grounds– Building Envelope
– Energy Management
– HVAC
– Lighting
– On-Site Power & Renewables
– Water
• DOE Forrestal Building
• Lab homes
• DOE “Campaigns” – collect broad
project information and recognize
best practices

Leadership, Energy, and Execution 13UNCLASSIFIED 7 NOV 2017
2017 ILC Army Reserve: 88th
DIV (R)
• 19,900 kWh saved annually
• 63% energy reduction compared to existing usage
Medium Project - IL002
Large Project – MI029
• 230,800 kWh saved annually
• 72% energy reduction compared to existing usage
Recognition:
Highest Percentage of annual Savings
for Troffer Retrofits
Leadership, Energy, and Execution 14UNCLASSIFIED 7 NOV 2017
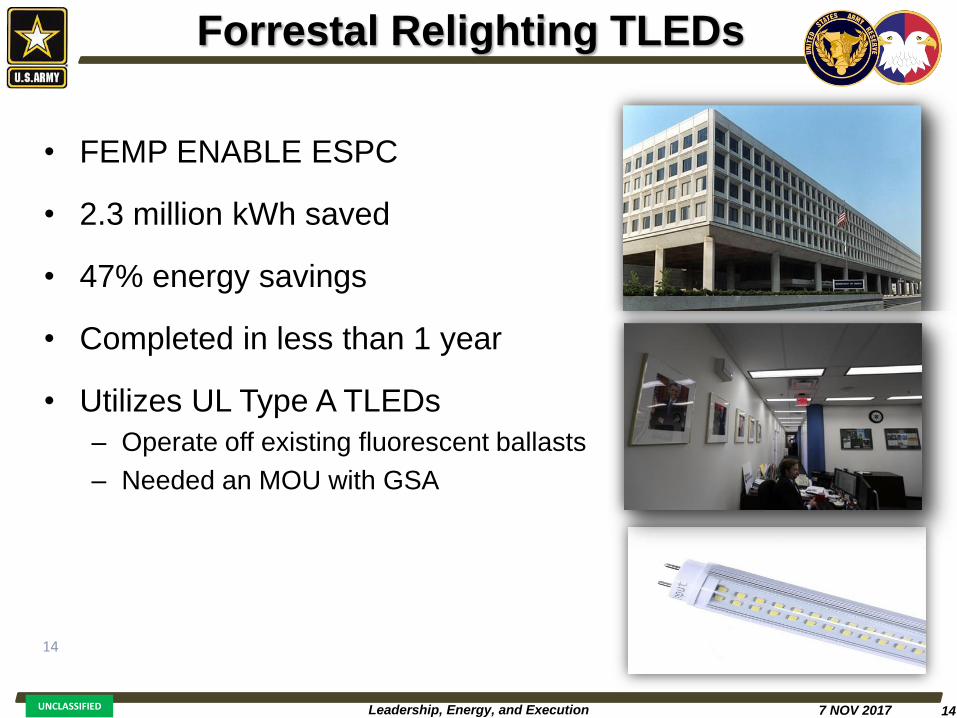
Forrestal Relighting TLEDs
• FEMP ENABLE ESPC
• 2.3 million kWh saved
• 47% energy savings
• Completed in less than 1 year
• Utilizes UL Type A TLEDs
– Operate off existing fluorescent ballasts
– Needed an MOU with GSA
14

Leadership, Energy, and Execution 15UNCLASSIFIED 7 NOV 2017
Forrestal Field Findings
• Do your homework:– select viable technology
– determine acceptable products/manufacturers
• Buy American Act - product compliance challenging
• Release clear and detailed RFQ/NOO
– Specific M&V requirements and protocols essential
• Beneficial to complete within one fiscal year
• Field hurdles – incompatibility with existing equipment or systems
Leadership, Energy, and Execution 16UNCLASSIFIED 7 NOV 2017
Lessons Learned from other PCM Projects
• PCM melting point temperature selection process– Utilize engineering calculations & data logging for proper PCM selection
– More than one melting temperature is usually necessary
• Control heating and cooling setpoints & scheduling– Allowed occupants to change setpoints & scheduling
• Effects - increases energy usage
• Establish proper test procedures with M&V– Inconsistent results based on utilizing utility meter data and not monitoring
HVAC equipment
• Collect longer periods of baseline and post data– Data analysis is inconclusive with regression analysis when periods are too
short
• Complex HVAC systems create a challenge to monitor– The simpler the HVAC systems (single zone RTU) the easier the monitoring
– Central plant HVAC systems and the effects of ancillary equipment (chillers and boilers) are challenging

Leadership, Energy, and Execution 17UNCLASSIFIED 7 NOV 2017
Other Lessons Learned
• Strive for simplicity
– Equipment/system isolation potential
– Personnel needed:
• Internal staff – onsite and offsite
• External personnel – contractors, subcontractors
• Project champions
• Proper preparation is essential
– Technology selection
– Thoroughly understand technology
– Verify savings estimates are accurate, reasonable and realistic
– Choose the right building
– Confer with site about their operations
– Good baseline is critical

Leadership, Energy, and Execution 18UNCLASSIFIED 7 NOV 2017
More Lessons
• Be proactive:
– Consider possible problems and solutions
• Continuous activities:
– Project Management
– Quality management
– Communication
Leadership, Energy, and Execution 19UNCLASSIFIED 7 NOV 2017
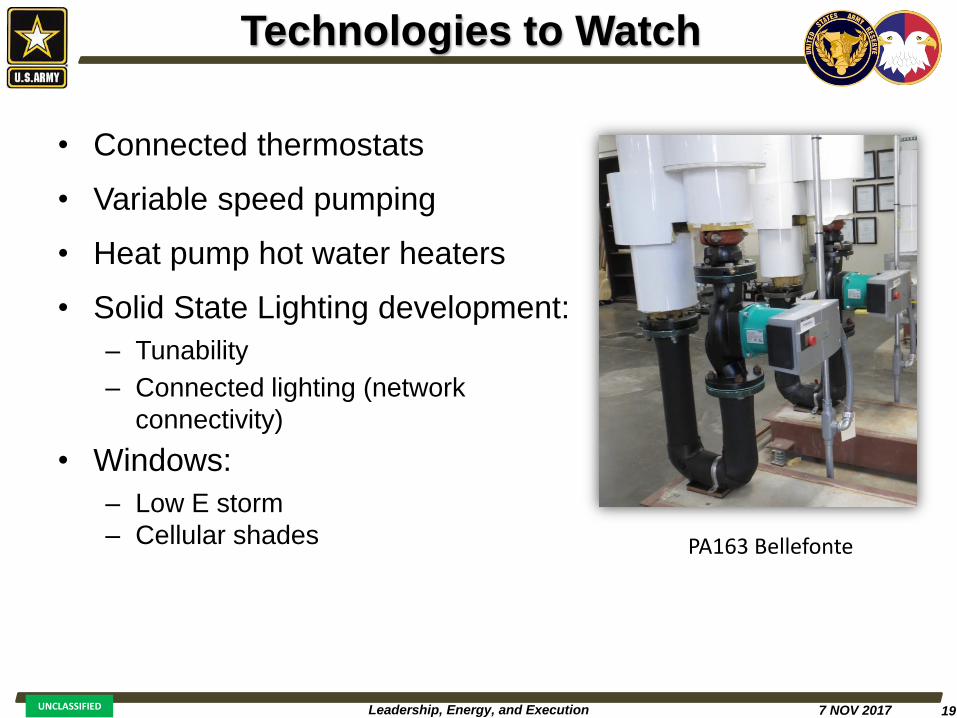
Technologies to Watch
• Connected thermostats
• Variable speed pumping
• Heat pump hot water heaters
• Solid State Lighting development:
– Tunability
– Connected lighting (network
connectivity)
• Windows:
– Low E storm
– Cellular shades PA163 Bellefonte
Leadership, Energy, and Execution 20UNCLASSIFIED 7 NOV 2017
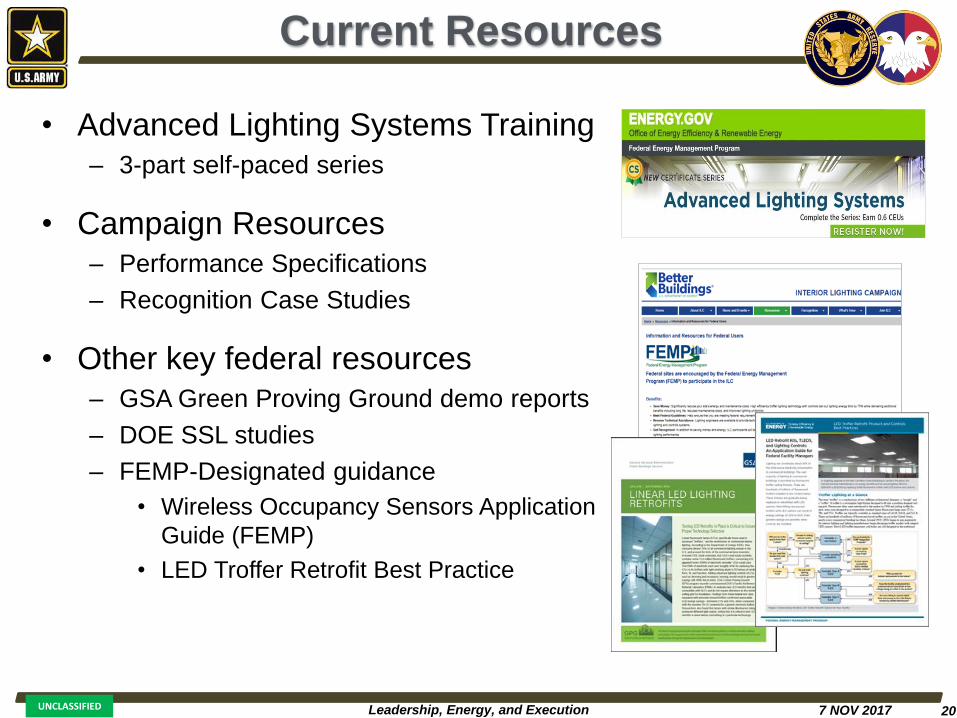
• Advanced Lighting Systems Training
– 3-part self-paced series
• Campaign Resources
– Performance Specifications
– Recognition Case Studies
• Other key federal resources
– GSA Green Proving Ground demo reports
– DOE SSL studies
– FEMP-Designated guidance
• Wireless Occupancy Sensors Application
Guide (FEMP)
• LED Troffer Retrofit Best Practice
Current Resources
Leadership, Energy, and Execution 21UNCLASSIFIED 7 NOV 2017
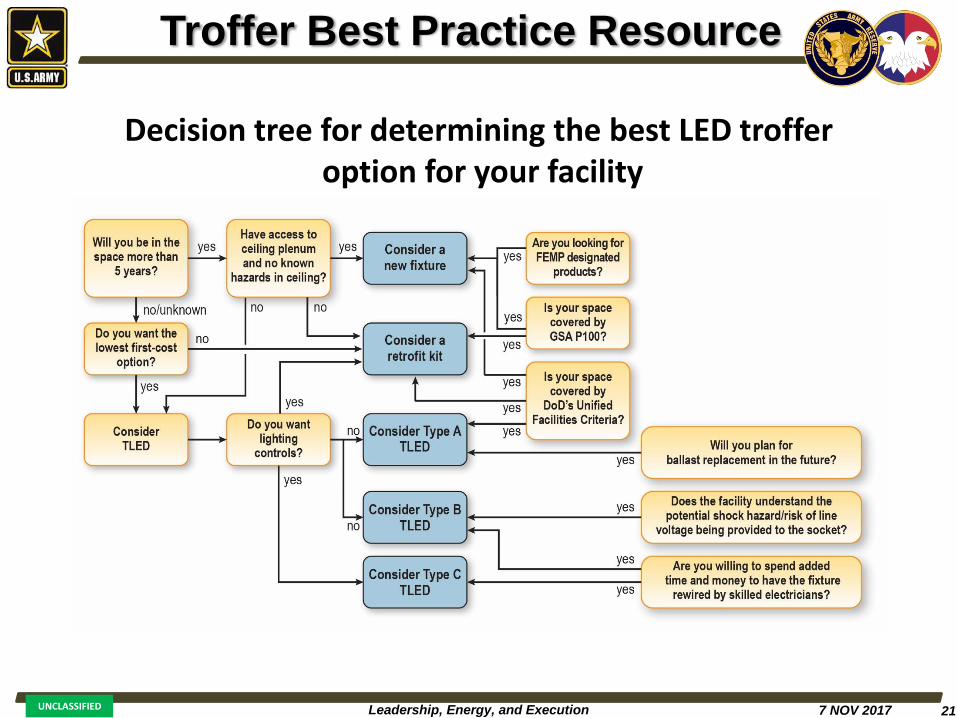
Troffer Best Practice Resource
Decision tree for determining the best LED trofferoption for your facility

Leadership, Energy, and Execution 22UNCLASSIFIED 7 NOV 2017
Resource Links
• Environmental Security Technology Certification Program (ESTCP)
https://www.serdp-estcp.org/About-SERDP-and-ESTCP/About-ESTCP
• General Services Administration Green Proving Ground Program
https://www.gsa.gov/governmentwide-initiatives/sustainability/gpg-program
• Department of Energy’s Solid-State Lighting Solutions
https://energy.gov/eere/femp/solid-state-lighting-solutions
• Interior Lighting Campaign (ILC)
https://interiorlightingcampaign.org/
• Lighting Energy Efficiency in Parking Campaign (LEEP)
http://www.leepcampaign.org/
• Advanced RTU Campaign (ARC) http://www.advancedrtu.org/
• Smart Energy Analytics Campaignhttps://smart-energy-analytics.org/
• PNNL Lab Homeshttp://labhomes.pnnl.gov/news.stm
Leadership, Energy, and Execution 23UNCLASSIFIED 7 NOV 2017
Machine Learning for USAR
Buildings Data
Mission Resilience & Sustainability Training
Presented By:Ben Ford– PNNL
Leadership, Energy, and Execution 24UNCLASSIFIED 7 NOV 2017
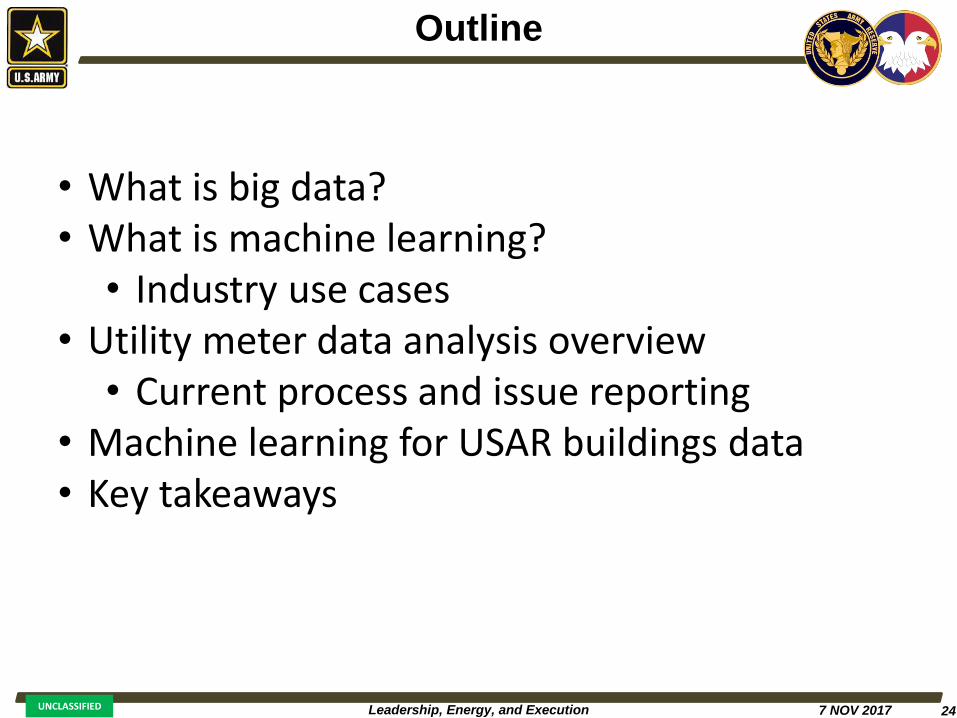
Outline
• What is big data?• What is machine learning?
• Industry use cases• Utility meter data analysis overview
• Current process and issue reporting• Machine learning for USAR buildings data• Key takeaways

Leadership, Energy, and Execution 25UNCLASSIFIED 7 NOV 2017
What is Big Data?
Big Data is large-scale data generated and captured continuously through a distributed network of manual and automated processes, characterized by the “Three V’s”.
Big data originated with business. Example sources:• Transactional data• Customer accounts• Inventory management• Process trending
Volume Velocity Variety
Leadership, Energy, and Execution 26UNCLASSIFIED 7 NOV 2017
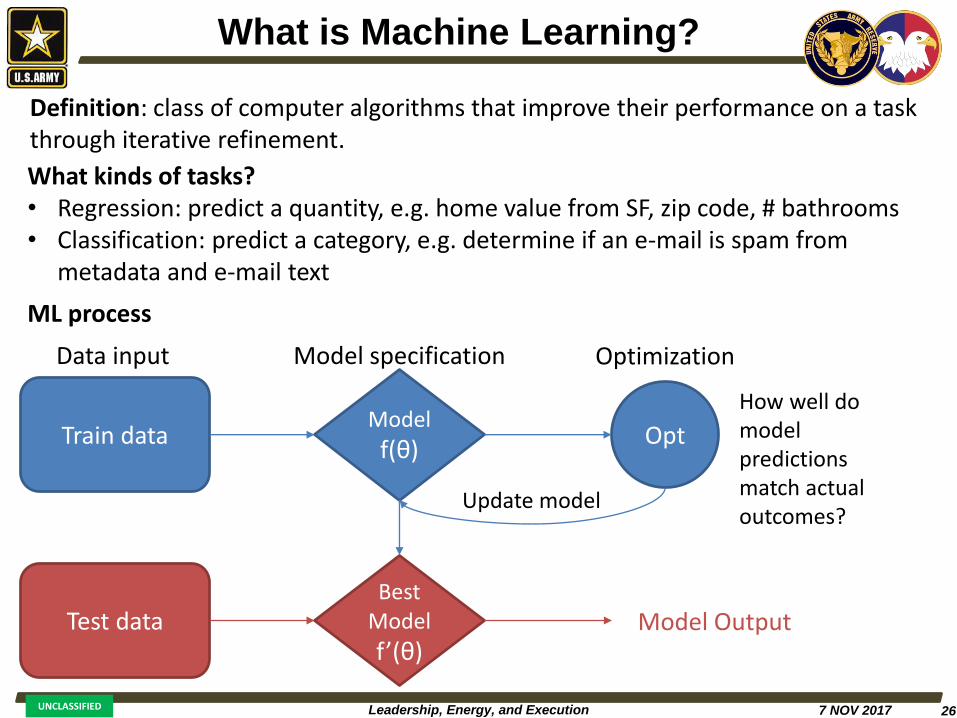
What is Machine Learning?
Definition: class of computer algorithms that improve their performance on a task through iterative refinement.
ML process
Train dataModel
f(θ)Opt
Update model
How well do model predictions match actual outcomes?
Data input Model specification Optimization
Test dataBest
Model
f’(θ)Model Output
What kinds of tasks?• Regression: predict a quantity, e.g. home value from SF, zip code, # bathrooms• Classification: predict a category, e.g. determine if an e-mail is spam from
metadata and e-mail text

Leadership, Energy, and Execution 27UNCLASSIFIED 7 NOV 2017
Machine Learning: Industry Use Cases
Recommender Engines Sentiment Analysis
Voice Recognition Anomaly Detection

Leadership, Energy, and Execution 28UNCLASSIFIED 7 NOV 2017
Sources of USAR Buildings Data
• Utility meter interval data • Meter Data Management System (MDMS)
• Building control system data (e.g. EBCS)• Sensors (temperature, pressure, status), alarms, run-time, set-points,
heating/cooling mode status• Dozens of equipment types (e.g. Boilers, Chillers, AHUs, VAVs, lighting,
occupancy)• Operations and maintenance tickets (e.g. CSS)
• Type, date, cost, frequency
Count of Meters by RSC and Type
• Others?

Leadership, Energy, and Execution 29UNCLASSIFIED 7 NOV 2017
Current Utility Meter Data Analysis Process
Evaluate
• Benchmark comparable buildings and identify operational problems, including meter connection, failure to use setbacks, early start-up, high baseload, and potential equipment controls issues
Prioritize
• Identify high priority facilities and actions for Installations or Regions based on energy, water and cost savings from corrective actions
Engage
• Provide regular Status Reports to facilitate energy manager action with limited, targeted information on meter operational status and building performance metrics
• Promote accountability by tasking and/or informally requesting resolution/justification and comparing performance to previous periods
Leadership, Energy, and Execution 30UNCLASSIFIED 7 NOV 2017
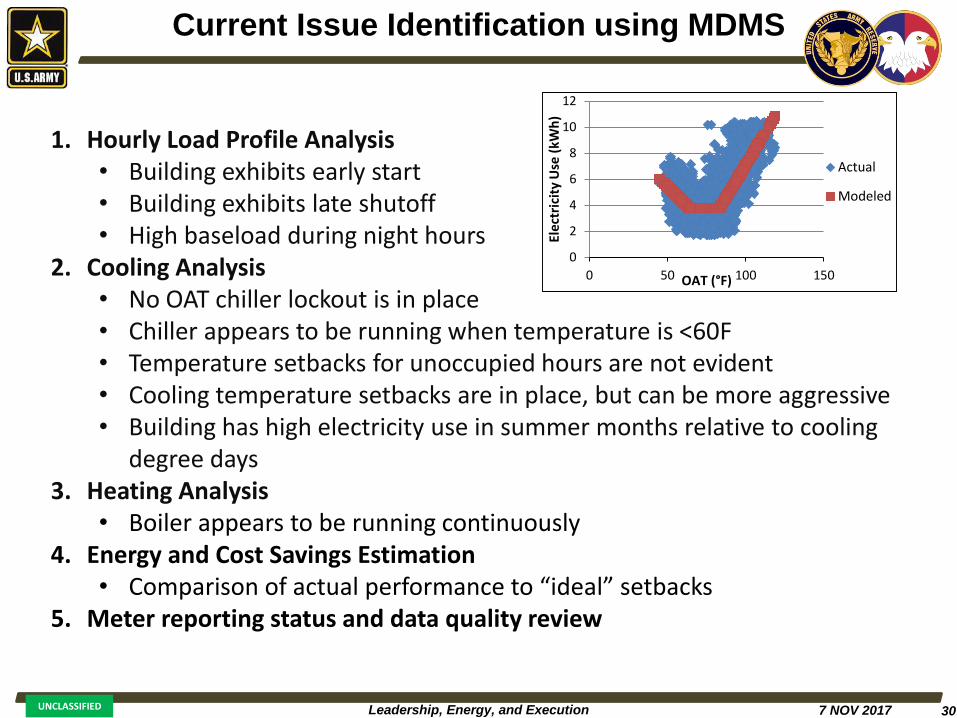
Current Issue Identification using MDMS
1. Hourly Load Profile Analysis• Building exhibits early start • Building exhibits late shutoff• High baseload during night hours
2. Cooling Analysis• No OAT chiller lockout is in place• Chiller appears to be running when temperature is <60F• Temperature setbacks for unoccupied hours are not evident• Cooling temperature setbacks are in place, but can be more aggressive• Building has high electricity use in summer months relative to cooling
degree days3. Heating Analysis
• Boiler appears to be running continuously4. Energy and Cost Savings Estimation
• Comparison of actual performance to “ideal” setbacks5. Meter reporting status and data quality review
0
2
4
6
8
10
12
0 50 100 150
Ele
ctri
city
Use
(kW
h)
OAT (°F)
Actual
Modeled
Leadership, Energy, and Execution 31UNCLASSIFIED 7 NOV 2017
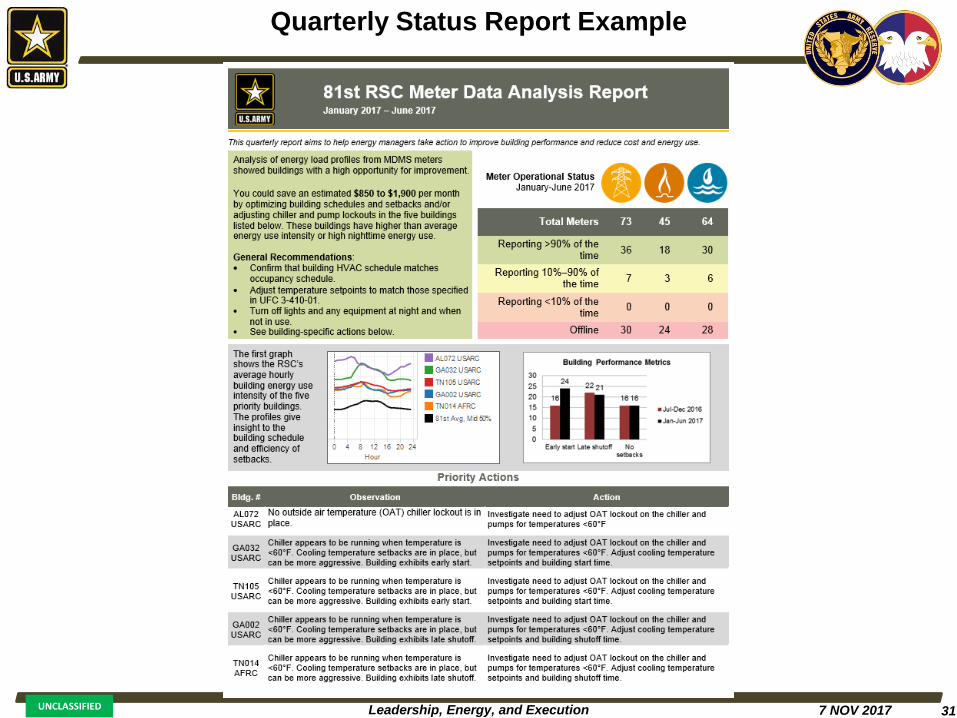
Quarterly Status Report Example
Leadership, Energy, and Execution 32UNCLASSIFIED 7 NOV 2017
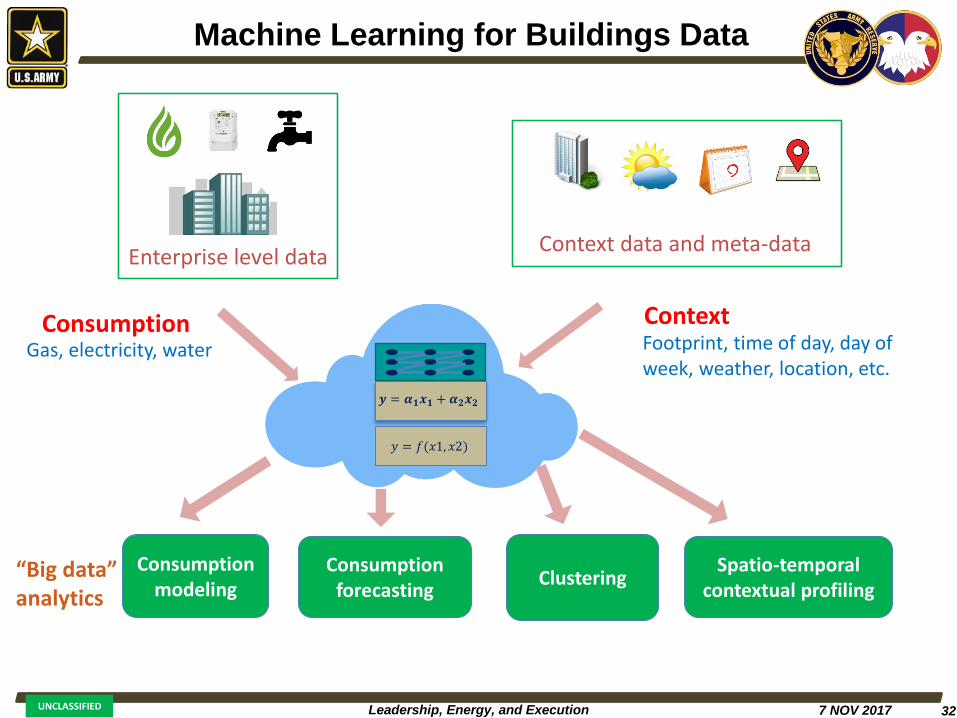
Machine Learning for Buildings Data
𝒚 = 𝜶𝟏𝒙𝟏 + 𝜶𝟐𝒙𝟐
𝑦 = 𝑓(𝑥1, 𝑥2)
Consumption modeling
Consumption forecasting
Spatio-temporal contextual profiling
Clustering
ConsumptionGas, electricity, water
Enterprise level dataContext data and meta-data
Context Footprint, time of day, day of week, weather, location, etc.
“Big data” analytics

Leadership, Energy, and Execution 33UNCLASSIFIED 7 NOV 2017
ML Economies of Scale
Cost/building
Scale (number of buildings)
Capability
Level of Effort
• Diminishing cost per building as ML models scale from demonstration to enterprise-level
• Successive models build on previous ones to deliver more advanced capabilities
• Greatest value from models that combines energy, control systems, and maintenance data

Leadership, Energy, and Execution 34UNCLASSIFIED 7 NOV 2017
Key Takeaways
• Machine Learning can yield automated insights, with minimal human-in-the-loop requirements
• Potential Machine Learning Applications for USAR• Consumption forecasting and demand
response• Fault detection and diagnosis• Predictive maintenance• Schedule optimization
• Your ideas?

Leadership, Energy, and Execution 35UNCLASSIFIED 7 NOV 2017
Thank you for your time!
Mission Resilience & Sustainability Training
Bill [email protected]
509-373-4558
Anne [email protected]
503-417-7569
206-528-3212
Emily Wendel [email protected]
206-528-3011