Embed Size (px)
Citation preview

2016OFFICE OF ENERGY
ANNUAL REPORT
2013 Annual Report Page i
Dear Governor Scott, President Negron, and Speaker Corcoran,
I am pleased to provide you with the 2016 Annual Report of the Florida Department of Agriculture and Consumer Services’ Office of Energy. This report reflects the Office of Energy’s activities during 2016 and elaborates on the programs helping to prepare Florida to meet the growing demand for energy in diverse and sustainable energy sources.
During the 2016 calendar year, the Office of Energy:
Provided 161 energy and water audits to farmers in the Suwannee County area and
invested more than $1.2 million to implement the resulting recommendations under the Farm Energy and Water Efficiency Realization Program.
Administered the Natural Gas Fuel Fleet Vehicle Rebate Program to Florida businesses for the conversion, purchase or lease of a natural gas fleet vehicle. This program produced an investment of $158.3 million and created or retained 632 jobs. In addition, the use of the vehicles purchased and retrofitted under this program will save rebate recipients an estimated $16.6 million.
Provided Florida K-12 public schools with 244 energy education kits designed to
develop teamwork, problem-solving abilities and investigate environmental issues. These kits include materials, such as solar panels and electric motors, which provide opportunities for hands-on science, technology, engineering and mathematics skills. An estimated 79,400 children around the state will be impacted by these kits.
I look forward to continuing working with you to advance Florida’s energy policy and support Florida’s businesses, consumers m and education infrastructure. Sincerely,
Adam H. Putnam Commissioner of Agriculture

2016 Annual Report Page ii
FLORIDA DEPARTMENT OF AGRICULTURE AND CONSUMER SERVICES
OFFICE OF ENERGY
2016 ANNUAL REPORT
Adam H. Putnam, Commissioner
The Holland Building 600 South Calhoun Street, Suite B04
Tallahassee, FL 32399-0001 (850) 617-7470
www.FreshFromFlorida.com

2016 Annual Report Page iii
Table of Contents Sections ____ Page No.
1. Executive Summary ………………………………………………………………...... 1 2. Florida’s Energy Landscape ………………………………………………………… 2
2.1 Florida’s Overall Consumption of Energy 2.2 Florida Sources of Energy in the Power Sector 2.3 Transportation Energy 2.4 New Trends
3. 2016 FDACS Office of Energy Accomplishments ...………………………………... 11
3.1 Energy Efficiency 3.1.1 Agricultural
3.1.1.1 Farm Energy and Water Efficiency Realization (FEWER) 3.1.1.2 Rural Business Enterprise Grant (RBEG) 3.1.1.3 Florida Renewable Efficiency Demonstration (FRED)
3.1.2 Multifamily 3.1.2.1 Multifamily Energy Efficiency Retrofit Demonstration
Projects 3.1.2.2 Multifamily Energy Retrofits Program (MERP)
3.2 Transportation 3.2.1 Natural Gas Fuel Fleet Vehicle Rebate Program 3.2.2 Drive Electric Orlando 3.2.3 Initiative for Resiliency in Energy through Vehicles (iREV) 3.2.4 Biofuels Infrastructure Partnership (BIP)
3.3 Education 3.3.1 Energy Clearinghouse of Information 3.3.2 Energy Education Kits for Public Schools-
3.3.2.1 EnergyWhiz Olympics 3.4 Propane Price Survey
3.4.1 State Heating Oil and Propane Program (SHOPP)
4. Florida Energy Systems Consortium ……………………………………………… 19
5. Florida Building Commission ……………………………………………………… 19
6. On the Horizon ……………………………………………………………………… 20 6.1 Mapping the Energy Landscape of Water and Wastewater Treatment Facilities in
Florida 6.2 Florida Alliance for Accelerating Solar and Storage Technology Readiness
(FAASSTeR) 6.3 Clean Energy for Low Income Communities Accelerator (CELICA) 6.4 2017 Florida Energy Summit
Attachment A: Florida Public Service Commission FEECA Report……………………... 21

2016 Annual Report Page 1
1. Executive Summary The Florida Department of Agriculture and Consumer Services’ Office of Energy (FDACS OOE) is the legislatively designated state energy policy and program development office within Florida. The FDACS OOE evaluates energy related studies, analyses and stakeholder input in order to recommend to the Governor and Legislature energy policies and programs that will move Florida toward a more diversified, stable and reliable energy portfolio. Further, FDACS OOE uses available state and federal funds to develop and manage energy efficiency, renewable energy and energy education programs throughout the state. In 2016, FDACS OOE offered programs in each of the following areas related to energy: transportation, energy efficiency, energy education and renewable energy. The FDACS OOE administered an energy efficiency pilot program project in 2016, providing a review of current energy usage in order to target energy and cost savings through retrofits. The Farm Energy and Water Efficiency Realization (FEWER) project, a pilot, provided on-site evaluations of the potential for energy efficiency, renewable energy upgrades, and water saving measures on individual farms in Suwanne County. In the transportation sector, FDACS OOE continues to administer the Natural Gas Fuel Fleet Vehicle Rebate program. This year, the program provided $5.8 million to 935 applicants. The Biofuels Infrastructure Partnership installed 135 biofuel “blender pumps” that are capable of disbursing biofuel blends in a range of 15 to 85 percent. In an effort to increase the usage of alternative fuels, FDACS OOE continues to participate in the Drive Electric Orlando project, which offers consumers the option to rent electric vehicles, and the Initiative for Resiliency in Energy through Vehicles program which helps promote the use of alternative fuel vehicles for disaster response. In an effort to provide energy-related education to Floridians, the FDACS OOE continued to host and improve the Florida Energy Clearinghouse. FDACS OOE purchased 244 Energy kits to provide to Florida public K-12 schools. This report reflects FDACS OOE activities during the 2016 calendar year and elaborates on the programs helping to prepare Florida in meeting the growing demand for energy in a diverse, reliable and sustainable manner. This report is submitted as required in Section 377.703(2)(f), Florida Statutes.

2016 Annual Report Page 2
2. Florida’s Energy Landscape This chapter summarizes Florida’s energy profile, including information on fuel diversity, electric generation, electric rates, infrastructure, transportation fuels, renewable fuels and energy efficiency measures. In addition to providing a summary of Florida’s energy landscape, this chapter provides an outlook on potential areas of opportunity for the state. 2.1 Florida’s Overall Consumption of Energy (Electricity and Transportation Fuel) According to the US Census, Florida is home to approximately 20.2 million people and is the third most populous state. With an increasing population, addressing Florida’s energy needs is a top priority. As it relates to consumption, the United States Department of Energy’s Energy Information Administration (EIA) ranks Florida 47th in the nation, consuming 207 million BTU1s per person. This consumption amount and the corresponding ranking declined from 2013 to 2014. Florida’s lower per-capita energy consumption ranking, relative to the national average, is due to below-average industrial sector consumption. Florida transportation and residential sectors drive energy consumption in the state. In terms of electric generation and transportation fuel, Florida is heavily reliant on natural gas and petroleum. Florida consumes more energy than it produces, making it a net energy importer of natural gas, coal, uranium and petroleum products. The most recent Florida energy consumption data provided by EIA is for 2014, and is shown in Figure 1. Figure 1 demonstrates the various fuel sources comprising Florida’s energy landscape. Natural gas continues to be the dominant fuel source for traditional electricity generation. The figure further demonstrates that Floridians consumed 1,246.7 trillion BTUs of natural gas in 2014, or 30.3 percent of its total energy consumption. Floridians also consumed 944.6 trillion BTUs of motor gasoline, or 22.9 percent of total energy consumption for all sectors—residential, commercial, industrial and transportation. The Florida Public Service Commission (FPSC) in its Review of the 2016 Ten-Year Site Plans of Florida’s Electric Utilities stated that “natural gas remains the dominant fuel over the planning horizon, with usage in 2015 at approximately 63 percent of the state’s net energy for load.” As of December 31, 2015, the Florida Reliability Coordinating Council (FRCC) reports that Florida’s total winter electric generating capacity is 62,991 megawatts (MW), and the Review of the 2016 Ten-Year Site Plans of Florida’s Electric Utilities discusses the planned addition of approximately 12,127 MW of new utility-owned generation over the next ten years. The amount of planned additions represents an increase from the previous year.
1 British Thermal Unit (BTU) is a standard unit for measuring a quantity of heat. The unit is used to measure and compare
the energy content of fuel.

2016 Annual Report Page 3
Florida receives the majority of its natural gas supplies from the Gulf Coast region via two interstate pipelines: the Florida Gas Transmission line and the Gulfstream pipeline. The Florida Gas Transmission line runs from Texas through the Florida Panhandle to Miami, and the Gulfstream pipeline is an underwater link from Mississippi and Alabama to Central Florida. The Jacksonville area also receives supplies from the liquefied natural gas (LNG) import terminal at Elba Island, Georgia, via the Cypress Pipeline. Florida Power & Light (FPL) is building a third major pipeline, Sabal Trail. This pipeline will increase natural gas supplies throughout the State. The pipeline is schedule to be in-service in May 2017. Nuclear energy capacity in Florida is stable and there are no planned increases during the 2016 ten-year planning period. There are four operating nuclear power reactors in the state, all of which are owned by FPL. Nuclear energy is capital intensive in nature and requires a significant amount of lead time to construct. Florida’s humid and warm climate leads to an increased demand for energy in order to address the state’s cooling needs. In terms of electricity usage, Florida’s residential sector consumes the majority of energy generated, as compared with the commercial and industrial sectors. In 2015, Florida consumed 220,984 gigawatt hours (GWh) of electricity. As shown in Figure 2, the FPSC stated in its Review of the 2016 Ten-Year Site Plans of Florida’s Electric Utilities that Florida has 8,659,510 residential electric customers using 53.2 percent of all electricity consumed in the state, with the remaining 46.8 percent of electricity being consumed by commercial and industrial users.
Coal13.5%
Natural Gas30.3%
Motor Gasoline excl. Ethanol
22.9%
Distillate Fuel Oil7.0%
Jet Fuel4.5%LPG
0.4%
Residual Fuel1.5%
Other Petroleum
1.3%
Nuclear Electric Power7.1%
Hydroelectric Power0.0%
Biomass6.1%
Other Renewables1.5% Net Interstate Flow
of Electricity4.0%
Figure 1: Florida Energy Consumption Estimates 2014Source: EIA
Coal
Natural Gas
Motor Gasoline excl. Ethanol
Distillate Fuel Oil
Jet Fuel
LPG
Residual Fuel
Other Petroleum
Nuclear Electric Power
Hydroelectric Power
Biomass

2016 Annual Report Page 4
As the third most populous state, transportation fuel consumption is high relative to the rest of the nation. According to the EIA, Florida is ranked third in the nation in terms of transportation fuel consumption, using 1,480.3 trillion BTUs; this accounts for approximately 5.5 percent of the total United States’ share of transportation fuel. Florida has no oil refineries to serve the state’s transportation sector and relies on petroleum products delivered by tanker and barge to ports in Tampa, Miami and Jacksonville. Due in part to Florida’s tourism industry, demand for petroleum-based transportation fuels (motor gasoline and jet fuel) is among the highest in the United States. Figure 3 illustrates that the transportation sector accounts for the majority of energy consumed in the state. The amount of energy consumed in the residential and commercial increased from 2013 to 2014, while the amount of energy consumed in the industrial and transportation sector decreased.
117,615, 53%86,027, 39%
17,342, 8%
Figure 2: Energy Usage in 2015 (GWh) Source: FPSC 2016 Ten-Year Site Plan Review
Residential
Commercial
Industrial
1,199.2, 29%
974.1, 24%468.0, 11%
1,480.3, 36%
Figure 3: Florida 2014 Energy Consumption by End-Use Sector (Trillion Btu)
Source: US EIA
Residential
Commercial
Industrial
Transportation

2016 Annual Report Page 5
2.2 Florida Sources of Energy in the Power Sector Florida’s power sector utilizes various fuel sources to address the state’s electrical needs. Figure 4 shows the mix of fuel sources Florida uses to generate electricity, including a projection to 2024. Figure 4 also shows Florida’s electric generation in 2003, which highlights a time period when Florida’s electric utilities had a more balanced fuel mix. Natural gas is the dominant fuel source for electricity as of 2015, currently comprising 62.9 percent of Florida’s electric generation and is projected to decrease to 62.6 percent by 2025. The small decrease is due to the long lead times to build coal and nuclear facilities, continuing the reliance on natural gas.
* Includes both utility and non-utility generation
** Includes both residual and distillate oil In the past, Florida’s utilities maintained a more diversified electric generation fuel source mix. By building plants that utilize different fuel sources, it provides a stability mechanism if one fuel source becomes unavailable or too costly. For example, in 2009, Florida’s coal and nuclear plants provided stability from the highly volatile natural gas prices. Over time, Florida’s utility industry has moved away from this balanced approach. This change is based on a number of factors, including:
Cleaner and less expensive natural gas generation facilities; The high cost, lengthy permitting and construction time of nuclear power facilities; and The high environmental and regulatory cost of coal generation.
2003Actual
2011Actual
2014Actual
2015Actual
2025Projected
Natural Gas* 26.5% 57.7% 58.5% 62.9% 62.6%
Coal 28.5% 23.6% 21.2% 18.8% 19.6%
Nuclear 14.2% 9.6% 12.3% 11.2% 11.4%
Oil** 13.3% 0.5% 0.2% 0.2% 0.0%
Interchange, Renewable, NUG, Other 17.6% 8.6% 7.8% 7.5% 6.3%
0.0%10.0%20.0%30.0%40.0%50.0%60.0%70.0%80.0%90.0%
100.0%
Ene
rgy
Gen
erat
ion
by
Fu
el T
ype
(% N
EL
)
Figure 4: Florida Electric Generation Fuel Source MixSource: FPSC Ten Year Site Plan Review 2011, 2012, 2014,2015, & 2016

2016 Annual Report Page 6
Future Electric Generation Capacity, Facilities, and Retirements Florida’s electric utilities plan for future generating capacity in order to meet the growing demand for energy from their constantly increasing customer base. The electric utilities also plan on generation facility retirements or phase outs, and these plans are done on a ten-year rolling basis. Between 2016 and 2022, Florida’s utilities plan to retire 4,610 MW of generation capacity. The current installed capacity and the 2025 projected capacity are highlighted in Figure 5. Figure 5: Florida Current and Projected Installed Capacity by Fuel and Technology (MW)
Source: FPSC 2016 Ten-Year Site Plan Review, page 43, Figure 18
Electric Rates The utility rates for residential customers in Florida vary. Rates are based on many factors, including: the number of customers a utility serves, whether utilities generate their own electricity (or purchase it from another utility) and what type of fuel source provides the electricity, such as natural gas, nuclear or coal. The following is a brief synopsis of the FPSC’s Comparative Rate Statistics as of December 31, 2015.

2016 Annual Report Page 7
Table 1: Residential Utility Rate Comparison High/Low per 1,000 kWh Investor-Owned Electric Utilities Average Bill
$118.49 High $137.57Low $94.30
Municipal Electric Utilities Average Bill $112.66
High $92.99Low $138.40
Cooperative Electric Utilities Average Bill $124.45
High $146.00Low $103.84
Source: FPSC December 2015 Comparative Rate Statistics
Table 2: Commercial/Industrial Utility Rate Comparison High/Low per 150,000 kWh Investor-Owned Electric Utilities Average Bill
$14,842.20 High $17,455Low $13,175
Municipal Electric Utilities Average Bill $16,342.65
High $22,050Low $11,710
Cooperative Electric Utilities Average Bill $15,615.88
High $18,700Low $11,724
Source: FPSC December 2015 Comparative Rate Statistics
In September 2016, the average of all of Florida’s electric rates was 10.26 cents per kilowatt hour (kWh) of electricity, which was slightly lower than the national average of 10.69 cents per kWh (EIA). Florida’s residential and commercial rates are lower than the national average; however, Florida’s industrial electricity average rate of 8.03 cents is higher than the national average of 7.15 cents. Natural Gas Usage Natural gas has grown from being one of many sources of energy used in Florida, to being the dominant fuel source for electric generation. The price of natural gas has dropped significantly, primarily due to increases in technological innovation. Figure 6 shows how natural gas compares to all energy sources used in Florida’s energy consumption and contains projections to 2025.
2016 Annual Report Page 8
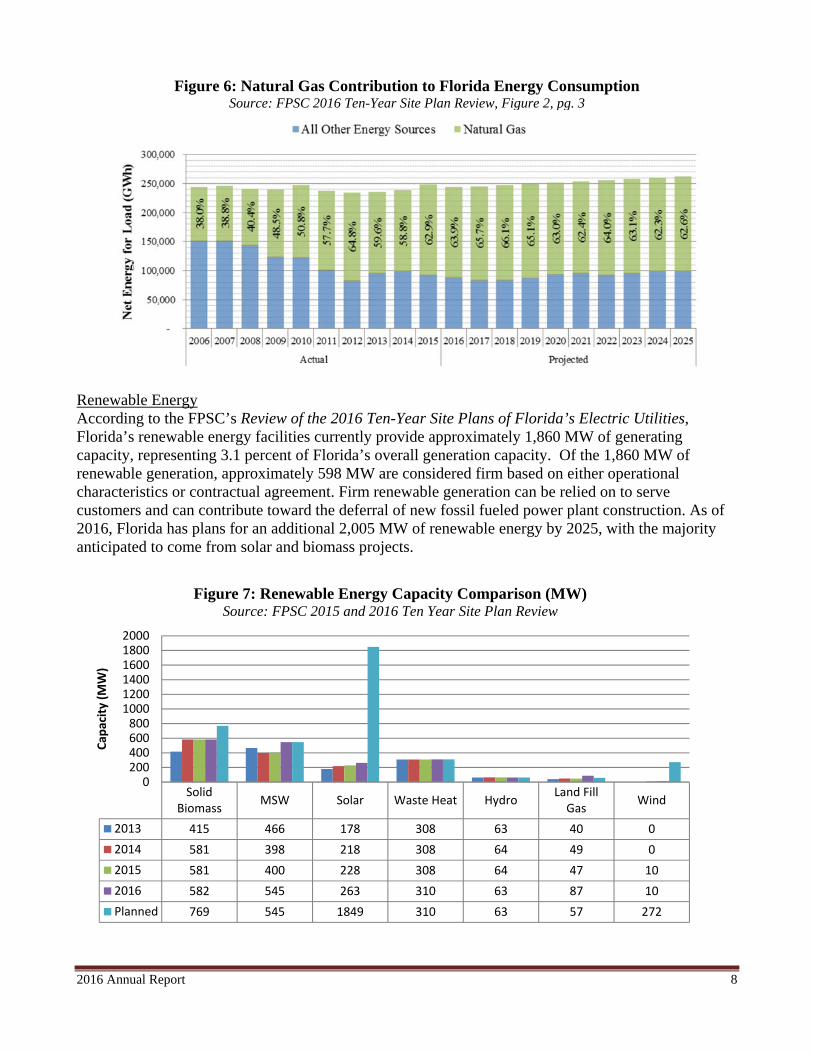
Figure 6: Natural Gas Contribution to Florida Energy Consumption Source: FPSC 2016 Ten-Year Site Plan Review, Figure 2, pg. 3
Renewable Energy According to the FPSC’s Review of the 2016 Ten-Year Site Plans of Florida’s Electric Utilities, Florida’s renewable energy facilities currently provide approximately 1,860 MW of generating capacity, representing 3.1 percent of Florida’s overall generation capacity. Of the 1,860 MW of renewable generation, approximately 598 MW are considered firm based on either operational characteristics or contractual agreement. Firm renewable generation can be relied on to serve customers and can contribute toward the deferral of new fossil fueled power plant construction. As of 2016, Florida has plans for an additional 2,005 MW of renewable energy by 2025, with the majority anticipated to come from solar and biomass projects.
SolidBiomass
MSW Solar Waste Heat HydroLand FillGas
Wind
2013 415 466 178 308 63 40 0
2014 581 398 218 308 64 49 0
2015 581 400 228 308 64 47 10
2016 582 545 263 310 63 87 10
Planned 769 545 1849 310 63 57 272
0200400600800100012001400160018002000
Cap
acity (M
W)
Figure 7: Renewable Energy Capacity Comparison (MW)Source: FPSC 2015 and 2016 Ten Year Site Plan Review

2016 Annual Report Page 9
As shown in Figure 7, solid biomass is the largest source of renewable energy in Florida as of 2016. Due to Florida’s year-round growing season, Florida has more biomass resources than any other state, according to the Florida Energy Systems Consortium. Energy production from biomass processing also has the potential to be a significant economic driver, especially in rural locations. However, in most cases, the bio-energy facility must be located near the intended feedstock to make the process economically viable. Florida’s second largest source of renewable energy currently comes from municipal solid waste (MSW). MSW uses residential waste as a feedstock and burns the waste to create steam which turns the electricity producing turbine. As of 2016, MSW accounts for 545 MW of electrical capacity in Florida and is expected to remain constant until 2025. MSW facilities are equipped with advanced scrubbers to remove pollutants and reduce emissions. MSW is attractive to major population centers because it diverts waste from entering the existing overburdened landfills while providing the benefit of a renewable energy source. Currently, Florida’s solar capacity is 263 MW, which includes approximately 108 MW of customer owned renewable capacity from nearly 11,650 systems. The total installed capacity within the state is expected to grow significantly over the next ten years with the total planned solar installation expected to add an additional 1,586 MW to the current 263 MW capacity. The vast majority of the planned solar is expected to be utility installations totaling 1,102 MW. Waste heat currently provides 310 MW of renewable generation capacity, and is expected to remain constant through 2025. Large industries, such as orange juice processors, can create waste heat while manufacturing their products. To capture and utilize that waste heat, they must redirect the waste heat or steam from their manufacturing process into a turbine to produce electricity. 2.3 Transportation Energy Florida’s large population, evolving demographics and projected growth require the state to develop and maintain a reliable and conveniently accessible transportation system. Florida’s tourism industry is one of the largest contributors to the state’s economy, and a progressive and diversified transportation system is vital to the tourist industry. Florida’s Transportation Infrastructure Florida is unique compared to other states in that it consists of a 447-mile-long peninsula extending from the Georgia border south to the Florida Keys; a northern panhandle that stretches over 361 miles from the Atlantic to Alabama; and nearly 1,200 miles of shoreline, totaling 54,157 square land miles. Within Florida is a strategic system of public roads and highways maintained by Florida’s Department of Transportation (FDOT) and the United States Department of Transportation (US DOT). According to the US DOT’s Bureau of Transportation Statistics, Florida has 122,088 miles of public roads; 1,495 miles of interstate; 2,900 miles of railroad tracks used for freight transport; 12,012 road bridges; 1,540 miles of inland waterways and 139 public use airports. Petroleum Use Florida’s transportation sector accounts for more than one-third of the total energy used in the state, with nearly all transportation fuel being imported. According to the United States Department of Energy (US DOE) Office of Energy Efficiency and Renewable Energy (EERE), Florida’s per capita energy consumption of motor gasoline was 9.83 barrels (413 gallons) in 2014, while the nationwide
2016 Annual Report Page 10
consumption during the same time was 10.04 barrels (422 gallons). The EIA’s State Energy Data System (SEDS) reports that Florida consumed more than 199.5 million barrels (8,379 million gallons) of motor fuel and more than 18.7 million barrels (785 million gallons) of ethanol in 2014. In the most recent data reported in 2014 by the US EIA, Florida has a total of 6,112 motor gasoline stations, accounting for 5.4 percent of the total US share. While Florida does not have any in-state refineries to process crude oil, the Florida Department of Environmental Protection, Bureau of Mining and Minerals Regulation, states that Florida produced 2,208,000 barrels of crude oil in 2015, with the majority of it coming from Jay Field in Escambia County. Florida’s Alternative Transportation Use A number of Florida’s private commercial fleet owners, as well as local governments and school boards, have begun the process of converting their fleets to natural gas in order to realize cost savings. There is a growing interest in using propane, compressed natural gas (CNG) and liquefied natural gas (LNG) for large vehicles and commercial operators. According to the US DOE Alternative Fuels Data Center, the state of Florida has 1,267 total public and private alternative fuel stations, of which 55 are CNG stations and 152 are propane stations. Electric vehicles (EV) are also an alternative transportation energy source, especially as technological advancements increase and range anxiety is reduced. Consumers, as well as private businesses and local governments, have been investing in electric vehicles and the infrastructure to support the charging of these vehicles. According to the US DOE Alternative Fuels Data Center, there are a total of 969 public and private charging stations with a total of 2,138 charging outlets installed throughout the state. This amount of installed stations is a 33 percent increase from 2015. Florida also has four US DOE designated Clean Cities Coalitions’ (CCCs): Southeast Florida, Central Florida, Tampa Bay and North Florida. The CCCs are responsible for promoting clean energy and alternative fuels for transportation throughout the state. They are tasked with working with vehicle fleets, fuel providers, community leaders and other stakeholders to reduce Florida’s dependence on petroleum use. The Electric Vehicle Transportation Center (EVTC) at the Florida Solar Energy Center is a five-year project funded through the US DOT University Transportation Centers Program. The EVTC supports the US DOT’s strategic goal of planning for near-term integration of alternative fuel vehicles as a means to build a sustainable transportation system. To date, the EVCT has held two Electric Vehicle Transportation & Technology Summits, completed a life-cycle assessment of workplace charging and authored 20 publications. The program ends September 2018. 2.4 New Trends The US Environmental Protection Agency (US EPA) transitioned under a new administration.

2016 Annual Report Page 11
3. 2016 FDACS Office of Energy Accomplishments The FDACS OOE manages various successful programs which help build the foundation for both current and future programs. Past programs help provide context for current programs in the FDACS OOE’s portfolio. The Energy Education Kits program is an example of this process as the origin of the Energy Education Kits program can be traced back to the SunSmart Schools Emergency Shelters program. The SunSmart Schools Emergency Shelter program began in 2009 and installed over one megawatt of solar power across Florida. The primary goal was to outfit 90 schools that double as emergency shelters with 10kW photovoltaic (PV) arrays with battery back-up. These systems provide power to critical loads during emergencies, while offsetting electricity costs during normal operation. With funds from investor-owned utilities, the program expanded to 106 PV systems at schools in 46 of Florida's 67 counties. Educational goals of the program included expanding solar curriculum into schools, using the PV systems as educational tools and providing professional development to teachers and school facility managers. A student-friendly website was created that provides energy lessons and is linked to PV data. Over 450 teachers and facility managers participated in professional development. The project cost $9.84 million and leveraged an additional $908,000 from utilities to complete the installations and provide teacher workshops and solar education kits. The total capacity installed was 1.0685 MW which produces an estimated average of 12.8218 MWh annually. The project resulted in K-12 energy education for students, energy savings for schools, statewide solar energy data collection, workforce, facility manager and teacher curriculum trainings, and collaboration between utilities, schools and universities that continued after the program ended. One of the educational components of the SunSmart School E-Shelters program was to provide energy education kits to each school. Due to the success of the SunSmart Schools E-Shelters kits, the FDACS OOE purchased 244 kits that were provided to schools through a separate program. 3.1 Energy Efficiency 3.1.1 Agricultural 3.1.1.1 Farm Energy and Water Efficiency Realization (FEWER) In 2015, FDACS OOE contracted with the Suwanee County Conservation District to conduct 190 on-site energy and water audits at farms and rural businesses under the FEWER Programs. The programs will promote water and energy efficiency while reducing the environmental impact of Florida agriculture, such as improving water quality in agricultural discharges while reflecting a balance between water quality improvements and agricultural productivity. Reduction of energy usage will result in not only monetary savings for producers, but significant environmental benefits, such as the reduction in water and electricity consumption.
2016 Annual Report Page 12
The purpose of this program is to:
1. To conduct on-site evaluations for energy efficiency and water saving measures and practices on individual farms.
2. To assist producers with the implementation of selected measures.
After participating in an evaluation, producers are eligible for grants to implement the recommendations. Equipment eligible for incentives may include, but are not limited to:
Energy efficient lighting; Energy efficient HVAC upgrades; Motors and motor controls; Poultry house insulation; Dairy milk harvesting equipment; Irrigation pump replacement; Variable speed drives; Sprinklers, nozzles and regulators; and Fuel switching.
To date, FDACS OOE received 228 audit applications, and 167 audits have been completed. Of the 228 applications received:
91 were from poultry operations; 79 were field crop operations; 34 were dairy operations; 6 were businesses; 8 were greenhouse or nursery operations; 8 were cattle operations; and 2 were aquaculture operations.
The audits provided producers/businesses with recommendations and the associated energy savings, water savings, environmental benefits and simple payback periods so they can easily prioritize upgrades. In addition, this program provided 75 percent cost share up to $25,000 per producer, to area farmers/businesses that participated in the audit and chose to implement some of the recommendations. Payments do not exceed the percentages or maximum amount per producer. Producers are responsible for any remaining costs of energy efficiency measures implementation. Producers have invested approximately $597,000 to date, and the grant has provided $1,492,363.
In one example, a poultry farm, following their audit, implemented all the recommended lightening, air heating and building environment equipment. The installations will result in an annual saving of 32 percent ($11,471) of their annual energy cost of $36,238. The poultry farm invested $7,218.55 and the grant provided $21,766.65 for a total cost of $28,874.20. 3.1.1.2 Rural Business Enterprise Grant (RBEG) The FDACS OOE added an additional $162,145 from the US Department of Agriculture RBEG program to FEWER program. The grant provided audits to approximately 100 businesses which

2016 Annual Report Page 13
employed 50 or fewer people in rural areas of Florida. Eligible entities included agricultural businesses, grocery stores and other businesses in rural areas. Eligible activities included:
Upgrades to HVAC systems; Insulation; Lighting controls; and Energy efficiency upgrades.
3.1.1.3 Florida Renewable Efficiency Demonstration (FRED) The FDACS OOE received a $1 million Conservation Innovation Grant from the United States Department of Agriculture Natural Resources Conservation Service (USDA-NRCS). Matched by $2 million from the Farm to Fuel program, these funds were used to establish the Farm Renewable and Efficiency Demonstrations (FRED) program, an innovative program to promote the adoption of technologies and practices that increase energy efficiency and renewable energy use in Florida agriculture. Examples of eligible projects for reimbursement included:
Energy efficient lighting and water pumps; Fuel efficient tractors and generators; and Small scale renewable energy generation, such as solar or biomass.
Funding for the grant portion of the program will be made available to participants upon completion of the evaluation. Applications for participation are reviewed and approved based on a first-come, first-served basis. After receiving the evaluation report, producers will be eligible to immediately apply for 80 percent of the project cost up to $25,000 to implement recommended energy and water efficiency and renewable energy upgrades. Mobile Energy Labs (MELs) will conduct energy use evaluations on farms and make recommendations for specific energy efficiency and renewable energy improvements to reduce energy costs. The FDACS OOE has contracted with the University of Florida’s Industrial Assessment Center, the University of Central Florida’s Florida Solar Energy Center and the Florida Agriculture and Mechanical University to operate the MELs. The FDACS OOE released a Notice of Funding Availability on September 19, 2016. To date, three applications have been received. Applications are currently being accepted until September 1, 2017, and are available at FreshFromFlorida.com/Business-Services/Energy/Incentives-for-Farmers. 3.1.2 Multifamily 3.1.2.1 Multifamily Energy Efficiency Retrofit Demonstration Projects
In 2015, FDACS OOE collaborated with Pinellas County Housing Authority (PCHA) and West Palm Beach Housing Authority (WPBHA) on the Multifamily Energy Efficiency Retrofit Demonstration Project to document the benefits of upgrading to energy efficient technologies in low-income multifamily buildings. PCHA’s Crystal Lakes Manor in Pinellas Park and WPBHA’s Robinson Village in West Palm Beach, both received $500,000 for energy efficient retrofits. A total of 236 units were retrofitted at Crystal Lakes Manor, and an additional 84 units were retrofitted at Robinson Village. In all, 320 units were revitalized. Upgrades included R-38 ceiling insulation, air duct insulation, 18 SEER air conditioning units, energy efficient lighting and energy efficient hot water heaters.

2016 Annual Report Page 14
Work was completed in August 2015, and the housing authorities submitted two years of energy consumption data from those properties in September 2016, covering the twelve months prior to and following the retrofit installations. The preliminary analysis shows an energy usage decrease in units where older equipment and insulation were replaced with high performance energy saving products. In West Palm Beach, analysis shows a 28.9 percent usage decrease of average daily kilowatt hours (kWh) across the post-retrofit year compared to the pre-retrofit year. In Pinellas County, analysis shows a 7.3 percent usage decrease of average daily kWh for that same period.
These findings indicate tangible energy savings can be found in Florida’s aging multifamily sector through targeted efficiency upgrades. FDACS OOE is analyzing the data further to determine the larger impact of these retrofits. 3.1.2.2 Multifamily Energy Efficiency Retrofits Program (MERP) The FDACS OOE continued its collaboration with the Florida Housing Finance Corporation (FHFC) on the Multifamily Energy Retrofit Program (MERP) revolving loan fund. This program provides capital funds to award grant/loan combinations for business owners of older, affordable eligible multifamily rental properties. Loans provide funds necessary to replace outdated and under-performing equipment, including, but not limited to; lighting, ceiling fans, appliances, insulation, air conditioning units, hot water heaters, washing machines, toilets and showerheads. Energy consumption data both before and after retrofits will demonstrate the effectiveness of the retrofits on an ongoing basis over several years. Currently, five properties are scheduled to perform retrofits under MERP: McPine Apartments in DeSoto County; Kinneret in Orange County; Wildwood in Sumter County; Middletowne Apartments in Clay County; and New Hope Community in Martin County (these last two are non-profits). To facilitate program requirements, FHFC contracted with EMG Corporation (Clampett Industries, LLC d/b/a EMG) to conduct energy audits of the properties, and the University of Florida Program for Resource Efficient Communities (UF PREC) to provide long-term data consumption analysis. As part of the application process, EMG Corporation conducted energy audits to develop Critical Repair Needs Analysis (CRNA) for each property. FHFC then used that analysis to developed a unique scope of work for each location. All five applicants have accepted invitations to credit underwriting, and an anticipated $4.8 million will be loaned to the applicants in 2017. These retrofits are expected to improve both property values and quality of life for residents. Installed energy and water efficiencies are expected to lower monthly utility costs, while at the same time, decreasing grid demand and water usage. UF PREC has collected the initial twelve-month baseline utility consumption data on all approved properties, including kilowatt hours used and monthly billing amounts. UF PREC will continue to collect, analyze and report on consumption data to provide a quantitative return-on-investment and benchmarking analysis.

2016 Annual Report Page 15
3.2 Transportation 3.2.1 Natural Gas Fuel Fleet Vehicle Rebate Program Chapter 377.810, Florida Statutes, authorized the creation of the Natural Gas Fuel Fleet Vehicle Rebate Program. The FDACS OOE is responsible for administering the program. The program is appropriated $6 million annually for five years for the purpose of incentivizing fleets to purchase, lease or convert to natural gas fueled vehicles. The program goals, as defined in statute, are to help reduce transportation costs and encourage freight mobility investments that contribute to the economic growth of the state. The program accomplishes these goals by providing rebates of up to $25,000 per vehicle and $250,000 per applicant per fiscal year for up to 50 percent of the costs associated with the conversion, purchase or lease of natural gas fleet vehicles registered in the state of Florida. Applications are awarded on a first-come, first-served basis until all program funds are expended. Forty percent of available funding is reserved for public sector fleets, with the remaining 60 percent available for private sector fleets. Applications are reviewed by the FDACS OOE for completeness, and deemed incomplete if they do not meet all requirements of Rule 5O-4.001, Florida Administrative Code. During the 2015-2016 year of the program, the FDACS OOE received 935 applications. Of these, 598 applications were approved for a total disbursement of $5.8 million; the remaining 337 applications were deemed incomplete. This represents an increase both in total number of applications and total funding disbursed over the 2014-2015 program year. The annual assessment of the program found that rebate recipients will realize $16.7 million in annual fuel savings. The assessment also estimated that a total of 632 jobs paying an average of $56,044 per year were created or retained as a result of the program. Additionally, the program’s contribution to Florida’s Gross Domestic Product was estimated at $158.3 million. As of December 31, 2016, of 2016-2017 fiscal year, the Natural Gas Fuel Fleet Vehicle Rebate Program has disbursed $4.1 million. In 2016, the Florida Legislature amended the governing statute to allow applicants that received the program maximum of $250,000 the opportunity to apply for additional rebates for vehicles that have not already received a rebate under the program. [Public sector applicants have preference over private sector applicants when applying for additional rebates.] The FDACS OOE is currently in the rulemaking process to incorporate these changes to the governing rule. 3.2.2 Drive Electric Orlando Using a $400,000 award from the U.S. DOE Clean Cities program, the FDACS OOE is working with the Electrification Coalition and the Central Florida Clean Cities Coalition to promote the Drive Electric Orlando project. Drive Electric Orlando offers consumers an option to rent an electric vehicle in Orlando in order to increase consumer awareness of the benefits and capabilities of electric vehicles.

2016 Annual Report Page 16
Drive Electric Orlando has brought together Orlando rental car agencies, hotels, restaurants and theme parks to offer consumers who participate in the program various incentives, including VIP treatment at Epcot’s Test Track ride, free valet parking, preferred parking spots, ample charging stations and a free three-month membership to CLEARLane Access, which allows travelers to skip the identification check point at the airport and head straight to the physical screening. Since October 2015, when the program launched, there have been 966 electric vehicle rentals with over 327,000 miles driven. Drive Electric Orlando has also trained over 250 rental car company employees to help ensure renters have a seamless and superior rental experience. 3.2.3 Initiative for Resiliency in Energy through Vehicles (iREV) iREV is a multi-partner, national effort to encourage states, local governments and their partners to incorporate alternative fuel vehicles and fueling infrastructure into their emergency management planning and operations. Incorporating vehicles powered by alternative fuels – such as biodiesel, natural gas, propane or electricity – into a fleet requires coordinated planning and consideration of potential costs, benefits, constraints and interdependencies involved with diversifying a fleet. The National Association of State Energy Officials (NASEO) is the lead organization on this national effort. The FDACS OOE participates on the iREV Steering Committee, collaborating on outreach materials, strategies and technical assistance resources. As part of the outreach to the emergency management community, NASEO and the iREV Steering Committee organized and facilitated regional workshops in late 2016 to share findings and technological resources. The FDACS OOE participated in the Southeast Regional Workshop in October 2016, held in conjunction with the annual meeting of the International Association of Emergency Managers. Future work on iREV will provide more planning resources and demonstrate methods to incorporate alternative fuel vehicles and related infrastructure into a community’s emergency management plans and fleet operations. 3.2.4 Biofuels Infrastructure Partnership (BIP) In September 2015, the FDACS OOE was awarded $15.9 million from the U.S. Department of Agriculture (USDA) Commodity Credit Corporation to increase the availability of infrastructure capable of dispensing higher blends of biofuels. Eligible infrastructure under the BIP program includes installation of blender pumps, which are capable of dispensing biofuel blends in a range from 15 percent to 85 percent (E15 to E85); dedicated E85 pumps, which dispense biofuel blends of 85 percent (E85); and underground storage tanks designed to accommodate the biofuel necessary for the higher blends. Proposed retrofits and station locations are submitted to USDA for environmental review and approval prior to work being authorized.

2016 Annual Report Page 17
Retrofits under this program began in May 2016. From May through December 2016, there have been 135 blender pumps and two dedicated E85 pumps installed at a total of 29 fuel station locations in Florida. The USDA extended the program to December 31, 2017. Post-installation data collection and reporting will continue for approximately five years after retrofit work is completed. 3.3 Education 3.3.1 Energy Clearinghouse of Information The Florida Energy Clearinghouse is a consumer-friendly portal to compare energy-saving technologies and educate about energy usage, energy production, renewable energy technologies and research being conducted in Florida. The FDACS OOE continues to host, update and expand the Florida Energy Clearinghouse in accordance with Section 570.0741, Florida Statutes. This year, the “My Florida Home Energy” tool was updated to enhance usability. By answering a few simple questions, Floridians can use this tool to learn how they can conserve energy and save money. The tool takes users on an interactive home tour and offers tips on how to improve its energy efficiency. In addition to the tips, the tool provides a customized plan which identifies energy efficient technologies and services along with the potential energy and monetary savings. The plan also includes all available financial incentives in the area. 3.2.2 Energy Education Kits for Public Schools The FDACS OOE provided Florida K-12 public schools with 244 energy education kits designed to develop teamwork, problem-solving abilities and to investigate environmental issues. The Energy Curricula and Learning kits are designed to complement the Solar Matters (Grades K-2, 3-5, and 6-8) and Understanding Solar Energy (9-12) activity units developed by the Florida Solar Energy Center. Each kit targets a specific grade range and includes enough materials for students to work in lab groups conducting energy related experiments and activities. Kits contain a variety of materials, including: pre-wired encapsulated mini-photovoltaic panels, motors, propellers, milliamp meters, multi-testers, color filters, magnifying glasses, protractors, thermometers, UV detecting beads, videos, energy ball and various printed resources. The curricula units are aligned with the current science standards which focus on science, technology, engineering and math. An estimated 79,400 children around the state will be impacted by these kits. The FDACS OOE uses one kit during educational events which are hosted at the Holland Building in Tallahassee, Fla. In 2016, FDACS hosted over 500 students from regional schools and clubs, where students had an opportunity to learn about three different topics. The Division of Food, Nutrition, and Wellness provides hands-on activities in the learning garden to teach students about healthy eating and gardening; the Division of Aquaculture provides live aquaculture displays to engage kids in learning about aquaculture in Florida; and the FDACS OOE uses the energy education kit to provide hands on activities for the kids to learn about solar, wind, and hydrogen power.

2016 Annual Report Page 18
3.3.2.1 EnergyWhiz Olympics The Statewide EnergyWhiz event is held every year and hosts approximately 1,000 students. The event is held at the Florida Solar Energy Center (FSEC) in Cocoa, and features five separate events.
1. Critter Comfort Cottage (Grades 4-12): Student’s design, construct and market energy-efficient, eco-friendly pet homes for any critter of their choosing.
2. Solar Energy Cook-off (Grades 4-12): Combines engineering, construction and culinary arts. Students design, build and then use their cooker to produce an original dish. 2016 was the first year to include a “Fresh From Florida” category to promote fresh Florida produce.
3. EVTC Electrathon (High School and above): Participants demonstrate real-world electric vehicle technology through custom designed and built electric go-carts.
4. Junior Solar Sprint (Grades 4-8): Each team produces a model-sized solar-powered car that is judged on technology, craftsmanship, innovation and performance.
5. Energy Innovations (Grades 6-12): Student teams design, engineer and market full-scale solar-powered devices that have real world applicability.
The FDACS OOE and FSEC worked together to create regional events. There are now five regional events in the following cities: Gainesville, Tallahassee, Orlando, Tampa and Parrish. The next statewide event will be May 13, 2017, in Cocoa.
3.4 Propane Price Survey 3.4.1 State Heating Oil and Propane Program (SHOPP) Under a federal cooperative agreement from the EIA, the FDACS OOE collects residential propane price information from a sample of individual propane retailers provided by EIA for the survey. Data for the State Heating Oil and Propane Program (SHOPP) is collected weekly during the winter heating season (October through March) by the state energy office in each state participating in the program. EIA aggregates the price for each state and publishes the aggregated prices to EIA’s website. As anti-collusion laws prohibit propane companies from sharing price data, this is the only publicly available mechanism for consumers and analysts to find information on residential propane prices. The identities of survey respondents and company level pricing data are confidential on both the state and federal levels. Florida began participating in the SHOPP survey in 2014-2015, when EIA expanded the program beyond the Northeast and Midwest areas of the country. The previous winter of 2013-2014 brought severe cold temperatures to other parts of the country and led to a propane shortage and price increases that affected residential customers even in warmer regions such as Florida. The current SHOPP award is a five-year cooperative agreement, beginning with the winter heating season of 2016-2017 and continuing through the winter heating season of 2020-2021.

2016 Annual Report Page 19
4. Florida Energy Systems Consortium The Florida Energy Systems Consortium (FESC) was created in 2008 and is unique in the United States; no other state has a statewide energy consortium involving all of its public universities. The concept combines all of the state’s university resources into one statewide center to advance energy research, technology transfer/commercialization, energy education and outreach. FESC used $38 million of state funding, from 2008, to leverage $425 million in energy research funding from third parties. Additionally, FESC was successful in developing 22 (still existing) start-up companies, 459 inventions, 101 technology licenses to industry and was involved with over 270 companies, 200 faculty and 130 research centers all working on energy related projects. As the original FESC funding has been exhausted, FDACS OOE has been working closely with FESC to identify funding opportunities by exploring options to collaborate on future competitive funding opportunities.
5. Florida Building Commission In accordance with Section 553.74, Florida Statutes, FDACS OOE joined the Florida Building Commission (FBC) in May 2016 by appointment from Governor Scott. The FBC is responsible for determining the most cost-effective energy-savings equipment and techniques available to the consumer, and when updating the Florida Building Code. The FBC updates the Florida Building Code, including the Energy Efficiency Code for Building Construction. This provides energy efficient construction and design guidelines for Florida’s commercial and residential infrastructure. It also approves course and training providers, conducts rule making workshops, develops declaratory statements, approves product applications and reviews accessibility waiver requests. As a member of the FBC, FDACS OOE is now able to contribute to discussions relevant to the state’s energy and energy efficiency building code development.
2016 Annual Report Page 20
6. On the Horizon In 2017, FDACS OOE will continue to work with the Governor and Legislature to advance policies and programs with the objective to secure a stable, reliable, and diverse supply of energy for Florida. FDACS OOE is currently developing programs to further the implementation of energy efficiency and development of renewable energy. These programs include: 6.1 Mapping the Energy Landscape of Water and Wastewater Treatment Facilities in Florida In December 2016, the FDACS OOE was awarded $75,000 from the US DOE State Energy Program competitive grant program for “Mapping the Energy Landscape of Water and Wastewater Treatment Facilities in Florida.” This grant is to map the energy landscape at water and wastewater treatment facilities in Florida to establish a baseline on energy efficiency and renewable energy measures at these types of facilities. 6.2 Florida Alliance for Accelerating Solar and Storage Technology Readiness (FAASSTeR) The FDACS OOE is working with Nhu Energy on a US DOE SunShot funded Initiative entitled Florida Alliance for Accelerating Solar and Storage Technology Readiness (FAASSTeR). The goals of this project are to enable Florida Municipal Electric Association member utilities to increase solar energy to over 10 percent of power capacity by 2024 and to enable informed policy and regulation in the state that maximizes consumer benefit from substantial growth in solar and storage technologies. 6.3 Clean Energy for Low Income Communities Accelerator (CELICA) The US DOE invited the FDACS OOE to participate in their Better Buildings Initiative’s Clean Energy for Low Income Communities Accelerator (CELICA). According to the US DOE, low income households spend an average of 15 to 20 percent of their income on energy bills. CELICA aims to identify strategies for funding and implementing programs that expand installation of energy efficiency and renewables, such as solar, that allow communities to decrease energy usage and costs. Over the next two years, FDACS OOE will join as one of forty-eight CELICA partners to address the issue of high cost, low efficiency utility usage in this sector. The FDACS OOE has met with several stakeholders statewide, including utility companies, local, state, and federal governments, as well as non-profits, whose focus is on low income communities. From these meetings, the FDACS OOE gained a clearer understanding of the market barriers and current building and energy efficiency trends facing low income these areas communities. The FDACS OOE will use information gleaned from stakeholders to consider strategies that aid communication between those in low income communities interested in making improvements to buildings, businesses who specialize in upgrading existing buildings and financial institutions. 6.4 2017 Florida Energy Summit The FDACS OOE plans to host another Florida Energy Summit in 2017. The date and location will be announced soon.
2016 Annual Report Page 21
Attachment A
Executive Summary of the Florida Public Service Commission’s Energy Efficiency and Conservation Act (FEECA) Report
The entire report as prepared by the Florida Public Service Commission, Annual Report on Activities Pursuant to the Florida Energy Efficiency and Conservation Act, can be found at: http://floridapsc.com/Files/PDF/Publications/Reports/Electricgas/AnnualReport/December%202016.pdf
Purpose Reducing the growth of Florida’s peak electric demand and energy consumption became a statutory objective in 1980, with the enactment of the Florida Energy Efficiency and Conservation Act (FEECA). Codified in Sections 366.80 through 366.83 and Section 403.519, Florida Statutes (F.S.), FEECA emphasizes reducing the growth rates of weather-sensitive peak electricity demand, reducing and controlling the growth rates of electricity consumption, and conserving expensive resources, particularly petroleum. Section 366.82(2), F.S., requires the Florida Public Service Commission (FPSC or Commission) to set demand-side management (DSM) goals at least every five years for the seven electric utilities subject to FEECA. The Commission sets goals with respect to summer and winter electric peak demand and annual energy savings over a ten-year period, with a reevaluation review every five years. Once goals are established, the seven FEECA utilities must submit DSM plans containing cost-effective programs intended to meet the goals. The seven electric utilities currently subject to FEECA are:
Five Florida Investor-owned utilities (IOUs), ranked in order of sales o Florida Power & Light Company (FPL) o Duke Energy Florida, LLC (DEF) o Tampa Electric Company (TECO) o Gulf Power Company (Gulf) o Florida Public Utilities Company (FPUC)
Two municipal utilities, ranked in order of sales o JEA o Orlando Utilities Commission (OUC)
The Commission regulates the electric rates and energy conservation cost recovery of the five IOUs. In contrast, the Commission does not regulate the rates of the two municipal utilities for which it sets DSM goals. The Commission is required by Section 366.82(10), F.S., to provide an annual report to the Florida Legislature and the Governor summarizing the adopted goals and progress toward achieving these goals. Similarly, Section 377.703(2)(f), F.S., requires the Commission to file information on electricity and natural gas energy conservation programs with the Department of Agriculture and Consumer Services.
2016 Annual Report Page 22
This report reviews the 2015 annual goal results for each FEECA utility and fulfills these statutory obligations. Report Layout This report presents the FEECA utilities’ progress towards achieving the Commission-established goals and the Commission’s efforts in overseeing these conservation initiatives. This report details these efforts through the following four sections and appendix:
Section 1 provides a history of FEECA, highlights savings produced by utility programs since 2000, and provides a description of existing tools for increasing electricity and natural gas conservation throughout Florida.
Section 2 discusses 2015 goals and achievements of the FEECA utilities.
Section 3 provides an overview of Florida’s electricity market.
Section 4 discusses methods the Commission has used to educate consumers about conservation and provides a list of related web sites.
Appendix 1 provides a list of the conservation programs currently offered by the FEECA utilities.
Pursuant to Section 366.82(10), F.S., this report on conservation results achieved by the FEECA utilities is due to the Florida Legislature and Governor by March 1, 2017.
2015 Achievements The Commission has authority by statute to allow utilities to recover prudently incurred costs related to conservation.2 The Commission has implemented this authority through the Energy Conservation Cost Recovery (ECCR) clause. The ECCR clause has been in existence since 1980. Since 1980, it is estimated that DSM programs offered by the FEECA utilities have reduced summer peak demand by 7,732 megawatts (MW) and winter peak demand by 7,263 MW. In comparison, the FEECA utilities currently have 46,584 MW of summer electric generating capacity and 50,227 MW of winter generating capacity. The history of FEECA and the ECCR clause are discussed in Section 1 of this report. For 2015, Florida’s investor-owned electric utilities recovered approximately $382 million in conservation program expenditures. Florida’s FEECA electric utilities also performed over 232,000 residential and commercial audits and offered 108 residential and commercial programs focused on energy conservation. All seven FEECA utilities met the Commission’s total DSM goals. Two Florida IOUs, TECO and Gulf, and one municipal utility, OUC, also met the Commission’s energy and demand savings goals for the residential and commercial/industrial (C/I) customer classes. Three IOUs, FPL, DEF, and FPUC, and one municipal utility, JEA, did not meet every specific goal set by the Commission for the residential and C/I customer classes. Additional detail on each utility’s performance is described in Section 2. Goal Setting Process for the Current Period
2 Section 366.82(11), F.S.
2016 Annual Report Page 23
On November 25, 2014, the Commission approved winter and summer peak demand and annual energy savings goals for the seven FEECA utilities for 2015 through 2024. The Commission approved goals based on the Rate Impact Measure (RIM) test to ensure that all ratepayers benefit from energy efficiency programs that pass the RIM test and thereby create a downward pressure on electric rates. The 2014 approved DSM goals for the FEECA utilities were lower than the goals approved by the Commission in 2009. The Commission identified fewer cost-effective energy efficiency programs as a result of more stringent building codes and appliance efficiency standards. The higher the current efficiency standards and codes, the less opportunity there is for utility-sponsored programs to be cost-effective. Additionally, lower utility avoided costs resulting from lower natural gas prices have contributed to fewer programs being cost-effective. The 2014 goal setting process is discussed further in Section 2.4. Additionally, in November 2014, the Commission voted to allow the IOUs’ five-year solar pilot programs to expire on December 31, 2015. The Commission based its decision on evidence in the record that the existing solar pilot programs were not cost-effective. Finally in 2014, the Commission mandated in its 2014 Goals Order that a focus be placed on energy efficiency for low-income consumers. The Commission ordered “When the FEECA utilities file their DSM implementation plans, each plan should address how the utilities will assist and educate their low-income customers, specifically with respect to the measures with a two-year or less payback.”3 Further discussion of the utilities’ low-income programs can be found in Section 2.4 of this report. Following the Commission’s establishment of the goals in late 2014, the IOUs filed DSM plans to meet the Commission’s goals. In mid to late 2015, the Commission approved the IOUs’ DSM plans. Subsequently, in late 2015, the IOUs filed program standards with the Commission to support these plans. At the end of 2015, the Commission approved the program standards for each IOU. The IOUs implemented the new programs in late 2015 and early 2016. Conclusion The potential demand and energy savings from utility-sponsored DSM programs are affected by consumer education and behavior, building codes, and appliance efficiency standards. Consumer actions to implement energy efficiency measures outside of utility programs, as well as codes and efficiency standards, create a baseline for a new program’s cost-effectiveness and reduce the potential incremental electric demand and energy savings available from DSM programs. Utilities design DSM programs to encourage conservation that exceeds the level of conservation resulting from current building codes and minimum efficiency standards. The level of savings from these programs is uncertain because it depends on voluntary participation from customers. However, all customers pay for the utility conservation programs as a portion of their monthly utility bills. Therefore, customer education on, and participation in, utility DSM programs—along with individual efforts to save electricity—are key in reducing Florida’s electric demand and energy usage. Conservation and renewable energy will play an important role in Florida’s energy future. The Commission is continuing efforts to encourage cost-effective conservation, reduce the use of fossil fuels, and defer the need for new generating capacity. These initiatives support a balanced mix of resources that reliably and cost-effectively meet the needs of Florida’s ratepayers. 3 Order No. PSC-14-0696-FOF-EU, Docket Nos. 130199-EI through 130205-EI, In re: Commission review of numeric
conservation goals, issued December 16, 2014.