Embed Size (px)
Citation preview

BACKGROUND PAPER 97-7
NEVADA'S ClASS-SIZE REDUCTION
PROGRAM
Nevada Revised Statutes 388.700 -388.730 "PROGRAM TO REDUCE THE PUPIL-TEACHER RATIO"
H. PEPPER STURM, COMMITTEE POLICY ANALYST SENA TE HUMAN RESOURCES COMMITTEE NEVADA LEGISLATIVE COUNSEL BlJREAU
APRIL 1997
1.25

SELECTED DATA NEVADA CLASS-SIZE REDUCTION PROGRAM
Prepared by Pepper Sturm, Policy Analyst
Senate Committee on Human Resources
PROGRAM INFORMATION
Following a review of the topic by a 1988 interim legislative study, the 1989 Nevada Legislature enacted the Class-Size Reduction Act (CSRA). The measure was designed to reduce the pupil-teacher ratio in the public schools, particularly in the earliest grades and in classrooms where the core curriculum is taught.
The program was scheduled to proceed in several phases. The first step reduced the ratio in selected kindergartens and first grade for the 1990-1991 school year. The following phase was designed to improve second grade ratios, followed by third grade reductions and broadening kindergarten assistance. The 1991 Legislature made funds available for the 1991-1992 school year to reduce the ratios in first and second grades and selected kindergartens at the 16-to-l ratio. Due to budget shortfalls late in 1991 and continuing state fiscal needs, the third grade phase was delayed until the 1996-1997 fiscal year when partial funding was provided.
After achieving the target ratio of 15 pupils to one teacher in the primary grades, the program proposes the pupil-teacher ratio be reduced to 22 pupils per class in grades 4, 5, and 6, followed by a reduction to no more than 25 pupils per class in grades 7 to 12.
Pupil-Teacher Ratios
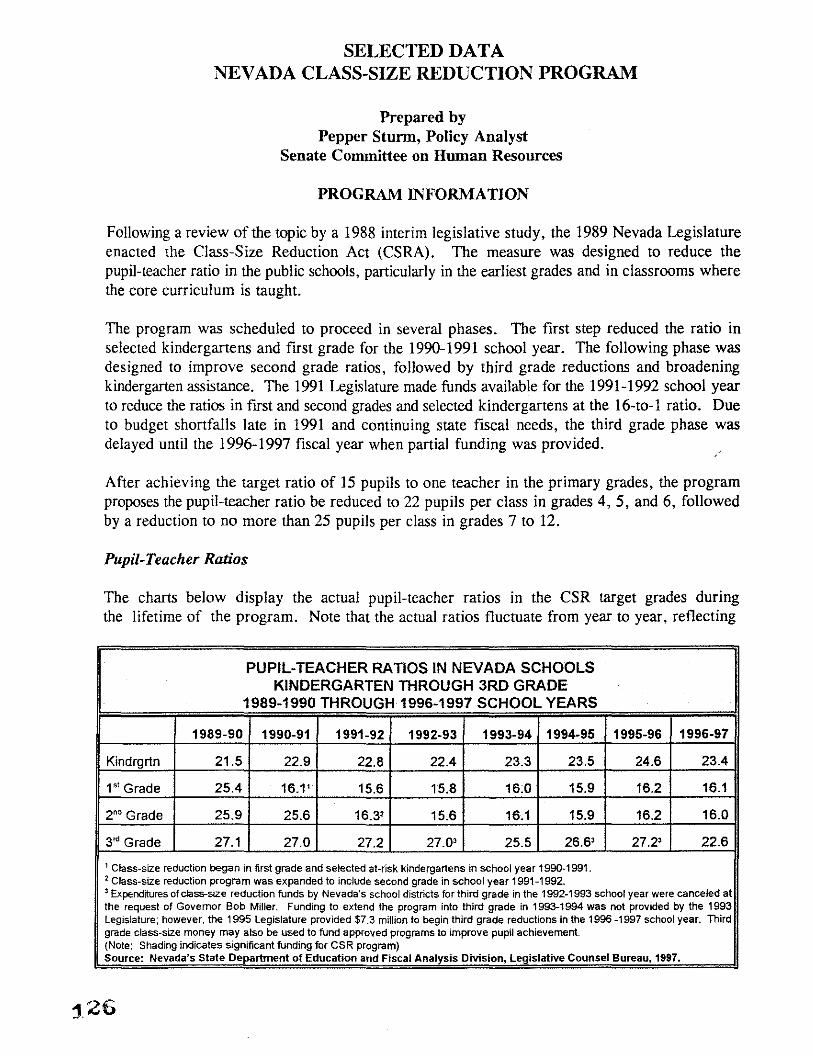
The charts below display the actual pupil-teacher ratios in the CSR target grades during the lifetime of the program. Note that the actual ratios fluctuate from year to year, reflecting
PUPIL-TEACHER RATIOS IN NEVADA SCHOOLS KINDERGARTEN THROUGH 3RD GRADE
1989-1990 THROUGH 1996-1997 SCHOOL YEARS
1989-90 1990-91 1991-92 1992-93 1993-94 1994-95 1995-96 1996-97
Kindrgrtn 21.5 22.9 22.8 22.4 23.3 23.5 24.6 23.4
1" Grade 25.4 16.1' 15.6 15.8 16.0 15.9 16.2 16.1
2'" Grade 25.9 25.6 16.3' 15.6 16.1 15.9 16.2 16.0
3'" Grade 27.1 27.0 27.2 27.0' 25.5 26.6' 27.2' 22.6
1 Class~size reduction began in first grade and selected at-risk kindergartens in school year 1990-1991. 2 Class-size reduction program was expanded to include second grade in school year 1991-1992. 3 Expenditures of dass-size reduction funds by Nevada's school districts for third grade in the 1992-1993 school year were canceled at the request of Governor Bob Miller. Funding to extend the program into third grade in 1993-1994 was not provided by the 1993 Legislature; however, the 1995 Legislature provided $7.3 million to begin third grade reductions in the 1996 -1997 school year. Third grade class-size money may also be used to fund approved programs to improve pupil achievement. (Note: Shading indicates significant funding for CSR program) Source: Nevada's State Department of Education and Fiscal AnalysiS DiviSion, Legislative Counsel Bureau, 1997.

NEVADA PUPIL-TEACHER RATIOS CSR Target Grades - K - 3
23 I ~
21 - " ..
- ~~~ ~~~~~~~-~- --~-.. 19-+---', 17 +-~~~~~~~---'~. ~~~~~~-~----~~~~---~~~~~~~~
'-- - - -.....: . .:.:.:.~"'-.,.,...-.----.-.-.---.-'--15-t-~~~
1989-90 1990·91 1991-92 1992-93
Kindergarten
2nd Grade
1993-94
-~1
1994-95
1 st Grade
3rd Grade
1995·96 1996-97
the success in projecting student growth and the number of teachers needed for the program. The actual funding allocation for Nevada's Class-Size Reduction Program is calculated by projecting student growth, figuring in the number of teachers districts would have hired to keep pace with
Number of CSR Teachers
600
500
400
300
200~~~r 100 ~
o 1990-911991-921992-931993-941994-951995-961996-97
o Kndrgrtn • First
• Second • Third
1'l'.!!b21 :l!l'lb22 1'l'l.2,,<ll 1'l'1,l,2;I 12'I!b25 l'J'l6,M
Kndrgnn 23 23.5 23.5 23.5 23~5 23~5
First 475~5 534.5 498~5 489~5 521.5 539~5
Second 332.5 458.5 468 489 517 Third 0
2
that growth under the old ratios, then calculating the number of additional teachers needed to reduce the pupil-to-teacher ratio to the funded level (currently 16 to 1). The CSR appropriations bill specifies the numbers of teachers to be hired, by grade. The measure also specifies the amount of the appropriation, by grade, based upon that estimated number of teachers multiplied by actual average of new hire salaries and benefits. In the current fiscal year, Nevada has employed 1,342 CSR teachers. The growth in the numbers of these teachers reflected on the chart at the left side of the page is a function of student growth in existing CSR grades, plus the addition of other grades as the program was phased in.
l'l95-~6
23~5
599 524.5 195
Effect Upon Pupil-Teacher Ratios in Other Grades
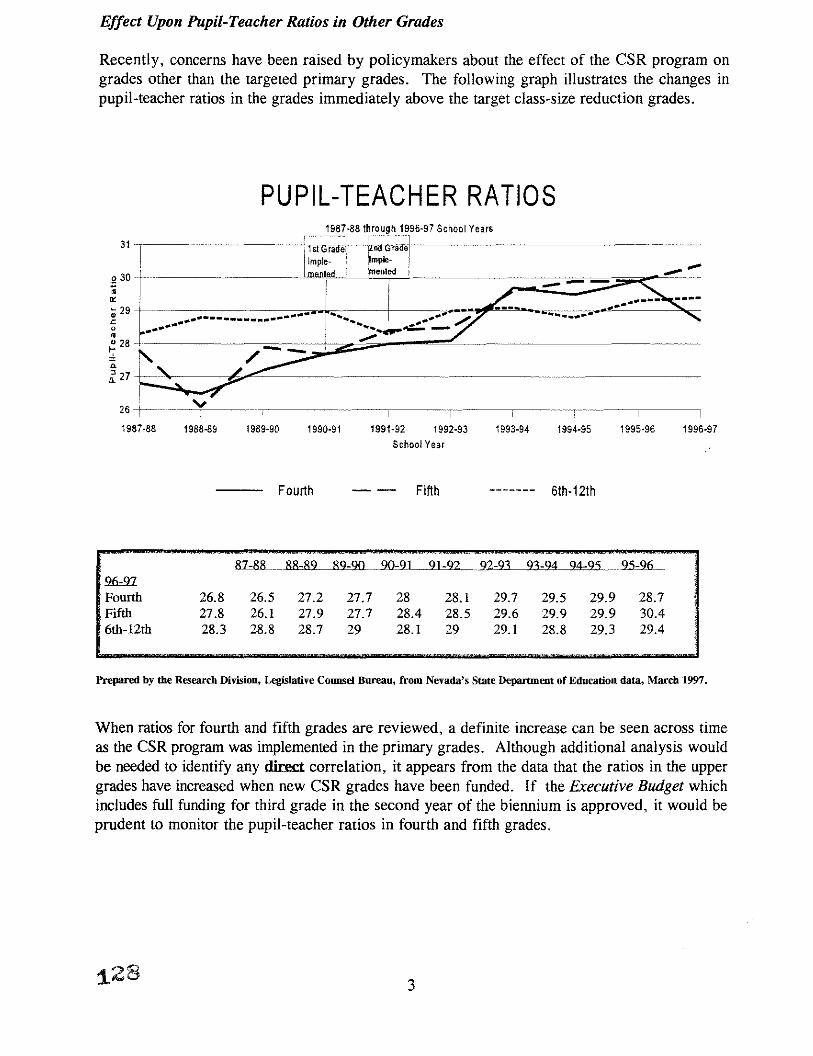
Recently, concerns have been raised by policymakers about the effect of the CSR program on grades other than the targeted primary grades. The following graph illustrates the changes in pupil-teacher ratios in the grades immediately above the target class-size reduction grades.
PUPIL-TEACHER RATIOS
26 -r-- v I I T '~""""-, I I
1987·88 1988·89 1989·90 1990·91 1991·92 1992·93 1993·94 1994·95 1995·96 1996·97
School Year
Fourth - - Fifth ------- 6th·12th
~- 88-82 82-00 00-91 21-Q7 .. 92-23 23-Q4 %-25 _ .. .9~ 9fJ='Il Fourth 26.8 26.5 27.2 27.7 28 28.1 29.7 29.5 29.9 28.7 Fifth 27.8 26.1 27.9 27.7 28.4 28.5 29.6 29.9 29.9 30.4 6th-12th 28.3 28.8 28.7 29 28.1 29 29.1 28.8 29.3 29.4
Prepared by the Research Division, Legislative Coumel Bureau, from Nevada's State Department of Education data, March 1997.
When ratios for fourth and fifth grades are reviewed, a definite increase can be seen across time as the CSR program was implemented in the primary grades. Although additional analysis would be needed to identify any diJ:ect correlation, it appears from the data that the ratios in the upper grades have increased when new CSR grades have been funded. If the Executive Budget which includes full funding for third grade in the second year of the biennium is approved, it would be prudent to monitor the pupil-teacher ratios in fourth and fifth grades.
1.28 3
Program Costs
The next chart displays the actual cost of Nevada's CSR program over time. Note that the program costs increase as new grades are phased into the program. By the end of this fiscal year,
YEARLY EXPENDITURES (IN THOUSANDS) FOR CLASS-5IZE REDUCTION PROGRAM KINDERGARTEN THROUGH3RD GRADE
(1990-1991 THROUGH 1996-1997 SCHOOL YEARS)
1990-91 1991-92" 1992-93" 1993-94" 1994-95" 1995-96" 1996-97t
Kindergarten $ 746.9 $ 792.8 $ 820.1 $ 853.7 $ 876.0 $ 945.4 $ 991.7
1st Grade 15,266.5 18,030.8 17,396.5 17,746.0 19,439.3 21,703.2 25,278.7
2nd Grade -- 11,216.6 16,000.6 16,928.6 18,227.8 20,798.1 22,134.7
3rd Grade- -- - -- -- - -- 7,308.4
TOTAL $16,013.4 $30,040.2 $34,217.2 $35,528.3 $38,543.1 $43,446.6 $55,713.5
*In 1990-1991, expenditures for at-risk kindergartens were tracked separately from expenditures for first grade. Since then, however, the class-size reduction funds for aU grades have been combined. The amounts reportedly spent in each grade in succeeding years represent a proportional share of expenditures based upon the number of class-siZe reduction teachers employed for each grade. ""'Expenditures of class-size reduction funds by Nevada's school districts for third grade in the 1992-1993 school year were delayed at the request of Governor Miller. Funding to extend the program into third grade in 1993-1994 was not provided by the 1993 Legislature; however, the 1995 Legislature provided $7.3 million to begin third grade reductions in the 1996-1997 school year. Third grade class~size money may also be used to fund approved programs to improve pupil achievement.
~
tEstimated (breakout by grade based upon 2-year average percent of total); rounding may affect total. Source: Nevada's State Department of Education and Fiscal Analysis Division, Legislative Counsel Bureau, 1997.
Nevada will have expended approximately $254.2 million for the direct costs of funding CSR, excluding any local capital expenditures or other local costs. In the coming biennium, the Executive Budget is recommending full funding for third grade; with that addition, the biennial expenditure for the CSR program is expected to be approximately $155 million, or about $25.6 million per grade per year (excluding kindergarten). The 1997 Legislature is currently reviewing this budget item but has yet to act upon these recommendations.
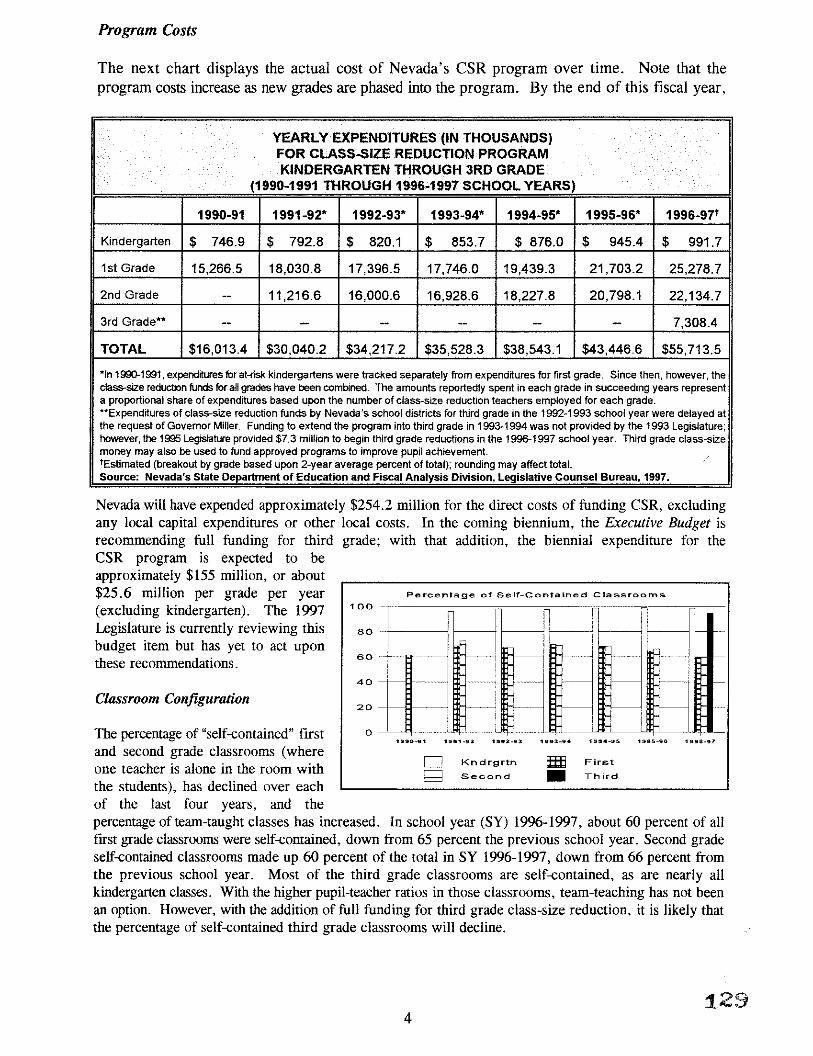
Classroom Configuration
The percentage of "self-contained" first and second grade classrooms (where one teacher is alone in the room with the students), has declined over each of the last four years, and the
100
80 ..
60
40
20
0
Percentage of Self-Contained Classrooms
r --] ! , , ! f- .~ ..
, I I ._- l· ... j ".,
-i -
I ,
-l ! ,
, -
_.- •......
! I
-
~,.,."_9~ 1,.!H_,. .. 1" .... · .. 3 1" .. 3_". ~,. ......... " ~; ... "-,, .. 1998_97
D Kndrgrtn IHIl First
g Second • Third
percentage ofteam-taught classes has increased. In school year (SY) 1996-1997, about 60 percent of all tirst grade classrooms were self-contained, down from 65 percent the previous school year. Second grade self-contained classrooms made up 60 percent of the total in SY 1996-1997, down from 66 percent from the previous school year. Most of the third grade classrooms are self-contained, as are nearly all kindergarten classes. With the higher pupil-teacher ratios in those classrooms, team-teaching has not been an option. However, with the addition of full funding for third grade class-size reduction, it is likely that the percentage of self-contained third grade classrooms will decline.
129 4

EVALUATIONS OF NEVADA'S CLASS SIZE PROGRAM
There have been two formal reports to date, with another expected in April 1997.
1991 Evaluation Report
In 1993, Nevada's State Department of Education's report on the CSR program makes the following conclusions:
• Principals, teachers, and parents were very positive in their attitudes toward class-size reduction, and the dynamics created within the classroom contributed to an improved learning environment;
• School districts reported fewer special education referrals (a decrease of 5 percent); and less teacher absenteeism (a decline of 7.1 percent); and
• Achievement data did not produce exceptional results, except among certain subgroups.
50
Q
~40 ~ e3Q ~
1.30
1 10 15
1 to 15
Washoe and Rural Districts
50
~40
" • ~30
" ~20 . " · Q
~10 4
O-L--,-·~----,------,------,,--~
16'020 211025 261040 CllH'lO SIZe
161020 211025 261040 Class SiZe
1 to 15
Clark County School District
~ 50
> · ~ 41) w · ~ )0
" ." ~O
L( o
16 to 20 21 to 25 25 to 4[l 1 II) 15 15 to 20 21 to 25 25 to 40
ClaH SiZe
5
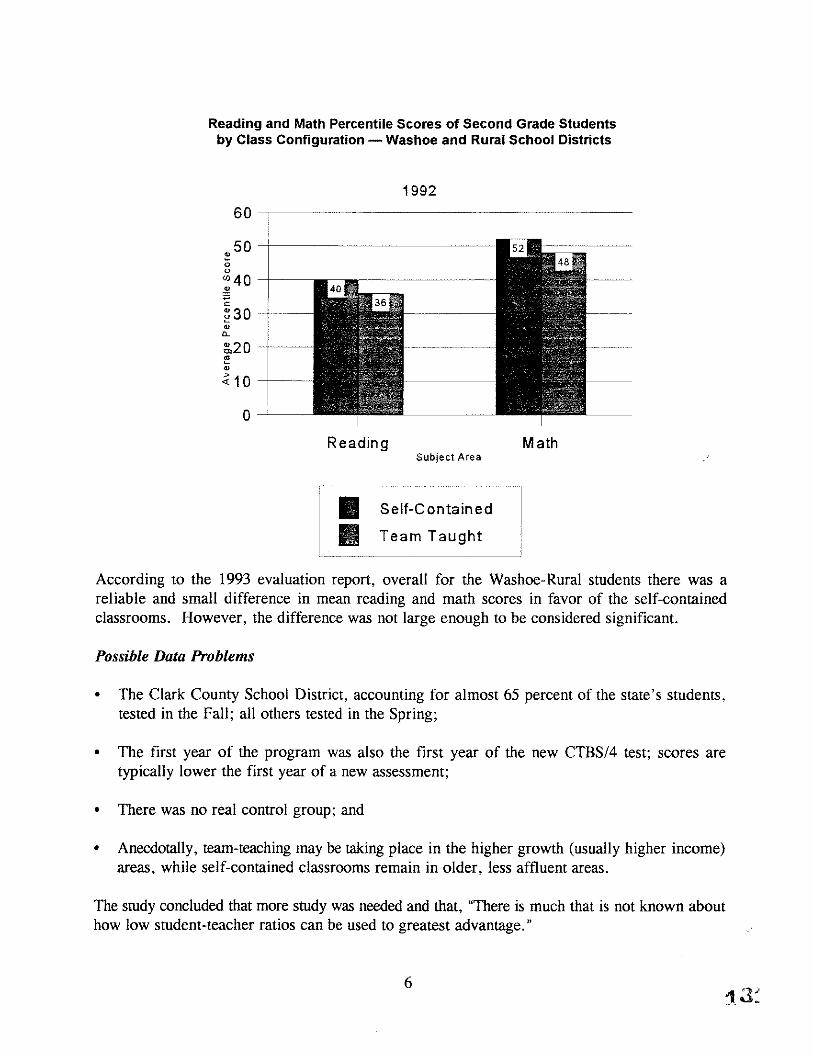
Reading and Math Percentile Scores of Second Grade Students by Class Configuration - Washoe and Rural School Districts
1992
~ 50 -+----"""""-~------" :; o "'40 -+-.!! ~ pO +""~--~ lL
~20 + ---~ ~
.;;: 1 0 -+-"~"-""
o -'--~ Reading
Subject Area
• Self-Contained
• Team Taught
Math
According to the 1993 evaluation report, overall for the Washoe-Rural students there was a reliable and small difference in mean reading and math scores in favor of the self-contained classrooms. However, the difference was not large enough to be considered significant.
Possible Data Problems
• The Clark County School District, accounting for almost 65 percent of the state's students, tested in the Fall; all others tested in the Spring;
• The first year of the program was also the first year of the new CTBS/4 test; scores are typically lower the first year of a new assessment;
• There was no real control group; and
• Anecdotally, team-teaching may be taking place in the higher growth (usually higher income) areas, while self-contained classrooms remain in older, less affluent areas.
The study concluded that more study was needed and that, "There is much that is not known about how low student-teacher ratios can be used to greatest advantage."
6
1995 Evaluation Report
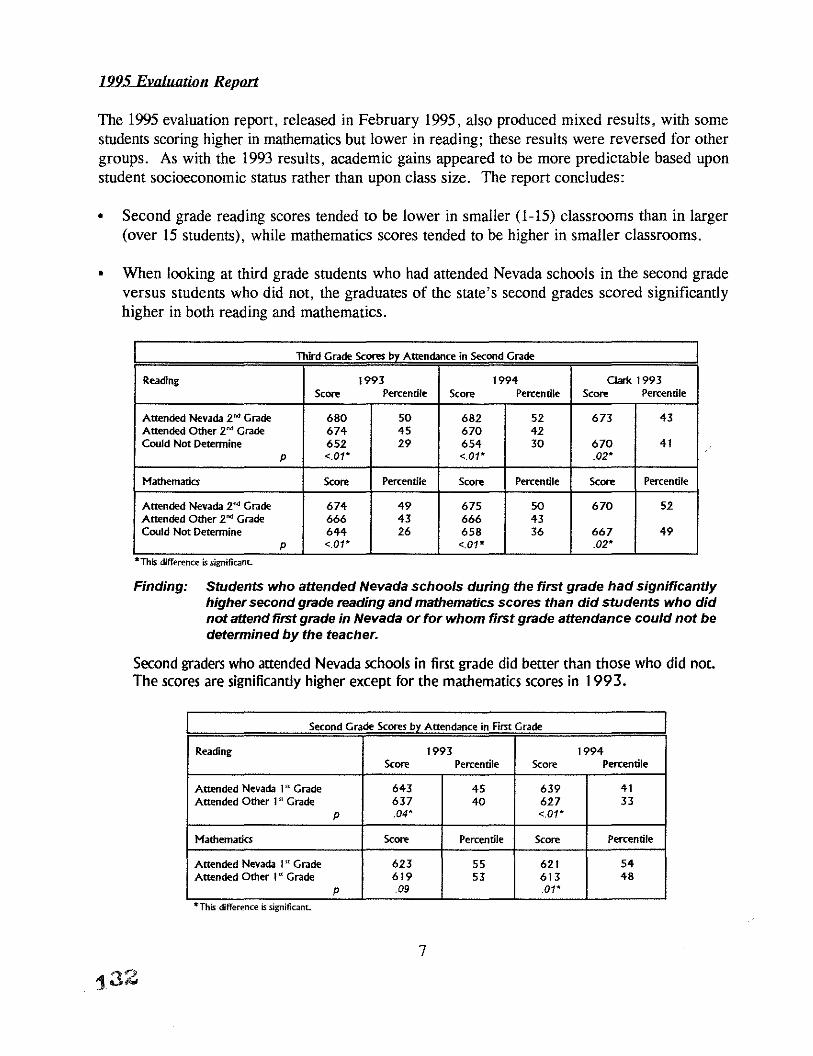
The 1995 evaluation report, released in February 1995, also produced mixed results, with some students scoring higher in mathematics but lower in reading; these results were reversed for other groups. As with the 1993 results, academic gains appeared to be more predictable based upon student socioeconomic status rather than upon class size. The report concludes:
• Second grade reading scores tended to be lower in smaller (1-15) classrooms than in larger (over 15 students), while mathematics scores tended to be higher in smaller classrooms.
• When looking at third grade students who had attended Nevada schools in the second grade versus students who did not, the graduates of the state's second grades scored significantly higher in both reading and mathematics.
Third Grade Scores by Attendance in Second Grade
Reading 1993 1994 CIar1< 1993 Score Percentile Score Percentile Score Percentile
Attended Nevada 2"" Grade 680 50 682 52 673 43 Attended Other 2nd Grade 674 45 670 42 Could Not Detennine 652 29 654 30 670 41
P <.01* <.01* .02*
Mathematics Score Percentile Score Percentile Score Percentile
Attended Nevada 2 00 Grade 674 49 675 50 670 52 Attended Other 2"" Grade 666 43 666 43 Could Not Detennine 644 26 658 36 667 49
P <.01* <.01'" .02*
"ThIS difference IS slgmlkant.
Finding: Students who attended Nevada schools during the first grade had significantly higher second grade reading and mathematics scores than did students who did not attend first grade in Nevada or for whom first grade attendance could not be determined by the teacher.
Second graders who attended Nevada schools in first grade did better than those who did not. The scores are significantly higher except for the mathematics scores in 1993.
Second Grade Scores by Attendance in Fim Grade
Reading 1993 1994 Score Percentile Score Percentile
Attended Nevada pI Grade 643 45 639 41 Attended Other 1" Grade 637 40 627 33
P .04' <.01*
Mathematics Score Percentile Score Percentile
Attended Nevada 1" Grade 623 55 621 54 Attended Other 1" Grade 619 53 613 48
P .09 .01*
"ThIS difference IS Significant.
7
132

• A gains analysis comparing test score gains for the same students as they moved from second to third and to fourth grade did not show significant differences by the class-size ratio experienced in second grade with one general exceptionmathematics scores were higher for the Washoe County and rural students (tested in the Spring) in larger classes (greater than 15 to 1).
Gains from second grade through the fourth grade (from 1992 through 1994) were compared for rural and Washoe students. These gains were not significant.
Fourth Grade Gains of Students by Second Grade Class Size
Reading Gains 1992·1994
1·15 Students 37 Over 15 SWdents 32
p .32
Mathematics 1992·1994
1-15 Students 18 Over 1 5 Students 19
p .51
The actual scores of these students were examined over the two·year period.
Finding: The mathematics and reading scores were higher for third graders who attended second grade in large classrooms than for those who attended second grade in small classrooms.
Third Grade Scores by Second Grade Class Size
Reading 1993 1994 Clark 1994 Score Percentile Score Percentile Score Percentile
1-1 5 Students 679 49 681 51 677 47 Over I 5 Students 685 54 688 57 675 45
p <.01* <.01* .75
Mathematics Score Percentile Score Percentile Score Percentile
1-1 5 Students 673 49 676 51 672 54 Over I 5 Students 678 53 682 56 672 54
p >.01* <.01* .96
• ThtS difference IS slgmficant.
There was a tendency for greater gains in mathematics to be associated with larger second grade classrooms, and greater gains in reading associated with smaller second grade classrooms.
• There are several factors overwhelmingly more important in predicating pupil achievement scores-special education status; ESL status, ethnicity, free lunch eligibility, and class configuration (in descending order), each accounted for more variance in scores than did class size.
8
1.34
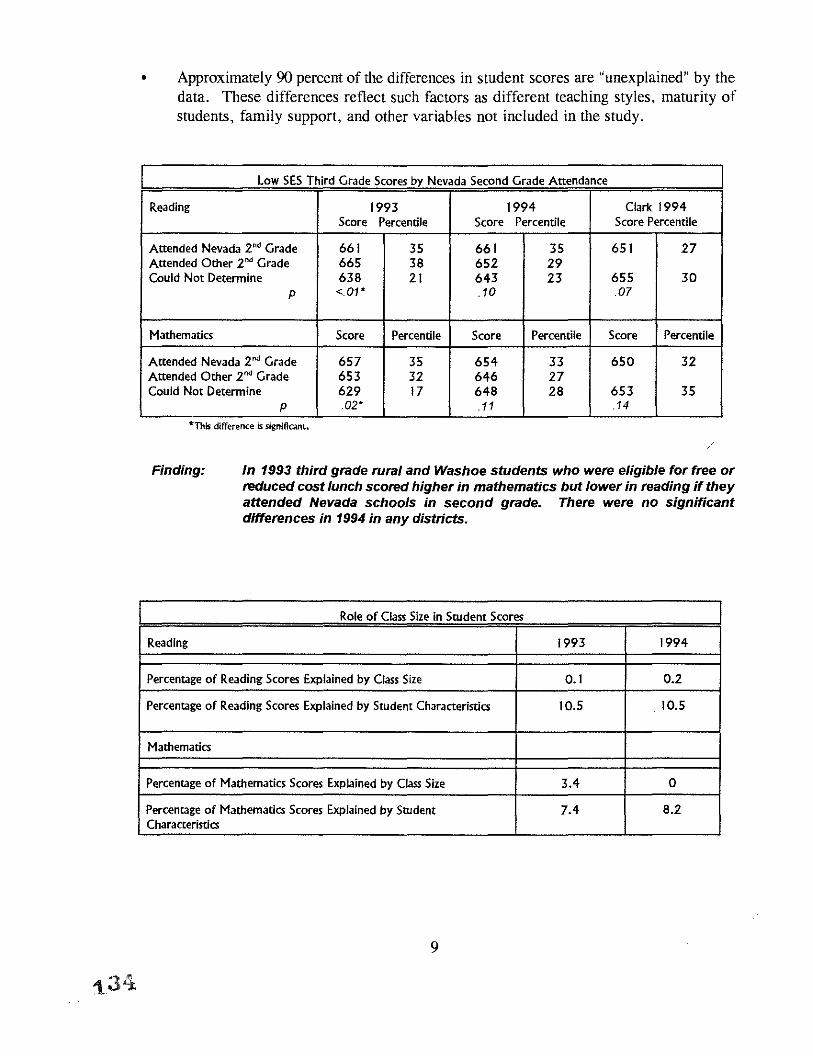
• Approximately 90 percent of the differences in student scores are "unexplained" by the data. These differences reflect such factors as different teaching styles. maturity of students. family support. and other variables not included in the study.
Low SES Third Grade Scores by Nevada Second Grade Attendance
Reading 1993 1994 Clark 1994 Score Percentile Score Percentile Score Percentile
Attended Nevada 2 0' Grade 661 35 661 35 651 27
Attended Other 2 0' Grade 665 38 652 29
Could Not Detennine 638 21 643 23 655 30 p <.01'" .10 .07
Mathematics Score Percentile Score Percentile Score Percentile
Attended Nevada 2" Grade 657 35 654 33 650 32 Attended Other 2" Grade 653 32 646 27 Could Not Detennine 629 17 648 28 653 35
p .02' .11 .14
*This difference is significant.
Finding: In 1993 third grade rural and Washoe students who were eligible for free or reduced cost lunch scored higher in mathematics but lower in reading if they attended Nevada schools in second grade. There were no Significant differences in 1994 in any districts.
Role of Class Size in Swdent Scores
Reading 1993 1994
Percentage of Reading Scores Explained by Class Size 0.1 0.2
Percentage of Reading Scores Explained by Swdent Characteristics 10.5 10.5
Mathematics
Percentage of Mathematics Scores Explained by Class Size 3.4 a Percentage of Mathematics Scores Explained by SWdent 7.4 8.2 Characteristics
9
CURRENT EVALUATION DATA
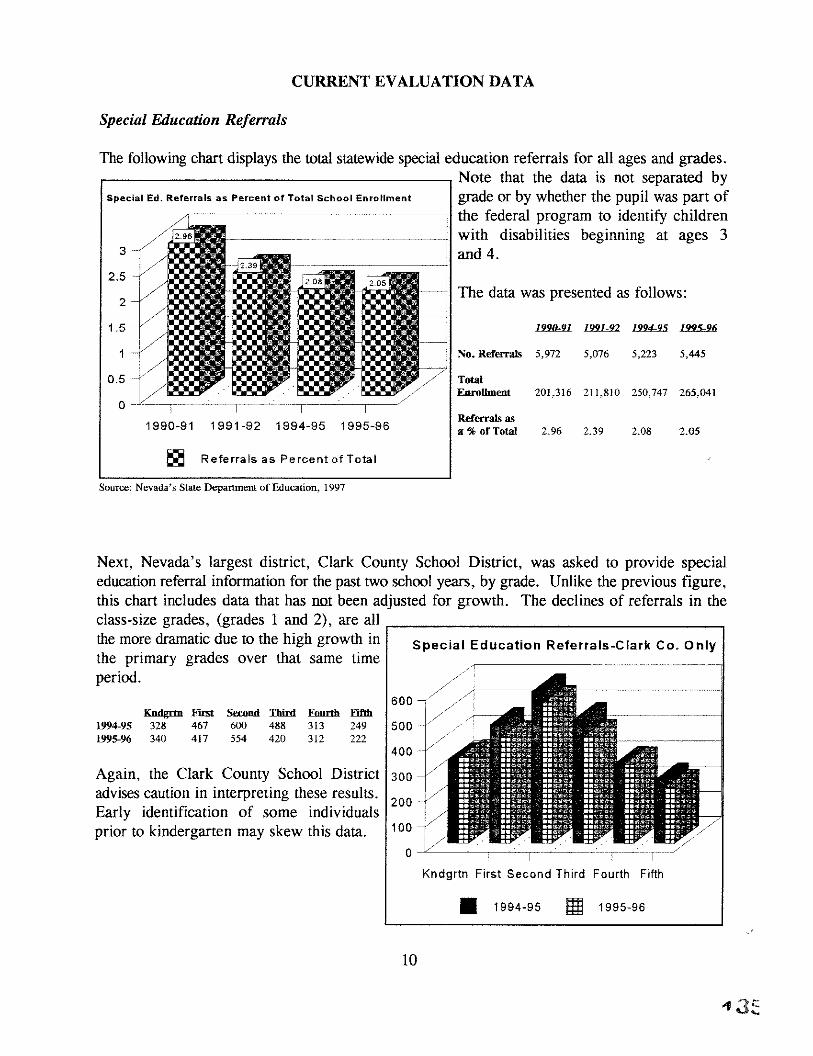
Special Education Referrals
The following chart displays the total statewide special education referrals for all ages and grades . .----------------------, Note that the data is not separated by
Special Ed. Referrals as Percent of Total School Enrollment grade or by whether the pupil was part of the federal program to identify children
---~~·~~~~.~~-~~~-.----~~H with disabilities beginning at ages 3 3 and 4.
2,5
2 The data was presented as follows:
1.5 l'J'lJb'll l'J'J.L!J2 l'I'J4!I5 l!Ifi,!M
1 No. Referrals 5.972 5,076 5,223 5,445
0,5 Total Enrollment 201,316 211,810 250,747 265,041
1990~91 1991 ~92 1994~95 1995-96 Referrals as 3' % of Total 2,96 2,39 2,08 2,05
~ Referrals as Percent of Total
Source: Nevada's State Department of Education, 1997
Next, Nevada's largest district, Clark County School District, was asked to provide special education referral information for the past two school years, by grade. Unlike the previous figure, this chart includes data that has llil1 been adjusted for growth. The declines of referrals in the class-size grades, (grades 1 and 2), are all .--_________________ -, the more dramatic due to the high growth in the primary grades over that same time period.
Kndgrtn flIlil Second Third Eruu:th Eifth
Special Education Referrals-Clark Co. Only
600
1994-95 328 467 600 488 313 249 500 1995-96 340 417 554 420 312 222
Again, the Clark County School District advises caution in interpreting these results. Early identification of some individuals prior to kindergarten may skew this data.
400
300
200
100
O~~--,-~,-~~,-~-~- T~~~~~~r~~/
Kndgrtn First Second Third Fourth Fifth
• 1994-95 ml 1995-96
10
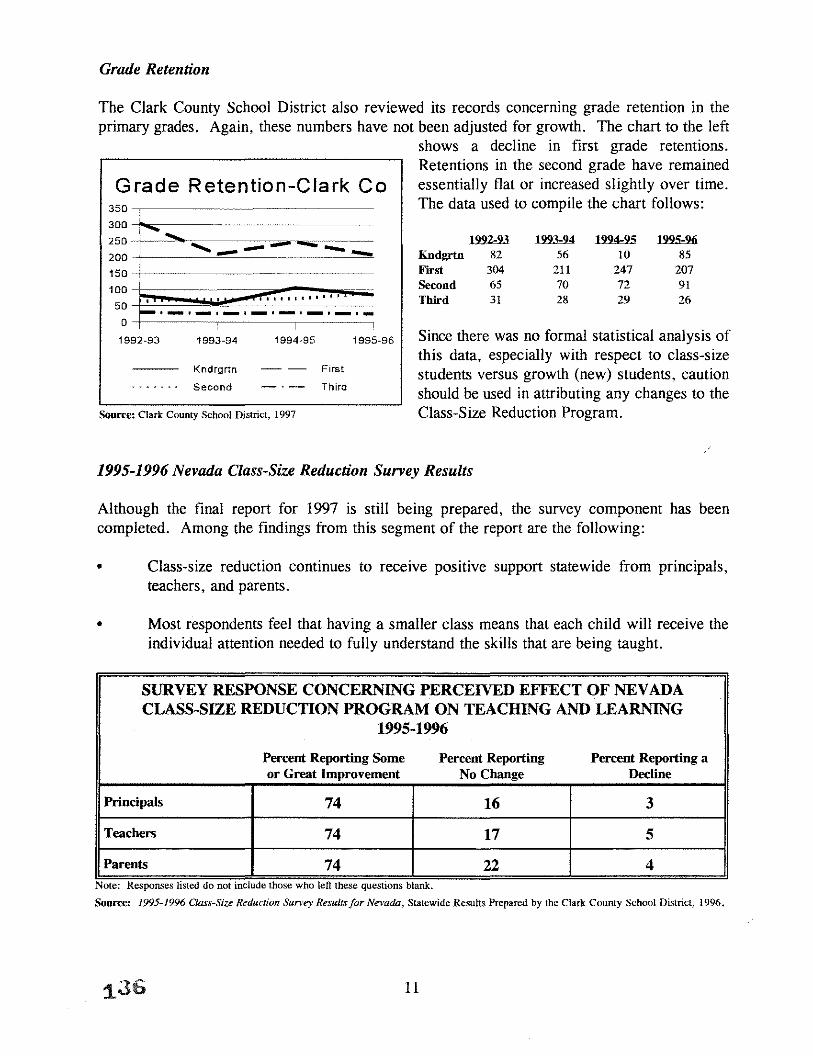
Grade Retention
The Clark County School District also reviewed its records concerning grade retention in the primary grades. Again, these numbers have not been adjusted for growth. The chart to the left
Grade Retention-Clark Co 350-~---~
300 k 250 .. '1 ...... U~_
200 - ! ........... --- --- -- -.... ....... --150
100 L·· .... ,.... 50 r' ~ i ' ! 'J ••• I ••••
_" ___ ;_'-'-'-'-'-o , I !
1992·93 1993·94 1994·95 1995·96
Kndrgrtn - - First
_ •••••. Second _. - Third
Source: Clark County School District, 1997
shows a decline in first grade retentions. Retentions in the second grade have remained essentially flat or increased slightly over time. The data used to compile the chart follows:
199k93 tmM ~5 .~ Kndgrtn 82 56 10 85 First 304 211 247 207 Second 65 70 72 91 Third 31 28 29 26
Since there was no formal statistical analysis of this data, especially with respect to class-size students versus growth (new) students, caution should be used in attributing any changes to the Class-Size Reduction Program.
1995-1996 Nevada Class-Size Reduction Survey Results
Although the final report for 1997 is still being prepared, the survey component has been completed. Among the findings from this segment of the report are the following:
• Class-size reduction continues to receive positive support statewide from principals, teachers, and parents.
• Most respondents feel that having a smaller class means that each child will receive the individual attention needed to fully understand the skills that are being taught.
SURVEY RESPONSE CONCERNING PERCEIVED EFFECT OF NEVADA CLASS-SIZE REDUCTION PROGRAM ON TEACHING AND LEARNING
1995-1996
Percent Reporting Some Percent Reporting Percent Reporting a or Great Improvement No Change Decline
Principals 74 16 3
Teachers 74 17 5
Parents 74 22 4 Note. Responses hsted do not mclude those who left these questIons blank.
Source: 1995-1996 Class-Size Reduction Survey Results/or Nevada, Statewide Results Prepared by the Clark County School District, 1996.
11

• Even though many respondents stated that team-teaching is preferable to 30-to-l ratios, they believe it is not as beneficial as each teacher having a self-contained classroom of 15 to 1.
• Fully one-third of parents did not respond to questions assessing the impact of CSR upon their child, and concerning the importance of third grade class-size reductions.
1995-1996 SURVEY RESPONSE: TOP TWO COMMENTS CONCERNlNG NEVADA'S CLASS-SIZE REDUCTION PROGRAM
What Is Most Advaotageous What Aspect Interferes with Aspect (Or What Effect on Success (Or What Problems as it Child)? Affects Your Child)?
Principals - More one on one and small - Lack of space/classrooms group instruction/interaction - Team teaching
Teachers - More one on one and .mall - Lack of space/classrooms group instruction - Team teaching - Team teachers can share ideas and leam from each other
~
Parents - Teacher can give child more - There are no problems individual attention - Team taught classrooms - Students feel more confident and overcrowded and noisy ltave higher self esteem in a small class
Source: 1995-1996 Class-Size Reduclion Survey Results/or Nevada, Statewide Results Prepared by the Clark County School District, 1996.
12

SELECTED REFERENCES TO MATERIALS CITED
NRS 388. 700 Class-Size Reduction Program Repon. Nevada's State Depattment of Education, January 31, 1997.
Costa, Judith S. 1995-1996 Class-Size Reduction Survey Results for Nevada. Clatk County School District Testing and Evaluation Depattment (1997).
Pollatd, James P. The Nevada Class-Size Reduction Evaluation Study 1995. Northwest Regional Educational Laboratory, Match 1995.
Snow, Maty B. The 1993 Class-Size Reduction Evaluation Study. Nevada's State Depattment of Education, August 1993.
13