Embed Size (px)
Citation preview

Mental Illness and the Criminal Justice System in
Nevada
Nevada Division of Public and Behavioral Health March 2013
Christopher Moore, MPH CandidateSouthern Nevada Adult Mental Health Services Jay Kvam, MSPH, State BiostatisticianNevada Division of Public and Behavioral Health Ihsan Azzam, MD, PhD, State EpidemiologistNevada Division of Public and Behavioral Health
Pamela Graber, MA, Public Information OfficerOffice of Public Health Informatics and Epidemiology Julia Peek, MHA, ManagerOffice of Public Health Informatics and Epidemiology
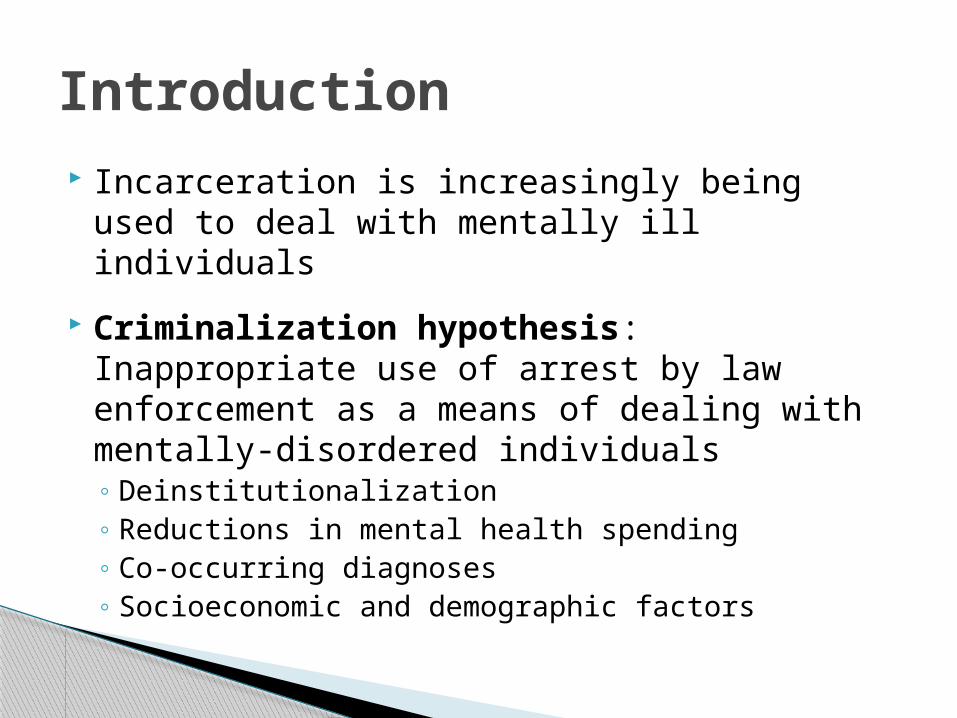
Incarceration is increasingly being used to deal with mentally ill individuals
Criminalization hypothesis: Inappropriate use of arrest by law enforcement as a means of dealing with mentally-disordered individuals◦ Deinstitutionalization◦ Reductions in mental health spending◦ Co-occurring diagnoses◦ Socioeconomic and demographic factors
Introduction

Three times as many individuals with serious mental illness (SMI) are incarcerated than receiving hospital-based treatment.
In the last 30 years, the number of inmates with SMI has tripled.
7-16% of inmates have a mental illness.
Introduction

Understand the prevalence and demographic distribution of mental illness in the jails of the three most populous counties in Nevada.
Consider policies and programs that have been, or could be, implemented to reduce the burden the criminalization of mental illness has placed on Nevada jails, and provide a better and more appropriate standard of care.
Objective

Descriptive Statistics: 2011 Division of Mental Health and Developmental Services (MHDS) data were cross-matched with data from three Nevada jails:◦ Clark County Detention Center (CCDC)◦ Washoe County Detention Facility (WCDF)◦ Carson City Jail (CCJ)
Population data from the US Census Bureau were utilized for comparisons with countywide rates for demographic variables
Analytical Statistics: Correlation between number of clinic visits/hospital admissions and frequency of incarceration were analyzed using Spearman’s rank correlation
Methods

2,000,759; 72.5%
429,908; 15.6%
54,838; 2.0%
273,426; 9.9%
Figure 1. Estimated Nevada Population by County, 2012
Clark County Washoe County Carson City Other
Results

CCDC WCDF CCJ0
10,000
20,000
30,000
40,000
50,000
60,000
0%
5%
10%
15%
20%
25%
5,703 2,674 527
49,789
12,7821,758
10.3%
17.3%
23.1%
Figure 2. Prevalence of 2011 Detainees with a History of
Mental Illness Detainee Users of MHDS Services Detainee Non-Users of MHDS ServicesUsers of MHDS Services, (%)
MH
DS
Cli
en
ts
De
tain
ee
Use
rs o
f M
HD
S S
erv
ice
s,
%

CCDC WCDF CCJ0%
10%
20%
30%
40%
50%
60%
70%64.1%
61.1%57.5%
34.6%38.8%
41.9%
1.2%
Figure 3. Individuals with a History of Mental Illness Detained at Nevada
Jails, 2011
Male Female Unknown
County Jail
Pe
rce
nta
ge
of
De
tain
ee
s

17 to24 25 to 34 35 to 44 45 to 54 55 to 64 65 and older
CCDC
0.189374013677012
0.328598982991408
0.252498684902683
0.188146589514291
0.046466771874452
0.003506926179203
93
WCDF
0.217439703153989
0.301298701298701
0.224489795918367
0.195918367346939
0.055287569573283
9
0.005565862708719
85
CCJ 0.324478178368121
0.269449715370019
0.212523719165085
0.159392789373814
0.026565464895635
7
0.004
3%
8%
13%
18%
23%
28%
33%
Figure 4. Detention of Individuals with a History of Mental Illness in Nevada Jails by Age Group, 2011
Pe
rce
nta
ge
of
Ind
ivid
ua
ls

White Black Asian/Pacific Is-lander
American In-dian/Alaskan
Native
Other Unknown
CCDC 0.491 0.208 0.021 0.002 0 0.293
WCDF 0.876 0.092 0.01 0.018 0.013 0.003
CCJ 0.966 0.019 0 0.011 0 0
5%
15%
25%
35%
45%
55%
65%
75%
85%
95%
Figure 5. Detention of Individuals with a History of Mental Illness in Nevada Jails
by Race, 2011
Nu
mb
er
of
Ind
ivid
ua
ls (
%)

CCDC WCDF CCJ0%
10%
20%
30%
40%
50%
60%
70%
80%
90%
66.2%
82.0%
70.6%
26.4%
10.8%
24.7%
8.9% 10.8% 8.2%
Figure 6. Detention of Individuals with a History of Mental Illness in Nevada Jails by
Ethnicity, 2011
Non-Hispanic Unknown Hispanic
County Jail
Pe
rce
nta
ge
of
Ind
ivid
ua
ls (
%)

Did Not Graduate
High School
Graduate/GED
Vocational/Technical
School
Some Col-lege
Under-graduate Degree
Some Graduate
School
Graduate Degree
Other
CCDC 0.295 0.431103234381923
0.0294638901196278
0.190518387239699
0.027027027027027
0.0046521931767833
4
0.0132919805050953
0.0093043863535666
8
WCDF 0.2644 0.4252 0.0504 0.1844 0.0256 0.0232 0.014 0.0128
CCJ 0.333333333333333
0.466101694915254
0.0338983050847458
0.11864406779661
0.019774011299435
0.0056497175141242
9
0.0084745762711864
4
0.0141242937853107
3%
8%
13%
18%
23%
28%
33%
38%
43%
48%
Figure 7. Detainees with a History of Mental Illness in Nevada County Jails by Educational
Attainment, 2011
Pe
rce
nta
ge
of
De
tain
ee
s

Unem-ployed,
Looking for Work
Unem-ployed, Not Looking for
Work
Retired Other Inmate Employed Full-Time
Employed Part-Time
Student Homemaker Unknown Military
CCDC 0.302647729265299
0.247764334560758
0.0049096966508855
0.0797825705768894
0.00140277047168157
0.0601437839733474
0.0471681571102928
0.011572856391373
0.00683850604944766
0.235840785551464
0.001
WCDF 0.464125560538117
0.251494768310912
0.0085949177877429
0.0242899850523169
0.00149476831091181
0.0680119581464873
0.0437219730941704
0.023542600896861
0.0216741405082212
0.0911808669656203
0.001
CCJ 0.250474383301708
0.148007590132827
0.00379506641366224
0.032258064516129
0 0.0683111954459203
0.0398481973434535
0.0740037950664137
0.0246679316888046
0.349146110056926
0.00379506641366224
3%
8%
13%
18%
23%
28%
33%
38%
43%
48%
Figure 8. Detainees with a History of Mental Ill-ness in Nevada Jails by Employment Status, 2011
Nu
mb
er
of
Ind
ivid
uals
(%
)
CCDC WCDF CCJ0
10,000
20,000
30,000
40,000
50,000
60,000
1.0%
1.2%
1.4%
1.6%
1.8%
2.0%
2.2%
2.4%
2.6%
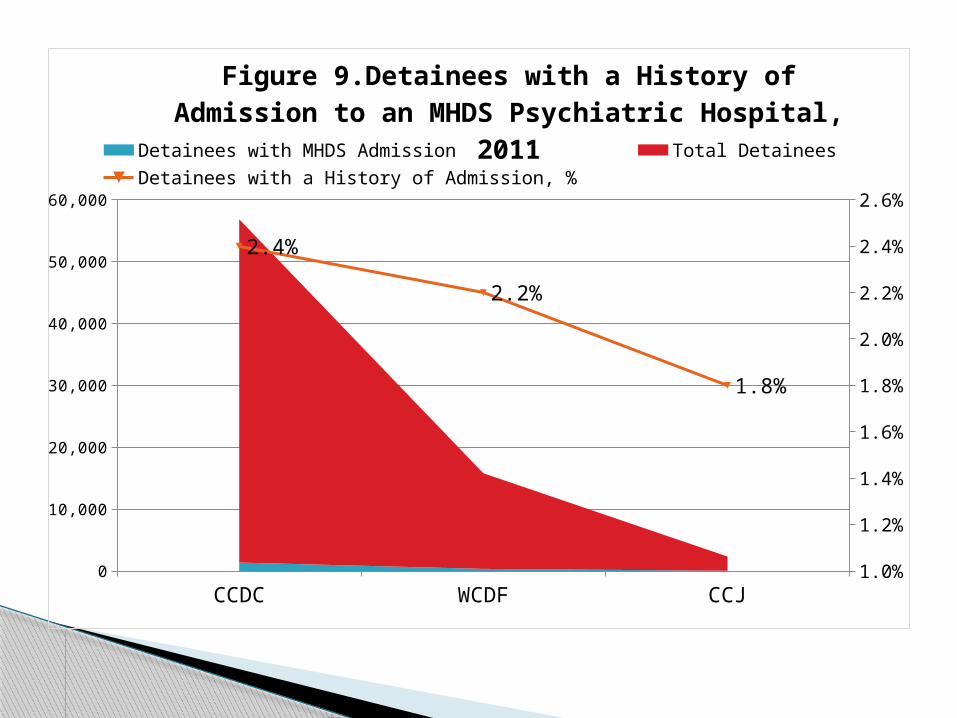
2.4%
2.2%
1.8%
Figure 9.Detainees with a History of Ad-mission to an MHDS Psychiatric Hospital,
2011Detainees with MHDS Admission Total DetaineesDetainees with a History of Admission, %

484, 19.5%105, 4.2%
16, 0.6%
1881, 75.7%
Figure 10. Prevalence of Clients Admitted to an MHDS Hospital and
Detained in a Nevada Jail, 2011
CCDC WCDF CCJ Not Detained
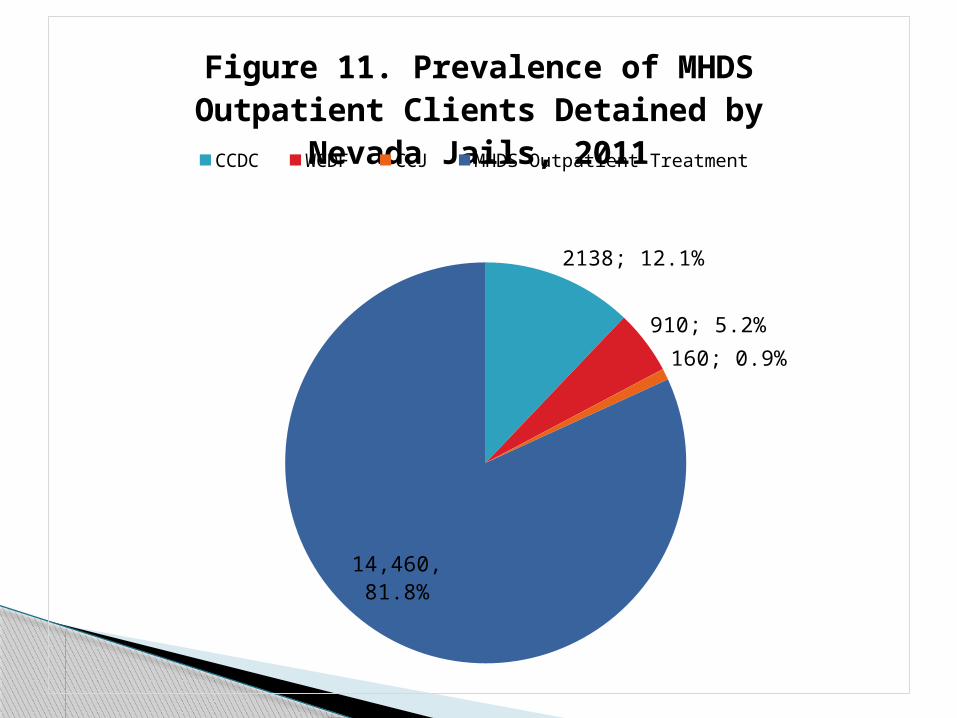
2138; 12.1%
910; 5.2%
160; 0.9%
14,460, 81.8%
Figure 11. Prevalence of MHDS Outpatient Clients Detained by
Nevada Jails, 2011CCDC WCDF CCJ MHDS Outpatient Treatment

1 2 3 4 5+0
50
100
150
200
250
300
0%
10%
20%
30%
40%
50%
60%56.4%
20.7%
9.7%5.9%
7.2%
Figure 13. Individuals Who Were Both Ad-mitted to an MHDS Hospital and Detained at
Least Once in a Nevada Jail, 2011
CCDC WCDF CCJ
Number of Detentions
Nu
mb
er
of
Ind
ivid
ua
ls
Pe
rce
nta
ge
of
Ind
ivid
ua
ls

1 2 3 4 5 to 9 10+
CCDC (n=2138)
0.592609915809167
0.235266604303087
0.0841908325537886
0.0397567820392891
0.0411599625818522
0.0070159027128157
2
WCDF (n=911)
0.551042810098793
0.21953896816685
0.109769484083425
0.0614709110867179
0.0548847420417124
0.0032930845225027
4
CCJ (n=162)
0.524691358024691
0.234567901234568
0.191358024691358
0.0308641975308642
0.0185185185185185
0
-5%
5%
15%
25%
35%
45%
55%
Figure 12. 2011 Users of MHDS Outpatient Services Detained by Nevada Jails by Number
of Detentions
Nu
mb
er
of
Ind
ivid
uals
(%
)

Psychotic Mood Substance Use
Personality Adjustment Other Deferred None
CCJ 0.482 0.143 0.268 0.018 0 0.054 0.036 0
WCDF
0.403061224489796
0.306122448979592
0.122448979591837
0.0306122448979592
0.0408163265306122
0.0561224489795918
0.0357142857142857
0.0051020408163265
3
CCDC
0.504424778761062
0.300884955752212
0.113569321533923
0.0103244837758112
0.0162241887905605
0.0471976401179941
0.0044247787610619
5
0.0029498525073746
3
5%
15%
25%
35%
45%
55%
Figure 14. Most Common Diagnoses Among Those Frequently Admitted and
Detained in Nevada Jails, 2011
Pe
rce
nta
ge
of
Ind
ivid
ua
ls

Table 1. Correlation Between Number of Hospitalizations or Clinic Visits and Number of Detentions in 2011.
CCDC WCDF CCJ
MHDS Hospital Admissions and Detentions
rs[487] = .095, p < .05
rs[105] = .214, p < .05
Non-significant
MHDS Outpatient Clinic Visits and Detention
rs[2138] = .059, p < .01
rs[910] = .147, p < .05
Non-significant
*Correlations calculated using the Spearman’s Rank Correlation Coefficient in SPSS (version 20).

Table 2. Legal Holds Placed by the LVMPD and Detainment by CCDC, 2011-2012.
2011 2012
Legal Holds 5,989 6,185
CCDC Detainees with Mental Illness
5,703 Not Available
Note: Total may include individuals counted more than once due to multiple legal holds. 248 individuals were placed on legal holds from CCDC

Misdemeanor Gross Midemeanor Felony Unassigned
CCDC 0.819 0.07 0.111 0
WCDF 0.961 0.006 0.011 0.022
CCJ 0.654 0 0.038 0.308
5%15%25%35%45%55%65%75%85%95%
Figure 15. Charges Filed Against Those with Multiple Admissions and Deten-
tions, 2011
Pe
rce
nta
ge
of
Ind
ivid
ua
ls
Criminalization of Mental Illness

Trespass, 4972, 87.4%
Other, 716, 12.6%
Figure 16. Charges Against Those with Multiple MHDS Admissions and
CCDC Detentions in 2011

Financial incentive for criminalization 2001 Report by the Bureau of Justice
Statistics◦ Annual operating costs per prisoner in Nevada
were $48.14 per day VERA Institute of Justice study
◦ States spent an average of $76.03 per inmate per day in 2010
◦ Nevada prison expenditures had increased by 9.39 percent between 2006 and 2010
Criminalization of Mental Illness

Table 3. Comparison of Treatment and Incarceration Costs, FY 2012
NNAMHS SNAMHS LVMPD
Admission/Incarceration (Per bed day) $1383.71 $656.10 $144.00
OP Clinic Visit $197.84 $166.54 N/A

Expansion of existing jail diversion programs, such as Mental Health Court, to include service provision for more mentally-disordered individuals.
Development of government and community partnerships to provide seriously mentally ill individuals with case management services and the social supports necessary to successfully transition from incarceration to community living.
Potential Solutions

Community-based program involving multiple Nevada government and local partnerships
Diverts non-violent offenders with mental illness into treatment programs
Goal: Reduce or eliminate offender recidivism by treating mental illness
Mental Health Court (MHC)

One Year Prior During One Year After Two Years Af-ter
2007 (n=106) 5011 1086 230 813
2008 (n=82) 4723 1119 230 NaN
2009 (n=63) 2820 569 858 NaN
500
1,500
2,500
3,500
4,500
5,500
Figure 18. Mental Health Court Graduate Jail Days, 2007-2009
Jail D
ays

One Year Prior During0
5,000
10,000
15,000
20,000
25,000
$0
$500,000
$1,000,000
$1,500,000
$2,000,000
$2,500,000
$1,060,279
$224,305
$1,090,676
$2,322,941
Figure 19. 2007-08 Mental Health Court Candidate Jail Days and CostsMHC Enrollee Jail Days (n=169) MHC Non-Enrollee Jail Days (n=164)MHC Enrollee Jail Costs MHC Non-Enrollee Jail Costs
Jail
Da
ys
Jail
Co
sts

Authorizes involuntary court-ordered admission of certain adults with mental illness to programs of outpatient services.
◦ History of treatment noncompliance◦ Able to live safely in the community◦ Admission necessary to prevent further disability
likely to result in harm to self or others◦ Limited ability to comply voluntarily with
treatment◦ Least restrictive treatment option
2013 Legislative Session: Assembly Bill 297
Rawson Neal Behavioral Health Center◦ Seamless transition to outpatient care◦ Intensive case management services◦ Housing provision
Dependent on strengthening partnerships between Mental Health and Criminal Justice professionals
Drop-in Center◦ Integration into the community◦ Peer support◦ Vocational training◦ Community resource and service access
Seamless Transitions to Outpatient Services

Treatment Advocacy Center Study
Figure 20. Prevalence of Mental Health Diversion Practices: A Survey of the States (2013)

Table 4. Nevada’s Grade for Mental Health Diversion Practices
Percentage of
population served by a
Mental Health Court
Percentage of
population served by
Crisis Intervention
Team
Average Percentage Grade
88% 37% 63% B+

Criminalization of mental illness has placed a high burden on the criminal justice system in Nevada
An approach involving multiple programs ranging in levels of intensity is needed to reduce this burden
Longitudinal data need to be collected to evaluate the effectiveness of each of these programs
Conclusions

Cross-matched data does not account for those individuals utilizing private services ◦ Underrepresentation of mental illness in jails
Misclassification◦ Prevalence rates sometimes total over 100 percent
Individuals may not be current utilizers of psychiatric services
MHDS clients may have been detained elsewhere◦ Actual prevalence of incarceration may be higher◦ Study of incarceration statewide is recommended
Limitations

For more information, contact:◦ Christopher Moore◦ Southern Nevada Adult Mental Health Services
Telephone: (702)486-6447 Email: [email protected]
Contact Information

The CCDC results of this study have also been presented in a Nevada Division of Public and Behavioral Health Report:◦ Moore, C., Kvam, J. Azzam, I., Graber, P., & Peek, J.
(2013, March). Mental Illness and the Criminal Justice System: Clark County, Nevada. http://health.nv.gov/publications.htm
The authors thank Jodie Gerson, Sharon Dollarhide, Kurt Green, and Adrian Ramirez for providing MHDS data. The authors also thank Dr. Patricia Cruz for providing guidance in the development of this presentation.
Acknowledgements

Guerino, P. H., Harrison, P.M, & Sabol, W.J. (2011, December). Prisoners in 2010. Retrieved 15 2013, March, from Bureau of Justice Statistics: http://bjs.gov/content/pub/pdf/p10.pdf
McKnight, T. (2012). Nevada's Division of Mental Health and Developmental Services 2012 Needs Assessment. State of Nevada Division of Mental Health and Developmental Services.
Osterweil, N. (2011, 17 November). Severe Mental Disorders Highly Prevalent in Jails, Prisons. Retrieved March 14, 2013, from Clinical Psychiatry News: http://www.clinicalpsychiatrynews.com/news/more-top-news/single-view/severe-mental-disorders-highly-prevalent-in-jails-prisons/a25755da9f.html.
Steadman, H.J., Osher, F.C., Robbins, P.C., Case, B., Samuels, S. (2009), “Prevalence of serious mental illness among jail inmates. Psychiatric Services;60:761–765. doi: 10.1176/appi.ps.60.6.761.
Stephan, J. (2004, June). State Prison Expenditures, 2001. Retrieved March 17, 2013, from Bureau of Justice Statistics: http://bjs.gov/content/pub/pdf/spe01.pdf.
Subramanian, R. & Tublitz, R. (2012, September). Realigning Justice Resources: A Review of Population and Spending Shifts in Prison and Community Corrections. Retrieved March 17, 2013, from VERA Institute of Justice: http://www.vera.org/files/Full%20Report.pdf.
Teplin, L.A. (1990). The prevalence of severe mental disorder among male urban jail detainees: comparison with the Epidemiologic Catchment Area Program. Am J Public Health. 80(6), 663–669.
Torrey, E.F., Kennard, A.D., Eslinger, D., Lamb, R., & Pavle, J. (2010, May). More Mentally Ill Persons are in Jails and Prisons Than Hospitals: A Survey of the States. Retrieved from: http://www.treatmentadvocacycenter.org/storage/documents/final_jails_v_hospitals_study.pdf
United States Census Bureau. (2010). American Fact Finder: Clark County, Nevada Retrieved March 14, 2012, from United States Census Bureau: http://factfinder2.census.gov/faces/tableservices/jsf/pages/productview.xhtml?pid=DEC_10_DP_DPDP1.
YCharts. (2013). Nevada Unemployment Rate. Retrieved March 15, 2013, from YCharts: http://ycharts.com/indicators/nevada_unemployment_rate.
Works Cited