Embed Size (px)
Citation preview

Nevada Courtyard4439 W. Nevada Place | Denver, CO 80219
CONFIDENTIAL OFFERING MEMORANDUM

© 2018 Greysteel / 2
04Investment Overview
The Offering
Property Details
Property Aerial
08Regional Overview
Area Highlights
Economic Highlights
Lifestyle Highlights
Demographics
Area Map
Major Employers Map
Retail / Transit Aerial
22Financial Analysis
Pricing Summary
Rent Roll
Unit Mix
Historical/Projected Income & Expenses
10-Year Cash Flow
18Sale Comparables
Sales Comps Map
Sales Comps Matrix
© 2018 Greysteel / 3
PROPERTY TOUR + OFFER PROCESSProperty Visitation: Prospective purchasers will be afforded the opportunity to visit the Property during prescheduled tours. Tours will include access to a representative sample of units as well as common areas. To not disturb the Property’s ongoing operations, visitation requires advance notice and scheduling.
Available Tour Dates: To schedule your tour of the Property, please contact Scott Whitfield at 303.390.1056 or [email protected].
Offer Submission: Offers should be submitted in the form of a non-binding Letter of Intent to Ryan Floyd at [email protected] or Scott Whitfield at [email protected]. Terms and conditions of Purchasers’ offer should at the minimum include:
• Offer price• Earnest money deposit• Due diligence and closing period• Description of Purchaser qualifications and proof of funds
LEGAL DISCLAIMERSThis Confidential Offering Memorandum (“Memorandum”) is solely for the use of the purchaser. While the information contained in this Analysis has been compiled from sources we believe to be reliable, neither Greysteel nor its representatives make any representations or warranties as to the accuracy or completeness of the information contained in this Analysis. All financial information and projections are provided for reference only and are based on assumptions relating to the general economy, market conditions and other factors beyond our control. Purchaser is encouraged to conduct an independent due diligence investigation, prepare independent financial projections, and consult with their legal, tax and other professional advisors before making an investment decision. Greysteel does not have authority to legally bind the owner and no contract or agreement providing for any transaction shall be deemed to exist unless and until a final definitive contract has been executed and delivered by owner.
All references to acreage, square footage, distance, and other measurements are approximations and must be independently verified.
SALES FINANCEScott [email protected]
Ryan FloydSenior [email protected]
Logan WiltseInvestment [email protected]
Paul HansonInvestment [email protected]
Daniel HartnettSenior Finance [email protected]
TRANSACTION SERVICESAri Firoozabadi*President & CEO
Rebecca WileyMarketing Director
Carl BrownCorporate Financial Analyst
Duerk BrewerChief Operating Officer
Nicole CapobiancoDirector of Transaction Services
Brett BurkhartLead Research Analyst
Yassi GhashghaiDirector of Corporate Services
*For more information or to inquire about Greysteel, please contact Ari Firoozabadi, President & CEO ([email protected] | 202.417.3873).

• The Offering
• Property Details
• Property Aerial
Investment Overview

© 2018 Greysteel / 5
The Offering
Greysteel is pleased to present the opportunity to acquire Nevada Courtyard Apartments, a professionally-managed residential community in North-West Denver. The garden-style property is well-maintained featuring little to no deferred maintenance and contains nine (9) two-bedroom apartments. All of the units received measured interior upgrades in 2016 including upgrades to cabinetry, appliances, countertops, bathrooms, and flooring. Investors will have the opportunity to drive value by implementing a continuation of the kitchen/bathroom improvements securing additional rent premiums from the large workforce renter base in Denver and the surrounding area. The community offers amenities such as on-site parking, walk-up entrance, and rear patios, as well as on-site laundry.
Investment Highlights
• Nevada Courtyard Apartments presents the opportunity to acquire a value-add apartment community with significant future growth prospects.
• Stabilized rent with additional upside potential.

© 2018 Greysteel / 6
Property Details
Nevada Courtyard Apartments4439 W. Nevada Place • Denver, CO 80219
YEAR BUILT / RENOVATED NEIGHBORHOOD ZONING OWNERSHIP
1956 / 2016 Westwood E-TU-C Fee Simple
Stories 1
Units 9
Buildings 1
Occupancy 100%
ConstructionExterior Brick
Building Height 11.5’
Parking Spaces 9
LocationCounty Denver
Parcel ID 5182-01-015
TaxesCurrent Tax Bill $5,380
6,420GROSS BUILDING SQUARE FEET
12,500 SFLOT SIZE
© 2018 Greysteel / 7
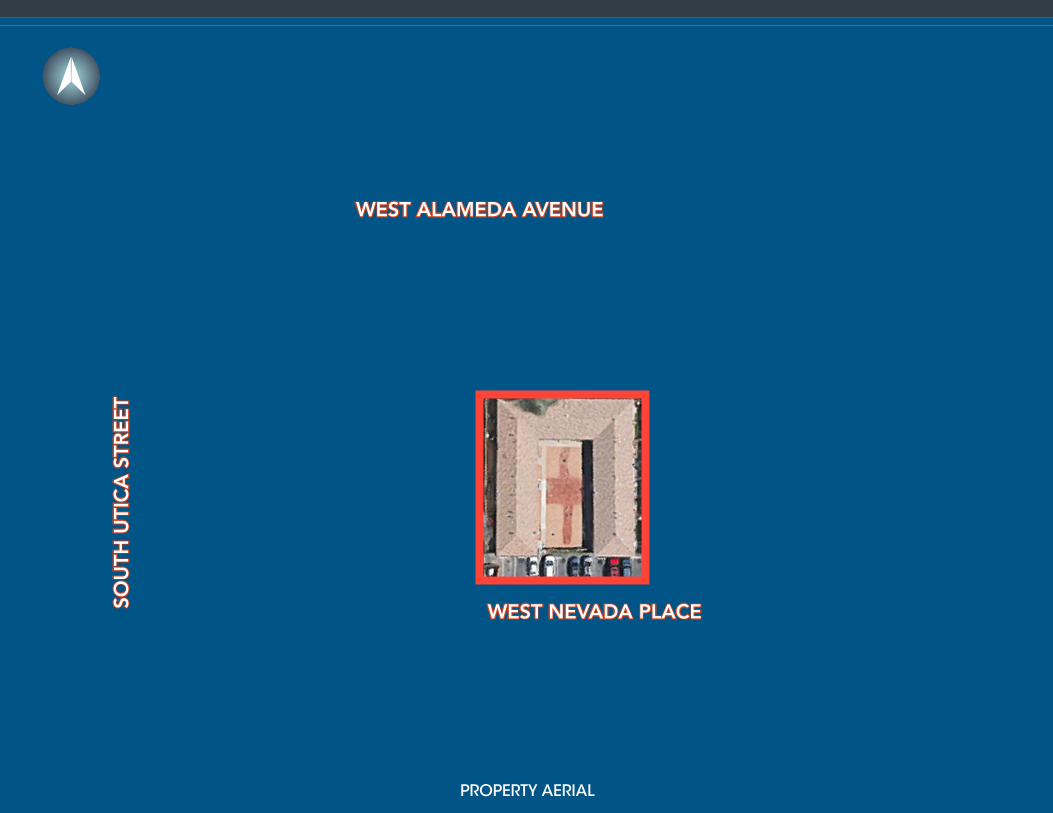
WEST NEVADA PLACE
WEST ALAMEDA AVENUE
SOU
TH U
TIC
A S
TRE
ET
PROPERTY AERIAL

• Area Highlights
• Economic Highlights
• Lifestyle Highlights
• Demographics
• Area Map
• Major Employers Map
• Retail / Transit Aerial
Regional Overview

© 2018 Greysteel / 9
AREA HIGHLIGHTS
Metropolitan DenverLocated in central Colorado, the Denver-Aurora-Lakewood Metropolitan Statistical Area consists of ten Colorado Counties totaling a population of over 2.9 million individuals. As the nation’s 19th most populated metro, Denver-Aurora-Lakewood MSA is a key economic center for the state, driven by the growth of a diversified economy ranging from Trade, Transportation, and Utilities to Government, Business, and Health Services. The region boasts a 2.3% unemployment rate accompanied by 3.6% in job growth, which contribute to the Denver-Aurora-Lakewood metro serving as home to a highly educated population, prominent schools and universities, and high incomes, as well as a high quality of life and access to a variety of outdoor recreational activities.
Metro Denver Key Facts:
• No. 7 – Highest average year-over-year population increase since 2010• No. 2 – Best Place to Live 2017 (U.S. News & World Report)• No. 2 – Most Educated State 2017 (U.S. News)• No. 1 – Best Place for Business and Careers 2017 & 2016 (Forbes)• Fortune 500 companies with headquarters in the metro (2017):
Arrow Electronics Inc., DaVita HealthCare Partners Inc., DISH Network Corporation, Liberty Interactive, Ball Aerospace and Technologies Corporation, Newmont Mining, Western Union, Level 3 Communications, Liberty Media, CH2M Hill Companies
City of DenverColorado’s capital, Denver, is nicknamed the Mile High City because of its exact one-mile elevation. Its 2018 population of nearly 715,000 makes it the 19th most populous U.S. city. What started out as a frontier town in 1858 has evolved into an economic center for Colorado and the surrounding Rocky Mountain and Great Plains states. Denver is also located just 340 miles from the exact center of the United States, making it an ideal central location for distribution centers and travel hubs. Three airlines have hubs in the Denver International Airport (DEN), the 6th busiest airport in the nation, and the fares to DEN have dropped nearly 42 percent in the last decade, making it an economical choice for travelers. Its economy is diversified in financial, commercial, federal, high-tech, educational, and tourism services, earning its No. 1 ranking as the “Best Place for Business and Careers” by Forbes in both 2017 and 2016. Denver also offers cultural attractions to its residents and visitors alike, including nationally recognized museums, the second largest performing arts center in the nation, and the Denver Zoo. Denver has more than 200 public parks and 20,000 acres of parks in the adjacent Rocky Mountains. The Downtown District, which features a mile-long pedestrian promenade, is approximately 12 miles east of the foothills of the Rocky Mountains and a starting point for many of the Colorado ski resorts.
Regional Economic Highlights: (*Per the Bureau of Labor Statistics as of May 2018)
3.6%EMPLOYMENT GROWTH
(Y-O-Y)
1,499,700TOTAL NONFARM
EMPLOYMENT
2.3%UNEMPLOYMENT
RATE
MAJOR GROWTH SECTORSInformation, Mining, Logging, and
Construction, Manufacturing

© 2018 Greysteel / 10
DENVER HEALTH (3.0 MILES) SAINT JOSEPH HOSPITAL (4.5 MILES) UNIVERSITY OF DENVER (5.0 MILES)
ECONOMIC HIGHLIGHTS
Denver Health (3.0 Miles): • Founded in 1997 in response to a need for affordable health care
coverage for employees of the Denver Health Authority and the Career Service Authority.
• Concentrates efforts on delivering quality health care products and services, providing the Denver community with access to high quality, cost-effective, locally managed health care.
• One of the top 25 employers in Metro Denver, with over 5,000 employees.
Denver Federal Center (3.5 Miles): • 623-acre campus with over 4 million square feet of office space housing
roughly 7,000 federal government employees.• 26 different agencies represented making it the largest concentration of
federal agencies outside of Washington, D.C.• Largest employer for the city of Lakewood.
Crossroads Commerce Park (3.9 Miles): • A modern development of nearly 1.0 million square feet of Class A
industrial space located in a central location with building sizes from 17,716–376,598 square feet.
• Minutes from Downtown Denver, providing close proximity to numerous amenities.
• Tenants include ATD, Empire Staple CO, Lennox, GLO, SP, and Inline.
Saint Joseph Hospital (4.5 Miles): • Saint Joseph Hospital was founded in Denver in 1873 by the Sisters of
Charity of Leavenworth as the first private teaching hospital in Colorado. Today, it remains the largest private teaching hospital in Denver.
• The hospital provides a tradition of healthcare that includes compassionate caregivers, stellar clinical expertise and active clinical partnerships with Kaiser Permanente, National Jewish Health and community physicians.
• The 831,000-square-foot hospital is home to 365 beds.• St. Joseph Hospital is a major employer in Denver with 2,370 local employees.
University of Denver (5.0 Miles): • The oldest and largest private university in the Rocky Mountain region,
the University of Denver currently has an undergraduate enrollment of 5,754 and a graduate enrollment of 5, 860. The university has 3,830 faculty and staff, with an average of $222 million spend annually on employee compensation, including wages and benefits.
• Students themselves contributed an estimated $115 million to the Denver metro economy in 2015—revenue generated primarily from housing, shopping and the service economy.
• Total economic benefit of the University for 2015 amounted to an estimated $958.2 million in total output produce by 7,661 University workers.
• The second largest employer in Denver County with 3,830 local employees.
© 2018 Greysteel / 11
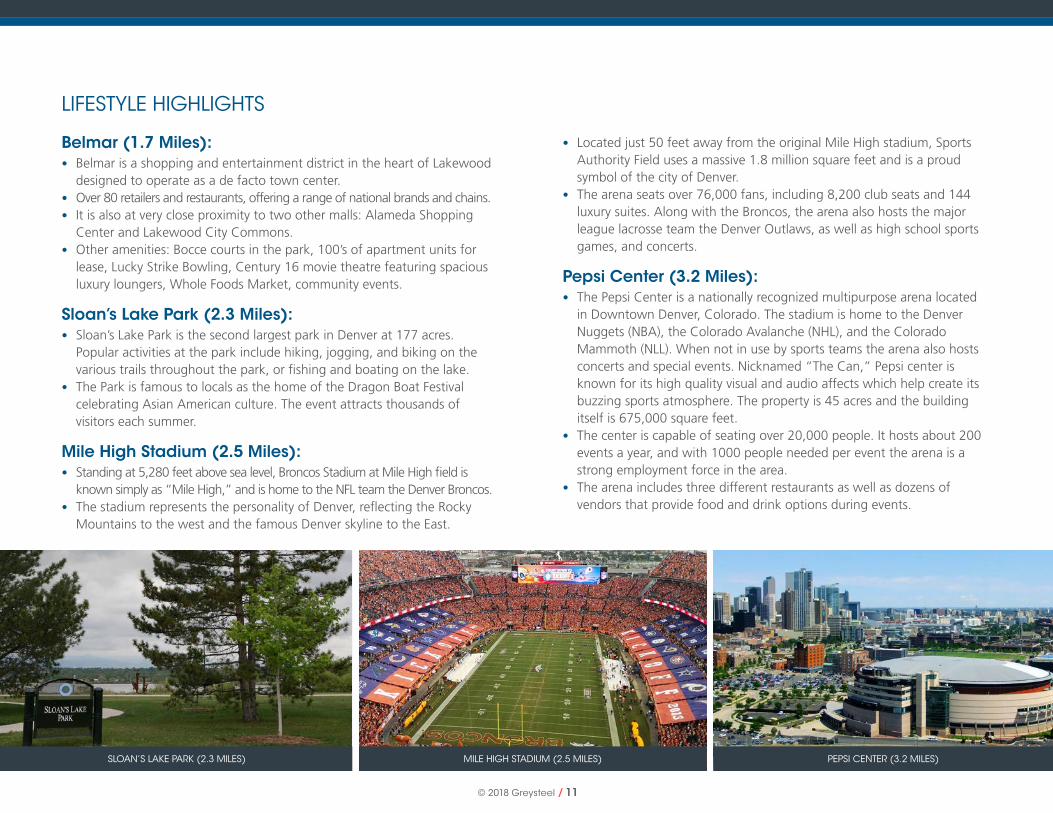
SLOAN’S LAKE PARK (2.3 MILES) MILE HIGH STADIUM (2.5 MILES) PEPSI CENTER (3.2 MILES)
LIFESTYLE HIGHLIGHTS
Belmar (1.7 Miles): • Belmar is a shopping and entertainment district in the heart of Lakewood
designed to operate as a de facto town center.• Over 80 retailers and restaurants, offering a range of national brands and chains.• It is also at very close proximity to two other malls: Alameda Shopping
Center and Lakewood City Commons.• Other amenities: Bocce courts in the park, 100’s of apartment units for
lease, Lucky Strike Bowling, Century 16 movie theatre featuring spacious luxury loungers, Whole Foods Market, community events.
Sloan’s Lake Park (2.3 Miles): • Sloan’s Lake Park is the second largest park in Denver at 177 acres.
Popular activities at the park include hiking, jogging, and biking on the various trails throughout the park, or fishing and boating on the lake.
• The Park is famous to locals as the home of the Dragon Boat Festival celebrating Asian American culture. The event attracts thousands of visitors each summer.
Mile High Stadium (2.5 Miles): • Standing at 5,280 feet above sea level, Broncos Stadium at Mile High field is
known simply as “Mile High,” and is home to the NFL team the Denver Broncos.• The stadium represents the personality of Denver, reflecting the Rocky
Mountains to the west and the famous Denver skyline to the East.
• Located just 50 feet away from the original Mile High stadium, Sports Authority Field uses a massive 1.8 million square feet and is a proud symbol of the city of Denver.
• The arena seats over 76,000 fans, including 8,200 club seats and 144 luxury suites. Along with the Broncos, the arena also hosts the major league lacrosse team the Denver Outlaws, as well as high school sports games, and concerts.
Pepsi Center (3.2 Miles): • The Pepsi Center is a nationally recognized multipurpose arena located
in Downtown Denver, Colorado. The stadium is home to the Denver Nuggets (NBA), the Colorado Avalanche (NHL), and the Colorado Mammoth (NLL). When not in use by sports teams the arena also hosts concerts and special events. Nicknamed “The Can,” Pepsi center is known for its high quality visual and audio affects which help create its buzzing sports atmosphere. The property is 45 acres and the building itself is 675,000 square feet.
• The center is capable of seating over 20,000 people. It hosts about 200 events a year, and with 1000 people needed per event the arena is a strong employment force in the area.
• The arena includes three different restaurants as well as dozens of vendors that provide food and drink options during events.
© 2018 Greysteel / 12
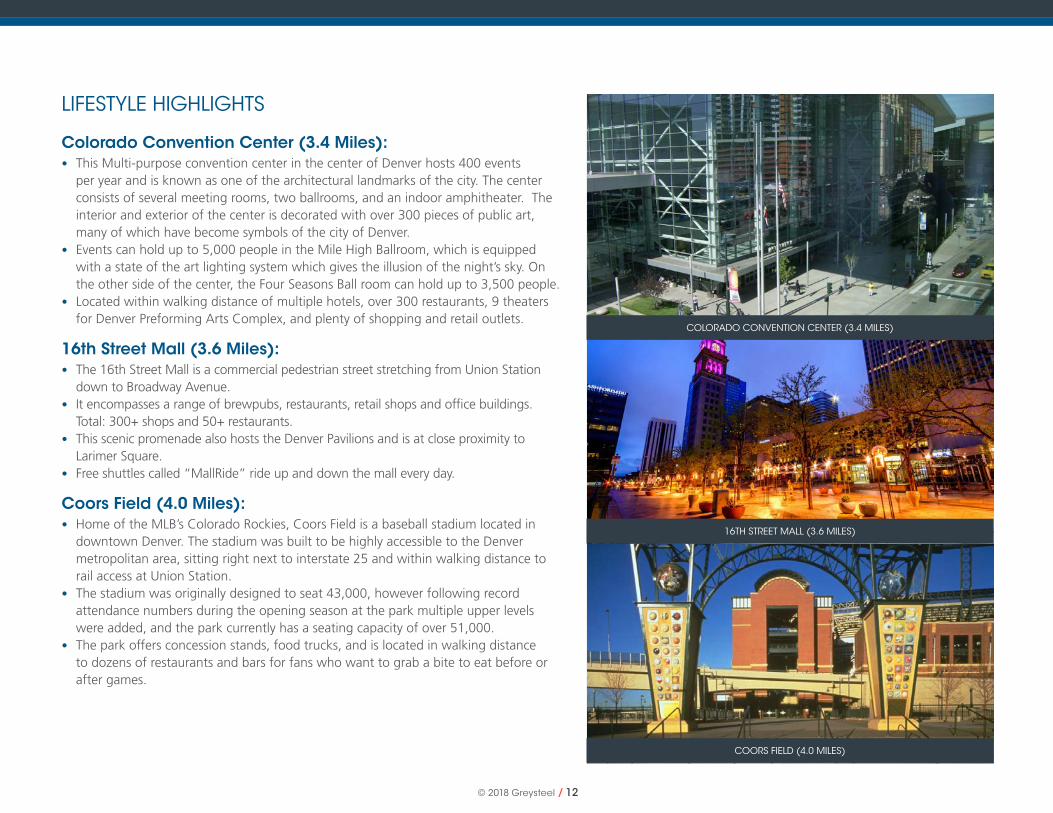
LIFESTYLE HIGHLIGHTS
Colorado Convention Center (3.4 Miles): • This Multi-purpose convention center in the center of Denver hosts 400 events
per year and is known as one of the architectural landmarks of the city. The center consists of several meeting rooms, two ballrooms, and an indoor amphitheater. The interior and exterior of the center is decorated with over 300 pieces of public art, many of which have become symbols of the city of Denver.
• Events can hold up to 5,000 people in the Mile High Ballroom, which is equipped with a state of the art lighting system which gives the illusion of the night’s sky. On the other side of the center, the Four Seasons Ball room can hold up to 3,500 people.
• Located within walking distance of multiple hotels, over 300 restaurants, 9 theaters for Denver Preforming Arts Complex, and plenty of shopping and retail outlets.
16th Street Mall (3.6 Miles): • The 16th Street Mall is a commercial pedestrian street stretching from Union Station
down to Broadway Avenue.• It encompasses a range of brewpubs, restaurants, retail shops and office buildings.
Total: 300+ shops and 50+ restaurants.• This scenic promenade also hosts the Denver Pavilions and is at close proximity to
Larimer Square.• Free shuttles called “MallRide” ride up and down the mall every day.
Coors Field (4.0 Miles): • Home of the MLB’s Colorado Rockies, Coors Field is a baseball stadium located in
downtown Denver. The stadium was built to be highly accessible to the Denver metropolitan area, sitting right next to interstate 25 and within walking distance to rail access at Union Station.
• The stadium was originally designed to seat 43,000, however following record attendance numbers during the opening season at the park multiple upper levels were added, and the park currently has a seating capacity of over 51,000.
• The park offers concession stands, food trucks, and is located in walking distance to dozens of restaurants and bars for fans who want to grab a bite to eat before or after games.
COLORADO CONVENTION CENTER (3.4 MILES)
16TH STREET MALL (3.6 MILES)
COORS FIELD (4.0 MILES)

© 2018 Greysteel / 13
Demographic & Income Profile Report
TOTAL RESIDENTIALPOPULATION TOTAL EMPLOYEES RENTER OCCUPIED
HOUSING UNITS MEDIAN AGE
MILES 2018 2023
1 29,136 30,800
3 185,624 197,777
5 484,208 526,037
MILES 2018
1 12,396
3 87,005
5 268,803
MILES 2018 2023
1 4,357 4,253
3 32,906 33,391
5 116,827 126,193
MILES 2018 2023
1 29.4 30.2
3 33.2 33.7
5 35.7 36.2
MEDIANHOUSEHOLD INCOME
AVERAGEHOUSEHOLD INCOME PER CAPITA INCOME
MILES 2018 2023
1 $38,881 $45,954
3 $46,782 $54,058
5 $56,233 $65,876
MILES 2018 2023
1 $52,880 $62,100
3 $61,569 $70,640
5 $82,969 $94,732
MILES 2018 2023
1 $15,942 $18,536
3 $22,489 $25,612
5 $37,769 $43,180

© 2018 Greysteel / 14
1
3
24
56
789
NEVADA COURTYARD
DENVER
70
70
76270
225
25
2
391 121 95 26
30
83
6
85
285
10
11
1218
19
1315
16
17 142070
15 Pepsi Center
16 Red Rocks Amphitheater
17 Mile High Stadium
18 Union Station
19 University of Denver
AREA MAP
2 MILES 4 MILES 8 MILES6 MILES
1 Colorado Mills
2 Colorado State Capitol
3 Coors Field
4 Denver Art Museum
5 Denver Botanic Gardens
6 Denver Health
7 Denver Museum of Nature & Science
8 Denver Zoo
9 Downtown Aquarium
10 Lamar Station Plaza
11 Larimer Square
12 LoDo
13 Museum of Contemporary Art
14 Paramount Theatre

© 2018 Greysteel / 15
3 MILES 10 MILES5 MILES 20 MILES
25
25
70
70
2
285
2017 MAJOR EMPLOYERS: DENVER
Company No. Employees
1 Denver Public School District #1 12,387
2 City and County of Denver 11,190
3 State of Colorado Central Payroll 10,548
4 Denver Health 6,842
5 United Airlines, Inc. 6,000
6 CHC Payroll Agent, Inc. 4,303
7 USDA National Finance Center 4,240
8 University of Denver 4,009
9 University of Colorado Central 3,399
10 U.S. Postal Service 3,225
1
4
5
6
7
8
9
MAJOR EMPLOYERS MAP
70
6
287
30
76
270
225
2
391 121
95
83
2070
85177 88
8
58
93
12172
470
470
470
30
83
36
70
NEVADA COURTYARD
W. COLFAX AVE
PENA BLVD
10
95
32

RETAIL / TRANSIT AERIAL
W. NEVADA PLACE
NEVADA COURTYARD
W. BAYAUD AVENUE
W. ALAMEDA AVENUE
S. S
HE
RID
AN
BO
ULE
VA
RD
S. S
TU
AR
T S
TR
EE
T
26
S. U
TIC
A S
TR
EE
T
S. S
TU
AR
T S
TR
EE
T
W. DAKOTA AVENUE
W. CEDAR AVENUE
95

© 2018 Greysteel / 17

• Sales Comps Map
• Sales Comps Matrix
Sale Comparables

© 2018 Greysteel / 19
25095
3856
1 Red Brick Apartments
2 Fenton Street Apartments
3 1475 S. Pierce Street
4 1208 Zephyr Street
70
3 MILES
NEVADA COURTYARD
2
3
1 254
291
121
70
KIP
LIN
G S
T
W. ALAMEDA AVE
25
25088
GRAND ARMY OF THE REPUBLIC HWY
W. COLFAX AVE
S.
SH
ER
IDA
N B
LVD
S.
FED
ER
AL
BLV
D
S.
SA
NTA
FE
DR
38585
SALES COMPS MAP

© 2018 Greysteel / 20
Sales Comps Matrix
PROPERTY UNITSYEARBUILT
SALEDATE
SALE PRICE SALE PRICE
PER UNIT SALE PRICE
PER SF CAP RATE
DIST. TO SUBJECT (MILES)
1 Red Brick Apartments 17 1961 Apr-18 $3,190,000 $187,647 $248.73 5.74% 2.38
2 1208 Zephyr Street 6 1960 May-17 $1,025,000 $170,833 $225.27 7.02% 2.75
3 1475 S. Pierce Street 8 1951 Jan-17 $1,350,000 $168,750 $167.24 5.98% 2.06
4439 W. Nevada Place 9 1956 -- $1,500,000 $166,667 $233.64 6.53% --
4 Fenton Street Apartments 13 1961 Sep-17 $2,100,000 $161,538 $168.17 6.38% 2.52
Survey Average $2,112,830 $172,925 $211.45 6.33%
$0.00
$50.00
$100.00
$150.00
$200.00
$250.00
$300.00
$145,000
$150,000
$155,000
$160,000
$165,000
$170,000
$175,000
$180,000
$185,000
$190,000
Red BrickApartments
Survey Average 1208 Zephyr Street 1475 S. Pierce Street 4439 W. NevadaPlace
Fenton StreetApartments
Sale
Pric
e Pe
r SF
Sale
Pric
e Pe
r U
nit
Sale Price Per Unit Sale Price Per SF

© 2018 Greysteel / 21DOWNTOWN DENVER (3.6 MILES)

• Pricing Summary
• Rent Roll
• Unit Mix
• Historical/Projected Income & Expenses
• 10-Year Cash Flow
Financial Analysis

© 2018 Greysteel / 23
Pricing Summary
Purchase Price $1,500,000
Price PSF $233.64
Price Per Unit $166,667
Current Cap Rate 6.53%
Current GRM 10.79X
Current Cash-on-Cash 7.34%
Pro Forma Cap Rate 6.97%
Pro Forma GRM 10.29X
Pro Forma Cash-on-Cash 9.09%
Current NOI $97,955
Pro Forma NOI $104,517
No. Of Units 9
GSF 6,420 SF
Property Summary
Fee Simple Pricing Summary

© 2018 Greysteel / 24
Rent Roll
Unit Number
Unit Bedrooms
Unit Bathrooms
Unit SFCurrent
Rent
Annual Current
Rent
Current Rent/SF
Pro Forma Rent
Annual Pro Forma Rent
Pro Forma Rent/SF
4419 2 BDR 1 BA 625 SF $1,315 $15,780 $2.10 $1,350 $16,200 $2.16
4421 2 BDR 1 BA 625 SF $1,325 $15,900 $2.12 $1,350 $16,200 $2.16
4423 2 BDR 1 BA 625 SF $1,250 $15,000 $2.00 $1,350 $16,200 $2.16
4425 2 BDR 1 BA 625 SF $1,275 $15,300 $2.04 $1,350 $16,200 $2.16
4429 2 BDR 1 BA 625 SF $1,315 $15,780 $2.10 $1,350 $16,200 $2.16
4433 2 BDR 1 BA 625 SF $1,150 $13,800 $1.84 $1,350 $16,200 $2.16
4435 2 BDR 1 BA 625 SF $1,300 $15,600 $2.08 $1,350 $16,200 $2.16
4437 2 BDR 1 BA 625 SF $1,350 $16,200 $2.16 $1,350 $16,200 $2.16
4439 2 BDR 1 BA 625 SF $1,300 $15,600 $2.08 $1,350 $16,200 $2.16
Total / Wtd. Avg:
- - 625 SF $1,287 $138,960 $2.06 $1,350 $145,800 $2.16
© 2018 Greysteel / 25
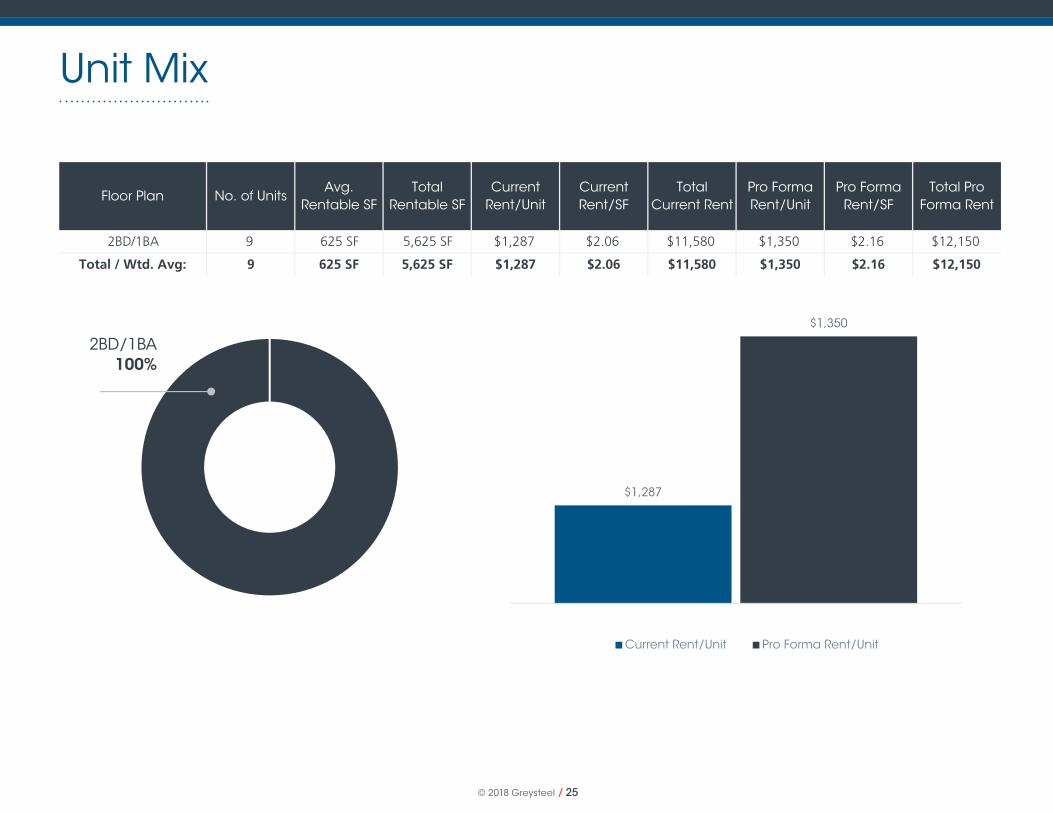
Unit Mix
Floor Plan No. of UnitsAvg.
Rentable SFTotal
Rentable SFCurrent
Rent/UnitCurrent Rent/SF
Total Current Rent
Pro Forma Rent/Unit
Pro Forma Rent/SF
Total Pro Forma Rent
2BD/1BA 9 625 SF 5,625 SF $1,287 $2.06 $11,580 $1,350 $2.16 $12,150
Total / Wtd. Avg: 9 625 SF 5,625 SF $1,287 $2.06 $11,580 $1,350 $2.16 $12,150
$1,287
$1,350
Current Rent/Unit Pro Forma Rent/Unit
2BD/1BA100%
© 2018 Greysteel / 26
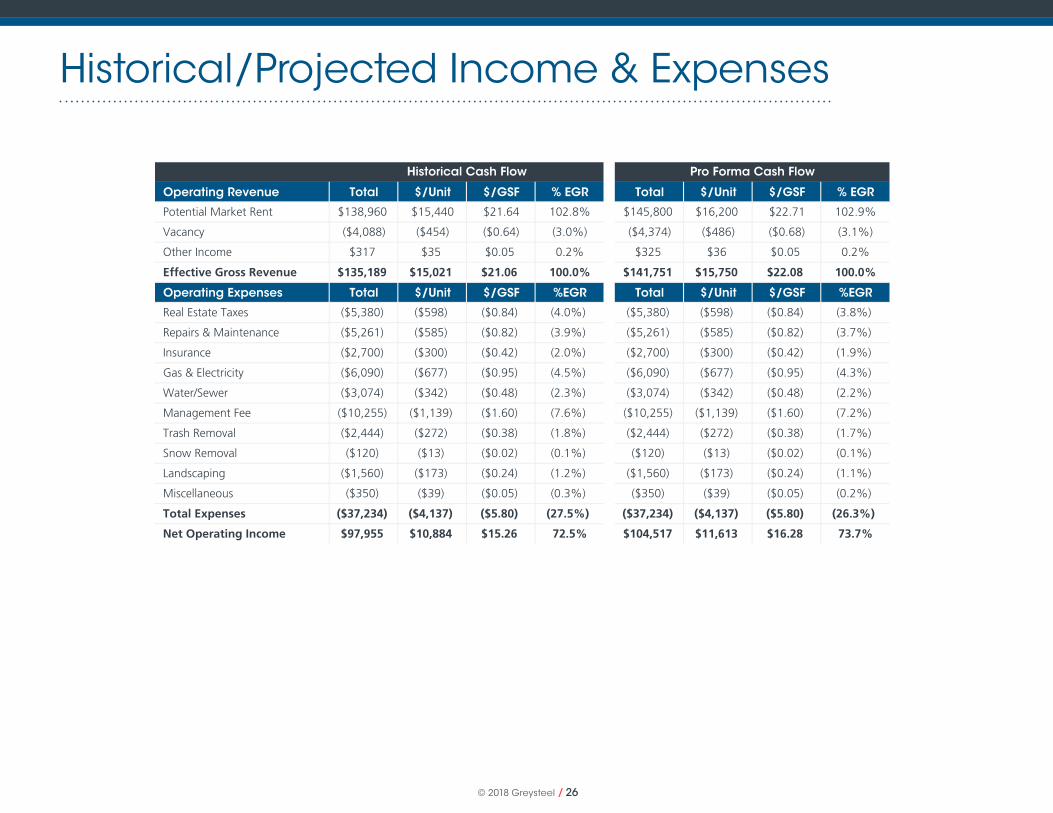
Historical/Projected Income & Expenses
Operating Revenue Total $/Unit $/GSF % EGR Total $/Unit $/GSF % EGR
Potential Market Rent $138,960 $15,440 $21.64 102.8% $145,800 $16,200 $22.71 102.9%
Vacancy ($4,088) ($454) ($0.64) (3.0%) ($4,374) ($486) ($0.68) (3.1%)
Other Income $317 $35 $0.05 0.2% $325 $36 $0.05 0.2%
Effective Gross Revenue $135,189 $15,021 $21.06 100.0% $141,751 $15,750 $22.08 100.0%
Operating Expenses Total $/Unit $/GSF %EGR Total $/Unit $/GSF %EGR
Real Estate Taxes ($5,380) ($598) ($0.84) (4.0%) ($5,380) ($598) ($0.84) (3.8%)
Repairs & Maintenance ($5,261) ($585) ($0.82) (3.9%) ($5,261) ($585) ($0.82) (3.7%)
Insurance ($2,700) ($300) ($0.42) (2.0%) ($2,700) ($300) ($0.42) (1.9%)
Gas & Electricity ($6,090) ($677) ($0.95) (4.5%) ($6,090) ($677) ($0.95) (4.3%)
Water/Sewer ($3,074) ($342) ($0.48) (2.3%) ($3,074) ($342) ($0.48) (2.2%)
Management Fee ($10,255) ($1,139) ($1.60) (7.6%) ($10,255) ($1,139) ($1.60) (7.2%)
Trash Removal ($2,444) ($272) ($0.38) (1.8%) ($2,444) ($272) ($0.38) (1.7%)
Snow Removal ($120) ($13) ($0.02) (0.1%) ($120) ($13) ($0.02) (0.1%)
Landscaping ($1,560) ($173) ($0.24) (1.2%) ($1,560) ($173) ($0.24) (1.1%)
Miscellaneous ($350) ($39) ($0.05) (0.3%) ($350) ($39) ($0.05) (0.2%)
Total Expenses ($37,234) ($4,137) ($5.80) (27.5%) ($37,234) ($4,137) ($5.80) (26.3%)
Net Operating Income $97,955 $10,884 $15.26 72.5% $104,517 $11,613 $16.28 73.7%
Historical Cash Flow Pro Forma Cash Flow

© 2018 Greysteel / 27
10-Year Cash Flow
At Close 2018 2019 2020 2021 2022 2023 2024 2025 2026 2027
Operating Cash Flow
Effective Gross Income $141,751 $146,004 $150,384 $154,895 $159,542 $164,328 $169,258 $174,336 $179,566 $184,953
Operating Expense ($37,234) ($37,979) ($38,738) ($39,513) ($40,303) ($41,109) ($41,932) ($42,770) ($43,626) ($44,498)
Net Operating Income $104,517 $108,025 $111,645 $115,382 $119,239 $123,219 $127,327 $131,566 $135,940 $140,455
Debt Service ($70,422) ($70,422) ($70,422) ($70,422) ($70,422) ($70,422) ($70,422) ($70,422) ($70,422) ($70,422)
Free Cash Flow $34,095 $37,602 $41,223 $44,960 $48,816 $52,797 $56,904 $61,143 $65,518 $70,032
Unlevered Investment Cash Flow
Total Cost ($1,500,000) - - - - - - - - - -
Net Cash Flow - $104,517 $108,025 $111,645 $115,382 $119,239 $123,219 $127,327 $131,566 $135,940 $140,455
Sales Price - - - - - - - - - - $1,821,249
Net Sale Proceeds - - - - - - - - - - $1,821,249
Unlevered Equity ($1,500,000) $104,517 $108,025 $111,645 $115,382 $119,239 $123,219 $127,327 $131,566 $135,940 $1,961,704
Levered Investment Cash Flow
Equity in ($375,000) - - - - - - - - - -
Net Cash Flow - $34,095 $37,602 $41,223 $44,960 $48,816 $52,797 $56,904 $61,143 $65,518 $70,032
Sales Price - - - - - - - - - - $1,821,249
Retire Perm Debt - - - - - - - - - - ($908,127)
Net Sale Proceeds - - - - - - - - - - $913,121
Levered Equity ($375,000) $34,095 $37,602 $41,223 $44,960 $48,816 $52,797 $56,904 $61,143 $65,518 $983,154
Returns
Return on Cost/Yield 7.0% 7.2% 7.4% 7.7% 7.9% 8.2% 8.5% 8.8% 9.1% 9.4%
Cash-on-Cash 9.1% 10.0% 11.0% 12.0% 13.0% 14.1% 15.2% 16.3% 17.5% 18.7%
DSCR 1.48x 1.53x 1.59x 1.64x 1.69x 1.75x 1.81x 1.87x 1.93x 1.99x

1001 Bannock Street • Suite 219 • Denver, CO 80204
303.390.1056 • www.greysteel.com
New York / Los Angeles / Dallas / Fort Worth Washington, D.C.* Philadelphia / Phoenix / Denver Baltimore / Norfolk
CO LICENSE NO: 100074465
*Corporate Headquarters and Transaction Services Center
© 2018 Greysteel