Embed Size (px)
Citation preview

Neutral theory:
The vast majority of observed sequence differences between members of a population are neutral (or close to neutral). These differences can be fixed in the population through random genetic drift. Some mutations are strongly counter selected (this is why there are patterns of conserved residues). Only very seldom is a mutation under positive selection.
The neutral theory does not say that all evolution is neutral and everything is only due to to genetic drift.

Nearly Neutral theory:
Even synonymous mutations do not lead to random composition but to codon bias. Small negative selection might be sufficient to produce the observed codon usage bias.

Motoo Kimura 1968Neutral TheoryGenetic Drift is main force for changing allele frequencies
How do you define evolution?
Richard Goldschmidt 1940hopeful monstersMutationism HGT/WGD!Punctuated EquilibriumFew genes / large effectVilified by Mayr, celebrated 1977 Gould & Evo-devo
Ernst Mayr 1942NeoDarwinian SynthesisNatural SelectionGradualismMany genes/small effectDario – “Fisher right”
Slide from Chris Pires
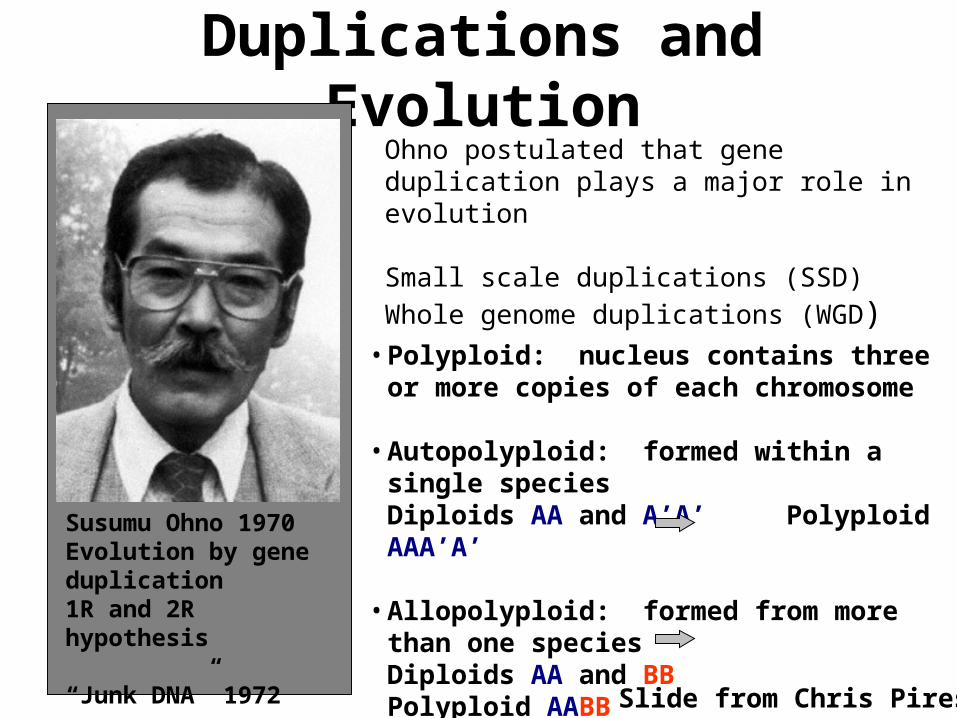
Duplications and EvolutionOhno postulated that gene duplication plays a major role in evolution
Small scale duplications (SSD)
Whole genome duplications (WGD)
• Polyploid: nucleus contains three or more copies of each chromosome
• Autopolyploid: formed within a single speciesDiploids AA and A’A’ Polyploid AAA’A’
• Allopolyploid: formed from more than one speciesDiploids AA and BB Polyploid AABB
Susumu Ohno 1970Evolution by gene duplication1R and 2R hypothesis
“Junk DNA” 1972Slide from Chris Pires

What is it good for?Gene duplication events can provide an outgroup that allows rooting a molecular phylogeny. Most famously this principle was applied in case of the tree of life – the only outgroup available in this case are ancient paralogs (see http://gogarten.uconn.edu/cvs/Publ_Pres.htm for more info).However, the same principle also is applicable to any group of organisms, where a duplication preceded the radiation (example).Lineage specific duplications also provide insights into which traits were important during evolution of a lineage.

e.g. gene duplications in yeastfrom Benner et al., 2002
Figure 1. The number of duplicated gene pairs (vertical axis) in the genome of the yeast Saccharomyces cerevisiae versus f2, a metric that models divergence
of silent positions in twofold redundant codon systems via an approach-to-equilibrium kinetic process and therefore acts as a logarithmic scale of the time since the duplications occurred. Recent duplications are represented by bars at the right. Duplications that diverged so long ago that equilibrium at the silent sites has been reached are represented by bars where f2 0.55. Noticeable are episodes
of gene duplication between the two extremes, including a duplication at f2
0.84. This represents the duplication, at ~80 Ma, whereby yeast gained its ability to ferment sugars found in fruits created by angiosperms. Also noticeable are recent duplications of genes that enable yeast to speed DNA synthesis, protein synthesis, and malt degradation, presumably representing yeast's recent interaction with humans.
The chemical pathway that converts glucose to alcohol in yeast arose ~80 Ma, near the time that fermentable fruits became dominant. Gene families that suffered duplication near this time, captured in the episode of gene duplication represented in the histogram in Fig. 1 by bars at f2
0.84, are named in red. According to the hypothesis, this pathway became useful to yeast when angiosperms (flowering, fruiting plants) began to provide abundant sources of fermentable sugar in their fruits.

the gradualist point of viewEvolution occurs within populations where the fittest organisms have a selective advantage. Over time the advantages genes become fixed in a population and the population gradually changes.
Note: this is not in contradiction to the the theory of neutral evolution. (which says what ?)
Processes that MIGHT go beyond inheritance with variation and selection? • Horizontal gene transfer and recombination • Polyploidization (botany, vertebrate evolution) see here or here• Fusion and cooperation of organisms (Kefir, lichen, also the eukaryotic cell) • Targeted mutations (?), genetic memory (?) (see Foster's and Hall's reviews on
directed/adaptive mutations; see here for a counterpoint) • Random genetic drift • Gratuitous complexity • Selfish genes (who/what is the subject of evolution??) • Parasitism, altruism, Morons • Evolutionary capacitors• Hopeless monsters (in analogy to Goldschmidt’s hopeful monsters)

Gene Transfer, Sex, and Recombination:• Inventions do not need to be made sequentially• Gene transfer, followed by homologous or non-homologous
recombination, allows inventions to be shared across the tree of life

Aside: Gene and genome duplication versus
Horizontal Gene Transfer
Autochtonous gene/genome duplication are rare in prokaryotes
Gene family expansion through horizontal gene transfer –the most common process in prokaryotes

Horizontal Gene Transfer (HGT) and the Acquisition of New Capabilities
• Most important process to adapt microorganisms to new environments.E.g.: Antibiotic and heavy metal resistance, pathways that allow acquisition and breakdown of new substrates.
• Creation of new metabolic pathways.
• HGT not autochthonous gene duplication is the main process of gene family expansion in prokaryotes.
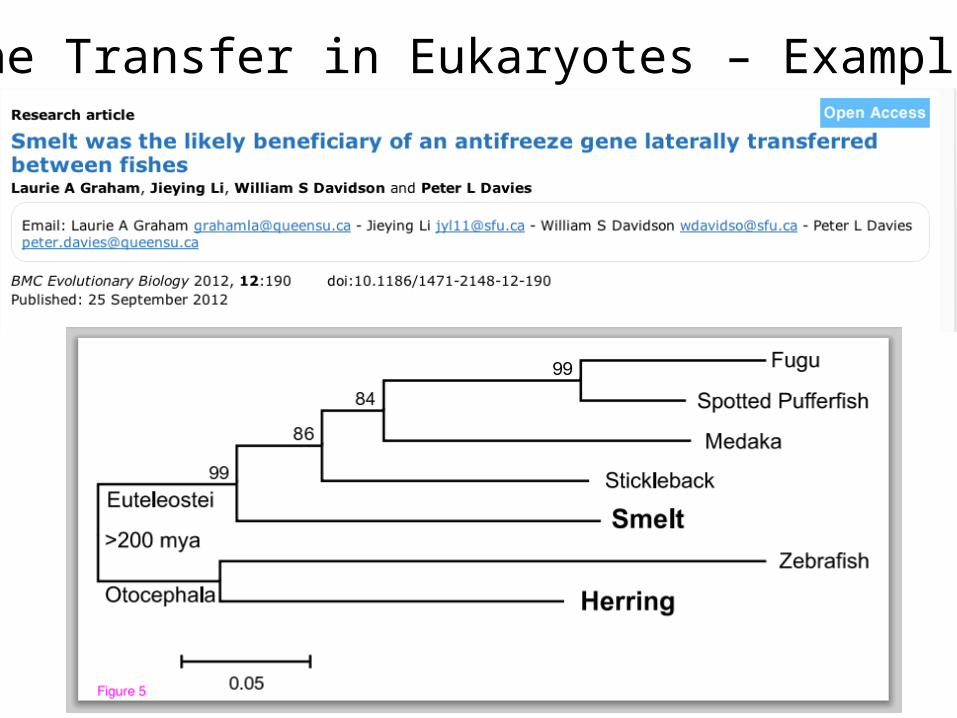
• Also important in the recent evolution of multicellular eukaryotes (HGT between fish species and between grasses).
Selection acts on the Holobiont (= Host + Symbionts) • To adapt to new conditions, new symbionts can be acquired, or existing symbionts
can acquire new genes through HGT.

Gene Transfer in Eukaryotes
Bacterial parasites on red algae
HGT Human gut symbiont

Gene Transfer in Eukaryotes – Example 2
Eric H. Roalson Current Biology Vol 22 No 5 R162
Curr Biol. 2012 Mar 6;22(5):445-9. Epub 2012 Feb 16.
Adaptive Evolution of C(4) Photosynthesisthrough Recurrent Lateral Gene Transfer.Christin PA, Edwards EJ, Besnard G, Boxall SF, Gregory R, Kellogg EA,
Hartwell J, Osborne CP.
Highlights • Key genes for C4 photosynthesis were transmitted between distantly
related grasses • These genes contributed to the adaptation of the primary metabolism • Their transmission was independent from most of the genome

Gene Transfer in Eukaryotes – Example 2
Fro
m: C
hris
tin P
A, E
dw
ard
s E
J, B
esn
ard
G,
Bo
xall
SF,
Gre
gor
y R
, Ke
llog
g E
A, H
artw
ell
J,
Osb
orn
e C
P.A
dapt
ive
Evo
lutio
n of
C(4
) P
hoto
synt
hesi
sth
roug
h R
ecur
rent
Lat
eral
Gen
e T
rans
fer.
Cur
r B
iol.
2012
Mar
6;2
2(5)
:445
-9.
Epu
b 20
12 F
eb 1
6.
Gene Transfer in Eukaryotes – Example 3

HGT as a force creating new pathways

HGT as a force creating new pathways – Example I
Acetoclastic Methanogenesis
Unique to subset of Archaea Energy production via reduction
of multiple carbon substrates to CH4
900 Million metric tons of biogenic methane produced annually.
Over 66% of biogenic methane is produced from acetate, mostly by Methanosarcina genera.
From: Galagan et al., 2002Fournier and Gogarten (2008) Evolution of Acetoclastic Methanogenesis in Methanosarcina via Horizontal Gene Transfer from Cellulolytic Clostridia. J. Bacteriol. 190(3):1124-7

Clostridia acetigenic pathway
Methanosarcina acetoclastic pathway
Figures drawn with Metacyc (www.metacyc.org)
PtaAPtaA
AckA
AckA
HGT

HGT as a force creating new pathways – Example 2
Oxygen producing photosynthesis

A heterologous fusion model for the evolution of oxygenic photosynthesis based on phylogenetic analysis.
Xiong J et al. PNAS 1998;95:14851-14856
©1998 by National Academy of Sciences

oxaloacetate
acetyl-CoA
citrate
malate
fumarate
isocitrate
succinate
succinyl-CoA
propionyl-CoA
3-methylmalyl-CoA
2-oxoglutarate
glutamate
methylaspartate
mesaconyl-CoA
mesaconate
glyoxylate
acetyl-CoACO2
CO2
Polyhydroxybutyrate
Lysine, leucine
Acetate
Fatty acids
Alcohols
Proteins
Poly-γ -glutamate
γ-Glutamylcystein
Osmoadaptation
HGT as a force creating new pathways – Example 3
Acetyl-CoA Assimilation: Methylaspartate Cycle
Khomyakova, Bükmez, Thomas, Erb, Berg, Science, 2011
oxaloacetate
acetyl-CoA
citrate
malate
fumarate
isocitrate
succinatesuccinyl-CoA
2-oxoglutarate
glyoxylate
acetyl-CoA
CO2
CO2
acetyl-CoA
crotonyl-CoA
ethylmalonyl-CoA
methylsuccinyl-CoA
mesaconyl-CoA
3-methylmalyl-CoA
propionyl-CoA
succinyl-CoA
glyoxylate
malate
acetyl-CoA
acetyl-CoACO2
CO2
oxaloacetate
acetyl-CoA
citrate
malate
fumarate
isocitrate
succinate
succinyl-CoA
propionyl-CoA
3-methylmalyl-CoA
2-oxoglutarate
glutamate
methylaspartate
mesaconyl-CoA
mesaconate
glyoxylate
acetyl-CoA
CO2
CO2
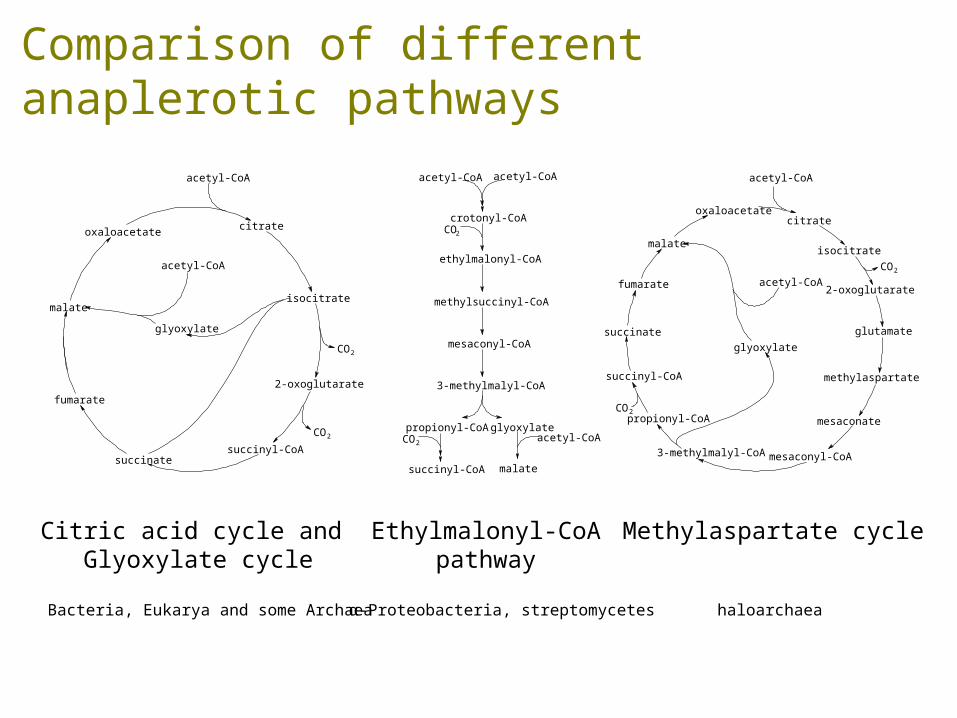
Comparison of different anaplerotic pathways
Citric acid cycle and Glyoxylate cycle
Ethylmalonyl-CoApathway
Methylaspartate cycle
Bacteria, Eukarya and some Archaea α-Proteobacteria, streptomycetes haloarchaea

Khomyakova, Bükmez, Thomas, Erb, Berg, Science, 2011
HaloarchaeaHaloarcula marismortui,Natrialba magadii
oxaloacetate
acetyl-CoA
citrate
malate
succinyl-CoA
propionyl-CoA
3-m ethylmalyl-CoA
2-oxoglutarate
glutamate
methylaspartate
mesaconyl-CoA
mesaconate
glyoxylate
CO 2
Biosynthesis
HCO 3-
acetyl-CoA
crotonyl-CoA
ethylmalonyl-CoA
3-methylmalyl-CoA
propionyl-CoA
succinyl-CoA
glyoxylate
malate
HCO 3-
CO 2
acetyl-CoAacetyl-CoA
acetyl-CoA
BiosynthesisBiosynthesis
HGT as a force creating new pathways – Example 3
Acetyl-CoA Assimilation: methylaspartate cycle
Propionate assimilation
Acetate assimilation, Bacteria
Glutamate fermentation,
Bacteria

selection versus drift
The larger the population the longer it takes for an allele to become fixed. Note: Even though an allele conveys a strong selective advantage of 10%, the allele has a rather large chance to go extinct. Note#2: Fixation is faster under selection than under drift.

If one waits long enough, one of two alleles with equal fitness will be fixed

Time till fixation depends on population size

s=0Probability of fixation, P, is equal to frequency of allele in population. Mutation rate (per gene/per unit of time) = u ; freq. with which allele is generated in diploid population size N =u*2N Probability of fixation for each allele = 1/(2N)
Substitution rate = frequency with which new alleles are generated * Probability of fixation= u*2N *1/(2N) = u = Mutation rate Therefore: If f s=0, the substitution rate is independent of population size, and equal to the mutation rate !!!! (NOTE: Mutation unequal Substitution! )This is the reason that there is hope that the molecular clock might sometimes work.
Fixation time due to drift alone: tav=4*Ne generations
(Ne=effective population size; For n discrete generations
Ne= n/(1/N1+1/N2+…..1/Nn)


N=50 s=0.1 50 replicates

s>0
Time till fixation on average: tav= (2/s) ln (2N) generations
(also true for mutations with negative “s” ! discuss among yourselves)
E.g.: N=106, s=0: average time to fixation: 4*106 generationss=0.01: average time to fixation: 2900 generations
N=104, s=0: average time to fixation: 40.000 generationss=0.01: average time to fixation: 1.900 generations
=> substitution rate of mutation under positive selection is larger than the rate wite which neutral mutations are fixed.

Random Genetic Drift SelectionA
llele
freq
ue
ncy
0
100
advantageous
disadvantageous
Modified from from www.tcd.ie/Genetics/staff/Aoife/GE3026/GE3026_1+2.ppt

Positive selection (s>0)• A new allele (mutant) confers some increase in the
fitness of the organism
• Selection acts to favour this allele
• Also called adaptive selection or Darwinian selection.
NOTE: Fitness = ability to survive and reproduce
Modified from from www.tcd.ie/Genetics/staff/Aoife/GE3026/GE3026_1+2.ppt

Advantageous allele
Herbicide resistance gene in nightshade plant
Modified from from www.tcd.ie/Genetics/staff/Aoife/GE3026/GE3026_1+2.ppt
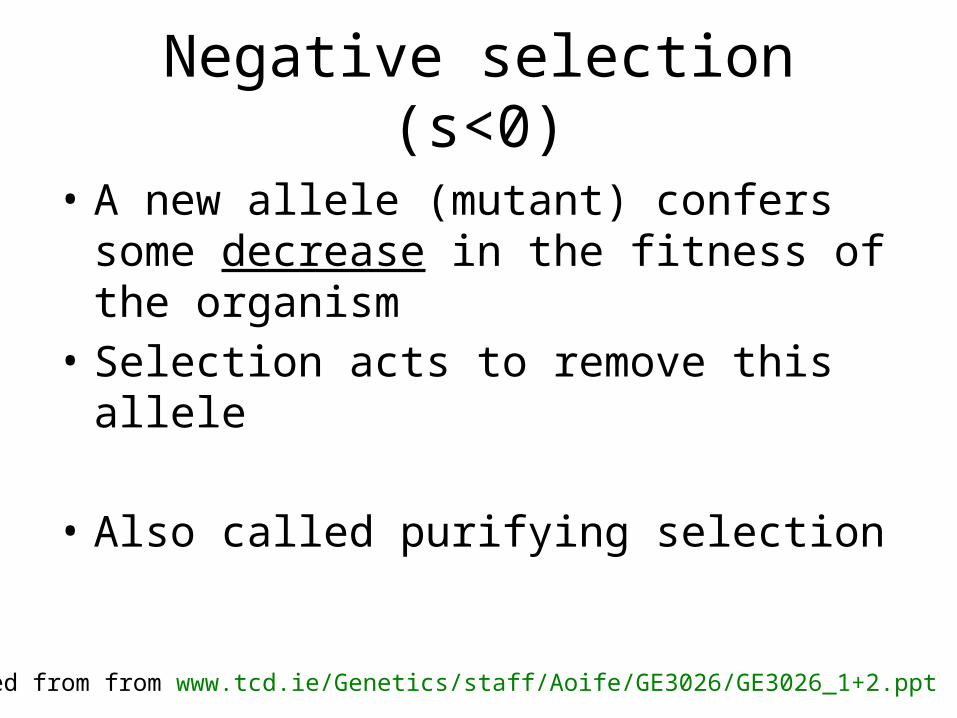
Negative selection (s<0)
• A new allele (mutant) confers some decrease in the fitness of the organism
• Selection acts to remove this allele
• Also called purifying selection
Modified from from www.tcd.ie/Genetics/staff/Aoife/GE3026/GE3026_1+2.ppt

Deleterious alleleHuman breast cancer gene, BRCA2
Normal (wild type) allele
Mutant allele(Montreal 440Family)
4 base pair deletionCauses frameshift
Stop codon
5% of breast cancer cases are familialMutations in BRCA2 account for 20% of familial cases
Modified from from www.tcd.ie/Genetics/staff/Aoife/GE3026/GE3026_1+2.ppt

Neutral mutations
• Neither advantageous nor disadvantageous• Invisible to selection (no selection)• Frequency subject to ‘drift’ in the population• Random drift – random changes in small
populations
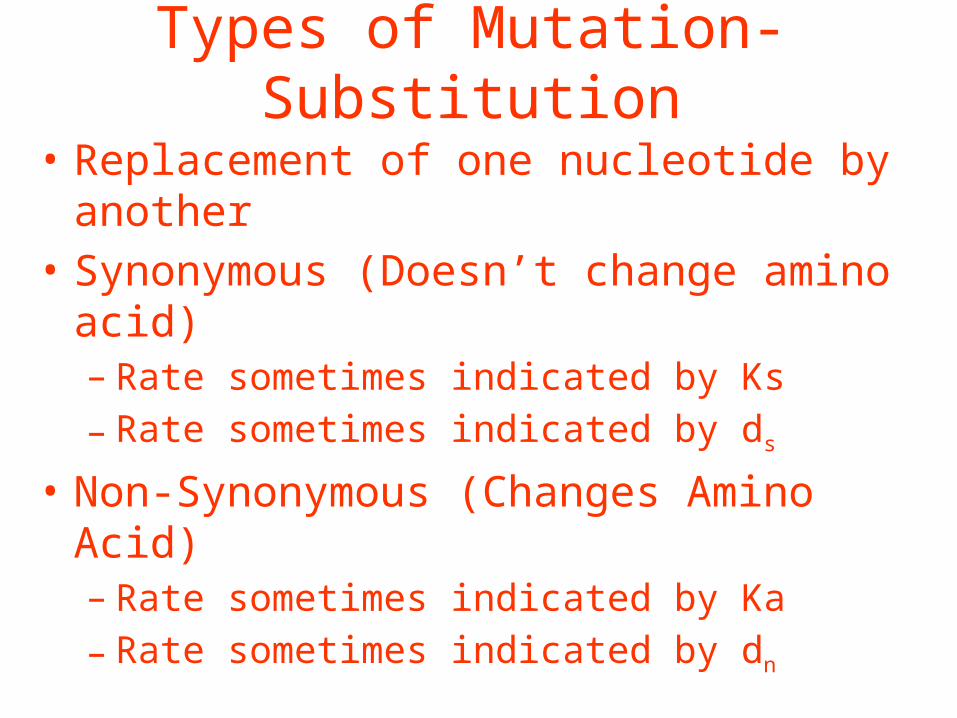
Types of Mutation-Substitution
• Replacement of one nucleotide by another• Synonymous (Doesn’t change amino acid)
– Rate sometimes indicated by Ks
– Rate sometimes indicated by ds
• Non-Synonymous (Changes Amino Acid)– Rate sometimes indicated by Ka
– Rate sometimes indicated by dn
(this and the following 4 slides are from mentor.lscf.ucsb.edu/course/ spring/eemb102/lecture/Lecture7.ppt)
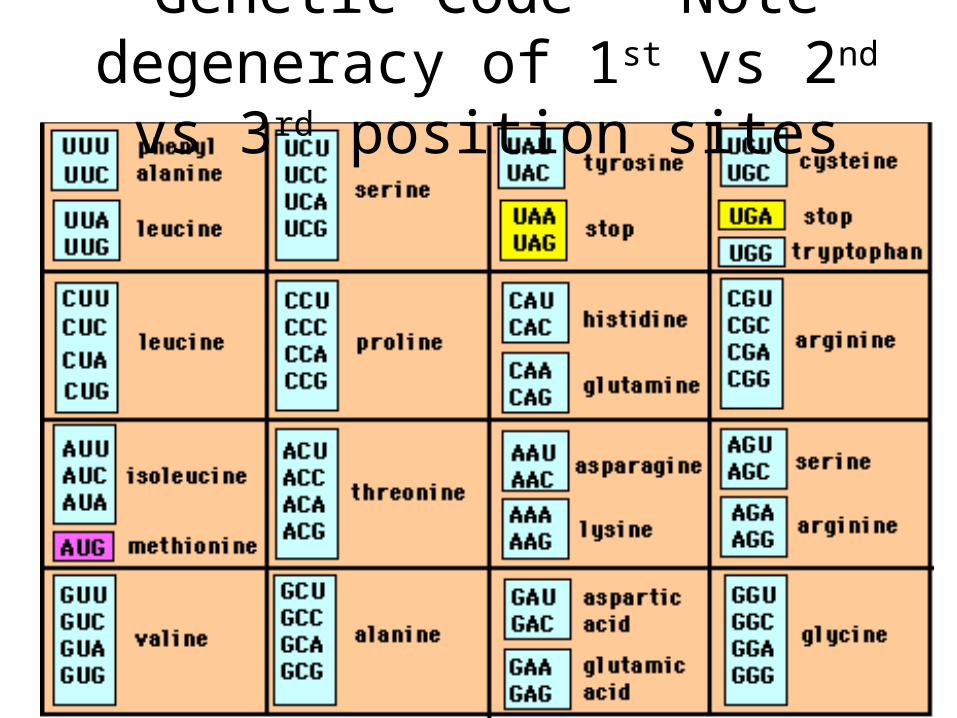
Genetic Code – Note degeneracy of 1st vs 2nd vs 3rd position sites
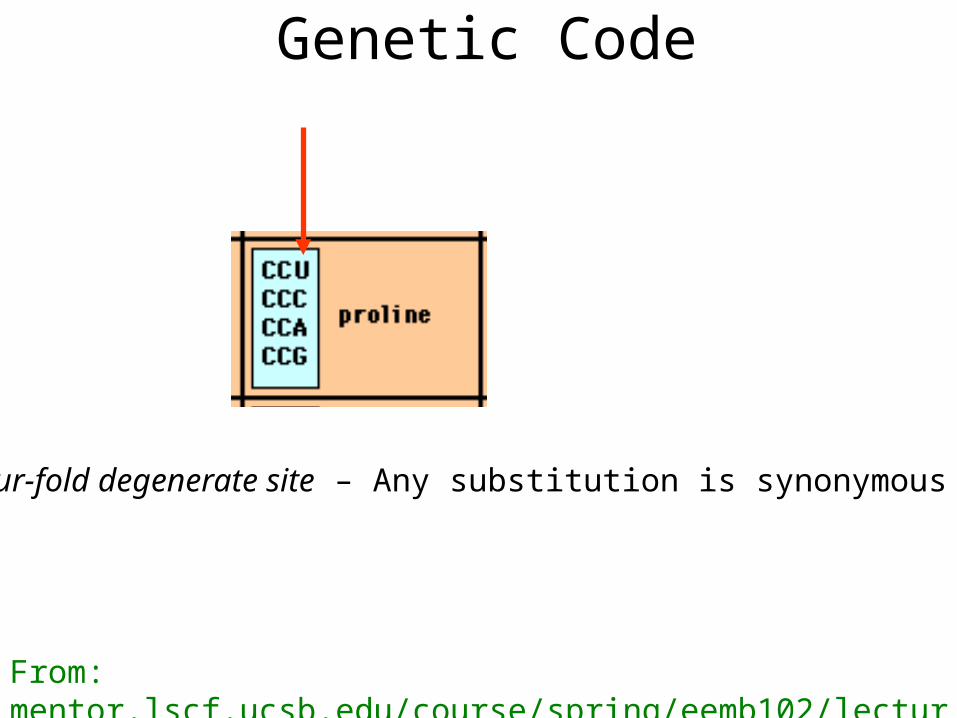
Genetic Code
Four-fold degenerate site – Any substitution is synonymous
From: mentor.lscf.ucsb.edu/course/spring/eemb102/lecture/Lecture7.ppt

Genetic Code
Two-fold degenerate site – Some substitutions synonymous, some non-synonymous
From: mentor.lscf.ucsb.edu/course/spring/eemb102/lecture/Lecture7.ppt

Degeneracy of 1st vs 2nd vs 3rd position sites results in 25.5% synonymous changes and 74.5% non synonymous changes (Yang&Nielsen,1998).
Genetic Code

Measuring Selection on Genes
• Null hypothesis = neutral evolution• Under neutral evolution, synonymous changes
should accumulate at a rate equal to mutation rate• Under neutral evolution, amino acid substitutions
should also accumulate at a rate equal to the mutation rate
From: mentor.lscf.ucsb.edu/course/spring/eemb102/lecture/Lecture7.ppt

Counting #s/#a Ser Ser Ser Ser Ser Species1 TGA TGC TGT TGT TGT
Ser Ser Ser Ser Ala Species2 TGT TGT TGT TGT GGT
#s = 2 sites #a = 1 site
#a/#s=0.5
Modified from: mentor.lscf.ucsb.edu/course/spring/eemb102/lecture/Lecture7.ppt
To assess selection pressures one needs to calculate the rates (Ka, Ks), i.e. the occurring substitutions as a fraction of the possible syn. and nonsyn. substitutions.
Things get more complicated, if one wants to take transition transversion ratios and codon bias into account. See chapter 4 in Nei and Kumar, Molecular Evolution and Phylogenetics.

Testing for selection using dN/dS ratio
dN/dS ratio (aka Ka/Ks or ω (omega) ratio) where
dN = number of non-synonymous substitutions / number of possible non-synonymous substitutions
dS =number of synonymous substitutions / number of possible non-synonymous substitutions
dN/dS >1 positive, Darwinian selection
dN/dS =1 neutral evolution
dN/dS <1 negative, purifying selection

dambeTwo programs worked well for me to align nucleotide sequences based on the amino acid alignment, One is seaview, the other is DAMBE (only for windows). This is a handy program for a lot of things, including reading a lot of different formats, calculating phylogenies, it even runs codeml (from PAML) for you.
The procedure is not straight forward, but is well described on the help pages. After installing DAMBE go to HELP -> general HELP -> sequences -> align nucleotide sequences based on …->
If you follow the instructions to the letter, it works fine.
DAMBE also calculates Ka and Ks distances from codon based aligned sequences.

dambe (cont)
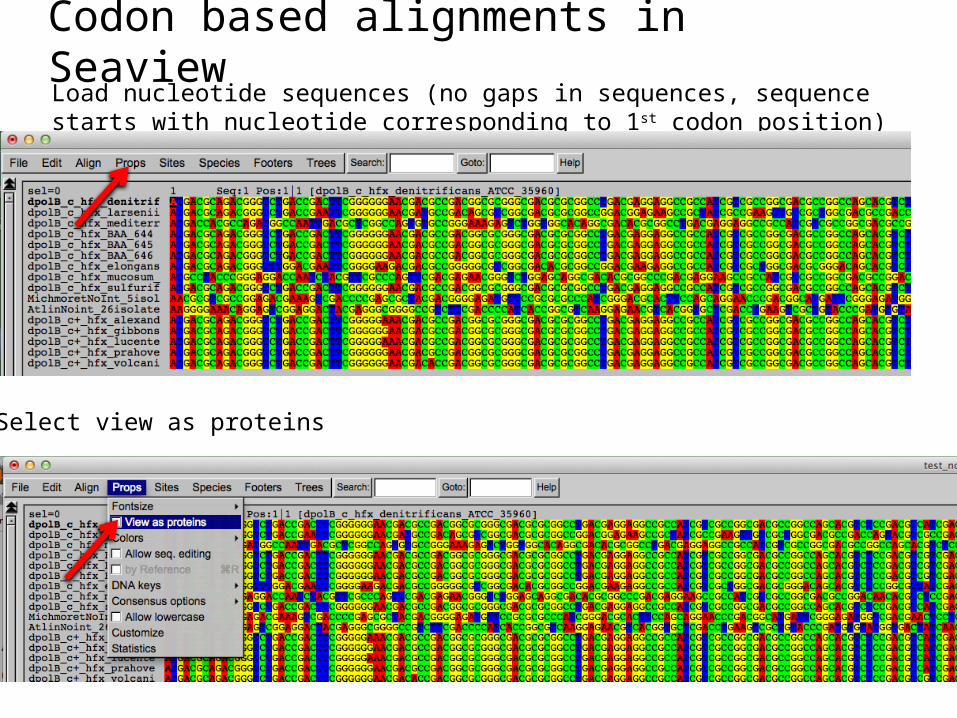
Codon based alignments in SeaviewLoad nucleotide sequences (no gaps in sequences, sequence starts with nucleotide corresponding to 1st codon position)
Select view as proteins
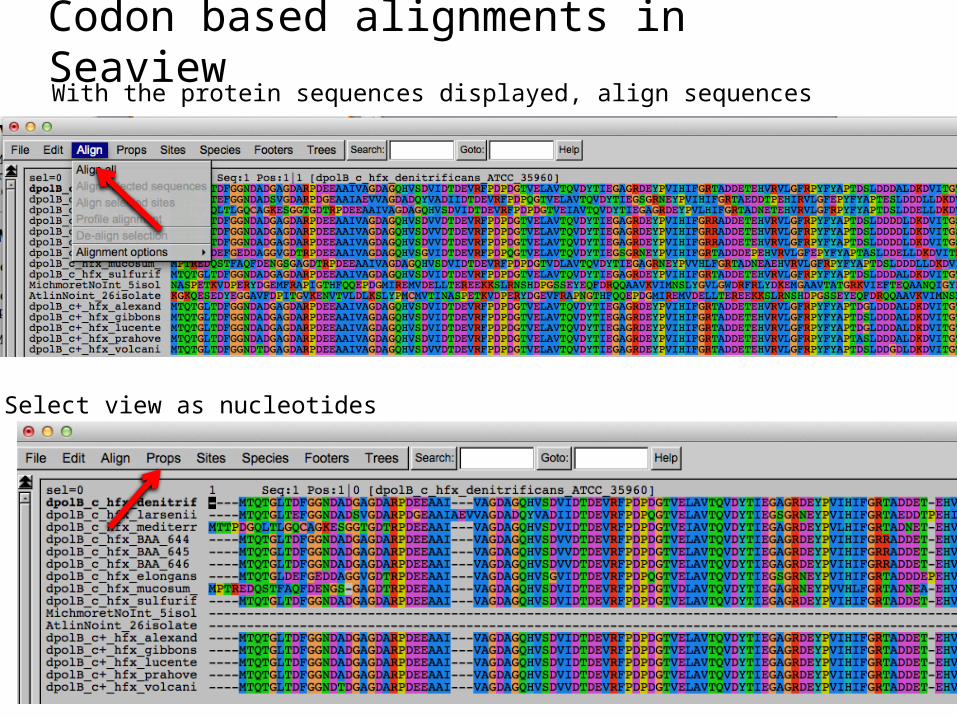
Codon based alignments in SeaviewWith the protein sequences displayed, align sequences
Select view as nucleotides
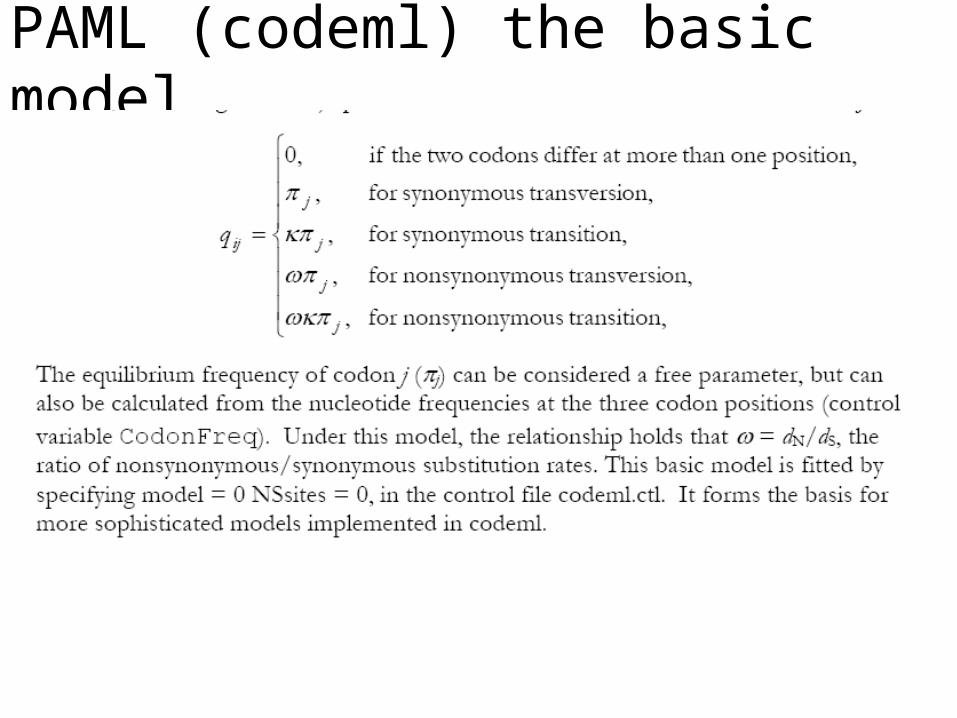
PAML (codeml) the basic model
sites versus branchesYou can determine omega for the whole dataset; however, usually not all sites in a sequence are under selection all the time.
PAML (and other programs) allow to either determine omega for each site over the whole tree, ,or determine omega for each branch for the whole sequence, .
It would be great to do both, i.e., conclude codon 176 in the vacuolar ATPases was under positive selection during the evolution of modern humans – alas, a single site does not provide much statistics ….

Sites model(s) work great have been shown to work great in few instances. The most celebrated case is the influenza virus HA gene.
A talk by Walter Fitch (slides and sound) on the evolution ofthis molecule is here .This article by Yang et al, 2000 gives more background on ml aproaches to measure omega. The dataset used by Yang et al is here: flu_data.paup .

sites model in MrBayes
begin mrbayes; set autoclose=yes; lset nst=2 rates=gamma nucmodel=codon omegavar=Ny98; mcmcp samplefreq=500 printfreq=500; mcmc ngen=500000; sump burnin=50; sumt burnin=50; end;
The MrBayes block in a nexus file might look something like this:


plot LogL to determine which samples to ignore
the same after rescaling the y-axis

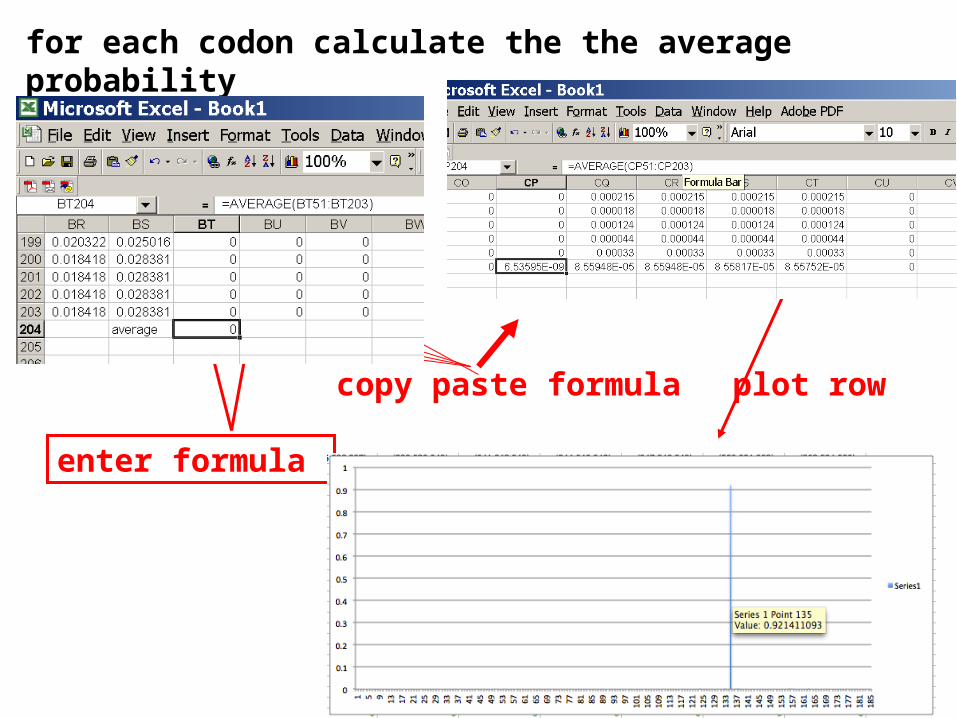
for each codon calculate the the average probability
enter formula
copy paste formula plot row

To determine credibility interval for a parameter (here omega<1):
Select values for the parameter, sampled after the burning.
Copy paste to a new spreadsheet,

• Sort values according to size,
• Discard top and bottom 2.5%
• Remainder gives 95% credibility interval.

Purifying selection in GTA genes
dN/dS <1 for GTA genes has been used to infer selection for function
GTA genes
Lang AS, Zhaxybayeva O, Beatty JT. Nat Rev Microbiol. 2012 Jun 11;10(7):472-82
Lang, A.S. & Beatty, J.T. Trends in Microbiology , Vol.15, No.2 , 2006

Purifying selection in E.coli ORFans
dN-dS < 0 for some ORFan E. coli clusters seems to suggest they are functional genes.
Adapted after Yu, G. and Stoltzfus, A. Genome Biol Evol (2012) Vol. 4 1176-1187
Gene groups Number dN-dS>0 dN-dS<0 dN-dS=0
E. coli ORFan clusters 3773 944 (25%) 1953 (52%) 876 (23%)
Clusters of E.coli sequences found in Salmonella sp., Citrobacter sp.
610 104 (17%) 423(69%) 83 (14%)
Clusters of E.coli sequences found in some Enterobacteriaceae only
373 8 (2%) 365 (98%) 0 (0%)

Vincent Daubin and Howard Ochman: Bacterial Genomes as New Gene Homes: The Genealogy of ORFans in E. coli. Genome Research 14:1036-1042, 2004
The ratio of non-synonymous to synonymous substitutions for genes found only in the E.coli - Salmonella clade is lower than 1, but larger than for more widely distributed genes.
Fig. 3 from Vincent Daubin and Howard Ochman, Genome Research 14:1036-1042, 2004
Increasing phylogenetic depth
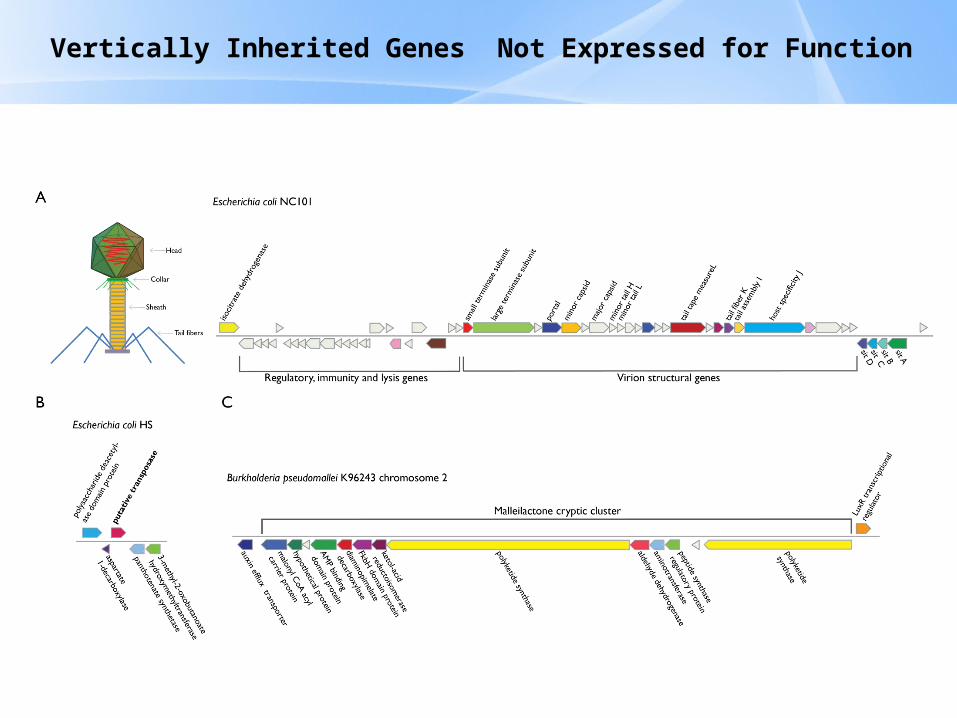
Vertically Inherited Genes Not Expressed for Function

Counting Algorithm
Calculate number of different nucleotides/amino acids per
MSA column (X)
Calculate number of nucleotides/amino acids
substitutions (X-1)
Calculate number of synonymous changes
S=(N-1)nc-N
assuming N=(N-1)aa
1 non-synonymous change
X=2 1 nucleotide substitution
X=2 1 amino acid substitution

Simulation Algorithm
Calculate MSA nucleotide frequencies (%A,%T,%G,%C)
Introduce a given number of random substitutions ( at any
position) based on inferred base frequencies
Compare translated mutated codon with the initial
translated codon and count synonymous and non-
synonymous substitutions

Evolution of Coding DNA Sequences Under a Neutral ModelE. coli Prophage Genes
Probability distribution
Count distribution
Non-synonymous
Synonymous
n= 90k= 24p=0.763P(≤24)=3.63E-23
Observed=24P(≤24) < 10-6
n= 90k= 66p=0.2365P(≥66)=3.22E-23
Observed=66P(≥66) < 10-6
n=90
n=90

Probability distribution
Count distribution
Synonymous
Synonymousn= 723k= 498p=0.232P(≥498)=6.41E-149
n= 375k= 243p=0.237P(≥243)=7.92E-64
Observed=498P(≥498) < 10-6
Observed=243P(≥243) < 10-6
n=723
n=375
Evolution of Coding DNA Sequences Under a Neutral ModelE. coli Prophage Genes

Our values well under the p=0.01 threshold suggest we can reject the null hypothesis of neutral evolution of prophage sequences.
Evolution of Coding DNA Sequences Under a Neutral ModelE. coli Prophage Genes
OBSERVED SIMULATED DnaparsSimulated Codeml
Gene
Alignment
Length (bp)
Substitutions
Synonymous changes*
Substitutions
p-value synonymous (given
*)
Minimum number of substitutio
ns dN/dS dN/dSMajor capsid 1023 90 66 90 3.23E-23 94 0.113 0.13142Minor capsid C
132981 59 81 1.98E-19 84 0.124 0.17704
Large terminase subunit
192375 67 75 7.10E-35 82 0.035 0.03773
Small terminase subunit
543100 66 100 1.07E-19 101 0.156 0.25147
Portal 1599 55 46 55 1.36E-21 *64 0.057 0.08081Protease 1329 55 37 55 4.64E-11 55 0.162 0.24421Minor tail H 2565 260 168 260 1.81E-44 260 0.17 0.30928Minor tail L 696 30 26 30 1.30E-13 30 0.044 0.05004Host specificity J
3480723 498 723 6.42E-149 *773 0.137 0.17103
Tail fiber K 741 41 28 41 1.06E-09 44 0.14 0.18354Tail assembly I
66939 33 39 3.82E-15 40 0.064 0.07987
Tail tape measure protein
2577375 243 375 7.92E-64 378 0.169 0.27957

Evolution of Coding DNA Sequences Under a Neutral ModelB. pseudomallei Cryptic Malleilactone Operon Genes and
E. coli transposase sequencesOBSERVED SIMULATED
GeneAlignment
Length (bp) SubstitutionsSynonymous
changes* Substitutions
p-value synonymous
(given *)
Aldehyde dehydrogenase 1544 13 3 13 4.67E-04
AMP- binding protein 1865 9 6 9 1.68E-02
Adenosylmethionine-8-amino-7-oxononanoate aminotransferase 1421 20 12 20 6.78E-04Fatty-acid CoA ligase 1859 13 2 13 8.71E-01Diaminopimelate decarboxylase 1388 7 3 7 6.63E-01Malonyl CoA-acyl transacylase 899 2 1 2 4.36E-01
FkbH domain protein 1481 17 9 17 2.05E-02
Hypothethical protein 431 3 2 3 1.47E-01Ketol-acid reductoisomerase 1091 2 0 2 1.00E+00Peptide synthase regulatory protein 1079 10 5 10 8.91E-02
Polyketide-peptide synthase 12479 135 66 135 4.35E-27
OBSERVED SIMULATED
GeneAlignment
Length (bp) SubstitutionsSynonymous
changes* Substitutions
p-value synonymous
(given *)
Putative transposase 903 175 107 175 1.15E-29

Trunk-of-my-car analogy: Hardly anything in there is the is the result of providing a selective advantage. Some items are removed quickly (purifying selection), some are useful under some conditions, but most things do not alter the fitness.
Could some of the inferred purifying selection be due to the acquisition of novel detrimental characteristics (e.g., protein toxicity, HOPELESS MONSTERS)?
Other ways to detect positive selection
Selective sweeps -> fewer alleles present in population (see contributions from archaic Humans for example)
Repeated episodes of positive selection -> high dN

Variant arose about 5800 years ago

The age of haplogroup D was found to be ~37,000 years