Embed Size (px)
Citation preview

Neuronal Preservation in MS
James D. Bowen, MD
Medical Director, Multiple Sclerosis Center
Swedish Neuroscience Institute
Seattle, Washington

Case
• 38-year-old woman
– 2008: optic neuritis
– 2009: numbness in right leg; MRI abnormal
– Diagnosed with MS and started on interferon beta-1a SQ 3 x week
• Patient is now concerned about possible brain atrophy and what can be done to stop it

Dichotomy of MS Damage
• Inflammation
– Acute
– Prominent immune component
• Degeneration
– Chronic
– Little immune component
Bramow S, et al. Brain. 2010;133:2983-2988.

Acute Inflammation
Enhancement: BBB leakage
Focal tissue loss: black holes
Slide courtesy of Dr. James D. Bowen.Abbreviation: BBB, blood brain barrier.
T1 image with gadolinium
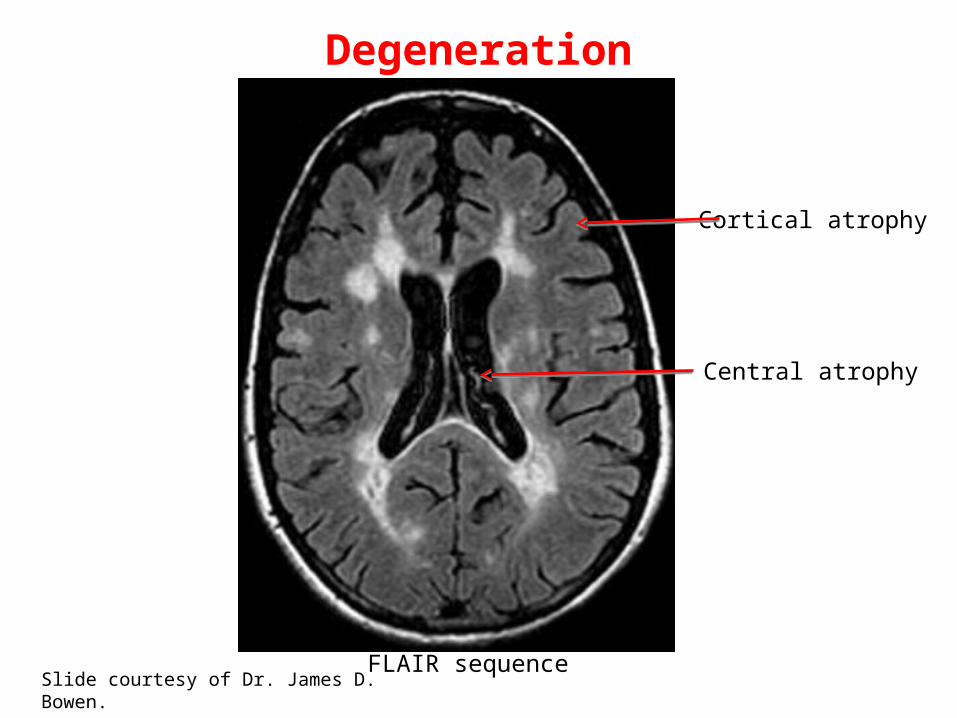
Degeneration
Cortical atrophy
Central atrophy
Slide courtesy of Dr. James D. Bowen.FLAIR sequence

Sym
ptom
s
MRI
Atrophy/degeneration
Clinical symptoms
RRMS SPMS
Disease Course in MS
Spain RI, et al. BMC Med. 2009;7:74. Slide courtesy of Dr. James D. Bowen.
Abbreviations: MRI, magnetic resonance imaging; RRMS, relapsing-remitting MS;SPMS, secondary-progressive MS.
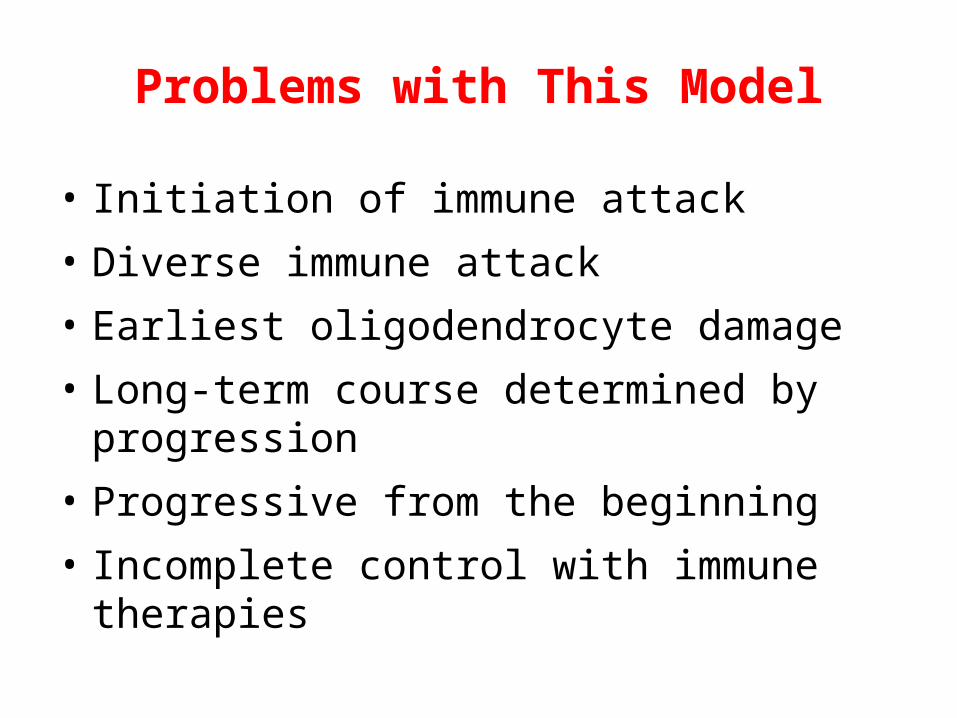
Problems with This Model
• Initiation of immune attack
• Diverse immune attack
• Earliest oligodendrocyte damage
• Long-term course determined by progression
• Progressive from the beginning
• Incomplete control with immune therapies
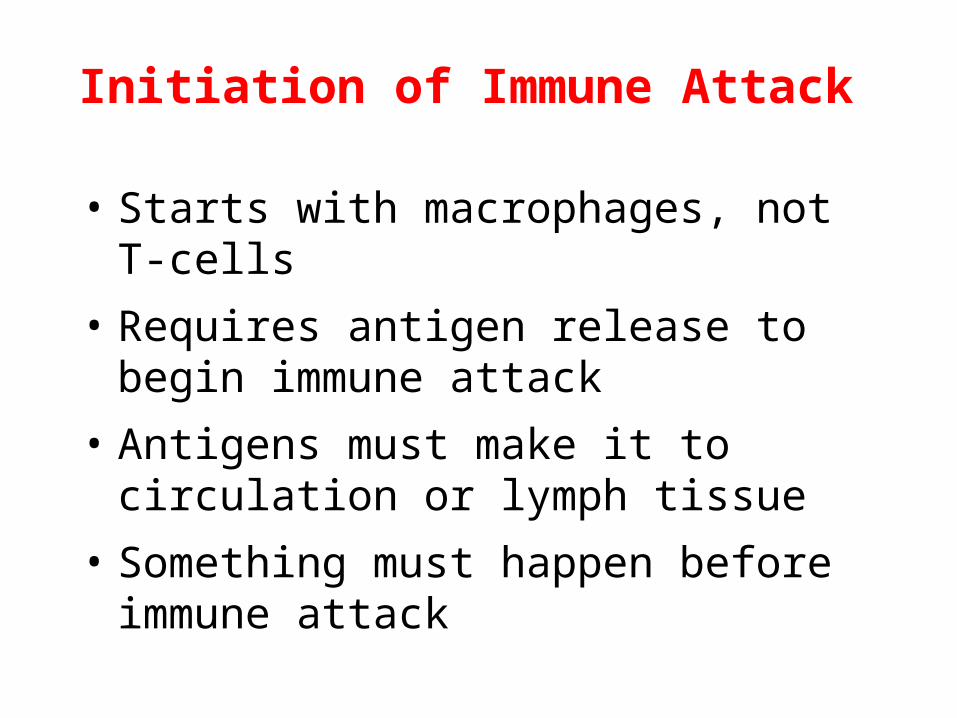
Initiation of Immune Attack
• Starts with macrophages, not T-cells
• Requires antigen release to begin immune attack
• Antigens must make it to circulation or lymph tissue
• Something must happen before immune attack
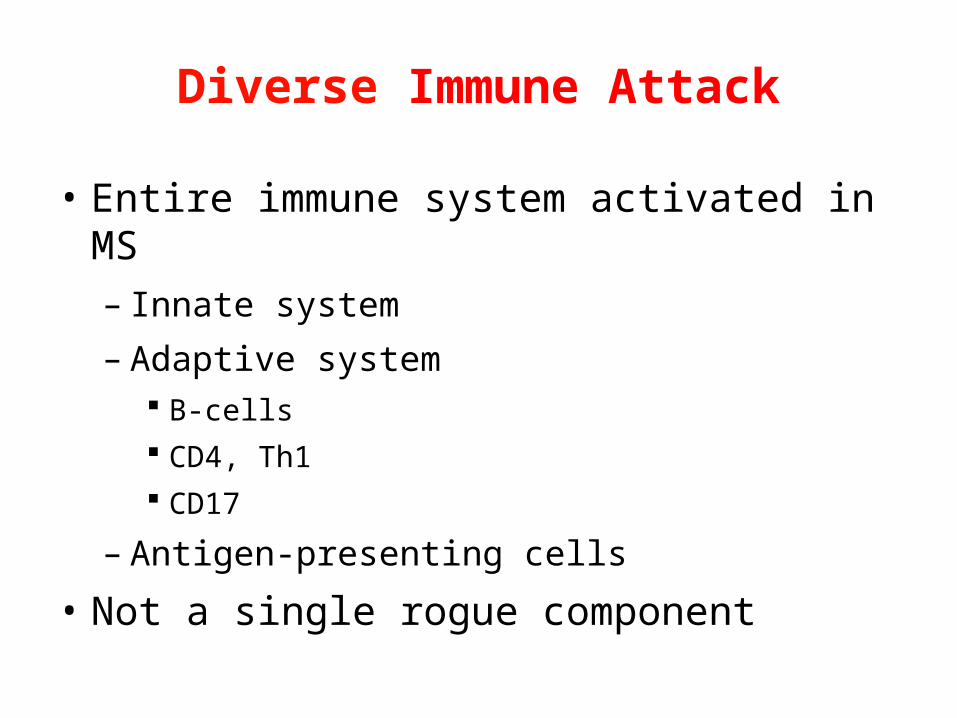
Diverse Immune Attack
• Entire immune system activated in MS
– Innate system
– Adaptive system B-cells
CD4, Th1
CD17
– Antigen-presenting cells
• Not a single rogue component
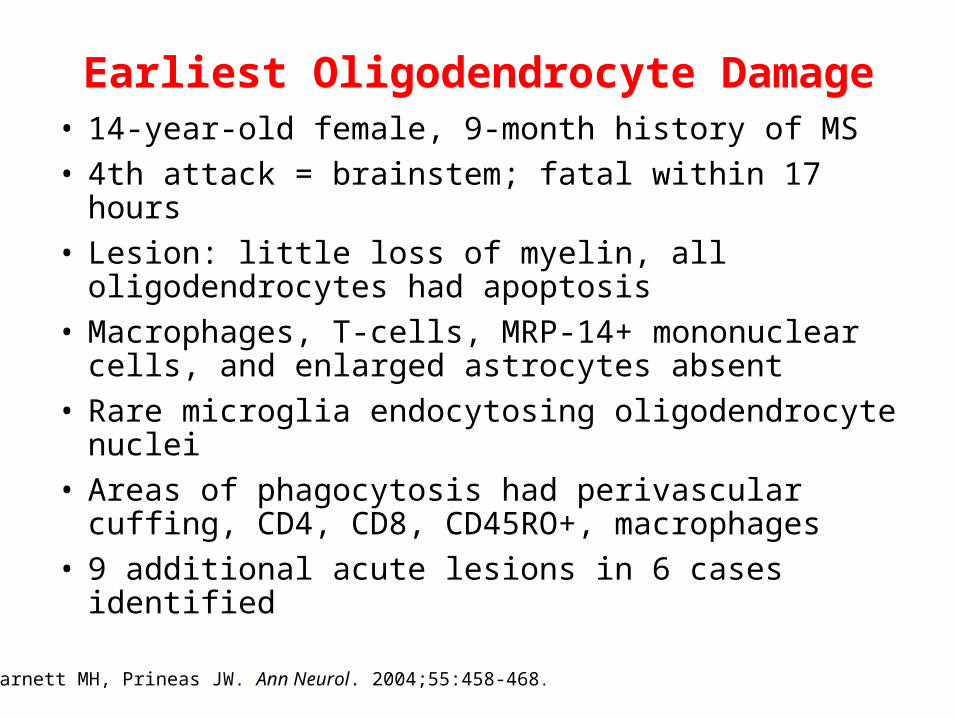
Earliest Oligodendrocyte Damage• 14-year-old female, 9-month history of MS
• 4th attack = brainstem; fatal within 17 hours
• Lesion: little loss of myelin, all oligodendrocytes had apoptosis
• Macrophages, T-cells, MRP-14+ mononuclear cells, and enlarged astrocytes absent
• Rare microglia endocytosing oligodendrocyte nuclei
• Areas of phagocytosis had perivascular cuffing, CD4, CD8, CD45RO+, macrophages
• 9 additional acute lesions in 6 cases identified
Barnett MH, Prineas JW. Ann Neurol. 2004;55:458-468.

Effects of Attacks on Progression
• N = 224 patients with ≥1 exacerbation
– 90 days after exacerbation 41% had EDSS score residual deficit of ≥0.5
30% had EDSS score residual deficit of ≥1.0
• Attacks can lead to permanent worsening
Lublin FD, et al. Neurology. 2003;61:1528-1532.Abbreviation: EDSS, Expanded Disability Status Scale.
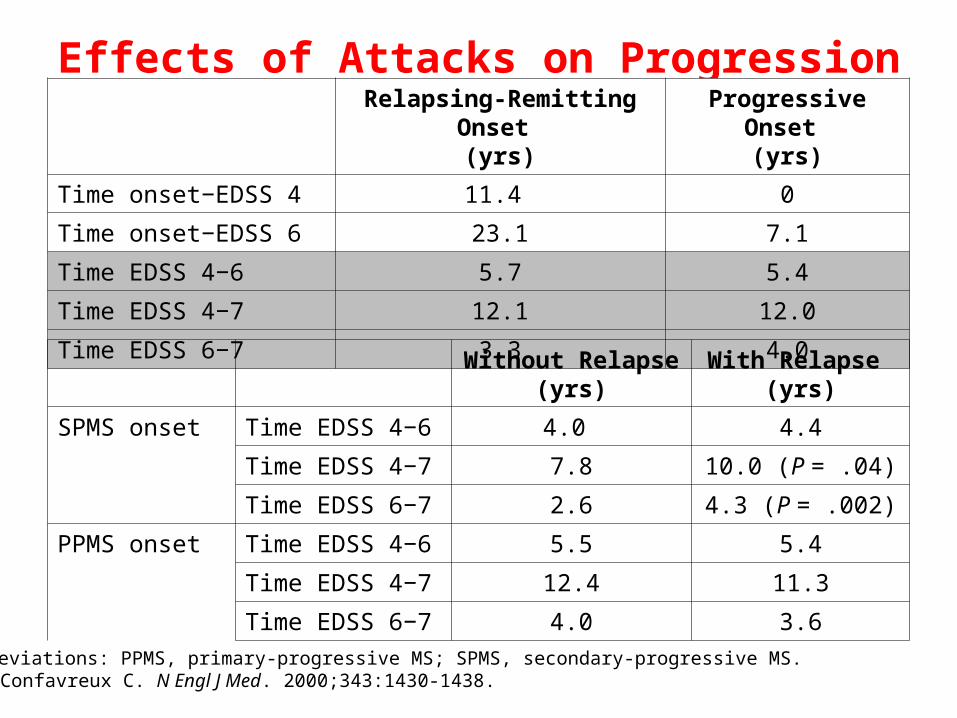
Effects of Attacks on ProgressionRelapsing-Remitting Onset
(yrs)Progressive Onset
(yrs)
Time onset−EDSS 4 11.4 0
Time onset−EDSS 6 23.1 7.1
Time EDSS 4−6 5.7 5.4
Time EDSS 4−7 12.1 12.0
Time EDSS 6−7 3.3 4.0
Without Relapse (yrs)
With Relapse (yrs)
SPMS onset Time EDSS 4−6 4.0 4.4
Time EDSS 4−7 7.8 10.0 (P = .04)
Time EDSS 6−7 2.6 4.3 (P = .002)
PPMS onset Time EDSS 4−6 5.5 5.4
Time EDSS 4−7 12.4 11.3
Time EDSS 6−7 4.0 3.6
Confavreux C. N Engl J Med. 2000;343:1430-1438.Abbreviations: PPMS, primary-progressive MS; SPMS, secondary-progressive MS.

Progressive from the Beginning
Patients with CIS have changes in:
• Atrophy (corpus callosum)1
• Magnetization transfer2
• NAA on MR spectroscopy1
– Marker of neuronal dysfunction and/or loss
• Functional MRI (fMRI)3
Abbreviations: CIS, clinically isolated syndrome; NAA, N-acetylaspartate.
1. Audoin B, et al. Mult Scler. 2007;13:41-51.2. Fernando KT, et al. Brain. 2005;128:2911-2925.3. Filippi M, et al. Hum Brain Mapp. 2004;21:108-117.
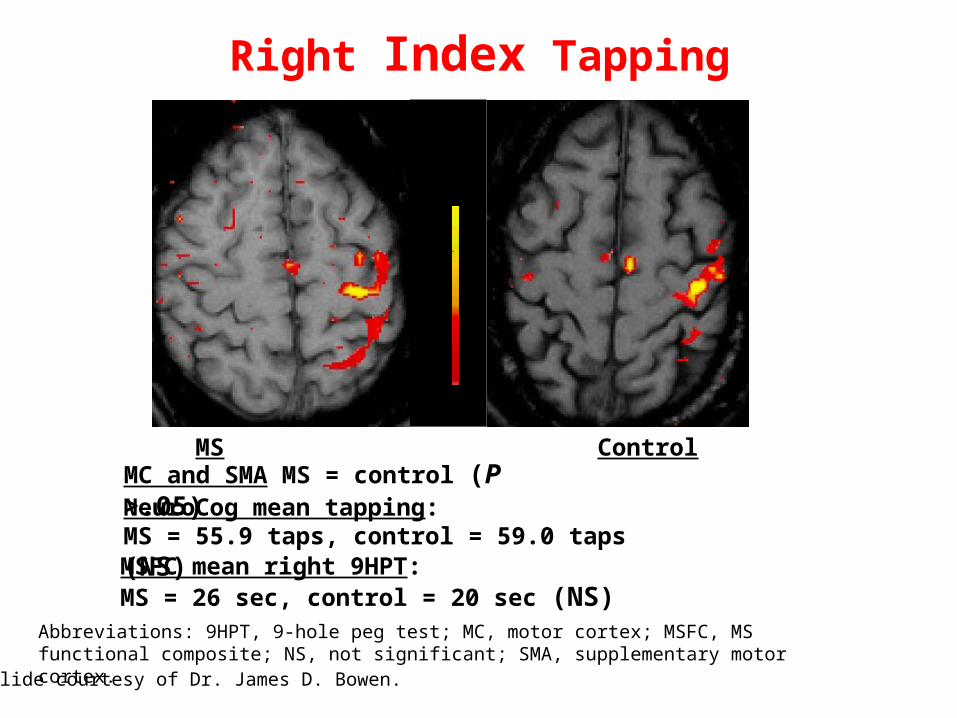
MS Control
max
min
NeuroCog mean tapping: MS = 55.9 taps, control = 59.0 taps (NS)MSFC mean right 9HPT: MS = 26 sec, control = 20 sec (NS)
MC and SMA MS = control (P >.05)
Right Index Tapping
Slide courtesy of Dr. James D. Bowen.
Abbreviations: 9HPT, 9-hole peg test; MC, motor cortex; MSFC, MS functional composite; NS, not significant; SMA, supplementary motor cortex.
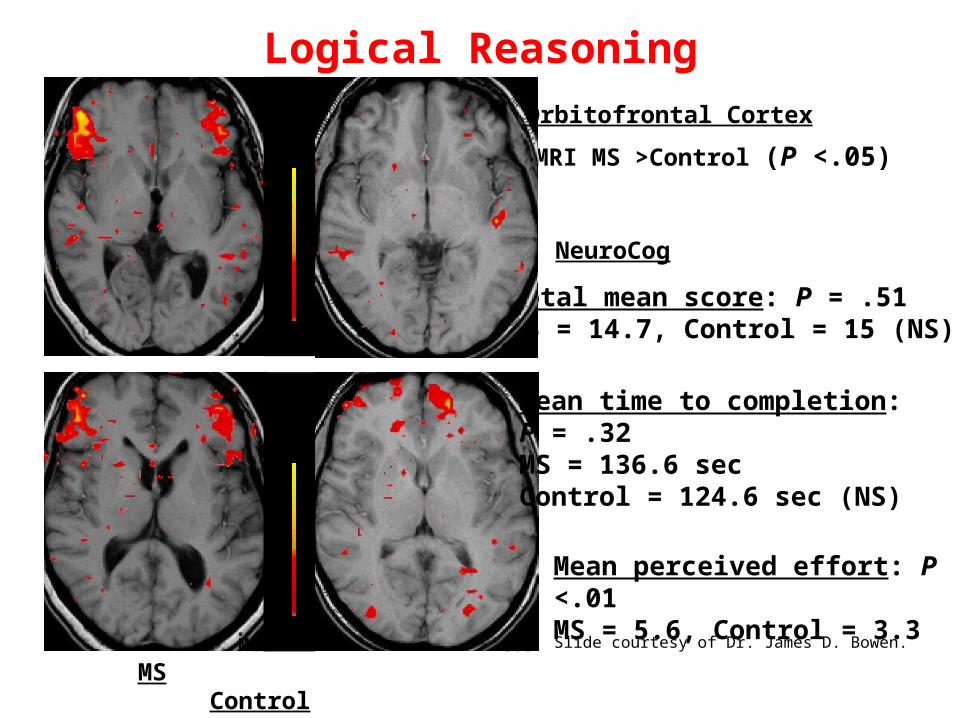
MS Control
fMRI MS >Control (P <.05)
Total mean score: P = .51MS = 14.7, Control = 15 (NS)
NeuroCog
max
min
Mean time to completion: P = .32MS = 136.6 sec Control = 124.6 sec (NS)
Orbitofrontal Cortex
max
minM12
M12
C03
C03
Logical Reasoning
Mean perceived effort: P <.01 MS = 5.6, Control = 3.3
Slide courtesy of Dr. James D. Bowen.

Incomplete Control with Immune Therapies
A B C D E FAttacks 28 29 32 32 68 65MRI 83 33 51 78 92EDSS 13 10.54 27 10 54 7.9
Jacobs LD, et al. Ann Neurol. 1996;39:285-294.IFNB MS Study Group. Neurology. 1993;43:662-667.PRISMS Study Group. Lancet. 1998;352:1498-1504.Johnson KP, et al. Neurology. 1995;45:1268-1276.Polman CH, et al. N Engl J Med. 2006;354:899-910.Hartung HP, et al. Lancet. 2002;360:2018-2025.
% R
ed
uct
ion

Autologous Stem Cell Transplant Studies
• ~80% stable at 3 years1
• 63% stable at 6 years2
• Perhaps more effective earlier in disease
• Perhaps more effective for RRMS
1. Reston JT, et al. Mult Scler. 2011;17:204-2132. Bowen J, et al. Unpublished data, 2011.
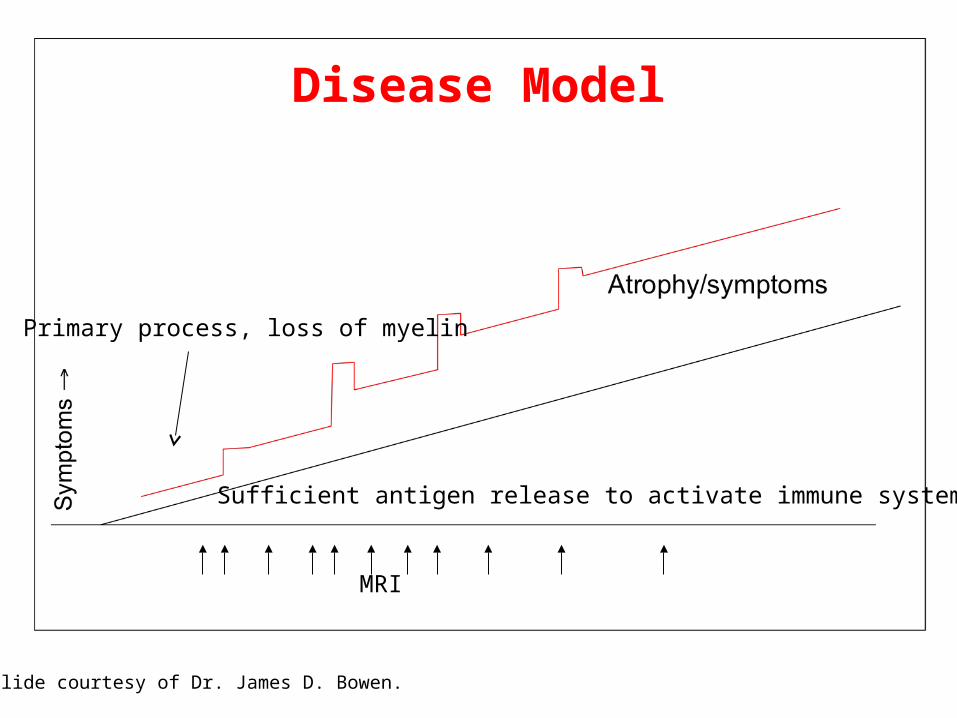
MRI
Sufficient antigen release to activate immune system
Primary process, loss of myelin
Disease Model
Slide courtesy of Dr. James D. Bowen.
Importance of Neuronal Preservation
Ultimate goal
• Preserve brain function
• Lessen disability
Assessing Neuronal Preservation
• Disability
• MRI
• Optical Coherence Tomography (OCT)
• Biomarkers

Disability Measures
Proxy for neuronal preservation• Expanded Disability Status Scale (EDSS)
• Multiple Sclerosis Functional Composite (MSFC)
– Paced Auditory Serial Addition Test (PASAT)
– 9-Hole Peg Test (9HPT)
– Low contrast visual acuity
– Timed 25-Foot Walk (T25-FW)
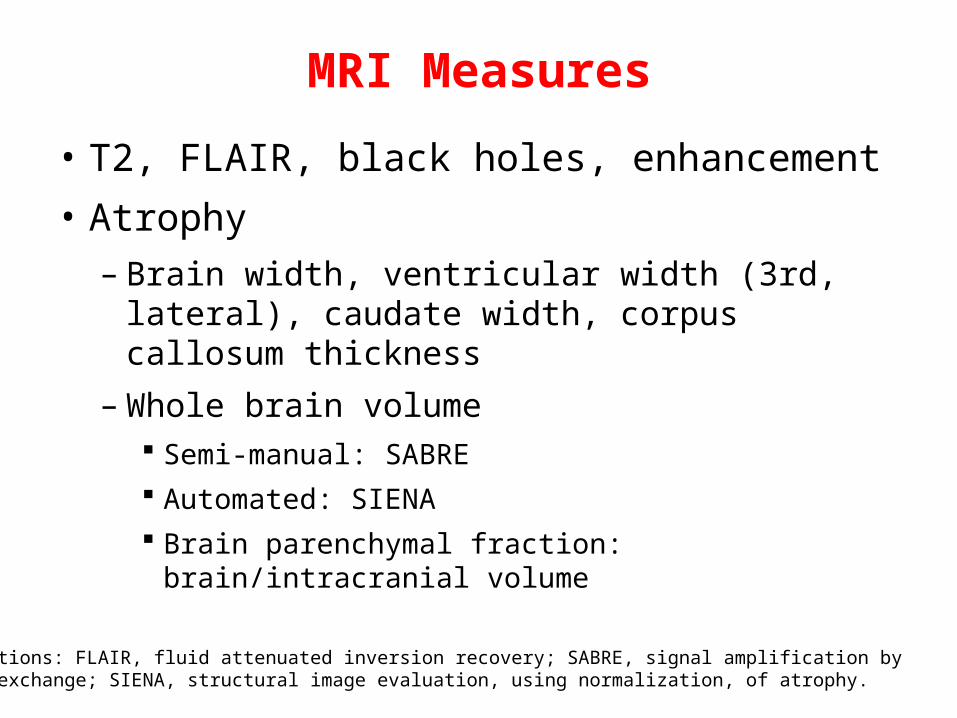
MRI Measures
• T2, FLAIR, black holes, enhancement
• Atrophy
– Brain width, ventricular width (3rd, lateral), caudate width, corpus callosum thickness
– Whole brain volume Semi-manual: SABRE
Automated: SIENA
Brain parenchymal fraction: brain/intracranial volume
Abbreviations: FLAIR, fluid attenuated inversion recovery; SABRE, signal amplification by reverse exchange; SIENA, structural image evaluation, using normalization, of atrophy.

New MRI Methods
• Magnetization transfer
• MR spectroscopy
• Diffusion tensor imaging (DTI)
• Functional MRI (fMRI)

Magnetization Transfer
+
+
Mac
rom
olec
ule
Free water
Bound water
+
+
Mac
rom
olec
ule
Free water
Narrow resonant frequency
Broad resonant frequency
Saturate at broad non-resonant frequency
Measure free water at that frequency
Slide courtesy of Dr. James D. Bowen.
Bagnato F, Frank JA. Curr Neurol Neurosci Rep. 2003;3:238-245.
Slide courtesy of Dr. James D. Bowen.
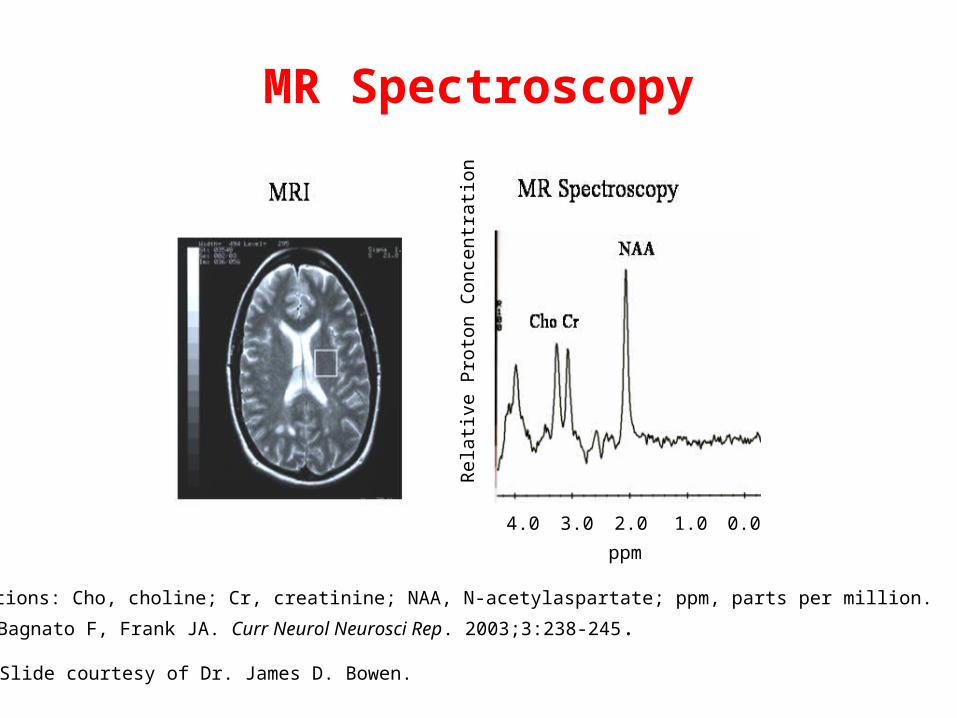
Abbreviations: Cho, choline; Cr, creatinine; NAA, N-acetylaspartate; ppm, parts per million.
Bagnato F, Frank JA. Curr Neurol Neurosci Rep. 2003;3:238-245.
Rel
ativ
e P
roto
n C
once
ntr
atio
n
ppm
4.0 3.0 2.0 1.0 0.0
MR Spectroscopy
+
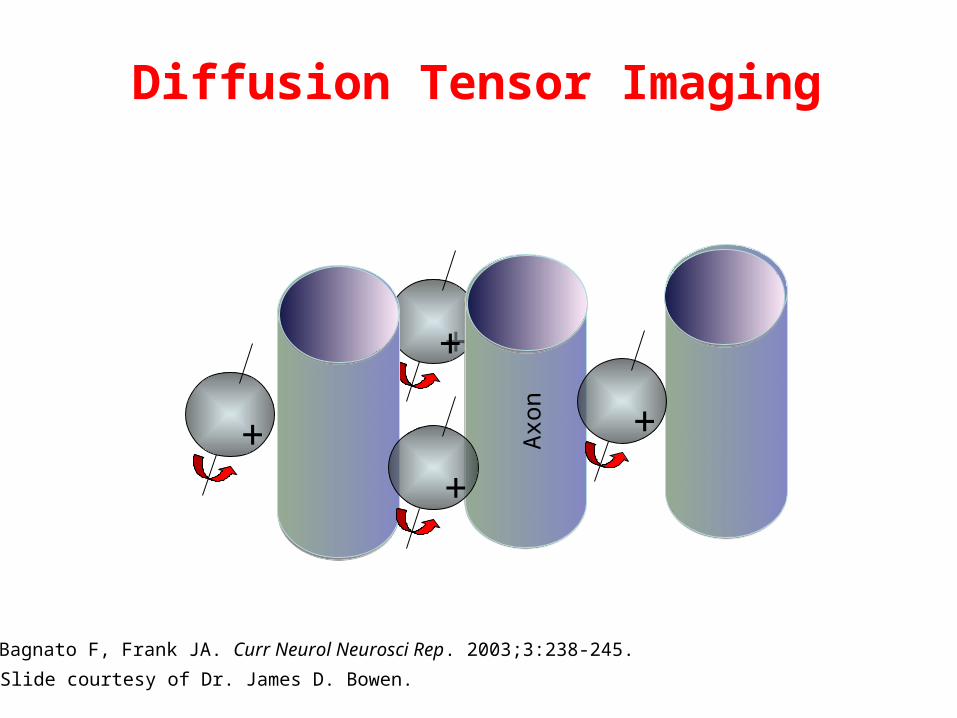
Diffusion Tensor Imaging
++
+
+
Axo
n
Slide courtesy of Dr. James D. Bowen.
Bagnato F, Frank JA. Curr Neurol Neurosci Rep. 2003;3:238-245.

Slide courtesy of Dr. James D. Bowen.
Diffusion Tensor Imaging

Optical Coherence Tomography
20/80 OD 20/50 OS
Abbreviations: OD, oculus dexter; OS, oculus sinister.Slide courtesy of Dr. James D. Bowen.

Brain Biomarkers—Iron
• Study of 7 MS patients, 4 controls1
– 7T MRI: MS patients have lower T2* values (higher iron content) in dentate, red nucleus, substantia nigra and globus pallidus
• 1.5T MRI followed longitudinally2
– Susceptibility-weighted imaging (SWI) showed no changes over 1 year—caution needed on claiming iron quantification with SWI
1. Pawate S, et al. Presented at 63rd AAN; April 9-16, 2011; Honolulu, Hawaii. 2. Khan O, et al. Neurology. 2011;76:A393.
Brain Biomarkers—Adenosine A2A-Receptor
• Proinflammatory and neurodegenerative properties
• PET scan using adenosine A2A-receptor specific [11C]TMSX of 4 patients with SPMS and 5 controls
• Increased uptake, widespread in white matter
• Binding associated with widespread white matter pathology
Rissanen E, et al. Neurology. 2011;76:A172.Abbreviations: PET, positron emission tomography; SPMS, secondary-progressive MS.
Brain Biomarkers—Neurofilament Phosphorylation
• Postmortem brain studied by MTR, ELISA
• Hyperphosphorylated neurofilament heavy chain correlated with T1 lesion load (r = 0.7) and inversely correlated with MTR (r = -0.76)
• These changes were present in normal- appearing white matter
Schmierer K, et al. Neurology. 2011;76:A358.Abbreviations: ELISA, enzyme-linked immunosorbent assay; MTR, magnetization transfer ratio.
Blood Biomarkers—Brain-Derived Neurotrophic Factor
• Produced by neurons or activated astrocytes1
• Plays a role in axonal growth, modulation of neuronal activity, activity-dependent synaptic and dendritic plasticity1,2
• Correlates with MRI T2 burden3
1. Binder DK, Scharfman HE. Growth Factors. 2004;22:123-131.2. Linker RA, et al. Brain. 2010;133:2248-2263. 3. Frota ERC, et al. Mult Scler. 2010;16:S158.

Blood Biomarkers—Ciliary Neurotrophic Factor
• Promotes
– Neurotransmitter synthesis1
– Neurite outgrowth1
• Protective role in myelin oligodendrocyte glycoprotein (MOG)-induced EAE2
1. Lam A, et al. Gene. 1991;102:271-276. 2. Linker RA, et al. Nat Med. 2002;8:620-624.
Abbreviation: EAE, experimental allergic encephalomyelitis.
CSF Biomarkers—Neurofilament Light Chain (NFL)
• An intermediate filament found in neurons; marker of axonal damage
• 66 patients with CIS
– After 1.65 years, 39 developed MS
• Mean CSF NFL
– 979.6 converters
– 450.72 nonconverters
Tortorella C, et al. Presented at 63rd AAN; April 9-16, 2011; Honolulu, Hawaii.

CSF Biomarkers—Tau Protein
• Stabilizes microtubules1
• 158 patients2
– RRMS (n = 94), CIS (n = 39), PP (n = 25)
– Tau protein elevated in all MS patient groups
1. Weingarten MD, et al. Proc Natl Acad Sci USA. 1975;72:1858-1862.2. Mares J, et al. Neurology. 1011;76:A597.

CSF Biomarkers—Pigment Epithelium Derived Factor
• Plays role in differentiating precursors into neurons1
• CSF specimens from 56 patients with MS, 19 patients with noninflammatory neurologic disorders2
– In patients in remission, PEDF negatively correlated with: Number of accumulated relapses (r = -0.66)
Disease duration (r = -0.4)
Abbreviations: CSF, cerebrospinal fluid; MS, multiple sclerosis; PEDF, pigment epithelium derived factor. 1. Houenou LJ, et al. J Comp Neurol. 1999;412:506-514.2. Orbach R, et al. Neurology. 2011;76:A375.
Effect of Therapies on Neuroprotection
• Preservation of brain and function demonstrated
– Due to neuroprotection or immune effects of the treatment?
• Effects on regeneration/remyelination less certain

Interferons
• Clinical preservation– Expanded Disability Status Scale (EDSS)1
Significant delay in time to sustained EDSS progression
• MRI1,2
Decreased T1 black holes Slowing of atrophy (brain parenchymal fraction)
• Increases brain-derived neurotrophic factor production3
1. Jacobs LD, et al. Ann Neurol. 1996;39:285-294. 2. Paty DW, et al. Neurology. 1993;43:662-667. 3. Yoshimura S, et al. Mult Scler. 2010;10:1178-1188.
Glatiramer Acetate
• Clinical preservation
– Significantly more patients had improved Expanded Disability Status Scale at 2 years compared with placebo patients1
• MRI
– Black hole formation reduced compared with placebo2
1. Johnson KP, et al. Neurology. 1995;45:1268-1276.2. Filippi M. Neurology. 2001;57:731-733.
Brain-Derived Neurotrophic & Other Factors and Glatiramer Acetate
• Glatiramer acetate (GA) increases brain-derived neurotrophic factor1
• GA increases insulin-like growth factor-1 production by Th2 lymphocytes in mice2
• Experimental allergic encephalomyelitis optic neuritis in rats—GA increases survival of retinal ganglion cells and increases phosphorylation of neuroprotective kinases (Akt, MAPK1, MAPK2) and bcl-23
• GA increases neuroprogenitor proliferation, migration, and differentiation4
1. Azoulay D, et al. Mult Scler. 2005;suppl 1: S86.2. Skihar V, et al. Mult Scler. 2005;suppl 1: S51. 3. Maier K, et al. Mult Scler. 2005;suppl 1: S51.4. Aharoni R, et al. Mult Scler. 2005;suppl 1: S51.
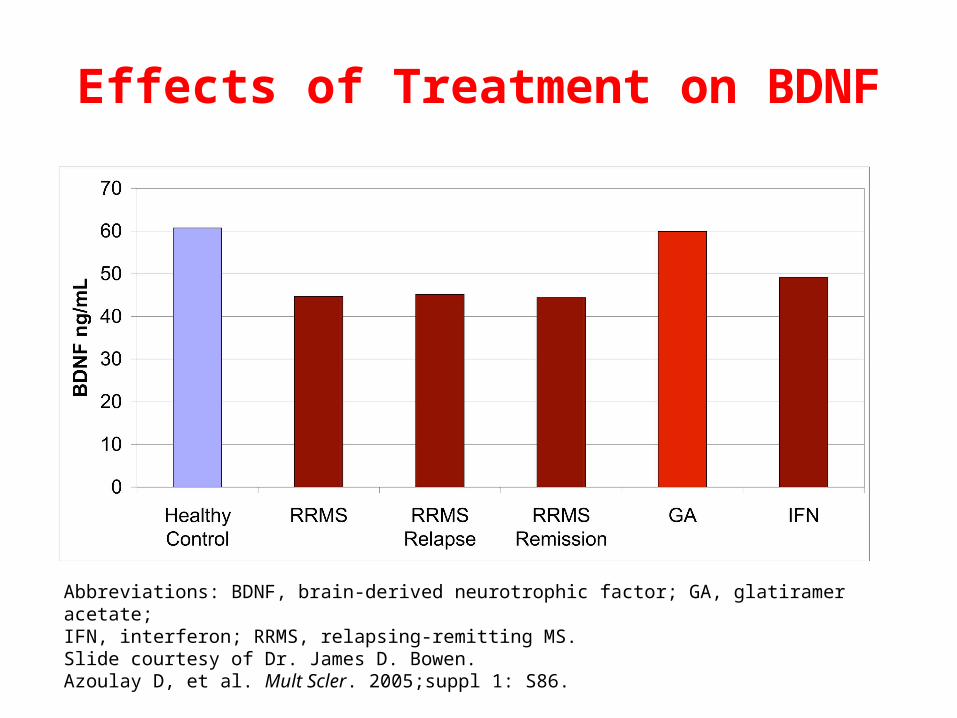
Effects of Treatment on BDNF
Abbreviations: BDNF, brain-derived neurotrophic factor; GA, glatiramer acetate; IFN, interferon; RRMS, relapsing-remitting MS.Slide courtesy of Dr. James D. Bowen.Azoulay D, et al. Mult Scler. 2005;suppl 1: S86.
Natalizumab
• Clinical preservation1
– Significantly reduced progression of sustained disability
• MRI1
– Decreased T1 black hole formation
– Decreased atrophy in year 2
1. Miller DH, et al. Neurology. 2007;68:1390-1401.
BG00012 (Dimethylfumarate)
• Decreases oxidative stress
• Increases nuclear factor-E2-related factor 2
Horssen S, et al. Neurology. 2011;76:A136.
Laquinimod
• Increases levels of brain-derived neurotrophic factor (BDNF)1-3
• Increased transcripts for insulin-like growth factor 1 x 204
• Increased transcripts for BDNF x 34
1. Thone J, et al. Mult Scler. 2010;16:S310.2. Hayardeny L, et al. Mult Scler. 2010;16:S160.3. Bruck W, Wegner C. J Neurol Sci. 2011;306:173-179.4. Silva C, et al. Mult Scler. 2010;16:S310.
Others
• Mesenchymal stem cell transplants
• Olesoxime
• Teriflunomide

Case Conclusion
The patient decided to continue her interferon disease-modifying therapy in order to decrease inflammatory disease activity and possibly neurodegeneration

Conclusions
• Neuronal protection important in MS
• Measuring it is challenging
– MRI
– Biomarkers (brain, blood, CSF)
• Some therapies possibly have neuroprotective effects

Thank you for your participation.
To earn CME/CE credit, please complete the posttest and evaluation. (Click link in the navigation bar above
or to the left of the slide presentation.)
Your feedback is appreciated and will help us continue to provide you with clinically relevant
educational activities that meet your specific needs.