Embed Size (px)
Citation preview
Neuromodulation of Brain Activity in Sleep and its
Effect on Consolidation
A sleep study modulating theta oscillations with tACS during targeted memory
reactivations
Sandra Klonteig
Submitted as master thesis at the Department of Psychology
University of Oslo
Spring, 2020

II
Acknowledgements
I would like to thank my supervisor Björn Rasch for opening his lab in Fribourg and for
giving me a warm welcome to the team. I have learnt a lot through the devotion, skills and
professionalism flourishing within this lab. Specifically, I would like to thank Sven Paßmann
for taking me onto his project. Thank you for the great collaboration, the meetings and fruitful
discussions (often including swiss chocolate), and guidance in the project along with Tamara
Von Dach. Furthermore, I would like to thank my internal supervisor Rene J. Huster, for the
invaluable feedback and advices during the writing of this thesis.
My appreciation of the Neuroband for providing colorful tunes and upbeat tempo throughout
this period ought to be recognized. Thank you, Erik, Josefine, Melvin and Andreas and the
rest of my student colleagues for the joyful moments throughout the two years at the program
of Cognitive Neuroscience.
Finally, I would like to thank everyone who participated in the study!
III
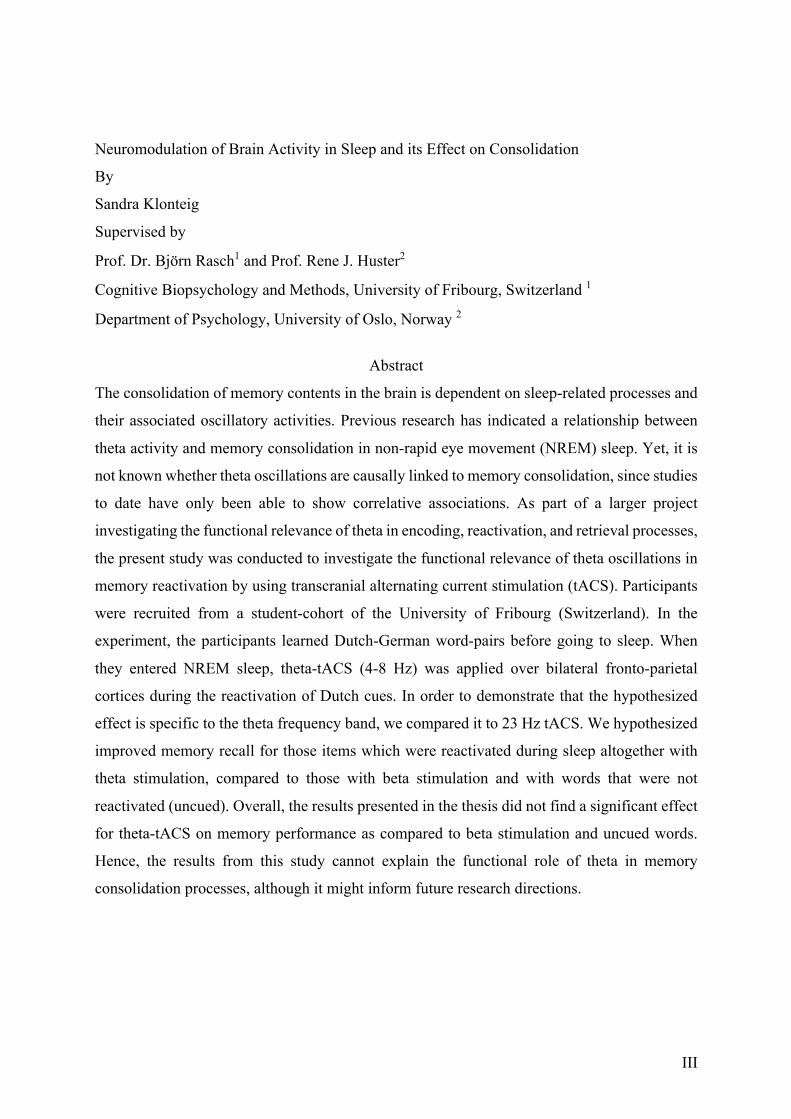
Neuromodulation of Brain Activity in Sleep and its Effect on Consolidation
By
Sandra Klonteig
Supervised by
Prof. Dr. Björn Rasch1 and Prof. Rene J. Huster2
Cognitive Biopsychology and Methods, University of Fribourg, Switzerland 1
Department of Psychology, University of Oslo, Norway 2
Abstract
The consolidation of memory contents in the brain is dependent on sleep-related processes and
their associated oscillatory activities. Previous research has indicated a relationship between
theta activity and memory consolidation in non-rapid eye movement (NREM) sleep. Yet, it is
not known whether theta oscillations are causally linked to memory consolidation, since studies
to date have only been able to show correlative associations. As part of a larger project
investigating the functional relevance of theta in encoding, reactivation, and retrieval processes,
the present study was conducted to investigate the functional relevance of theta oscillations in
memory reactivation by using transcranial alternating current stimulation (tACS). Participants
were recruited from a student-cohort of the University of Fribourg (Switzerland). In the
experiment, the participants learned Dutch-German word-pairs before going to sleep. When
they entered NREM sleep, theta-tACS (4-8 Hz) was applied over bilateral fronto-parietal
cortices during the reactivation of Dutch cues. In order to demonstrate that the hypothesized
effect is specific to the theta frequency band, we compared it to 23 Hz tACS. We hypothesized
improved memory recall for those items which were reactivated during sleep altogether with
theta stimulation, compared to those with beta stimulation and with words that were not
reactivated (uncued). Overall, the results presented in the thesis did not find a significant effect
for theta-tACS on memory performance as compared to beta stimulation and uncued words.
Hence, the results from this study cannot explain the functional role of theta in memory
consolidation processes, although it might inform future research directions.

IV
Contents
Abbreviations .................................................................................................................... VI
1. Introduction ............................................................................................................... 1
1.1 Memory ................................................................................................................................ 1
1.1.1 Long term memory systems ................................................................................................................. 2 1.1.2 Neural oscillations and cognition ......................................................................................................... 3 1.1.3 Theta oscillations and memory ............................................................................................................. 3
1.2 Sleep ..................................................................................................................................... 4
1.2.1 Sleep stages .......................................................................................................................................... 5 1.2.2 Sleep architecture ................................................................................................................................. 5
1.3 Sleep and Memory ................................................................................................................ 6
1.3.1 The active consolidation hypothesis ..................................................................................................... 7 1.3.2 Targeted memory reactivation .............................................................................................................. 8 1.3.3 Theta activity under targeted memory reactivation .............................................................................. 9
1.4. Transcranial Alternating Current Stimulation ................................................................. 10
1.5 Aims ................................................................................................................................... 11
1.6 Hypothesis .......................................................................................................................... 12
2. Methods ................................................................................................................... 13
2.1 Participants ........................................................................................................................ 13
2.2 Design ................................................................................................................................. 14
2.3 Procedure ........................................................................................................................... 14
2.4 Set up and Materials .......................................................................................................... 16
2.4.1 Polysomnographic recordings ............................................................................................................ 16 2.4.2 Transcranial Alternating Current Stimulation .................................................................................... 17 2.4.3 Vocabulary learning task .................................................................................................................... 18 2.4.4 Reactivation of Vocabulary ................................................................................................................ 19 2.4.5 Analyses of Sleep stages .................................................................................................................... 21 2.4.6 Questionnaires .................................................................................................................................... 21
2.5 Data analysis ...................................................................................................................... 22
2.5.1 Behavioral analyses ............................................................................................................................ 22 2.5.2 Analyses of Sleep ............................................................................................................................... 25

V
2.5.3 Analysis of questionnaires .................................................................................................................. 25
3. Results ......................................................................................................................... 26
3.1 Behavioral findings ............................................................................................................ 26
3.1.1 General memory performance ............................................................................................................ 26 3.1.2 Gains and losses ................................................................................................................................. 29 3.1.3 Follow-up ........................................................................................................................................... 31
3.2 Sleep ................................................................................................................................... 31
3.2.1 Analysis of sleep stages ...................................................................................................................... 32 3.2.2 Differences in memory scores faceted over stimulation- order .......................................................... 35
3.3 Questionnaires .................................................................................................................... 36
4. Discussion .................................................................................................................... 40
4.1 Behavioral findings ............................................................................................................ 40
4.2 Findings in the sleep data and explorative analyses ........................................................... 43
4.2.1 Differences within participants over stimulation- order ..................................................................... 45
4.3 Questionnaires .................................................................................................................... 46
4.4 Limitations and directions .................................................................................................. 46
5. Conclusions ................................................................................................................. 49
6. Funding ....................................................................................................................... 49
7. Declaration of contribution .......................................................................................... 49
8. References ................................................................................................................... 50
Appendix A ...................................................................................................................... 57
Appendix B ...................................................................................................................... 62

VI
Abbreviations
EEG: Electroencephalogram
EOG: Electrooculography
ECG: Electrocardiogram
MTL: Medial Temporal Lobe
PFC: Prefrontal Cortex
tACS: Transcranial Altering Current Stimulation
TMR: Targeted Memory Reactivation
tSOS: Transcranial Slow Oscillation Stimulation
otDCS: Oscillatory Transcranial Direct Current Stimulation
REM: Rapid Eye Movement
NREM: Non-Rapid Eye Movement
SO: Slow Oscillations
SWA: Slow Wave Activity
SWS: Slow Wave Sleep
WP: Word Pair

1
1. Introduction
The section aims to provide an introduction of previous literature and theories in fields that
have built the rationale for and situate the present study. Specifically, the intention is to
present the current status of scientific research on theta oscillations and their relation to
memory consolidation processes during NREM sleep. The introduction is structured to first
provide theoretical foundations for the concepts of memory and sleep, with delimitations
reflecting the topic of the current study, before memory consolidation during sleep will be
presented. Furthermore, previous research on targeted memory reactivation (TMR) will be
introduced and discussed in relation to theta activity. Finally, transcranial Alternating Current
Stimulation (tACS) will be presented as a method to modulate neural oscillations and theta
activity, and previous studies applying this method will be discussed.
Previous research will be highlighted with an attempt to shed light on the potentials
for enriching the field with new knowledge. The aims and hypothesis of this study will then
be presented with an underlying objective of facilitating our understanding of a potential
functional relevance of theta oscillations in memory consolidation.
1.1 Memory
Memory is a function that allows organisms to interact with and adapt efficiently to their
environment. Further, it allows behavior to be shaped depending on varying external
conditions, for example by avoiding repetitions of actions that proved maladaptive or
dangerous previous situations (Rasch & Born, 2013). The process of learning and memory is
thought to contain three stages; encoding, consolidation, and retrieval. Encoding occurs when
the memory is formed into a new memory trace. Consolidation refers to the process of
stabilizing the memory trace gradually, and the integration of memories into preexisting
knowledge networks (Banich & Compton, 2018, p.278-83). Consolidation can occur at a
system level or between synapses. Synaptic consolidation is when features, such as spines,
relevant to the efficiency in synapses are remodeled. Whereas system consolidation applies at
a system level, when newly encoded information stimulates entire neuronal circuitries to
reorganize. As a result, both of these processes lead to a remodeled and strengthened network
with synaptic connections representing a memory trace (Rasch & Born, 2013). The final stage
of the memory process, retrieval, is when the memory is accessed and recalled (Banich &
Compton, 2018, p. 278-83).

2
1.1.1 Long term memory systems
In long term memory systems (see figure 1), two major categories of memory differ in whether
they involve medial temporal lobe regions (declarative) or not (non- declarative). Non-
declarative memory involves procedural, conditional, reflex non-associative learning, and
priming (see Stickgold, 2005 for examples and further explanations). Declarative memory
involves episodic and semantic memory, where episodic is memory for particular events or
episodes in once life and semantic is memories of general information that does not require
context to be encoded (Stickgold, 2005). In declarative memory, the medial temporal lobe
(MTL) and particularly the hippocampus (HPC) are of interest, as it is involved in the encoding
of memories (Squire & Zola, 1996). Memories are consolidated and stored in the HPC (short-
term storage) and neocortex (long-term storage). Although not immediately apparent, the
prefrontal cortex (PFC) has also been shown to play an essential role in declarative memory,
contributing to memory processing via top-down control. As a result, there has been
considerable research investigating the interaction between the hippocampus and prefrontal
cortex in memory processing of declarative memories. Research has found bidirectional,
ipsilateral communication via the two brain areas, which has been associated with neural
oscillations (Eichenbaum, 2017).
Figure 1. The different memory systems. Memory can be subdivided into two main categories, declarative, explicit hippocampus-dependent and Non-declarative, implicit hippocampus-independent memory. These two main concepts can be further specified: episodic memory refers to all memories stored in association with a specific spatiotemporal context, whereas semantic memory includes all concepts and knowledge assimilated independently from precise contextual indices. Procedural memory skills implying long-term learning motor and cognitive aptitudes, priming involving perceptual representation, conditioning representing all associations between stimuli and conditioned responses, and reflex non-associative learning including habituation and sensitization are all considered as implicit memory sub-categories. adapted from Stickgold (2005).

3
1.1.2 Neural oscillations and cognition
The nervous system communicates with electrochemical signaling. The electrical signal is
created within a neuron via a synaptic potential, transfer of the potential to the soma, and
action potential, causing the neuron to fire and transmit information from one neuron to
another (Banich & Compton, 2018, p. 14-15). When a large population of neurons fire at the
same time, this creates a local field potential. Neural oscillations represent the fluctuations in
the excitability of a population of neurons. There are three ways to measure an oscillation:
phase, frequency, and power. Brain rhythm frequency bands include delta (1-4 Hz), theta (4-8
Hz.), alpha (8-12 Hz.), beta (12-30 Hz), and gamma (30 Hz+) (M. X. Cohen, 2014). These
neural oscillations are associated with networks, and their communication have been found to
play a significant function in cognition, such as memory (Başar et al., 2001).
1.1.3 Theta oscillations and memory
Brain activity in the theta frequency band (4-8 Hz) (M. X. Cohen, 2014), has been associated
with encoding and retrieval, and lately also consolidation processes of memory. In general, it
is assumed that this oscillatory activity is related to synchronization of different areas in the
brain to offer a time window for synchronous transfer of information and additionally marking
of essential information that should be stored with priority.
Increased theta activity before and during encoding has been linked to better memory
performance (Salari & Rose, 2016; Schneider & Rose, 2016). Theta activity has also been
associated with the retrieval of declarative memory and has been argued to be process-specific
as it was not mainly linked to the retrieval of specific memory traces (W. Klimesch et al., 2001).
Previous research has indicated a relationship between theta activity and memory consolidation
in NREM sleep. Yet, it is not known whether the underlying processes of theta oscillations are
causally responsible for memory consolidation, since studies to date have only been able to
show correlative associations (Schreiner et al., 2018; Schreiner & Göldi, et al., 2015). These
studies will be discussed in further detail towards the end of this literature view.
Some suggest the underlying functions of theta and their role in memory is grounded in
the cross-frequency coupling between theta and gamma oscillations (Lisman & Jensen, 2013).
Specifically, theta is generated in the hippocampus and neocortical areas, and there are
bidirectional projections between the hippocampus and neocortical areas. Gamma frequency
has been related to the binding of features from diverse brain regions in both the cortex and
hippocampus. Research has found that hippocampal theta rhythms phase-bias gamma
oscillations (reflecting specific information) in neocortical areas, which suggests that

4
hippocampal theta is related to the temporal coordination of neocortical gamma oscillators
(Sirota et al., 2008). This might be beneficial such that assemblies in different areas in neocortex
can be synchronously transferred and associated in the hippocampus and networks involving
the hippocampus.
Furthermore, it has been suggested that theta is related to the marking of valuable
information that should be stored with priority (Lisman & Jensen, 2013; Vertes, 2005). A study
found that the hippocampus contains neurons that are phase-locked to theta frequency by
looking at neuronal spike timing and local theta oscillations, and the degree of phase-locking
has been correlated with memory strength (Rutishauser et al., 2010). Further, in a study on rats,
it was found that motivation (an expected reward) for learning a task was correlated with the
coherence of theta activity in the hippocampus and PFC and predicted better memory
performance. The authors discussed a possibility that theta is related to tagging of the memory
representation for later consolidation through PFC neurons modulated by the hippocampus
(Benchenane et al., 2010).
Altogether, theta frequencies and the underlying functions are thought to offer a time
window for synchronous transfer and allow for top-down control from frontal areas to the
hippocampus that might increase the likelihood of information to be memorized. However,
there is uncertainty regarding thetas function in the consolidation process and if theta serves the
same function during a sleep state.
1.2 Sleep
Sleep occurs in almost all animals and is defined as “a natural and reversible state of reduced
responsiveness to external stimuli and relative inactivity, accompanied by a loss of
consciousness” (Rasch & Born, 2013). From an evolutionary perspective, sleep ought to play
an essential role if one is to explain the trade-off between sleep and the increased vulnerability
to danger, caused by loss of consciousness. Accompanying this argument, research has found
that sleep deprivation or disturbances are related to adverse health outcomes (Colten &
Altevogt, 2006). Several functions of sleep have been suggested, one of which is energy
conservation. However, due to the loss of responsiveness to external stimuli, researchers argue
that the essential functions of sleep must be related to the brain (Rasch & Born, 2013).

5
1.2.1 Sleep stages
Sleep stages are characterized by neurophysiological features such as neural oscillations and
neurochemical levels (see figure 2 for an overview). This thesis will focus on the neuronal
oscillations that distinguish each stage. In the classification of sleep stages, the first intersection
is between sleep containing rapid eye movement (REM) and sleep lacking it, so-called Non-
REM sleep. NREM-sleep further branches out to N1, N2, and N3 sleep, following the AASM
(2007) model. N3 sleep contains Slow Wave Sleep (SWS), which is prominent in NREM-sleep.
The sleep stages will be considered in detail in the subsequent order.
REM in human nocturnal sleep is recognized by a wake-like state with mixed theta and
alpha frequencies with low amplitudes, rapid eye movements, and distinct physiological
activity such as muscle atonia (Iber et al., 2007) .Theta oscillations are prevalent in rodents’
REM sleep, in the hippocampus and neocortex. Although theta activity in REM sleep in humans
is not as readily identified, similar oscillatory patterns have been found in comparable brain
areas as rodents (Rasch & Born, 2013). The underlying functions of theta in REM sleep in
humans is discussed, one suggestion is a relevance of theta activity in emotional memory
(Klinzing et al., 2019). N1 sleep is considered a light sleep stage and consists of mixed
frequencies in the theta range, with low amplitude. Eyes begin to roll and physiological activity
decreases. Stage N2 is a deeper stage than N1. This stage is characterized by k-complexes and
sleep spindles, and low physical activity. Stage N3 is the deepest stage where k-complexes and
spindle activity may persist, and the stage is dominated by slow waves (SW). Slow-wave sleep
is dominated by EEG activity between 0.5 and 2 Hz with an amplitude of more than 75
microvolts. Slow-wave sleep is characterized by neocortical slow oscillations (SO),
thalamocortical spindles, and hippocampal sharp-wave ripples as field potential oscillations
(Rasch & Born, 2013).
1.2.2 Sleep architecture
Sleep stages alternate in cyclic occurrences that altogether produce the sleep architecture. Sleep
architecture can differ between individuals or other demographic groups, but is seen as highly
consistent within an individual across multiple nights (Rasch & Born, 2013). N1 is the first
stage we enter after falling asleep; this stage lasts between 1-7 minutes and constitutes about
5% of total sleep. N1 is usually followed by stage N2, which lasts for around 20 minutes but
accounts for about 57% of total sleep. Stage N3 is about 18% of sleep, however periods with

6
SWS are most predominant in earlier parts of the night (early sleep). REM sleep usually occurs
after 80-100 min and determines the end of a sleep cycle (Carskadon et al., 2005). REM sleep
is most profound and powerful in later parts of the night (late sleep) and accounts for about
20% of total sleep (Rasch & Born, 2013; sleep data was taken from a population sample in
Redline et al., 2004).
Figure 2. Human sleep pattern and features. A: the typical mammals' sleep rhythm features two core stages repeatedly occurring in the course of the night, rapid eye movement (REM) and non-REM sleep. Slow-wave sleep (SWS), also named Non-REM sleep stage 3 (N3), is predominant in the first part of the night, whereas late sleep is mostly characterized by REM sleep stage. B: The most prominent oscillatory events during Non-REM sleep are neocortical slow oscillations (SOs, 0.5 - 2 Hz), thalamocortical sleep spindles (waxing and waning high-frequency bursts, mainly 11-15 Hz, mostly observed in Non-REM sleep stage 2) and hippocampal sharp wave-ripples events (SW-R, superimposed CA3 region's rapid depolarization and 100-300 Hz-frequency oscillations originating in CA1). REM sleep, on the other hand, at least in animals, is prevalently featured by Ponto-Geniculo-Occipital (PGO) waves and theta (4-8 Hz) activity taking place in the hippocampus. Retrieved from Rasch & Born (2013).
1.3 Sleep and Memory
Sleep has consistently shown to be involved in the consolidation of memories (Diekelmann &
Born, 2010; Maquet, 2001). There are a range of theories attempting to explain the function of
sleep in memory consolidation. Rasch & Born (2013) provide a historical overview of
previous research, theories and hypotheses on sleep and its role in memory. Some proposed
hypotheses are “the dual process hypothesis”, “sequential hypothesis” and “synaptic

7
homeostasis hypothesis”, due to the scope of the thesis these will not be introduced further.
The thesis will focus on the “active consolidation hypothesis” (see figure 3 for an overview),
proposed by Rasch & Born (2013) as it integrates previous research and aspects of some
current hypotheses on sleep and memory.
1.3.1 The active consolidation hypothesis
The active consolidation hypothesis assumes that memories are consolidated through
reactivations in the short-term storage site during SWS and later transferred to long term storage
areas. The neural process underlying this is a connection between the neocortex and
hippocampus driven by neocortical slow oscillations. Thalamo-cortical spindles are known to
induce plastic changes in cortical areas and sharp-wave ripples that involve the repeated
reactivation of hippocampal memory representations. These events are both driven together by
the depolarization of SOs, which then reorganize the memory representation. The hypothesis
assumes REM sleep is the period when the memory representation is again stabilized and
integrated into pre-existing memory traces (Rasch & Born, 2013).
Figure 3. The active system consolidation model of memory. According to the two-stage hypothesis, memory traces are first stored into a fast-learning, temporary store identified with the hippocampus, and have to be repeatedly activated during SWS in order to allow their stabilization into a long-term store located in neocortical regions. B: newly acquired memory traces temporarily represented in the hippocampus are repeatedly reactivated during SWS, a process directed by SOs originated in the neocortex. The depolarization of neocortical neural networks (up-state of SOs) drives the generation of hippocampal sharp wave-ripples, together with thalamocortical spindles (spindle-ripple events): this chain of oscillatory events is responsible for memory reactivation. Thus, memories temporarily stored in the hippocampus are stabilized and reinforced in the neocortex through reactivation elicited by SOs. Retrieved from Rasch & Born, (2013).

8
1.3.2 Targeted memory reactivation
One procedure that has given support to the theory of sleep as an active part of the consolidation
process, is targeted memory reactivation (TMR). In TMR, one uses memory cues to induce
reactivations of a particular memory during sleep (Oudiette & Paller, 2013). To illustrate, in an
experiment conducted by Schreiner and Rasch (2015), participants were instructed to learn
Dutch-German word-pairs before they went to bed. The Dutch words were then replayed during
NREM sleep or wake, and memory performance was assessed afterward (see figure 4 for
procedure). Results indicated that memory performance was at an advantage for those words
which had been cued compared to those who were not cued, and that cueing was most
advantageous when cues were presented during NREM sleep, as compared to passive or active
waking-state. Notably, similar findings have been found in other types of cues, such as odors
and sounds. Overall, previous research has established a consistent link between TMR and
improvement of declarative memory consolidation during NREM sleep (Oudiette & Paller,
2013, Rasch & Born, 2013).
Figure 4. Experimental procedure. (a and b) Participants studied 120 Dutch–German word pairs in the evening. Afterward, participants of the main and the control sleep groups slept for 3 h, whereas 2 other groups stayed awake. During the retention interval, 90 Dutch words (30 prior remembered, 30 prior not remembered and 30 new words) were repeatedly presented again. Cueing of vocabulary occurred during NonREM sleep, during performance of a working memory task, or during rest. The control sleep group did not receive any cues during sleep. After the retention interval, participants were tested on the German translation of the Dutch words using a cued recall procedure. Retrieved from Schreiner & Rasch (2015).
9
The majority of studies on TMR we have identified in the literature review, measured
memory retrieval the morning after the content was learned. Correspondingly, the effects of
TMR with a longer delay between encoding and retrieval have not been investigated that
thoroughly (Oudiette & Paller, 2013). Research on long-term effects of sleep and learning
new material shows changes in the hippocampus and medial prefrontal cortex (mPFC), from
up to 2 days to 6 months later (Gais et al., 2007). We identified one study assessing emotional
memories in socially anxious and healthy children, including TMR methods with cued and
uncued stimuli. The authors did not find a difference between emotional valence and its
modulation by memory cuing between the groups the morning after, yet at the one-week
follow-up a difference became prevalent. The ability to remember cued stimuli better than
uncued stimuli ,not related to emotional valence, was no longer evident one week later (see
Groch et al., 2017 for further details and interpretations). Conclusively, there has not been
identified sufficient amount of studies with follow-up assessments to capture the long-delayed
effects by TMR on memory.
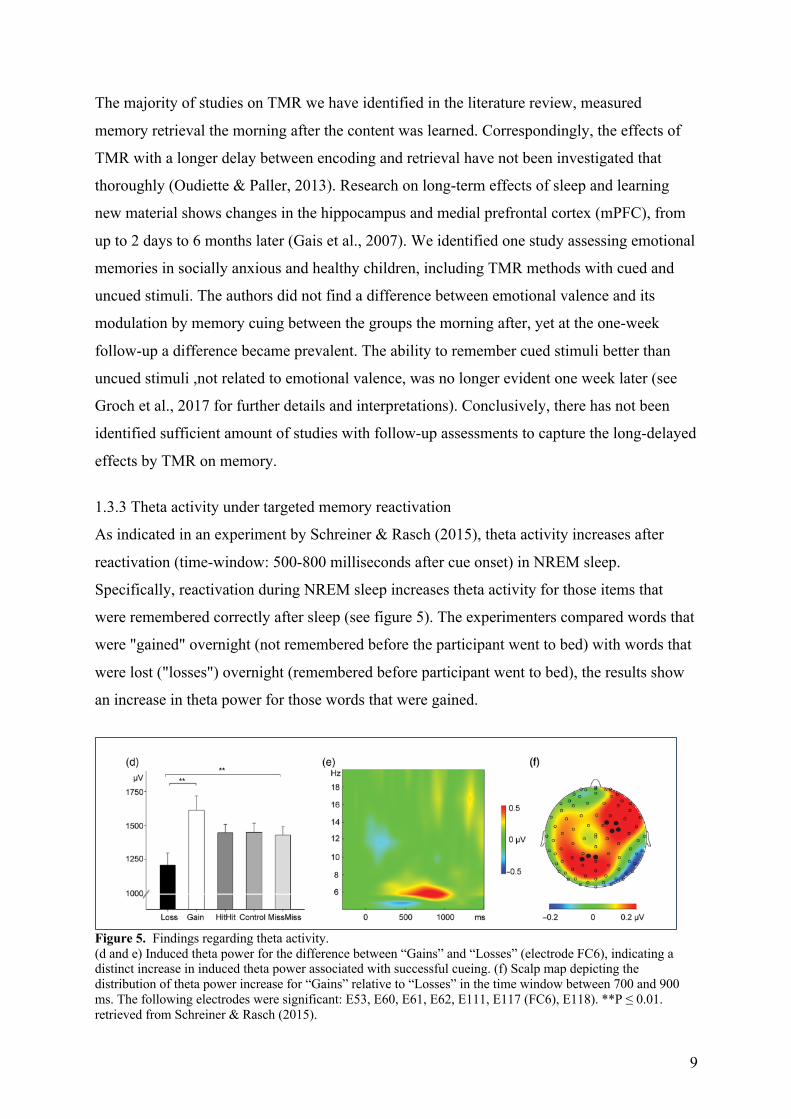
1.3.3 Theta activity under targeted memory reactivation
As indicated in an experiment by Schreiner & Rasch (2015), theta activity increases after
reactivation (time-window: 500-800 milliseconds after cue onset) in NREM sleep.
Specifically, reactivation during NREM sleep increases theta activity for those items that
were remembered correctly after sleep (see figure 5). The experimenters compared words that
were "gained" overnight (not remembered before the participant went to bed) with words that
were lost ("losses") overnight (remembered before participant went to bed), the results show
an increase in theta power for those words that were gained.
Figure 5. Findings regarding theta activity. (d and e) Induced theta power for the difference between “Gains” and “Losses” (electrode FC6), indicating a distinct increase in induced theta power associated with successful cueing. (f) Scalp map depicting the distribution of theta power increase for “Gains” relative to “Losses” in the time window between 700 and 900 ms. The following electrodes were significant: E53, E60, E61, E62, E111, E117 (FC6), E118). **P ≤ 0.01. retrieved from Schreiner & Rasch (2015).

10
Moreover, a similar study found a blocking effect of memory benefits when new information
was presented with a short delay (200 ms) after a cue as compared to a longer delay (1500
ms) (Schreiner, Lehmann, et al., 2015). The researchers also found a decrease in theta activity
after the short delay and discussed whether the new stimulus interrupted the ongoing theta
activity. Possibly arguing for a critical role of theta activity for successful reactivation. A
newer study showed the same neural patterns in the theta frequency range during sleep and
wake at the retrieval test (see figure 6). Altogether, the authors argued that theta activity is
associated with establishing the reactivations of memories in both sleep and wake state and
that the effect might be independent of the state.
Figure 6. overview of findings. Cue-triggered memory reactivation shares the same neural signatures during wakefulness and sleep. Theta oscillations orchestrate the reactivation of memories during both physiological states. During sleep, reactivation patterns autonomously re-emerge at a rate of 1 Hz, indicating a coordination by slow oscillations. retrieved from Schreiner and collegues (2018).
1.4. Transcranial Alternating Current Stimulation
tACS stimulation is a non-invasive method that can be used to affect ongoing neural
processes by directly interfering with cortical rhythms and has been suggested as a
mechanism to actively synchronize cortical oscillations (Paulus, 2011). tACS is considered a
safe stimulation as it is non-invasive, focal, selective, and painless (Antal et al., 2008; Chaieb
11
et al., 2014). tACS has also been found to have long-lasting effects beyond the stimulation
itself. To illustrate, tACS stimulation for 10 minutes (according to individual EEG alpha
frequency) showed significant effective modulation of the EEG individual alpha frequency in
participants (Zaehle et al., 2010). Furthermore, an extension of this finding showed those
effects to last up 30 minutes after stimulation (Neuling et al., 2013). It should be emphasized
that these findings have so far been found in the alpha frequency band (Kasten, Dowsett, &
Herrmann, 2016 with findings up to 70 min of increased activity), and there are not as
consistent findings for the theta range (Pahor & Jaušovec, 2018; Vosskuhl et al., 2015).
Overall, tACS stimulation applies an alternating current between the switching anode and
cathode (Paulus, 2011), which might optimize the conditions for flow of information between
frontal and MTL areas. Using tACS to induce theta activity might therefore be an appropriate
device to enhance the transfer of memory from short-term to long-term storage sites.
One previous study used tACS to investigate the effects of theta in working memory
capacity, and a beneficial effect was found under stimulation of theta frequency in fronto-
parietal areas as compared to sham (Jausovec et al., 2014). Polanía and collegues (2012)
conducted an experiment to investigate the relevance of phase coupling of the theta frequency
band with tACS stimulation. The experimenters found that when frontoparietal network was
stimulated with an oscillation current at 0 vs. 180 degrees, the 0-degree oscillation improved
later memory whereas the 180-degree worsened it. Hence, the timing and coupling of theta
oscillations might be of importance. There are also previous studies that have investigated the
function of theta activity in NREM sleep under TMR, however with different stimulation
techniques (otDCS) (Marshall, Helgadóttir, Mölle, & Born, 2006, Marshall, Kirov, Brade,
Mölle, & Born, 2011). The overall findings did not show an advantage of stimulation in the
theta frequency on memory or sleep facilitating memory processes. However, there are
technical aspects of the stimulation to consider in the studies mentioned above. The studies
mostly stimulated frontal areas (positive polarization in fronto-lateral electrodes) and thereby
might have neglected the role of the hippocampus as a generator of theta activity.
Furthermore, different stimulation techniques stimulating in the theta frequency range have
shown divergent effects on memory performance (Lang et al., 2019), and findings from
studies with other types of stimulation techniques ought to be interpreted with caution.
1.5 Aims
Based on previous findings on the functions underlying theta activity and the potential roles
in encoding, reactivation and retrieval, it was decided to conduct three studies with the aim of

12
investigating the function underlying theta in these memory processes. This thesis focused on
the reactivation part of the memory process. The aim was to use tACS at an individual’s
dominant theta frequency to increase intrinsic oscillatory activity. Thereby, to investigate the
functional relevance of theta for NREM sleep under TMR and its associated effects on
memory consolidation. To isolate the effect of the theta stimulation, a control stimulation of
beta (23 Hz), thought irrelevant to the consolidation mechanism in NREM sleep, was
included as a control stimulation. For comparison, it was also included a condition with
neither stimulation nor TMR (uncued). The overnight performance was assessed with a
vocabulary learning task with correctly remembered items as a measure of performance.
As gains and losses had been used as a tool in previous studies (discussed above) to
detangle the effect of the overall memory performance, I included a similar method as an
exploratory analysis aiming to potentially get further information about the overall memory
performance. Follow-up assessments were also added as an explorative measure with the aim
of assessing the long-term effects of TMR and theta/beta stimulation. Furthermore, sleep
stages between the stimulation blocks was collected to investigate whether there was an
immediate change in the sleep structure due to the stimulation. Sleep architecture for the full
night was examined with the aim to get an overview of the sleep quality and to see if there
was an influence on the memory performance the morning after. Furthermore, I conducted
some preliminary comparisons of descriptive data with other studies investigating on TMR
(see discussion) and added a preliminary comparison of memory performance with respect to
the order of the stimulations. Questionnaires assessing sleep quality, mood and tiredness were
included to get an impression of the traits and states of the participants. All these assessments
were treated as exploratory as we did not have sufficient theoretical support to assume a
strong direction of the effect beforehand.
1.6 Hypothesis
We expected an improvement in memory performance for those items that received theta-
tACS during reactivation, compared to those items that received control beta stimulation and
items that were never reactivated (uncued). An underlying assumption was therefore that
theta-tACS is indeed able to modify the ongoing brain state during nocturnal reactivation of
previously encoded Dutch-German word pairs. Lastly, I want to note that the current data
material is collected from a small sample which reduce inferences from the analysis and
thereby our ability to assess this hypothesis.

13
2. Methods
2.1 Participants
The study recruited 35 German native speakers from a student-cohort of the University of
Fribourg (Switzerland) via flyers and advertisement on social media. Central criteria for
inclusion were right handedness, no prior knowledge of Dutch, no disorders of neurological
and/or psychological nature, no intake of psychotropic and/or narcotic drugs, no shift work
during last 6 weeks, no known sleep disturbances or pregnancy. Beck Depression Inventory
(BDI) (Kuehner et al., 2007) scores (M = 3, SD 2.8) were a part of the inclusion/exclusion
criteria, and all participants with scores above 14 were excluded from the study. This led to a
sample of 15 participants scheduled for the experiment.
Unfortunately, the data collection and recruiting were disrupted due to circumstances
around the covid19 virus. The final sample was 7 participants, see figure 7 for a flow chart of
the recruiting procedure. The sample consisted of 5 females and all participants were between
18-30 years of age (M=21.57, SD =3.91). Participation in the study required a signed consent
form and the fulfilment of all demands (include/exclude criteria). Subjects were compensated
with a small reimbursement of 130 CHF for a complete participation in the study. The study
was approved by Swiss Ethics Committees.
Figure 7. Flow chart of the study. Out of 35 volunteers screened, 15 fulfilled the requirements. Five participants were not measured due to closing of laboratories. Three participants ended the experiment premature, or were excluded due to technical issues, leaving seven subjects for analysis.
Email screening N=35
Exclusion (N=20)• Inclusion/exclusion
criteria
Scheduled for experiment N=15
Attending experimental nights N=10
Not finished (N=5)• Closing of labs due to
covid19 virus
Excluded (N=3)• Premature termination
of experiment (N=2)• Technical issues
(N=1)Included in analysis N=7

14
2.2 Design
The experiment had a crossover within-subject-design and stimulation of theta-tACS/beta-
tACS were randomized completely over all participants. The randomization procedure was
conducted before the beginning of the data collection, via an online randomization tool
(https://www.random.org). Participants were allocated to a stimulation order, and this was
sealed in an envelope for the experimenters to open after participants had gone to bed. The
experiment was double blinded, neither the participants nor the experimenters were aware of
the order of theta/beta stimulation while it could affect the participants’ performance.
2.3 Procedure
Participants completed a total of two sessions in the study, both conducted at the University
of Fribourg in a sleep laboratory. Before the experimental session, participants spent an
adaptation night to habituate with the experimental setting in the sleep laboratory. Participants
arrived in the laboratory in the evening and were instructed to complete the Pittsburgh Sleep
Quality Index (PSQI) (Buysse et al., 1989) as well as other questionnaires that will not be
considered in this thesis. Followingly, the researchers prepared participants for
polysomnographic recordings, and attached stimulation electrodes before the participants
went to sleep. Subjects were awoken at 7:30 the following day and were freed from the
equipment and reminded to return for the experimental session.
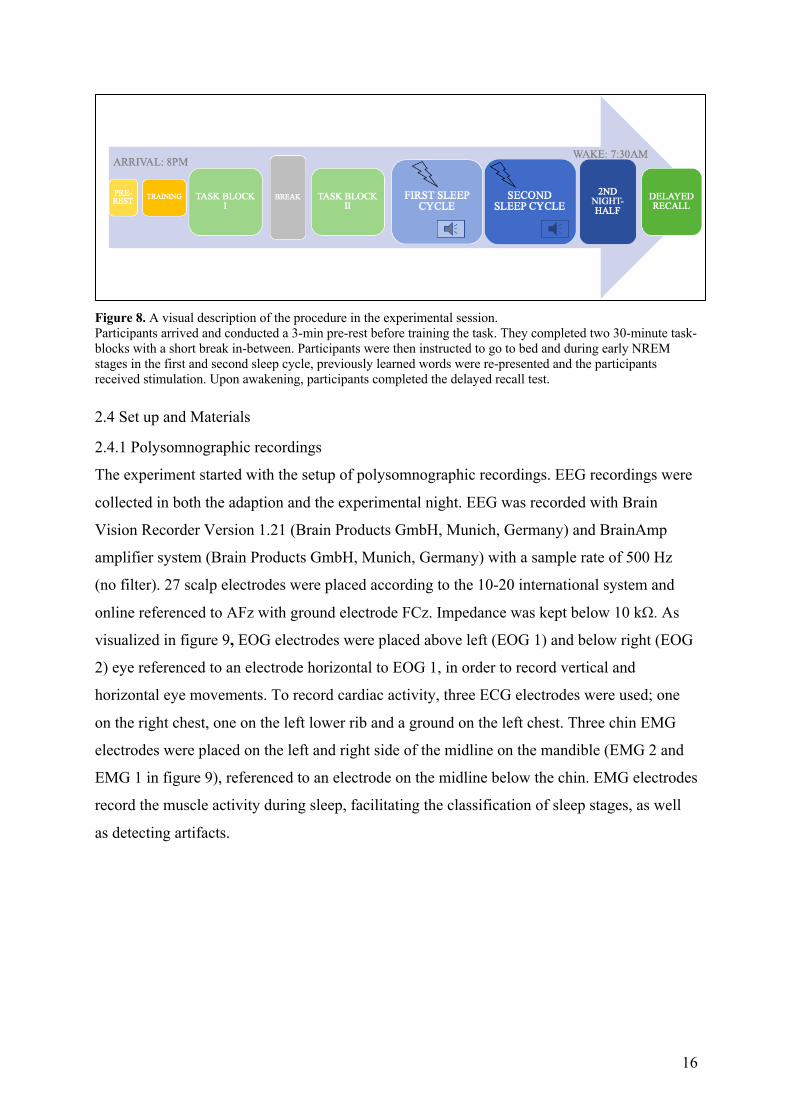
In the experimental session (see figure 8), subjects arrived in the laboratory in the
evening and were prepared with the same equipment as in the adaptation night. After, they
conducted tasks on a Windows 10 computer with stimuli presented electronically using the E-
prime 3.0 software (Psychology Software Tools, Pittsburgh, PA). All participants were seated
at a distance of approximately 70 cm from the computer screen. Responses were given via
keyboard or a microphone. The participants conducted a rest EEG task and were instructed to
sit calmly and close their eyes for three minutes until the researcher notified them the task was
completed. After training the memory task (see vocabulary learning task), they completed
questionnaires assessing their mood state (see MDBF under “questionnaires”) and level of
tiredness (see VAS under “questionnaires”). The VAS questionnaire was given to the
participants at four different timepoints: Before task block I (PreTask), after task-block I
(PostTask1), after task block II (PostTask2) and before the delayed recall in the morning after
(PreDelay). Followingly, subjects learned 2 lists of Dutch-German word pairs (WP) and upon
completion of the memory task they went to sleep.

15
Sleep stages were distinguished online by a researcher based on the patterns of
oscillatory brain activity, muscle tone intensity, and eye movements during sleep. When
participants entered stable sleep stage N2/N3 (4 minutes of consecutive sleepstage N2/N3),
the electrical stimulation and targeted memory reaction procedure began. In each of the two
sleep cycles used for reactivation, the first block of reactivation was accompanied by a
stimulation in either theta or beta frequency range (the order of stimulation with respect to
both cycles was randomized over all participants). The first block lasted for ~ 9 minutes.
After the first block, there was a break of at least 1-minute where the experimenter(s) ensured
the participant was still in NREM sleep. In case of continuing NREM sleep, another ~9
minute-block with reactivation only (no electrical stimulation) followed. A unique set of cues
(see Reactivation of Vocabulary) was presented acoustically at hearing threshold (50 Decibel)
in each of these blocks. When the participants had received a minimum of 40 minutes (4
blocks) with reactivation in both cycles, they slept until 7:30 the following morning at which
point they were woken up.
Participants were then asked to do their morning routine. After the researchers had
checked if the recording signals were still in god condition, participants’ recall performance
of the memorized word pairs was retrieved while EEG was recorded.
Before leaving, the participants filled out questionnaires assessing their perceptions of the
stimulation and the experiment. Finally, they were informed they could voluntarily enter a
link and respond to a questionnaire one week later.
The online questionnaire was distributed through SoSciSurvey (www.soscisurvey.de)
and consisted of demographic questions assessing their motivation to do the questionnaire and
the sleep quality the last week. The test was a multiple-choice test with Dutch words
presented and the participants were instructed to choose between three German translations,
the participants could also choose “I do not know the answer”. The test consisted of 70 WPs
in total.
16
Figure 8. A visual description of the procedure in the experimental session. Participants arrived and conducted a 3-min pre-rest before training the task. They completed two 30-minute task-blocks with a short break in-between. Participants were then instructed to go to bed and during early NREM stages in the first and second sleep cycle, previously learned words were re-presented and the participants received stimulation. Upon awakening, participants completed the delayed recall test. 2.4 Set up and Materials
2.4.1 Polysomnographic recordings
The experiment started with the setup of polysomnographic recordings. EEG recordings were
collected in both the adaption and the experimental night. EEG was recorded with Brain
Vision Recorder Version 1.21 (Brain Products GmbH, Munich, Germany) and BrainAmp
amplifier system (Brain Products GmbH, Munich, Germany) with a sample rate of 500 Hz
(no filter). 27 scalp electrodes were placed according to the 10-20 international system and
online referenced to AFz with ground electrode FCz. Impedance was kept below 10 kΩ. As
visualized in figure 9, EOG electrodes were placed above left (EOG 1) and below right (EOG
2) eye referenced to an electrode horizontal to EOG 1, in order to record vertical and
horizontal eye movements. To record cardiac activity, three ECG electrodes were used; one
on the right chest, one on the left lower rib and a ground on the left chest. Three chin EMG
electrodes were placed on the left and right side of the midline on the mandible (EMG 2 and
EMG 1 in figure 9), referenced to an electrode on the midline below the chin. EMG electrodes
record the muscle activity during sleep, facilitating the classification of sleep stages, as well
as detecting artifacts.

17
Figure 9: Visual representation of the single electrodes. Electrodes were placed on the approximate positions. Ref = reference electrode.
2.4.2 Transcranial Alternating Current Stimulation
In order to manipulate the intrinsic oscillatory activity, a battery driven device (Neuroconn
model: DC Stimulator Plus, GmbH, Ilmenau, Germany) was used. To determine accurate
positioning of the electrodes, field analyses were performed using Roast V2.7.1(Huang et al.,
2019), see figure 10. Four 5x5cm rubber electrodes were attached to the head bilaterally
underneath the EEG recording cap over frontal (Fp1 & Fp2) and parietal (P7 & P8) locations,
see figure 11. Alternating current stimulation was delivered via Fp1 and P7 (in phase) to the
return electrodes at FP2 and P8 (in phase). A splitter box was used to split the current. Current
density per electrode was 0,08 mA/cm2 with an intensity of 2mA peak to peak. Electrodes
were kept in place using conductive Ten20 paste (Weaver and Company, Colorado, USA).
Figure 10: Modelling. This figure shows a picture of the modelling conducted with field analysis, showing increased voltage in electrical fields mainly in the MTL areas and PFC areas in a coronal view (left) and left hemisphere view (right). The right picture includes the electrode positions.

18
Figure 11. EEG capping with tACS electrodes. Red representing electrodes which the current was delivered via, and blue representing return electrodes.
Stimulations were delivered in blocks of 9 minutes (2 -3 blocks, depending on the length of
N2/3 sleep stages) either in the range of theta or beta frequency band. The theta frequency
was adjusted for individually calculated theta. The method for calculating individual theta
frequency (ITF) was determined based on recommendations by Wolfgang Klimesch (1999) of
using individual alpha frequencies (IAF) as an anchor for ITF. We followed the method used
in an experiment by Jausovec and collegues (2014) investigating theta-tACS on working
memory. The ITF was computed as individually determined alpha peak minus 5 Hz. The
individual alpha peak was calculated using a MATLAB- (version r2019a) based script by
Corcoran, Alday, Schlesewsky, & Bornkessel-Schlesewsky (2018), based on data from the
EEG recording of the rest task collected in the beginning of the experiment. Stimulation in the
range of beta frequency band was set to a fixed value of 23 Hz to avoid interference with the
spindle frequency band 8-15 Hz, which might be a part of the memory consolidation process
(Diekelmann & Born, 2010). Fade in/out times were set to 10 seconds in the theta condition
(cycles varied depending on the calculated ITF), and 100 x 2𝜋 for the beta stimulation.
Impedance was kept below 5 kΩ.
2.4.3 Vocabulary learning task
Before beginning the learning session, participants conducted a short training session to
familiarize them with the procedure. Subjects were then presented acoustically with 140
Dutch-German word-pairs in total. The 140 WPs were split into two lists such that each list
consisted of 70 WPs (hereby referred to as list A and list B). Both lists were created equally in

19
terms of number of characters and Levenshtein distance. The two lists were then randomly
allocated to either task block I or II such that the order of two lists were randomized over all
participants.
Each task block consisted of three rounds; the encoding phase, recall+feedback, and
immediate recall (see figure 12). In the encoding phase, participants were acoustically
presented with a WP consisting of a Dutch cue and a German translation and were asked to
try to memorize the WPs. In the recall+feedback, they were presented with the Dutch cue and
were asked if they remembered the German translation or not. If they indicated that they
remembered the translation, they were asked to give a response verbally. Afterwards, they
were given the correct translation independently of their answer. In the immediate recall,
participants were presented with the Dutch cue and asked to give a response, but no feedback
was given. The delayed recall was conducted the next morning after nocturnal sleep and
consisted only of the recall phase (similar to immediate recall), containing the Dutch cues
from the encoding session as well as those Dutch cues only presented during the nocturnal
reactivation (hereby referred to as list C and list D, respectively; see reactivation of
vocabulary).
Figure 12. Vocabulary learning task In the encoding phase, participants were first presented with a Dutch cue and then the correct German translation. In the second round they were again presented the Dutch cue, asked to recall the German translation and then given the correct answer. Finally, the participants were presented the Dutch cue and asked to recall the German translation with no feedback given.
2.4.4 Reactivation of Vocabulary
The total of 140 WPs was divided into two categories; “remembered” and “not remembered”,
based on what participants stated they remembered in the recall test of each task-block. The
Milch
Melk
Encoding
Affe
Aap
WP 1
WP 2
WP 1
WP 1
...70 WP
...70 WP
response
WP 2
Recall+feedback
Melk
Milch
...70 WP
Immediate/delayed recall
Melkresponse
Aapresponse
WP 1
WP 1
...70 WP
20
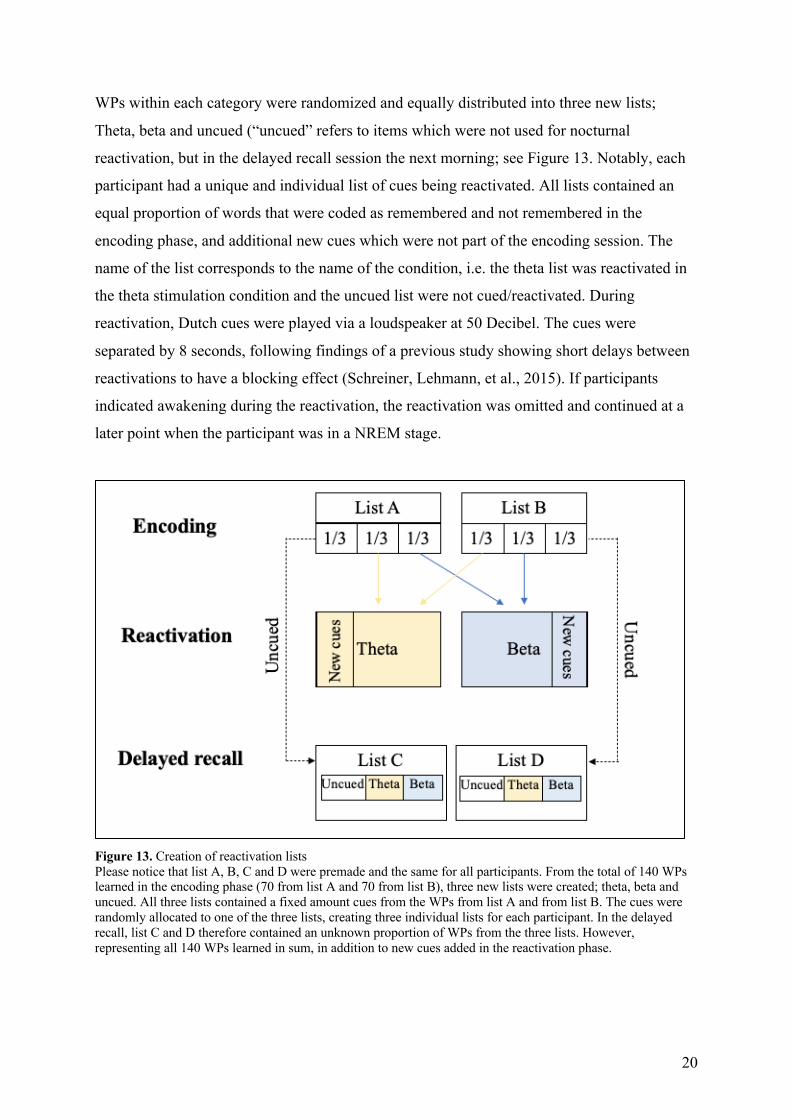
WPs within each category were randomized and equally distributed into three new lists;
Theta, beta and uncued (“uncued” refers to items which were not used for nocturnal
reactivation, but in the delayed recall session the next morning; see Figure 13. Notably, each
participant had a unique and individual list of cues being reactivated. All lists contained an
equal proportion of words that were coded as remembered and not remembered in the
encoding phase, and additional new cues which were not part of the encoding session. The
name of the list corresponds to the name of the condition, i.e. the theta list was reactivated in
the theta stimulation condition and the uncued list were not cued/reactivated. During
reactivation, Dutch cues were played via a loudspeaker at 50 Decibel. The cues were
separated by 8 seconds, following findings of a previous study showing short delays between
reactivations to have a blocking effect (Schreiner, Lehmann, et al., 2015). If participants
indicated awakening during the reactivation, the reactivation was omitted and continued at a
later point when the participant was in a NREM stage.
Figure 13. Creation of reactivation lists Please notice that list A, B, C and D were premade and the same for all participants. From the total of 140 WPs learned in the encoding phase (70 from list A and 70 from list B), three new lists were created; theta, beta and uncued. All three lists contained a fixed amount cues from the WPs from list A and from list B. The cues were randomly allocated to one of the three lists, creating three individual lists for each participant. In the delayed recall, list C and D therefore contained an unknown proportion of WPs from the three lists. However, representing all 140 WPs learned in sum, in addition to new cues added in the reactivation phase.

21
2.4.5 Analyses of Sleep stages
Sleep stages were first distinguished online by a researcher based on the patterns of
oscillatory brain activity, muscle tone intensity, and eye movements during sleep following
the AASM criteria for online scoring of NREM 1,2,3 and REM sleep (Iber et al., 2007). In
offline scoring, EEG signal was filtered (low cut off: 0.032 Hz; high cut off: 35 Hz, notch
filter), re-referenced to the averaged mastoids, and down sampled to 200 Hz using Brain
Vision Analyzer version 2.1 (Brain Products GmbH). Offline sleep-stage scoring, and sleep
stage analyses, were both scored based on 30s epochs through SchlafAus v1.5 (Steffen Gais,
Lübeck; Germany). Sleep stages were determined by 3 independent raters according to the
standard criteria for NREM 1,2,3 and REM sleep (Iber et al., 2007). Intervals during acute
stimulation were not scored due to the excessive signal artifacts. See figure 14 for an example
of a hypnogram.
Figure 14. Hypnogram The figure shows an example of a hypnogram from the second night, from one of the participants in the study. W: Wake; REM; S1:N1, S2; N2 S4 (not relevant); M: movement time, but reflects also stimulation cycles (see large black bars) small bars refer to movement arousal.
2.4.6 Questionnaires
Visual Analogue Scale (VAS) scale was used to assess the tiredness of the participants. The
questionnaire is scored from 1- 10 on a Levenes scale. 1 indicating “tired” increasing to 10
indicating “wake” (Killgore, 1999). PSQI was included to assess the sleep quality of the
participants (Buysse et al., 1989). MDBF is referred to as MDSQ in English
(Multidimensional Mood State Questionnaire) and was incorporated to assess the mood state
of the participants. Specifically, the MDBF is divided in subparts GS (good,bad), RU (rest,
unrest) and WM (awake, tired) (Steyer, Schwenkmezger, Notz and Eid, 1997). An after-
23:59 00:59 01:59 02:59 03:59 04:59 05:59 06:59
W
REM
S1
S2
S3
S4
M
Time
Proband: ThetaMEMreact_VP04_sleep2.vhdr

22
stimulation questionnaire, developed by Universitätsmedizin Göttingen for participants to
report possible feelings or sensations related to the stimulation, was used here as well (see
appendix A).
2.5 Data analysis
All statistical analyses were conducted through R version 3.6.2 (R Core team, 2019). A two-
sided significance α-level was set to .05 in all analyses.
2.5.1 Behavioral analyses
The acoustically recorded answers from participants were coded by researchers who were
German speakers. The experimenters coded the correctness of each answer accepting only
answers that completely matched the learned translations. Due to a technical error with the
MATLAB script assigning words to the different condition lists, some words were repeated in
the beta and theta list. On average, 8 words were repeated for every participant. These words
were excluded from the analysis. To solve the inconsistency in the amount of words between
the beta/theta lists and the uncued list, the scores were calculated as the proportion of correct
answers in each condition list. Since the follow-up test only contained half of the words
learned (only from list A) and reactivated during the night, the correct answers were
calculated as a proportion of possible correct answers for each condition in the follow-up list.
2.5.1.1 General memory performance
In the analysis of correct answers, I used the R-package lme4 (Bates, Maechler & Bolker,
2012) to perform a linear mixed effects analysis. The linear mixed effects model was chosen
due to its advantages and flexibility with regards to constructing a model with both fixed and
random effects and handling of potential missing data (Cnaan et al., 1997). It has been
recommended to “keep it maximal” with respect to the random effects structure, and to
include those random effects which are supported by the experimental design
(Barr,Levy,Scheepers, & Tily, 2013). Our random effects were specified a priori based on our
hypothesis and theoretical assumptions, we expected individual differences between
participants to explain variance, and it was seen as an advantage to be able to add this as a
random structure in the model to account for this variance. With respect to the fixed effects, I
attempted to add a bare minimum in order to not overfit the model (Babyak, 2004) and as I
saw it unlikely the model would support a very complex structure with the current small

23
sample. The linear mixed effects analyzed the relationship between correctly remembered
words and conditions across time, and were based on this model:
𝛾!" =𝐵#" + 𝐶𝑜𝑛𝑑𝑖𝑡𝑖𝑜𝑛$!"# + 𝑇𝐼𝑀𝐸$$# + 𝐶𝑜𝑛𝑑𝑖𝑡𝑖𝑜𝑛 ∗ 𝑇𝐼𝑀𝐸𝜒%!" + 𝜀!"
𝐵#" = (𝐵# + 𝜇#")
Where 𝛾!" is the memory score at timepoint i for subject j. 𝜒&!" is the conditions (beta, theta
and uncued) at timepoint i for subject j. 𝜒'" is time (immediate/delayed) for subject j. 𝜒%!" is
the value for the interaction for Condition and TIME for timepoint i and subject j. 𝐵#" is the
random intercept for subject j, such that 𝐵# is the fixed intercept and 𝜇#" is the residual or
random effect for the intercept for subject j. Visual inspection of residual plots (see appendix
B) did not reveal any obvious deviations from homoscedasticity or normality.
To assess how much variation was explained by the different stimulations (excluding
the uncued condition), a random slope between the stimulation conditions was added to a
similar model (model 2). With the aim of further explaining the amount of variance in the
stimulation conditions, I included a random slope such that participants were not only allowed
to have differing intercepts (Model 1), but where they are also allowed to have different
slopes for the effect of stimulation:
𝛾!" =𝐵#" + 𝐵&"𝑆𝑇𝐼𝑀𝐶𝑜𝑛𝑑𝑖𝑡𝑖𝑜𝑛$!"# + 𝑇𝐼𝑀𝐸$$# + 𝑆𝑇𝐼𝑀𝐶𝑜𝑛𝑑𝑖𝑡𝑖𝑜𝑛 ∗ 𝑇𝐼𝑀𝐸𝜒%!" + 𝜀!"
𝐵#" = (𝐵# + 𝜇#")
𝐵&" = (𝐵& + 𝜇&")
With the difference from the previous model is that “Condition” is replaced with
“STIMCondition” (beta and theta). 𝐵&" is the random slope for STIMCondition (beta and
theta), this term estimates the slope of the overall model fitted to the data, 𝐵& , and the
variability of slopes in different context around the overall model, 𝜇&". No extreme outliers
were detected, and memory scores were normally distributed in each condition, as assessed by
Shapiro-Wilk’s test (p > .05). Visual inspection of residual plots (see appendix B) did not
reveal any obvious deviations from homoscedasticity or normality.
The use of significance effects for the interpretation of results in linear mixed models
are a topic of discussion (Luke, 2017). However, I chose to include p-values for all individual
predictors for illustrative purposes collected through lmertest in R via Satterthwaite's degrees
of freedom method (Kuznetsova et al., 2017). Furthermore, p-values were obtained by
likelihood ratio tests, as recommended by Zuur et al., (2009), of the full model with the

24
random effect in question against the model without the random effect in question (0 model).
Mainly to assess the changes in the model fit (AIC and BIC as criteria for model selection)
due to adding a random effect structure.
2.5.1.2 Gains and Losses
The words were also divided into groups of gains and losses. “Gains” refer to words which
had not been remembered in the immediate recall but were successfully retrieved at delayed
recall. In contrast, “Losses” were words which had been successfully retrieved at a immediate
recall but were not remembered delayed recall. The participant could “gain” or “lose”
retrieval of a word from the immediate to delayed recall. The gains and losses were calculated
as a proportion of each condition list.
In the gains data, two outliers were identified in two participants in the uncued
condition. The outliers were considered extreme and a Shapiro test indicated the sample was
not normally distributed in the uncued condition, p <.001. Therefore, it was determined to use
a Friedman ANOVA test to compare the mean differences in proportion of gains (DV) within
participants over the conditions (IV levels: theta, beta and uncued) to account for the violation
of these assumptions (Field, 2013, p. 249-258).
To analyze losses, a one-way repeated measures ANOVAs was used to compare the
mean differences in proportion of losses (DV) within participants over the conditions (IV
levels: theta, beta and uncued). Two datapoints were identified as outliers in the beta and
uncued condition within one participant. The outliers were not considered extreme as the
participant overall scored at a similar level in all three conditions. Hence it was determined to
be a reflection of few participants and proceeding with the analysis would be proper. The
losses score was normally distributed in each condition, as assessed by Shapiro-Wilk’s test (p
> .05).
2.5.1.3 Follow-up
A one-way ANOVA was used to compare the mean differences of proportion of correctly
remembered words (DV) in the follow up measure over the three conditions (IV levels: theta,
beta and uncued). One participant was excluded due to lacking data which led to a total N= 6.
Two datapoints were identified as outliers in the beta and theta condition within one
participant. The outliers were not considered extreme as the participant overall scored at a
similar level in all three conditions. Hence it was determined to be a reflection of few

25
participants and proceeding with the analysis would be proper. The memory score was
normally distributed in each condition, as assessed by Shapiro-Wilk’s test (p > .05).
2.5.2 Analyses of Sleep
The percentage of time spent in sleep stages (Awake, N1, N2, N3, and REM) after each
unique stimulation block, was collected with a R script (see appendix A) that reported the
sleep stages in the ~9-min stimulation free intervals after each stimulation epoch. The
percentage of time spent in sleep stages after stimulation was compared between the
stimulation blocks (theta/beta). For the “awake” stage, the assumption of normality was
violated (Shapiro-Wilk’s test (p = .039)), and due to this violation, it was chosen to conduct
single tests for all sleep stages. For the wake condition, the means were compared with a
Paired Samples Wilcoxon Test to account for the violation of normality. Sleep stages (N1,
N2, N3, and REM) were analyzed with separate paired t- test to compare the mean differences
between the stimulation conditions (beta and theta). Assumptions of normality were not
violated, Shapiro-Wilk’s test (p > .05) in either of these tests. Furthermore, the percentage of
time spent in sleep stages (N1, N2, N3, and REM) for the full night was correlated with the
performance in the delayed recall with a Pearson correlation. Assumptions of normality and
linearity related samples were visually inspected and determined not to be violated.
As an additional exploratory interpretation of the data, I subtracted the scores in the
delayed recall from the immediate recall to assess the change over time disregarding initial
performance for each participant. Then I faceted this data into the order of stimulations, such
that I could separate between the change in memory performance for participants who
received theta in the first sleep cycle (N=3), and those who received theta in the second sleep
cycle (N=4). Only the descriptive data will be presented, and no analyses were conducted due
to the small sample sizes in each group.
2.5.3 Analysis of questionnaires
A Pearson correlation test was used to assess if there was a significant relationship between
measures in the VAS, PSQI and MDBF scale and the performance in the immediate recall
and delayed recall (only for VAS pre- delayed recall). Assumptions of normality, no extreme
outliers and linearity were visually inspected and determined not to be violated. Furthermore,
a one-way repeated measures ANOVA was used to compare means in the VAS scale (DV) at
different timepoints (IV levels: Pre task block 1, Post task block 1, Post task block 2 and Pre

26
delayed recall) to investigate if there were any significant difference within participants in
tiredness at the different timepoints. Assumption of no-extreme outliers was not violated, the
VAS scores were normally distributed at each timepoint, as assessed by Shapiro-Wilk’s test
(p > .05).
3. Results
3.1 Behavioral findings
Behavioral findings for general memory performance, gains and losses, and follow-up will be
provided in the subsequent order in this section. See table 1 for an overview of the descriptive
data for memory performance in immediate and delayed recall, follow-up, and the gains and
losses from immediate to delayed recall.
Table 1 | Descriptive data of memory performance
Theta, mean (SD) Beta, mean (SD) Uncued, mean (SD)
Immediate recall 33.77 (17.13) 29.4 (18.31) 31.18 (16.75)
Delayed recall 32.11 (16.06) 31.80 (19.12) 27.89 (15.87)
Follow-up 71.63 (22.67) 64.83 (11.34) 71.98 (18.89)
Gains 6.80 (0.06) 5.51 (0.05) 3.13 (0.04)
Losses 8.46 (0.04) 3.11 (0.04) 6.42 (0.05) Note: Numbers are reported as mean percentages with standard deviations (SD) for theta, beta and uncued condition. N = 7; Follow-up: N = 6. Gains and losses are calculated from the performance in the immediate to delayed recall within each participant.
3.1.1 General memory performance
Memory scores in percentage were retrieved from the immediate and delayed recall in the
beta, theta and uncued condition, please see table 1 for descriptive data. In the theta condition,
average memory performance was lower in the delayed recall (M=32.11, SD=16.06)
compared to the immediate recall (M=33.77, SD = 17.13). In the uncued condition,
performance was lower in the delayed recall (M=27.89, SD=15.87) compared to the
immediate recall (M=31.18, SD=16.75). For the beta condition, average memory performance
was higher in the delayed recall (M=31.80, SD= 19.12) compared to immediate recall
(M=29.4, SD=18.31) based on descriptive data.
Overall, the linear mixed model analysis of general memory performance revealed one
significant effect for intercept (see model 1). Indicating the participants’ initial performance
levels in the uncued condition differed from 0 (p <.01). No other significant effects (main

27
effect TIME and Condition, interaction effect Condition*TIME) were observed (p >.3). See
model 1 for all coefficients.
The slopes will be included as an additional source of information, although it should
be noted the effects were found to be non-significant. Model 1 indicate that theta, as
compared to uncued, had a 1.64% more mean increase in memory performance from
immediate to delayed recall. Beta, as compared to uncued, had 5.69% higher change in
memory performance from immediate to delayed recall. According to model 1, beta had the
highest increase in memory performance from immediate to delayed recall, also compared to
theta (4.06%) however with standard errors estimated to be 6.06%.
With regard to the random effect, the likelihood ratio test (see appendix B) indicated
that model 1 explained significantly more variance (AIC: 330.52, BIC: 344.43, x2 = 37.41,
df= 1, p<.001) as compared to a model without the random intercept (0 model, AIC: 365.93
BIC: 378.10). Model 1 indicates the effects due to the random intercept of participants
account for 190.9 out of a total variance of 255.06, hence, explain ~75% of the total variance
in this model. In sum, model 1 show no significant effects in the main and interaction effects,
from investigating the slopes beta had the greatest advantage (albeit with great standard error)
and the random intercept explain considerable parts of variance in the random effect.
Table 2 | model 1 (Intercept condition: uncued, intercept time: immediate)
Fixed effects Coef. (𝐵) SE (𝐵) t-value p-value*
Intercept 31.183 6.036 5.166 <.001*
Condition (beta) -1.781 4.281 -0.416 .679
Condition (theta) 2.587 4.281 0.604 .549
Time (delayed) -3.295 4.281 -0.770 .447
Condition(beta): Time(delayed) 5.696 6.055 0.941 .353
Condition (theta): Time (delayed) 1.637 6.055 0.270 .788
Random intercept Variance SD
Participant 190.90 13.82
Residuals
Total variance
64.16
255.06
8.01
AIC
BIC
330.5
344.4
Note:* p-value indicating significance level <.05 𝐵 = regression coefficients; SE = standard error; AIC = Akaike information criterion; BIC =Bayesian Information Criterion. N= 7

28
The linear mixed model analysis of general memory performance in the stimulation
conditions (theta and beta) are shown in table 3. Model 2 also show a significant effect of
intercept (p= .002). Indicating the differences in participants’ initial performance in the beta
condition are significantly different from 0. The same trends in the result for the main effects
and the interaction effect applies in model 2 as in model 1, and show no significant effects. As
for the random effects, the random intercept explains a variance of 278.26 (≈ 62% of total
variance). The variation in slopes from the beta to theta condition accounts for 143.66 (≈ 32%
of total variance). The likelihood ratio test compared Model 2 with a 0 model (containing
only the random intercept), and found a significant better fit of the model when the random
slope was included in model 2 (AIC: 222.49, BIC: 233.16, x2=9.86, df=2, p >.01) compared
to model 0 (AIC: 228.36, BIC: 236.35), see appendix B for table.
As a result, Model 2 found no significant effects in the main and interaction effects.
However, it indicates that a large portion of variance is explained by the random intercept and
a significantly better fit was shown when including a random slope with the effect of the
beta/theta condition on each individual participant. Overall, please see figure 15 for a visual
description of the findings in model 1 and 2.
Table 3 | Model 2 (intercept condition: beta, intercept time: immediate)
Fixed effects Coef. (𝐵) SE (𝐵) t-value p-value*
Intercept 29.401 6.564 4.479 .002*
Condition(theta) 4.368 5.216 0.837 .423
Time (delayed) 2.401 2.585 0.929 .369
Condition(theta):
Time(delayed)
-4.059 3.655 -1.110 .286
Random slope Variance SD
Participant 278.26 16.681
Condition (theta) 143.66 11.986
Residuals
Total variance
23.38
445,3
4.836
AIC
BIC
222.5
233.2
Note:* p-value indicating significance level <.05. 𝐵 = regression coefficients; SE = standard error; AIC = Akaike information criterion; BIC =Bayesian Information Criterion. N= 7

29
Figure 15. Plot of memory scores in time and conditions for all participants. The x- axis display the % correctly remember words ranging from 0 to 60%. The plot show participants and their individual slopes in scores from immediate to delayed recall in the uncued, beta and theta condition. Grey lines indicate average slopes. Individual lines, in same colors over conditions, represent scores within one participant.
3.1.2 Gains and losses
For gains, a Friedmans test was conducted to compare the mean gains in the beta, theta and
uncued condition, please see table 1 and figure 16 for a presentation of the descriptive data.
Gains scores were not statistically different between the conditions, X2(2) = 0.963, p= .618.
Kendall’s W effect size indicated a small effect (W = 0.0688). For losses, a repeated measures
one-way ANOVA was conducted to compare the mean loss in the beta, theta and uncued
condition, please see table 1 and figure 17 for a presentation of the descriptive data.
Mauchly’s test indicated the assumption of sphericity was not violated, χ2 = .955, p = .892. A
significant difference between groups were found F (2,12) = 5.093, p = .025, with a medium
effect size (η2=.094). Post-hoc tests conducted showed significant lower percentage of losses
in the beta condition as compared to the theta condition (t = -2.54, p = .044) and uncued
condition (t=-2.65, p =.038). However, after adjusting the p-values using the Bonferroni
multiple testing correction method these effects diminished, with no- significant difference
between the beta and theta condition (t= -2.54, p = .133) , and uncued condition (t=-2.65, p
=.114), or between the theta and uncued condition (t= 1.27, p = .756).
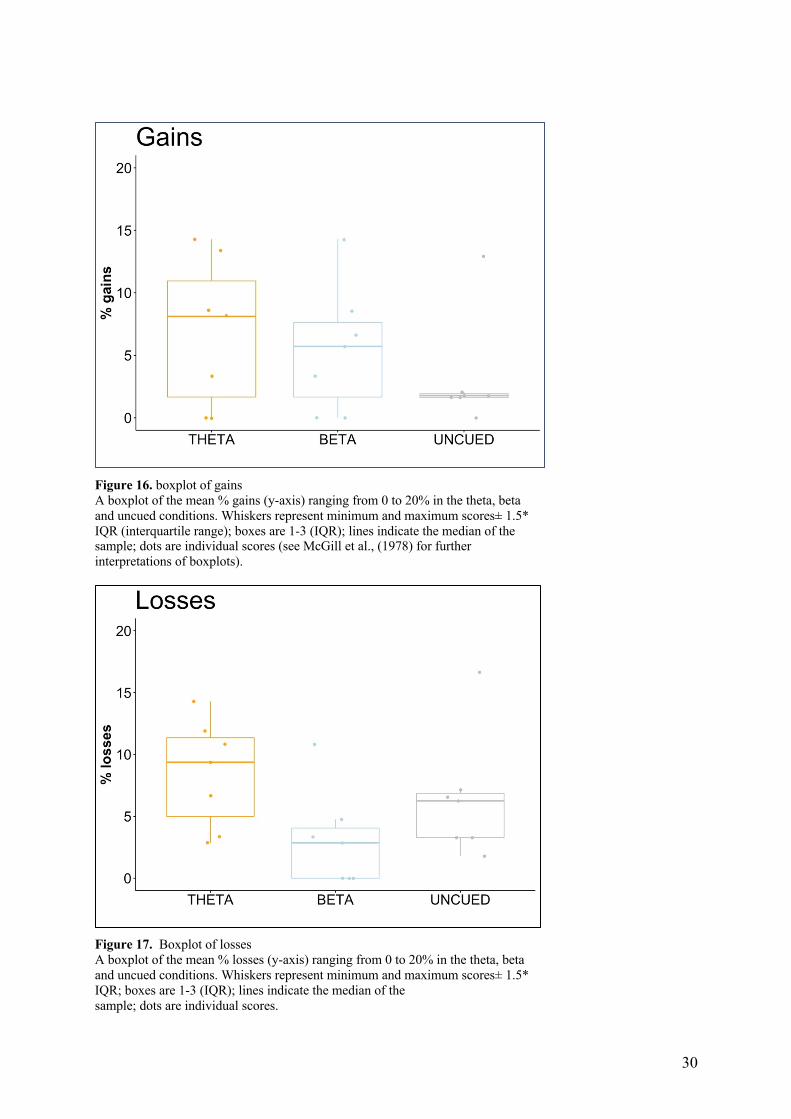
30
Figure 16. boxplot of gains A boxplot of the mean % gains (y-axis) ranging from 0 to 20% in the theta, beta and uncued conditions. Whiskers represent minimum and maximum scores± 1.5* IQR (interquartile range); boxes are 1-3 (IQR); lines indicate the median of the sample; dots are individual scores (see McGill et al., (1978) for further interpretations of boxplots).
Figure 17. Boxplot of losses A boxplot of the mean % losses (y-axis) ranging from 0 to 20% in the theta, beta and uncued conditions. Whiskers represent minimum and maximum scores± 1.5* IQR; boxes are 1-3 (IQR); lines indicate the median of the sample; dots are individual scores.

31
3.1.3 Follow-up
A one-way repeated measures ANOVA was used to determine whether there was any
difference in follow-up mean memory score in the three conditions (theta, beta and uncued).
For descriptive data, please see table 1 and figure 18 for a visual description. No difference
between groups were found F (2,10) = 0.769, p = .489, with a small-medium effect size
(η2=0.038). Mauchly’s test indicated the assumption of sphericity was not violated, χ2 =
0.667, p = .458. Due to a non-significance in the omnibus test, no further analyses were
conducted.
Figure 18. Follow-up A boxplot of the mean % correct scores in the follow-up measure (y-axis) ranging from 40 – 100% in the theta, beta and uncued condition. Whiskers represent minimum and maximum scores ± 1.5* IQR; boxes are 1-3 interquartile range; lines indicate the median of the sample; dots are individual scores.
3.2 Sleep
Analyses of sleep stages after theta/beta stimulations and for the full night along with plots
presenting the data, will be provided in the current section. Followed by an outline of the
change in memory scores faceted into the order of the stimulations. The order of stimulations,
individual theta frequencies and other characteristics related to the sleep part of the
experiment is presented in table 4.

32
Table 4 | Sleep characteristics Mean (SD) [range]
Individual Theta Frequency 4.71(0.61) [4.38 6]
Number of stimulation blocks Beta | Theta
Number of reactivation-only blocks Beta | Theta
2.71(0.49) [2 3] | 2.71 (0.49) [2 3]
2.14(0.38) [2 3] | 2.29 (0.49) [2 3]
Categorical Ratio
Stimulation order sleep cycles (theta-beta/beta-theta)
List order: list A first/list B first
3/4
3/4
3.2.1 Analysis of sleep stages
Paired t-tests and Wilcoxon signed rank test were used to compare the mean percentages of
time spent in different sleep stages after beta or theta stimulation (see table 5 and figure 19 for
descriptive data). For the “awake” stage, Wilcoxon signed rank test showed no difference in
mean % awake after stimulation with beta and theta (V= 6, Z=-0.269, p= .7874, r=-.01). The
effect size r, calculated as Z statistic divided by square root of the sample size (Z/√N), is
considered small. Furthermore, there were no difference in mean % in sleep stages N1, N2,
N3 and REM after stimulation with beta and theta, see table 5 for t-test parameters and p-
values. Pearson correlation tests were conducted to assess if there was a relationship between
amount spent in sleep stages and the performance in the delayed recall. All these tests were
non-significant, and no correlation was found between the variables (p >.1), see table 6 for
statistical parameters and figure 20 for scatterplots.

33
Table 5 | Sleep stages during the whole night and after stimulations for all participants
Sleep stage Full night After beta After theta Test
statistic *
P-
value
Effect size
% Wake 3.67 (3.39) 2.63 (3.85) 7.18 (14.11) V=6 .787 -.10 r
% N1 5.78 (2.61) 4.06 (4.01) 5.00 (4.13) t=-0.39 .704 .15 d
% N2 51.60 (5.99) 50.84 (30.29) 40.94 (16.07) t=0.69 .52 .26 d
% N3 13.50 (6.19) 39.54 (32.28) 29.44 (30.33) t=0.60 .56 .23 d
% REM 12.48 (7.83) 2.93 (3.85) 17.44 (19.14) t=-1.81 .12 .68 d
Sleep latency
SWS latency
REM latency
10.42 (8.03)
31.25 (31.55)
158.17 (100.3)
Total min 364,79
Sleep eff. 97.22
Wake (min) 15.83 (14.93)
N1 (min) 25.00 (10.98)
N2 (min) 224.45 (16.44)
N3 (min) 59.92 (29.55)
REM (min) 55.42 (36.13) Note.: (N=7). Sleep stages in % and minutes with standard deviations (SD). Sleep efficiency was calculated as minutes in N1, N2, N3 and REM divided by the sum of total minutes asleep and sleep latency. Test statistic and p-values are from comparison of the difference sleep stages after beta and theta stimulation. *Test statistic were t-values for N1, N2, N3 and REM, and V (Wilcoxon test) for “awake”. Similarly, effect sizes, are reported and are Cohens d (Cohen, 1998). for all measures with exception of awake which were calculated as r. Please see subheading “1.2.1 Sleep stages” for explanation of abbreviations.
Table 6 | Correlations between sleep stages and memory performance. Pearson correlation
Mean (SD) [Range] R (R2) p
Sleep stages:
Wake
N1
N2
N3
REM
3.67 (3.39)
5.78(2.61)
51.60(5.99)
13.50(6.19)
12.48(7.83)
-.29(.08)
-.15(.02)
-.18(.03)
.23(.05)
.16(.03)
.53
.74
.70
.63
.73
Note: All the sleep stages were corelated with delayed recall performance. Sleep stages are reported in %. Please see subheading “1.2.1 Sleep stages” for explanation of abbreviations. N=7

34
Figure 19. sleep stages after stimulation The y axis displays the mean % of time spent in the sleep stage after beta (left) and theta (right) stimulation; colors represents one individual sleep stage. Whiskers represent minimum and maximum scores ± 1.5* IQR; boxes are 1-3 interquartile range, the lines indicate the median of the sample; dots are individual scores identified as outliers (see McGill et al., (1978) for further interpretations of boxplots). See “1.2.1 Sleep stages” for explanations of abbreviations. N=7

35
Figure 20. Plot of correlations between sleep stages and memory performance The figure shows four plots of mean scores in sleep stages (N1, N2, N3 and REM) correlated with memory performance in delayed recall (N=7). The shaded light blue areas show the confidence intervals (95%). The line presenting the estimated slope of the all the data and individual dots is the individual data for participants. See “1.2.1 Sleep stages” for explanations of abbreviations.
3.2.2 Differences in memory scores faceted over stimulation- order
As an additional exploratory interpretation of the data, I subtracted the scores in the delayed
recall from the immediate recall to assess the change over time disregarding initial
performance for each participant. Higher scores indicate a more favorable development in
memory performance over time. Table 7 show means with respect to changes within the
participants over conditions and stimulation orders. No analyses were conducted due to small
sample sizes (n=3 and n=4). See figure 21 for a plot of theta and beta conditions (A plot
including the uncued condition can be found in appendix B).

36
Table 7 | Descriptive data of changes in memory performance over stimulation order
Theta, mean (SD) Beta, mean (SD) Uncued, mean (SD)
Overall Change -1.66 (7.76) 2.40(6.99) -3.29 (1.89)
Theta cycle 1 -4.24(4.75) 5.08(4.50) -4.52 (1.09)
Beta cycle 1 0.28(9.68) 0.39(8.47) -2.38 (1.93) Note: Numbers are reported as mean percentages with standard deviations (SD) for theta, beta and uncued condition. N = 7 (N=3 in theta cycle 1); Change is calculated as delayed-immediate recall within each participant.
Figure 21. Memory change over stimulation order Change over time (delayed score subtracted by score in immediate recall), in the theta and beta condition. Colors represent the stimulation order, such as red is for participants who received beta stimulation in the first sleep cycle (theta in the second), and blue is for participants who received theta stimulation the first sleep cycle (beta in the second). Total amount of participants was 7.
3.3 Questionnaires
In the after-stimulation questionnaire, 6 out of 7 subjects reported they could undergo
stimulation again at a later timepoint. Overall, only light indications of sensations were
reported, such as feeling warm (N=1) and cold (N=3) during the stimulation. Similarly, some
participants reported mild headache (N=2) or mild itching/burning(N=2) at the electrode

37
positions after stimulation. We therefore consider the safety criteria to be fulfilled by all
participants.
A one-way repeated measures ANOVA was used to compare the differences between
the mean of all the scores in the VAS scale (see table 8 and figure 22). No significant
difference in tiredness at any timepoint was found, F (3,24) = 0.59, p = .62, with a medium
effect size (η2= 0.07). Mauchly's Test of Sphericity indicated that the assumption of
sphericity had not been violated, χ2 = 0.25, p = .266. Due to a non-significance in the
omnibus test, no further analyses were conducted. Furthermore, four individual Pearson
correlation tests were used to assess if there was a relationship between scores from the VAS
scales (PreTask, PostTask1, PostTask2 and PreDelay) and memory performance, see table 8
for statistic parameters and figure 23 for scatterplots. All VAS scores were compared with the
performance in the immediate recall, with the exception of PreDelay which was associated
with performance in the delayed recall. Overall, no correlation was found between the VAS
scores and memory performance (p>.05).
Table 8 | Correlations with memory performance Pearson correlation
Mean (SD)[Range] R (R2) p
VAS:
Pre task block 1
Post task block 1
Post task block 2
Pre delayed recall
4.86 (1.57) [0 8]
4.14 (1.95) [0 8]
3.71 (2.49) [0 8]
5.00 (2.16) [0 8]
-.48 (.23)
.29 (.08)
.66 (.44)
-.75 (.56)
.27
.53
.66
.05
MDBF:
GS
RU
WM
15.57 (2.30) [13 20]
14.86 (2.19) [12 17]
11.43 (2.30) [9 16]
.19 (.04)
-.08 (.01)
.19 (.04)
.69
.87
.68
PSQI:
Total
3.86 (2.54) [1 8]
.14 (.02)
.76
Note: All measurements are of the same sample (N=7), however, memory performance refers to performance in either the immediate recall or delayed recall. The VAS pre delayed recall and PSQI were corelated with delayed recall performance. All the other measures were correlated with immediate recall performance. Please see subheading “2.4.6 Questionnaires” for explanation of abbreviations.

38
Figure 22. Means of VAS scores at different timepoints. The y axis represents the mean VAS score for all participants (N=7), while the x axis shows the timepoints when the VAS was measured. Points represent the mean for all participants, whiskers represent the estimated error around the mean.
Figure 23. scatterplots of VAS correlations with memory performance The figure shows four plots of VAS scores correlated with memory performance in immediate recall and delayed recall (only for “Pre delayed”). The shaded light blue areas show the confidence intervals. On the x axis is the VAS score, ranging from 1- 10 and y axis is memory performance in % of correct answers. N=7

39
For the MDBF scores, three individual Pearson correlation tests were used to assess if there
was a relationship between measures in the MDBF (GS, RU and WM) and the performance in
the immediate recall. All these tests were non-significant, and no correlation was found
between the variables (p >.6), see table 8 for statistical parameters and figure 24 for
scatterplots. Similarly, a Pearson correlation test was used to assess whether there was a
relationship between the PSQI score and memory performance in the delayed recall. No
significant correlation was found (p = .76), see table 8 for statistical parameters and figure 24
for a scatterplot of the relationship.
Figure 24. scatterplots of MDBF and PSQI correlations with memory performance The figure shows four plots in total. Three (left side and upper right) plots are MDBF scores (GS, RU, WM) correlated with memory performance in immediate recall. The fourth plot (right bottom) is of the PSQI score correlated with memory performance in the delayed recall. On the x axis is the score for the questionnaire, and memory performance in % of correct answers on the y axis. The shaded blue areas indicate the confidence intervals.

40
4. Discussion
The current study aimed to investigate the potential functional relevance of theta activity in
memory consolidation with the use of tACS and TMR methods. Stimulation in the beta
frequency band was conducted as a control stimulation, in addition to a condition which
received neither stimulation nor TMR (uncued), with the intention to isolate the effect of
theta. We hypothesized there would be an improvement in memory performance for those
items that received theta-tACS during reactivation, compared to those items that received
control beta stimulation and items that were never reactivated (uncued). Contrary to our
hypothesis, the current results presented in the thesis did not find a functional role for theta in
memory consolidation.
I conducted explorative analyses with the attempt to investigate the effects underlying
the behavioral outcomes. Gains and losses over-night were investigated, and memory
performance at one-week follow up, however no significant effects were found. Sleep
architecture was examined, both after stimulation and for the full night, and no significant
differences between the conditions was detected. Questionnaires assessing traits and states did
not reveal any significant effects on performance on the memory tasks. Despite these non-
significant results, I did identify some trends in the data which could be valuable for future
experiments on memory consolidations and the functions related to oscillatory activities. It
should be noted that all inferences are based on data from a small sample and should be
considered tentative.
4.1 Behavioral findings
For the behavioral data, no significant difference in memory performance was found for those
items that received theta-tACS during reactivation, compared to those items that received
control beta stimulation and items that were never reactivated (uncued). Surprisingly, if one
discards the non-significant-effects and interpret the mere trend in the data, beta was the
condition which displayed the most increase in memory performance overnight. The uncued
condition had the largest decrease in memory performance, placing theta in the middle of the
two. The considerable large standard errors render further interpretations of this data
explorative, therefore additional analyses were conducted with an attempt to understand and
supplement these outcomes.
Visual inspection of the data (figure 15) shows there are random patterns lacking a
clear directional trend between participants in both the theta and beta condition. Relatively,
the uncued condition appear to have a consistent decreasing tendency in memory performance

41
for all participants over time. Hence, model 2 was added with the aim of isolating the
stimulation conditions and a random slope was included such that participants were not only
allowed to have differing intercepts (model 1), but where they are also allowed to have
different slopes for the effect of stimulation. The random slope indicated that the theta/beta
conditions’ effect on each individual participant accounted for ~30 % of the variance.
However, there was no consistency in the direction of the trend in either condition between
participants (see Appendix B for all coefficients). Overall, model 2 confirmed findings in
model 1, and indicated that individual differences seem to account for much variance in the
model and that there is a lacking consistent trend for the data in the stimulation conditions.
One can speculate whether there were factors in the experimental design which caused this
inconsistency in the stimulation conditions, such as disturbances during sleep due to TMR.
One can discuss whether there was a general disturbance due to the TMR as it was
always taking place in the theta/beta condition, compared to the uncued condition. Previous
studies with TMR have not reported significant disturbances such as awakenings as an issue
when cues were presented below 50 Decibel (Cordi et al., 2018; Oudiette & Paller, 2013;
Schreiner & Rasch, 2015). Hence, it does not seem to be a noteworthy disturbing effect due to
just TMR.
On the other hand, the effect of TMR might be reflected in the trend of our results
through more stable immediate – delayed performance in the theta and beta condition as
compared to uncued. Therefore, I conducted a brief comparison with other studies containing
only TMR and also investigating Dutch-German word-pairs (Schreiner, Lehmann, et al.,
2015; Schreiner & Rasch, 2015), see appendix B for raw numbers and calculations. These
studies have set the immediate recall to 100 % and then report the percentage change in the
delayed recall. The mean of these findings was a percentage change of 100.33 for cued words
and 91.33 for uncued in the delayed recall. Our results showed a mean percentage change of
110 for the beta condition, 97 for theta condition and for 89 for uncued (see Appendix B for
raw numbers and standard deviations). Thus, results from the current study could be related to
previous findings for the uncued condition (no effect of TMR) and theta/beta (effect of TMR).
For the beta condition, the mean change in percentage of correct recalled words are above the
average change in percentage expected due to just TMR (according to previous studies). I am
not sure if this is a reflection of random noise in our data, as it has considerable large standard
errors, or if there could be a trend above the effect of TMR for the beta condition. It should be
noted that these results are solely based on descriptive data and have not been tested for

42
significance levels, and there are differences in the experiment designs in the studies of
comparison to be considered when associating the data.
Gains and losses from immediate to delayed recall were investigated with the intention
of unravelling the overall memory performance. The results showed no significant difference
in gains and losses between the conditions. When considering the descriptive data, theta had
higher mean of gains as compared to the beta and uncued condition. Puzzlingly, theta also had
a higher mean of losses as compared to the other conditions. The greater amount of losses
could account for a detrimental effect on overall memory performance in the theta condition.
As of now, I remain hesitant as to how to explain the trends for losses and gains, in particular
why the beta condition displayed fewer losses than the theta condition. As previous studies
have found induced theta power for the difference between gains and losses (Schreiner &
Rasch, 2015), further investigations could follow this approach and isolate the words which
were lost/gained with the attempt to find commonalities (i.e. the power differences of theta
when these words were encoded/reactivated/retrieved). This could provide valuable insight
with regard to the underlying reason of why these items were gained/lost overnight.
For the follow up condition, no significant differences were found between the theta,
beta and uncued conditions. Our results are consistent with the latter finding in the previous
study on long term effects on TMR, which found a difference in emotional valence after one
week but not any differences for cued vs. uncued stimuli (Groch et al., 2017). Although the
performance in all three conditions was higher in the follow up (>64% correct) as compared
to delayed (>27% correct), this could be explained by the change of format in the follow-up
test as compared to immediate/delayed recall. For example, the follow up measure included a
recognition instead of a cued recall task. Previous studies have shown higher performance on
recognition vs recall tests at one week follow up (Postman et al., 2007). Overall, neither of the
conditions showed an effect on memory performance after one week. These findings warrant
future investigations with longer delays in performance tests to get a clearer impression of
how long-lasting the effects of TMR and potentially other experimental factors on memory is.
As of now, the main conclusion from the behavioral results is that we have not
provided evidence for the functional role of theta and its underlying processes in memory
consolidation. The behavioral data presented contain substantial limitations (see “4.4
limitations and directions”), which render attempts to explain the trends in the data
problematic. Sleep data was investigated to get a further idea of the process behind the
memory consolidation and if there were any factors in the experiment that influenced the
results.

43
4.2 Findings in the sleep data and explorative analyses
For a closer look on the immediate effects of stimulation, I collected the sleep stages
between stimulation blocks, and 9 minutes after the final stimulation block. Then I compared
the amount of time spent in each sleep stage (awake, N1, N2, N3 and REM) after stimulation
with either theta or beta. The results showed no significant difference between sleep stages
after stimulation with beta and theta. Due to the increased variance in the stimulation
conditions, as discussed above, I will interpret the findings with regards to trends in the
descriptive sleep data in a liberal manner. After theta stimulation, participants showed on
average more awakenings (~5% more), and REM (~14% more), and decreased N2 (~10%
less) and SWS (N3 =~10 % less), as compared to after beta stimulation. Despite the
considerable large standard deviations in the data, the mean differences are somewhat
consistent with findings from a previous study stimulating theta frequencies during sleep with
otDCS (Marshall et al., 2011). Marshall and colleagues (2011) found that in the 1-minute
period between theta stimulation blocks, the mean time spent in N3 was strongly reduced and
an increase in N2 sleep and overall latency of SWS. The behavioral outcome indicated
impaired consolidation of declarative word-pairs in the theta condition compared to sham.
There could be hints of a similar trend in our data, with respect to reduced N3. Nonetheless,
this study used a different stimulation technique which renders direct comparisons
challenging and our trends indicate a decrease in N2 and increase in REM after theta
stimulation.
We are curious to see the trends of a potential increase in REM sleep after theta
stimulation. As discussed previously, theta is promiment in REM sleep and the function of
theta and the underlying processes is unclear in studies on humans (Diekelmann & Born,
2010; Rasch & Born, 2013). However, as the data has considerable large standard errors and a
small sample size, we cannot exclude the possibility of this being a reflection of noise in the
data or other factors which might have impacted these trends. For example, as theta
stimulation was conducted more times in the second sleep cycle (N=4) than in the first sleep
cycle (N=3), the increase in REM sleep after theta stimulation might be because REM sleep is
more prevalent in late sleep (Rasch & Born, 2013), and was therefore detected more often in
the second sleep cycle. Overall, no significant differences were found in our comparisons of
sleep stages after theta and beta stimulation.
The sleep architecture for the full night (table 5), did not reveal any obvious deviations
from what was anticipated with regard to the amount time spent in sleep stages. Participants

44
were on average awake for 15 minutes, light sleep stages (N1) for 5%, 18% SWS (N3) and
12% REM (see table 5), which can be considered within the norm of what we expected under
the circumstances of the experiment as compared to studies with similar experimental designs
(Cordi et al., 2018; Cousins et al., 2014) and average sleep architecture data (Redline et al.,
2004). It should also be noted that I am solely discussing trends in the sleep architecture in the
experimental night. To get an even clearer impression of the potential change in sleep
architecture due to the experiment, further investigations could compare the sleep data with
the participants’ normal sleep, or for example compare the sleep architectures in the
adaptation and experimental night.
As indicated in the sleep architecture for the full night, the latency for REM was on
average longer (158 min) than what was predicted (80-100 min, see “1.2.1 Sleep stages”). I
inspected the raw data and found that four of the participants had a REM latency between 73
– 90 minutes, and three participants had between 159 – 314 minutes (see appendix B for all
data). One explanation of this could be inability to detect the first REM episode in the sleep
scoring. As we were not able to score sleep stages under stimulation, due to artifacts in the
EEG signal, this might have led us to fail to discover the first REM episode when it occurred.
It was attempted to avoid this matter by restricting the stimulation and TMR-only blocks to a
maximum of 6 (≈60 minutes) with the objective to complete the stimulation and TMR before
likely the participants would enter a REM stage. However, some suggest that REM episodes
occur already 70 minutes after sleep onset (McCarley, 2007). Hence, there is a possibility that
participants entered REM stages prior to our completion of stimulation and TMR, and this
might be a source of influence in the data. To ensure detection of the first REM stage, one
could for example shorten the blocks of TMR and stimulation or complete e.g. a maximum of
four blocks.
No significant relationship was found between time spent in sleep stages (awake, N1,
N2, N3 and REM) and performance in the delayed recall. Previous studies have showed
associations between memory performance and duration in sleep stages (Rasch & Born,
2013). Based on the observed correlation coefficient, our results indicated a negative trend of
correlations between time spent awake, in N1 and N2 sleep and memory performance. As for
N3 and REM, positive correlations with memory performance was indicated. This trend could
be consistent with previous literature showing elevated SWS to facilitate declarative memory,
and REM sleep which have been suggested to play a role in memory processing (Diekelmann
& Born, 2010; Rasch & Born, 2013). On the other hand, all effect sizes were deemed small

45
(Cohen, 1998) and the non-significant effect imply there was little shown relationship
between sleep stages and memory performance the morning after sleep.
There could be a general disturbance in sleep due to the stimulations which prevented
or even reversed immediate beneficial effects of stimulation on sleep facilitating memory
consolidation. Although with different stimulation techniques and experiment designs,
previous studies have found stimulation to decrease SWS for the entire night (Marshall et al.,
2006; Paßmann et al., 2016), reduced power of slow oscillations (Ketz et al., 2018; Marshall
et al., 2006) and coupling with spindles (Ketz et al., 2018). On the other hand, a feedback
controlled tACS (12 Hz) study enhanced specific bursts of activity (sleep spindles) without
affecting the overall sleep architecture (Lustenberger et al., 2016). As some of these findings
suggest, stimulations may have caused effects on features in sleep seen relevant for memory
consolidation processes, such as sleep spindles and slow waves (Rasch & Born, 2013). Future
investigations could therefore be conducted to assess the change in these specific features in
sleep related to memory consolidation.
4.2.1 Differences within participants over stimulation- order
To explore the variance within the stimulation conditions one step further, I calculated the
changes in memory performance from the immediate to delayed recall and faceted the
changes over time into stimulation orders, (see figure 21). It should be noted that no analysis
was conducted, and the inferences are based solely on a visual inspection of the data and
descriptive means from considerable small samples (N= 3 and N= 4).
Although highly speculative, we are deliberating whether there could be indications of
an interaction between order of the stimulations and memory performance. From investigating
the slopes, there seem to be more decrease in memory performance in theta when beta is in
the second cycle as compared to first cycle. Correspondingly, data in the beta condition
appears to follow an opposite trend. If this was the case, it is possible there are long-lasting
effects from the tACS stimulation as some previous literature has suggested (Herrmann et al.,
2013; Kasten et al., 2016). Hence, the separation between sleep cycle 1 and 2 might be too
small, which have caused overlapping effects between the conditions. One could also discuss
this with respect to the REM latencies discussed above, all three participants with longer
REM latencies than we expected (159 – 314) were stimulated with the same order (theta first,
then beta), see appendix B for raw data. However, at this point it is not possible to discuss if
the stimulation order did indeed have an effect on REM latencies, or if this is a random trend

46
in a small sample. Again, it should be noted that these interpretations are at this point
hypothetical.
4.3 Questionnaires
As presented in the results from the questionnaires assessing general sleep quality (PSQI),
tiredness (VAS) and mood states (MDBF), neither seemed related to the behavioral outcome.
Furthermore, no significant difference between the VAS scores assessed at different
timepoints was found. This indicates that the participants were not significantly more tired at
any specific point in time during the experiment. Considering the study’s low power, some
trends in the data warrant highlighting. First, it should be noted that the participants reported
more tiredness in post task block II (M =3.7) than at the other timepoints. Moreover, the
performance in the immediate recall was on average lower (~30%), as compared to a similar
study which have had an average of ~50% in the immediate recall (Schreiner & Rasch, 2015).
One can therefore speculate whether tiredness affected initial performance in the immediate
recall, although not to a degree from which is showed in significant tests and it should be
clarified that the discussion is of trends and not statistical effects. Indicated by the R values in
table 6, there was indeed a slight positive direction of the correlation between wakefulness
and memory performance after task block I and II, with medium-large effect sizes. One
suggestion could be to discuss beginning the experiment at an earlier timepoint, to avoid
potential effects due to tiredness. Despite these small trends in the data, mood, tiredness and
sleep quality did not statistically play any impact in our behavioral results overall.
4.4 Limitations and directions
A major limitation of the study is low sample size. Although the within study design lowered
the number of groups being compared in the main analysis, the power is considerably low. To
illustrate, the study initially intended to include 26 participants to achieve a power of 80%
with a medium effect size with a rmANOVA (the power analysis tool does not provide
calculations for LMM) (Faul et al., 2007). Post hoc power analysis determined the power with
the current sample to be 30%. In practical terms this means we had a 30% chance to detect a
significant effect in the analysis if there truly was an effect. Although, post-hoc power should
be interpreted with caution (see Gelman, 2019 for a discussion), and the number calculated by
g*power is subject of variation with different types of analyses, it was mentioned for
illustrative causes.

47
The small sample also led to violation of assumptions such as normality and extreme
outliers which sometimes strained me to use alternative analyses. There are large errors and
variance in the data, and I believe these outcomes would diminish with more participants as
individual differences seem to explain much of the variance. Furthermore, adding more
participants would also facilitate the exploration of the data, in terms of being able to add
more effects to the models and dividing the sample with regards to between subjects’ factors,
such as stimulation order. As of now, there is a considerable lack of power in the analyses,
which have caused limitations in the analyses and overall an increase of type II error rate.
The study used the IAF from the parietal areas in rest EEG data and subtracted 5 to
calculate the ITF, and consequently made assumptions about Individual theta frequencies
which can be examined further. The first assumption is that IAF (and ITF) is not state
dependent with regard to resting and sleep. Hence, IAF from resting EEG data are assumed
not to be considerable different from IAF during sleep. As studies have found alpha peak
frequencies to differ according to the state of the individual (Mierau et al., 2017), one can
therefore question whether the theta frequencies measured during rest EEG is representative
of theta frequencies during sleep or memory consolidation. Another assumption is the notion
there is a linear relationship between IAF and ITF. According to Klimesch (1999) there have
been found large differences when it comes to individual alpha frequencies, and it has been
suggested to use theta frequencies with individual alpha frequency as anchor point. Another
study found that peaks in the theta range occurred on average near half of the alpha peak
frequency in rest EEG data (van Albada & Robinson, 2013). Hence, future studies could
consider if there are other ways to calculate ITF which could improve the effects of tACS
stimulation.
Theta is prominent in the PFC (Mitchell et al., 2008), but IAF was measured in
parietal cortices in this study. This could be problematic in the sense that frontal theta and
parietal alpha might not be directly correlated, leading to the question of whether we might
have stimulated using the wrong frequency. Therefore, it would be interesting to compare ITF
calculated in resting EEG state with ITF under TMR, to investigate if these assumptions are
met or not. If a difference is found, future studies could explore other methods for calculating
ITF, such as using data from the adaptation night, and potentially retrieve information from
frontal areas instead of parietal.
Future studies can consider how the amount of TMR and stimulation blocks affects the
results, and whether it is possible to restrict the total amount of blocks to a maximum of four
to ensure detection of the first REM episode. The researcher in this study was instructed to
48
reactivate a minimum of four and maximum six blocks, and for the second cycle not to
exceed the amount of reactivation blocks in the first cycle. Our findings do not show an
indication of a difference between how many stimulations participants received due to type of
stimulation (2.71 stimulation blocks in both conditions), however a slight increase in TMR-
only blocks for theta (2.29) as compared to beta (2.14), see table 4. We do not view this as a
substantial difference in the current data set, but future studies could consider the possibility
and investigate whether the number of stimulation and TMR blocks plays a role in the overall
performance.
Our choice of study design with regard to the conditions could be changed to improve
interpretations of the outcomes. Our retention measure does not allow us to directly
differentiate between a natural decay of the memory and gain in memory after TMR and an
additional gain after stimulation. Furthermore, the choice of the uncued condition can be
discussed as it includes two, instead of one, factors which differentiates from the other
conditions; the uncued condition had no stimulation and it also had no TMR. As mentioned
above, there are other comparable studies which have conducted TMR only, which gave us an
idea of how much the effect from stimulation should be above the TMR-only effect. Either
way, if future studies incorporated a TMR-only condition, this could isolate the effect due to
the stimulation further. One practical suggestion is for future studies to consider including
more nights in the experiment, with theta in one night and beta in the other to ensure there are
no overlapping effects of the stimulation conditions. For instance, one night with theta and a
TMR-only condition, and one night with beta and TMR-only condition. Altogether, there are
changes to the experimental design that could be made, which in turn, could advance the
interpretation of the findings.
Further investigations of the sleep data could provide valuable information about the
specific processes underlying the behavioral outcomes. As discussed with respect to gains and
losses, investigations could attempt to isolate each word and compare them over these
categories to see if there were any common underlying activities (such as induced theta
power) during sleep, which might elaborate on why they were gained or lost over night. As
discussed, the stimulation might have affected other features of sleep, for example sleep
spindles. Further investigations could examine some of these features and their potential
impacts.

49
5. Conclusions
The thesis presents an experiment investigating the functional relevance of theta activity on
memory consolidation with tACS stimulation. We discovered potential influences in the
experimental design, such as overlapping effects of stimulations, and made suggestions on
how to advance the study design. For instance, future studies could consider including two
experimental nights to isolate the stimulation conditions. Some trends in the data could be
investigated further. For example, one could isolate the single items in gains and losses and
conduct analyses of power differences in the theta range. We investigated sleep architecture
after stimulation, and proposed to prolong this investigation to include other features in sleep
relevant for memory consolidation, such as sleep spindles. As the study is presented today, a
prominent restraint is a low sample size. Upon opening of the laboratories, the data collection
will proceed, and a larger sample size could provide more confidence in whether to keep or
reject the hypothesis, and to make suggestions for future studies from there on. As of now, the
current results can neither confirm nor disconfirm theta’s functional relevance in memory
consolidation. However, the limitations in the experiment and the potential improvements
identified may pave the way for future experiments on the topic.
6. Funding
No funding was received.
7. Declaration of contribution
My role in the project was to aid with the design of the experiment, specifically with regard to
the procedure in the adaptation and experimental night and with construction of a procedure
manual. I assisted new members in the team with learning the procedure of the experiments.
Furthermore, I created the MATLAB script which separated the words learned in the
encoding into three lists: beta, theta and uncued, and a script in R to gather sleep stages ~9
min after stimulation (see appendix A). Additionally, I helped with data collection and offline
sleep scoring. Lastly, I structured behavioral and sleep data, suggested and conducted all
analyses and plots which followed and wrote the present thesis in full. It should be noted that
most of the work was conducted in collaboration with others (see acknowledgements), and
therefore the pronoun “we” was chosen when there was a collaboration and the pronoun “I”
when it was solely my own work.
50
8. References
Antal, A., Boros, K., Poreisz, C., Chaieb, L., Terney, D., & Paulus, W. (2008). Comparatively
weak after-effects of transcranial alternating current stimulation (tACS) on cortical
excitability in humans. Brain Stimulation, 1(2), 97–105.
https://doi.org/10.1016/j.brs.2007.10.001
Babyak, M. A. (2004). What You See May Not Be What You Get: A Brief, Nontechnical
Introduction to Overfitting in Regression-Type Models. Psychosomatic Medicine, 66(3).
https://journals.lww.com/psychosomaticmedicine/Fulltext/2004/05000/What_You_See_
May_Not_Be_What_You_Get__A_Brief,.21.aspx
Banich, M T., Compton, R J. (2018): Cognitive Neuroscience. Cambridge University Press
(4. Edition) isbn: 9781316507902.
Barr, D. J., Levy, R., Scheepers, C., & Tily, H. J. (2013). Random effects structure for
confirmatory hypothesis testing: Keep it maximal. Journal of Memory and Language,
68(3). https://doi.org/10.1016/j.jml.2012.11.001
Başar, E., Başar-Eroglu, C., Karakaş, S., & Schürmann, M. (2001). Gamma, alpha, delta, and
theta oscillations govern cognitive processes. International Journal of Psychophysiology,
39(2), 241–248. https://doi.org/https://doi.org/10.1016/S0167-8760(00)00145-8
Benchenane, K., Peyrache, A., Khamassi, M., Tierney, P. L., Gioanni, Y., Battaglia, F. P., &
Wiener, S. I. (2010). Coherent Theta Oscillations and Reorganization of Spike Timing in
the Hippocampal- Prefrontal Network upon Learning. Neuron, 66(6), 921–936.
https://doi.org/10.1016/j.neuron.2010.05.013
Buysse, D. J., Reynolds, C. F. 3rd, Monk, T. H., Berman, S. R., & Kupfer, D. J. (1989). The
Pittsburgh Sleep Quality Index: a new instrument for psychiatric practice and research.
Psychiatry Research, 28(2), 193–213. https://doi.org/10.1016/0165-1781(89)90047-4
Carskadon, M., Dement, W., Kryger, M., Roth, T., & Roehrs, T. (2005). Normal Human
Sleep: An Overview. In Principles and Practice of Sleep Medicine (4th ed., pp. 16–26).
St. Louis: Elsevier Saunders.
http://apsychoserver.psych.arizona.edu/JJBAReprints/PSYC501A/Readings/Carskadon
Dement 2011.pdf
Chaieb, L., Antal, A., Pisoni, A., Saiote, C., Opitz, A., Ambrus, G. G., Focke, N., & Paulus,
W. (2014). Safety of 5 kHz tACS. Brain Stimulation, 7(1), 92–96.
https://doi.org/10.1016/j.brs.2013.08.004
Cnaan, A., Laird, N. M., & Slasor, P. (1997). Using the general linear mixed model to analyse
unbalanced repeated measures and longitudinal data. Statistics in Medicine, 16(20),

51
2349–2380. https://doi.org/10.1002/(SICI)1097-0258(19971030)16:20<2349::AID-
SIM667>3.0.CO;2-E
Cohen, J. (1998). Statistical Power Analysis for the Behavioral Sciences (2nd edition). New
York, NY: routledge Academic. https://doi.org/10.4324/9780203771587
Cohen, M. X. (2014). Analyzing Neural Time Series Data: Theory and Practice. Cambridge,
MA: MIT Press.
Colten, H. R., & Altevogt, B. M. (2006). Sleep disorders and sleep deprivation: an unmet
public health problem. Washington, DC: National Academies Press.
https://doi.org/10.17226/11617
Corcoran, A. W., Alday, P. M., Schlesewsky, M., & Bornkessel-Schlesewsky, I. (2018).
Toward a reliable, automated method of individual alpha frequency (IAF) quantification.
Psychophysiology, 55(7), e13064. https://doi.org/10.1111/psyp.13064
Cordi, M. J., Schreiner, T., & Rasch, B. (2018). No effect of vocabulary reactivation in older
adults. Neuropsychologia, 119, 253–261.
https://doi.org/10.1016/j.neuropsychologia.2018.08.021
Cousins, J. N., El-Deredy, W., Parkes, L. M., Hennies, N., & Lewis, P. A. (2014). Cued
Memory Reactivation during Slow-Wave Sleep Promotes Explicit Knowledge of a
Motor Sequence. The Journal of Neuroscience, 34(48), 15870–15876.
https://doi.org/10.1523/JNEUROSCI.1011-14.2014
Diekelmann, S., & Born, J. (2010). The memory function of sleep. Nat.Rev.Neurosci.,
11(1471-0048 (Electronic), 114–126. https://doi.org/10.1038/nrn2762
Eichenbaum, H. (2017). Prefrontal-hippocampal interactions in episodic memory. Nature
Reviews Neuroscience, 18(9), 547–558. https://doi.org/10.1038/nrn.2017.74
Faul, F., Erdfelder, E., Lang, A.-G., & Buchner, A. (2007). G*Power 3: A flexible statistical
power analysis program for the social, behavioral, and biomedical sciences. Behavior
Research Methods, 39(2), 175–191. https://doi.org/10.3758/BF03193146
Field, A. (2013). Discovering Statistics Using IBM SPSS Statistics (4th ed.). Sage
Publications Ltd.
Gais, S., Albouy, G., Boly, M., Dang-Vu, T. T., Darsaud, A., Desseilles, M., Rauchs, G.,
Schabus, M., Sterpenich, V., Vandewalle, G., Maquet, P., & Peigneux, P. (2007). Sleep
transforms the cerebral trace of declarative memories. Proceedings of the National
Academy of Sciences of the United States of America, 104(47), 18778–18783.
https://doi.org/10.1073/pnas.0705454104
Gelman, A. (2019). Don’t Calculate Post-hoc Power Using Observed Estimate of Effect Size.
52
Annals of Surgery, 269(1).
https://journals.lww.com/annalsofsurgery/Fulltext/2019/01000/Don_t_Calculate_Post_h
oc_Power_Using_Observed.46.aspx
Groch, S., Preiss, A., McMakin, D. L., Rasch, B., Walitza, S., Huber, R., & Wilhelm, I.
(2017). Targeted Reactivation during Sleep Differentially Affects Negative Memories in
Socially Anxious and Healthy Children and Adolescents. The Journal of Neuroscience,
37(9), 2425–2434. https://doi.org/10.1523/jneurosci.1912-16.2017
Herrmann, C. S., Rach, S., Neuling, T., & Strüber, D. (2013). Transcranial alternating current
stimulation: a review of the underlying mechanisms and modulation of cognitive
processes. Frontiers in Human Neuroscience, 7(June), 1–13.
https://doi.org/10.3389/fnhum.2013.00279
Huang, Y., Datta, A., Bikson, M., & Parra, L. C. (2019). Realistic volumetric-approach to
simulate transcranial electric stimulation-ROAST-a fully automated open-source
pipeline. Journal of Neural Engineering, 16(5), 56006. https://doi.org/10.1088/1741-
2552/ab208d
Iber, C., Ancoli-Israel, S., Chesson, A., & Quan, S. F. (2007). The AASM Manual for the
Scoring of Sleep and Associated Events: Rules, Terminology, and Technical
Specification. American Academy of Sleep Medicine, 1.
Jausovec, N., Jausovec, K., & Pahor, A. (2014). The influence of theta transcranial alternating
current stimulation (tACS) on working memory storage and processing functions. Acta
Psychologica, 146(1), 1–6. https://doi.org/10.1016/j.actpsy.2013.11.011
Kasten, F. H., Dowsett, J., & Herrmann, C. S. (2016). Sustained Aftereffect of α-tACS Lasts
Up to 70 min after Stimulation. Frontiers in Human Neuroscience, 10, 1–9.
https://doi.org/10.3389/fnhum.2016.00245
Ketz, N., Jones, A. P., Bryant, N. B., Clark, V. P., & Pilly, P. K. (2018). Closed-Loop Slow-
Wave tACS Improves Sleep-Dependent Long-Term Memory Generalization by
Modulating Endogenous Oscillations. The Journal of Neuroscience, 38(33), 7314–7326.
https://doi.org/10.1523/jneurosci.0273-18.2018
Killgore, W. D. (1999). The visual analogue mood scale: can a single-item scale accurately
classify depressive mood state? Psychological Reports, 85(3), 1238–1243.
https://doi.org/10.2466/pr0.1999.85.3f.1238
Klimesch, W., Doppelmayr, M., Stadler, W., Pöllhuber, D., Sauseng, P., & Röhm, D. (2001).
Episodic retrieval is reflected by a process specific increase in human
electroencephalographic theta activity. Neuroscience Letters, 302(1), 49–52.

53
https://doi.org/10.1016/S0304-3940(01)01656-1
Klimesch, Wolfgang. (1999). EEG alpha and theta oscillations reflect cognitive and memory
performance: A review and analysis. Brain Research Reviews, 29(2–3), 169–195.
https://doi.org/10.1016/S0165-0173(98)00056-3
Klinzing, J. G., Niethard, N., & Born, J. (2019). Mechanisms of systems memory
consolidation during sleep. Nature Neuroscience, 22, 1598–1610
https://doi.org/10.1038/s41593-019-0467-3
Kuehner, C., Bürger, C. C., Keller, F. F., & Hautzinger, M. M. (2007). Reliabilität und
Validität des revidierten Beck-Depressionsinventars (BDI-II). Nervenarzt, 78, 651–656.
https://doi.org/10.1007/s00115-006-2098-7
Kuznetsova, A., Brockhoff, P. B., & Christensen, R. H. B. (2017). lmerTest Package: Tests in
Linear Mixed Effects Models. Journal of Statistical Software,82(13).
https://doi.org/10.18637/jss.v082.i13
Lang, S., Gan, L. S., Alrazi, T., & Monchi, O. (2019). Theta band high definition transcranial
alternating current stimulation, but not transcranial direct current stimulation, improves
associative memory performance. Scientific Reports, 9(1), 1–11.
https://doi.org/10.1038/s41598-019-44680-8
Lisman, J. E., & Jensen, O. (2013). The Theta-Gamma Neural Code. Neuron, 77(6), 1002–
1016. https://doi.org/10.1016/j.neuron.2013.03.007
Luke, S. G. (2017). Evaluating significance in linear mixed-effects models in R. Behavior
Research Methods, 49(4), 1494–1502. https://doi.org/10.3758/s13428-016-0809-y
Lustenberger, C., Boyle, M. R., Alagapan, S., Mellin, J. M., Vaughn, B. V., & Fröhlich, F.
(2016). Feedback-Controlled Transcranial Alternating Current Stimulation Reveals a
Functional Role of Sleep Spindles in Motor Memory Consolidation. Current Biology,
26(16), 2127–2136. https://doi.org/https://doi.org/10.1016/j.cub.2016.06.044
Maquet, P. (2001). The role of sleep in learning and memory. Science, 294(5544), 1048–
1052. https://doi.org/10.1126/science.1062856
Marshall, L., Helgadóttir, H., Mölle, M., & Born, J. (2006). Boosting slow oscillations during
sleep potentiates memory. Nature, 444(7119), 610–613.
https://doi.org/10.1038/nature05278
Marshall, L., Kirov, R., Brade, J., Mölle, M., & Born, J. (2011). Transcranial Electrical
Currents to Probe EEG Brain Rhythms and Memory Consolidation during Sleep in
Humans. PLOS ONE, 6(2), e16905. https://doi.org/10.1371/journal.pone.0016905
McCarley, R. W. (2007). Neurobiology of REM and NREM sleep. Sleep Medicine, 8(4),

54
302–330. https://doi.org/https://doi.org/10.1016/j.sleep.2007.03.005
McGill, R., Tukey, J. W., & Larsen, W. A. (1978). Variations of Box Plots. The American
Statistician, 32(1), 12–16. https://doi.org/10.2307/2683468
Mierau, A., Klimesch, W., & Lefebvre, J. (2017). State-dependent alpha peak frequency
shifts: Experimental evidence, potential mechanisms and functional implications.
Neuroscience, 360, 146–154.
https://doi.org/https://doi.org/10.1016/j.neuroscience.2017.07.037
Mitchell, D. J., McNaughton, N., Flanagan, D., & Kirk, I. J. (2008). Frontal-midline theta
from the perspective of hippocampal “theta”. Progress in Neurobiology, 86(3), 156–185.
https://doi.org/https://doi.org/10.1016/j.pneurobio.2008.09.005
Neuling, T., Rach, S., & Herrmann, C. (2013). Orchestrating neuronal networks: sustained
after-effects of transcranial alternating current stimulation depend upon brain states.
Frontiers in Human Neuroscience,7(1)
https://www.frontiersin.org/article/10.3389/fnhum.2013.00161
Oudiette, D., & Paller, K. A. (2013). Upgrading the sleeping brain with targeted memory
reactivation. In Trends in Cognitive Sciences,17(3), 142–149. Elsevier Current Trends.
https://doi.org/10.1016/j.tics.2013.01.006
Pahor, A., & Jaušovec, N. (2018). The effects of theta and gamma tacs on working memory
and electrophysiology. Frontiers in Human Neuroscience, 11, 1–16.
https://doi.org/10.3389/fnhum.2017.00651
Paßmann, S., Külzow, N., Ladenbauer, J., Antonenko, D., Grittner, U., Tamm, S., & Flöel, A.
(2016). Boosting Slow Oscillatory Activity Using tDCS during Early Nocturnal Slow
Wave Sleep Does Not Improve Memory Consolidation in Healthy Older Adults. Brain
Stimulation, 9(5), 730–739. https://doi.org/10.1016/j.brs.2016.04.016
Paulus, W. (2011). Transcranial electrical stimulation (tES- tDCS; tRNS, tACS) methods.
Neuropsychological Rehabilitation, 2011(5), 37–41.
https://doi.org/10.1080/09602011.2011.557292
Polanía, R., Nitsche, M. A., Korman, C., Batsikadze, G., & Paulus, W. (2012). The
Importance of Timing in Segregated Theta Phase-Coupling for Cognitive Performance.
Current Biology, 22(14), 1314–1318.
https://doi.org/https://doi.org/10.1016/j.cub.2012.05.021
Postman, L., Kruesi, E., & Regan, J. (2007). Recognition and recall as measures of long-term
retention. Quarterly Journal of Experimental Psychology, 27, 411–418.
https://doi.org/10.1080/14640747508400501

55
Rasch, B., & Born, J. (2013). About Sleep’s Role in Memory. Physiol Review, 93, 681–766.
https://doi.org/doi:10.1152/physrev.00032.2012
R Core Team (2019). R: A language and environment for statistical computing. R Foundation
for Statistical Computing, Vienna, Austria. URL https://www.R-project.org/.
Redline, S., Kirchner, H. L., Quan, S. F., Gottlieb, D. J., Kapur, V., & Newman, A. (2004).
The Effects of Age, Sex, Ethnicity, and Sleep-Disordered Breathing on Sleep
Architecture. Archives of Internal Medicine, 164(4), 406–418.
https://doi.org/10.1001/archinte.164.4.406
Rutishauser, U., Ross, I. B., Mamelak, A. N., & Schuman, E. M. (2010). Human memory
strength is predicted by theta-frequency phase-locking of single neurons. Nature,
464(7290), 903–907. https://doi.org/10.1038/nature08860
Salari, N., & Rose, M. (2016). Dissociation of the functional relevance of different pre-
stimulus oscillatory activity for memory formation. NeuroImage, 125, 1013–1021.
https://doi.org/10.1016/j.neuroimage.2015.10.037
Schneider, S. L., & Rose, M. (2016). Intention to encode boosts memory-related pre-stimulus
EEG beta power. NeuroImage, 125, 978–987.
https://doi.org/10.1016/j.neuroimage.2015.11.024
Schreiner, T., Doeller, C. F., Jensen, O., Rasch, B., & Staudigl, T. (2018). Theta Phase-
Coordinated Memory Reactivation Reoccurs in a Slow-Oscillatory Rhythm during
NREM Sleep. Cell Reports, 25(2), 296–301. https://doi.org/10.1016/j.celrep.2018.09.037
Schreiner, T., Göldi, M., & Rasch, B. (2015). Cueing vocabulary during sleep increases theta
activity during later recognition testing. Psychophysiology, 52(11), 1538–1543.
https://doi.org/10.1111/psyp.12505
Schreiner, T., Lehmann, M., & Rasch, B. (2015). Auditory feedback blocks memory benefits
of cueing during sleep. Nature Communications, 6(8729), 1–11.
https://doi.org/10.1038/ncomms9729
Schreiner, T., & Rasch, B. (2015). Boosting Vocabulary Learning by Verbal Cueing During
Sleep. Cerebral Cortex, 25(11), 4169–4179. https://doi.org/10.1093/cercor/bhu139
Sirota, A., Montgomery, S., Fujisawa, S., Isomura, Y., Zugaro, M., & Buzsáki, G. (2008).
Entrainment of Neocortical Neurons and Gamma Oscillations by the Hippocampal Theta
Rhythm. Neuron, 60(4), 683–697. https://doi.org/10.1016/j.neuron.2008.09.014
Squire, L. R., & Zola, S. M. (1996). Structure and function of declarative and nondeclarative
memory systems. Proceedings of the National Academy of Sciences of the United States
of America, 93(24), 13515–13522. https://doi.org/10.1073/pnas.93.24.13515
56
Steyer, R., P. Schwenkmezger, P. Notz, and M. Eid. 1997. Der Mehrdimensionale
Befindlichkeitsfragebogen (MDBF). Hogrefe, G€ottingen.
Stickgold, R. (2005). Sleep-dependent memory consolidation. Nature, 437(7063), 1272–1278.
https://doi.org/10.1038/nature04286
van Albada, S. J., & Robinson, P. A. (2013). Relationships between Electroencephalographic
Spectral Peaks Across Frequency Bands. Frontiers in Human Neuroscience, 7, 56.
https://doi.org/10.3389/fnhum.2013.00056
Vertes, R. P. (2005). Hippocampal theta rhythm: a tag for short-term memory. Hippocampus,
15(7), 923–935. https://doi.org/10.1002/hipo.20118
Vosskuhl, J., Huster, R. J., & Herrmann, C. S. (2015). Increase in short-term memory
capacity induced by down-regulating individual theta frequency via transcranial
alternating current stimulation. Frontiers in Human Neuroscience, 9(May), 257.
https://doi.org/10.3389/fnhum.2015.00257
Zaehle, T., Rach, S., & Herrmann, C. S. (2010). Transcranial Alternating Current Stimulation
Enhances Individual Alpha Activity in Human EEG. PLOS ONE, 5(11).
https://doi.org/10.1371/journal.pone.0013766
Zuur, A., Ieno, E. N., Walker, N., Saveliev, A., & Smith, G. M. (2009). Mixed Effects Models
and Extensions in Ecology With R (Vols. 1–574). https://doi.org/10.1007/978-0-387-
87458-6_1

57
Appendix A
After-stimulation questionnaire:

58
Central parts of MATLAB script assigning words from list A and B into three new lists:
Theta, beta and uncued:

59

60
Parts of the R script for extracting sleep episodes between and after stimulation:

61

62
Appendix B
Distribution of hits (correctly remembered words in proportion):
Residual plots for model 1:

63
Faceted by condition:

64
Coefficients for all participants (VP) from model 1 (all conditions, random intercept) :
Residual plots for model 2:

65
Coefficients for all participants from model 2 (Just theta /beta(reference) conditions, random
slope) :

66
Model 1 and 0 model and its comparison in the likelihood ratio test. Hits = number of
correctly remembered words.
Likelihood test for model 2:
Plot of memory change with the uncued condition:

67
TMR only studies, calculations for comparison in the discussion:
Our results calculated with 100 % performance in immediate recall:

68
REM latencies for all participants:
Plots of conditions separated by stimorder (right y axis).

69