Embed Size (px)
Citation preview
Contents lists available at ScienceDirect
Neurobiology of Disease
journal homepage: www.elsevier.com/locate/ynbdi
Beta bursts during continuous movements accompany the velocitydecrement in Parkinson's disease patientsRoxanne Lofredia,b,c,d, Huiling Tana,b, Wolf-Julian Neumannc, Chien-Hung Yeha,b,Gerd-Helge Schneidere, Andrea A. Kühnc, Peter Browna,b,⁎
a Nuffield Department of Clinical Neurosciences, University of Oxford, Oxford, UKb Medical Research Council Brain Network Dynamics Unit, University of Oxford, Oxford, UKc Movement Disorders and Neuromodulation Unit, Department of Neurology, Charité – Universitätsmedizin Berlin, Berlin, Germanyd Berlin Institute of Health (BIH), 10178 Berlin, Germanye Department of Neurosurgery, Charité – Universitätsmedizin Berlin, Berlin, Germany
A R T I C L E I N F O
Keywords:Parkinson's diseaseBradykinesiaSubthalamic nucleusBeta oscillationsBeta bursts
A B S T R A C T
Bradykinesia is reported to correlate with subthalamic beta power (13–35 Hz) recorded at rest in Parkinson'sdisease (PD). Pilot studies suggest adaptive deep brain stimulation triggered by amplitude threshold crossings ofbeta activity defined at rest is effective. This is puzzling, given that beta is suppressed during repetitivemovements when bradykinesia becomes apparent. Recently, increased beta power in PD has been linked to betabursts. Here we investigate whether beta bursts also occur during repetitive movements and relate to progressivedecrement in movement velocity. Therefore, subthalamic local field potentials were recorded in 12 PD patientsoff medication while performing 30s blocks of rotatory movements alternating with rest periods. Bursts weredefined separately for the low (13–20 Hz) and high (20–35 Hz) beta band using thresholds defined at rest. Asexpected, velocity significantly decreased within movement blocks. Despite the sustained suppression of bothbeta sub-bands, bursts could still be detected during movement. Beta bursts were reduced in amplitude, durationand rate during movement with beta rate correlating best with beta power. A mixed-effects linear model re-vealed that percentage time spent in beta bursts predicted velocity decreases better than averaged power. Thiscorrelation was specific for the low beta band. Our results link beta bursts during movement to bradykinesia.This helps explain how beta activity may contribute to bradykinetic movement decrement even though meanbeta power is reduced during movement. Moreover, our findings help explain the effectiveness of adaptive DBStriggered off beta bursts, even though these may be defined with respect to beta levels at rest.
1. Introduction
Parkinson's disease (PD) is a common neurological disorder withbradykinesia as its core motor symptom. Bradykinesia describes theslowness of movement initiation and the progressive decrement inmovement velocity and amplitude during repetitive movements that isspecific for PD. (Rodrigues et al., 2009; Ling et al., 2012; Rocco et al.,n.d.) It is particularly well controlled by chronic deep brain stimulation(DBS), an efficient treatment option for PD patients in whom dopami-nergic medications no longer provide consistent benefit (Deuschl et al.,2006; Schuepbach et al., 2013). Recordings from externalized DBS-electrodes have revealed a correlation between the severity of brady-kinesia and the extent of averaged beta amplitude (13–35 Hz) in thesubthalamic nucleus (STN) (Kühn et al., 2006; Neumann et al., 2016;
Oswal et al., 2016). Subthalamic beta power is reduced in parallel withsymptom alleviation by both dopaminergic medication (Kühn et al.,2006; Kühn et al., 2009) and DBS (Oswal et al., 2016; Eusebio et al.,2011; Kuhn et al., 2008). Accordingly, beta activity has been considereda neurophysiological correlate of motor impairment and has been usedas local feedback parameter for adaptive instead of continuously de-livered DBS. There are several approaches to adaptive DBS. One uses aSTN beta amplitude threshold to turn stimulation on and off and hasproven to have a similar or better efficacy / side-effect profile thanconventional DBS (Little et al., 2016a; Little et al., 2013; Little et al.,2016b; Pina-Fuentes et al., 2017). The beneficial effects of this form ofadaptive DBS and of dopaminergic medication have recently beenlinked to a shortening of pathologically prolonged and elevated betaepisodes, so called beta bursts (Tinkhauser et al., 2017a; Tinkhauser
https://doi.org/10.1016/j.nbd.2019.03.013Received 6 November 2018; Received in revised form 27 February 2019; Accepted 14 March 2019
⁎ Corresponding author at: Nuffield Department of Clinical Neurosciences, John Radcliffe Hospital, University of Oxford, Level 6, West Wing, OX3 9DU Oxford, UK.E-mail address: [email protected] (P. Brown).
Neurobiology of Disease 127 (2019) 462–471
Available online 18 March 20190969-9961/ © 2019 The Authors. Published by Elsevier Inc. This is an open access article under the CC BY license (http://creativecommons.org/licenses/BY/4.0/).
T

et al., 2017b). This is in line with findings from physiological brainactivity, where beta bursts preceding a movement have been associatedwith a slowing of subsequent movements (Leventhal et al., 2012; Shinet al., 2017). However, it has not been reported yet whether beta burstsare also present during continuous movements and if so, what effectstheir occurrence might have on movement velocity. Rather, the currentunderstanding derived from non-invasive and intracerebral recordingsin healthy primates and humans, as well as PD patients, is that con-tinuously performed non-isometric movements are accompanied by asustained suppression of beta power below its level at rest(Androulidakis et al., 2008; Joundi et al., 2013; Muthukumaraswamy,2010; Steiner et al., 2017; Kühn et al., 2008; Erbil & Ungan, 2007;Cassim et al., 2000; Bichsel et al., 2018). Yet, bursts of increased betapower may not have been captured in previous studies, as beta powerwas routinely averaged across the time domain. Here we hypothesizethat subthalamic beta bursts also occur during repetitive movements inPD patients and may relate to the progressive decrement of velocity inbradykinesia termed the sequence effect. Our findings help explain twoclinico-physiological paradoxes; how may beta activity contribute tothe sequence effect and how can adaptive deep brain stimulation trig-gered off beta bursts improve bradykinesia when mean beta power isreduced during movement (Johnson et al., 2016)?
2. Methods and materials
2.1. Patients and surgery
12 subjects with idiopathic Parkinson's disease (mean diseaseduration 10.5 years, range 5–18 years; mean age 62.8 years, range47–72 years; four women; further clinical details given in Table 1)undergoing stereotactic functional neurosurgery for bilateral im-plantation of DBS electrodes in the STN were enrolled in the study. Allsubjects provided written informed consent which was approved by thelocal review boards of the Charité - Universitätsmedizin Berlin and inaccordance with the standards set by the Declaration of Helsinki. DBSelectrode extension cables were externalized in a brief postoperativeinterval of 5–7 days for clinical testing, allowing the recording of localfield potentials (LFP) from the STN. In 9 subjects, the permanentquadripolar macroelectrode used was model 3389 (Medtronic Neuro-logical Division, Minneapolis, MN, USA) with four platinum‑iridiumcylindrical surfaces (1.27 mm diameter, 1.5 mm length) and a centre-to-centre separation of 2 mm. In 3 subjects, directional leads (BostonScientific, Marlborough, MA) with 2 cylindrical (most ventral and mostdorsal contact, here termed contacts 1 and 8) and 2*3 segmented sur-faces (1.5 mm2) with a centre-to-centre separation of 2 mm (heretermed contacts 2, 3 and 4 for the ventral segmented ring and 5, 6 and 7for the dorsal segmented ring) were implanted. In all subjects, correctDBS-electrode placement was confirmed by intraoperative
microelectrode recordings and test stimulation. In 10/12 subjects, post-operative CT imaging was available (case 2 and 12 did not have post-operative images in our centre) and used for localization of DBS-elec-trodes following the semi-automatic approach implemented in theLead-DBS toolbox (Horn et al., 2018; Horn & Kühn, 2015). In brief,preoperative T2 and T1 weighted MR images were coregistered topostoperative CT scans and normalized to MNI 2009b NLIN Asymstandard space. DBS contact artefacts in CT scans were visualized andmarked to obtain 3D coordinates in MNI space of all contacts for allavailable scans.
2.2. Paradigm and recordings
LFP-recordings were performed after the subjects had been with-drawn from dopaminergic medication for at least 12 h (OFF state).Subjects were comfortably seated in an armchair and asked to con-tinuously rotate a swivelling handle as quickly and with the largestamplitude as possible for 30 s with their clinically more affected upperlimb (right: n= 7, left: n= 5). Every movement block was precededand followed by 30 s of rest recording. This sequence was repeated withthe same instructions three times (see Fig. 1). Subjects could initiateand execute the repetitive movement in their own time so that it wasself-paced in nature. LFPs were recorded between adjacent contact pairsin the 9 subjects with the 3389 electrode model. In the 3 cases withdirectional leads, bipolar recordings were obtained by referencing eachcontact to the lowermost contact of the electrode. The recordings werethen re-referenced offline to approximate the bipolar recordings de-rived from adjacent pairs of the circular contacts of the 3389 electrodemodel (for example: (STNR12 + STNR13 + STNR14)-(STNR15 + STNR16 + STNR17)). Signals were amplified (x 50.000)and low (1 kHz) and high pass (0.5 Hz) filtered using a D360 amplifier(Digitimer Ltd., Welwyn Garden City, Hertfordshire, UK). Data weresampled at 2 kHz on the analog to digital converter (1401). All datawere low-pass filtered below 500 Hz and down sampled to 1 kHz offlinefor further analysis. 9/12 patients also performed the same task severalmonths after implantation of an impulse generator with the option ofrecording local field potentials where the signal-to-noise ratio allowedonly a more limited analysis of the dynamics of beta activity (Steineret al., 2017).
2.3. Data analysis and signal processing
Analyses of both behavioural and electrophysiological data wereperformed in MATLAB (version R2016a; The MathWorks, Natick, USA)using custom Matlab code based on the Statistical Parametric Mapping(Litvak et al., 2011a) and Fieldtrip (Oostenveld et al., 2011) toolboxes.Segments with visually detected artefacts were removed before re-cordings were down-sampled to 200 Hz and high-pass (3 Hz) and notch
Table 1Clinical details.
Case Age/Gender Disease duration (years) Symptoms Handedness More affected side UPDRS ON/OFF Medication Brady-kinesia Subscorea
1 62/M 15 Tremor, Bradykinesia Right Right 21/24 42 66/M 8 Bradykinesia, Rigidity Right Right 17/26 53 72/M 9 Tremor, Bradykinesia, Rigidity Right Left 20/35 54 63/M 16 Bradykinesia, Rigidity Right Left 29/42 65 72/F 5 Bradykinesia, Rigidity Right Right 19/34 76 61/F 10 Tremor, Bradykinesia, Rigidity Right Right 4/20 47 47/F 7 Tremor, Bradykinesia, Rigidity Right Left 6/29 68 58/F 7 Tremor, Bradykinesia Right Right 10/32 59 57/M 18 Tremor, Bradykinesia Right Left 20/41 410 65/M 12 Bradykinesia, Rigidity Right Left 39/55 611 69/M 9 Tremor, Bradykinesia Right Right 23/33 612 62/M 10 Bradykinesia, Rigidity Right Right 30/47 6
a Sum of bradykinesia sub-items in MDS-UPDRS-III of more affected upper limb (finger taps, hand movements, supination/pronation movements) in the OFFmedication state.
R. Lofredi, et al. Neurobiology of Disease 127 (2019) 462–471
463
filtered (48–52 Hz) to limit movement artefacts and effects of line noise.During movement, the local maxima of the movement velocity (firstderivative of movement trace) were automatically detected (matlabfunction: findpeaks, minimal peak height 0.01, minimal peak distance30 data points). All automatically defined time points were visuallychecked and adjusted if necessary. By interpolating between the peaksof movement velocity, a continuous measurement of movement velo-city across movement time was obtained which mitigated the effects ofdirectional changes in movement. The interpolated traces weresmoothed with a moving average Gaussian smoothing kernel of 50 ms.LFP recordings were transferred to the frequency domain using Morletwavelets with 10 cycles and a frequency resolution of 1 Hz. Power-spectra were normalized to the sum of total power of 5–45 Hz and55–95 Hz over the entire recording session to allow comparison acrosssubjects. The bipolar channel with highest peak in the beta band(13–35 Hz) during rest, contralateral to the moved hand, was selectedfor further analyses. This selection was based on previous reports thatdemonstrated a significant correlation between contact-pair location inthe sensorimotor part of the STN and beta power (Horn et al., 2017). Inthe present cohort, post-hoc verification of contact pair localization,defined as the Euclidean midpoint between adjacent contacts (Hornet al., 2017; Neumann et al., 2017), confirmed that highest beta powercoincided with location in the sensorimotor STN, see SupplementaryFig. 1. Moreover, selected contact pairs were on average 3 ± 0.29 mmdistant to a previously reported optimal target location for best clinicalDBS outcome in PD. (Caire et al., 2013) The wavelet amplitude wasseparately averaged across the low beta (13–20 Hz) and high beta(20–35 Hz) sub-bands as distinct roles for both sub-bands in motorcontrol and with respect to dopamine-responsivity have been reported
(Oswal et al., 2016). Each power amplitude trace was z-scored (X-μ/δ)over the entire recording session and smoothed with a moving averageGaussian smoothing kernel of 175 ms. A burst was defined separatelyfor the high and low beta sub-bands when the instantaneous normalizedpower exceeded the 75th percentile of the signal amplitude distributionacross the rest periods of the recording in the respective frequency band(Tinkhauser et al., 2017a). We took the 75th percentile to define burstsas this has been the one used in previous studies of PD patients in theliterature (Tinkhauser et al., 2017a; Tinkhauser et al., 2017b;Tinkhauser et al., 2018; Torrecillos et al., 2018; Lofredi et al., 2018a;Lofredi et al., 2018b). Importantly, using this threshold it has beenshown elsewhere that bursts in the STN LFP overlap bursts in the ip-silateral EEG and contralateral STN LFP more often than predicted bychance from permuted data. Moreover, the phase synchronization be-tween cerebral cortex and STN is greater during STN beta bursts thanoutside of these bursts (Tinkhauser et al., 2018). This is evidence thatbursting tends to be synchronised across the basal-ganglia cortical cir-cuit and is not simply the product of a thresholded, time-varying localsignal. In line with this, we have previously shown that the pattern offindings is similar regardless of whether the 55th to 90th percentilethresholds is used to define bursts (Tinkhauser et al., 2017a). Anotherimportant reason for using the 75th percentile to define bursts is that itequates to the median threshold used in amplitude-responsive adaptiveDBS when allowance is made for the processing and ramping appliedduring adaptive DBS (Little et al., 2016a; Little et al., 2013). Thus thefindings with this threshold are relevant to the delivery of adaptive DBS(Tinkhauser et al., 2017a). However, to show that the correlation be-tween change in velocity and low beta bursting is similar regardless ofthe exact threshold applied, we also tested additional linear mixed-
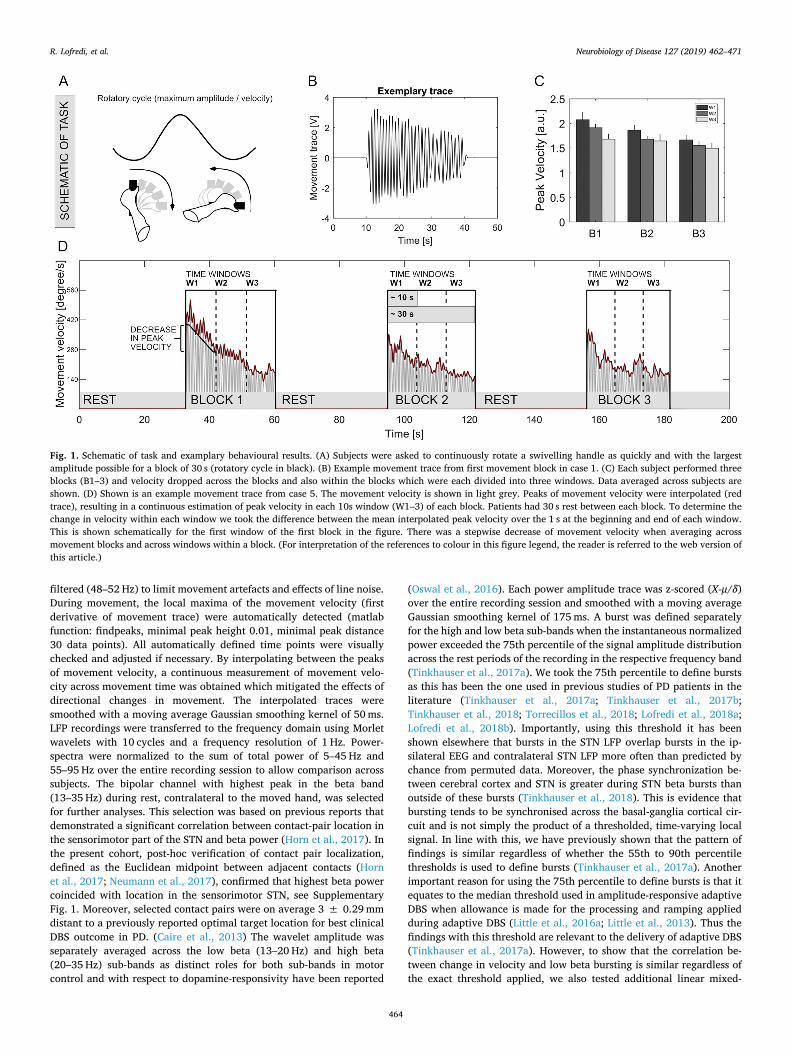
Fig. 1. Schematic of task and examplary behavioural results. (A) Subjects were asked to continuously rotate a swivelling handle as quickly and with the largestamplitude possible for a block of 30 s (rotatory cycle in black). (B) Example movement trace from first movement block in case 1. (C) Each subject performed threeblocks (B1–3) and velocity dropped across the blocks and also within the blocks which were each divided into three windows. Data averaged across subjects areshown. (D) Shown is an example movement trace from case 5. The movement velocity is shown in light grey. Peaks of movement velocity were interpolated (redtrace), resulting in a continuous estimation of peak velocity in each 10s window (W1–3) of each block. Patients had 30 s rest between each block. To determine thechange in velocity within each window we took the difference between the mean interpolated peak velocity over the 1 s at the beginning and end of each window.This is shown schematically for the first window of the first block in the figure. There was a stepwise decrease of movement velocity when averaging acrossmovement blocks and across windows within a block. (For interpretation of the references to colour in this figure legend, the reader is referred to the web version ofthis article.)
R. Lofredi, et al. Neurobiology of Disease 127 (2019) 462–471
464

effects models with results derived from thresholding with the 55th,65th, 85th and 95th percentile. Beta burst duration was defined as thetime spent over the predefined threshold. Threshold crossings lastingshorter than 100 ms were not considered, so that bursts involved morethan one complete oscillation cycle. The amplitude of a beta burst wasdefined as the area under the curve between signal and threshold line.Beta burst properties at rest and during movement were compared se-parately for both beta sub-bands. The distribution of burst durationswas considered by categorizing them into five time windows of 100 msstarting from 200 ms to > 600 ms in duration.
2.4. Statistics
Non-parametric Monte Carlo permutation tests were used for sta-tistical analyses. Permutation tests do not rely on assumptions about the
underlying data distribution. Note that the interchanged values alwaysstem from the same physiological source and differ only in the testcondition in which they occur. To illustrate the method we refer to thecomparison between high beta power at rest and during movement, asshown in the right bar plots in Fig. 2B. For legibility, high beta is ab-breviated beta in the following. First, beta power was averaged sepa-rately over rest and over movement within each patient. Thereby, twogroups of twelve beta values at rest and twelve corresponding betavalues during movement were generated. We refer to this distributionas the original distribution. We then averaged the beta power at restacross subjects and the beta power during movement across subjectsand subtracted mean beta power at rest from mean beta power duringmovement. In this specific case the mean difference between betapower during movement and at rest was −0.3118, showing that betapower at rest was higher than beta power during movement in the
Fig. 2. Averaged power spectra and burst properties at rest and during movement. (A) Group average power spectra were estimated separately over movement (red)and rest periods (black). (B) When averaging over the low (13–20 Hz) and high (20–35 Hz) beta sub-bands, there was a significant power decrease in both beta sub-bands during movement. (C, D) Both low and high beta power were continuously suppressed when averaged over 10 s windows within movement blocks. (E) Groupaveraged data. Beta burst properties during movement (red bars) and rest (black bars) periods were compared separately for the low (upper panel) and high beta sub-bands (lower panel). There was a significant decrease in burst duration and rate during movement when compared to rest, in both beta sub-bands. Additionally, burstamplitude during movement was significantly decreased in the low beta band when compared to rest. (F) During movement, the percentage amount of short bursts(< 200 ms) was higher. At rest, the amount of longer bursts was higher. Shaded areas in A and error lines indicate standard errors of the mean. Means and standarderrors of the mean are shown. *P < .05; **P < .01. (For interpretation of the references to colour in this figure legend, the reader is referred to the web version ofthis article.)
R. Lofredi, et al. Neurobiology of Disease 127 (2019) 462–471
465

original distribution. In a second step, we created a shuffled distributionby randomly interchanging beta values averaged in each subject overrest and beta values averaged in each subject during movement to givea shuffled distribution. We then averaged the shuffled beta power atrest across subjects and the shuffled beta power during movementacross subjects and subtracted mean beta power at rest from mean betapower during movement in the shuffled distribution. The shufflingprocedure was randomly repeated 5000 times to generate 5000 meandifference estimates. The mean difference between beta power at restand beta power during movement in our original distribution was thencompared to that in the distribution of 5000 mean differences gener-ated from the shuffled data. If the mean difference in the original datawas outside the 95% confidence limits of the mean difference of theshuffled data then this was considered a significant difference.
Rank-based Spearman correlations were calculated if data deviatedsignificantly from a normal distribution as assessed by Kolmogorov-Smirnov tests. Otherwise, linear Pearson correlations were conducted.Correlation coefficients were Fisher transformed before averaging andthen back-transformed. Results are reported as mean ± standard de-viation and considered significant at an α-level of 0.05 after correctionfor multiple comparisons by controlling for the false discovery rate(FDR) (Benjamini & Hochberg, 1995). Averaged LFP power and per-centage time with burst activity were derived from the activity over 3windows per 30-s movement block (~10 s per window; see Fig. 1B, D).To assess the sequence effect, the difference in velocity averaged over1 s (corresponds to approximately two rotations) at the beginning andthe end of each time window (~10 s) was calculated. In addition, werepeated analyses when averaging across windows of ~5 s to test for theconsistency of any identified effects. Separate linear mixed effects re-gression models were compared to assess the relationship betweenchange in velocity and mean power or bursting in both beta sub-bandsusing the Matlab function fitlme. Linear mixed effects regression modelshave excellent statistical power, as they allow for both fixed andrandom effects as well as for consideration of non-independence in thedata, which arises from a hierarchical structure (here the considerationof both individual subject data and cross-subject results). In our im-plementation, the change in velocity was set as the dependent variable.Averaged power, change in averaged power or percentage time spent inbursting were entered into the model as fixed effects, separately for thelow or high beta sub-band. In order to take into account the cross-subject variability in the linear regression intercepts and slopes betweenthe dependent variable and the considered independent variables, theintercepts and the slopes were considered as additional random factorsgrouped by subjects. Thus, the fixed effects give the estimated popu-lation mean values of the slopes in the tested within-subject relation-ship across all subjects. To control for effects of non-normal distribu-tion, significant models were compared to results after transforming allmodel inputs to normal distribution (van Albada & Robinson, 2007).Window duration was kept relatively long (10 or 5 s) to observe thesequence effect on velocity and to capture the effects of several betabursts within each window, thereby increasing potential effect sizes. Byconsidering long time periods, this approach was also relatively robustto systematic fluctuations in beta activity and burst probability withinone rotatory movement cycle (lasting ~50 ms) that have been reportedin the gait cycle (Fischer et al., 2018) and during repetitive index fingerto thumb taps (Androulidakis et al., 2008).
3. Results
3.1. Behavioural results of change in movement over time
After artefact removal, the analysed movement time was89.13 ± 1.5 s (29.7 ± 0.4 s for each of the three movement blocks)and rest time 91.8 ± 4.4 s per subject (drawn from the three corre-sponding rest blocks). Patients performed rotatory movements with amean frequency of 1.7 ± 0.2 Hz and a mean speed of 240.7 ± 22.4
degrees/s. Three movement blocks were performed. For analysis, eachblock was subdivided in three equally long time windows (9.9 ± 0.1 sper time window) to assess the change of behaviour and oscillatoryactivity over time. A linear mixed-effects regression model (with aver-aged movement velocity in a given time window as the dependentvariable, time windows as independent variables, random intercepts fordifferent subjects and fixed slope between time window and movementvelocity) demonstrated a significant relationship between averagedvelocity and time window within blocks as well as across blocks(n= 12, estimate of fixed slope across blocks = −0.27, P = .006; es-timate of fixed slope across windows within blocks = −0.24, P= .01,BIC = 100.87) without significant interaction between time windowsand blocks (P= .2). Although the averaged velocity decreased from thefirst to the last block, the change in velocity within 10 s was similarboth across windows within a movement block and across movementblocks (block: P= .1; window: P= .7). Summing up, these resultsconfirm a decrease in velocity (sequence effect) over 30 s on a grouplevel, with the slope of this velocity decrease being relatively uniformover time. An example of the performance of a single block is shown inFig. 1B and the group data across and within blocks are summarised inFig. 1C.
3.2. Power spectra at rest and during movement
When averaging beta band power separately for rest and movementperiods, both low (13–20 Hz) and high beta (20–35 Hz) power weresuppressed during movement (low beta: rest = 1.42 ± 0.2% totalpower, mov = 1.16 ± 0.2%, Pmovrest = 0.02; high beta:rest = 0.86 ± 0.2%, mov = 0.55 ± 0.15%, Pmovrest = 0.005; Fig. 2A,B). After z-scoring the low and high beta bands separately over theentire recording, mean power was assessed across the three windowscomprising the blocks of movement. In the low beta band, the powersuppression was significant in the first and last window but did notreach significance in the second window (rest = 0.1 ± 0.04; W1/W2/W3: mov = −0.155 ± 0.08/−0.0465 ± 0.07/−0.09 ± 0.06,Pmovrest = 0.01/0.9/0.03; Fig. 2C and Supplementary Fig. 2). In thehigh beta band, the power suppression persisted across all time win-dows (rest = 0.17 ± 0.06; W1/W2/W3: mov = −0.17 ± 0.02/−0.13 ± 0.09/−0.22 ± 0.07, Pmovrest = 0.01/0.02/0.003; Fig. 2D).
3.3. Movement-related modulation of beta burst properties
Beta burst properties at rest and during movement are summarisedin Fig. 2E and F. Low beta bursts were present in all subjects duringmovement for 18.7 ± 3% of the total movement time (50 ± 7 burstsper subject, 16 ± 8 per block, 5 ± 0.8 per window) while high betabursts were detected in 9/12 subjects during movement for 13 ± 3% ofthe total movement time (55.9 ± 7 bursts per subject, 17.5 ± 11 perblock, 5.8 ± 1.1 per window). The 3/12 subjects without high betabursting during movement showed no significant differences in peakvelocity (HBeta Bursts Negative: 1.5 ± 0.18 a.u., HBeta Bursts Posi-tive: 1.8 ± 0.21 a.u., P= .11) or change in velocity over time (HBetaBursts Negative: −0.2 ± 0.15 a.u., HBeta Bursts Positive:–0.1 ±0.26 a.u., P= .45). In both beta sub-bands, bursts occurred less fre-quently (low beta burst rate: rest = 0.7 ± 0.1 Hz, mov = 0.6 ±0.3 Hz, P = .05; high beta burst rate: rest = 0.9 ± 0.1 Hz,mov = 0.5 ± 0.5 Hz, P= .008) and were shorter in duration (low betaburst dur: rest = 340 ± 62 ms, mov = 287 ± 86 ms, P= .04; highbeta burst dur: rest = 278 ± 35 ms mov = 230 ± 51 ms, P = .02)during movement than at rest. In the low beta band, burst amplitudewas also significantly smaller during movement when compared to rest(low beta burst amplitude: rest = 68 ± 22 a.u., mov = 43 ± 21 a.u.,P= .02). This was not the case for high beta bursting (high beta burstamplitude: rest = 49 ± 16 a.u., mov = 38 ± 27 a.u., P= .25). Theproportion of short bursts (≤300 ms) was increased during movementcompared to an increased proportion of longer bursts (≥600 ms) at rest
R. Lofredi, et al. Neurobiology of Disease 127 (2019) 462–471
466
(see Fig. 2E and Supplementary Table 1).Above we confirmed a decrease in velocity (sequence effect) over
30 s, but showed that the slope of this decrease in velocity was rela-tively constant over time. Similarly, mean burst amplitude, durationand rate, did not vary systematically with block order or time windowindicating that beta bursting during movement was also relatively un-affected by the time within a given subject. This was shown by a linearmixed-effects regression model with a random intercept and fixed slopebetween subjects and mean burst duration, amplitude or rate as thedependent variable and movement block and time window within blockas independent variables, separately for each beta frequency sub-band.The burst rate and the mean burst amplitude and duration were sig-nificant predictors of the averaged beta power within time windows(low beta: PRate < 0.001; PAmp < 0.001; PDur = 0.01; high beta:PRate < 0.001; PAmp < 0.001; PDur = 0.025). Burst rate was the mostimportant predictor (low beta: coefficients estimate for burstrate = 0.63, coefficients estimate for z-scored burst amplitude = 0.003,coefficients estimate for burst duration = 0.0004; high beta: coeffi-cients estimate for burst rate = 0.37, coefficients estimate for z-scoredburst amplitude = 0.003, coefficients estimate for burst dura-tion = 0.0004).
3.4. Correlation between decrement in movement velocity and beta bursting
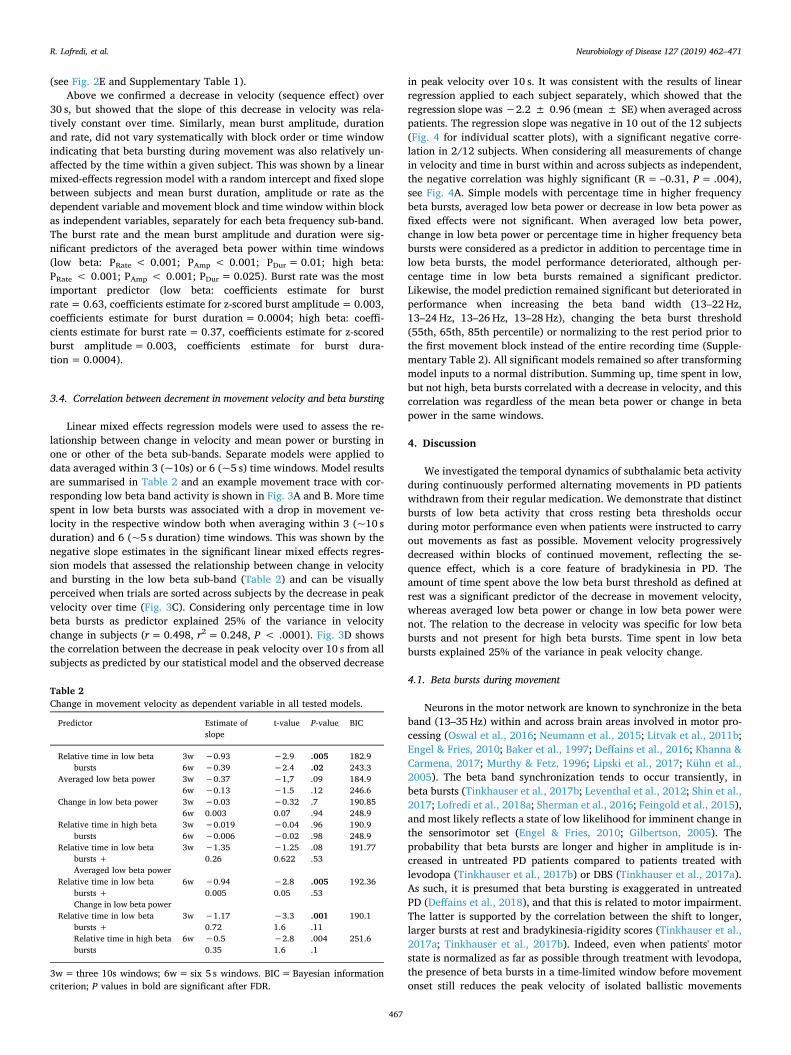
Linear mixed effects regression models were used to assess the re-lationship between change in velocity and mean power or bursting inone or other of the beta sub-bands. Separate models were applied todata averaged within 3 (~10s) or 6 (~5 s) time windows. Model resultsare summarised in Table 2 and an example movement trace with cor-responding low beta band activity is shown in Fig. 3A and B. More timespent in low beta bursts was associated with a drop in movement ve-locity in the respective window both when averaging within 3 (~10 sduration) and 6 (~5 s duration) time windows. This was shown by thenegative slope estimates in the significant linear mixed effects regres-sion models that assessed the relationship between change in velocityand bursting in the low beta sub-band (Table 2) and can be visuallyperceived when trials are sorted across subjects by the decrease in peakvelocity over time (Fig. 3C). Considering only percentage time in lowbeta bursts as predictor explained 25% of the variance in velocitychange in subjects (r= 0.498, r2 = 0.248, P < .0001). Fig. 3D showsthe correlation between the decrease in peak velocity over 10 s from allsubjects as predicted by our statistical model and the observed decrease
in peak velocity over 10 s. It was consistent with the results of linearregression applied to each subject separately, which showed that theregression slope was −2.2 ± 0.96 (mean ± SE) when averaged acrosspatients. The regression slope was negative in 10 out of the 12 subjects(Fig. 4 for individual scatter plots), with a significant negative corre-lation in 2/12 subjects. When considering all measurements of changein velocity and time in burst within and across subjects as independent,the negative correlation was highly significant (R = –0.31, P= .004),see Fig. 4A. Simple models with percentage time in higher frequencybeta bursts, averaged low beta power or decrease in low beta power asfixed effects were not significant. When averaged low beta power,change in low beta power or percentage time in higher frequency betabursts were considered as a predictor in addition to percentage time inlow beta bursts, the model performance deteriorated, although per-centage time in low beta bursts remained a significant predictor.Likewise, the model prediction remained significant but deteriorated inperformance when increasing the beta band width (13–22 Hz,13–24 Hz, 13–26 Hz, 13–28 Hz), changing the beta burst threshold(55th, 65th, 85th percentile) or normalizing to the rest period prior tothe first movement block instead of the entire recording time (Supple-mentary Table 2). All significant models remained so after transformingmodel inputs to a normal distribution. Summing up, time spent in low,but not high, beta bursts correlated with a decrease in velocity, and thiscorrelation was regardless of the mean beta power or change in betapower in the same windows.
4. Discussion
We investigated the temporal dynamics of subthalamic beta activityduring continuously performed alternating movements in PD patientswithdrawn from their regular medication. We demonstrate that distinctbursts of low beta activity that cross resting beta thresholds occurduring motor performance even when patients were instructed to carryout movements as fast as possible. Movement velocity progressivelydecreased within blocks of continued movement, reflecting the se-quence effect, which is a core feature of bradykinesia in PD. Theamount of time spent above the low beta burst threshold as defined atrest was a significant predictor of the decrease in movement velocity,whereas averaged low beta power or change in low beta power werenot. The relation to the decrease in velocity was specific for low betabursts and not present for high beta bursts. Time spent in low betabursts explained 25% of the variance in peak velocity change.
4.1. Beta bursts during movement
Neurons in the motor network are known to synchronize in the betaband (13–35 Hz) within and across brain areas involved in motor pro-cessing (Oswal et al., 2016; Neumann et al., 2015; Litvak et al., 2011b;Engel & Fries, 2010; Baker et al., 1997; Deffains et al., 2016; Khanna &Carmena, 2017; Murthy & Fetz, 1996; Lipski et al., 2017; Kühn et al.,2005). The beta band synchronization tends to occur transiently, inbeta bursts (Tinkhauser et al., 2017b; Leventhal et al., 2012; Shin et al.,2017; Lofredi et al., 2018a; Sherman et al., 2016; Feingold et al., 2015),and most likely reflects a state of low likelihood for imminent change inthe sensorimotor set (Engel & Fries, 2010; Gilbertson, 2005). Theprobability that beta bursts are longer and higher in amplitude is in-creased in untreated PD patients compared to patients treated withlevodopa (Tinkhauser et al., 2017b) or DBS (Tinkhauser et al., 2017a).As such, it is presumed that beta bursting is exaggerated in untreatedPD (Deffains et al., 2018), and that this is related to motor impairment.The latter is supported by the correlation between the shift to longer,larger bursts at rest and bradykinesia-rigidity scores (Tinkhauser et al.,2017a; Tinkhauser et al., 2017b). Indeed, even when patients' motorstate is normalized as far as possible through treatment with levodopa,the presence of beta bursts in a time-limited window before movementonset still reduces the peak velocity of isolated ballistic movements
Table 2Change in movement velocity as dependent variable in all tested models.
Predictor Estimate ofslope
t-value P-value BIC
Relative time in low betabursts
3w −0.93 −2.9 .005 182.96w −0.39 −2.4 .02 243.3
Averaged low beta power 3w −0.37 −1,7 .09 184.96w −0.13 −1.5 .12 246.6
Change in low beta power 3w −0.03 −0.32 .7 190.856w 0.003 0.07 .94 248.9
Relative time in high betabursts
3w −0.019 −0.04 .96 190.96w −0.006 −0.02 .98 248.9
Relative time in low betabursts +Averaged low beta power
3w −1.35 −1.25 .08 191.770.26 0.622 .53
Relative time in low betabursts +Change in low beta power
6w −0.94 −2.8 .005 192.360.005 0.05 .53
Relative time in low betabursts +Relative time in high betabursts
3w −1.17 −3.3 .001 190.10.72 1.6 .11
6w −0.5 −2.8 .004 251.60.35 1.6 .1
3w = three 10s windows; 6w = six 5 s windows. BIC = Bayesian informationcriterion; P values in bold are significant after FDR.
R. Lofredi, et al. Neurobiology of Disease 127 (2019) 462–471
467

with the effect being further amplified by the amplitude of the burst(Torrecillos et al., 2018). However, thus far the characteristics andcorrelates of beta bursts in PD have not been described during thecontinuous repetitive movements used to assess bradykinesia. One re-cent study demonstrated that although beta power was suppressedduring continuously repeated movements, this suppression progres-sively diminished over time in tandem with a progressive decrement inthe frequency and amplitude of movements (Steiner et al., 2017).
However, this study did not consider the moment-to-moment dynamicsof the beta power. We were able to confirm lower degrees of powerduring movement. Critically though, we showed that beta bursts stillarose despite the overall beta suppression during movement. Burstsoccurring during continuous movements were decreased in duration,amplitude and rate when compared to rest, despite being defined in thesame way during movement as at rest. Nevertheless, the time spent inlow beta bursts correlated with the decrease of movement velocity in
Fig. 3. Correlation between low beta bursting and decrease in peak velocity. (A) Example of the first 10 s (w1) in the first movement block (b1) from case 11 isshown. The peak velocity trace (red line, first row) is an interpolation of peaks of movement velocity (black line, first row) to give a continuous estimation. Note thatin off-line analysis, the change in peak velocity within a given 10 s time window was assessed by averaging peak velocity over the first and last second (red shadedarea) and subtracting the two values (mean peak velocity in first second – mean peak velocity in last second, here: 434–308 degrees/s.; see white lines). In the secondrow is shown the corresponding raw trace of the local field potential recording, filtered around the low beta band (13–20 Hz). The third row demonstrates thefluctuations of the low beta amplitude after wavelet transform. The burst threshold of this subject is shown as dotted grey line and bursting activity (with a minimumduration of 100 ms) is highlighted in light grey. Here, 34% of time is spent in low beta bursting, which is associated with an overall decrement across the whole 10swindow. (B) Same but now for a window with sparse bursting throughout (3%) and maintained peak velocity. Shown are the first 10 s (w1) in the third movementbloc (b3) from case 9. (C) In red are labelled the two example cases when trials from all subjects (n= 108) are sorted by the change of peak velocity over 10 s ofcontinuous movement. (D) Correlation plot showing the decrease in peak velocity over 10 s from all subjects as predicted by our statistical model on the x-axis andthe original decrease in peak velocity over 10 s on the y-axis. Change in peak velocity over 10 s could be significantly (r = 0.498, P < .0001) predicted by time spentin low beta bursts, explaining 25% of the variance in peak velocity change across patients. Shown values are normalized. (For interpretation of the references tocolour in this figure legend, the reader is referred to the web version of this article.)
Fig. 4. Correlation between change in velocity and time in burst within and across subjects. (A) Shown are all measurements of change in velocity and time spent inlow beta bursts within and across subjects as independent values. This shows a highly significant, negative correlation (R = –0.31, P= .004). (B) Shown areindividual scatter plots of the change in velocity over ~10 s (y-axis, negative values indicate a decrease in velocity over time) and the percentage time spent in lowbeta bursting over the same ~10 s (x-axis). In 10/12 cases, there was a negative correlation (fitted regression line shown in red) between change in velocity and timespent in low beta bursts that was individually significant in 2/10 cases. In case 10 there was a positive correlation and in case 2 beta bursting was detected only in 2/9assessed time windows which limits interpretability. Across patients, the regression slope between change in velocity and low beta bursting was −2.2 ± 0.96(mean ± SE). (For interpretation of the references to colour in this figure legend, the reader is referred to the web version of this article.)
R. Lofredi, et al. Neurobiology of Disease 127 (2019) 462–471
468

PD patients performing repetitive movements, and this correlation wasnot simply explained by averaged beta power or change in beta power.This is in line with prior studies highlighting the rate of cortical betabursts as a consistent predictor of behaviour in healthy animals (Shinet al., 2017; Sherman et al., 2016).
4.2. Implications for adaptive DBS
Currently, DBS paradigms continuously apply high-frequency sti-mulation, thereby suppressing subthalamic low beta activity (Oswalet al., 2016). Because the latter correlates with improvement of motorsymptoms, subthalamic beta activity has emerged as a local feedbackparameter for adaptive DBS (Little et al., 2013). Acutely triggering DBSonly when a threshold of beta activity defined at rest is crossed hasproven to be similar or even superior to continuous DBS in controlledconditions (Little et al., 2016a; Little et al., 2013; Little et al., 2016b).However, it has been unclear how adaptive stimulation delivered at athreshold defined at rest would be able to prevent bradykinesia whenaverage beta power drops below resting levels during movement(Johnson et al., 2016). Our results reveal that beta burst events, al-though diminished in probability, amplitude and duration, can stillsurpass the threshold defined at rest and the time spent in such burstingis linked to the sequence effect of bradykinesia. The situation may bedifferent during briefer movements. Here not all movements may ne-cessarily be affected by beta bursts (Torrecillos et al., 2018). It istempting to speculate that the distribution of movement velocities thatincludes normal speeds in patients with PD (Mazzoni et al., 2007) re-flects the probabilistic nature of beta bursting during voluntary move-ment.
4.3. Limitations of the study
Having discussed the significance of our findings, it is prudent toaddress the limitations of this study. First, the correlation between lowbeta bursting and the sequence effect during repetitive movements mayhave been underestimated because intracerebral recordings were per-formed in the days following DBS surgery. This period is associatedwith a reduction in subthalamic beta activity and a temporary ameli-oration of parkinsonian symptoms (Chen et al., 2006; Mann et al.,2009). Second, studies in healthy control subjects performing repetitivefinger tapping (Rodrigues et al., 2009; Ling et al., 2012) suggest thatphysiological fatigue also contributes to a progressive reduction inmovement velocity. If we assume that beta bursts are associated withpathological and not physiological slowing, then overlapping fatiguewill also tend to underestimate the contribution of beta bursts to thesequence effect. Third, we analysed the data from all studied subjects,but it should be noted that four subjects were classified as tremordominant (see Table 1). This might have led to a weakening of theassociation between low beta bursting and the sequence effect acrossthe group, although our correlative approach should have amelioratedthis problem. Fourth, our findings are correlative, and by themselves,can only suggest and not prove that beta bursts may causally contributeto the sequence effect of bradykinesia. Fifth, episodes of manualfreezing as defined as periods of zero velocity lasting one second ormore were only observed in 3 instances in 2 subjects. These were toofew to analyse, although we note that beta bursts have recently beenassociated with gait freezing (Syrkin-Nikolau et al., 2017). Finally, al-though not a confound, it is worth highlighting that the relevance ofbeta bursts and their features may not necessarily be the same duringrest and during movement. Thus there may be time-limited periods ofvulnerability during movement (Torrecillos et al., 2018) and other tasks(Khanna and Carmena, 2017) when even brief bursts are associatedwith a disturbance of function.
5. Conclusion
Here we show that subthalamic beta bursts can be detected duringcontinuous movements in the dopamine-depleted state of PD patients.Critically, we reveal a spectrally specific relationship between theprogressive decrement of movement velocity and the amount ofbursting activity in the low beta band in the STN. Although the durationof beta bursts has been considered closely linked to motor impairmentat rest, the present and other findings suggest that even briefer burstscan be deleterious when they occur during movement (Torrecillos et al.,2018; Sherman et al., 2016; Khanna and Carmena, 2017; Chen et al.,2006). These findings contribute to the understanding of the sequenceeffect in bradykinesia as a motor symptom that is specific for Parkin-son's disease. Moreover, they have a direct bearing on adaptive DBSparadigms, and explain how a stimulation trigger defined at rest canstill be effective during voluntary movement despite the coincidentsuppression of mean beta activity.
Acknowledgments
We would like to thank all patients for their participation
Financial disclosures
Lofredi R
Stock Ownership in medically-related fi-elds: NONE
Intellectual Property Rights: NONE
Consultancies: NONE Expert Testimony: NONEAdvisory Boards: NONE Employment: Charité – University
Medicine BerlinPartnerships: NONE Contracts: Charité – University Medicine
BerlinHonoraria: NONE Royalties: NONEGrants: DAAD Other: NONE
Tan H
Stock Ownership in medically-related fields: N-one.
Intellectual Property Rights:None.
Consultancies: None. Expert Testimony: None.Advisory Boards: None. Employment: University of
Oxford.Partnerships: None. Contracts: University of Oxford.Honoraria: None. Royalties: None.Grants: MRC, UK. Other: None.
Neumann WJ
Stock Ownership in medically-related fi-elds: NONE
Intellectual Property Rights: NONE
Consultancies: NONE Expert Testimony: NONEAdvisory Boards: NONE Employment: Charité – University
Medicine BerlinPartnerships: NONE Contracts: Charité – University Medicine
BerlinHonoraria: NONE Royalties: NONEGrants: DGKN Other: NONE
Yeh CH
Stock Ownership in medically-related fields: N-one.
Intellectual Property Rights:None.
Consultancies: None. Expert Testimony: None.Advisory Boards: None. Employment: University of
Oxford.
R. Lofredi, et al. Neurobiology of Disease 127 (2019) 462–471
469

Partnerships: None. Contracts:University of Oxford.Honoraria: Royalties:Grants: MOST Other:
Schneider GH
Stock Ownership in medically-related fields:NONE
Intellectual Property Rights: NONE
Consultancies: NONE Expert Testimony: NONEAdvisory Boards: NONE Employment: Charité – University
Medicine BerlinPartnerships: NONE Contracts: Charité – University
Medicine BerlinHonoraria: MEDTRONIC, ST. JUDE MEDICAL,
BOSTON SCIENTIFICRoyalties: NONE
Grants: NONE Other: NONE
Kühn AA
Stock Ownership in medically-related fields: NO-NE
Intellectual Property Rights:NONE
Consultancies: NONE Expert Testimony: NONEAdvisory Boards: BOSTON SCIENTIFIC Employment: Charité –
University Medicine BerlinPartnerships: NONE Contracts: Charité – University
Medicine BerlinHonoraria: MEDTRONIC, ST. JUDE MEDICAL,
BOSTON SCIENTIFIC, IPSENRoyalties: NONE
Grants: DFG, MEDTRONIC Other: NONE
Brown P
Stock Ownership in medically-related fields: N-ONE
Intellectual Property Rights:NONE
Consultancies: NONE Expert Testimony: NONEAdvisory Boards: BOSTON SCIENTIFIC Employment: University of
OxfordPartnerships: NONE Contracts: University of OxfordHonoraria: MEDTRONIC, BOSTON SCIENTIFIC, Royalties: NONEGrants: MEDTRONIC Other: NONE
Author roles
Roxanne Lofredi
1. Research Project: Execution,2. Statistical Analysis: Design, Execution,3. Manuscript Preparation: Writing of the first draft.
Huiling Tan
1. Statistical Analysis: Design,2. Manuscript Preparation: Review and Critique.
Wolf-Julian Neumann
1. Research Project: Execution,2. Statistical Analysis: Design,3. Manuscript Preparation: Review and Critique.
Chien-Hung Yeh
1. Statistical Analysis: Design,2. Manuscript Preparation: Review and Critique.
Gerd-Helge Schneider
1. Research Project: Organization, Execution,2. Manuscript Preparation: Review and Critique.
Andrea A. Kühn
1. Research Project: Conception, Organization, Execution,2. Statistical Analysis: Review and Critique,3. Manuscript Preparation: Review and Critique.
Peter Brown
1. Research Project: Conception, Organization, Execution,2. Statistical Analysis: Review and Critique,3. Manuscript Preparation: Review and Critique.
Financial Disclosure/Conflict of Interest concerning the researchrelated to the manuscript
None.
Funding sources for study
This study was supported by a postdoc fellowship of the GermanAcademic Exchange Service (DAAD), Postdoctoral Research AbroadProgram by Taiwan Ministry of Science and Technology 106-2917-I-564-027 (CHY), the German Research Foundation (DFG) grant KFO247(AAK), the Rosetrees Trust (PB) and the Medical Research Council(MRC) grants MR/P012272/1 (HT) and MC_UU_12024/1 (PB).
The following are the supplementary data related to this article.
References
Androulidakis, A.G., et al., 2008. Amplitude modulation of oscillatory activity in thesubthalamic nucleus during movement. Eur. J. Neurosci. 27, 1277–1284.
Baker, S.N., Olivier, E., Lemon, R.N., 1997. Coherent oscillations in monkey motor cortexand hand muscle EMG show task-dependent modulation. J. Physiol. 501, 225–241.
Benjamini, Y., Hochberg, Y., 1995. Controlling the false discovery rate: a practical andpowerful approach to multiple testing. J. R. Stat. Soc. Ser. B 57, 289–300.
Bichsel, O., et al., 2018. Functionally separated networks for self-paced and externally-cued motor execution in Parkinson's disease: evidence from deep brain recordings inhumans. Neuroimage 177, 20–29.
Caire, F., Ranoux, D., Guehl, D., Burbaud, P., Cuny, E., 2013. A systematic review ofstudies on anatomical position of electrode contacts used for chronic subthalamicstimulation in Parkinson's disease. Acta Neurochir. 155, 1647–1654 discussion 1654.
Cassim, F., et al., 2000. Brief and sustained movements: differences in event-related (de)synchronization (ERD/ERS) patterns. Clin. Neurophysiol. 111, 2032–2039.
Chen, C.C., et al., 2006. Intra-operative recordings of local field potentials can help lo-calize the subthalamic nucleus in Parkinson's disease surgery. Exp. Neurol. 198,214–221.
Deffains, M., et al., 2016. Subthalamic, not striatal, activity correlates with basal gangliadownstream activity in normal and parkinsonian monkeys. Elife 5, 1–38.
Deffains, M., Iskhakova, L., Katabi, S., Israel, Z., Bergman, H., 2018 Aug 25. Longer βoscillatory episodes reliably identify pathological subthalamic activity in parkin-sonism. Mov. Disord. https://doi.org/10.1002/mds.27418.
Deuschl, G., et al., 2006. A randomized trial of deep-brain stimulation for Parkinson'sdisease. N. Engl. J. Med. 355, 896–908.
Engel, A.K., Fries, P., 2010. Beta-band oscillations–signalling the status quo? Curr. Opin.Neurobiol. 20, 156–165.
Erbil, N., Ungan, P., 2007. Changes in the alpha and beta amplitudes of the central EEGduring the onset, continuation, and offset of long-duration repetitive hand move-ments. Brain Res. 1169, 44–56.
Eusebio, A., et al., 2011. Deep brain stimulation can suppress pathological synchronisa-tion in parkinsonian patients. J. Neurol. Neurosurg. Psychiatry 82, 569–573.
Feingold, J., Gibson, D.J., DePasquale, B., Graybiel, A.M., 2015. Bursts of beta oscillationdifferentiate postperformance activity in the striatum and motor cortex of monkeysperforming movement tasks. Proc. Natl. Acad. Sci. U. S. A. 112, 13687–13692.
Fischer, P., et al., 2018. Alternating modulation of subthalamic nucleus beta oscillationsduring stepping. J. Neurosci. https://doi.org/10.1523/JNEUROSCI.3596-17.2018.
Gilbertson, T., 2005. Existing motor state is favored at the expense of new movementduring 13-35 Hz oscillatory synchrony in the human corticospinal system. J.Neurosci. 25, 7771–7779.
Horn, A., Kühn, A.A., 2015. NeuroImage Lead-DBS: a toolbox for deep brain stimulationelectrode localizations and visualizations. Neuroimage 107, 127–135.
Horn, A., Neumann, W.-J., Degen, K., Schneider, G.-H., Kühn, A.A., 2017. Toward anelectrophysiological ‘sweet spot’ for deep brain stimulation in the subthalamic nu-cleus. Hum. Brain Mapp. https://doi.org/10.1002/hbm.23594.
R. Lofredi, et al. Neurobiology of Disease 127 (2019) 462–471
470

Horn, A., et al., 2018. Lead-DBS v2: towards a comprehensive pipeline for deep brainstimulation imaging. Neuroimage. https://doi.org/10.1016/j.neuroimage.2018.08.068.
Johnson, L.A., et al., 2016. Closed-loop deep brain stimulation effects on parkinsonianmotor symptoms in a non-human primate – is beta enough? Brain Stimul. 9, 892–896.
Joundi, R.A., et al., 2013. Persistent suppression of subthalamic beta-band activity duringrhythmic finger tapping in Parkinson's disease. Clin. Neurophysiol. 124, 565–573.
Khanna, P., Carmena, J.M., 2017. Beta band oscillations in motor cortex reflect neuralpopulation signals that delay movement onset. Elife 6, 1–31.
Kühn, A.A., et al., 2005. The relationship between local field potential and neuronaldischarge in the subthalamic nucleus of patients with Parkinson's disease. Exp.Neurol. 194, 212–220.
Kühn, A.A., Kupsch, A., Schneider, G.-H., Brown, P., 2006. Reduction in subthalamic 8-35Hz oscillatory activity correlates with clinical improvement in Parkinson's disease.Eur. J. Neurosci. 23, 1956–1960.
Kühn, A.A., et al., 2008. High-frequency stimulation of the subthalamic nucleus sup-presses oscillatory β activity in patients with Parkinson’s disease in parallel withimprovement in motor performance. J. Neurosci. 28, 6165–6173.
Kühn, A.A., et al., 2009. Pathological synchronisation in the subthalamic nucleus of pa-tients with Parkinson's disease relates to both bradykinesia and rigidity. Exp. Neurol.215, 380–387.
Leventhal, D.K., et al., 2012. Basal ganglia beta oscillations accompany Cue utilization.Neuron 73, 523–536.
Ling, H., Massey, L.A., Lees, A.J., Brown, P., Day, B.L., 2012. Hypokinesia without de-crement distinguishes progressive supranuclear palsy from Parkinson's disease. Brain135, 1141–1153.
Lipski, W.J., et al., 2017. Dynamics of human subthalamic neuron phase-locking to motorand sensory cortical oscillations during movement. J. Neurophysiol. 118, 1472–1487.
Little, S., et al., 2013. Adaptive deep brain stimulation in advanced Parkinson disease.Ann. Neurol. 74, 449–457.
Little, S., et al., 2016a. Bilateral adaptive deep brain stimulation is effective in Parkinson'sdisease. J. Neurol. Neurosurg. Psychiatry 87, 717–721.
Little, S., et al., 2016b. Adaptive deep brain stimulation for Parkinson’s disease demon-strates reduced speech side effects compared to conventional stimulation in the acutesetting. J. Neurol. Neurosurg. Psychiatry. https://doi.org/10.1136/jnnp-2016-313518.
Litvak, V., et al., 2011a. EEG and MEG data analysis in SPM8. Comput. Intell. Neurosci.2011, 852961.
Litvak, V., et al., 2011b. Resting oscillatory cortico-subthalamic connectivity in patientswith Parkinson's disease. Brain 134, 359.
Lofredi, R., et al., 2018a. Pallidal beta bursts in Parkinson’s disease and dystonia. Mov.Disord. 1–5. https://doi.org/10.1002/mds.27524.
Lofredi, R., et al., 2018b. Dopamine-dependent scaling of subthalamic gamma bursts withmovement velocity in patients with Parkinson's disease. Elife 7. https://doi.org/10.7554/eLife.31895.
Mann, J.M., et al., 2009. Brain penetration effects of microelectrodes and DBS leads inSTN or GPi. J. Neurol. Neurosurg. Psychiatry 80, 794–797.
Mazzoni, P., Hristova, A., Krakauer, J.W., 2007. Why don't we move faster? Parkinson's
disease, movement vigor, and implicit motivation. J. Neurosci. 27, 7105–7116.Murthy, V.N., Fetz, E.E., 1996. Synchronization of neurons during local field potential
oscillations in sensorimotor cortex of awake monkeys. J. Neurophysiol. 76,3968–3982.
Muthukumaraswamy, S.D., 2010. Functional properties of human primary motor cortexgamma oscillations. J. Neurophysiol. 104, 2873–2885.
Neumann, W.J., et al., 2015. Cortico-pallidal oscillatory connectivity in patients withdystonia. Brain 1894–1906. https://doi.org/10.1093/brain/awv109.
Neumann, W.-J., et al., 2016. Subthalamic synchronized oscillatory activity correlateswith motor impairment in patients with Parkinson's disease. Mov. Disord. 31,1748–1751. https://doi.org/10.1002/mds.26759.
Neumann, W.-J., et al., 2017. A localized pallidal physiomarker in cervical dystonia. Ann.Neurol. 82, 912–924. https://doi.org/10.1002/ana.25095.
Oostenveld, R., Fries, P., Maris, E., Schoffelen, J.-M., 2011. FieldTrip: open source soft-ware for advanced analysis of MEG, EEG, and invasive electrophysiological data.Intell. Neurosci. 2011, 1:1–1:9.
Oswal, A., et al., 2016. Deep brain stimulation modulates synchrony within spatially andspectrally distinct resting state networks in Parkinson’s disease. Brain 1482–1496.https://doi.org/10.1093/brain/aww048.
Pina-Fuentes, D., et al., 2017. Adaptive DBS in a Parkinson's patient with chronicallyimplanted DBS: a proof of principle. Mov. Dis. 32, 1253–1254.
Rocco, A. et al. Analysis of repetitive and nonrepetitive sequential arm movements inpatients with Parkinson's disease. Mov. Disord. 9, 311–314.
Rodrigues, J.P., Mastaglia, F.L., Thickbroom, G.W., 2009. Rapid slowing of maximalfinger movement rate: fatigue of central motor control? Exp. Brain Res. 196,557–563.
Schuepbach, W.M.M., et al., 2013. Neurostimulation for Parkinson's disease with earlymotor complications. N. Engl. J. Med. 368, 610–622.
Sherman, M.A., et al., 2016. Neural mechanisms of transient neocortical beta rhythms:converging evidence from humans, computational modeling, monkeys, and mice.Proc. Natl. Acad. Sci. U. S. A. 113, E4885–E4894.
Shin, H., Law, R., Tsutsui, S., Moore, C.I., Jones, S.R., 2017. The rate of transient betafrequency events predicts behavior across tasks and species. Elife 6, 1–31.
Steiner, L.A., et al., 2017. Subthalamic beta dynamics mirror parkinsonian bradykinesiamonths after neurostimulator implantation. Mov. Disord. 32, 1183–1190.
Syrkin-Nikolau, et al., 2017. Neurobiol. Dis. https://doi.org/10.1016/j.nbd.2017.09.002.Tinkhauser, G., et al., 2017a. The modulatory effect of adaptive deep brain stimulation on
beta bursts in Parkinson's disease. Brain 140, 1053–1067.Tinkhauser, G., et al., 2017b. Beta burst dynamics in Parkinson's disease OFF and ON
dopaminergic medication. Brain 140, 2968–2981.Tinkhauser, G., et al., 2018. Beta burst coupling across the motor circuit in Parkinson's
disease. Neurobiol. Dis. 117, 217–225.Torrecillos, F., et al., 2018. Modulation of Beta bursts in the subthalamic nucleus predicts
motor performance. J. Neurosci. 38, 8905–8917.van Albada, S.J., Robinson, P.A., 2007. Transformation of arbitrary distributions to the
normal distribution with application to EEG test-retest reliability. J. Neurosci.Methods 161, 205–211.
R. Lofredi, et al. Neurobiology of Disease 127 (2019) 462–471
471