Embed Size (px)
Citation preview

University of Pennsylvania University of Pennsylvania
ScholarlyCommons ScholarlyCommons
Operations, Information and Decisions Papers Wharton Faculty Research
6-12-2008
Neural Antecedents of the Endowment Effect Neural Antecedents of the Endowment Effect
Brian Knutson
G Elliott Wimmer
Scott Rick University of Pennsylvania
Nick G. Hollon
Drazen Prelec
See next page for additional authors
Follow this and additional works at: https://repository.upenn.edu/oid_papers
Part of the Other Cell and Developmental Biology Commons, Other Life Sciences Commons, and the
Other Social and Behavioral Sciences Commons
Recommended Citation Recommended Citation Knutson, B., Wimmer, G. E., Rick, S., Hollon, N. G., Prelec, D., & Loewenstein, G. (2008). Neural Antecedents of the Endowment Effect. Cell Press, 58 (5), 814-822. http://dx.doi.org/10.1016/j.neuron.2008.05.018
This paper is posted at ScholarlyCommons. https://repository.upenn.edu/oid_papers/27 For more information, please contact [email protected].

Neural Antecedents of the Endowment Effect Neural Antecedents of the Endowment Effect
Abstract Abstract The “endowment effect” refers to the tendency to place greater value on items that one owns—an anomaly that violates the reference-independence assumption of rational choice theories. We investigated neural antecedents of the endowment effect in an event-related functional magnetic resonance imaging (fMRI) study. During scanning, 24 subjects considered six products paired with 18 different prices under buying, choosing, or selling conditions. Subjects showed greater nucleus accumbens (NAcc) activation for preferred products across buy and sell conditions combined, but greater mesial prefrontal cortex (MPFC) activation in response to low prices when buying versus selling. During selling, right insular activation for preferred products predicted individual differences in susceptibility to the endowment effect. These findings are consistent with a reference-dependent account in which ownership increases value by enhancing the salience of the possible loss of preferred products.
Author Keywords Author Keywords
Keywords Keywords SYSBIO, SYSNEURO
Disciplines Disciplines Other Cell and Developmental Biology | Other Life Sciences | Other Social and Behavioral Sciences
Author(s) Author(s) Brian Knutson, G Elliott Wimmer, Scott Rick, Nick G. Hollon, Drazen Prelec, and George Loewenstein
This journal article is available at ScholarlyCommons: https://repository.upenn.edu/oid_papers/27

Neural antecedents of the endowment effect Supplementary Material
Neuron, Volume 58
Brian Knutson1, G. Elliott Wimmer1, Scott Rick2, Nick G. Hollon1, Drazen Prelec3, George Loewenstein4
1Psychology and Neuroscience, Stanford University
2The Wharton School, University of Pennsylvania 3Sloan School of Management, Massachusetts Institute of Technology
4Social and Decision Sciences, Carnegie Mellon University
*Contact: Brian Knutson Bldg. 420, Jordan Hall Stanford CA 94305 USA 650 724 2965 [email protected]

S1. Task instructions
S2. Post-scan endowment effect estimates by product preference
S3. Regressors of interest for sell versus buy model
S4. Trial period and interaction regressors
S5. Reaction time and conflict regressors
S6. Regressors of interest for sell versus choose model
S7. NAcc and right insula timecourse plots by price percent
S8. Individual difference plots

Supplement 1: Task instructions In this experiment, you will be given the opportunity to sell some products that you have already been given, to buy some products you do not currently own, and to choose between receiving other products or receiving money. You will be prompted to make your decision as shown below: to sell the product for the offered price (Yes) or not to sell the product for the offered price (No). Sometimes “Yes” will appear in the box on the left, and sometimes “Yes” will appear in the box on the right. You will always be able to select whatever option appears in the left box by pressing the leftmost button, and you can select whatever option appears in the right by pressing the rightmost button. Once the Yes/No options appear on screen, you have 4 seconds to make your choice. If you do not respond on a given trial and if that trial is randomly selected to count, your choice for that trial will be determined by a coin toss. Instructions for Selling: Suppose that one of the two products you had received at the beginning of the study was the Stanford Mug shown below. In this example, you would decide whether or not to sell the Stanford Mug for $2.50. SELL? <Picture: Stanford Mug> Stanford Mug $2.50 Press the Space Bar to continue Instructions for Buying: In the example below, you would decide whether or not to buy the Stanford T-shirt for $5.00. BUY? <Picture: Stanford T-shirt > Stanford T-shirt $5.00 Press the Space Bar to continue
You will also make several choices between receiving a product and receiving an amount of money. For these decisions, you will be presented with a product and an amount of money.

Sometimes you will be asked if you want to choose the product. Choose “Yes” if you want the product instead of the money. Choose “No” if you want the money instead of the product. Other times you will be asked if you want to choose the money. Choose “Yes” if you want the money instead of the product. Choose “No” if you want the product instead of the money. Instructions for Choosing In the example below, you would choose “Yes” if you want the Godiva chocolate instead of $4.00. You would choose “No” if you want $4.00 instead of the Godiva Chocolate. Choose Product? <Picture: Chocolates> Godiva Chocolate $4.00 Press the Space Bar to continue Instructions for Choosing, Continued In the example below, you would choose “Yes” if you want $4.00 instead of the Godiva chocolate. You would choose “No” if you want the Godiva Chocolate instead of $4.00. Choose Money? <Picture: Chocolates> Godiva Chocolate $4.00 Press the Space Bar to continue Please note that although you will make several decisions, only some of your choices will determine what you leave the experiment with today. One choice involving each product will count for real. You will draw marbles out of a jar the end of the experiment to see what choice counts for each product. Because you will be making decisions about six different products in this experiment, that means that six of the decisions that you make will be chosen to count for real -- one decision for each product.
For decisions that involve selling the products you have been given, one decision for each of the two products will count. For the decisions that count, we will look up whether you chose to sell or not. If you chose to sell, we will ask you to give up the product and will pay you the amount you agreed to sell the product for. If you chose not to sell, then you will keep the product.

For decisions that involve buying products, one decision for each of the two products will count. For the decisions that count, we will look up whether you chose to buy or not. If you chose to buy, we will give you the product and ask you to pay the amount you agreed to buy the product for. If you chose not to buy, then you will not receive the product or give up any money. For decisions that involve choosing whether to take a product or take money, one decision for each of the two products will count. For the decisions that count, we will look up whether you chose to take the product or take the money. If you chose to take the product, then we will give you the product. If you chose to take the money, then we will give you the money. For participating in this experiment, you have already received two products. These are yours to keep, although you will be given the opportunity to sell them back to the experimenter. Press the Space Bar to see the two products.
For practice, imagine that you now own this product: <Stanford Mug> Let us know if you have any questions. Press the space bar to begin the practice session. === Subjects were then presented with six products (listed below) and endowed with two: Product Retail Price Digital Camera $93.49 Flash Drive $55.95 iPod Shuffle $79.00 iPod Alarm Clock Base $89.99 Noise Cancelling Headphones $35.99 Wireless Mighty Mouse $69.00

Supplement 2: Post-scan endowment effect estimates by product preference (mean ± SEM)

Supplement 3: Regressors of interest for sell versus buy model Table S3.1. Regressors of interest and interaction foci (VOIs italicized, p<.01 corrected for 3 regions; whole brain, p<.001 uncorrected; cluster=3 voxels).
Product preference (product + price)* Peak Z R A S R Anterior Insula 3.72 26 26 1R Nucleus Accumbens 3.70 8 8 -2
L Nucleus Accumbens 3.87 -11 5 -3
L Middle Occipital Gyrus 4.34 -8 -101 12 Product preference X condition (product + price) Peak Z R A S None Price percent (price) Peak Z R A S R Middle Frontal Gyrus -3.55 34 26 46L Middle Frontal Gyrus -3.89 -38 19 46R Inferior Frontal Gyrus -4.24 45 15 23L Inferior Frontal Gyrus -3.77 -53 15 19R Superior Temporal Gyrus -3.78 60 -19 8
Price percent X condition (price)* Peak Z R A S L Mesial Prefrontal Cortex 4.17 -4 50 2
R Mesial Prefrontal Cortex 4.21 5 43 -4
L Anterior Cingulate 4.51 -8 38 1R Orbitofrontal Cortex 3.64 26 30 -14L Anterior Cingulate 3.95 -8 26 27L Dorsal Caudate 4.10 -11 15 16L Ventral Pallidum 4.39 -15 0 -7L Precentral Gyrus -3.73 -53 -4 12R Precentral Gyrus -3.66 34 -11 49Medial Dorsal Thalamus 4.15 0 -15 8Midbrain (i.e., VTA / SN) 3.98 0 -26 -14L Posterior Cingulate 4.09 -8 -49 19R Superior Temporal Gyrus -3.88 56 -49 19L Lingual Gyrus 3.85 -23 -79 1 Product choice (choice) Peak Z R A S R Parahippocampal Gyrus 3.52 30 -23 -18 Product choice X condition (choice) Peak Z R A S R Dorsolateral Prefrontal Cortex -3.86 30 53 4R Caudate -3.83 11 15 4L Lingual Gyrus -4.00 -26 -83 -3

R Middle Occipital Gyrus -3.84 41 -83 1L Middle Occipital Gyrus -3.80 -38 -83 1

Supplement 4: Trial period and interaction regressors Activation correlated with task variables might be due to a nonparametric increase or decrease in neural activation due to trial period rather than the variables of interest. Thus, trial period regressors were included in the model along with parametric variables (i.e., preference, percent retail price) in order to covary out potential trial period confounds. In the standard regression model over all conditions, three unit-weighted regressors were included that assigned a 1 to product, price, and choice trial periods and 0 to all other time points. These regressors were also multiplied to represent the contrast of Sell (+1) versus Buy (-1) conditions at each period. As with regressors of interest, all regressors were convolved with gamma variate functions prior to inclusion in the model. For the product period, anterior insula, anterior cingulate, thalamus, and visual cortex showed relatively greater activation (Figure S4.1). For the price period, similar areas showed increased activation, as well as dorsolateral prefrontal cortex, with slight deactivation of the mesial prefrontal cortex (Figure S4.2). For the choice period, dorsolateral prefrontal cortex and motor regions including putamen, thalamus, and motor cortex showed increased activation (Figure S4.3). Additionally, during the price period only, average activation in the MPFC varied as a function of Sell vs. Buy condition (Table S4.1).

Table S4.1. Period regressor activation foci (whole brain, p<.0001 uncorrected; cluster=3 voxels).
Product Period Peak Z R A S L Medial Frontal Gyrus -4.36 -4 49 16 L Subgenual Cingulate -4.35 -4 30 1 R Anterior Insula 4.64 30 23 -3 L Anterior Insula 4.48 -30 23 8 L Anterior Cingulate 4.32 -8 19 31 R Medial Frontal Gyrus 5.46 2 11 46 L Medial Frontal Gyrus 5.34 -2 11 45 R Middle Frontal Gyrus 5.32 38 8 31 L Precentral Gyrus 5.36 -38 0 38 R Middle Frontal Gyrus 4.98 30 0 49 L Middle Frontal Gyrus 4.45 -26 -4 49 R Cingulate 5.14 4 -23 27 L Pulvinar 6.49 -19 -26 1 R Pulvinar 6.23 19 -26 1 R Caudate Tail -4.24 15 -30 19 R Caudate Tail -4.74 19 -34 16 R Caudate Tail -4.40 30 -38 8 L Caudate Tail -4.70 -19 -38 16 L Caudate Tail -4.89 -26 -41 8 L Precuneus -5.02 -4 -49 31 L Inferior Parietal Lobe -5.12 -41 -71 31 Product Period X Condition Peak Z R A S None Price Period Peak Z R A S L Mesial Prefrontal Cortex -4.34 -8 56 -7 L Superior Frontal Gyrus 4.43 -38 53 16 L Medial Frontal Gyrus -4.30 -15 49 16 R Middle Frontal Gyrus 5.20 41 26 27 L Anterior Cingulate 4.43 -11 26 27 L Subgenual Cingulate -3.99 -8 26 -3 R Anterior Insula 6.75 30 23 -3 R Medial Frontal Gyrus 6.65 4 15 46 L Medial Frontal Gyrus 6.53 -3 15 46 L Anterior Insula 5.80 -41 15 1 R Middle Frontal Gyrus 4.91 34 11 27 L Inferior Frontal Gyrus 6.17 -41 8 27 R Superior Frontal Gyrus 4.79 26 8 49 R Insula -4.60 30 8 16 R Caudate -5.11 15 0 23 R Caudate 4.36 11 0 8 R Middle Temporal Gyrus -4.63 49 -4 -11 L Caudate -4.49 -23 -4 27 L Middle Temporal Gyrus -4.72 -60 -4 -14 L Middle Frontal Gyrus 4.78 -23 -8 46 L Globus Pallidus -4.52 -23 -8 -3 L Amygdala -4.51 -23 -8 -11 R Thalamus 4.48 11 -8 4 R Cingulate -4.06 8 -8 38 L Posterior Insula -4.45 -45 -11 12 L Posterior Insula -5.17 -38 -15 16 L Thalamus 5.09 -8 -15 12 R Posterior Insula -5.08 34 -15 1 R Thalamus 4.98 8 -15 16 L Parahippocampal Gyrus -4.73 -19 -15 -14 R Parahippocampal Gyrus -4.54 15 -15 -14

L Cingulate -4.21 -11 -15 38 R Postcentral Gyrus -5.98 56 -19 23 L Middle Temporal Gyrus -4.15 -56 -19 -7 R Caudate -4.13 19 -19 23 Cingulate 5.64 0 -23 27 L Cingulate -4.06 -11 -23 38 R Pulvinar 6.74 19 -26 4 R Pulvinar 5.21 8 -26 1 L Pulvinar 5.59 -4 -26 1 L Pulvinar 7.55 -19 -30 1 L Posterior Insula -6.20 -38 -34 19 Price Period X Condition Peak Z R A S L Middle Frontal Gyrus -4.49 -23 60 8 L Mesial Prefrontal Cortex -4.21 -4 53 1 Posterior Cingulate -4.54 0 -26 31 L Posterior Cingulate -5.12 -8 -53 16 Choice Period Peak Z R A S R Superior Frontal Gyrus 4.89 30 60 -3 R Superior Frontal Gyrus 5.38 34 53 -11 L Putamen 5.64 -26 8 1 L Middle Frontal Gyrus 4.56 -45 8 42 R Putamen 5.54 23 4 12 R Cingulate 4.99 4 -15 27 L Thalamus 4.61 -11 -15 8 R Pulvinar 6.35 23 -26 8 L Pulvinar 6.19 -19 -26 4 L Superior Parietal Lobe 4.66 -26 -53 46 R Superior Parietal Lobe 5.91 23 -56 49 L Superior Parietal Lobe 4.94 -19 -64 38 R Inferior Parietal Lobe -5.00 49 -68 34 Choice Period X Condition Peak Z R A S None

Figure S4.1. Product period maps (p<.001, uncorrected)
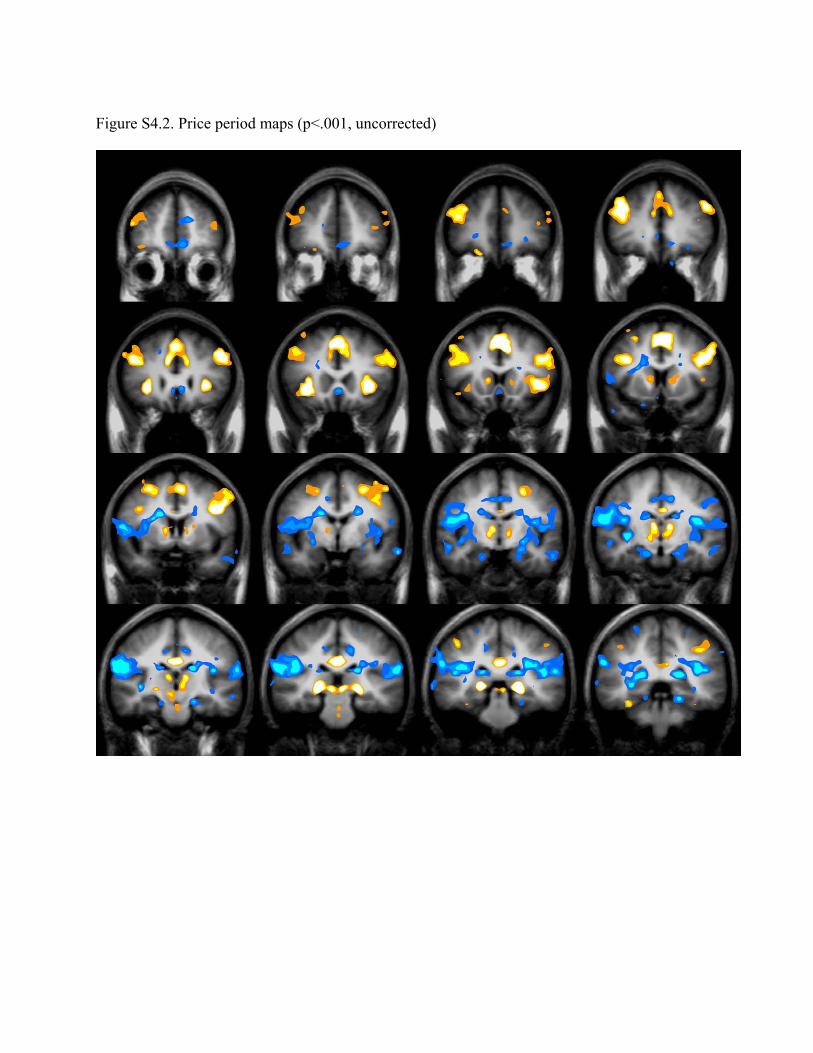
Figure S4.2. Price period maps (p<.001, uncorrected)
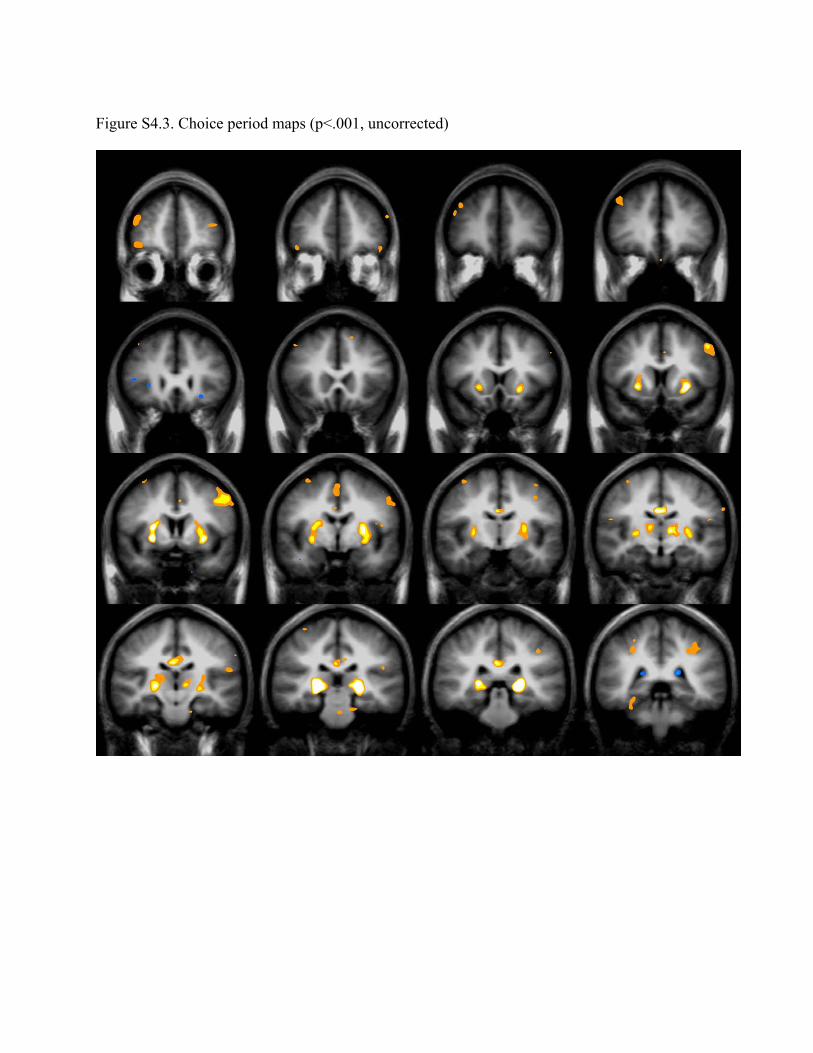
Figure S4.3. Choice period maps (p<.001, uncorrected)

Supplement 5. Reaction time and conflict regressors Activation correlated with task variables during the choice period might be due to differences in response conflict or motor demand. Although reaction times did not differ between buy and sell trials, they were significantly longer for choose trials (consistent with choice options being labeled as product/price in the choose condition rather than yes/no in the buy and sell conditions). Thus, a reaction time regressor was included in the model during the choice period to covary out potential motor confounds. Reaction time was log-transformed and entered into the standard regression as a delta regressor during the choice period across all conditions. In an additional model, a conflict regressor was included during the price period to model response conflict. The conflict regressor was computed as the reciprocal of the absolute difference from the indifference point in units of price percent and entered into the standard regression as a convolved delta regressor during the price period across all conditions. Both regressors were also multiplied to contrast Sell (+1) versus Buy (-1) conditions at corresponding periods. As with regressors of interest, both regressors were convolved with gamma variate functions prior to inclusion in the model. Response conflict correlated with activation in the anterior cingulate (Figure S5.1), replicating prior reports of an association between anterior cingulate activation and response conflict (Botvinick et al., 1999). This association did not differ as a function of condition. Reaction time robustly correlated with anterior cingulate, medial frontal gyrus, and anterior insula activation, and negatively with bilateral amygdala activation (Figure S5.2). These patterns did not differ as a function of condition.
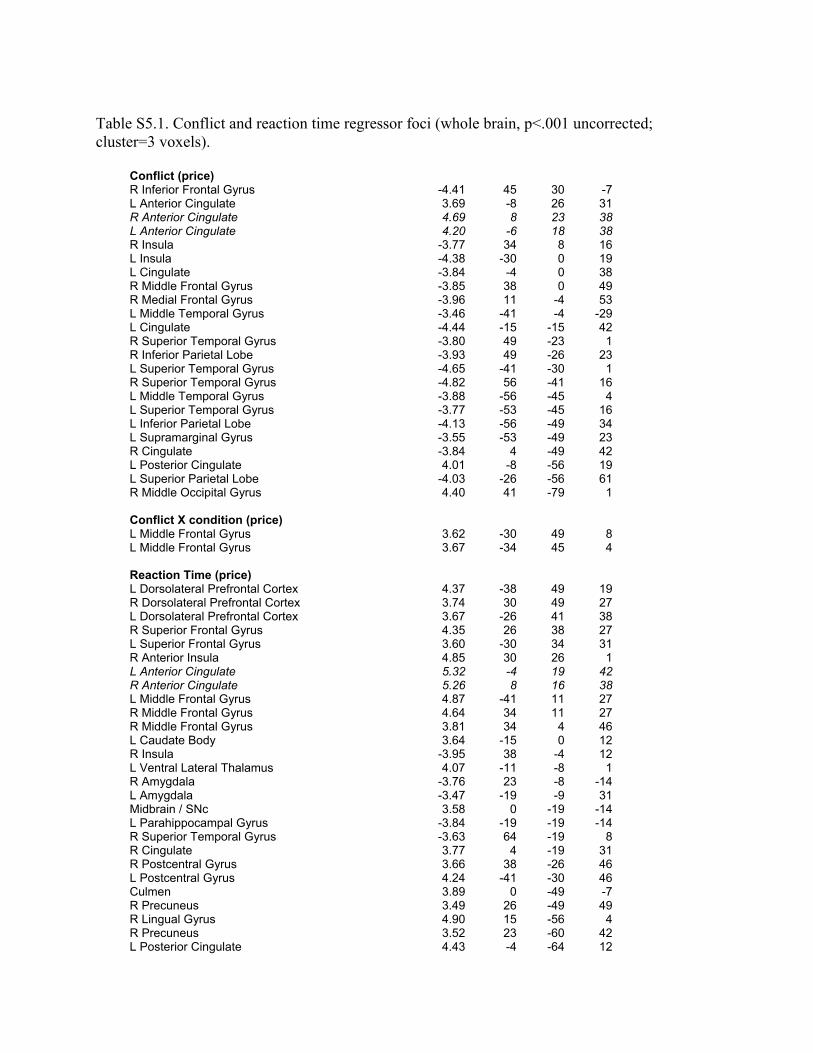
Table S5.1. Conflict and reaction time regressor foci (whole brain, p<.001 uncorrected; cluster=3 voxels).
Conflict (price) R Inferior Frontal Gyrus -4.41 45 30 -7 L Anterior Cingulate 3.69 -8 26 31 R Anterior Cingulate 4.69 8 23 38 L Anterior Cingulate 4.20 -6 18 38 R Insula -3.77 34 8 16 L Insula -4.38 -30 0 19 L Cingulate -3.84 -4 0 38 R Middle Frontal Gyrus -3.85 38 0 49 R Medial Frontal Gyrus -3.96 11 -4 53 L Middle Temporal Gyrus -3.46 -41 -4 -29 L Cingulate -4.44 -15 -15 42 R Superior Temporal Gyrus -3.80 49 -23 1 R Inferior Parietal Lobe -3.93 49 -26 23 L Superior Temporal Gyrus -4.65 -41 -30 1 R Superior Temporal Gyrus -4.82 56 -41 16 L Middle Temporal Gyrus -3.88 -56 -45 4 L Superior Temporal Gyrus -3.77 -53 -45 16 L Inferior Parietal Lobe -4.13 -56 -49 34 L Supramarginal Gyrus -3.55 -53 -49 23 R Cingulate -3.84 4 -49 42 L Posterior Cingulate 4.01 -8 -56 19 L Superior Parietal Lobe -4.03 -26 -56 61 R Middle Occipital Gyrus 4.40 41 -79 1
Conflict X condition (price) L Middle Frontal Gyrus 3.62 -30 49 8 L Middle Frontal Gyrus 3.67 -34 45 4 Reaction Time (price) L Dorsolateral Prefrontal Cortex 4.37 -38 49 19 R Dorsolateral Prefrontal Cortex 3.74 30 49 27 L Dorsolateral Prefrontal Cortex 3.67 -26 41 38 R Superior Frontal Gyrus 4.35 26 38 27 L Superior Frontal Gyrus 3.60 -30 34 31 R Anterior Insula 4.85 30 26 1 L Anterior Cingulate 5.32 -4 19 42 R Anterior Cingulate 5.26 8 16 38 L Middle Frontal Gyrus 4.87 -41 11 27 R Middle Frontal Gyrus 4.64 34 11 27 R Middle Frontal Gyrus 3.81 34 4 46 L Caudate Body 3.64 -15 0 12 R Insula -3.95 38 -4 12 L Ventral Lateral Thalamus 4.07 -11 -8 1 R Amygdala -3.76 23 -8 -14 L Amygdala -3.47 -19 -9 31 Midbrain / SNc 3.58 0 -19 -14 L Parahippocampal Gyrus -3.84 -19 -19 -14 R Superior Temporal Gyrus -3.63 64 -19 8 R Cingulate 3.77 4 -19 31 R Postcentral Gyrus 3.66 38 -26 46 L Postcentral Gyrus 4.24 -41 -30 46 Culmen 3.89 0 -49 -7 R Precuneus 3.49 26 -49 49 R Lingual Gyrus 4.90 15 -56 4 R Precuneus 3.52 23 -60 42 L Posterior Cingulate 4.43 -4 -64 12

L Superior parietal lobe 4.56 -23 -64 46 R Cuneus 3.90 26 -71 31 L Lingual Gyrus 4.37 -19 -83 1 R Lingual Gyrus 4.92 23 -83 1 L Middle Occipital Gyrus 4.18 -26 -83 19 L Cuneus 4.00 -26 -83 31 L Cuneus 3.58 -15 -94 8 Reaction Time X condition (price) None

Figure S5.1. Conflict regressor during the price period (p<.001, uncorrected)

Figure S5.2. Reaction time regressor during the choice period (p<.001, uncorrected)

Supplement 6: Regressors of interest for sell versus choose model Table S6.1. Regressors of interest and interaction foci (VOIs italicized, p<.01 corrected for 3 regions; whole brain, p<.001 uncorrected; cluster=3 voxels).
Product preference (product + price)* Peak Z R A S R Superior Frontal Gyrus 3.97 30 45 15 L Nucleus Accumbens 3.27 -12 16 -3 R Nucleus Accumbens 3.58 7 12 0 R Superior Temporal Gyrus -3.94 52 -52 15 R Middle Temporal Gyrus -4.13 41 -71 23 R Superior Temporal Gyrus -3.94 52 -52 15 Product preference X condition (product + price) Peak Z R A S None Price percent (price) Peak Z R A S R Middle Frontal Gyrus -3.51 33 26 38 L Middle Frontal Gyrus -3.83 -37 18 45 R Inferior Frontal Gyrus -4.20 45 15 23 L Inferior Frontal Gyrus -3.72 -52 15 19 R Superior Temporal Gyrus -3.95 60 -18 8 R Middle Occipital Gyrus -3.58 30 -60 4 Price percent X condition (price)* Peak Z R A S R Mesial Prefrontal Cortex 3.45 1 52 1 L Cingulate Gyrus 3.96 -7 33 30 L Anterior Cingulate 4.10 0 33 4 L Caudate 3.80 -7 15 1 L Lingual Gyrus 4.56 -22 -71 1 L Fusiform Gyrus 4.37 -33 -63 -3 L Cuneus 3.80 -15 -90 19 Product choice (choice) Peak Z R A S L Posterior Cingulate 3.57 -15 37 24 Product choice X condition (choice) Peak Z R A S None

Supplement 7: NAcc and right insula timecourse plots by price percent Figure S7.1. NAcc activation timecourses plotted by condition and price percent.
Figure S7.2. Right insula activation timecourses plotted by condition and price percent.

Supplement 8: Individual difference plots Figure S8.1. Correlations of right insula activation (mean ± SEM) with individual differences in susceptibility to the endowment effect (scanned estimate) by condition (Sell vs. Buy) and product preference (High vs. Low; n=20).
Figure S8.2. Correlations of right insula activation (mean ± SEM) with individual differences in susceptibility to the endowment effect (post-scan estimate) by condition (Sell vs. Buy) and product preference (High vs. Low; n=20).