Embed Size (px)
Citation preview
Networks of Protein Interactions
Construction of Networks from Diverse Data Sources
Neda Nategh
CS 374
Lecture 16
November 7, 2006
What we have learned about interaction networks in CS374
• Properties of interaction networks (Susan)• Comparison of networks across species (Chuan Sheng) Network alignment• Construction of networks from diverse data sources (Neda) Network integration
Biological aspects
Basics of protein Interaction Networks
Types of interactions
• Physical interactions
Protein pairs are in direct contact
• Complex interaction
Protein pairs participate in the same functional module Metabolic pathway Signaling network Multiprotein complex
Eukaryote-like glycosylation system of Campylobacter jejuni
Cell division machinery of Caulobacter crescentus

Protein Complex
A protein complex is a group of two or more associated
proteins.
Networks of proteins
• Topological properties
• Functional organization
news.uns.purdue.edu/UNS/images/cramer.photo2.jpeg
Metabolic Pathway
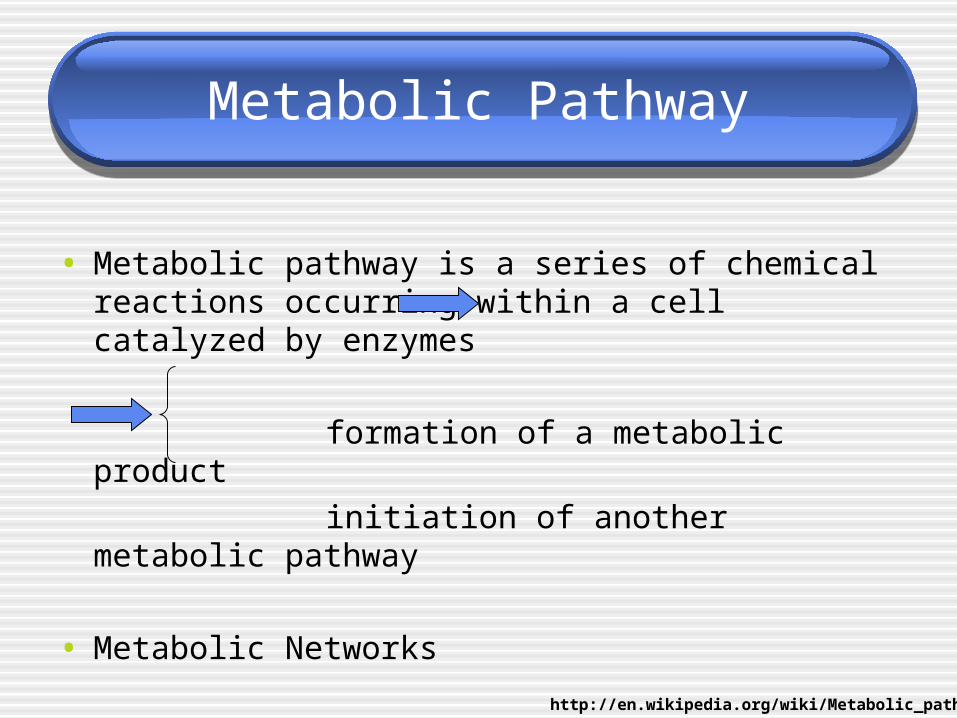
• Metabolic pathway is a series of chemical reactions occurring within a cell catalyzed by enzymes
formation of a metabolic product
initiation of another metabolic pathway
• Metabolic Networks
http://en.wikipedia.org/wiki/Metabolic_pathway
Signaling network
Signal transduction
Process by which a cell converts one kind of signal or stimulus into another.
A sequence of biochemical reactions inside the cell, which are carried out by enzymes and linked through second messengers.
http://en.wikipedia.org/wiki/Signal_transduction

High-throughput data
• Co-expression
• Co-location
• Co-inheritance
• Co-evolution
• Co-citation
• Rosetta stone(Gene-fusions)
Expression
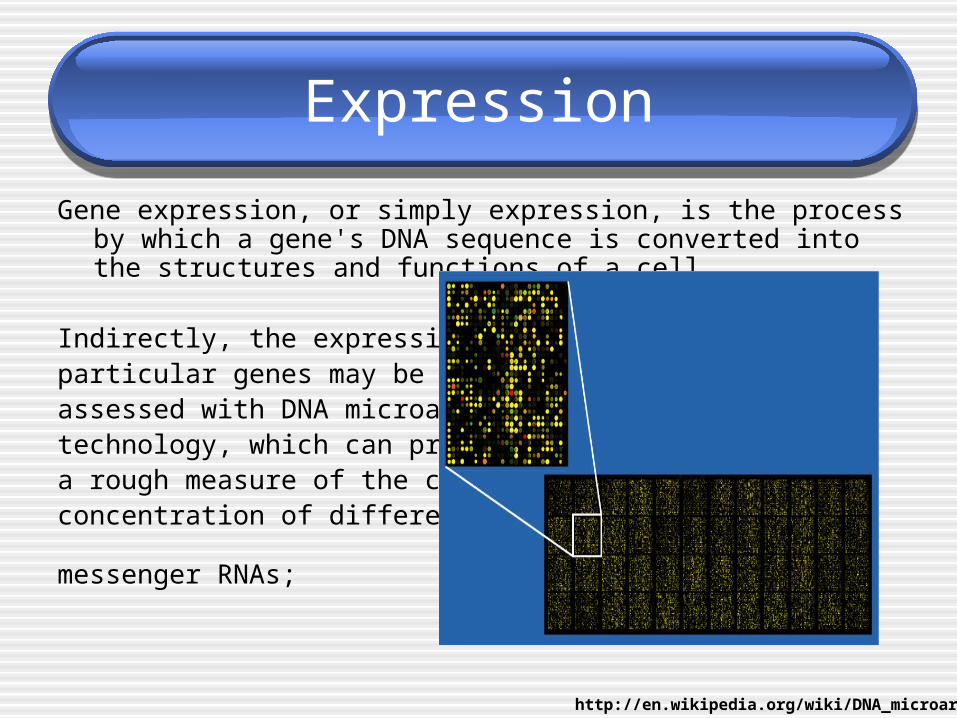
Gene expression, or simply expression, is the process by which a gene's DNA sequence is converted into the structures and functions of a cell.
Indirectly, the expression of particular genes may be assessed with DNA microarray technology, which can provide a rough measure of the cellular concentration of different
messenger RNAs;
http://en.wikipedia.org/wiki/DNA_microarray
Inheritance
Proteins are clustered according to the similarity of their phylogenetic profiles. Similar profiles show a correlated pattern of inheritance and, by implication, functional linkage.
Evolution
Evolution is the change in the heritable traits of a population over successive generations, as determined by shifts in the allele frequencies of genes.
Gene fusion
• A fusion gene is a hybrid gene formed from two previously separate genes. translocation interstitial deletion chromosomal inversion
• By creating a fusion gene of a protein of interest and green fluorescent protein, the protein of interest may be observed in cells or tissue using fluorescence microscopy. The protein synthesized when a fusion gene is expressed is called a fusion protein.
http://en.wikipedia.org/wiki/Gene_fusion
Experiments
• Microarray analysis of gene expression
• Systematic protein interaction mapping
• Mass spectrometry
• Yeast two hybrid
• Synthetic lethal screens
Microarray analysis of gene expression
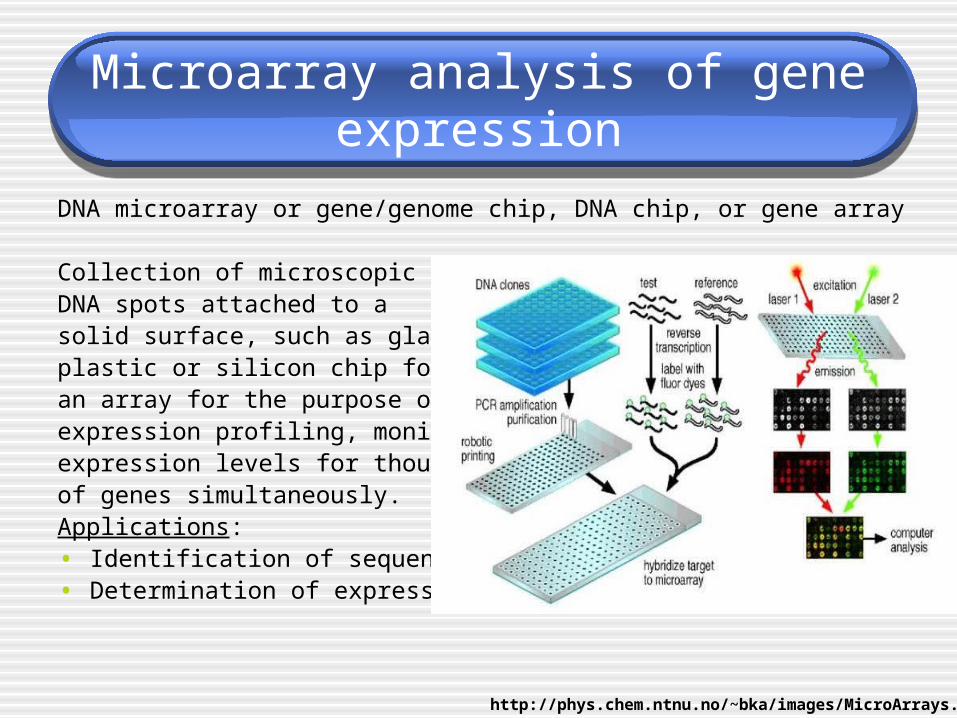
DNA microarray or gene/genome chip, DNA chip, or gene array
Collection of microscopic DNA spots attached to a solid surface, such as glass,plastic or silicon chip forming an array for the purpose of expression profiling, monitoring expression levels for thousands of genes simultaneously.Applications:• Identification of sequence• Determination of expression level of genes
http://phys.chem.ntnu.no/~bka/images/MicroArrays.jpg

Affinity purification/Mass spectrometry
• For characterization of proteins
• Using quantitative mass spectrometry
to analyze the composition of a partially
purified protein complex.
• Interacting proteins can be
distinguished from nonspecifically
co-purifying proteins by their abundance
ratios.
• Complexes can be analyzed after a
single step purification Better detection
of weakly associated proteins
http://en.wikipedia.org/wiki/Image:Mass_spectrom.gif
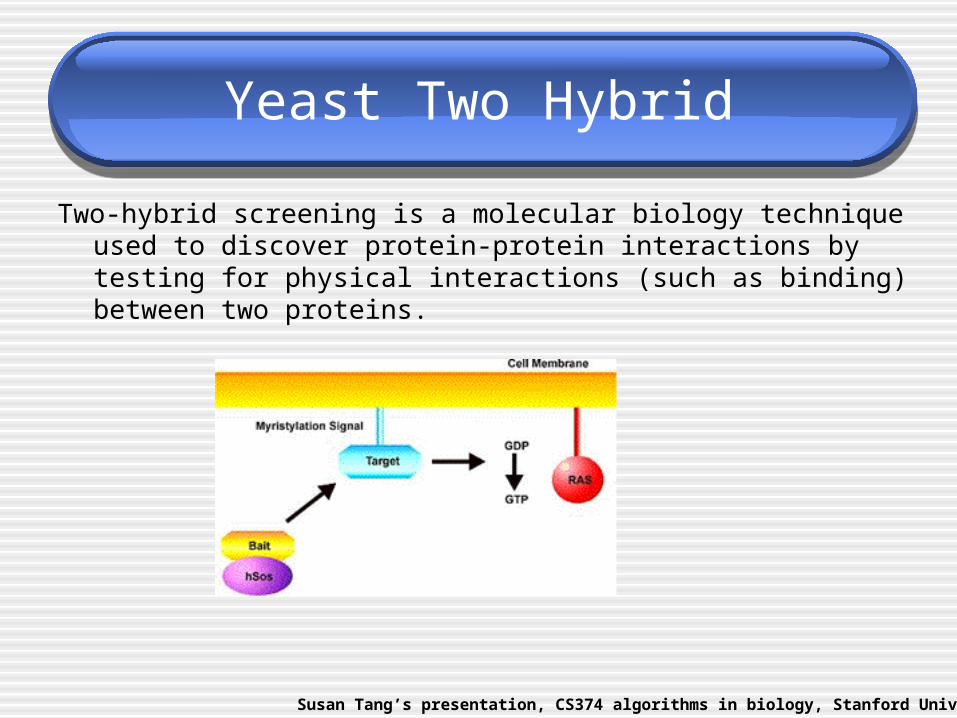
Yeast Two Hybrid
Two-hybrid screening is a molecular biology technique used to discover protein-protein interactions by testing for physical interactions (such as binding) between two proteins.
Susan Tang’s presentation, CS374 algorithms in biology, Stanford University
Synthetic lethal screening
• To interpret genetic networks by
examining the effects on the cell when pairs of genes are
knocked out simultaneously. Knocking out each gene separately may have no phenotypic
effect because of robustness provided by genetic redundancy, but knocking out both genes has a severe, possibly lethal effect.

Basics of protein Interaction Networks
Computational aspects
Statistics terminology
• Probability
• Probability density
• Conditional probability
• Prior/Postrior probability
• Bayes’ rule

Statistics terminology
True False
Positive True positive False positive(error type I)
Negative True negative False negative(error type II)
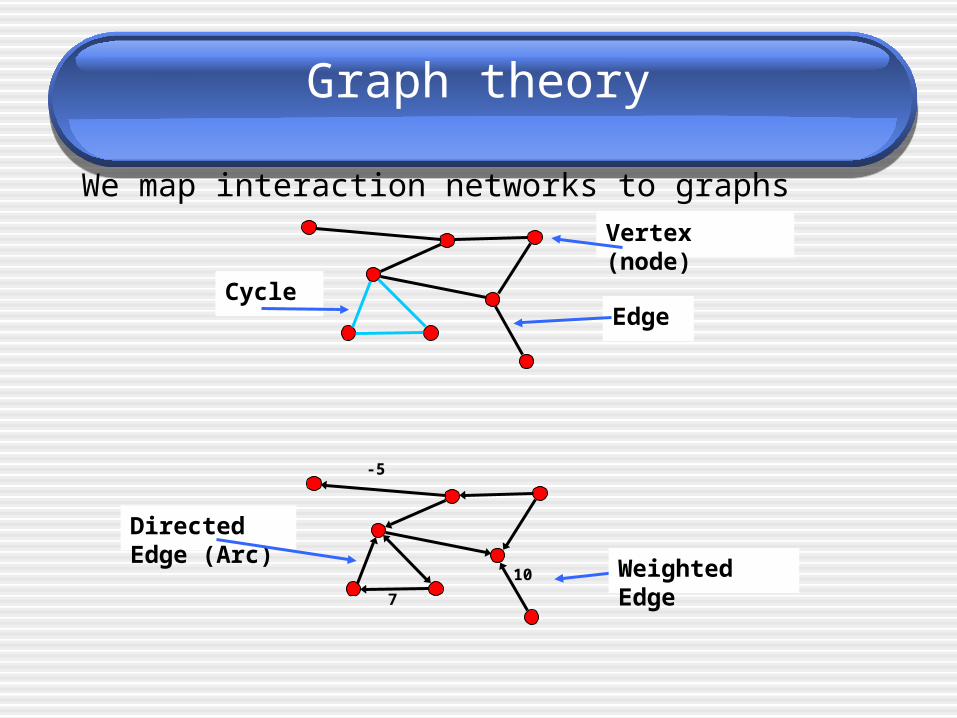
Graph theory
We map interaction networks to graphs
Vertex (node)
EdgeCycle
-5
Directed Edge (Arc)
Weighted Edge7
10
Networks in our model
• Undirected graphs
• Nodes correspond to proteins
• Edges represent the interactions
• Edge weights represent interaction probabilities
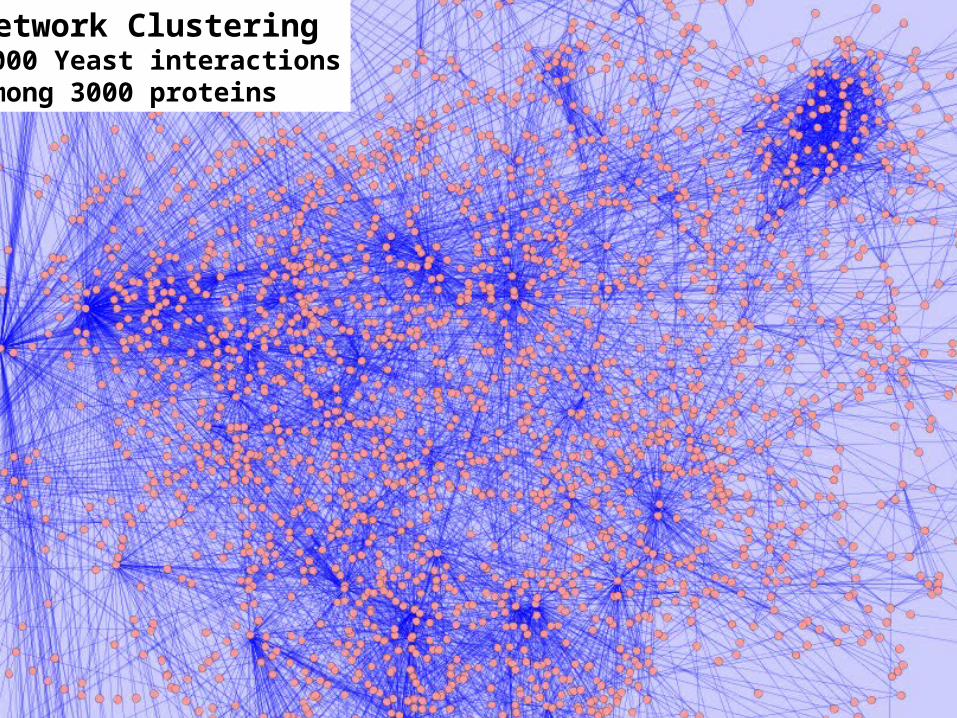
Network Clustering7000 Yeast interactionsamong 3000 proteins
Training sets
• KEGG(Kyoto Encyclopedia of Genes and Genomes)
• GFP(Green Fluorescent Protein)
• GO(Gene Ontology)
• COG(Cluster of Orthologous Groups of proteins)

Genomics• Genomics
• 1 genome• Assembly, Gene Finding
• Comparative Genomics• N genomes• Sequence Alignment
• Functional Genomics• 1 assay• Microarray Analysis
• Integrative Genomics• N assays• Network Integration
A probabilistic functional network of yeast genes
Insuk Lee, Shailesh V. Date, Alex T. Adai,Edward M. Marcotte

Motivation
Knowledge of gene networks’ structure
• Complex roles of individual genes
interplay between many systems in a cell
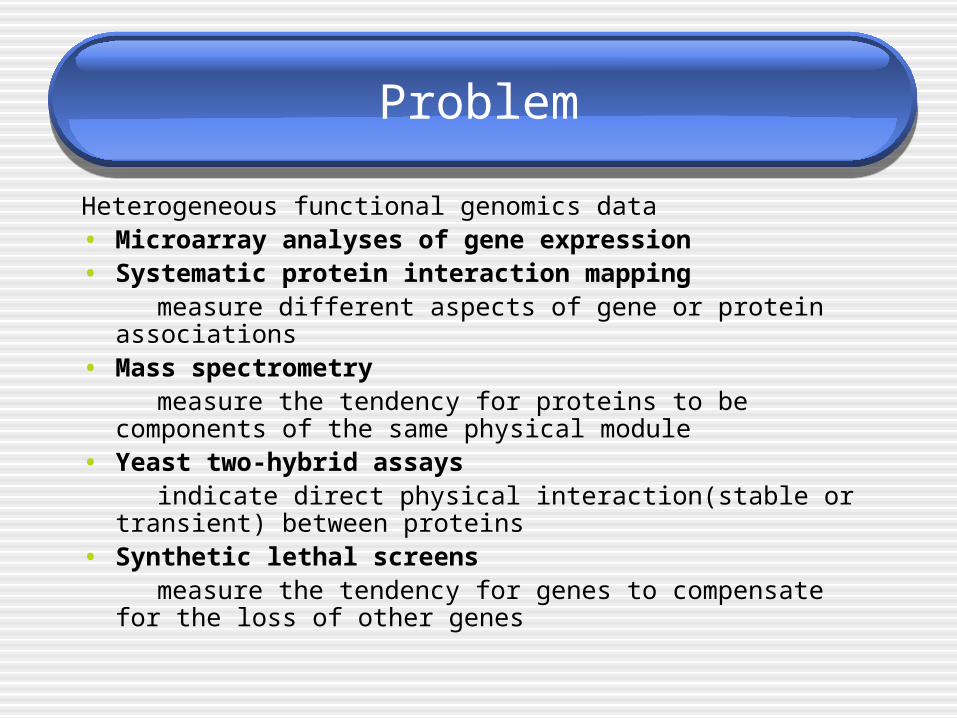
Problem
Heterogeneous functional genomics data• Microarray analyses of gene expression• Systematic protein interaction mapping measure different aspects of gene or protein associations• Mass spectrometry measure the tendency for proteins to be components of the
same physical module• Yeast two-hybrid assays indicate direct physical interaction(stable or transient) between
proteins• Synthetic lethal screens measure the tendency for genes to compensate for the loss of
other genes
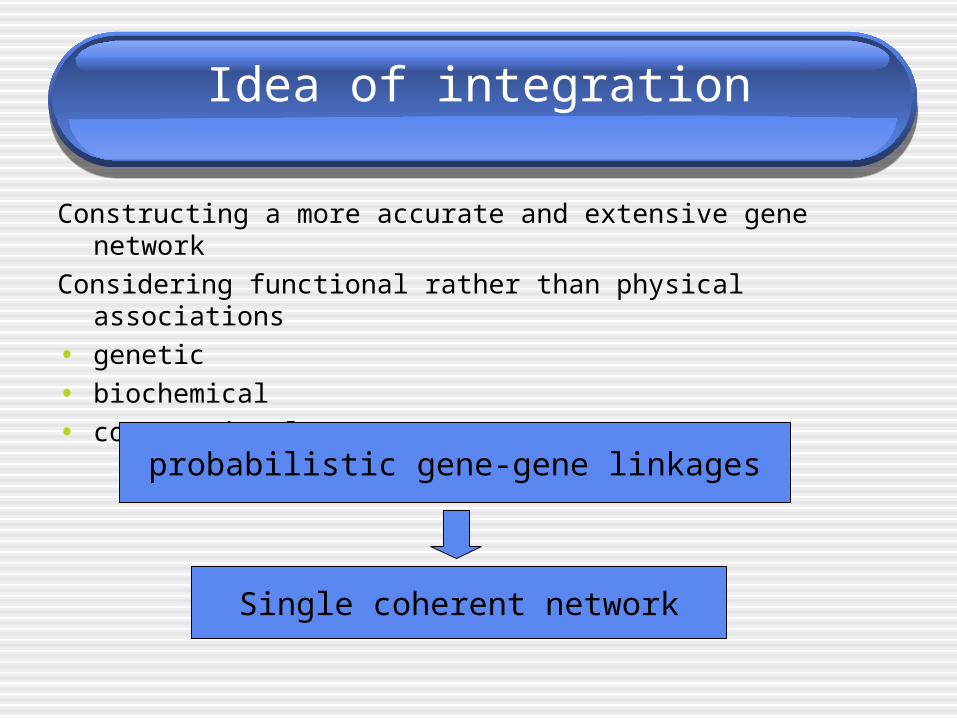
Idea of integration
Constructing a more accurate and extensive gene network
Considering functional rather than physical associations
• genetic
• biochemical
• computational
probabilistic gene-gene linkages
Single coherent network
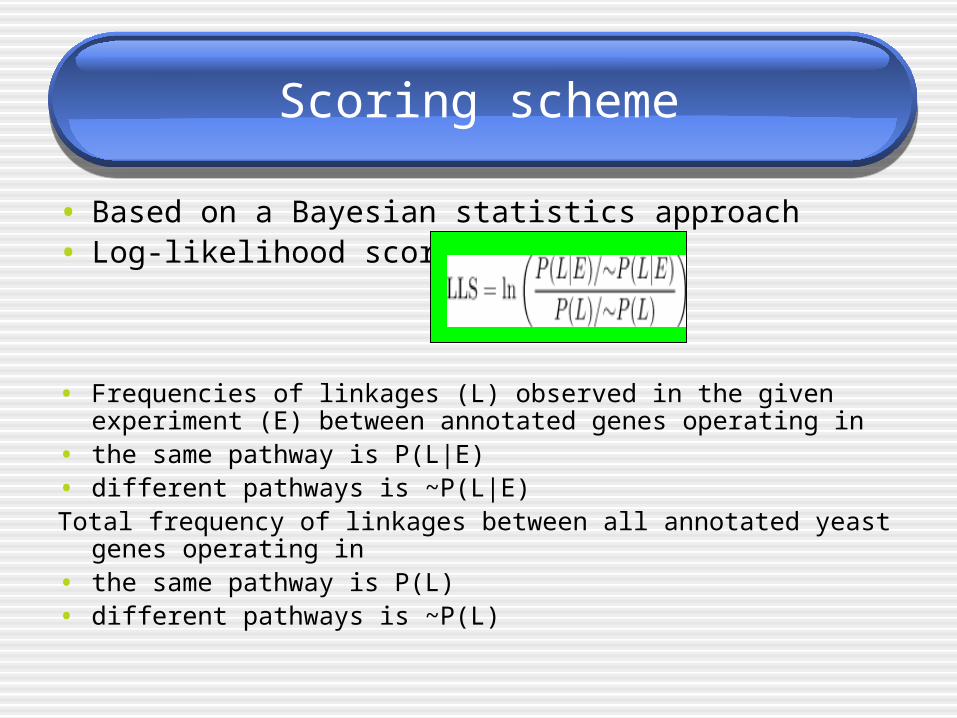
Scoring scheme
• Based on a Bayesian statistics approach• Log-likelihood score
• Frequencies of linkages (L) observed in the given experiment (E) between annotated genes operating in
• the same pathway is P(L|E)• different pathways is ~P(L|E)Total frequency of linkages between all annotated yeast genes
operating in • the same pathway is P(L)• different pathways is ~P(L)
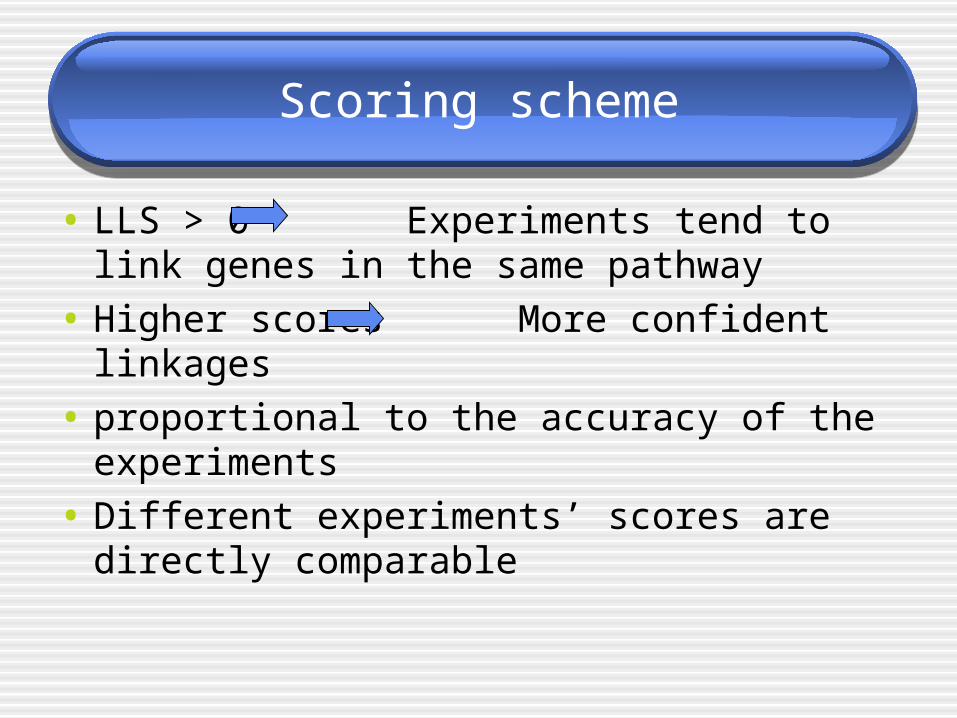
Scoring scheme
• LLS > 0 Experiments tend to link genes in the same pathway
• Higher scores More confident linkages
• proportional to the accuracy of the experiments
• Different experiments’ scores are directly comparable
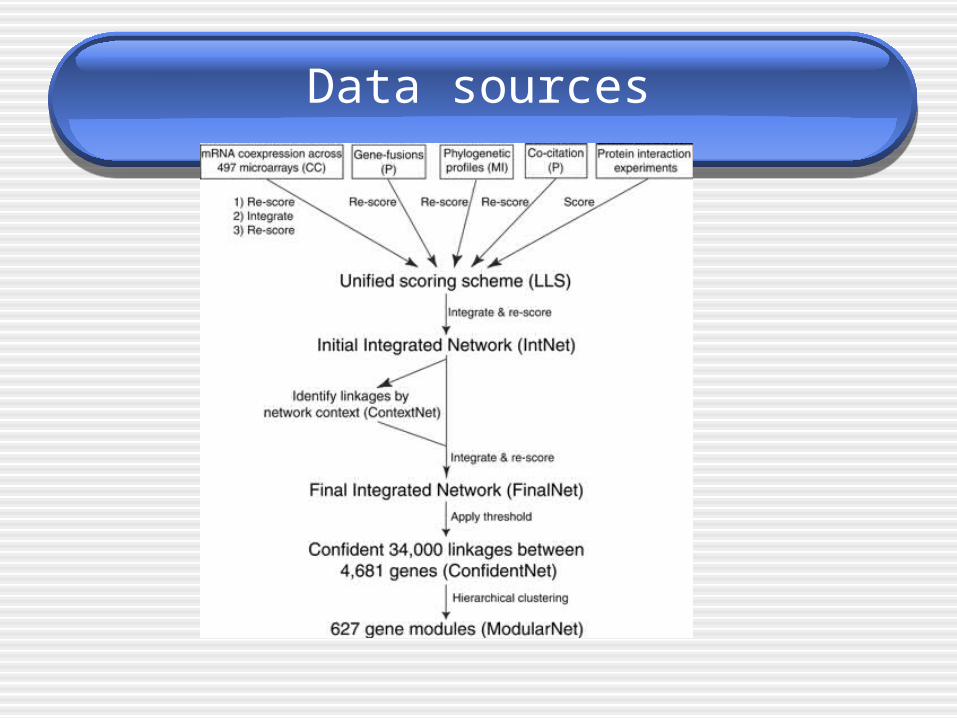
Data sources

Benchmarked accuracy and extent of functional genomics data sets and the integrated networks
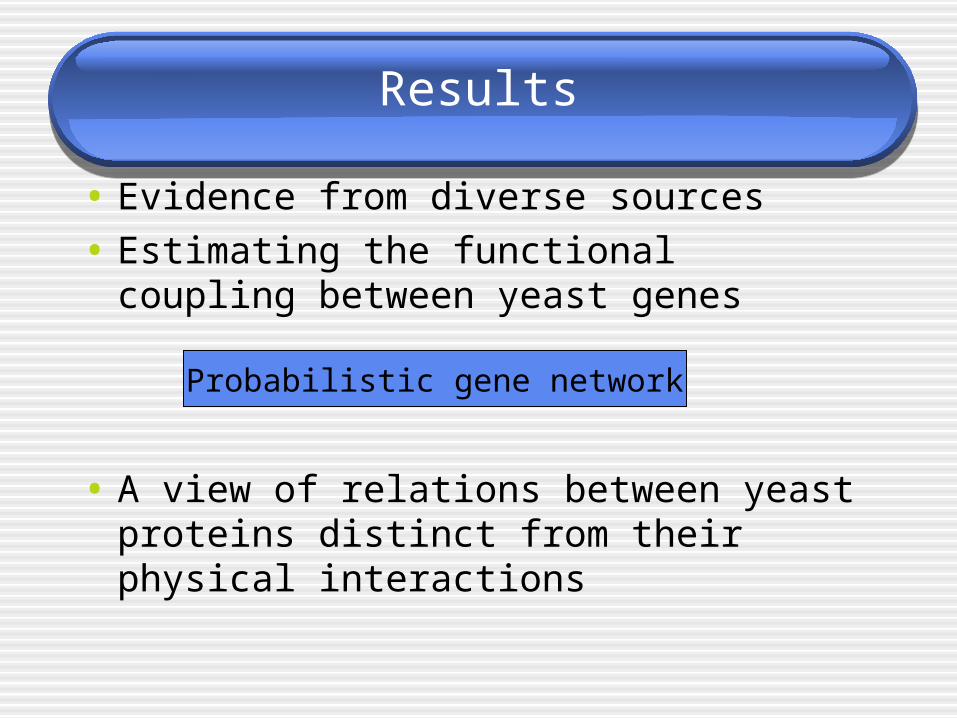
Results
• Evidence from diverse sources
• Estimating the functional coupling between yeast genes
• A view of relations between yeast proteins distinct from their physical interactions
Probabilistic gene network

Future directions
Application of this strategy to other organisms such as human
• (i) assemble benchmarks for measuring the accuracy of linkages between human genes
• (ii) assemble gold standard sets of highly accurate interactions for calibrating the benchmarks
• (iii) benchmark functional genomics data for their ability to correctly link human genes
• then integrate the data as described.

Integrated protein interaction networks for 11 Microbes
Balaji S. Srinivasan, Antal F. Novak, Jason A. Flannick, Serafim Batzoglou, Harley H.
McAdams
Motivation
There are different methods to predict the interactions but the network generated by eah method are often contradictory
Objective:constructing a summary network for each species which
uses all the evidence at hand to predict which proteins are functionally linked
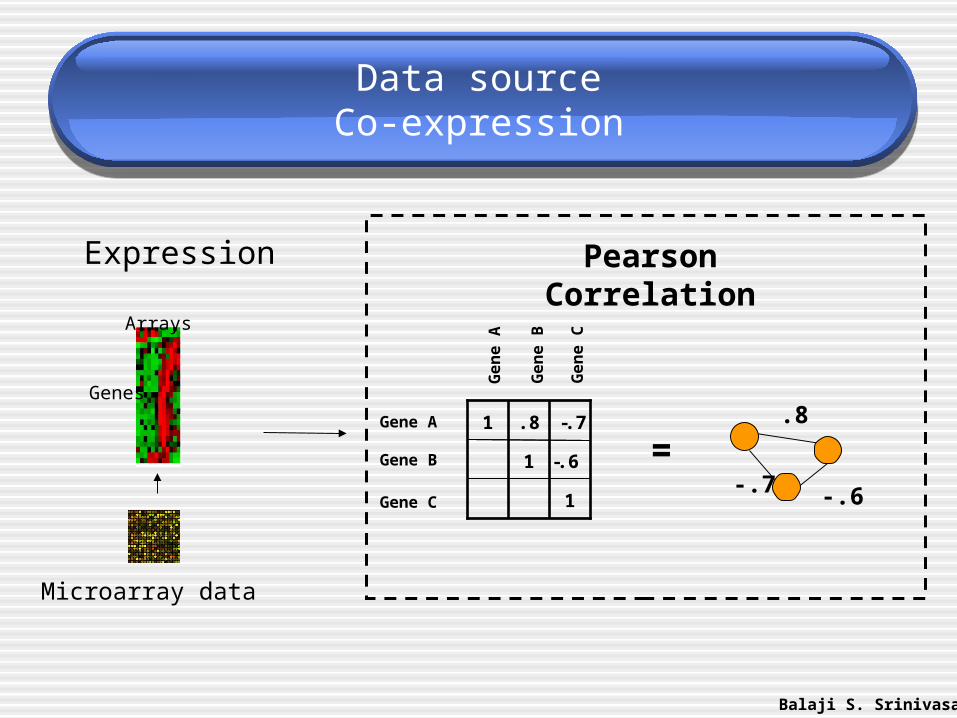
Data sourceCo-expression
1
.81
1
-.6
-.7Gene A
Gene B
Gene C
Ge
ne
B
Ge
ne
A
Ge
ne
C
Pearson Correlation
=.8
-.7 -.6
Genes
Arrays
Microarray data
Expression
Balaji S. Srinivasan

Data sourcesCo-location
0
.060
0
.25
.25Protein A
Protein B
Protein C
Pro
tein
B
Pro
tein
A
Pro
tein
C
Average chromosomal distance
.06
.25 .25
=.6.2.3.1
.5
.1.3.2.4
.25 .25 .05
Protein A
Protein B
Protein C
Ch
rom
2
Ch
rom
1
Ch
rom
4
Ch
rom
3
Location
Balaji S. SrinivasanAssembled Genomes
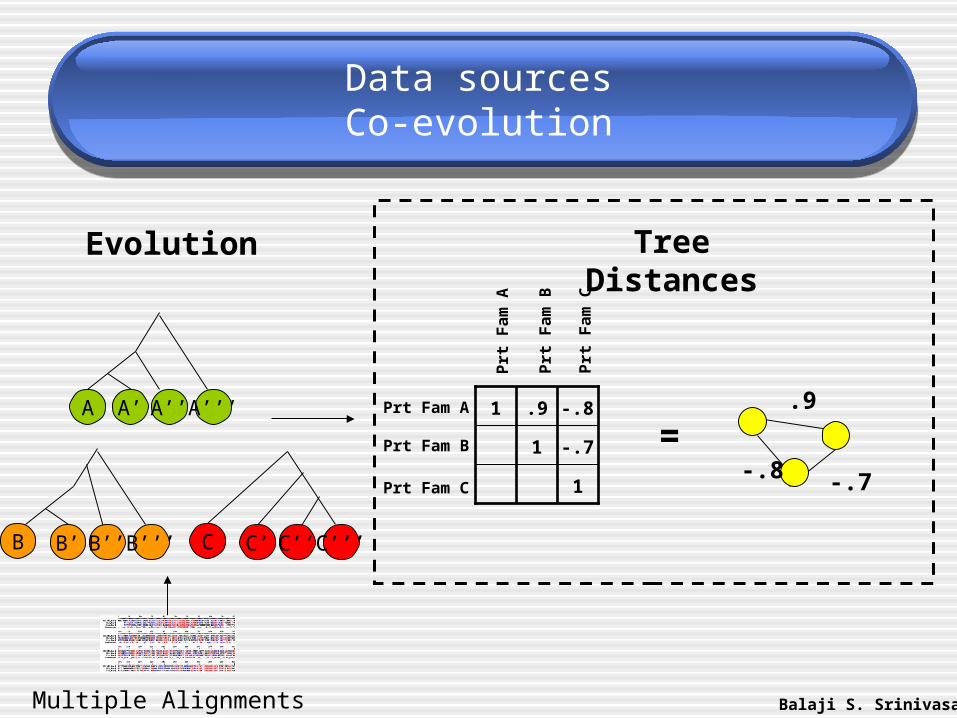
Data sourcesCo-evolution
1
.91
1
-.7
-.8Prt Fam A
Prt Fam B
Prt Fam C
Prt
Fa
m B
Prt
Fa
m A
Prt
Fa
m C
Tree Distances
.9
-.8 -.7
=
C’’
Evolution
A A’ A’’ A’’’
B’ B’’ B’’’B C’ C’’’C
Multiple Alignments Balaji S. Srinivasan
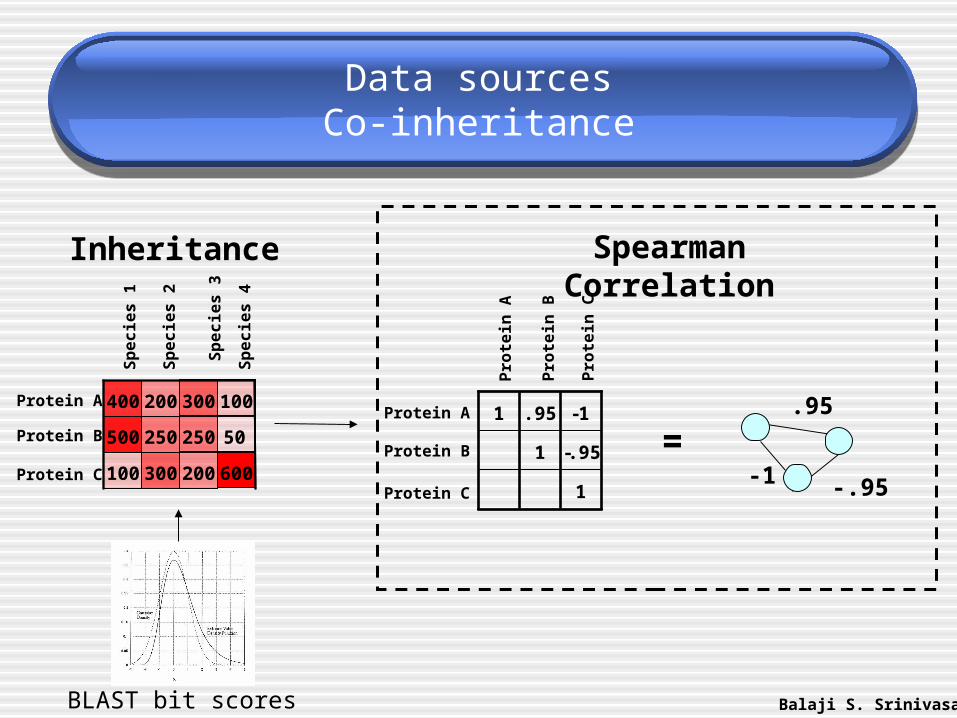
Data sourcesCo-inheritance
1
.951
1
-.95
-1Protein A
Protein B
Protein C
Pro
tein
B
Pro
tein
A
Pro
tein
C
.95
-1 -.95
=
Spearman Correlation
600200300100
500
100300200400
250 250 50
Protein A
Protein B
Protein C
Sp
ec
ies
2
Sp
ec
ies
1
Sp
ec
ies
4
Sp
ec
ies
3
Inheritance
Balaji S. SrinivasanBLAST bit scores
Integration of two predictors
• Previous work
• Recent work
• Method presented in this paper

Previous work
We can integrate two given networks by
• intersection
• union
• average
+
€
G1 = (V1,E1)coexpression
€
V1,V2 ∈ (V , set of all proteins)
coinheritance
€
G2 = (V2,E2)
=
€
E isc =1 if (E1 > T1) || (E2 > T2)
Eunion =1 if (E1 > T1) & & (E2 > T2)
Eavg = .5(E1 +E2)
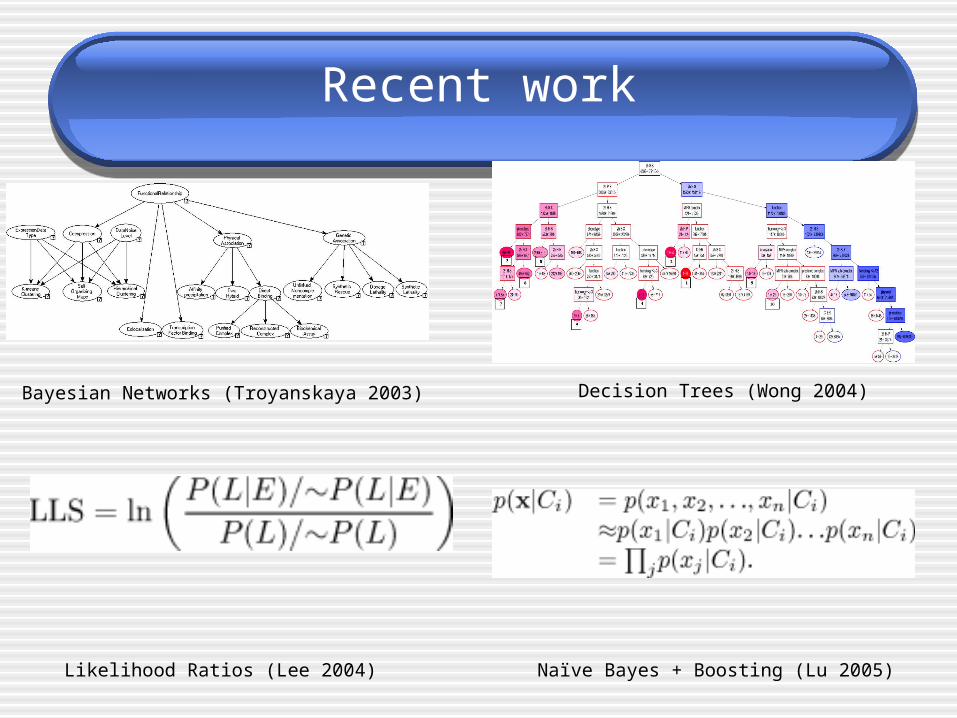
Recent work
Bayesian Networks (Troyanskaya 2003) Decision Trees (Wong 2004)
Naïve Bayes + Boosting (Lu 2005)Likelihood Ratios (Lee 2004)
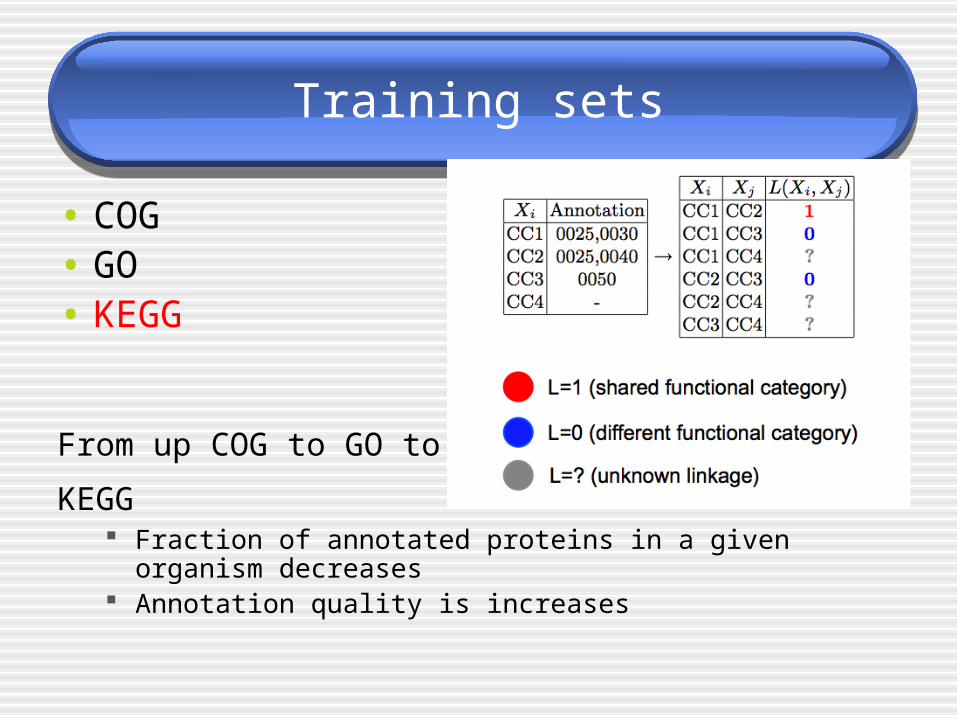
Training sets
• COG• GO• KEGG
From up COG to GO to
KEGG Fraction of annotated proteins in a given organism decreases Annotation quality is increases
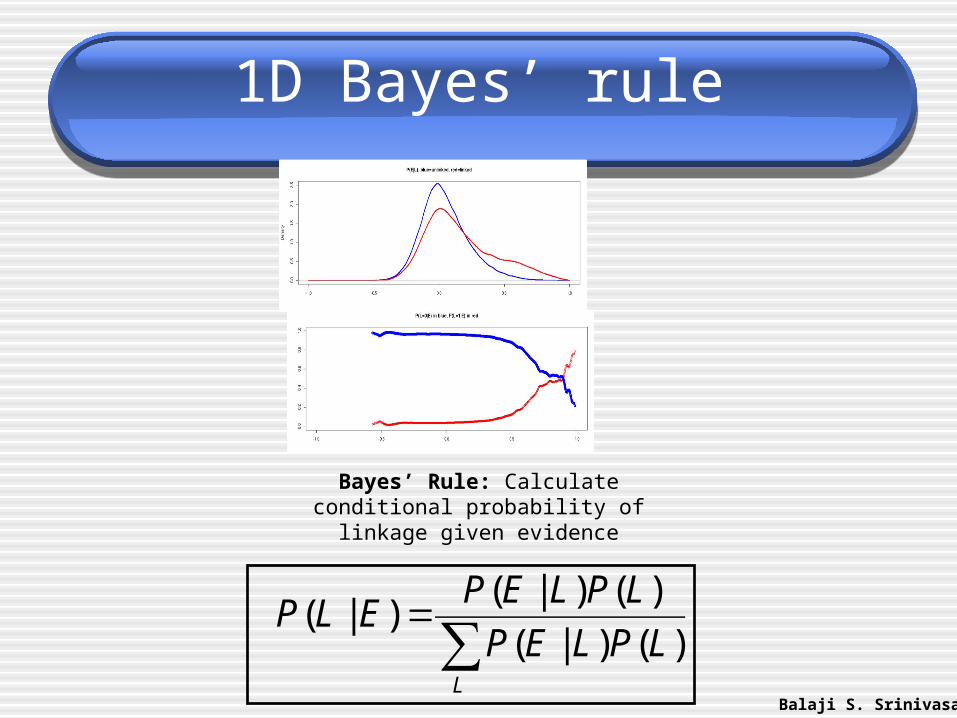
1D Bayes’ rule
∑=
L
LPLEP
LPLEPELP
)()|(
)()|()|(
Bayes’ Rule: Calculateconditional probability oflinkage given evidence
Balaji S. Srinivasan
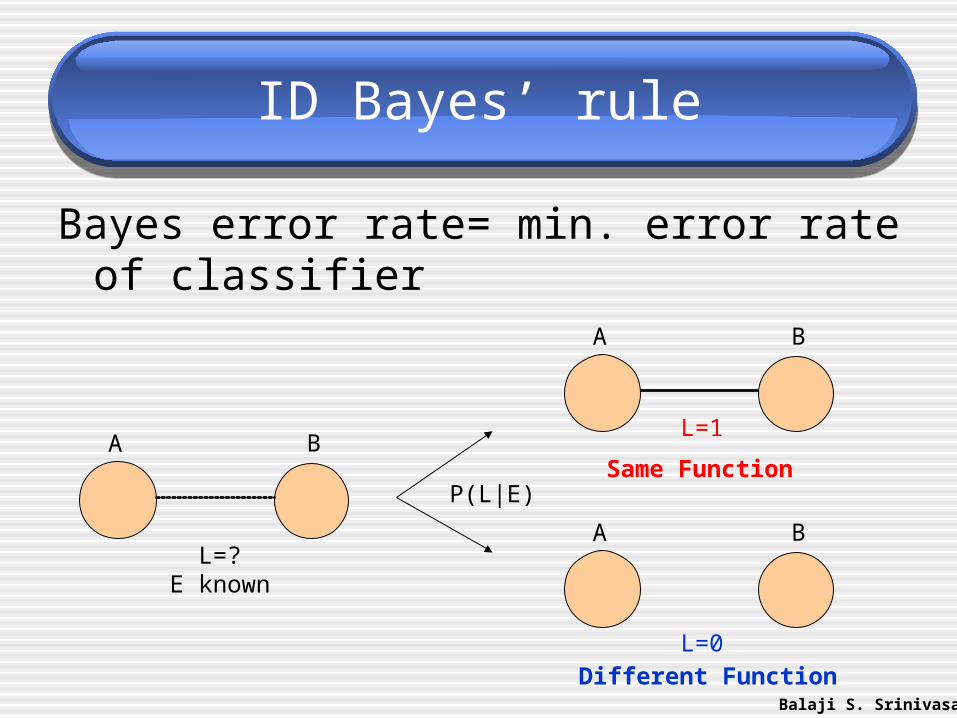
ID Bayes’ rule
Bayes error rate= min. error rate of classifier
A B
L=?E known
Different Function
A B
L=0
Same Function
A B
L=1
P(L|E)
Balaji S. Srinivasan

2D network integration
• 2D scatter plot Separates linked pairs from unlinked pairs more efficiently
• co-expression vs. co-inheritence
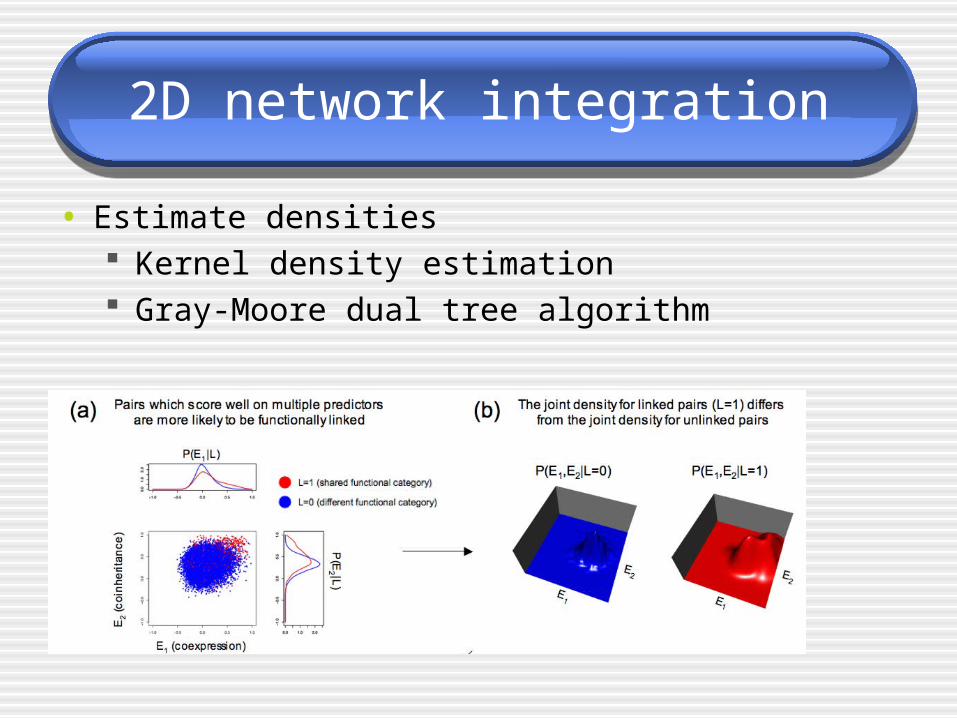
2D network integration
• Estimate densities Kernel density estimation Gray-Moore dual tree algorithm
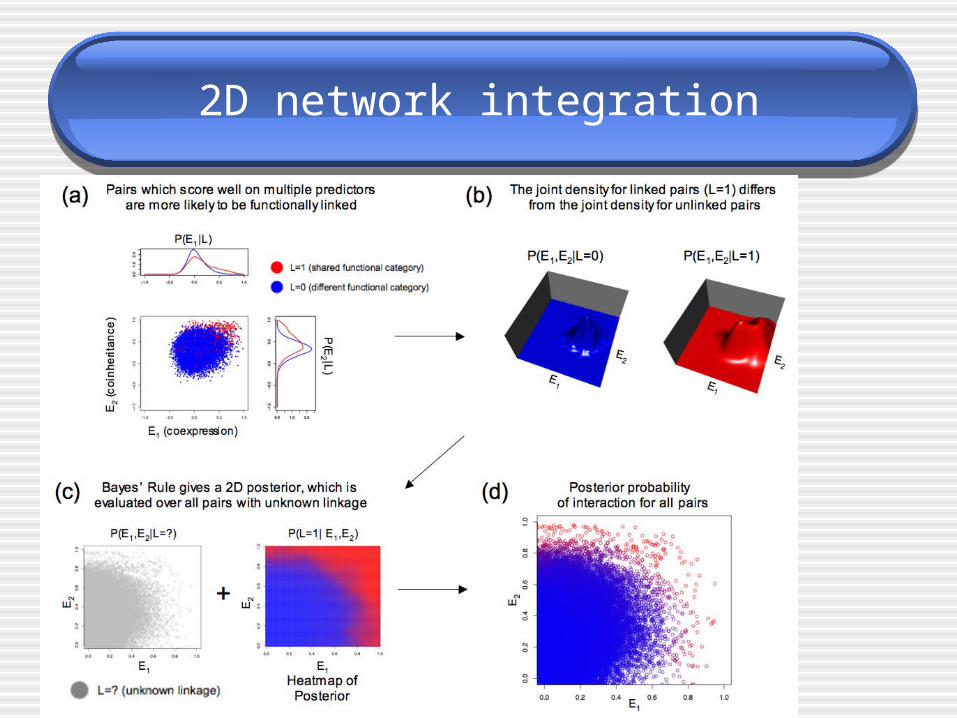
2D network integration
2D network integration
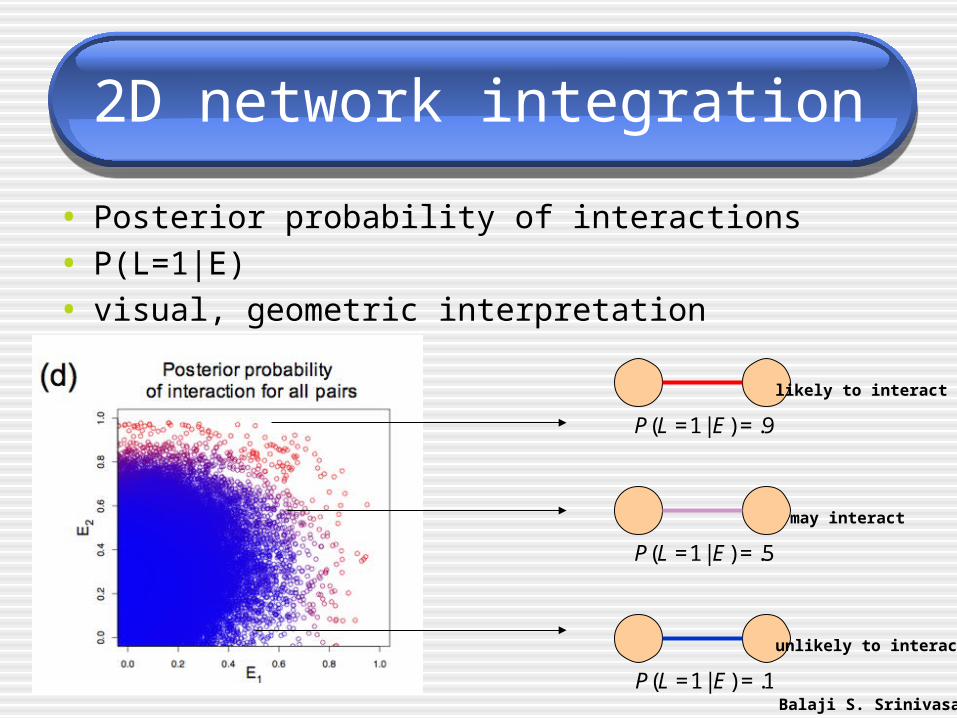
• Posterior probability of interactions
• P(L=1|E)
• visual, geometric interpretation
€
P(L =1 | E) = .9
€
P(L =1 | E) = .5
€
P(L =1 | E) = .1Balaji S. Srinivasan
likely to interact
may interact
unlikely to interact
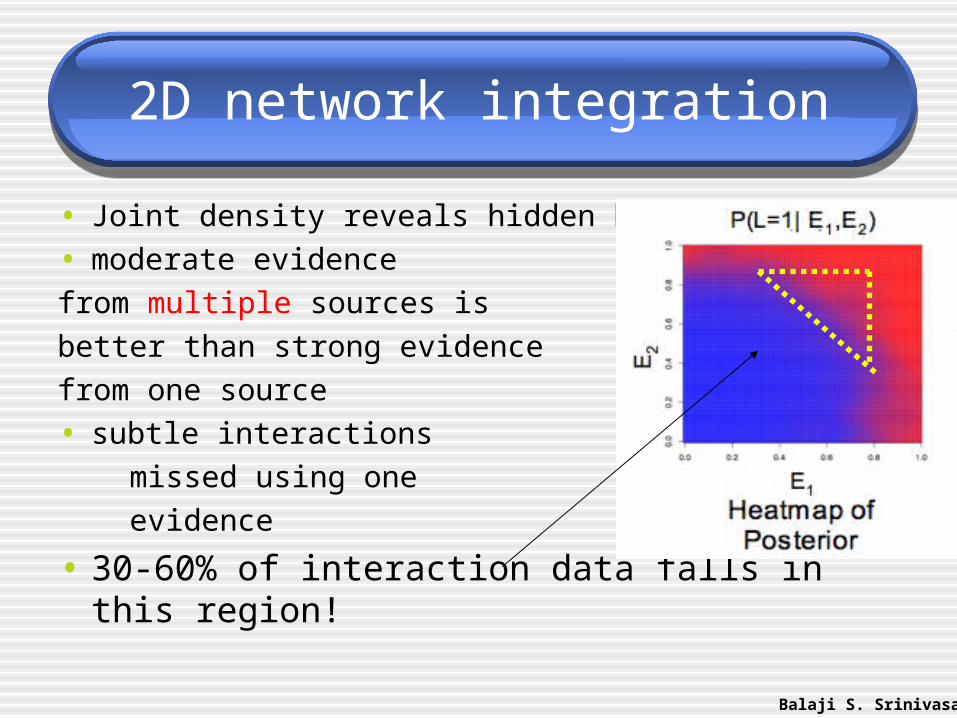
2D network integration
• Joint density reveals hidden biology
• moderate evidence
from multiple sources is
better than strong evidence
from one source
• subtle interactions
missed using one
evidence
• 30-60% of interaction data falls in this region!
Balaji S. Srinivasan

N predictors
Given all evidences
N=3)1|,,( 321 =LEEEP)0|,,( 321 =LEEEP ),,|1( 321 EEELP =
coex
pres
sion
(E1)
colocation (E2)
coinheritance (E3)

Conclusion and Future directions
This algorithm can be generalized to apply to discrete,ordinal or categorical data sets and is applicable to larger eukaryotic genomes
• Possibility of comparative modular biology
Align subgraphs of interaction networks
Network alignment algorithm scalable to large data sets and comparing many species simultaneously.

Question
?