Embed Size (px)
Citation preview

Estimation of COVID-19 Impactin Virginia
Network Systems Science & Advanced
ComputingBiocomplexity Institute
& InitiativeUniversity of Virginia
biocomplexity.virginia.edu
April 13, 2020(data current to April 11, 2020)Biocomplexity Institute Technical report: TR-2020-048

Who We Are• Biocomplexity Institute at the University of Virginia• Using big data and simulations to understand massively interactive systems
• Over 20 years of crafting and analyzing infectious disease models• Pandemic response and support for Influenza, Ebola, Zika, others
• COVID-19 researchers on today's panel
13-Apr-20 2
Bryan LewisResearch Associate Professor
Chris BarrettExecutive Director
Madhav MaratheDivision Director

Overview• Goal: Understand impact of COVID-19 mitigations in Virginia• Approach:
• Calibrate explanatory mechanistic model to observed cases• Project infections through the end of summer• Consider a range of possible mitigation effects in "what-if" scenarios
• Outcomes:• Ill, Confirmed, Hospitalized, ICU, Ventilated, Death• Geographic spread over time, case counts, healthcare burdens
13-Apr-20 3

Key TakeawaysProjecting future cases precisely is impossible and unnecessary.Even without perfect projections, we can confidently draw conclusions:
• Current social distancing efforts are working.
• Under current conditions, Virginia as a whole will have sufficient medical resources for at least the next couple months.
• Lifting social distancing restrictions too soon can lead quickly to a second wave.
• Further modeling could elucidate the effectiveness of test-trace-isolate policies.
• The situation is changing rapidly. Models will be updated regularly.
13-Apr-20 4

Model Configuration and Data Analysis
13-Apr-20 5

Simulation Engine – PatchSim• Metapopulation model
• Represents each population and its interactions as a single patch
• 133 patches for Virginia counties and independent cities
• Extended SEIR disease representation• Includes asymptomatic infections and
treatments
• Mitigations affect both disease dynamics and population interactions
• Runs fast on high-performance computers
• Ideal for calibration and optimization
12-Apr-2020 6
Venkatramanan, Srinivasan, et al. "Optimizing spatial allocation of seasonal influenza vaccine under temporal constraints.” PLoS Computational Biology 15.9 (2019): e1007111.
Susceptible Exposed Infectious Removed

Model Configuration• Transmission: parameters are calibrated to the observed case counts• Reproductive number: 2.1 - 2.3• Infectious period (time of infectiousness before full isolation): 3.3 to 5 days
• Initial infections: Start infections from confirmed cases by county• Timing and location based on onset of illness from VDH data• Assume 15% detection rate, so one confirmed case becomes ~7 initial
infections
• Mitigations: Duration and intensity of mitigations into the future are unknowable, thus explored through 5 scenarios
13-Apr-20 7

Mitigation Scenarios• Consider 5 possible futures• Two levels of intensity with two durations and one with no effect
• Start of social distancing: March 15th, as measured from VDH data• Duration: Lift on April 30th or lift on June 10th
13-Apr-20 8
Duration(lift date) Intensity Short Name Description
Apr 30th Slowing Slow - Apr30 Slowing intensity, lift April 30th
June 10th Slowing Slow - Jun10 Slowing intensity, lift June 10th
Apr 30th Pausing Pause – Apr30 Pausing intensity, lift April 30th
June 10th Pausing Pause – Jun10 Pausing intensity, lift June 10th
None Unmitigated Unmitigated No effect of social distancing
• Intensity of mitigation: Slowing growth vs. Pausing growth• Slowing – Social distancing slows the
growth, but new cases do increase• Pausing – Social distancing pauses
growth, keeping new cases steady• Pausing scenarios track the data
better

Full Parameters
13-Apr-20 9
Parameter Estimated Values Description [Source]
Transmissibility (R0) 2.2 [2.1 – 2.3] Reproductive number *
Incubation period 5 days Time from infection to Infectious *
Infectious period 3.3 - 5 days Duration of infectiousness *
Proportion asymptomatic 50% Proportion of infections that don’t exhibit symptoms *
Proportion hospitalized 5.5% (~20% of confirmed) Symptomatic Infections becoming Hospitalized *
Proportion in ICU 20% Hospitalized patients that require ICU *
Proportion ventilated 70% Proportion of ICU requiring ventilation *
Onset to hospitalization 5 days Time from symptoms to hospitalization *
Hospitalization to ventilation 3 days Time from hospitalization to ventilation *
Duration hospitalized 10 days Time spent in the hospital
Duration ventilated 14 days Time spent on a ventilator †
Infection detection rate 15% One confirmed case becomes ~7 initial infections #
* CDC COVID-19 Modeling Team. "Best Guess” scenario. Planning Parameters for COVID-19 Outbreak Scenarios. Version: 2020-03-31.† Up-to-date. COVID-19 Critical Care Issues. https://www.uptodate.com/contents/coronavirus-disease-2019-covid-19-critical-care-issues?source=related_link# Li et al., Science 16 Mar 2020:eabb3221 https://science.sciencemag.org/content/early/2020/03/24/science.abb3221

Calibration Approach • Data:
• County level case counts by date of onset (from VDH)• Confirmed cases for model fitting
• Model: PatchSim initialized with disease parameter ranges from literature• Calibration: fit model to observed data
• Search transmissibility and duration of infectiousness
• Markov Chain Monte Carlo (MCMC) particle filtering finds best fits while capturing uncertainty in parameter estimates
• Project: future cases and outcomes using the trained particles
13-Apr-20 10
https://public.tableau.com/views/VirginiaCOVID-19Dashboard/VirginiaCOVID-19Dashboard
Accessed 1pm April 12, 2020

Impact of Interventions
13-Apr-20 11

Estimating Effects of Social Distancing
13-Apr-20 12
• Anonymized mobility data shows Virginia greatly reduced activities• Google: -44% retail & recreation, -18% grocery stores, -39% workplaces• Cuebiq: >50% reduction of average individual mobility compared to Year Avg.
• VDH data shows reductions in growth rate starting in mid-March• Weekly average growth rate by date of onset
• Week before March 15 = 0.3• Week after March 15 = 0.03
• Equivalent reproductive number change• 2.2 before March 15th
• 1.1 after March 15th
Google. COVID-19 community mobility reports. https://www.google.com/covid19/mobility/Cuebiq: COVID-19 Mobility insights. https://www.cuebiq.com/visitation-insights-covid19/
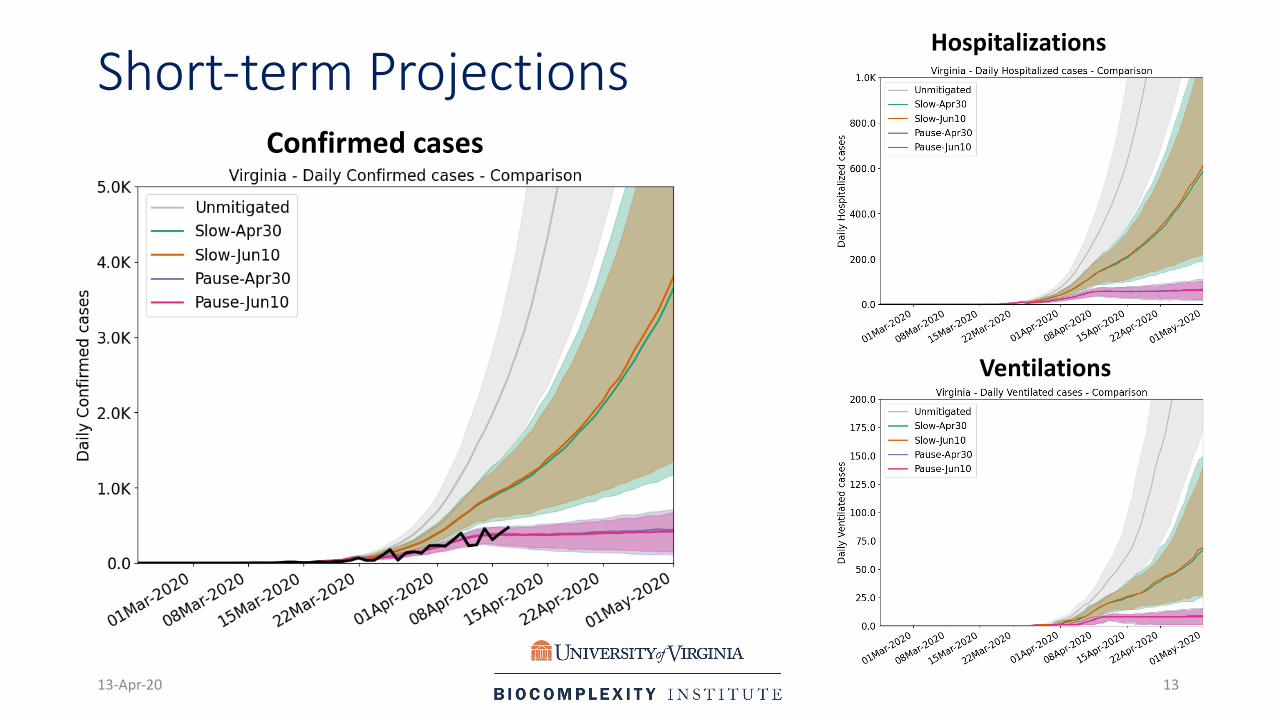
Short-term Projections
13-Apr-20 13
Confirmed cases
Hospitalizations
Ventilations

Stay the Course: Future Depends on Policy
13-Apr-20 14
Week ending
Unmitigated Slow Jun10
Pause Jun10
4/12/20 11,846 5,518 2,4694/19/20 25,712 8,502 2,5994/26/20 53,562 13,076 2,7425/3/20 101,876 19,881 2,944
5/10/20 164,527 29,567 3,1515/17/20 200,184 42,312 3,3455/24/20 182,818 57,679 3,5585/31/20 136,652 73,380 3,7706/7/20 84,016 85,874 3,962
6/14/20 46,350 89,390 4,1446/21/20 23,363 85,226 4,4706/28/20 11,366 91,648 7,850
Weekly New Confirmed Cases
Numbers are medians of projections

Hospital Demand and Capacity by Region
13-Apr-20 15
Assumes average length of stay of 10 daysCOVID-19 capacity ranges from 80% (dots) to 120% (dash) of total beds
Scenario Date Ranges
Slow – Apr30 Early May – Early June
Slow – Jun10 Early May – Mid June
Pause – Apr30 Mid June – Late July
Pause – Jun10 Mid July – Late August
Unmitigated Late April – Mid May
Date ranges when regions are estimatedto exceed surge capacity
Social Distancing postpones the time when capacity is exceeded 1 to 2.5 months
Timing estimates can be used for planning to augment existing capacities if needed
Capacities by Region – Pause June 10

Ongoing Efforts and Improvements• Incorporate age structure into transmission dynamics and
stratify outcomes by age in these projections• Incorporate Virginia-specific outcomes and durations which will better
tailor these analyses to our Commonwealth• Assess evidence for the role of seasonality, and incorporate if warranted• Analyze Test-Trace-Isolate mitigations• Connect forecast demand to VDH dashboard
13-Apr-20 16

Key TakeawaysProjecting future cases precisely is impossible and unnecessary.Even without perfect projections, we can confidently draw conclusions:
• Current social distancing efforts are working.
• Under current conditions, Virginia as a whole will have sufficient medical resources for at least the next couple months.
• Lifting social distancing restrictions too soon can lead quickly to a second wave.
• Further modeling could explore the effectiveness of test-trace-isolate policies.
• The situation is changing rapidly. Models will be updated regularly.
13-Apr-20 17

References Venkatramanan, S., et al. "Optimizing spatial allocation of seasonal influenza vaccine under temporal constraints.” PLoScomputational biology 15.9 (2019): e1007111.
Arindam Fadikar, Dave Higdon, Jiangzhuo Chen, Bryan Lewis, Srinivasan Venkatramanan, and Madhav Marathe. Calibrating a stochastic, agent-based model using quantile-based emulation. SIAM/ASA Journal on Uncertainty Quantification, 6(4):1685–1706, 2018.
Adiga, Aniruddha, Srinivasan Venkatramanan, Akhil Peddireddy, et al. "Evaluating the impact of international airline suspensions on COVID-19 direct importation risk." medRxiv (2020)
NSSAC. PatchSim: Code for simulating the metapopulation SEIR model. https://github.com/NSSAC/PatchSim (Accessed on 04/10/2020).
Virginia Department of Health. COVID-19 in Virginia. http://www.vdh.virginia.gov/coronavirus/ (Accessed on 04/10/2020)
Biocomplexity Institute. COVID-19 Surveillance Dashboard. https://nssac.bii.virginia.edu/covid-19/dashboard/
Google. COVID-19 community mobility reports. https://www.google.com/covid19/mobility/
Cuebiq: COVID-19 Mobility insights. https://www.cuebiq.com/visitation-insights-covid19/
Biocomplexity page for data and other resources related to COVID-19: https://covid19.biocomplexity.virginia.edu/
13-Apr-20 18

Questions?
13-Apr-20 19
Points of Contact
Bryan [email protected]
Srini [email protected]
Madhav [email protected]
Chris [email protected]
Biocomplexity COVID-19 Response Team
Aniruddha Adiga, Abhijin Adiga, Hannah Baek, Chris Barrett, Golda Barrow, Richard Beckman, Parantapa Bhattacharya, Andrei Bura, Jiangzhuo Chen, Clark Cucinell, Allan Dickerman, Stephen Eubank, Arindam Fadikar, Joshua Goldstein, Stefan Hoops, Sallie Keller, Ron Kenyon, Brian Klahn, Gizem Korkmaz, Vicki Lancaster, Bryan Lewis, Dustin Machi, Chunhong Mao, Achla Marathe, Madhav Marathe, Fanchao Meng, Henning Mortveit, Mark Orr, Przemyslaw Porebski, SS Ravi, Erin Raymond, Jose Bayoan Santiago Calderon, James Schlitt, Aaron Schroeder, Stephanie Shipp, Samarth Swarup, Alex Telionis, Srinivasan Venkatramanan, Anil Vullikanti, James Walke, Amanda Wilson, Dawen Xie