Embed Size (px)
Citation preview

Network Optimization ModelsChapter 9: Hillier and LiebermanDr. Hurley’s AGB 328 Course
Terms to KnowNodes, Arcs, Directed Arc, Undirected Arc,
Links, Directed Network, Undirected Network, Path, Directed Path, Undirected Path, Cycle, Connected, Connected Network, Tree, Spanning Tree, Arc Capacity, Supply Node, Demand Node, Transshipment Node, Sink, Source, Residual Network, Residual Capacity, Augmenting Path, Cut, Cut Value, Max-Flow Min-Cut Theorem, Feasible Solutions Property, Integer Solutions Property, Reverse Arc, Basic Arcs, Nonbasic Arcs
Terms to Know Cont.Spanning Tree Solution, Feasible
Spanning Tree, Fundamental Theorem for the Network Simplex Method, Program Evaluation and Review Technique (PERT), Critical Path Method (CPM), Immediate Successor, Immediate Predecessor, Project Network, Activity-on-Arc, Activity-on-Node, Project Duration, Critical Path, Crashing an Activity, Crashing the Project, Normal Point, Crash Point, Marginal Cost Analysis
The Shortest Path ProblemA shortest path problem usually has an
node known as the origin and a node known as the destination
The objective of this problem is to find the shortest path from the origin node to the destination node◦The shortest path could be measured in time,
distance, etc.Since this problem is a special case of
the linear programming problem, the simplex method could be used to solve it
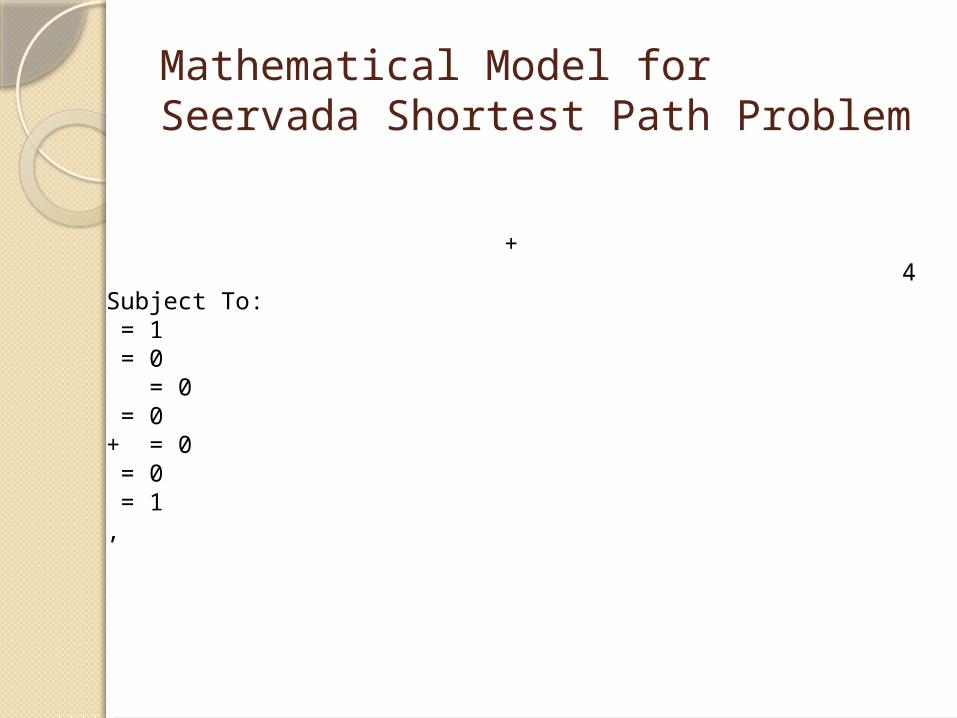
Mathematical Model for Seervada Shortest Path Problem
+4
Subject To: = 1 = 0 = 0 = 0+ = 0 = 0 = 1,
Seervada Spreadsheet ModelExamine in Class
Minimum Spanning Tree ProblemsThe goal of the minimum
spanning tree problem is to connect all the nodes either directly or indirectly at the lowest cost
The minimum spanning tree problem will have one less link the number of nodes in the optimal solution
The solution to the minimum spanning tree problem can be accomplished using the greedy algorithm
Greedy AlgorithmChoose any two nodes initially
and connect themIdentify the closest unconnected
node and then connect it◦Continue until all nodes have been
connected to the tree◦Ties can be broken arbitrarily
The Maximum Flow ProblemThe purpose of the maximum
flow problem is to get as much flow through the network based on the capacity constraints of the network◦This can be measured by the amount
leaving the source or by the amount entering the sink
It has a source where supply originates from and a sink which absorbs the supply that makes it through the network
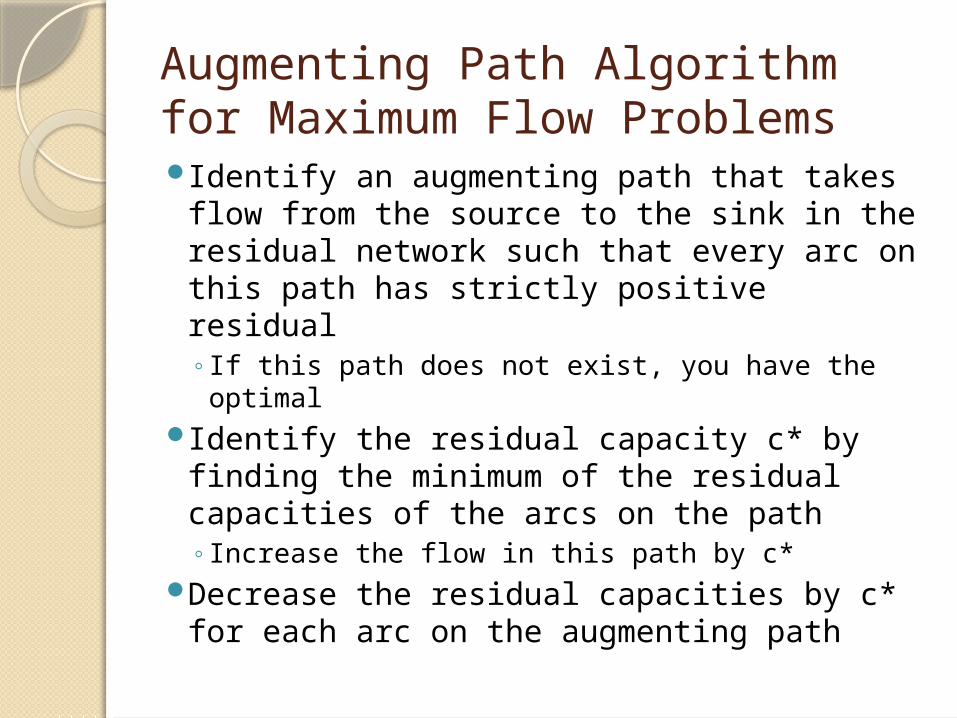
Augmenting Path Algorithm for Maximum Flow ProblemsIdentify an augmenting path that takes
flow from the source to the sink in the residual network such that every arc on this path has strictly positive residual◦If this path does not exist, you have the
optimalIdentify the residual capacity c* by
finding the minimum of the residual capacities of the arcs on the path◦Increase the flow in this path by c*
Decrease the residual capacities by c* for each arc on the augmenting path

Max-Flow Min-Cut Theorem
Another way of figuring out the maximum flow is by using the Max-Flow Min-Cut Theorem◦The theorem states that if you have a
single source and sink, then the maximum flow through the network is equal to the smallest cut value for all the cuts of the network The cut value is found by summing up all the
arcs which are directly affected by the cut of a network A cut is defined as a set of directed arcs that separate
the source from the sink

Mathematical Model for the Seervada Max Flow Problem

Excel Formulation of Seervada Max Flow ProblemExamined in Class
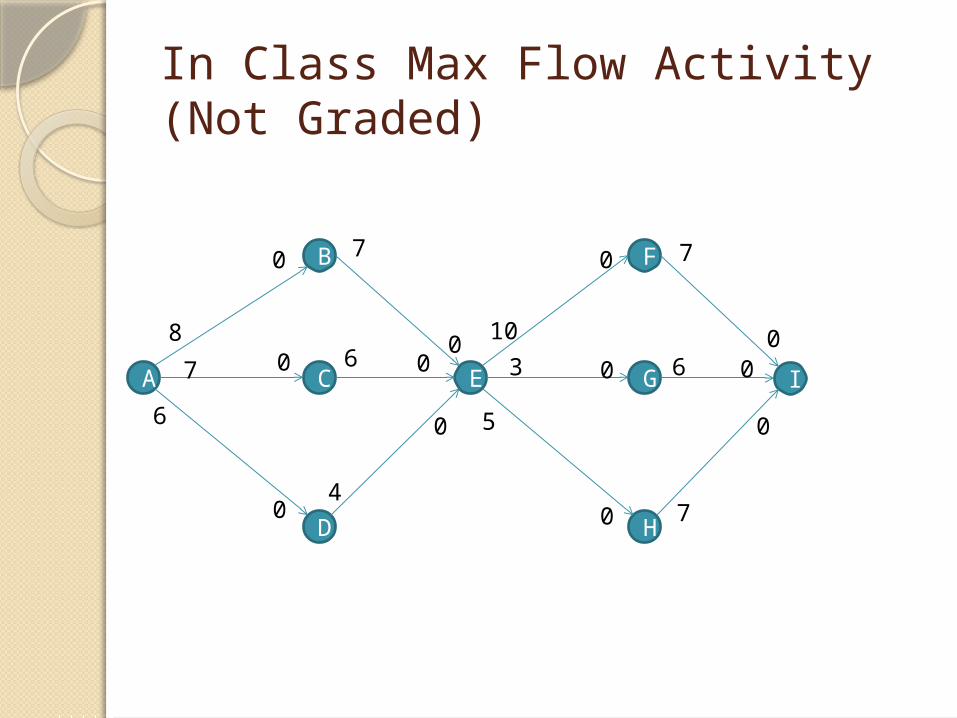
In Class Max Flow Activity (Not Graded)
A
D
C
B
E
H
G
F
I
8
7
6
7
106 3
5
7
6
47
0
0
0
0
00
0
0
0
00
0
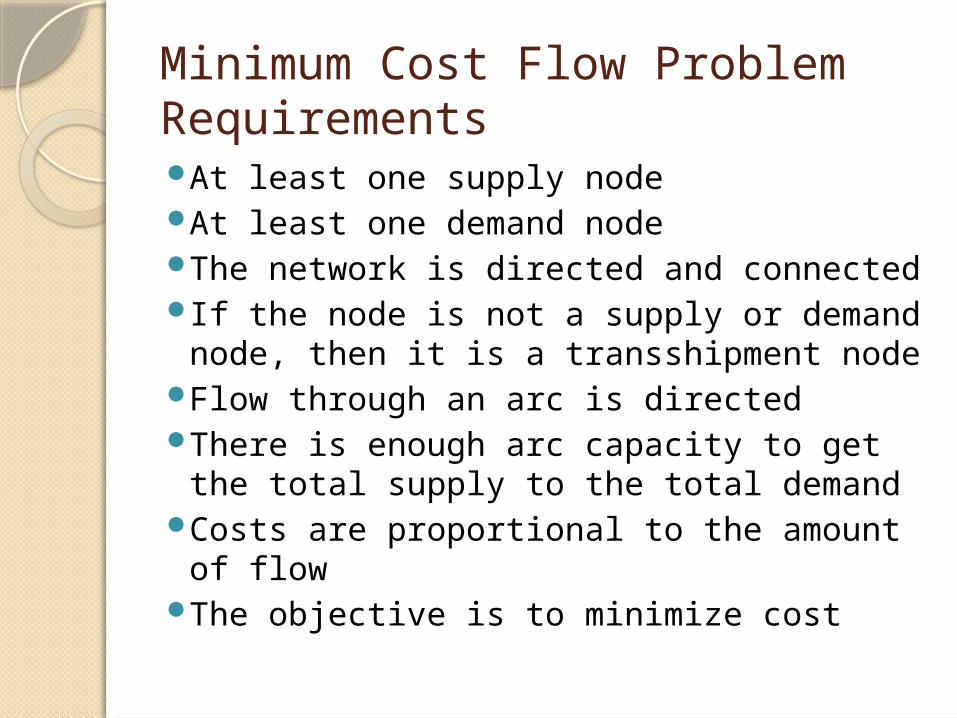
Minimum Cost Flow Problem RequirementsAt least one supply nodeAt least one demand nodeThe network is directed and connectedIf the node is not a supply or demand
node, then it is a transshipment nodeFlow through an arc is directedThere is enough arc capacity to get the
total supply to the total demandCosts are proportional to the amount of
flowThe objective is to minimize cost
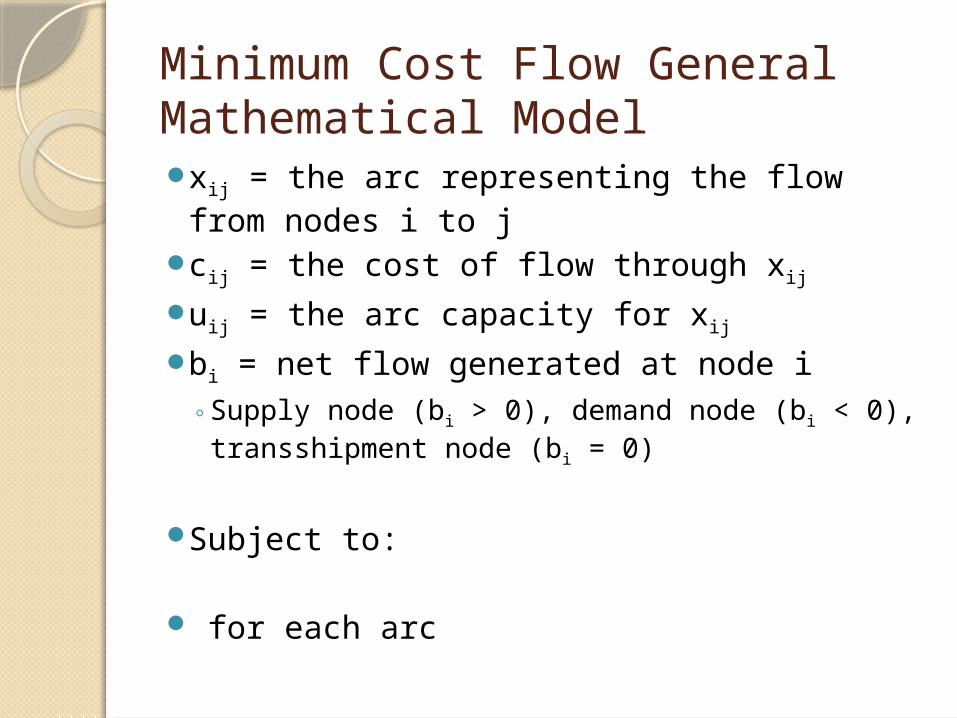
Minimum Cost Flow General Mathematical Modelxij = the arc representing the flow from
nodes i to jcij = the cost of flow through xij
uij = the arc capacity for xij
bi = net flow generated at node i ◦ Supply node (bi > 0), demand node (bi < 0),
transshipment node (bi = 0)
Subject to:
for each arc

Minimum Cost Flow Problem in ExcelWe will examine the Distribution
Unlimited Co. in class

What is Project ManagementProject management can be defined
as the coordination of activities with the potential use of many organizations, both internal and external to the business, in order to conduct a large scale project from beginning to end.
There are two management science techniques that are used for project management:◦ Program and Evaluation Review Technique
(PERT)◦ Critical Path Method (CPM)
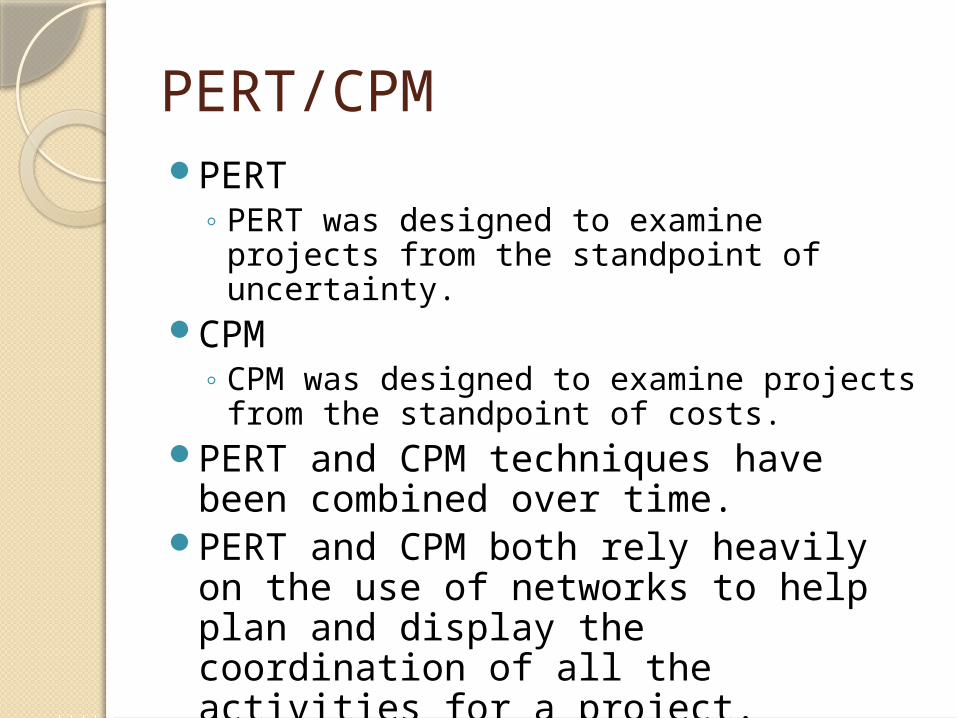
PERT/CPMPERT
◦ PERT was designed to examine projects from the standpoint of uncertainty.
CPM◦ CPM was designed to examine projects
from the standpoint of costs.PERT and CPM techniques have been
combined over time.PERT and CPM both rely heavily on the
use of networks to help plan and display the coordination of all the activities for a project.
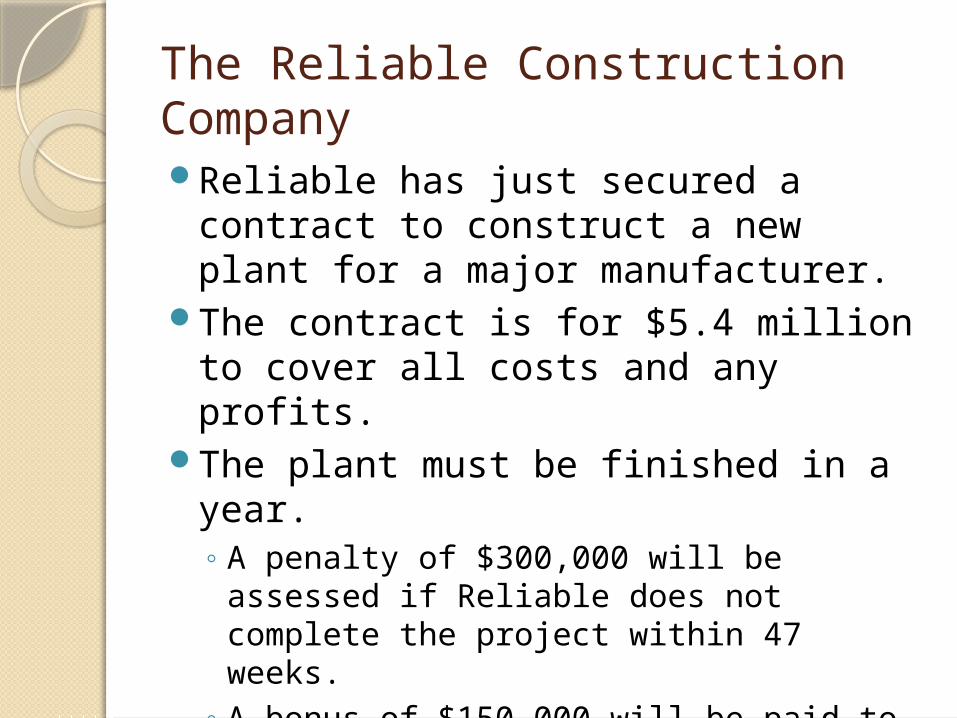
The Reliable Construction CompanyReliable has just secured a contract to
construct a new plant for a major manufacturer.
The contract is for $5.4 million to cover all costs and any profits.
The plant must be finished in a year.◦ A penalty of $300,000 will be assessed if
Reliable does not complete the project within 47 weeks.
◦ A bonus of $150,000 will be paid to Reliable if the plant is completed within 40 weeks.
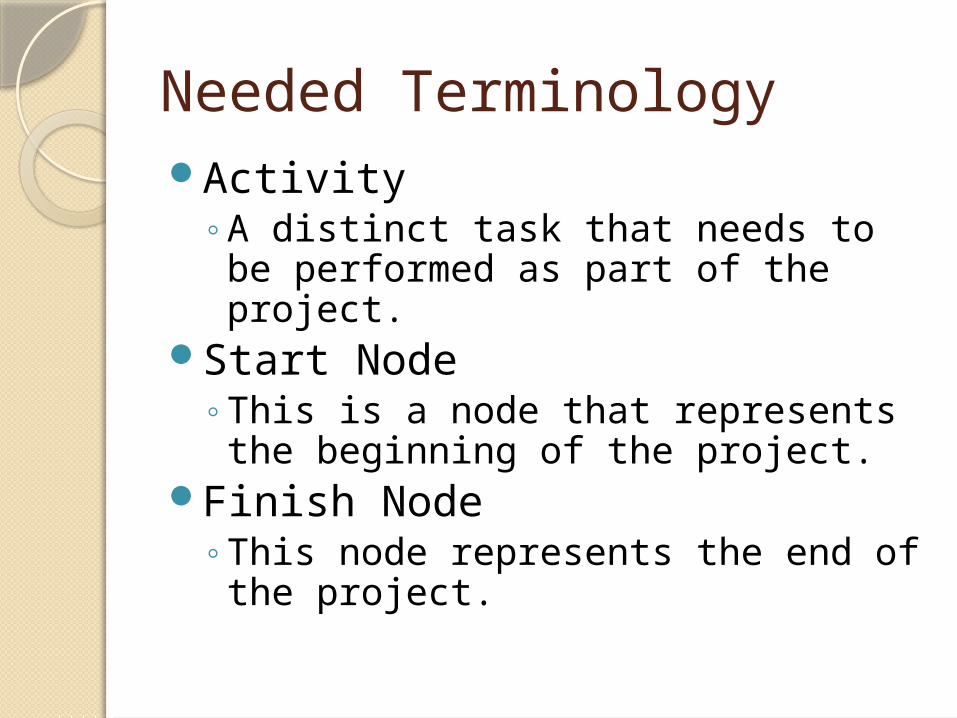
Needed TerminologyActivity
◦A distinct task that needs to be performed as part of the project.
Start Node◦This is a node that represents the
beginning of the project.Finish Node
◦This node represents the end of the project.
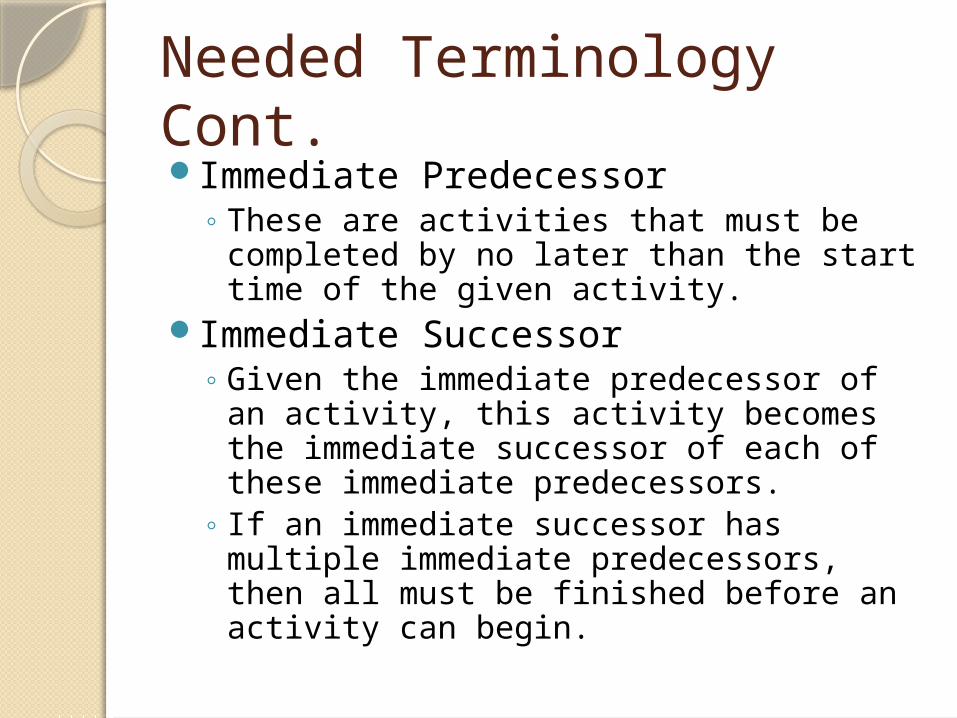
Needed Terminology Cont.Immediate Predecessor
◦ These are activities that must be completed by no later than the start time of the given activity.
Immediate Successor◦ Given the immediate predecessor of an
activity, this activity becomes the immediate successor of each of these immediate predecessors.
◦ If an immediate successor has multiple immediate predecessors, then all must be finished before an activity can begin.
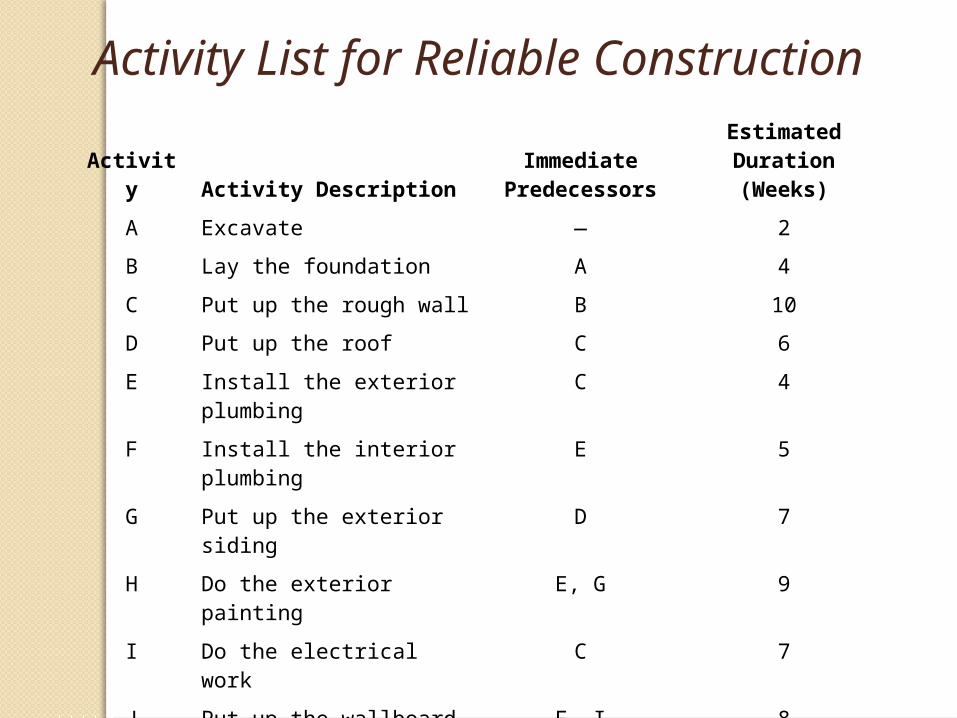
Activity List for Reliable Construction
Activity Activity DescriptionImmediate
PredecessorsEstimated
Duration (Weeks)
A Excavate — 2
B Lay the foundation A 4
C Put up the rough wall B 10
D Put up the roof C 6
E Install the exterior plumbing C 4
F Install the interior plumbing E 5
G Put up the exterior siding D 7
H Do the exterior painting E, G 9
I Do the electrical work C 7
J Put up the wallboard F, I 8
K Install the flooring J 4
L Do the interior painting J 5
M Install the exterior fixtures H 2
N Install the interior fixtures K, L 6
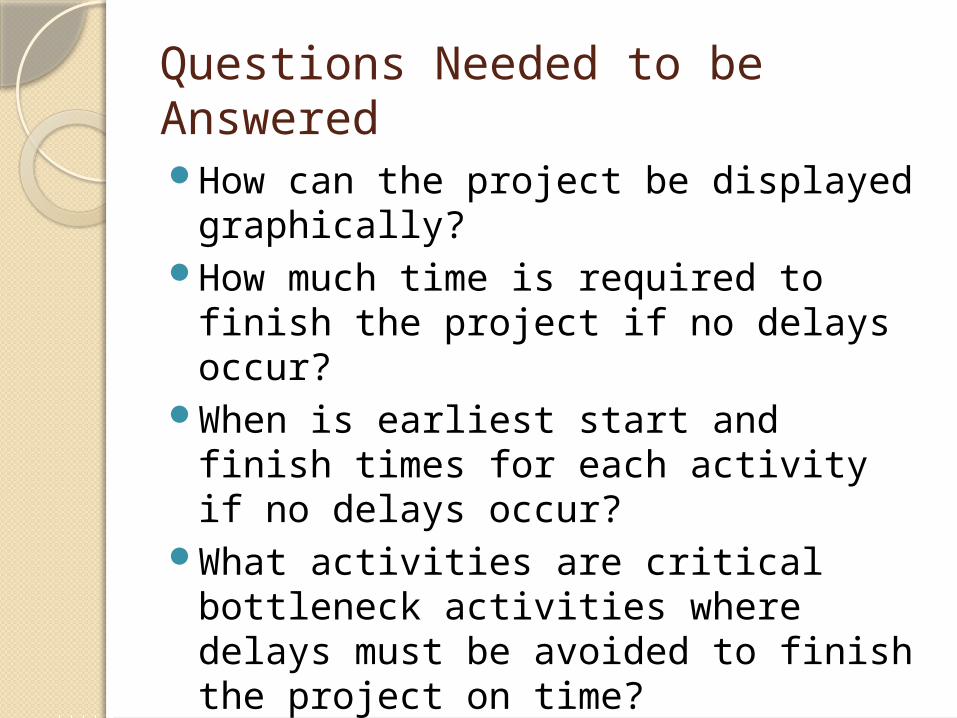
Questions Needed to be AnsweredHow can the project be displayed
graphically?How much time is required to finish
the project if no delays occur?When is earliest start and finish times
for each activity if no delays occur?What activities are critical bottleneck
activities where delays must be avoided to finish the project on time?
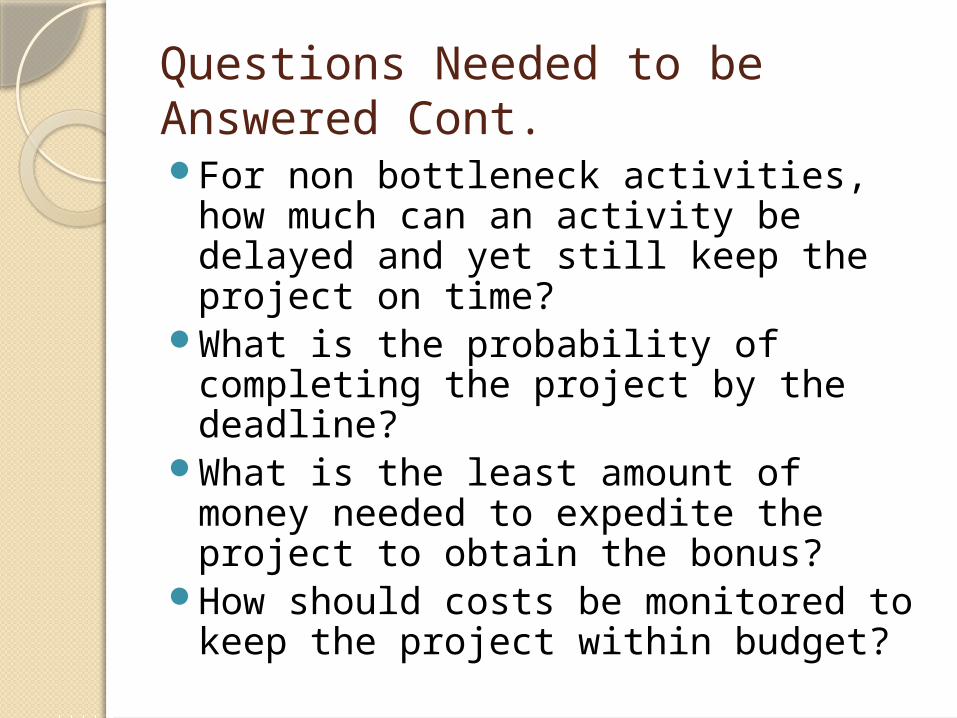
Questions Needed to be Answered Cont.For non bottleneck activities, how
much can an activity be delayed and yet still keep the project on time?
What is the probability of completing the project by the deadline?
What is the least amount of money needed to expedite the project to obtain the bonus?
How should costs be monitored to keep the project within budget?
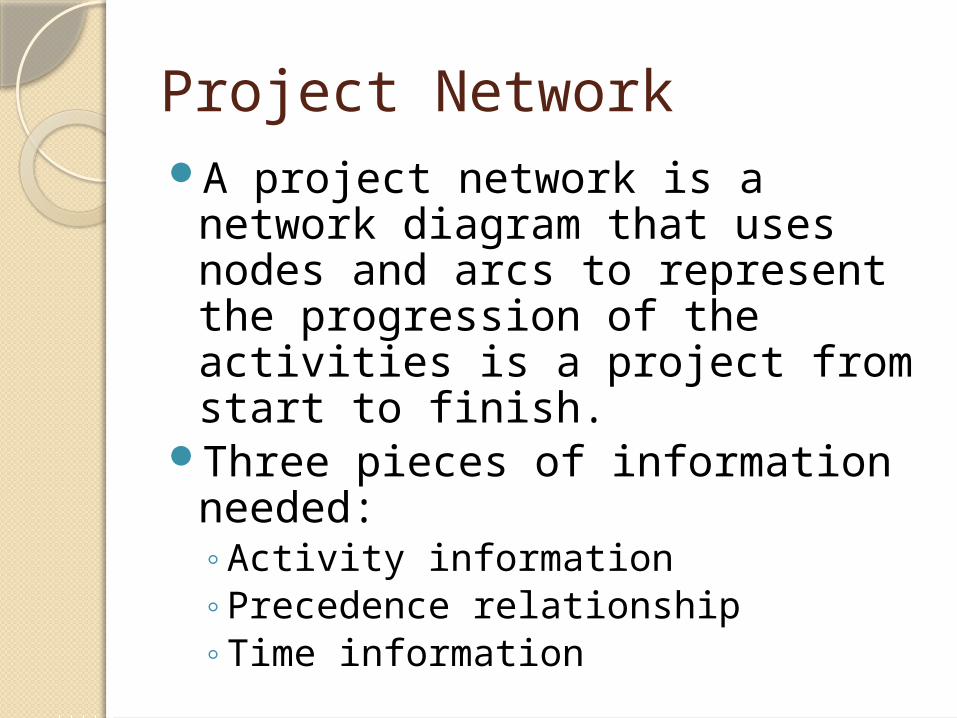
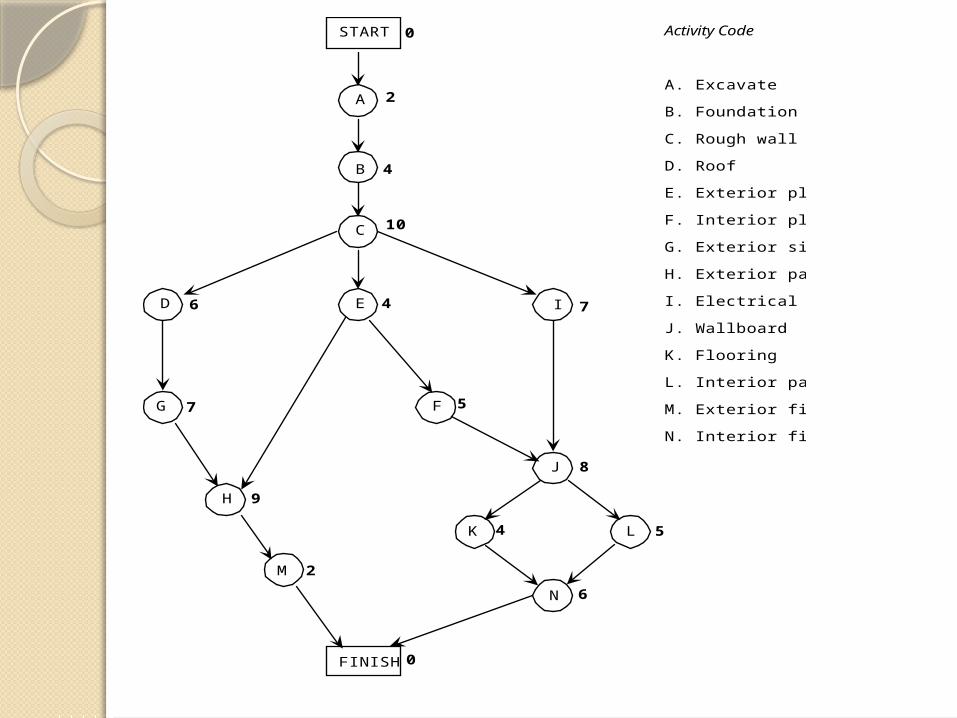
Project NetworkA project network is a network
diagram that uses nodes and arcs to represent the progression of the activities is a project from start to finish.
Three pieces of information needed:◦Activity information◦Precedence relationship◦Time information
Project Network Cont.Two types of project networks
◦Activity-on-Arc (AOA) On this diagram, the activity is
represented on an arc, while a node is used to separate an activity from its immediate predecessors.
◦Activity-on-Node (AON) On this diagram, the activity is
represented by the node, while the arc is used to showed the precedence relationship between the activities.
A
START
G
H
M
F
J
K L
N
Activity Code
A. Excavate
B. Foundation
C. Rough wall
D. Roof
E. Exterior plumbing
F. Interior plumbing
G. Exterior siding
H. Exterior painting
I. Electrical work
J. Wallboard
K. Flooring
L. Interior painting
M. Exterior fixtures
N. Interior fixtures
2
4
10
746
7
9
5
8
4 5
6
2
0
0FINISH
D IE
C
B
Scheduling Using PERT/CPMA path through a project network
is a route that follows a set of arcs from the start node to the finish node.
The length of a path is defined as the sum of the durations of the activities of the path.◦What are the paths and their
corresponding lengths for Reliable?
Critical PathThis is the path that has the
longest length through the project.
The shortest time that a project can conceivably be finished is the critical path.◦Why?

More TerminologyEarliest start time of an activity (ES)
◦ The time at which an activity will begin if there are no delays in a project.
Earliest finish time of an activity (EF)◦ The time at which an activity will finish if
there are no delays in a project.Latest start time of an activity (LS)
◦ The latest possible time that an activity can start without delaying the project.

More Terminology Cont.Latest finish time of an activity
(LF)◦The latest possible time that an
activity can be completed without delaying the project.
Forward pass◦The process of moving through a
project from start to finish to determine the earliest start and finish times for the activities in the project.
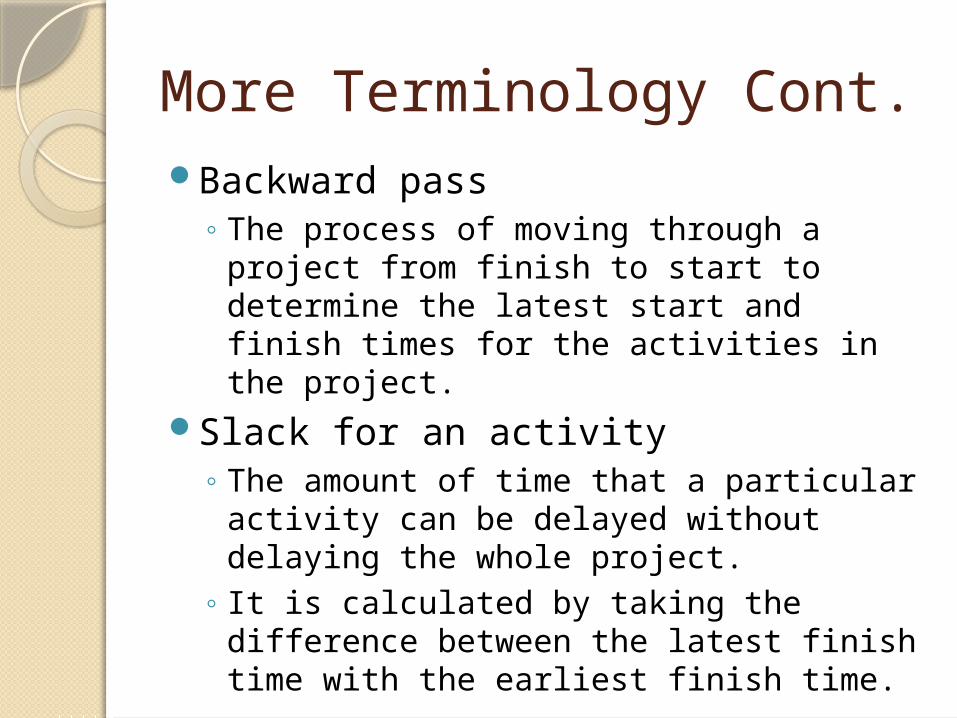
More Terminology Cont.Backward pass
◦ The process of moving through a project from finish to start to determine the latest start and finish times for the activities in the project.
Slack for an activity◦ The amount of time that a particular
activity can be delayed without delaying the whole project.
◦ It is calculated by taking the difference between the latest finish time with the earliest finish time.
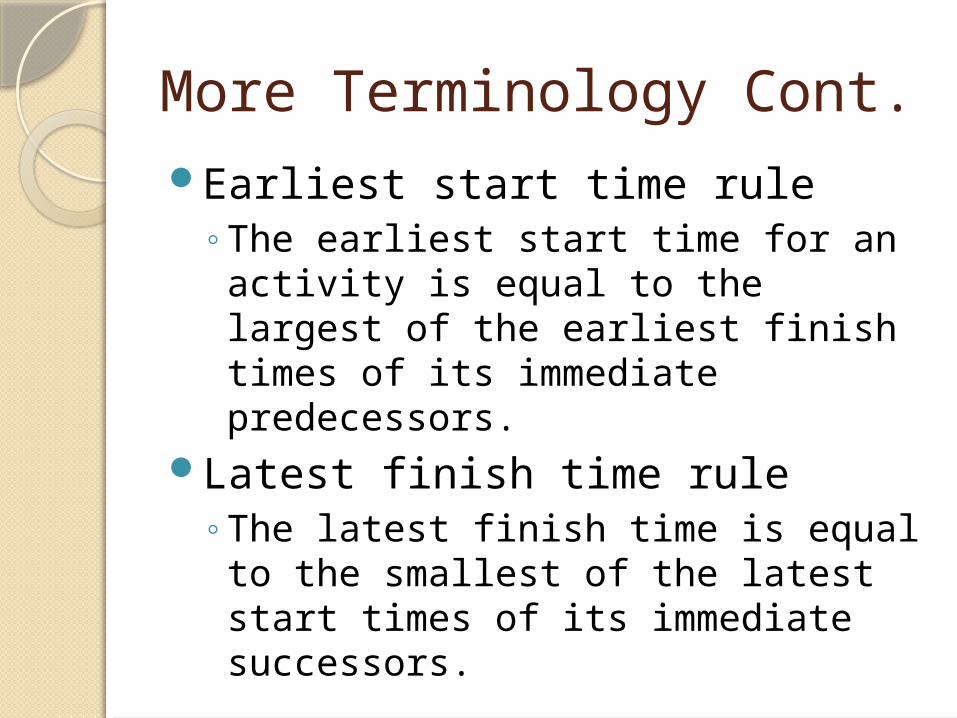
More Terminology Cont.Earliest start time rule
◦The earliest start time for an activity is equal to the largest of the earliest finish times of its immediate predecessors.
Latest finish time rule◦The latest finish time is equal to the
smallest of the latest start times of its immediate successors.
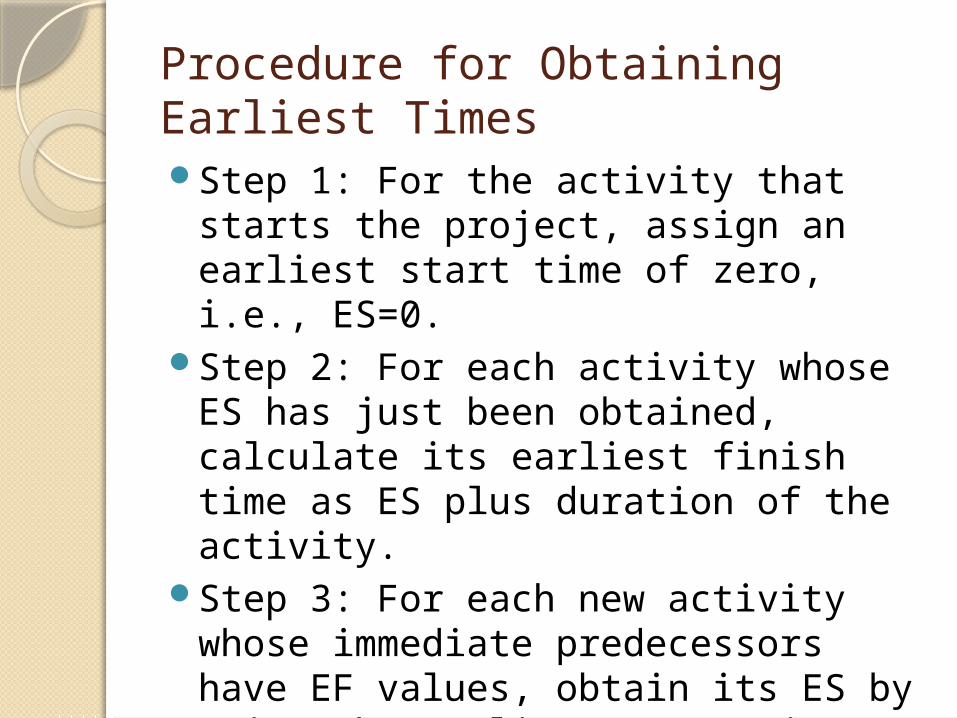
Procedure for Obtaining Earliest TimesStep 1: For the activity that starts the
project, assign an earliest start time of zero, i.e., ES=0.
Step 2: For each activity whose ES has just been obtained, calculate its earliest finish time as ES plus duration of the activity.
Step 3: For each new activity whose immediate predecessors have EF values, obtain its ES by using the earliest start time rule.
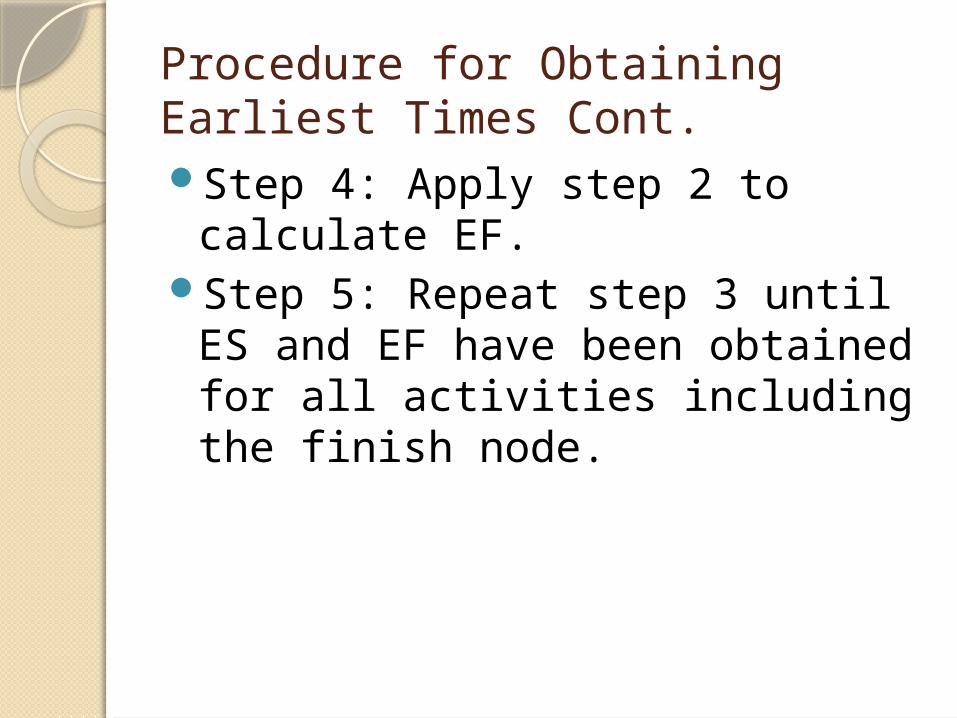
Procedure for Obtaining Earliest Times Cont.Step 4: Apply step 2 to calculate
EF.Step 5: Repeat step 3 until ES
and EF have been obtained for all activities including the finish node.
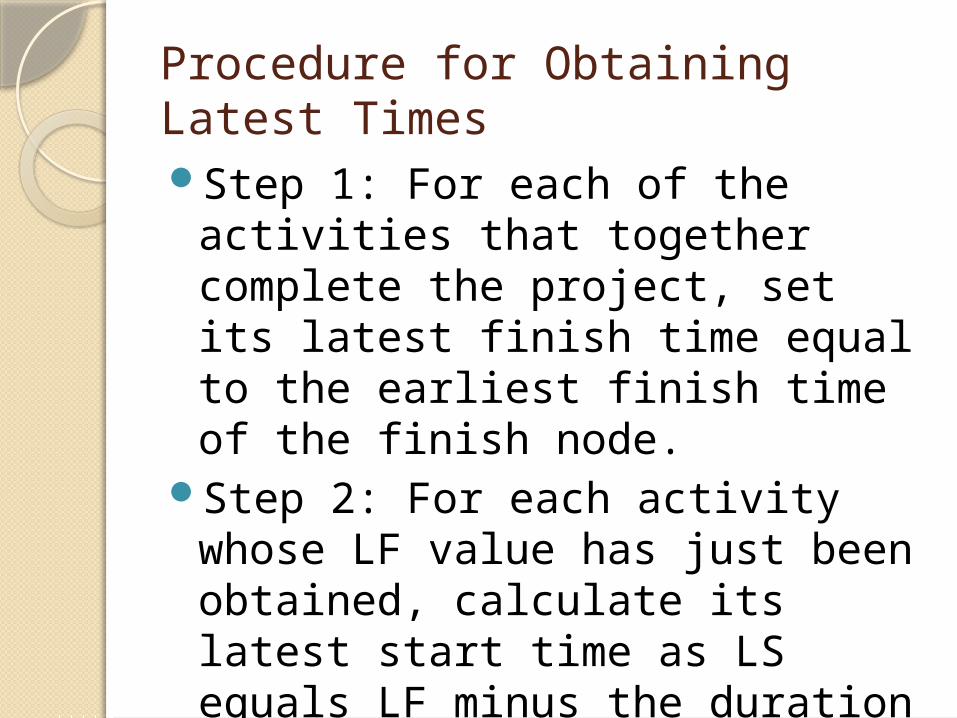
Procedure for Obtaining Latest TimesStep 1: For each of the activities
that together complete the project, set its latest finish time equal to the earliest finish time of the finish node.
Step 2: For each activity whose LF value has just been obtained, calculate its latest start time as LS equals LF minus the duration of the activity.
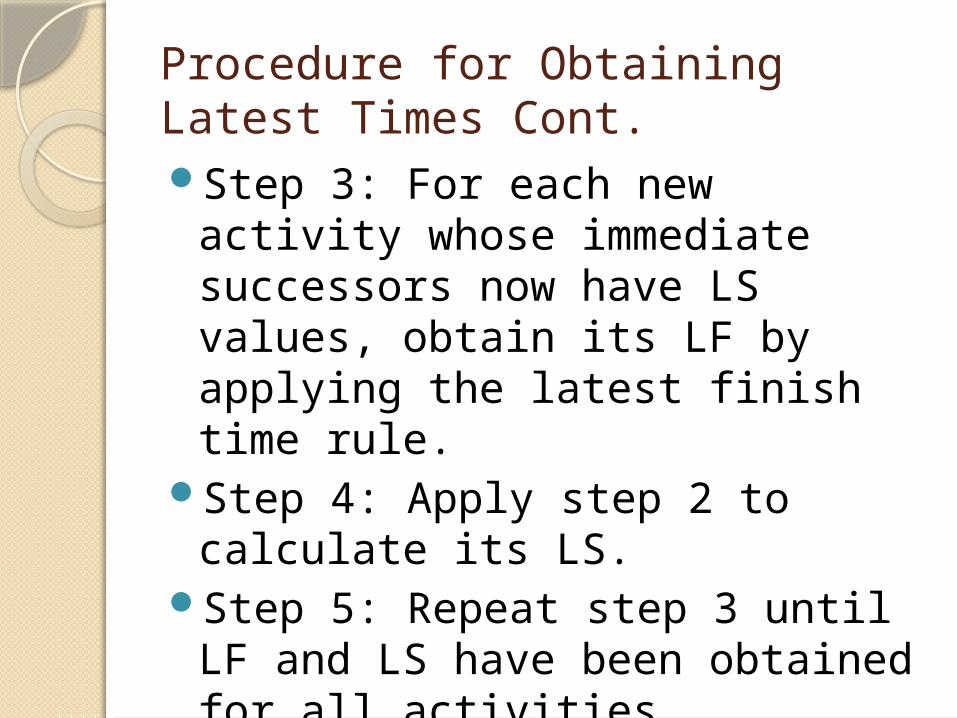
Procedure for Obtaining Latest Times Cont.Step 3: For each new activity
whose immediate successors now have LS values, obtain its LF by applying the latest finish time rule.
Step 4: Apply step 2 to calculate its LS.
Step 5: Repeat step 3 until LF and LS have been obtained for all activities.
A
START
G
H
M
F
J
FINISH
K L
N
D IE
C
B
2
4
10
746
7
9
5
8
4 5
6
2
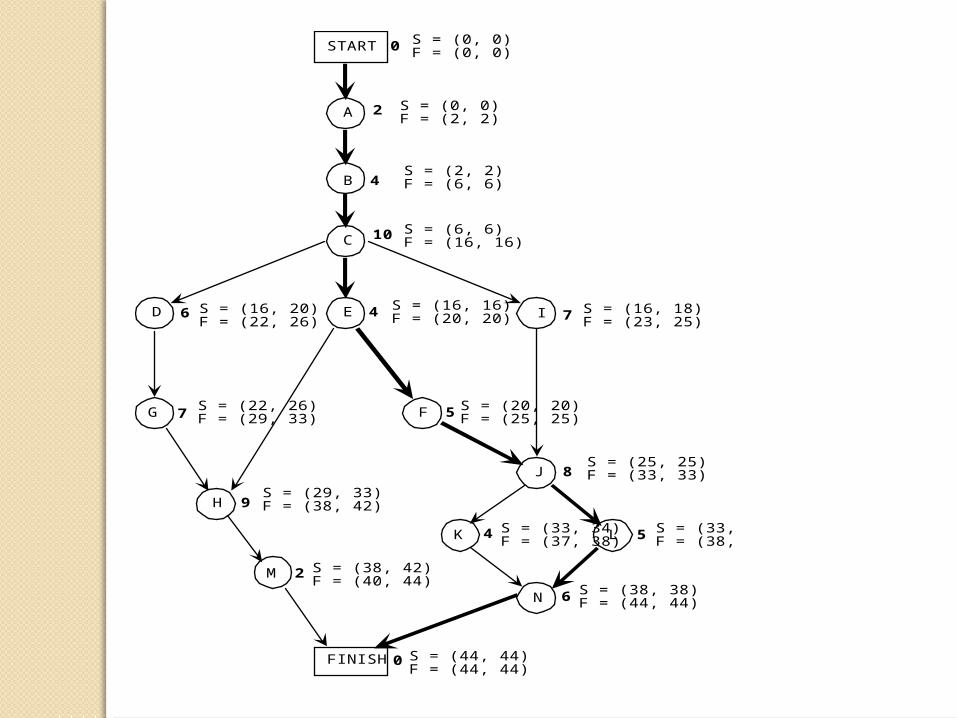
S = (0, 0) F = (2, 2)
S = (2, 2) F = (6, 6)
S = (16, 20) F = (22, 26)
S = (16, 16) F = (20, 20)
S = (16, 18) F = (23, 25)
S = (20, 20) F = (25, 25)
S = (22, 26) F = (29, 33)
S = (6, 6) F = (16, 16)
S = (0, 0) F = (0, 0)
S = (25, 25) F = (33, 33)
S = (33, 33) F = (38, 38)
S = (38, 38) F = (44, 44)
S = (33, 34) F = (37, 38)
S = (29, 33) F = (38, 42)
S = (38, 42) F = (40, 44)
S = (44, 44) F = (44, 44)
0
0
Ways of Finding the Critical PathExamine all the paths and find
the path with the maximum length.
Calculate the slack for an activity.◦If the slack is zero, it is on the critical
path.◦If the slack is positive, it is not on the
critical path.
Time-Cost Trade-OffsReliable had an incentive bonus
of $150,000 to finish the project in 40 weeks.◦Is it worth while for Reliable to
speed-up the project?
CrashingCrashing an activity refers to
taking on extra expenditures in order to reduce the duration of an activity below its expected value.
Crashing a project refers to crashing a number of activities to reduce the duration of the project.
CPM Method of Time-Cost Trade-OffsThis is a method concerned with
whether it is worthwhile to crash activities to reduce the anticipated duration of the project to a desired value.
This assumes that there is a trade-off between time and cost that has an inverse relationship.
More TerminologyNormal Point is the time and cost
of an activity when it is performed in a normal way.
Crash point show the time and cost when the activity is fully crashed.
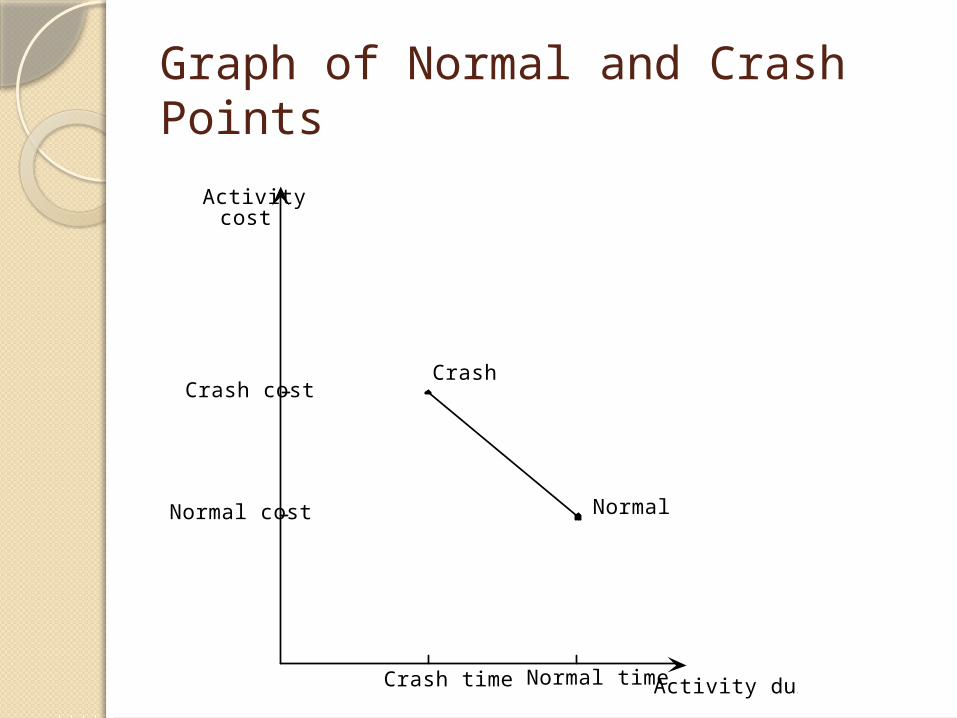
Graph of Normal and Crash Points
Activity duration
Activity cost
Crash cost
Normal cost Normal
Crash
Crash time Normal time
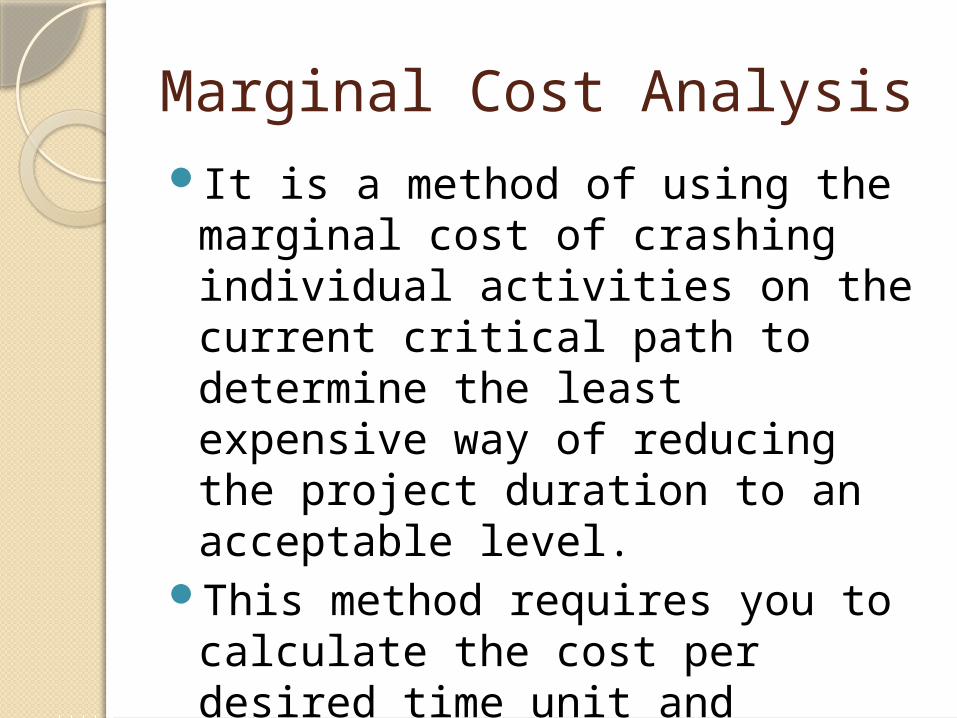
Marginal Cost AnalysisIt is a method of using the
marginal cost of crashing individual activities on the current critical path to determine the least expensive way of reducing the project duration to an acceptable level.
This method requires you to calculate the cost per desired time unit and compare each cost with the other costs.
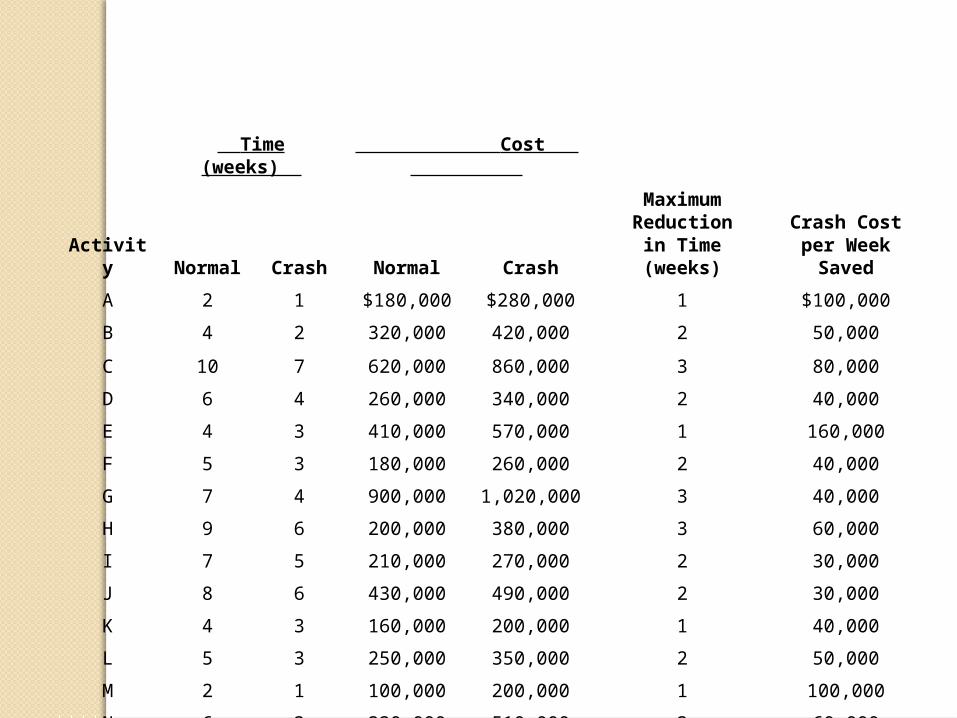
Time (weeks) Cost
MaximumReduction
in Time (weeks)
Crash Costper Week
SavedActivity Normal Crash Normal Crash
A 2 1 $180,000 $280,000 1 $100,000
B 4 2 320,000 420,000 2 50,000
C 10 7 620,000 860,000 3 80,000
D 6 4 260,000 340,000 2 40,000
E 4 3 410,000 570,000 1 160,000
F 5 3 180,000 260,000 2 40,000
G 7 4 900,000 1,020,000 3 40,000
H 9 6 200,000 380,000 3 60,000
I 7 5 210,000 270,000 2 30,000
J 8 6 430,000 490,000 2 30,000
K 4 3 160,000 200,000 1 40,000
L 5 3 250,000 350,000 2 50,000
M 2 1 100,000 200,000 1 100,000
N 6 3 330,000 510,000 3 60,000
Marginal Cost Analysis Cont.Once the marginal cost for
crashing each activity has been conducted, you next want to choose the crashing that has the smallest marginal cost.
Next, calculate the effect that the crash has on each path.◦Note: Crashing can potentially cause
another path to become a critical path.

Solving Crashing Problems Using LPThere are three decisions to be
made:◦The start time of each activity◦The reduction in each activity due to
crashing◦The finish time of the project
LP model will be examined in class.


![Transportation Problem - ULisboaweb.tecnico.ulisboa.pt/~mcasquilho/CD_Casquilho/TP_PrototypeAnd… · example in Hillier & Lieberman [2006, pp 330–331]4. EXAMPLE Table 3 — Production](https://img.dokumen.tips/doc/110x75/5ea9f3dd37d31403e3081443/transportation-problem-mcasquilhocdcasquilhotpprototypeand-example-in-hillier.jpg)


![On Post-Evaluation Analysis: Candle-Lighting and Surrogate ... · book, for example, Hillier and Lieberman [1986] offer the following perspective on post-evaluation analysis. They](https://img.dokumen.tips/doc/110x75/5ea9f4803c76e577400f5fea/on-post-evaluation-analysis-candle-lighting-and-surrogate-book-for-example.jpg)