Embed Size (px)
Citation preview
Network dynamics of tourism development in South Korea
Author
Kim, Young-Rae, Scott, Noel
Published
2017
Journal Title
Current Issues in Tourism
Version
Accepted Manuscript (AM)
DOI
https://doi.org/10.1080/13683500.2017.1318837
Copyright Statement
© 2017 Taylor & Francis (Routledge). This is an Accepted Manuscript of an article publishedby Taylor & Francis in Current Issues in Tourism on 02 May 2017, available online: http://www.tandfonline.com/10.1080/13683500.2017.1318837.
Downloaded from
http://hdl.handle.net/10072/344353
Griffith Research Online
https://research-repository.griffith.edu.au
1
Kim, Young-Rae & Scott, N. (2017 Accepted Online) Network dynamics of tourism
development: South Korea’s experience from 1945 to 1999 Current Issues in Tourism
NETWORK DYNAMICS OF TOURISM DEVELOPMENT IN SOUTH KOREA
Abstract
This study utilizes network analysis to trace the evolution of the organization of tourism
stakeholders during South Korea’s transition from a developing to a developed country
spanning the period 1945 to 1999. Tourism stakeholder institutional development in South
Korea is studied by examining changes within a network of organizations as their means and
objectives evolve. Data are drawn from news articles that deal with tourism and development
from 1945 to 1999, and coded into organizations, development related means and objectives.
Two-mode and a one-mode metric network analysis and correspondence analysis of coded
data were undertaken. The results show the dynamic nature of networks interacting among
organizations along with their means and objectives. Furthermore, this study states that the
“social embeddedness” of the tourism network became stronger over time, leading to further
development opportunities.
Keywords: Network dynamics, Evolution of tourism development, South Korea, Tourism in transition, Social embeddedness of tourism
2
Introduction
This study utilizes network analysis to trace the evolution of tourism stakeholder networks
during South Korea’s transition from a developing to a developed country. While prior
studies have provided an in-depth description and interpretation not only on patterns of the
foci and themes of tourism development (e.g, Burns, 1999; Hawkins & Mann, 2007; Jafari,
2001), and also on conditions and factors that determine these patterns (e.g., Clancy, 1999;
Dredge, 2001), they have struggled to capture the dynamics and complexity of networks of
tourism organizations which have evolved over long periods of time (Hawkins & Mann,
2007; Dredge, 2006; Milne & Ateljevic, 2001).
This study applies a network approach to fill this research gap. A network analysis
approach based on a relational perspective allows identification of the interaction of actors,
and the structural relationships between organizations associated with the tourism
development process and outcomes (Scott, Cooper, & Baggio, 2008). This study considers
key state-government organizations as nodes and their relationships with other actors as links,
to analyze changes in the State’s role. In addition, network analysis allows tourism
development related means and objectives to also be considered, allowing inferences about
cause and agents of network formation and transformation over time (Hay, 1998; Marsh &
Smith, 2000). Thus, tourism development here is represented by a dynamic network
consisting of key organizations with their means and objectives as nodes and their relations as
links over time.
South Korea has been selected for the case because it is only one of few nations that
transitioned from developing to developed status in a relatively short period as described as a
“century-skipping country” with industrialization, democratization, and a flourishing civic
3
society accomplished within half a century (Kwon, 2006). While most studies have focused
on only the development of tourism in developing countries, developed countries, or
transitional countries (e.g., Bramwell & Myer, 2007; Hall, 2004; Williams & Balàaz, 2000),
few studies have examined the role of tourism in countries ranging from developing to a
developed country status.
In the remainder of this paper, we first review evolution of tourism development studies,
and South Korea’s tourism development context. Next the network analysis approach is
discussed and adopted as the analytical viewpoint to describe and visualize the changes of the
role of stakeholders, particularly government sectors in association with their development
related means and objectives for the case of South Korea spanning from 1945 to 1999.
Consequently analysis and results follow with some implications.
Theoretical background
Evolution of Tourism Development
After the Second World War, the growth of mass tourism and its impact both on
developing and developed countries became a focal point for academic study with a variety
of theoretical approaches applied. In general, early studies that applied market-oriented
modernization and dependency theory debating the “good” and “bad” impacts of tourism
development have become complicated and diversified in foci and themes, as well as the
stakeholders and their structures under which they take place.
Burns (1999) has charted this trend from a “tourism first approach (economic growth)” to
a “development first approach with social, cultural and environmental benefits.” Extending
these studies, Jafari (2001) proposed four development platforms: “advocacy”, “cautionary,”
“adaptancy” and “knowledge-based.” An advocacy platform promotes tourism’s economic
4
value, while the cautionary platform is concerned with its negative impacts. The adaptancy
platform appeared as compromise between these two standpoints, and was followed by
knowledge-based approaches in order to better understand the complexities involved. In a
study of the role of an institutional entity (focusing on the World Bank) and changing
development themes and values, Hawkins & Mann (2007) considered that the World Bank
evolved from infrastructure-based development (Macro), and private, market-dependent
development (Disengagement) toward sustainable (Sustainability) and performance (Micro)
focused development.
These studies significantly contributed in identifying general trends and patterns of the
foci and themes in tourism development, however they showed a limit in understanding the
conditions under which specific development patterns occur, and what determines them. This
research gap has been filled by the introduction of (historical) institutional political
perspective. This literature uses concepts of path dependency and path creation which have
been applied to deal with the durability and diversity of tourism policy over time. This
approach adopts a broader perspective albeit in a specific social and state context and
emphasizes the role of “institutions” embedded in path dependent and path created historical
patterns (David, 1994). For example, Clancy (1999) investigated tourism development in
Mexico over the past 30 years, describing tension between state and market in the process of
tourism development. Dredge (2001) also reviewed the historical development of local
government in New South Wales, Australia from 1900s, with respect to tourism, and
discussed the influence of institutional history on how tourism is dealt with.
Evolutionary studies in tourism have provided not only general trends and patterns of the
foci and themes in tourism development, but also the specific conditions and factors that
5
determine these paths with an in-depth description and interpretation, drawing upon policy
papers and documents along with secondary statistics. However, despite its in-depth
description and interpretation of the patterns and paths, they are challenged by the complexity
and dynamics of the development process where diverse multiple actors and competing
values are interlinked, and interact ceaseless as they evolve (Hawkins & Mann 2007; Dredge,
2006; Milne & Ateljevic 2001). And also, most place-specific studies have focused on either
developing countries (e.g., Chhenag 2008; Dieke , 2000), developed countries (e.g., Williams
& Shaw 1991), or transitional states moving from a planned socialist economy to a free
market, such as those in Central and Eastern Europe (Bramwell & Myer 2007; Hall 2004;
Williams & Balàaz 2000). Thus, a dynamic evolutionary perspective, in particular focusing
on a country transitioning from developing to developed status, is rarely found.
Network Approach and Network Transformation
Network analysis is based on the structural view that actions are structured by patterns of
relationships between actors (Barabasi, 2002). In a social context, network analysis is the
result of the compromise between the functional stance, which explains that an act is decided
unilaterally by structure, and behaviour theory, which insists that meaning is created through
individual action. Structuration theory is the fruit of the efforts to establish a comprehensive
social model that offsets the weaknesses of the structural and behavioural positions. As
Giddens (1979) insisted in his structuration theory, structure is a medium as well as a result of
the act that is reproduced at the same time. This analysis is represented in Giddens’
discussion of the “duality of structure” (p. 69).
Network analysis provides an alternative theoretical frame to examine the interaction of
actors and structural relationships in the policy-making process and public-policy outcomes.
6
Traditionally, pluralism, elitism, corporatism, and the bureaucratic politics model of the
policy process have focused on actors, whether individual or in a group, but do not
adequately address the significance of institutional constraints or environmental factors that
affect new institutional approaches. Network analysis is a useful tool to depict attributes of
actors in the process of policy-making and their impacts on the policy outcome, as well as the
links and interdependence between the government sector and other societal actors (Klijn,
1997; Rhodes, 2008).
In tourism, the network approach has been widely applied to investigate the complex
structure between destinations and tourists associated with management and marketing
(Casanueva, Gallego & García-Sánchez, 2016). In particular, this approach has also been
proven as a useful tool to identify structure, interaction and power among stakeholders
associated with tourism development (Bramwell & Meyer, 2007; Kimbu & Ngoasong, 2013:
Pforr, 2006). For example, Pforr (2006) analyzed stakeholders’ interacting and dynamic
relationships in the formulation process of a particular tourism master plan in the northern
territorial area in Australia. Similarly, Kimbu & Ngoasong (2013) explored the destination
stakeholders in formulating and implementing tourism policy in Cameroon, suggesting a
centrally coordinated but decentralized tourism network that reaches out to all representative
stakeholders when formulating and implementing tourism policies.
However, these studies typically are a static snapshot of a certain time with exception of a
study in the former East Germany by Bramwell and Myer (2007) who used a policy network
approach to analyze changes the role of stakeholders from a former East Germany island over
10-years. It should be noted that a network has flexible and adaptable characteristics allowing
co-evolution among nodes rather than stable structural relations (Hay, 1998; Marsh & Smith,
7
2000; Scott, Cooper, & Baggio, 2008), but is often limited in explaining change because of
the complexity involved (Dredge, 2006). Methodologically, this is because of the resources,
stakeholders, and the power applied in the policy process are hard to quantify (Marin &
Mayntz, 1991), resulting in difficulties of data collection. Hence, though a network may be
described, how and why it evolves and transforms are not easily explained.
In spite of difficulties of collecting data on complex relationships between organizations,
network theory remains useful for investigating dynamic interactions between act and
structure, and recognizes actors as the active players within a structured network. Hay (1998)
argues that individuals seeking to realize their objectives make a strategic assessment of the
context in which they find themselves. However, that context is not fixed. Individuals learn
from their actions and adjust their strategies. The context is changed by their actions and so
individuals have to adjust to different contexts (Rhodes, 2008). Gardiner & Scott (2014)
argue, in the case of Gold Coast in Australia, that an individual’s skill and knowledge in
strategic assessment adjusting to the context is important to build and maintain a successful
network. Recent theory of network resource also confirms that each organization’s skills and
knowledge plays a key role in conditioning mobilizing network resources to change and
sustain network (Casanueva, Gallego, Castro & Sancho, 2014).
South Korea Context
South Korea, like other newly independent countries after the Second World War, had
weak human resources, institutions, and financial capacity for economic development. Even
worse, South Korea became embroiled in the Inter-Korea War in 1950, only a few years after
independence and after suffering more than 40 years of Japanese colonial occupation. Indeed,
after the war in 1953, South Korea was a “vulnerable nation” (Woo-Cumings, 1999: 260).
8
Despite its lack of financial capacity, less competitive endowed factors, and small domestic
market size, the country undertook outward (export) oriented economic development policies.
Tourism in South Korea was recognized as a vehicle for national economic development
enabling to contribute to export revenue and to efficiently utilize natural and cultural
resources. During the 1960s and 1970s, the state undertook a number of interventions. To
secure funding, the government on one hand tried to attract international aid, mostly from the
USA, and on the other nationalized private banks and used them to provide capital (Kwon,
2006: 158). Key basic laws and regulations (Framework Act on Tourism, Tourism Promotion
Act) were introduced, and the first tourism department under the control of the Ministry of
Transportation was created. In the 1960s, the government acquired and operated the Korea
Airline Corporation, a casino, and hotels, a travel agency, and a taxi company. These were
later sold to private companies through the Korea Tourism Corporation which was
established in 1962. In 1970s, the government jointly funded, constructed, and operated a
number of international tourist resorts (in Jeju Island, Gyeonggju, and Sorak Mountain) with
the private sector. In addition, the government hosted international tourism expositions and
conventions such as Pacific Asia Travel Association (PATA), American Society of Travel
Agents (ASTA), as well as the Asian Games in 1986 and Olympic Games in 1988 (KTO,
2002: 73-97). The outcome was dramatic. The number of international tourists surpassed one
million in 1978 and ten million in 2012, with GNP per capita increasing from $1,500 in 1978
to $22,500 in 2011 in real terms. South Korea became a member of the OECD in 1996.
To achieve this outcome, the South Korean government strategically and aggressively
intervened to achieve economic growth while respecting the principles of private ownership
and the market economy (Johnson, 1982; Woo-Cumings, 1999). A state-government has the
9
autonomy to plan for the long-term national interest without having its policies disrupted by
short-term corporate or working-class interests. Its actions were that of a “political
entrepreneur” (Kwon, 2006: 122), although some describe it as “Korea Inc” (Mason et al.,
1980: 485). Later as it introduced social and cultural pluralism, South Korea became more
‘soft’ and ‘flexible’ requiring different roles and responsibilities (Weiss & Hobson, 1995).
Method and data
Analytical Frame and Research Questions
The purpose of this study is to investigate the evolution in the organization of state-driven
tourism development in South Korea as it transitioned from a developing to a developed
status. For this, this study focus on the structural changes of the sharing power of
stakeholders among public, private and other sectors such as non-profit organizations along
with the changes of development related means and objectives that they have utilized. The
relations between market and government have been a highlight in the study of tourism
development (e.g., Bramwell & Myer 2007; Clancy, 1999; Hall 2004; Kimbu & Ngoasong,
2013; : Marsh & Smith, 2000; Pforr, 2006; Williams & Balàaz 2000), plus the means and
objectives has been a key frame in explaining process and outcome of development (Dunn,
1971) guiding strategic assessment and direction of development. Three research questions
are addressed:
Firstly, how have the structural characteristics of the tourism development network
changed? Here structural characteristics result from interaction among organizations, and
refer to the looseness or tightness of links, and if a development network is centralized or
decentralized.
10
Secondly, how did the organizations’ relative positions and roles in the network change
through the process of development? In particular, what role did the South Korea state-
government play in the process of development?
Thirdly, what objectives and means have been used and shared by organizations in the
tourism development network? Were economic-centered means and values key drivers of
development as existing tourism development paths indicate? Are these values shifting
toward more sustainable development paradigm?
Analytical Methods
For the first research question, network structure was characterized using network size,
density, and centralization (Scott, 1991). Network density refers to the proportion of number
of direct link (k) in a network relative to the total number possible links. Density ranges from
zero to one. Zero density means that all nodes are unconnected while a density of one means
that every node is connected to every other node. This is common measure of how a network
is densely or loosely connectedi. Centralization is a measure of the structure of the network as
a whole and whether it has a center around which other nodes are arranged (Freeman, 1979).
A centralized network will have many of its links dispersed around one or a few nodes, while
a decentralized network is one in which there is little variation among the numbers of links
each node possesses. The centralization of a network is calculated by dividing the proportion
of observed level of the centralization by the maximum level of centralization of a networkii.
For the second research question, power centrality was used to find the relative importance
or influence of actors (individual organizations). This assigns relative scores to all nodes in
the network based on the concept that connections to high-scoring nodes contribute more to
11
the score of the node in question than equal connections to low-scoring nodes (Bonacich,
1987). For example, one is likely to be more influential if they are connected to other centers
-- because they can quickly reach a lot of other actors through powerful actorsiii.
Thirdly, changes in focus of development (means and objectives) were examined using
two-mode network analysis and correspondence analysis. The means of development
includes both physical and non-physical resources that were utilized for tourism development,
from construction of physical infrastructure and facilities to marketing and policy making. A
two-mode network analysis that describes links between two sets of nodes at two different
levels of analysis was used to examine relationships between organizations and development
means. Furthermore, correspondence analysis was used to analyze the relationships between
organizations and objectives. In two-mode analysis, the similarity of the actors in terms of
objectives and vice versa can be examined. Correspondence analysis measures the level of
correspondence between rows and columns containing categorical variables, with entries in
the table representing the distances between individual rows and/or columns in a two-
dimensional space (Greenacre, 2007). This allows analysis of the variances among actors and
events simultaneously, and mapping of the patterns of co-presence of both in the joint
corresponding space. Thus, matching organizations to objectives enables an understanding of
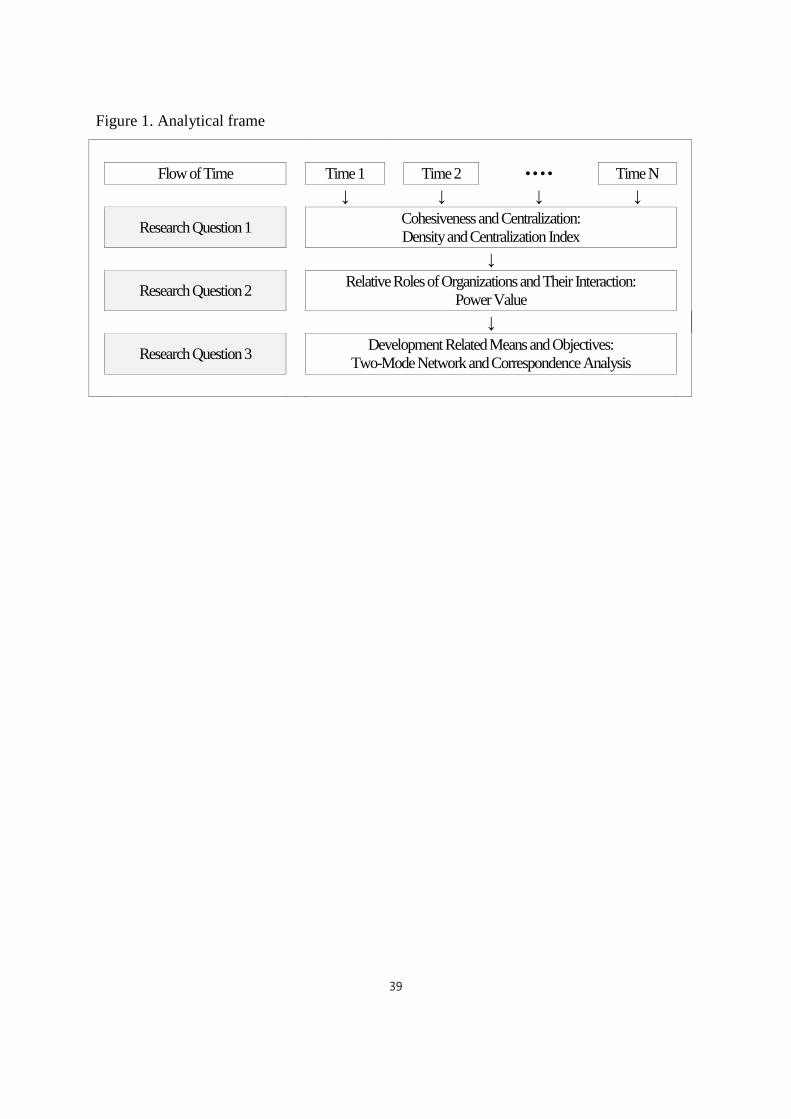
how actors are associated and by what objectives. Based on the research questions and
methods, the following analytical frame is proposed in Figure 1:
********
FIGURE 1. ANALYTICAL FRAME
ABOUT HERE
12
********
Data Sources
Different data sources are available for use in a network analysis; historical documents
such as policy papers, documentary films and secondary statistics (Dredge, 2006); direct data
from interviews (Kimbu & Ngoasong, 2013) or structured questionnaires conducted with
relevant stakeholders (Pforr, 2006); or mixed of these (Bramwell & Meyer, 2007). For this
study, data was collected from a daily newspaper published from 1945 to 1999 in South
Korea. Newspapers as data sources have advantages over other data sources specifically for
this study. First of all, data from direct interviews or structured surveys with stakeholders are
limited in their ability to capture evolution over long periods. Bramwell & Meyer (2007)
applied retrospective in-depth interview with key stakeholders over a 10-year period, but the
50-year period examined here is too long to rely on respondents’ memories. Secondly, news
articles fit the purpose of this study better than policy papers, and other historical documents.
The purpose of the study is to examine the significant dynamic characteristics of the state-
government organization across the development process rather than interpretation of these
through analysis of policy papers and historical documents. News articles are intended to
describe efficiently the “who, how, and why” of a story in a short passage which allows data
to be conveniently obtained (Paranyushkin, 2010). This argument becomes more persuasive
considering the long study period. In addition, news articles are a communication channel
where policy makers and stakeholders interact for policy-making (Robert, 1997). In this way
news stories better reflect not only objective facts but also social concerns among different
stakeholders, while policy papers representing government perspective of development are
13
limited and often one-sided.
To select a suitable newspaper, firstly, because of the long period of the time examined,
the stories should be available in an electronic archive service. Secondly, the numbers of
newspapers and articles has increased recently which influences the number of nodes and
links, and hence the density and centralization measures. To avoid this only newspapers
published continuously from 1945 to 1999 were considered. Thirdly, the source should be
significant in terms of volume of papers sold or market share. An examination of the
newspaper archive provided by Korea’s biggest portal site (www.naver.com) which accounts
for 70% of internet searches as of 2012 was conducted. The Donga-Daily Newspaper was
selected as it was the only one published continuously from 1945 to 1999. The Donga-Daily
Newspaper has the third largest distribution of all newspapers in South Korea. Finally, it
should be noted that because articles from the archive service were only available up to 1999,
the study period was set to be from 1945 to 1999.
Data Collection
Data was found by using two key words to search the electronic archive: “tourism” and
“development”. The resulting news articles were analyzed to identify organizations, resources,
and development objectives. For example, one news article in 1960s discussed that Ministry
of Transportation (organization) had designated a tourist district (means) to attract foreign
tourists (objectives). An initial search identified relevant articles as well as some without
relevance to this study: for example some dealt with mainly urban, rural, coastal development
issues and events, where tourism was incidental. To address this, articles were included if the
title contained both tourism and development. Furthermore, articles with tourism-related
development as their key topic, or other equivalent development issues and events, were
14
prioritized. It should be noted that occurrences of events in news articles may not represent
exactly the interactions among actors and resources because it may reflect potentiality in
terms of social concerns. To minimize this effect, we excluded editorials which are usually
subjective opinions of events. As a result analysis of the newspaper articles selected enables
the general trends and patterns of tourism network development to be determined as required
by this study.
Then, it was also necessary to divide the study period into intervals to better analyze
changes in the development network. The period was broken down into five intervals: 1945-
1960 (1950s), 1961-1970 (1960s), 1971-1980 (1970s), 1981-1990 (1980s), and 1991-1999
(1990s). Three graduate students trained in the study purpose and the data collection scheme,
gathered the data focusing on who (organizations), what (resources), and why (development
values or objectives). This took approximately three months, from September to November
2013, and identified 1,430 news articles covering the study period and allowing lists of
organizations, resources, and development values and objectives to be determined.
Expert Review
To reduce data collection bias, an in-depth focus group review session with three experts,
two university professors and a senior researcher from a government sponsored research
institute who each have more than 10-year experience in tourism development, was
conducted to check if the organizations, means, and objectives identified accurately reflected
the content of the article. In most cases organizations were relatively clear, but resources and
objectives were sometimes unclear or appeared more than twice in one article. The experts
were asked to exclude irrelevant news articles and select the primary means and objectives
when multiple were evident, and when they were unclear, to clarify them as much as they
15
could by discussing the context of the news article, and if necessary, by looking at related
secondary literature. It is important to note that, development objectives were only identified
for public sector organizations because articles about the private sector did not identify firm
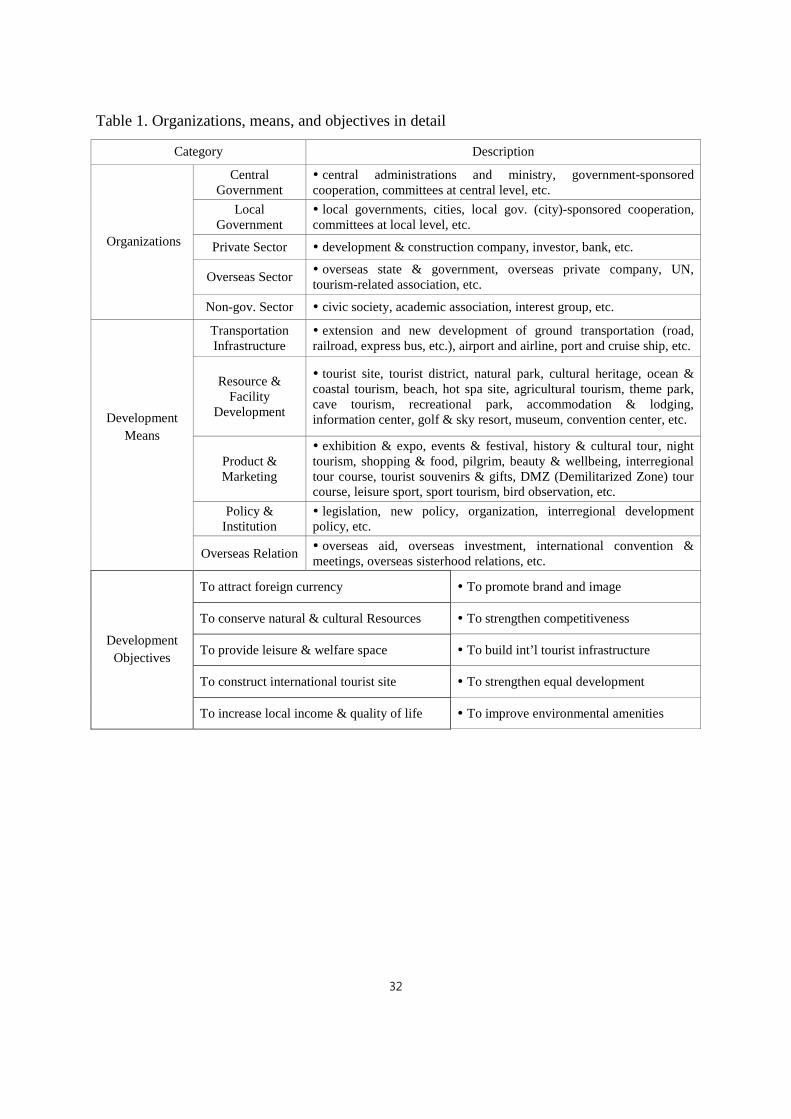
objectives. Through this process, 141 out of 1,430 articles were excluded, resulting in 1,389
news articles, and their associated organizations, resources, and objectives as shown in Table
1.
********
TABLE 1. ORGANIZATIONS, MEANS, AND OBJECTIVES IN DETAIL
ABOUT HERE
********
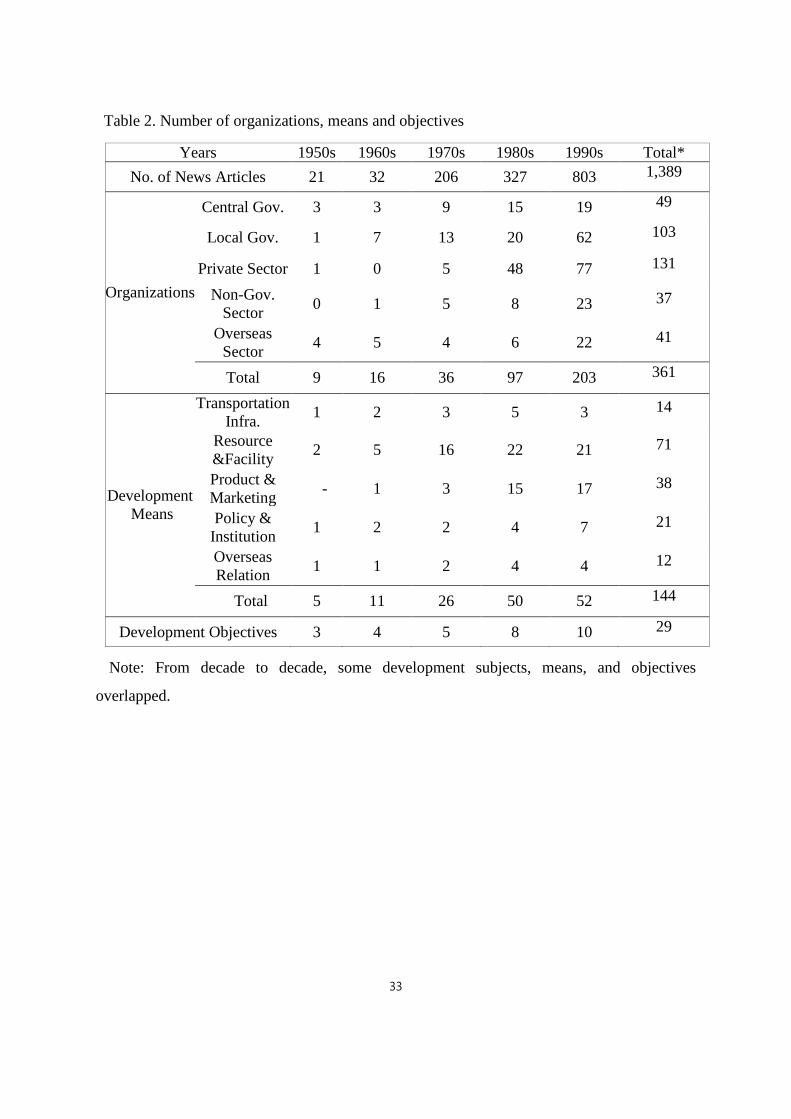
Table 2 shows the number of organizations, means, and objectives over the study period
that was drawn from a total of 1,389 news articles. As we see in table 2, the number of
organizations, means and objectives grows as time passes, but this simple pattern does not
show the interactions and complicated relations among the subjects, means, and objectives.
********
TABLE 2. NUMBER OF ORGANIZATIONS, MEANS, AND OBJECTIVES ABOUT
HERE
********
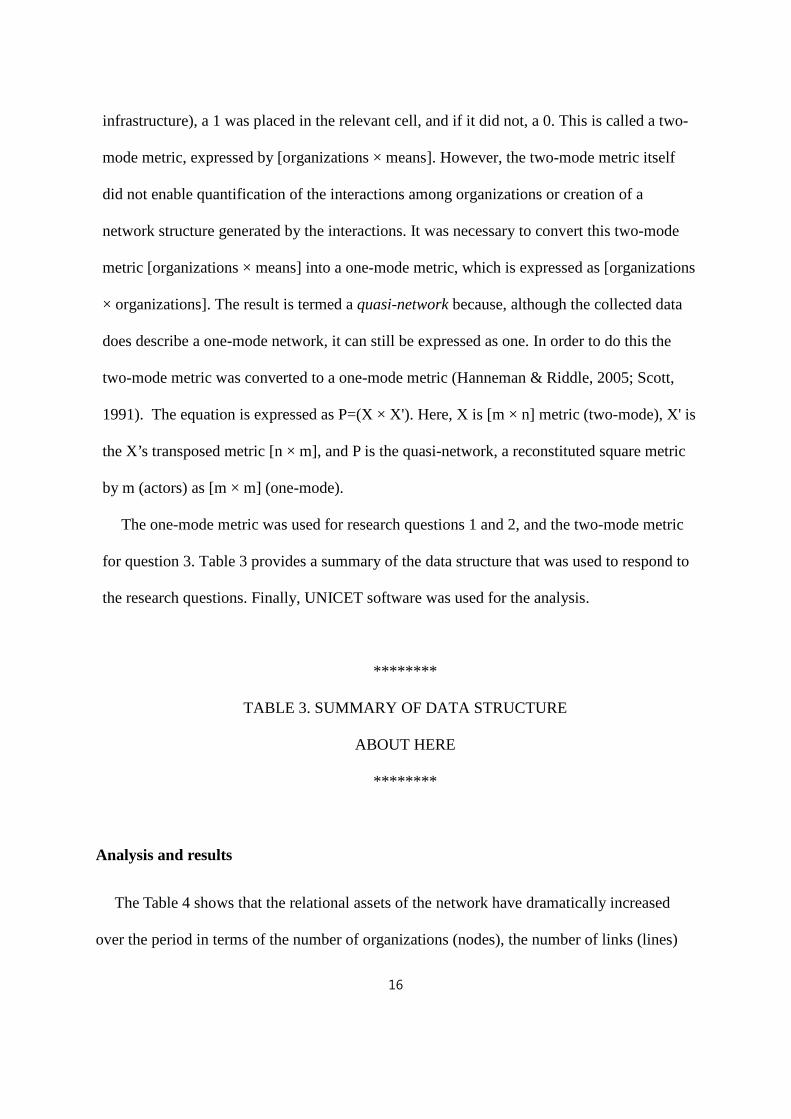
Data Structure: The Two-Mode Metric and Quasi-Network
In order to conduct the network analysis, a matrix was constructed consisting of the
organizations in rows and the means in columns. If a newspaper article indicated a
development subject (organization) used a particular type of resources (built transport
16
infrastructure), a 1 was placed in the relevant cell, and if it did not, a 0. This is called a two-
mode metric, expressed by [organizations × means]. However, the two-mode metric itself
did not enable quantification of the interactions among organizations or creation of a
network structure generated by the interactions. It was necessary to convert this two-mode
metric [organizations × means] into a one-mode metric, which is expressed as [organizations
× organizations]. The result is termed a quasi-network because, although the collected data
does describe a one-mode network, it can still be expressed as one. In order to do this the
two-mode metric was converted to a one-mode metric (Hanneman & Riddle, 2005; Scott,
1991). The equation is expressed as P=(X × X'). Here, X is [m × n] metric (two-mode), X' is
the X’s transposed metric [n × m], and P is the quasi-network, a reconstituted square metric
by m (actors) as [m × m] (one-mode).
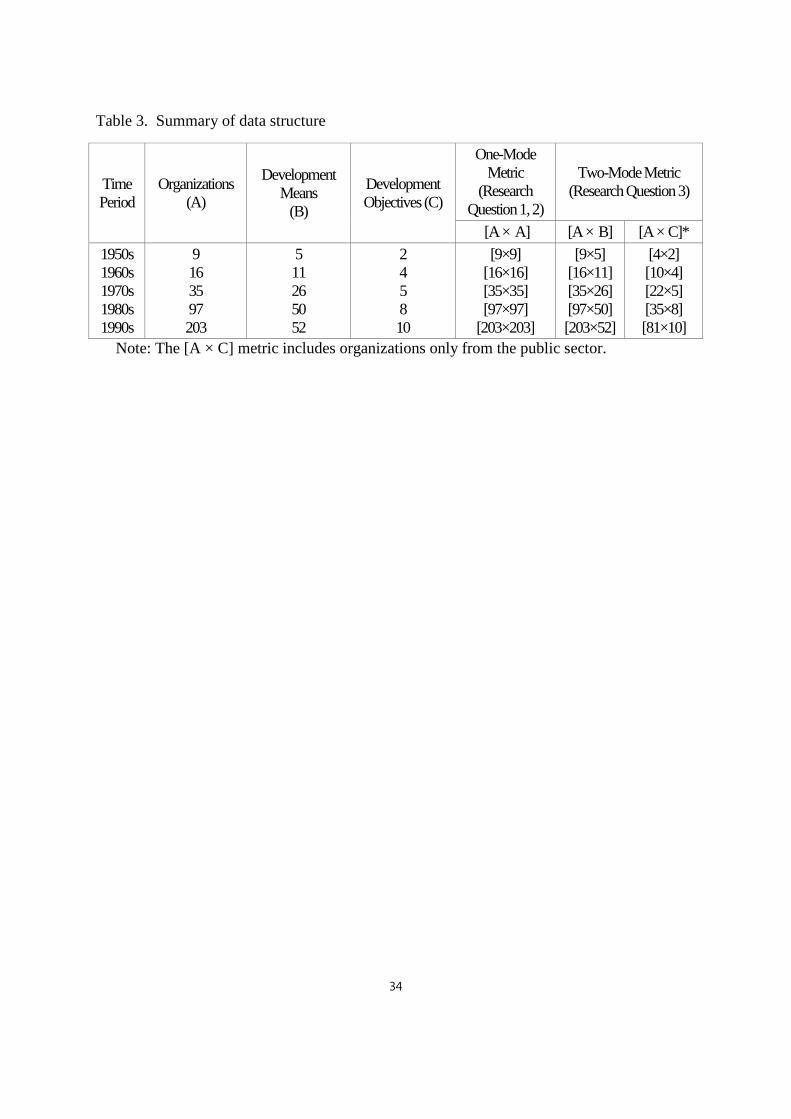
The one-mode metric was used for research questions 1 and 2, and the two-mode metric
for question 3. Table 3 provides a summary of the data structure that was used to respond to
the research questions. Finally, UNICET software was used for the analysis.
********
TABLE 3. SUMMARY OF DATA STRUCTURE
ABOUT HERE
********
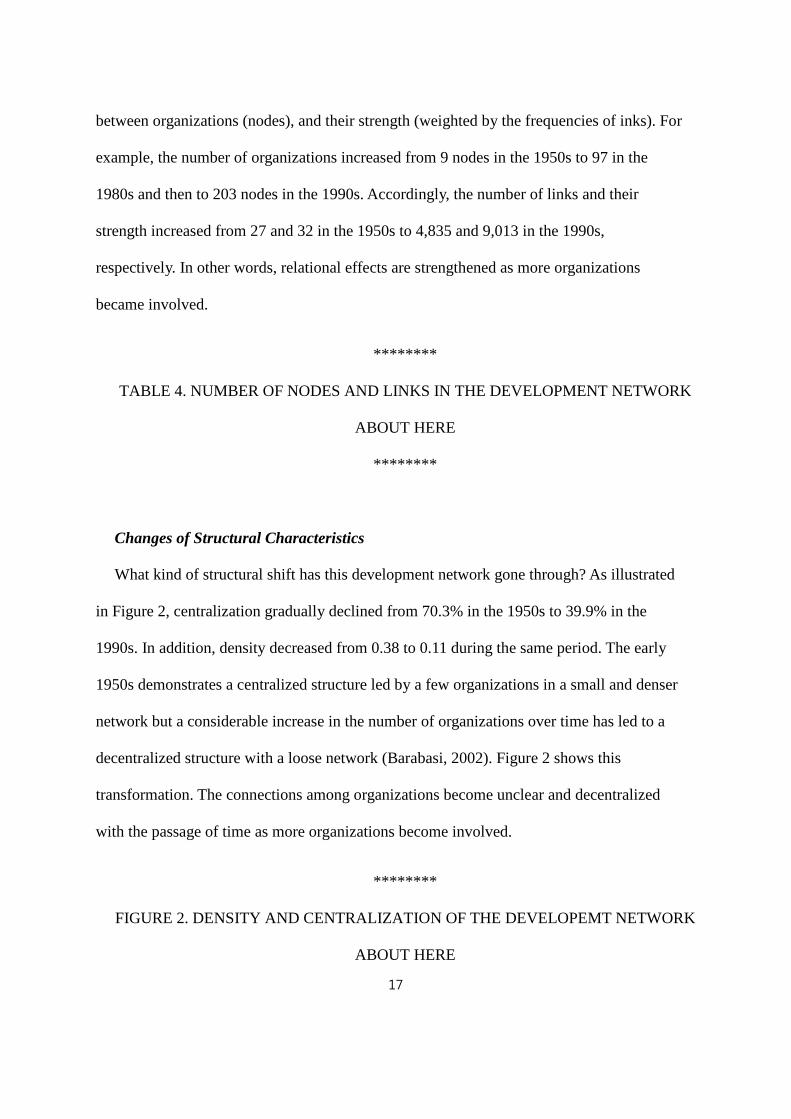
Analysis and results
The Table 4 shows that the relational assets of the network have dramatically increased
over the period in terms of the number of organizations (nodes), the number of links (lines)
17
between organizations (nodes), and their strength (weighted by the frequencies of inks). For
example, the number of organizations increased from 9 nodes in the 1950s to 97 in the
1980s and then to 203 nodes in the 1990s. Accordingly, the number of links and their
strength increased from 27 and 32 in the 1950s to 4,835 and 9,013 in the 1990s,
respectively. In other words, relational effects are strengthened as more organizations
became involved.
********
TABLE 4. NUMBER OF NODES AND LINKS IN THE DEVELOPMENT NETWORK
ABOUT HERE
********
Changes of Structural Characteristics
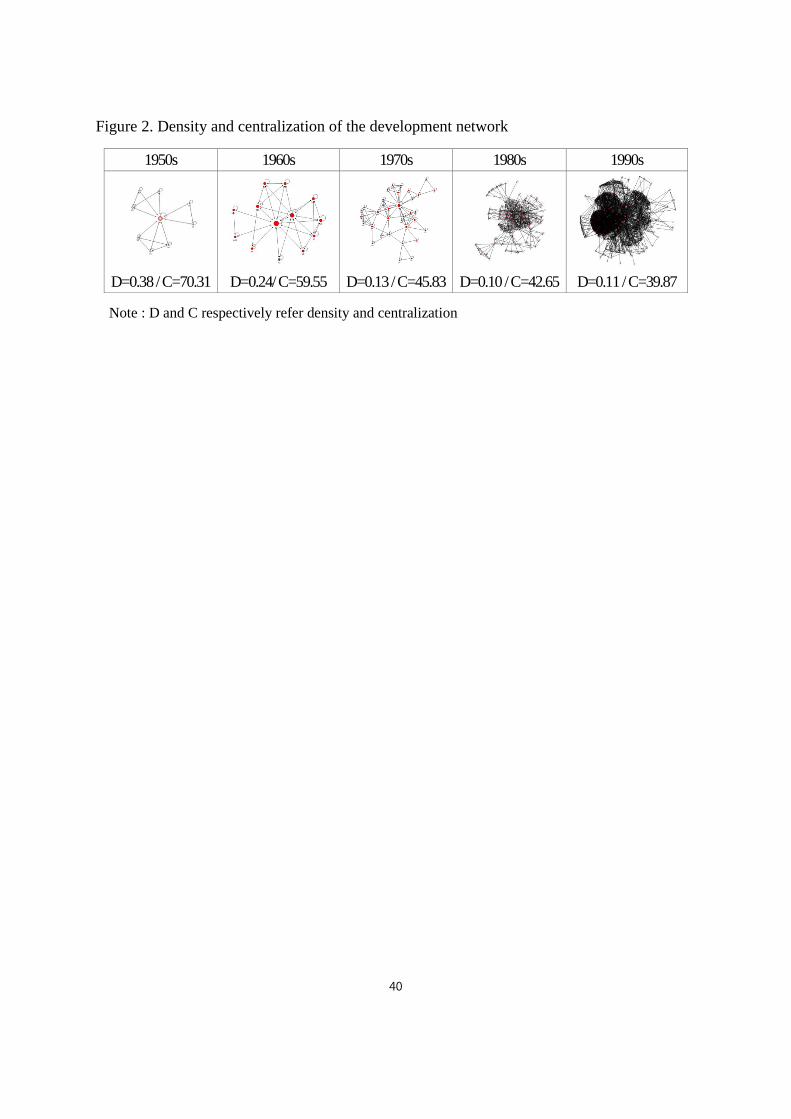
What kind of structural shift has this development network gone through? As illustrated
in Figure 2, centralization gradually declined from 70.3% in the 1950s to 39.9% in the
1990s. In addition, density decreased from 0.38 to 0.11 during the same period. The early
1950s demonstrates a centralized structure led by a few organizations in a small and denser
network but a considerable increase in the number of organizations over time has led to a
decentralized structure with a loose network (Barabasi, 2002). Figure 2 shows this
transformation. The connections among organizations become unclear and decentralized
with the passage of time as more organizations become involved.
********
FIGURE 2. DENSITY AND CENTRALIZATION OF THE DEVELOPEMT NETWORK
ABOUT HERE
18
********
Interactions among Organizations and their Relative Influence
Influence of Organizations over Time
Power centrality was used to examine the relative influence of individual organizations
over time. Since power centrality reveals not only the number of nodes directly connected,
but also the strength of nodes that are powerfully connected, organizations higher in power
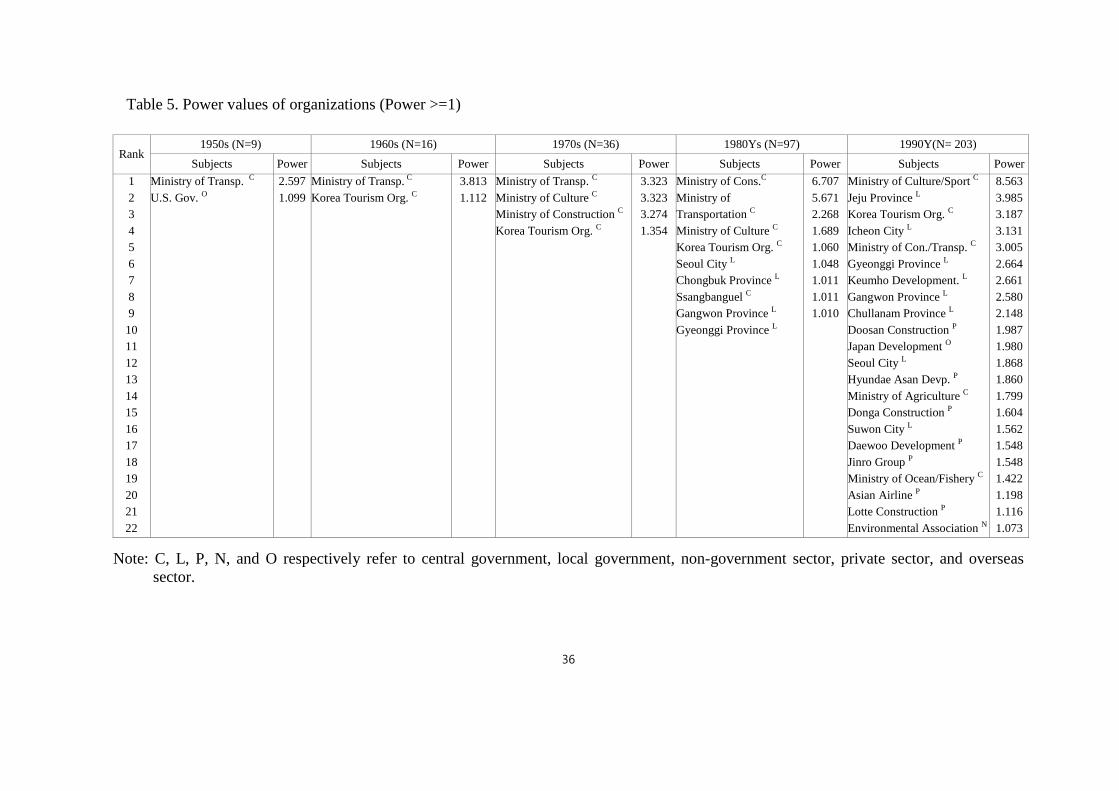
values represent more influential actors. As described below in Table 5, the Ministry of
Transportation had the most influential actor with power value of 2.597, followed by the
United States Department of Commerce (1.099) in the 1950s. The Ministry of
Transportation had a central role in tourism development after the colonial period,
particularly through control of the railway system and this influence continued after
national liberation. The U.S. Department of Commerce’s role was important because the
Korean government had to borrow funds from its ally, the U.S., to boost tourism after the
inter-Korean War. The United Nations Forces (0.40) and the PATA (Pacific Asia Travel
Association) (0.40) were also influential at that time. While national capability and
financial ability were poor, these organizations were key leaders of tourism development.
This paradigm continued into the 1960s when the Korea Tourism Organization (1.112),
established in 1962 for the purpose of attracting foreign tourists, began to possess
considerable influence, along with the Ministry of Transportation, which had consistently
kept its position as the most influential actor indicated by the highest power values (3.183).
Entering the 1990s, many other government agencies, such as the Ministry of Oceans and
Fisheries and the Ministry for Agriculture, Forestry and Fisheries, along with major tourism
19
development organizations (e.g., Ministry of Transportation, Ministry of Culture, Ministry
of Construction, etc.), participated in many activities (Event & Festivals, History &
Cultural Program etc.) relating to tourism development. Moreover, local governments
became involved in tourism development. Few private sector organizations existed in the
1950s and those that did had very minor influence, but that influence grew as more private
entities entered the sector (Keumho, Doosan, Hyundae, Lotte etc.) in the 1990s. In non-
governmental sectors, influential entities such as the Environmental Association also
emerged. These results show state-government in South Korea played a key role in the
process of tourism development by leading other sectors until they developed their own
autonomy, especially, the private sector. These relations are more clearly revealed in the
following simplified image of the development network.
********
TABLE 5. POWER VALUES OF ORGANIZATIONS (Power >=1)
ABOUT HERE
*******
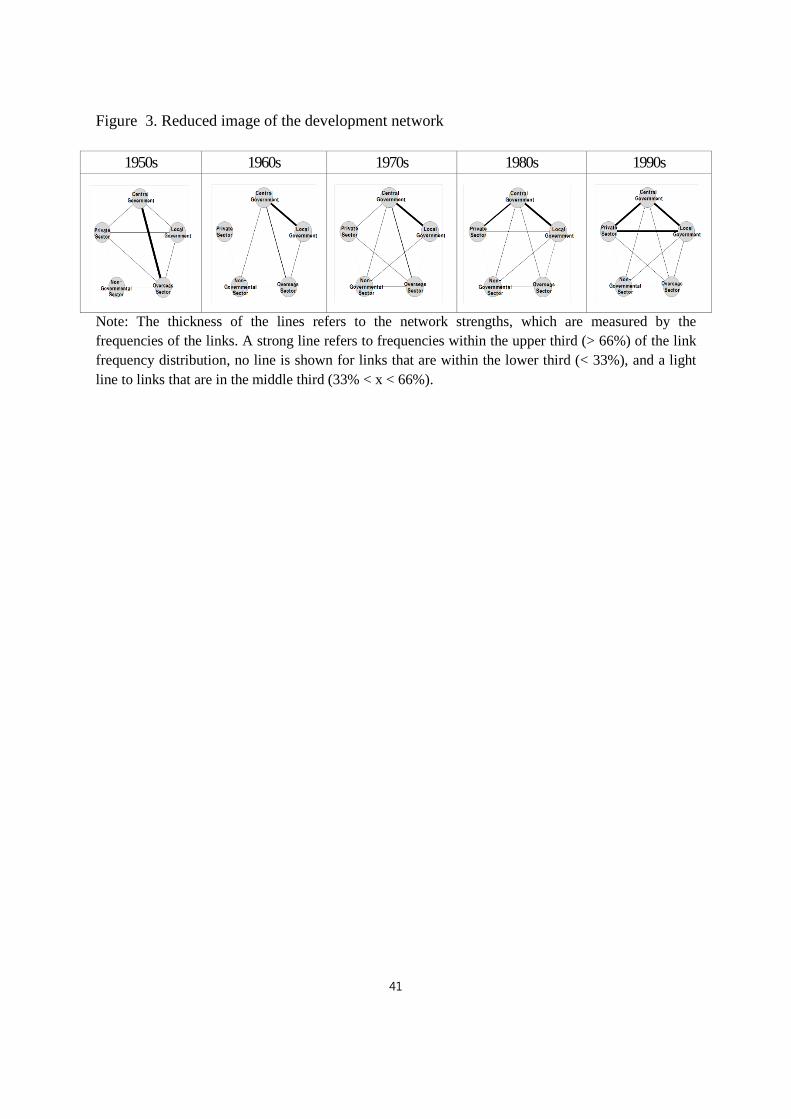
Interaction among Simplified Organizations
To reduce the interactions among organizations, the subjects were divided into the
following categories: central government, local government, private sector, overseas sector,
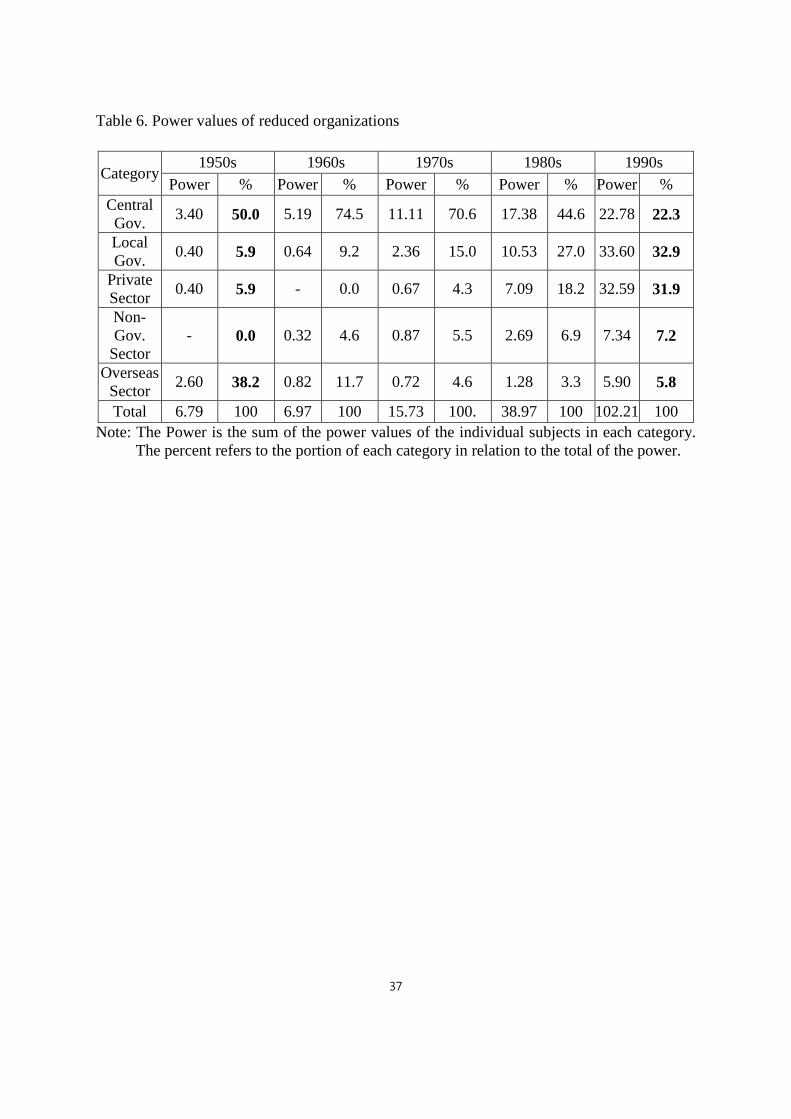
and non-governmental sector and the relative power of each calculated. As shown in Table
6, the central government’s power increased from 50.6% in the 1950s to 74.5% and 70.6%
in the 1960s and 1970s respectively. Then it declined entering the 1980s and was as low as
23.3% during the 1990s. On the other hand, the local government and private sector, each
20
having 6% power in the 1950s grew to 32.9% and 31.9% respectively in the 1990s. In non-
governmental sectors, power was almost zero in the 1950s and increased to 7.2% in the
1990s, a minor increase overall. The power of the overseas sector was relatively high
(38.2%) in the 1950s and then it gradually decreased. Entering the 1990s, it bounced back
slightly to 5.8%. Overall, the central government’s powerful role was obvious from the
1950s to 1970s and became weaker as decades passed, while the roles of the local
government, private sector, and non-governmental sector, which were almost absent in the
earlier period, strengthened and diversified as the 1990s approached. Figure 3 illustrates
this relation in a simplified form by using its relational strength weighted by the
frequencies of links among organizations.
********
TABLE 6. POWER VALUES OF REDUCED ORGANIZATIONS
ABOUT HERE
********
********
FIGURE 3. REDUCED IMAGE OF THE DEVELOPMENT NETWORK
ABOUT HERE
********
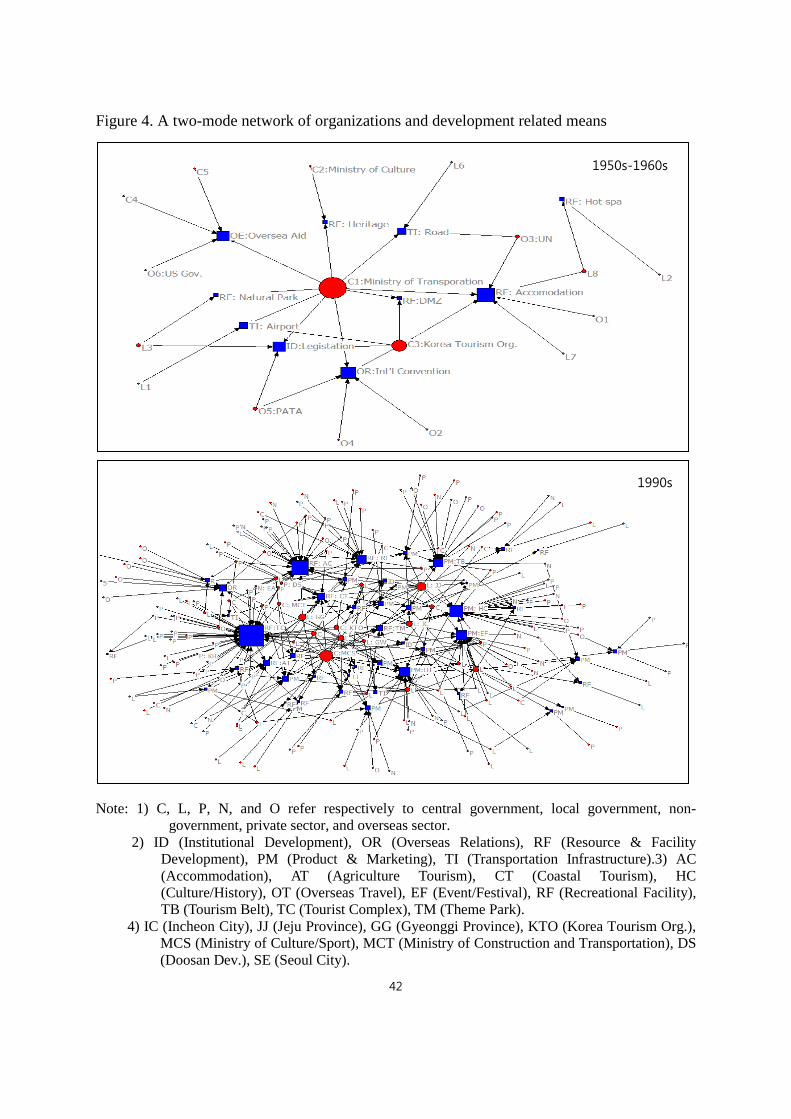
Development Related Means and Objectives
A two-mode network of organizations and means was used to examine how the
development network has changed in terms of the physical and non-physical resources
mobilized during the development process. Since a two-mode network does not provide
power values, degree centrality (which measures centrality in terms of direct links to nodes)
21
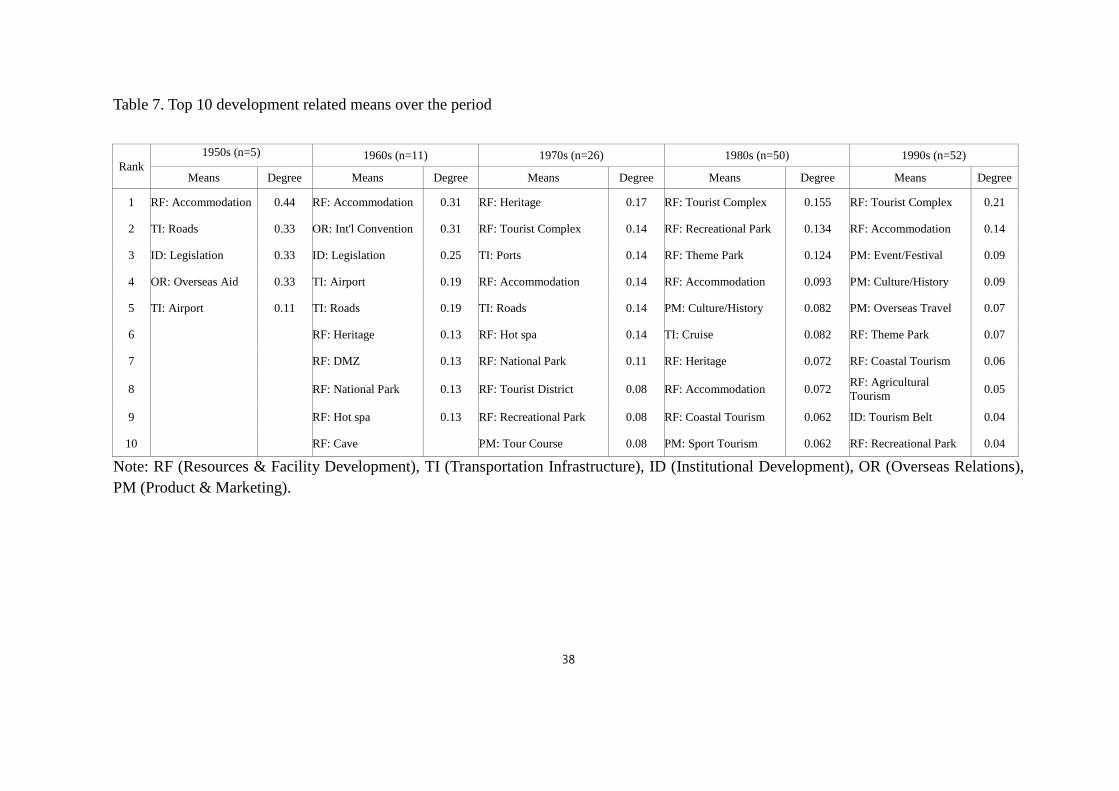
was employed. In the 1950s, the main means was accommodation (0.44 in degree centrality)
followed by roads (0.33), overseas aid (0.33) and legislation (0.33) (see Table 7). In the
1960s, along with accommodation, international conventions were important (0.31 degree
centrality). There were many efforts by such organizations as PATA (Pacific Asia Travel
Association) to host international conferences in South Korea at this time. In the 1990s,
tourist resort complexes were more frequently mentioned and also the type of resources and
facilities became more diverse, encompassing the ocean, agriculture, theme parks, and
recreational parks. Events and festivals (0.09), cultural and historical products (0.09), and
overseas travel (0.07), also were developed in the 1990s.
The means of development is shown in Figure 4. In the 1950s and 1960s, the Ministry of
Transportation (MT) along with the Korea Tourism Organization, were exclusively and
directly involved with accommodation, transportation infrastructures (roads, airport),
legislation, resource and facilities development (heritage, national park, etc.), overseas aid,
and international convention. In particular, the MT was connected to the U.S. Government
for overseas aid, and to the PATA for hosting international convention and meetings. This
implies that, on the one hand, the central government exploited accommodations, airports and
roads, resources and facilities to improve tourism infrastructure, and on the other hand, it also
encouraged the use of foreign capital and international conventions to develop new tourism.
However, in the 1990s, the picture changes dramatically. The relationship between
resources and organizations became more complicated as more diverse means and multiple
subjects arose. In the 1990s, resources were shared between the central government and
organizations from other sectors, in particular, local government and private sector. For
example, TC (Tourist Complex) and EF (Event/Festival), which have strong degree
22
centralities, were developed by diverse organizations. In sum, the earlier limited
infrastructure (such as ‘accommodations’ and ‘roads’) controlled by the central government
have become diverse with new actors and infrastructure such as tourist complexes, theme
parks, coastal t and agricultural tourism, along with associated marketing.
********
TABLE 7. TOP 10 DEVELOPMENT RELATED MEANS OVER THE PERIOD
ABOUT HERE
********
********
FIGURE 4. A TWO-MODE NETWORK OF ORGANIZATIONS AND DEVELOPMENT
RELATED MEANS
ABOUT HERE
********
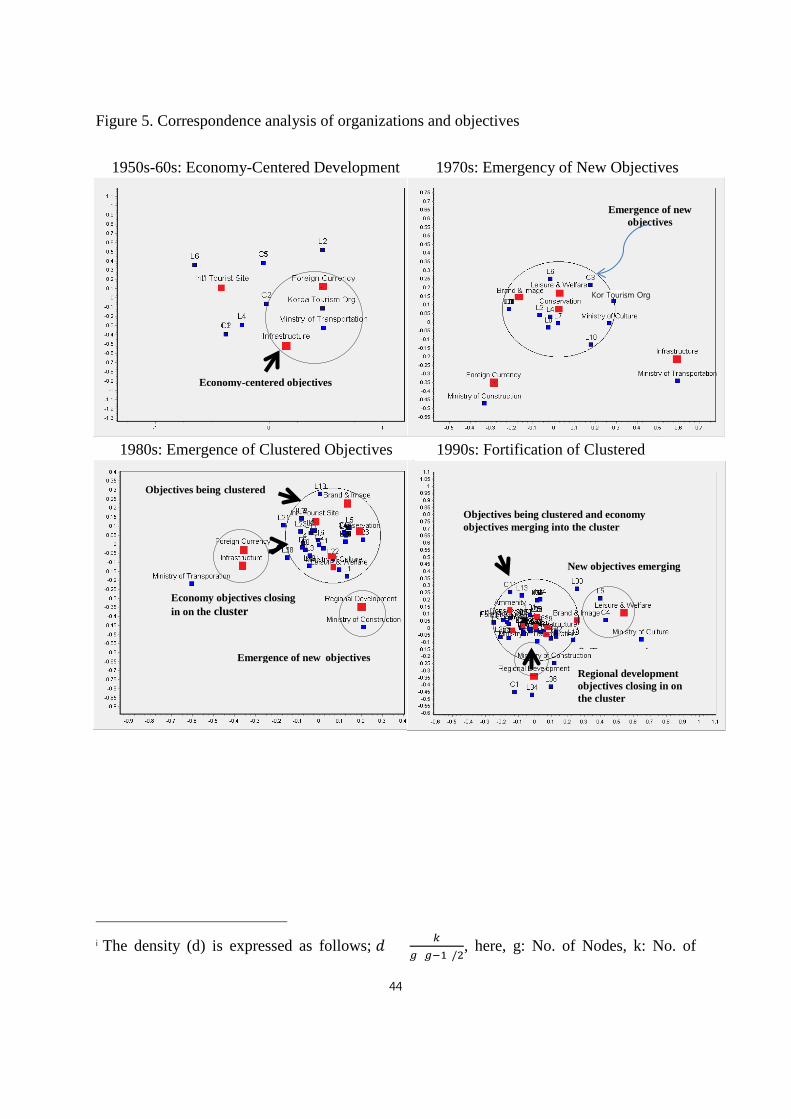
Lastly, correspondence analysis was conducted between organizations drawn from the
public sector and development objectives. Figure 5 shows in detail the changes in
correspondence between organizations and objectives. In the 1950s and 1960s, the MT and
the Korea Tourism Organization pursued economic growth objectives concerning foreign
currency and infrastructure. In the 1970s, while eeconomy-centered growth objectives
remained, new objectives such as leisure and welfare, image and brand, and conservation
emerged led by the Ministry of Culture and the Korea Tourism Organization. In the 1980s,
the objectives were clustered around new subjects and were shared by multiple subjects
23
rather than exclusively linked to a few (indicated by a lower correspondence level). Also, a
new objective, regional development appeared associated with the Ministry of Construction.
In the 1990s, clustering intensified. In summary, in the earlier decades the central government
led tourism development using economy-centered objectives. Later new non-economic
objectives were created and responsibility for them transferred to regional level government.
********
FIGURE 5. CORRESPONDENCE ANALYSIS OF THE ORGANIZATIONS AND
OBJECTIVES
ABOUT HERE
********
Discussion and conclusions
Summary
This study has utilized SNA to analyze the evolution of tourism stakeholder network
during South Korea’s transition from developing to developed country. South Korea was
chosen for its strong strategic intervention to achieve economic growth. The evolution of
tourism organization was studied by analyzing changes in the relationships within a
network of organizations as their development means and objectives changed. Three
research questions were addressed concerning structural changes in the tourism
development network, the relative position of stakeholders with special attention to the role
of state-government, and the driving forces of these network changes. The results for each
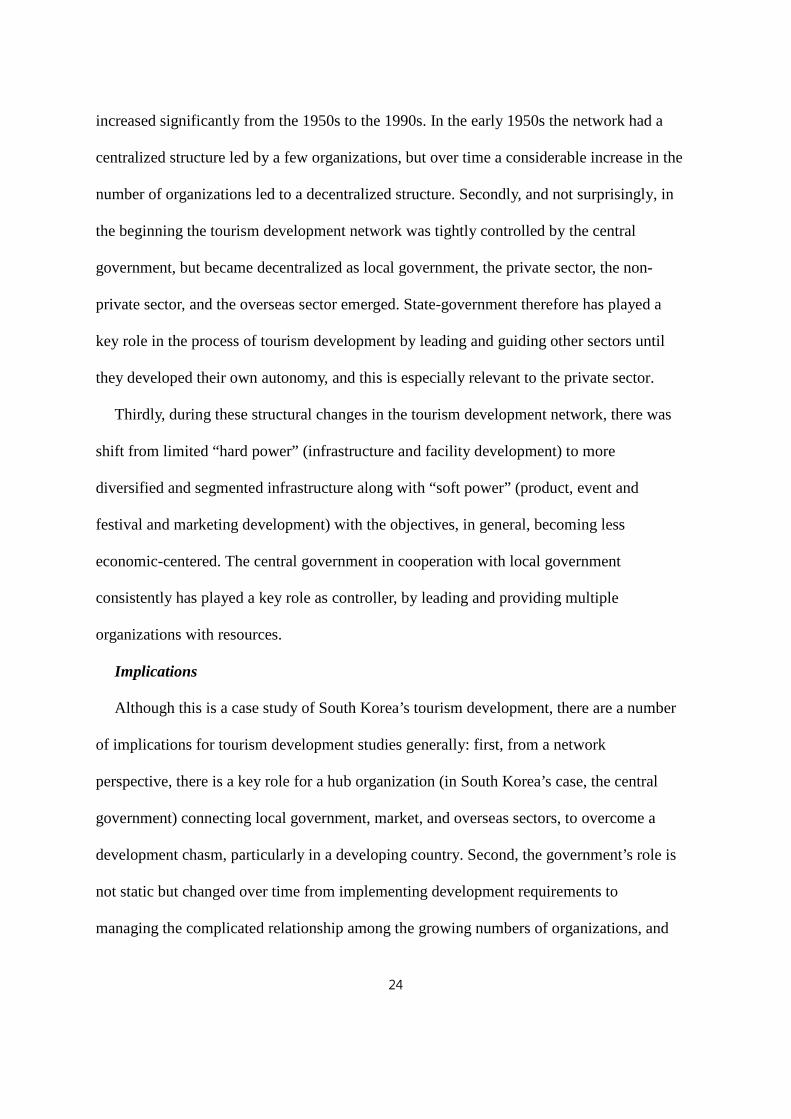
question are as follows: Firstly, the relational intensity of the organizations involved
24
increased significantly from the 1950s to the 1990s. In the early 1950s the network had a
centralized structure led by a few organizations, but over time a considerable increase in the
number of organizations led to a decentralized structure. Secondly, and not surprisingly, in
the beginning the tourism development network was tightly controlled by the central
government, but became decentralized as local government, the private sector, the non-
private sector, and the overseas sector emerged. State-government therefore has played a
key role in the process of tourism development by leading and guiding other sectors until
they developed their own autonomy, and this is especially relevant to the private sector.
Thirdly, during these structural changes in the tourism development network, there was
shift from limited “hard power” (infrastructure and facility development) to more
diversified and segmented infrastructure along with “soft power” (product, event and
festival and marketing development) with the objectives, in general, becoming less
economic-centered. The central government in cooperation with local government
consistently has played a key role as controller, by leading and providing multiple
organizations with resources.
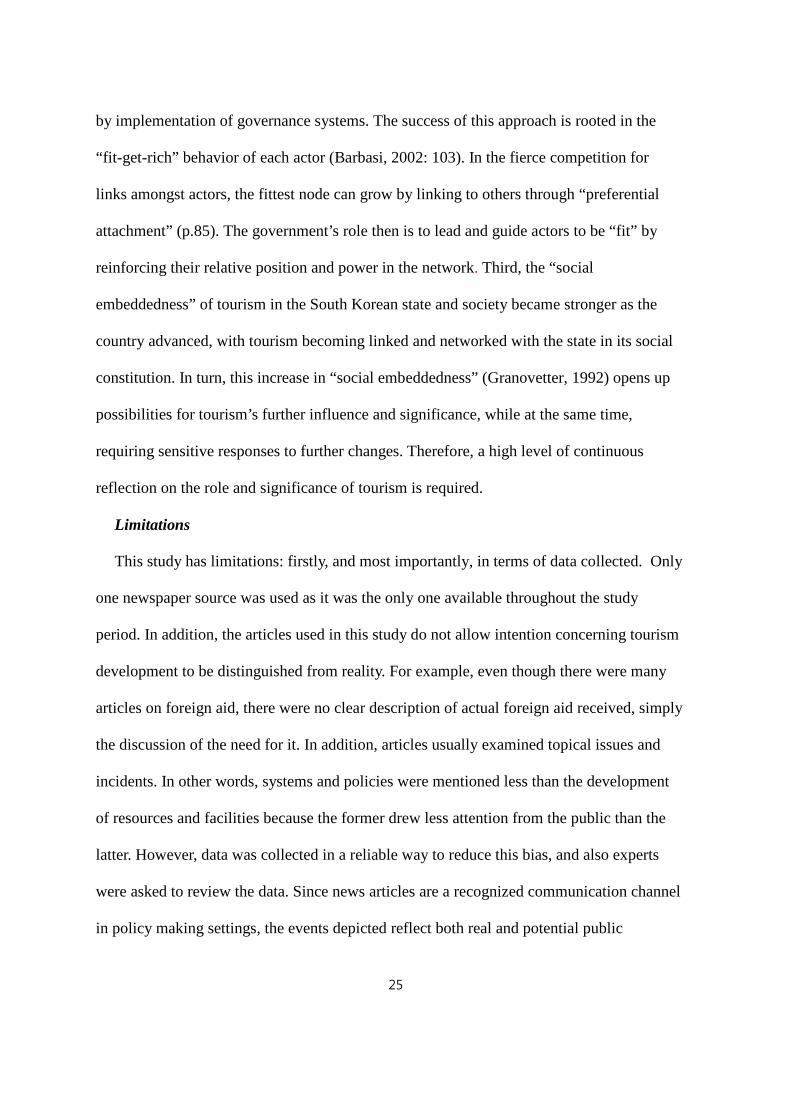
Implications
Although this is a case study of South Korea’s tourism development, there are a number
of implications for tourism development studies generally: first, from a network
perspective, there is a key role for a hub organization (in South Korea’s case, the central
government) connecting local government, market, and overseas sectors, to overcome a
development chasm, particularly in a developing country. Second, the government’s role is
not static but changed over time from implementing development requirements to
managing the complicated relationship among the growing numbers of organizations, and
25
by implementation of governance systems. The success of this approach is rooted in the
“fit-get-rich” behavior of each actor (Barbasi, 2002: 103). In the fierce competition for
links amongst actors, the fittest node can grow by linking to others through “preferential
attachment” (p.85). The government’s role then is to lead and guide actors to be “fit” by
reinforcing their relative position and power in the network. Third, the “social
embeddedness” of tourism in the South Korean state and society became stronger as the
country advanced, with tourism becoming linked and networked with the state in its social
constitution. In turn, this increase in “social embeddedness” (Granovetter, 1992) opens up
possibilities for tourism’s further influence and significance, while at the same time,
requiring sensitive responses to further changes. Therefore, a high level of continuous
reflection on the role and significance of tourism is required.
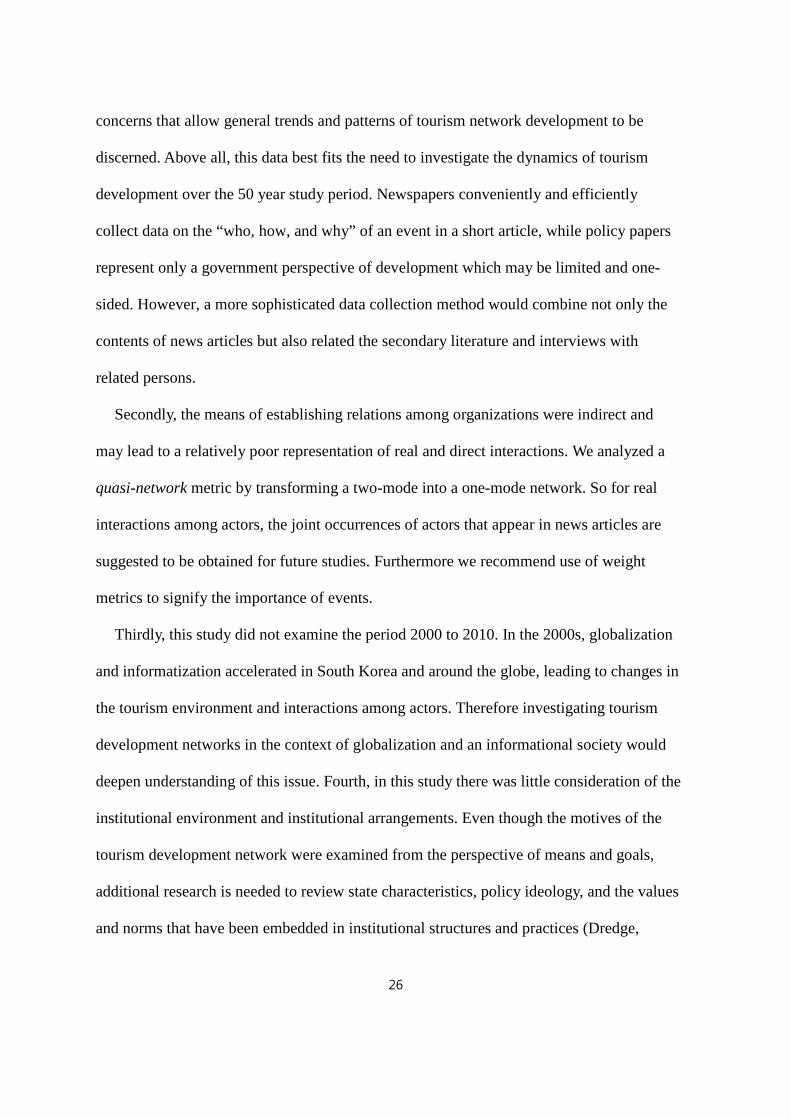
Limitations
This study has limitations: firstly, and most importantly, in terms of data collected. Only
one newspaper source was used as it was the only one available throughout the study
period. In addition, the articles used in this study do not allow intention concerning tourism
development to be distinguished from reality. For example, even though there were many
articles on foreign aid, there were no clear description of actual foreign aid received, simply
the discussion of the need for it. In addition, articles usually examined topical issues and
incidents. In other words, systems and policies were mentioned less than the development
of resources and facilities because the former drew less attention from the public than the
latter. However, data was collected in a reliable way to reduce this bias, and also experts
were asked to review the data. Since news articles are a recognized communication channel
in policy making settings, the events depicted reflect both real and potential public
26
concerns that allow general trends and patterns of tourism network development to be
discerned. Above all, this data best fits the need to investigate the dynamics of tourism
development over the 50 year study period. Newspapers conveniently and efficiently
collect data on the “who, how, and why” of an event in a short article, while policy papers
represent only a government perspective of development which may be limited and one-
sided. However, a more sophisticated data collection method would combine not only the
contents of news articles but also related the secondary literature and interviews with
related persons.
Secondly, the means of establishing relations among organizations were indirect and
may lead to a relatively poor representation of real and direct interactions. We analyzed a
quasi-network metric by transforming a two-mode into a one-mode network. So for real
interactions among actors, the joint occurrences of actors that appear in news articles are
suggested to be obtained for future studies. Furthermore we recommend use of weight
metrics to signify the importance of events.
Thirdly, this study did not examine the period 2000 to 2010. In the 2000s, globalization
and informatization accelerated in South Korea and around the globe, leading to changes in
the tourism environment and interactions among actors. Therefore investigating tourism
development networks in the context of globalization and an informational society would
deepen understanding of this issue. Fourth, in this study there was little consideration of the
institutional environment and institutional arrangements. Even though the motives of the
tourism development network were examined from the perspective of means and goals,
additional research is needed to review state characteristics, policy ideology, and the values
and norms that have been embedded in institutional structures and practices (Dredge,
27
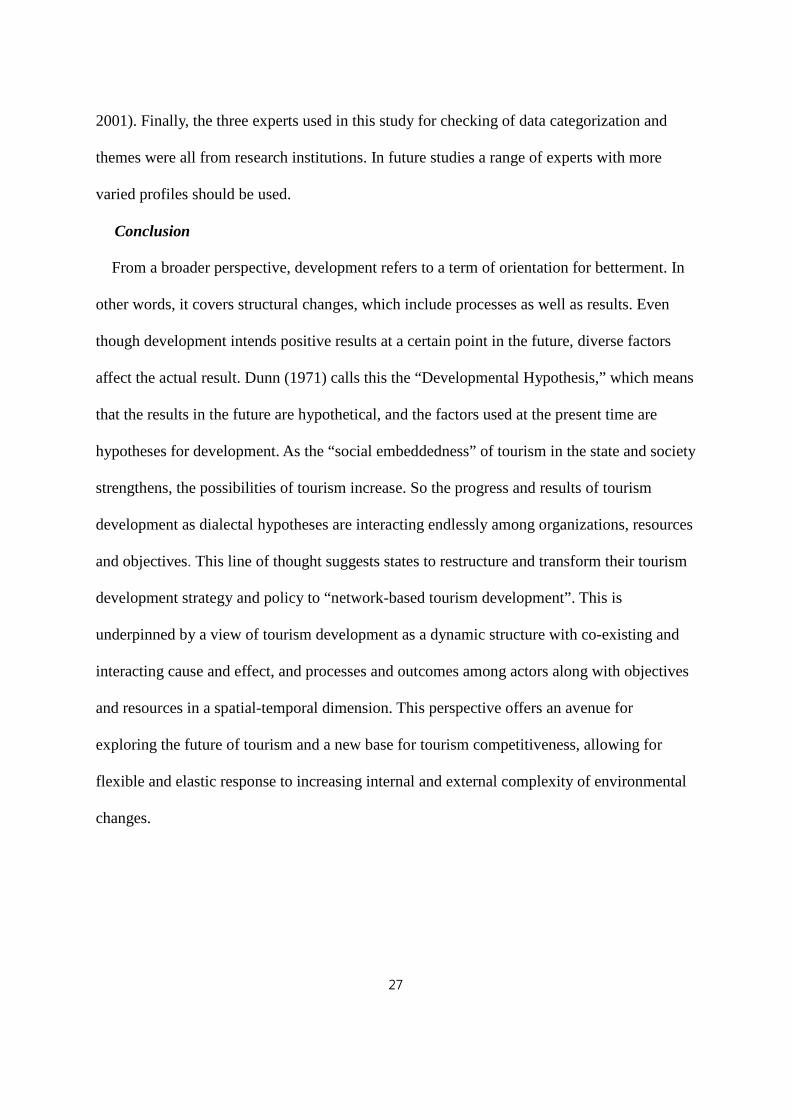
2001). Finally, the three experts used in this study for checking of data categorization and
themes were all from research institutions. In future studies a range of experts with more
varied profiles should be used.
Conclusion
From a broader perspective, development refers to a term of orientation for betterment. In
other words, it covers structural changes, which include processes as well as results. Even
though development intends positive results at a certain point in the future, diverse factors
affect the actual result. Dunn (1971) calls this the “Developmental Hypothesis,” which means
that the results in the future are hypothetical, and the factors used at the present time are
hypotheses for development. As the “social embeddedness” of tourism in the state and society
strengthens, the possibilities of tourism increase. So the progress and results of tourism
development as dialectal hypotheses are interacting endlessly among organizations, resources
and objectives. This line of thought suggests states to restructure and transform their tourism
development strategy and policy to “network-based tourism development”. This is
underpinned by a view of tourism development as a dynamic structure with co-existing and
interacting cause and effect, and processes and outcomes among actors along with objectives
and resources in a spatial-temporal dimension. This perspective offers an avenue for
exploring the future of tourism and a new base for tourism competitiveness, allowing for
flexible and elastic response to increasing internal and external complexity of environmental
changes.
28
References
Barabasi, A.L. (2002). Linked: The New Science of Networks. East-Asia Publishing
Company.
Bonacich, P. (1987). Power and centrality: a family of measures. American Journal of
Sociology, 92, 1170-182
Bramwell, B., & Meyer, D. (2007). Power, Tourism Policy Relations in Transition. Annals
of Tourism Research, 34(3), 766-788.
Burns, P. (1999). Paradoxes in Planning Tourism Elitism or Brutalism. Annals of Tourism
Research, 26(2), 329–348.
Casanueva, C., Gallego, A., & Sancho, M. (2013) Network resources and social capital in
the airline alliance porfolios. Tourism Management, 36, 441-453.
Casanueva, C., Gallego, A., Castro, I., Castro, I., & Sancho, M. (2014) Airline alliances:
Mobilizing network resources. Tourism Management, 44, 88-98.
Casanueva, C., Gallego, A., & García-Sánchez, R. (2016). Social network analysis in
tourism. Current Issues in Tourism, 19 (12), 1190-1209.
Clancy, M.J. (1999). Tourism and Development: Evidence from Mexico. Annals of
Tourism Research, 26(1), 1-20.
Chhenag, V. (2008). The Political Economy of Tourism in Cambodia. Asia Pacific Journal
of Tourism Research, 13(3), 281-297.
David, P. A. (1994). Why are Institutions the Carriers of History? Path Dependence and the
Evolution of Conventions, Organizations and Institutions. Structural Change and
Economic Dynamics, 5(2), 205-220.
Dieke, P.U.C. (2000). The Political Economy of Tourism Development in Africa. Elmsford:
29
Cognizant Communication Corp.
Dredge, D. (2001). Local Government Tourism Planning and Policy-making in New South
Wales: Institutional Development and Historical Legacies. Current Issues in
Tourism, 4(2-4), 355-380.
Dredge, D. (2006). Networks, Conflict and Collaborative Communities. Journal of Sustain
able Tourism, 14(6), 562-581.
Dunn, E.S. (1971). Economic and Social Development: A Process of Social Learning.
Baltimore: The Johns Hopkins Press.
Freeman, L.C. (1979). Centrality in social networks: conceptual clarification. Social Networks 3,
41-52.
Gardiner, S., & Scott, N. (2014). Successful Tourism Clusters: Passion in Paradise. Annals
of Tourism Research, 46, 171-173.
Giddens, A. (1979). Central Problems in Social Theory. London and Basingstoke: The
Macmillan Press Ltd.
Granovetter, M. (1992). Problems of explanation in economic sociology. In N. Nohria & R.
Eccles (Ed.), Networks and Organizations: Structure, Form and Action (pp. 25-
6). Boston: Harvard Business School Press.
Greenacre, M. (2007). Correspondence Analysis in Practice. Chapman & Hall/CRC.
Hay, C. (1998). The Tangled Webs We Weave: the Discourse, Strategy and Practice of
Networking. In D. Marsh (Ed.), Comparing Policy Networks. Buckingham: Open
University Press.
Hall, D. (2004). Introduction. In D. Hall (Ed.), Tourism and Transition: Governance, Trans
formation and Development (pp. 1–24). Wallingford: CABI
30
Hanneman, R.A., & Riddle, M. (2005). Introduction to social network methods. CA:
University of California.
Hawkins, D.E., & Mann, S. (2007). The World Bank’s Role in Tourism Development.
Annals of Tourism Research, 34(2), 348–363.
Jafari, J. (2001). Research and Scholarship: The Basis of Tourism Education. The Journal
of Tourism Studies, 1(1), 33–41.
Johnson, C. (1982). MITI and the Japanese Miracle. Stanford: Stanford University Press.
Kimbu, A.N., & Ngoasong, M.Z. (2013). Centralised Decentralisation of Tourism
Development: A Network Perspective. Annals of Tourism Research, 40(1), 235-
259.
Klijn, E. (1997). Policy Networks: An Overview. In W.J. Kichkert et al. (Ed.), Managing
Complex Networks. London: Sage.
KTO (2002). Korea National Tourism Organization: 40-Year History
Kwon, T.J. (2006). Century-skipping Industrialization and Democratization of Korea.
Seoul: Nanam Publishing House.
Marin, B., & Mayntz, R. (1991). Policy Networks: Empirical Evidence and Theoretical
Considerations. Boulder. Colorado: Westview Press.
Marsh, D., & Smith, M. (2000). Understanding Policy Networks: towards a dialectical
approach. Political Studies, 48, 4-21.
Mason, E. et. al. (1980). The Economic and Social Modernization of the Republic of Korea.
Harvard University Press
Milne, S., & Ateljevic, I. (2001). Tourism, economic development and the global-local
nexus: Theory embracing complexity. Tourism Geographies, 3(4), 369-393.
31
Paranyushkin, D. (2010). Text Network Analysis. Available at
http://issuu.com/deemeetree/docs/text-network-analysis
Pforr, C. (2006). Tourism Policy in the Making: An Australian Network Study. Annals of
Tourism Research, 33(1), 87-108.
Rhodes, R.A.W. (2008). Policy Network Analysis. In R. Goodin, M. Moran, & M. Rein
(Ed.), The Oxford Handbook of Public Policy (pp. 425–443). Oxford University
Press.
Roberts, C.W. (1997). Introduction. In C.W. Roberts (Ed.), Text Analysis for the Social
Science: Method for Drawing Statistical Inferences from Texts and Transcripts.
Mahwah, NJ: Lawrence Erlbaum Associates
Scott, J. (1991) Social Network Analysis. London: Sage Publication
Scott, N., Cooper, C., & Baggio, R. (2008). Network Analysis and Tourism: From Theory to
Practice. London: Multilingual Matters & Channel View Publications.
Weiss, L., & Hobson, J. (1995). States and Economic Development: Comparative
Historical Analysis. Cambridge: Polity Press.
Williams, A.M., & Balàaz, V. (2002). The Czech and Slovak Republics: Conceptual Issues
in the Economic Analysis of Tourism in Transition. Tourism Management, 23(1),
37-45.
Williams, A.M., & Shaw, G. (1991). Tourism and Economic Development: Western
European Experiences. London: Belhaven Press.
Woo-Cumings, M. (1999). Introduction. In M. Woo-Cumings (Ed.), The Developmental
State. Cornell University Press.
32
Table 1. Organizations, means, and objectives in detail
Category Description
Organizations
Central Government
central administrations and ministry, government-sponsored cooperation, committees at central level, etc.
Local Government
local governments, cities, local gov. (city)-sponsored cooperation, committees at local level, etc.
Private Sector development & construction company, investor, bank, etc.
Overseas Sector overseas state & government, overseas private company, UN, tourism-related association, etc.
Non-gov. Sector civic society, academic association, interest group, etc.
Development Means
Transportation Infrastructure
extension and new development of ground transportation (road, railroad, express bus, etc.), airport and airline, port and cruise ship, etc.
Resource & Facility
Development
tourist site, tourist district, natural park, cultural heritage, ocean & coastal tourism, beach, hot spa site, agricultural tourism, theme park, cave tourism, recreational park, accommodation & lodging, information center, golf & sky resort, museum, convention center, etc.
Product & Marketing
exhibition & expo, events & festival, history & cultural tour, night tourism, shopping & food, pilgrim, beauty & wellbeing, interregional tour course, tourist souvenirs & gifts, DMZ (Demilitarized Zone) tour course, leisure sport, sport tourism, bird observation, etc.
Policy & Institution
legislation, new policy, organization, interregional development policy, etc.
Overseas Relation overseas aid, overseas investment, international convention & meetings, overseas sisterhood relations, etc.
Development Objectives
To attract foreign currency To promote brand and image
To conserve natural & cultural Resources To strengthen competitiveness
To provide leisure & welfare space To build int’l tourist infrastructure
To construct international tourist site To strengthen equal development
To increase local income & quality of life To improve environmental amenities
33
Table 2. Number of organizations, means and objectives
Years 1950s 1960s 1970s 1980s 1990s Total* No. of News Articles 21 32 206 327 803 1,389
Organizations
Central Gov. 3 3 9 15 19 49
Local Gov. 1 7 13 20 62 103
Private Sector 1 0 5 48 77 131
Non-Gov. Sector 0 1 5 8 23 37
Overseas Sector 4 5 4 6 22 41
Total 9 16 36 97 203 361
Development
Means
Transportation Infra. 1 2 3 5 3 14
Resource &Facility 2 5 16 22 21 71
Product & Marketing - 1 3 15 17 38
Policy & Institution 1 2 2 4 7 21
Overseas Relation 1 1 2 4 4 12
Total 5 11 26 50 52 144
Development Objectives 3 4 5 8 10 29
Note: From decade to decade, some development subjects, means, and objectives
overlapped.
34
Table 3. Summary of data structure
Time Period
Organizations (A)
Development Means
(B)
Development Objectives (C)
One-Mode Metric
(Research Question 1, 2)
Two-Mode Metric (Research Question 3)
[A × A] [A × B] [A × C]* 1950s 1960s 1970s 1980s 1990s
9 16 35 97 203
5 11 26 50 52
2 4 5 8 10
[9×9] [16×16] [35×35] [97×97]
[203×203]
[9×5] [16×11] [35×26] [97×50] [203×52]
[4×2] [10×4] [22×5] [35×8] [81×10]
Note: The [A × C] metric includes organizations only from the public sector.

35
Table 4. Number of nodes and links in the development network
1950s 1960s 1970s 1980s 1990s No. of Nodes No. of Links
No. of Frequencies
9 27 32
16 58 118
36 160 350
97 918
1,498
203 4,835 9,013
36
Table 5. Power values of organizations (Power >=1)
Rank 1950s (N=9) 1960s (N=16) 1970s (N=36) 1980Ys (N=97) 1990Y(N= 203)
Subjects Power Subjects Power Subjects Power Subjects Power Subjects Power 1 2 3 4 5 6 7 8 9
10 11 12 13 14 15 16 17 18 19 20 21 22
Ministry of Transp. C U.S. Gov. O
2.597 1.099
Ministry of Transp. C Korea Tourism Org. C
3.813 1.112
Ministry of Transp. C Ministry of Culture C Ministry of Construction C Korea Tourism Org. C
3.323 3.323 3.274 1.354
Ministry of Cons.C Ministry of Transportation C Ministry of Culture C Korea Tourism Org. C Seoul City L Chongbuk Province L Ssangbanguel C Gangwon Province L Gyeonggi Province L
6.707 5.671 2.268 1.689 1.060 1.048 1.011 1.011 1.010
Ministry of Culture/Sport C Jeju Province L Korea Tourism Org. C Icheon City L Ministry of Con./Transp. C Gyeonggi Province L Keumho Development. L Gangwon Province L Chullanam Province L Doosan Construction P Japan Development O Seoul City L Hyundae Asan Devp. P Ministry of Agriculture C Donga Construction P Suwon City L Daewoo Development P Jinro Group P Ministry of Ocean/Fishery C Asian Airline P Lotte Construction P
Environmental Association N
8.563 3.985 3.187 3.131 3.005 2.664 2.661 2.580 2.148 1.987 1.980 1.868 1.860 1.799 1.604 1.562 1.548 1.548 1.422 1.198 1.116 1.073
Note: C, L, P, N, and O respectively refer to central government, local government, non-government sector, private sector, and overseas sector.
37
Table 6. Power values of reduced organizations
Category 1950s 1960s 1970s 1980s 1990s
Power % Power % Power % Power % Power % Central Gov. 3.40 50.0 5.19 74.5 11.11 70.6 17.38 44.6 22.78 22.3
Local Gov. 0.40 5.9 0.64 9.2 2.36 15.0 10.53 27.0 33.60 32.9
Private Sector 0.40 5.9 - 0.0 0.67 4.3 7.09 18.2 32.59 31.9
Non-Gov.
Sector - 0.0 0.32 4.6 0.87 5.5 2.69 6.9 7.34 7.2
Overseas Sector 2.60 38.2 0.82 11.7 0.72 4.6 1.28 3.3 5.90 5.8
Total 6.79 100 6.97 100 15.73 100. 38.97 100 102.21 100 Note: The Power is the sum of the power values of the individual subjects in each category.
The percent refers to the portion of each category in relation to the total of the power.
38
Table 7. Top 10 development related means over the period
Note: RF (Resources & Facility Development), TI (Transportation Infrastructure), ID (Institutional Development), OR (Overseas Relations), PM (Product & Marketing).
Rank 1950s (n=5) 1960s (n=11) 1970s (n=26) 1980s (n=50) 1990s (n=52)
Means Degree Means Degree Means Degree Means Degree Means Degree
1 RF: Accommodation 0.44 RF: Accommodation 0.31 RF: Heritage 0.17 RF: Tourist Complex 0.155 RF: Tourist Complex 0.21
2 TI: Roads 0.33 OR: Int'l Convention 0.31 RF: Tourist Complex 0.14 RF: Recreational Park 0.134 RF: Accommodation 0.14
3 ID: Legislation 0.33 ID: Legislation 0.25 TI: Ports 0.14 RF: Theme Park 0.124 PM: Event/Festival 0.09
4 OR: Overseas Aid 0.33 TI: Airport 0.19 RF: Accommodation 0.14 RF: Accommodation 0.093 PM: Culture/History 0.09
5 TI: Airport 0.11 TI: Roads 0.19 TI: Roads 0.14 PM: Culture/History 0.082 PM: Overseas Travel 0.07
6 RF: Heritage 0.13 RF: Hot spa 0.14 TI: Cruise 0.082 RF: Theme Park 0.07
7 RF: DMZ 0.13 RF: National Park 0.11 RF: Heritage 0.072 RF: Coastal Tourism 0.06
8 RF: National Park 0.13 RF: Tourist District 0.08 RF: Accommodation 0.072 RF: Agricultural Tourism 0.05
9 RF: Hot spa 0.13 RF: Recreational Park 0.08 RF: Coastal Tourism 0.062 ID: Tourism Belt 0.04
10 RF: Cave PM: Tour Course 0.08 PM: Sport Tourism 0.062 RF: Recreational Park 0.04
39
Figure 1. Analytical frame
Flow of Time Time 1 Time 2 • • • • Time N ↓ ↓ ↓ ↓
Research Question 1 Cohesiveness and Centralization: Density and Centralization Index
↓
Research Question 2 Relative Roles of Organizations and Their Interaction: Power Value
↓
Research Question 3 Development Related Means and Objectives: Two-Mode Network and Correspondence Analysis
40
Figure 2. Density and centralization of the development network
1950s 1960s 1970s 1980s 1990s
D=0.38 / C=70.31 D=0.24/ C=59.55 D=0.13 / C=45.83 D=0.10 / C=42.65 D=0.11 / C=39.87
Note : D and C respectively refer density and centralization
41
Figure 3. Reduced image of the development network
1950s 1960s 1970s 1980s 1990s
Note: The thickness of the lines refers to the network strengths, which are measured by the frequencies of the links. A strong line refers to frequencies within the upper third (> 66%) of the link frequency distribution, no line is shown for links that are within the lower third (< 33%), and a light line to links that are in the middle third (33% < x < 66%).
42
Figure 4. A two-mode network of organizations and development related means
Picture 4. A Two-Mode Network of Development Subjects and Means
Note: 1) C, L, P, N, and O refer respectively to central government, local government, non-
government, private sector, and overseas sector. 2) ID (Institutional Development), OR (Overseas Relations), RF (Resource & Facility
Development), PM (Product & Marketing), TI (Transportation Infrastructure).3) AC (Accommodation), AT (Agriculture Tourism), CT (Coastal Tourism), HC (Culture/History), OT (Overseas Travel), EF (Event/Festival), RF (Recreational Facility), TB (Tourism Belt), TC (Tourist Complex), TM (Theme Park).
4) IC (Incheon City), JJ (Jeju Province), GG (Gyeonggi Province), KTO (Korea Tourism Org.), MCS (Ministry of Culture/Sport), MCT (Ministry of Construction and Transportation), DS (Doosan Dev.), SE (Seoul City).
1990s
1950s-1960s

43
44
Figure 5. Correspondence analysis of organizations and objectives
1950s-60s: Economy-Centered Development 1970s: Emergency of New Objectives
1980s: Emergence of Clustered Objectives 1990s: Fortification of Clustered
Objectives
i The density (d) is expressed as follows; 𝑑 = 𝑘𝑔 (𝑔−1)/2
, here, g: No. of Nodes, k: No. of
Economy-centered objectives
Objectives being clustered
Economy objectives closing in on the cluster
Emergence of new objectives & T t ti
Objectives being clustered and economy objectives merging into the cluster
Regional development objectives closing in on the cluster
New objectives emerging
Emergence of new objectives
Kor Tourism Org

45
Lines
ii This is usually expressed as follows; 𝐶𝑥 = ∑ 𝐶𝑥(𝑃∗)− 𝐶𝑥(𝑃𝑖)𝑛𝑗=1
𝑚𝑚𝑥∑ 𝐶𝑥(𝑃∗)− 𝐶𝑥(𝑃𝑖)𝑛𝑗=1
, here, Cx (pi) is any centrality
measure of point i, and Cx (p *) is the largest such measure in the network. iii Power centrality is formally defined as follows: 𝐶𝑖 (𝛼,𝛽) = ∑ �𝛼 + 𝛽𝐶𝑗 �𝑅𝑖𝑗𝑛
𝑖 , here, 𝛼 is a constant to standardize the centrality index, 𝛽 is the level of interaction. 𝑅𝑖𝑗 is the adjacency matrix.