Embed Size (px)
Citation preview

Network Attack Visualization
Greg Contiwww.cc.gatech.edu/~conti

Disclaimer
The views expressed in this presentation are those of the author and do not reflect the official policy or position of the United States Military Academy, the Department of the Army, the Department of Defense or the U.S. Government.
image: http://www.leavenworth.army.mil/usdb/standard%20products/vtdefault.htm

information visualization is the use of interactive, sensory representations, typically visual, of abstract data to reinforce cognition.
http://en.wikipedia.org/wiki/Information_visualization

An Art Survey…
http://www.artinvest2000.com/leonardo_gioconda.htmhttp://www.geocities.com/h2lee/ascii/monalisa.htmlhttp://www.muppetlabs.com/~breadbox/bf/http://www.clifford.at/cfun/progex/
A B C

• Patterns• Anomalies• Comparisons• Outliers/Extremes• Big Picture & Details• Interaction• Large Datasets
Why InfoVis?
Replies
Views

TCP Dump
Tcpdump image: http://www.bgnett.no/~giva/pcap/tcpdump.pngTCPDump can be found at http://www.tcpdump.org/
Ethereal image: http://www.linux-france.org/prj/edu/archinet/AMSI/index/images/ethereal.gifEthereal by Gerald Combs can be found at http://www.ethereal.com/
EtherApe image: http://www.solaris4you.dk/sniffersSS.htmlEtherape by Juan Toledo can be found at http://etherape.sourceforge.net/
Ethereal
EtherApe
Packet Capture Visualizations

So What?• Go Beyond the Algorithm
– Complement current systems
• Make CTF a Spectator Sport• Enhance forensic analysis
– Mine large datasets – Logs
• Monitor in real time– Allow big picture, but details on demand– Fingerprint attacks/tools (people?)– Alerts (2-3 Million /day)
• Observe attacker behavior (example)
What tasks do you need help with?

Recon
Focused Attacks
Next Wave
Des
tina
tion
IP
Time

Classical InfoVis Research

InfoVis Mantra
http://www.cs.umd.edu/~ben/
Overview First
Zoom and Filter
Details on Demand

Overview and Detail
Examples by Dr. John Stasko, see www.cc.gatech.edu/classes/AY2002/ cs7450_spring/Talks/09-overdetail.ppt for more details.
Game shown is Civilization II

Focus and Context
Examples by Dr. John Stasko, see www.cc.gatech.edu/classes/AY2001/ cs7450_fall/Talks/8-focuscontext.ppt for more details.Table lens (right) is from Xerox Parc and Inxight
Fisheye View
Table Lens

For more information…
•Courses (free)•Conferences•Systems•Research Groups
Bookmarks on CD
Example Classical InfoVis Systems
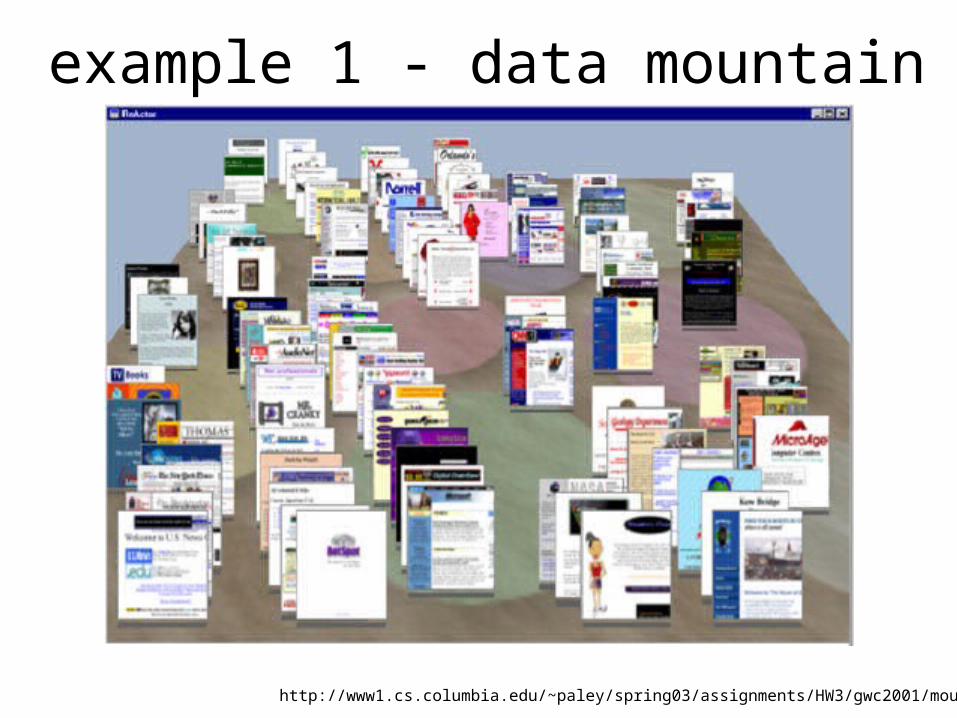
example 1 - data mountain
http://www1.cs.columbia.edu/~paley/spring03/assignments/HW3/gwc2001/mountain.jpg

example 2 - filmfinder
http://transcriptions.english.ucsb.edu/archive/colloquia/Kirshenbaum/filmfinder.gif

example 3 - parallel coordinates
A. Inselberg and B. Dimsdale. Parallel coordinates: A tool for visualizing multidimensional geometry. Proc. of Visualization '90, p. 361-78, 1990.
http://davis.wpi.edu/~xmdv/images/para.gif
MPG
35
0

example 4 -informative art
http://www.viktoria.se/fal/projects/infoart/
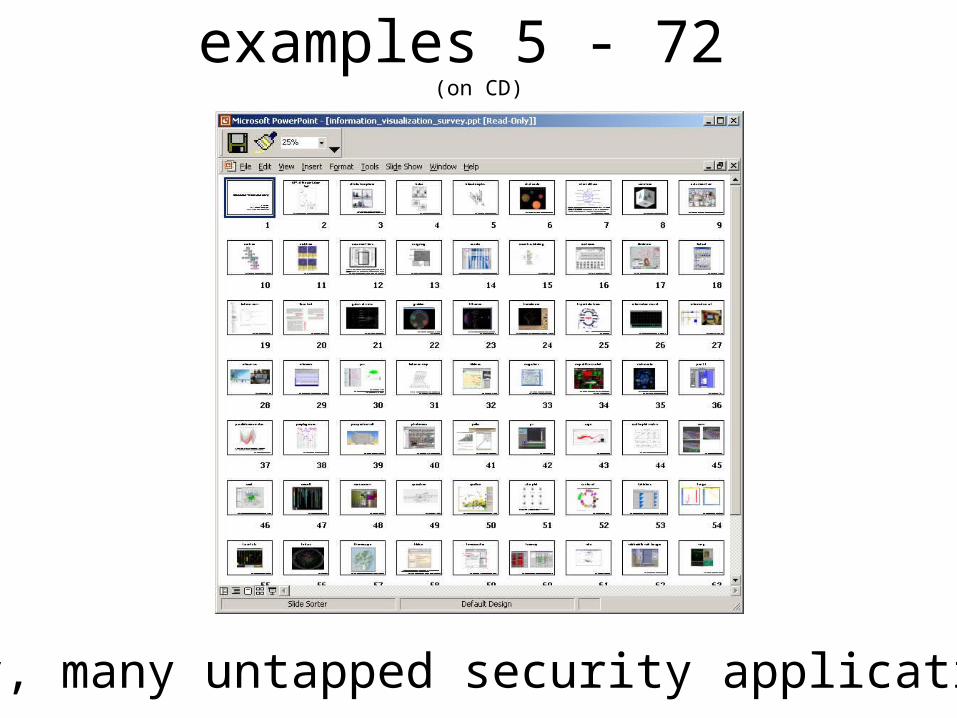
Many, many untapped security applications…
examples 5 - 72 (on CD)

More InformationInformation Visualization
• Envisioning Information by Tufte• The Visual Display of Quantitative Information by Tufte• Visual Explanations by Tufte• Beautiful Evidence by Tufte (due this year)• Information Visualization by Spence• Information Visualization: Using Vision to Think by Card• See also the Tufte road show, details at www.edwardtufte.com
images: www.amazon.com

Representative Security Visualization Research

Soon Tee Teoh
Routing Anomalies
http://graphics.cs.ucdavis.edu/~steoh/
See also treemap basic research: http://www.cs.umd.edu/hcil/treemap-history/index.shtml

Secure Scope
http://www.securedecisions.com/main.htm

Starlight
http://starlight.pnl.gov/

Open Source Security Information Management (OSSIM)
http://www.ossim.net/screenshots/metrics.jpg

TCP/IP SequenceNumber Generation
Initial paper - http://razor.bindview.com/publish/papers/tcpseq/print.htmlFollow-up paper - http://lcamtuf.coredump.cx/newtcp/
Linux 2.2 TCP/IP sequence numbers are not as good as they might be, but are certainly adequate, and attack feasibility is very low. Linux 2.2 TCP/IP sequence numbers are not as good as they might be, but are certainly adequate, and attack feasibility is very low.
Michal Zalewski
x[n] = s[n-2] - s[n-3] y[n] = s[n-1] - s[n-2] z[n] = s[n] - s [n-1]
x[n] = s[n-2] - s[n-3]
y[n] = s[n-1] - s[n-2]
z[n] = s[n] - s [n-1]

Wireless Visualization
http://www.ittc.ku.edu/wlan/images_all_small.shtml

Observing Intruder Behavior
Dr. Rob Erbacher
– Visual Summarizing and Analysis Techniques for Intrusion Data
– Multi-Dimensional Data Visualization
– A Component-Based Event-Driven Interactive Visualization Software Architecture
http://otherland.cs.usu.edu/~erbacher/

http://otherland.cs.usu.edu/~erbacher/
Glyphs
Dr. Rob Erbacher

examples 9 - 45(to be posted)

Hot Research Areas…• visualizing vulnerabilities • visualizing IDS alarms (NIDS/HIDS) • visualizing worm/virus propagation • visualizing routing anamolies • visualizing large volume computer network logs • visual correlations of security events • visualizing network traffic for security • visualizing attacks in near-real-time • security visualization at line speeds • dynamic attack tree creation (graphic) • forensic visualization
http://www.cs.fit.edu/~pkc/vizdmsec04/
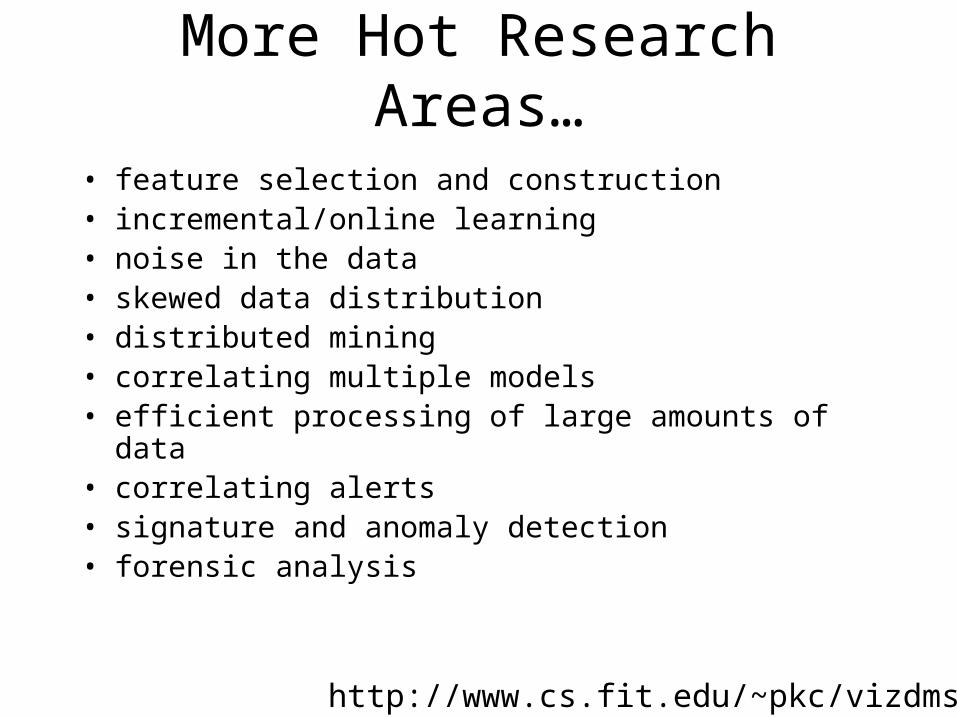
More Hot Research Areas…
• feature selection and construction • incremental/online learning • noise in the data • skewed data distribution • distributed mining • correlating multiple models • efficient processing of large amounts of data • correlating alerts • signature and anomaly detection • forensic analysis
http://www.cs.fit.edu/~pkc/vizdmsec04/

Building a System

Visual IDS

Ethernet
Packet Capture
Parse
Process
Plot
tcpdump(pcap, snort)
Perl
Perl
xmgrace(gnuplot)
tcpdumpcapturefiles
winpcap
VB
VB
VB
System Architecture
Creativity

rumint tool components (CD)


External Port Internal Port
65,535 65,535
0 0
External IP Internal IP
255.255.255.255 255.255.255.255
0.0.0.0 0.0.0.0
External IP Internal Port
255.255.255.255 65,535
0.0.0.0 0
parallel port views

External IP External Port Internal Port Internal IP
255.255.255.255 65,535 65,535 255.255.255.255
0.0.0.0 0 0 0.0.0.0
Also a Port to IP to IP to Port View

sara 5.0.3 (port to port view)
Light Medium Heavy

nmap 3 (RH8)
NMapWin 3 (XP)
SuperScan 3.0 (XP)
SuperScan 4.0 (XP)
nmap 3 UDP (RH8)
nmap 3.5 (XP)
scanline 1.01 (XP)
nikto 1.32 (XP)
Tool Fingerprinting(port to port view)

time sequence data(external port vs. packet)
nmap win superscan 3
port
s
port
spackets packets
Also internal/external IP and internal port

packet length and protocol type over time
port
s
packe
tslength

30 days on the Georgia Tech honeynet
External IP Internal Port External Port Internal Port

Demo’s
rumintxmgracetreemapworm propagationsurvey x 2 .pptlinks
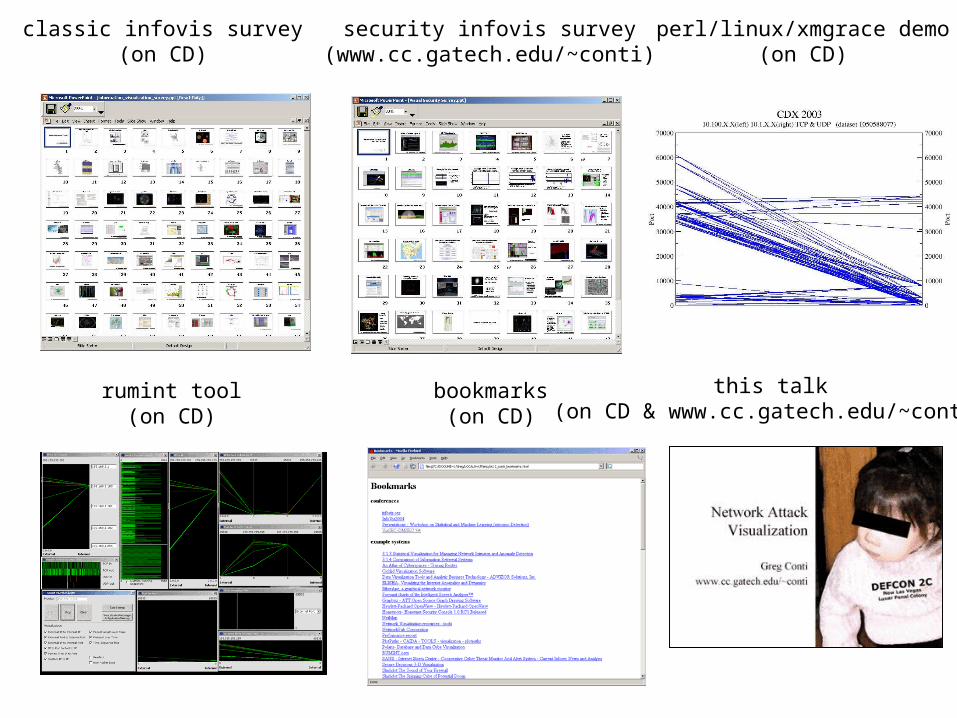
classic infovis survey(on CD)
security infovis survey(www.cc.gatech.edu/~conti)
perl/linux/xmgrace demo(on CD)
rumint tool(on CD)
bookmarks(on CD)
this talk(on CD & www.cc.gatech.edu/~conti)

Acknowledgements• 404.se2600
– Clint– Hendrick– icer– Rockit– StricK
• Dr. John Stasko– http://www.cc.gatech.edu/~john.stasko/
• Dr. Wenke Lee– http://www.cc.gatech.edu/~wenke/
• Dr. John Levine– http://www.eecs.usma.edu/
• Julian Grizzard– http://www.ece.gatech.edu/
Questions?http://carcino.gen.nz/images/index.php/04980e0b/53c55ca5