Embed Size (px)
Citation preview

Network analysis: Criminal specialization and fraud detection
Michele Tumminello, Andrea ConsiglioDepartment of Economics, Management and Statistics
University of Palermo

Summary• Bipartite Networks and statistically validated
networks
• The integrated Antifraud Archive
• Network indicators
• Criminal specialization and network motifs
• Conclusions

Bipartite networks
Car crashes
Vehicles or subjectsAuthors
Papers
Criminals
Crimes
Banks
Loans
Traders
Stocks
Actors
Movies
Mobile users
Phone calls
Plos ONE 2013
QF 2015 JEDC 2015
NJP 2015
NJP 2012 QF
2015
Plos ONE 2011

A statistical validation of co-occurrence
The question that characterizes the null hypothesis is: what is the probability that the number X occurs by chance?
N
Total # of events
NB
NAX
# of events where SA appears
# of events where
SB appears
# of events where both SA and SB appear
Suppose there are N events in the investigated set. Suppose we want to statistically validate the co-occurrence of subject SA and subject SB. Suppose that the number of events where SA (SB) appears is NA (NB), whereas the number of events where both SA and SB appear is X.
Tumminello M, Miccichè S, Lillo F, Piilo J, Mantegna RN (2011) Statistically Validated Networks in Bipartite Complex Systems. PLOS ONE 6(3): e17994. doi:10.1371/journal.pone.0017994 http://journals.plos.org/plosone/article?id=10.1371/journal.pone.0017994

Hypergeometric distribution and Statistically Validated Networks
p-value associated with a detection of co-occurrences ≥ X:
€
p =i=X
Min(NA ,NB )
∑
NA
i⎛
⎝ ⎜
⎞
⎠ ⎟ N − NA
NB − i⎛
⎝ ⎜
⎞
⎠ ⎟
NNB
⎛
⎝ ⎜
⎞
⎠ ⎟
• Count the total number of tests: T
• Arrange p-values in increasing order.
• Set a link between two vertices if the associated p-value satisfies one of the following inequalities
Bonferroni Network
Holm-Bonferroni Network
FDR Network

Type I error control: false positive links
Proposition 1: the probability that a false positive link is set in the Bonferroni network is smaller than .↵
Co-occurrences might be dependent

Bonferroni network• It’s the most conservative network
• The test is data independent
• A co-occurence equal to 1 is not statistically significant, provided that the number of links, E, in the co-occurrence network is larger than the number of nodes in the projected set divided by
p�value(nAB = 1|NA, NB , N) = NA NB(N �NA)! (N �NB)!
(N �NA �NB + 1)!� p�value(nAB = 1|1, 1, N) =
1
N>
0.01
E
↵

Type I error control: false positive links
Proposition 2: the probability that a false positive link is set in the Holm-Bonferroni network is smaller than .↵
Proposition 3: the expected proportion of false positive links in the FDR network is smaller than , under the (unrealistic) assumption that co-occurrences are independent.
↵

The Integrated Antifraud Archive (AIA)
• Time period: 2011-2016 • About 14 million car crashes • About 20 million individuals and companies • About 18 million vehicles
Tumminello M, Consiglio A, Project: “Network analysis and modelling of the integrated anti-fraud database”, funded by the Istituto per la Vigilanza sulle
Assicurazioni (IVASS), which is the National Agency that supervises the activity of all the insurance companies operating in Italy. Responsible for IVASS: Farabullini F

Distinguishing between subjects and vehicles
Nodes LinksConnected
components (CC)
Size of largest CC
Bonferroni network of subjects*
1,197,055 1,113,389 407.552 318,876
Bonferroni network of vehicles*
209,801 121.253 99,373 11
*Subjects and vehicles recorded in the white list have been excluded from the analysis

Bonferroni network: heterogeneity of subjects
Number of events per
subject
Subjects in the bipartite network
Difference btw Subjects in contiguous
groups
Events in the bipartite network
Subjects in the Bonferroni
network
Links in the Bonferroni
network
Subjects in the largest
connected component
Any 18,877,177 - 13,533,500 1,197,055 1,113,389 318,876
Less than 10,000 18,877,036 141 13,518,704 1,195,356 1,074,812 307,436
Less than 5,000 18,876,613 423 13,505,765 1,187,001 1,006,892 279,945
Less than 1,000 18,873,771 2842 13,473,986 1,156,706 826,475 170,671
Less than 500 18,871,669 2102 13,462,713 1,149,780 788,115 130,562
Less than100 18,856,567 15102 13,437,058 1,101,720 694,210 844

An indicator of link-robustness to geographical localization
n(i)=5; n(j)=4; n(i,j)=3
n(i)=12
30; n
(j)=87
0; n(
i,j)=25

An indicator of link-robustness to localization
T=total number of events in the dataset (T=13,533,500 in AIA 10/2016)
B=bonferroni threshold in the dataset (B=1.356e-10 in AIA 10/2016)
M(i,j)=Min(Q) such that p-value(n(i),n(j),n(i,j),Q)<B
Robustness indicator
R(i,j)=log10(T)-log10(M)
Properties:• Positivity • Fast evaluation

An indicator of link-robustness to localization: the rationale
n(i)=5; n(j)=4; n(i,j)=3
n(i)=12
30; n
(j)=87
0; n(
i,j)=25 R=1.83
R=3.05

Bonferroni network: distribution of link-robustness

Indicators
•Network level indicators
•Event/subject/vehicle level indicators

Subject indicators
The R indicator is an indicator of link robustness that can be used to construct an indicator of node relevance and/or centrality
(relevant, weighted, easy, and fast)
(relevant, unweighted, more complicated, slow)
Subject strength: s(i) =PN(i)
j=1 Ri,j
Subject average strength: as(i) =PN(i)
j=1 Ri,j
N(i)
Subject betweenness: b(i) =P
p,q�p,q(i)�p,q
, where �p,q is the number of shortest
paths between p and q and �p,q(i) is the number of those passing through i.

Event indicatorsFor any event e, the list L(e) of subject pairs with a validated connection “enhanced” by event e is compiled.
Event strength: s(e) =P
(i,j)2L(e) Ri,j
(meaningful, weighted, easy, and fast)
Event betweenness: theoretically easy, but unfeasible in practice (best guess)

Validated bipartite
VALIDATED BIPARTITE:
Given the SVN of subjects (or vehicles), a bipartite network is reconstructed by
•selecting from the original bipartite network all of the event(i)-subject(j) pairs such that event i contributed to a link in the SVN between subject(j) and (at least) another subject.
•finally adding all the subjects involved in the selected events.

K-H core of a bipartite network
The K-H core of a bipartite network is the largest bipartite subnetwork such that nodes of Set A have degree at least K and nodes of set B have degree at least H

Network indicators: Mixed event-subject indicators of centrality: the K-H core
Event oriented event-subject indicator:KHe(e, s) = max(K) such that (e, s) 2 K �H core
Subject oriented event-subject indicator:
KHs(e, s) = max(H) such that (e, s) 2 K �H core
Balanced event-subject indicator:
KH(e, s) = max(
pK ·H) such that (e, s) 2 K �H core

K-H CORE DECOMPOSITION of a validated bipartite community
(with K>1 and H>1)

Interlude: criminal specialization

The network of crimes
• We have a list of 336,069 individuals who have been suspected of at least one crime over one decade time window: about 2,000,000 instances.
• Crimes are coded in a list of 376 specific crime types (penal code)
• We have information about gender and age of individuals.
M Tumminello, C Edling, F Liljeros, RN Mantegna, J Sarnecki (2013) The Phenomenology of Specialization of Criminal Suspects. PLoS ONE 8(5): e64703. doi:10.1371/journal.pone.0064703

The color of nodes identifies clusters of crimes, according to the Infomap method
The weighted FDR network of crimes

Chapter 3 (Assault) - chapter 4 (Crimes against liberty and peace) – chapter 6 (sexual offences) - chapter 8 (Theft & Robbery) – chapter 9 (Fraud and other acts of dishonesty) – chapter 11 (tax offences) – chapter 12 (environmental offences).
Characterization of clusters

Interpretation of clusters in the FDR network
The method of cluster characterization has been introduced by MT et al. (2011), Community characterization of heterogeneous complex systems, J. Stat. Mech. P01019

Focus session: Big Data -- Berlin 2012March 26, 2012
Probability that a suspect who has been already suspected of "t" crimes in her career is then suspected of a crime, the "t+1" crime, which belongs to the same cluster as crime "t", as a function of (the proxy of) career progression "t".
“The little specialization, which still exists, occurs after adolescence and increases with criminal career progression” (Blumstein1986,Piquero1999).

Criminal specialization and organized crime
• A collaboration between Procura di Palermo (Gery Ferrara) and University of Palermo (Michele Tumminello and Salvatore Micciche’).
• Data: – Criminal records (“casellario giudiziario”) – Detailed vital statistics (“anagrafica di secondo
livello” – incomplete)

FDR network of crimes
Extremely violent crimes Weapons and violent crimes Mafia & weapons Robbery Armed Robbery Drugs

Specialization and criminal careerSweden Palermo dataset
At the beginning of their career, criminals included in the Palermo dataset are generalists.

A network of two families
An important motif
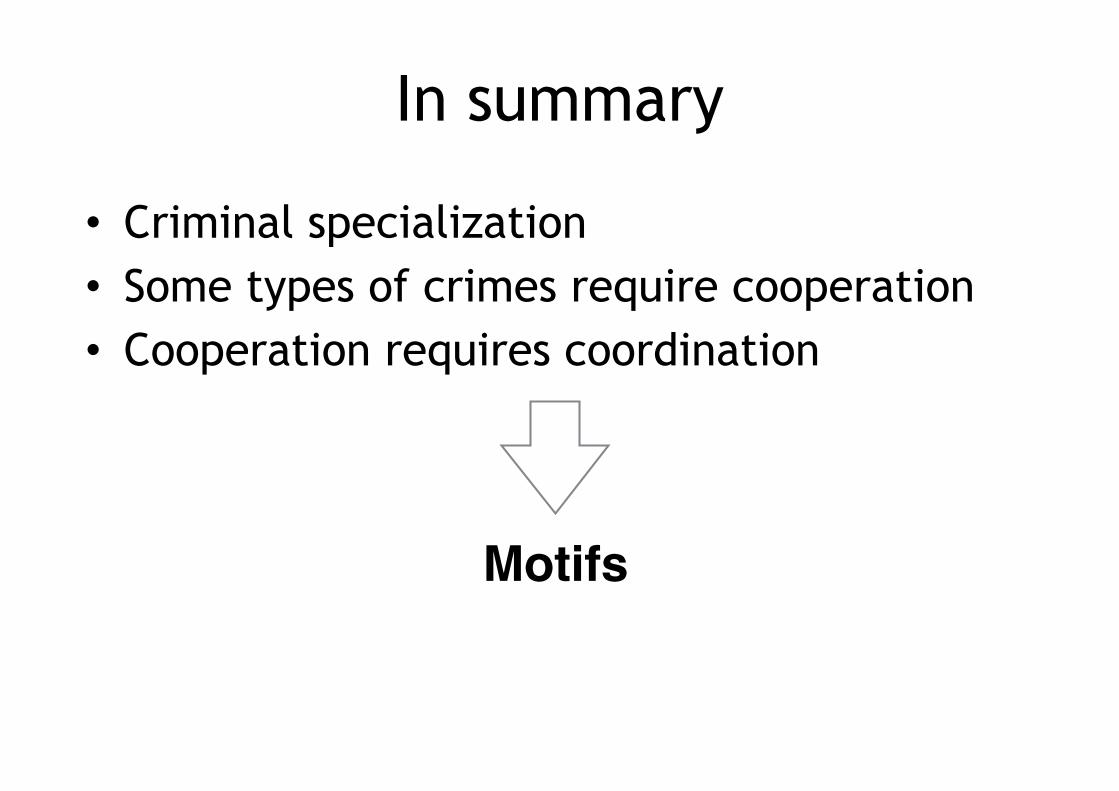
In summary
• Criminal specialization • Some types of crimes require cooperation • Cooperation requires coordination
Motifs

Three-node motifs: triangles
Nn1 n2
n3
n*12
n*13 n*23
n123
p-value = p(n⇤12 + n⇤
13 + n⇤23 � n⇤,0
12 + n⇤,013 + n⇤,0
23 )
p(n⇤12, n
⇤13, n
⇤23|n1, n2, n3, N) =
X
n12
� n1
n12
�� N�n1
n2�n12
�� n12
n12�n⇤12
��n1�n12
n⇤13
��n2�n12
n⇤23
�� N�n1�n2+n12
n3�n⇤13�n⇤
23�n12�n⇤12
�
�Nn2
��Nn3
�

Three-node motifs and antifraud
• Number of triangles: 162,409 • Number of statistically validated triangles:60,523
Network of directly involved subjects (no professionals)
Randomly rewired network of directly involved subjects
• Average number of triangles: 18,535 • Average Number of statistically validated triangles: 0.08

Preliminary conclusions
1. The network of subjects and vehicles carry different information.
2. Considered network indicators and AIA (node) indicators carry complementary information, and, therefore, can fruitfully be integrated.
4. The test on “claims closed following investigation” and the analysis of a few case studies indicate the effectiveness of the overall approach: next step is developing and tuning network indicators with respect to such benchmarks.