Embed Size (px)
Citation preview
NetIQ® AppManager® for Agentless Monitoring
Management Guide
February 2014

Legal Notice
THIS DOCUMENT AND THE SOFTWARE DESCRIBED IN THIS DOCUMENT ARE FURNISHED UNDER AND ARE SUBJECT TO THE TERMS OF A LICENSE AGREEMENT OR A NON-DISCLOSURE AGREEMENT. EXCEPT AS EXPRESSLY SET FORTH IN SUCH LICENSE AGREEMENT OR NON-DISCLOSURE AGREEMENT, NETIQ CORPORATION PROVIDES THIS DOCUMENT AND THE SOFTWARE DESCRIBED IN THIS DOCUMENT "AS IS" WITHOUT WARRANTY OF ANY KIND, EITHER EXPRESS OR IMPLIED, INCLUDING, BUT NOT LIMITED TO, THE IMPLIED WARRANTIES OF MERCHANTABILITY OR FITNESS FOR A PARTICULAR PURPOSE. SOME STATES DO NOT ALLOW DISCLAIMERS OF EXPRESS OR IMPLIED WARRANTIES IN CERTAIN TRANSACTIONS; THEREFORE, THIS STATEMENT MAY NOT APPLY TO YOU.
For purposes of clarity, any module, adapter or other similar material ("Module") is licensed under the terms and conditions of the End User License Agreement for the applicable version of the NetIQ product or software to which it relates or interoperates with, and by accessing, copying or using a Module you agree to be bound by such terms. If you do not agree to the terms of the End User License Agreement you are not authorized to use, access or copy a Module and you must destroy all copies of the Module and contact NetIQ for further instructions.
This document and the software described in this document may not be lent, sold, or given away without the prior written permission of NetIQ Corporation, except as otherwise permitted by law. Except as expressly set forth in such license agreement or non-disclosure agreement, no part of this document or the software described in this document may be reproduced, stored in a retrieval system, or transmitted in any form or by any means, electronic, mechanical, or otherwise, without the prior written consent of NetIQ Corporation. Some companies, names, and data in this document are used for illustration purposes and may not represent real companies, individuals, or data.
This document could include technical inaccuracies or typographical errors. Changes are periodically made to the information herein. These changes may be incorporated in new editions of this document. NetIQ Corporation may make improvements in or changes to the software described in this document at any time.
U.S. Government Restricted Rights: If the software and documentation are being acquired by or on behalf of the U.S. Government or by a U.S. Government prime contractor or subcontractor (at any tier), in accordance with 48 C.F.R. 227.7202-4 (for Department of Defense (DOD) acquisitions) and 48 C.F.R. 2.101 and 12.212 (for non-DOD acquisitions), the government’s rights in the software and documentation, including its rights to use, modify, reproduce, release, perform, display or disclose the software or documentation, will be subject in all respects to the commercial license rights and restrictions provided in the license agreement.
© 2014 NetIQ Corporation and its affiliates. All Rights Reserved.
For information about NetIQ trademarks, see https://www.netiq.com/company/legal/.

Contents
About this Book and the Library 5About NetIQ Corporation 7
1 Introducing AppManager for Agentless Monitoring 9
2 Installing AppManager for Agentless Monitoring 11
2.1 System Requirements . . . . . . . . . . . . . . . . . . . . . . . . . . . . . . . . . . . . . . . . . . . . . . . . . . . . . . . . . . . . 112.2 Pre-installation Considerations . . . . . . . . . . . . . . . . . . . . . . . . . . . . . . . . . . . . . . . . . . . . . . . . . . . . . 132.3 Installing the Module . . . . . . . . . . . . . . . . . . . . . . . . . . . . . . . . . . . . . . . . . . . . . . . . . . . . . . . . . . . . . 132.4 Deploying the Module with Control Center. . . . . . . . . . . . . . . . . . . . . . . . . . . . . . . . . . . . . . . . . . . . . 142.5 Silently Installing the Module . . . . . . . . . . . . . . . . . . . . . . . . . . . . . . . . . . . . . . . . . . . . . . . . . . . . . . . 152.6 Configuring Security Credentials . . . . . . . . . . . . . . . . . . . . . . . . . . . . . . . . . . . . . . . . . . . . . . . . . . . . 162.7 Monitoring the Health of the Monitoring Server . . . . . . . . . . . . . . . . . . . . . . . . . . . . . . . . . . . . . . . . . 182.8 Scalability Considerations . . . . . . . . . . . . . . . . . . . . . . . . . . . . . . . . . . . . . . . . . . . . . . . . . . . . . . . . . 192.9 Discovering Remote Computer Resources . . . . . . . . . . . . . . . . . . . . . . . . . . . . . . . . . . . . . . . . . . . . 20
3 Agentless Knowledge Scripts 23
3.1 Monitoring Remote Computers Having Different Threshold Values . . . . . . . . . . . . . . . . . . . . . . . . . 243.2 CPUUtilization . . . . . . . . . . . . . . . . . . . . . . . . . . . . . . . . . . . . . . . . . . . . . . . . . . . . . . . . . . . . . . . . . . 253.3 DiskSpace . . . . . . . . . . . . . . . . . . . . . . . . . . . . . . . . . . . . . . . . . . . . . . . . . . . . . . . . . . . . . . . . . . . . . 273.4 MemoryUtilization. . . . . . . . . . . . . . . . . . . . . . . . . . . . . . . . . . . . . . . . . . . . . . . . . . . . . . . . . . . . . . . . 313.5 MonitoringInterval . . . . . . . . . . . . . . . . . . . . . . . . . . . . . . . . . . . . . . . . . . . . . . . . . . . . . . . . . . . . . . . 323.6 NetworkUtilization . . . . . . . . . . . . . . . . . . . . . . . . . . . . . . . . . . . . . . . . . . . . . . . . . . . . . . . . . . . . . . . 333.7 RemoteComputerStatus . . . . . . . . . . . . . . . . . . . . . . . . . . . . . . . . . . . . . . . . . . . . . . . . . . . . . . . . . . 35
Contents 3

4 NetIQ AppManager for Agentless Monitoring Management Guide

About this Book and the Library
The NetIQ AppManager product (AppManager) is a comprehensive solution for managing, diagnosing, and analyzing performance, availability, and health for a broad spectrum of operating environments, applications, services, and server hardware.
AppManager provides system administrators with a central, easy-to-use console to view critical server and application resources across the enterprise. With AppManager, administrative staff can monitor computer and application resources, check for potential problems, initiate responsive actions, automate routine tasks, and gather performance data for real-time and historical reporting and analysis.
Intended AudienceThis guide provides information for individuals responsible for installing an AppManager module and monitoring specific applications with AppManager.
Other Information in the LibraryThe library provides the following information resources:
Installation Guide for AppManager Provides complete information about AppManager pre-installation requirements and step-by-step installation procedures for all AppManager components.
User Guide for AppManager Control Center Provides complete information about managing groups of computers, including running jobs, responding to events, creating reports, and working with Control Center. A separate guide is available for the AppManager Operator Console.
Administrator Guide for AppManager Provides information about maintaining an AppManager management site, managing security, using scripts to handle AppManager tasks, and leveraging advanced configuration options.
Upgrade and Migration Guide for AppManager Provides complete information about how to upgrade from a previous version of AppManager.
Management guides Provide information about installing and monitoring specific applications with AppManager.
Help Provides context-sensitive information and step-by-step guidance for common tasks, as well as definitions for each field on each window.
The AppManager library is available in Adobe Acrobat (PDF) format from the AppManager Documentation page of the NetIQ Web site.
About this Book and the Library 5

6 NetIQ AppManager for Agentless Monitoring Management Guide

About NetIQ Corporation
We are a global, enterprise software company, with a focus on the three persistent challenges in your environment: Change, complexity and risk—and how we can help you control them.
Our ViewpointAdapting to change and managing complexity and risk are nothing new
In fact, of all the challenges you face, these are perhaps the most prominent variables that deny you the control you need to securely measure, monitor, and manage your physical, virtual, and cloud computing environments.
Enabling critical business services, better and faster We believe that providing as much control as possible to IT organizations is the only way to enable timelier and cost effective delivery of services. Persistent pressures like change and complexity will only continue to increase as organizations continue to change and the technologies needed to manage them become inherently more complex.
Our PhilosophySelling intelligent solutions, not just software
In order to provide reliable control, we first make sure we understand the real-world scenarios in which IT organizations like yours operate — day in and day out. That's the only way we can develop practical, intelligent IT solutions that successfully yield proven, measurable results. And that's so much more rewarding than simply selling software.
Driving your success is our passion We place your success at the heart of how we do business. From product inception to deployment, we understand that you need IT solutions that work well and integrate seamlessly with your existing investments; you need ongoing support and training post-deployment; and you need someone that is truly easy to work with — for a change. Ultimately, when you succeed, we all succeed.
Our Solutions Identity & Access Governance Access Management Security Management Systems & Application Management Workload Management Service Management
About NetIQ Corporation 7

Contacting Sales SupportFor questions about products, pricing, and capabilities, contact your local partner. If you cannot contact your partner, contact our Sales Support team.
Contacting Technical SupportFor specific product issues, contact our Technical Support team.
Contacting Documentation SupportOur goal is to provide documentation that meets your needs. The documentation for this product is available on the NetIQ Web site in HTML and PDF formats on a page that does not require you to log in. If you have suggestions for documentation improvements, click comment on this topic at the bottom of any page in the HTML version of the documentation posted at www.netiq.com/documentation. You can also email [email protected]. We value your input and look forward to hearing from you.
Contacting the Online User CommunityNetIQ Communities, the NetIQ online community, is a collaborative network connecting you to your peers and NetIQ experts. By providing more immediate information, useful links to helpful resources, and access to NetIQ experts, NetIQ Communities helps ensure you are mastering the knowledge you need to realize the full potential of IT investments upon which you rely. For more information, visit community.netiq.com.
Worldwide: www.netiq.com/about_netiq/officelocations.asp
United States and Canada: 1-888-323-6768
Email: [email protected]
Web Site: www.netiq.com
Worldwide: www.netiq.com/support/contactinfo.asp
North and South America: 1-713-418-5555
Europe, Middle East, and Africa: +353 (0) 91-782 677
Email: [email protected]
Web Site: www.netiq.com/support
8 NetIQ AppManager for Agentless Monitoring Management Guide

1 1Introducing AppManager for Agentless Monitoring
AppManager for Agentless Monitoring allows you to monitor remote Windows and UNIX computers without having to install the AppManager agent on these computers. Install the AppManager agent only on the computer where you want to install this module and the monitoring server (PlateSpin Recon Server). The agent computer is the computer on which you install the AppManager agent, the AppManager for Agentless Monitoring module, and the monitoring server.
This release of AppManager for Agentless Monitoring allows you to monitor up to 700 remote computers.
Use AppManager for Agentless Monitoring to monitor the following:
Availability of the remote computer for monitoring CPU statistics, such as CPU usage and queue length Logical disk statistics, such as the percentage of disk space used and the amount of free space
available Network utilization for network interface cards (NICs) Physical memory usage
Introducing AppManager for Agentless Monitoring 9

10 NetIQ AppManager for Agentless Monitoring Management Guide
2 2Installing AppManager for Agentless Monitoring
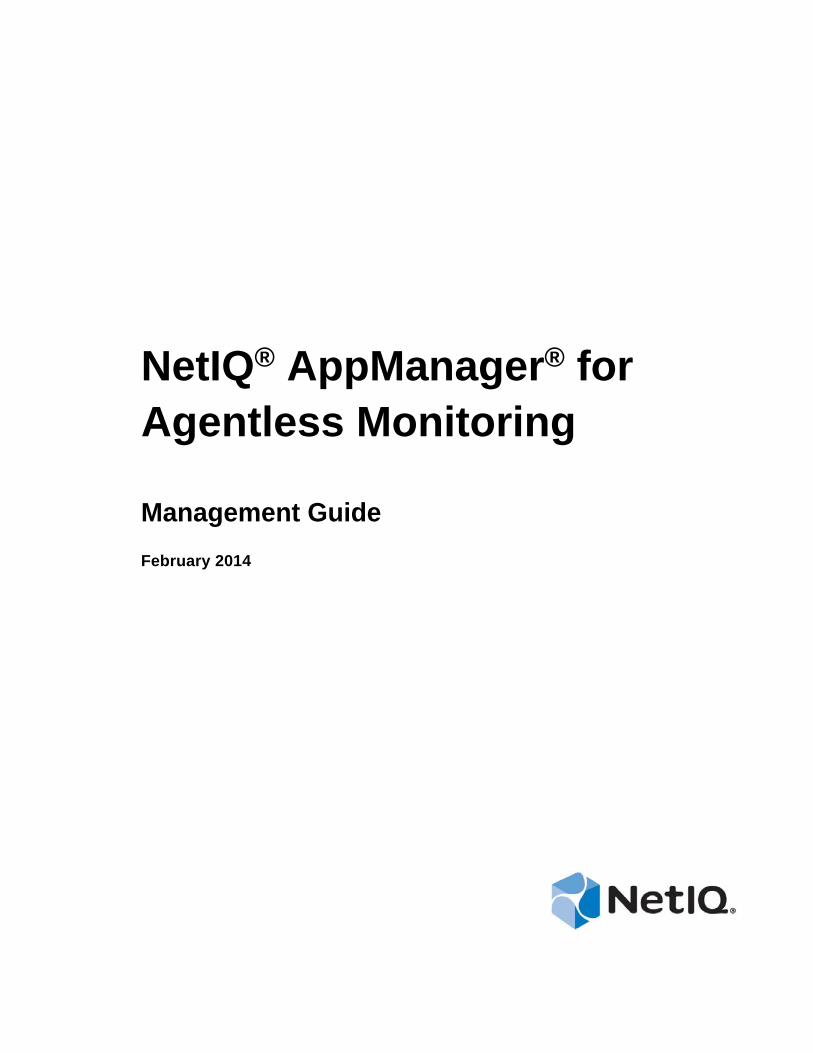
This chapter provides installation instructions and describes system requirements for AppManager for Agentless Monitoring.
This chapter assumes you have AppManager installed. For more information about installing AppManager or about AppManager system requirements, see the Installation Guide for AppManager, which is available on the AppManager Documentation page.
2.1 System RequirementsFor the latest information about supported software versions and the availability of module updates, visit the AppManager Supported Products page. Unless noted otherwise, this module supports all updates, hotfixes, and service packs for the releases listed below.
AppManager for Agentless Monitoring has the following system requirements:
Software/Hardware Version
NetIQ AppManager installed on the AppManager repository (QDB) computers, on the agent computer that has the monitoring server installed, and on all console computers
8.2 or later
Agent computer requirements Disk Space: 100 GB free
Memory: 16 GB recommended
Processor: Xeon 2.8 GHz or 3.2 GHz dual core or multi-processor
Management server requirements Disk Space: 100 GB free
Memory: 8 GB recommended
Processors: 8
AppManager repository computer requirements
Database Server: SQL Server 2008 R2
Disk Space: 100 GB free
Memory: 16 GB recommended
Processors: 8
Microsoft Windows operating system on the agent computer
Windows Server 2008 R2
Installing AppManager for Agentless Monitoring 11

Microsoft Windows operating system on the remote computers that you want to monitor
One of the following Windows operating systems:
Windows Server 2012 R2
Windows Server 2012
Windows 8.1 (32-bit or 64-bit)
Windows 8 (32-bit or 64-bit)
Windows Server 2008 R2
Windows Server 2008 (SP2, SP1) (32-bit or 64-bit)
Windows Server 2003 R2 (SP2 SS/ES, SP1 SS/ES)
Windows Server 2003 (SP2, SP1, SP0) (32-bit or 64-bit)
Windows XP (SP3, SP2, SP1, SP0) (32-bit or 64-bit)
UNIX operating system on the remote computers that you want to monitor
One of the following UNIX/Linux operating systems:
Oracle Linux 6.3, 6.2, 6.1, 6.0, 5.9, 5.8, 5.7, 5.6, 5.5, 5.4, 5.3 (32-bit or 64-bit)
Novell Open Enterprise Server (OES) 11 Linux (64-bit)
Novell Open Enterprise Server (OES) 2 SP3 Linux (32-bit or 64-bit)
Novell SUSE Linux Enterprise Server (SLES) 11 SP2, 11 SP1, 11, 10 SP3, 10 SP2, 10 SP1, 10.0, 9.x (32-bit or 64-bit)
Red Hat Enterprise Linux 6.3 ES, 6.2 ES, 6.1 ES, 6.0 ES, 5.9 ES, 5.8 ES, 5.7 ES, 5.5 ES, 5.4 ES, 5.3 ES, 5.2 ES, 5.1 AS/ES, 5.0 AS/ES, 4.0 AS/ES, 3.0 AS/ES (32-bit or 64-bit)
Novell SUSE Linux 8.0 (32-bit)
Red Hat Linux 9.2, 9.1, 9.0, 8.0, 7.3 (32-bit or 64-bit)
Red Hat Enterprise Linux 2.x AS/ES (32-bit)
Novell OpenSUSE 12.1, 11.4, 11.1, 11, 10.3, 10.2, 10.1 (32-bit or 64-bit)
Fedora Core 10, 9, 8, 7, 6, 5, 4, 3 (32-bit or 64-bit)
CentOS 2.0 (32-bit)
Ubuntu 12.04, 11.10, 8.10, 8.04, 7.1 (32-bit or 64-bit)
CentOS 6.2, 6.1, 5.2, 5.1, 4.6, 3.9 (32-bit or 64-bit)
Sun Solaris 10, 9, 8 (SPARC/x86) (32-bit or 64-bit)
Sun Solaris 7 (SPARC) (32-bit)
IBM AIX 6.1, 5.3 TL7 or later, 5.2 (32-bit or 64-bit)
Microsoft .NET Framework on the agent computer
3.5 SP1
Software/Hardware Version
12 NetIQ AppManager for Agentless Monitoring Management Guide

2.2 Pre-installation ConsiderationsBefore installing this module on the agent computer, use the PlateSpin Recon executable file that you downloaded from the download package to install the following on the agent computer:
Monitoring server (PlateSpin Recon Server) Monitoring client (PlateSpin Recon Client)
For information about installing the monitoring server and client, see the Installing PlateSpin Recon section in the PlateSpin Recon Getting Started Guide.
IMPORTANT: This module supports only SQL Express 2008 R2 and SQL Server 2008 R2 databases for monitoring server installation.
You must activate the PlateSpin Recon license. For information about the PlateSpin Recon license, please contact your NetIQ Representative or Technical Support.
2.3 Installing the ModuleRun the module installer on the agent computers to install the agent components, and run the module installer on all console computers to install the Help and console extensions.
Access the AM70-Agentless-8.x.x.0.msi module installer from the AM70_Agentless_8.x.x.0 self-extracting installation package on the AppManager Module Upgrades & Trials page.
For Windows environments where User Account Control (UAC) is enabled, install the module using an account with administrative privileges. Use one of the following methods:
Log in to the server using the account named Administrator. Then, run the module installer AM70-Agentless-8.x.x.0.msi file from a command prompt or by double-clicking it.
Log in to the server as a user with administrative privileges and run the module installer AM70-Agentless-8.x.x.0.msi file as an administrator from a command prompt. To open a command-prompt window at the administrative level, right-click a command-prompt icon or a Windows menu item and select Run as administrator.
You can install the Knowledge Scripts into local or remote AppManager repositories (QDBs). The module installer installs Knowledge Scripts for each module directly into the QDB.
You can install the module manually, or you can use Control Center to deploy the module to a remote computer where an agent is installed. For more information, see Section 2.4, “Deploying the Module with Control Center,” on page 14. However, if you use Control Center to deploy the module, Control Center only installs the agent components of the module. The module installer installs the QDB and console components as well as the agent components on the agent computer.
To install the module manually:
1 Double-click the module installer .msi file. 2 Accept the license agreement. 3 Review the results of the pre-installation check. You can expect one of the following three
scenarios: No AppManager agent is present: In this scenario, the pre-installation check fails, and the
installer does not install agent components.
Installing AppManager for Agentless Monitoring 13

An AppManager agent is present, but some other prerequisite fails: In this scenario, the default is to not install agent components because of one or more missing prerequisites. However, you can override the default by selecting Install agent component locally. A missing application server for this particular module often causes this scenario. For example, this module requires the presence of the monitoring server (PlateSpin Recon Server 4.0 or later) on the selected computer.
All prerequisites are met: In this scenario, the installer installs the agent components.4 To install the Knowledge Scripts into the QDB:
4a Select Install Knowledge Scripts to install the repository components, including the Knowledge Scripts, object types, and SQL stored procedures.
4b Specify the SQL Server name of the server hosting the QDB, as well as the case-sensitive QDB name. Note Microsoft .NET Framework 3.5 is required on the computer where you run the installation program for the QDB portion of the module. For computers running more recent versions of Windows operating systems that use a newer version of .NET, install .NET 3.5 with the Add Roles and Features wizard in Windows Server Manager, as described in this Microsoft article.
5 Run the module installer only for the primary QDB. Control Center automatically replicates this module to secondary QDBs.
6 Run the module installer on all console computers to install the Help and console extensions.7 Run the module installer on the agent computers to install the agent components. 8 Configure the security credentials in AppManager Security Manager. For more information, see
Section 2.6, “Configuring Security Credentials,” on page 16.9 (Conditional) If you have not discovered remote computer resources, run the
Discovery_Agentless Knowledge Script on the agent computer to discover the remote computers to monitor. For more information, see Section 2.9, “Discovering Remote Computer Resources,” on page 20.
After the installation has completed, the Agentless_Install.log file, located in the \NetIQ\Temp\NetIQ_Debug\ServerName folder, lists any problems that occurred.
2.4 Deploying the Module with Control CenterYou can use Control Center to deploy the module to a remote computer where an agent is installed. This topic briefly describes the steps involved in deploying a module and provides instructions for checking in the module installation package. For more information, see the Control Center User Guide for AppManager, which is available on the AppManager Documentation page.
2.4.1 Deployment Overview
This section describes the tasks required to deploy the module on an agent computer.
To deploy the module on an agent computer:
1 Verify the default deployment credentials. 2 Check in an installation package. For more information, see Section 2.4.2, “Checking In the
Installation Package,” on page 15.3 Configure an email address to receive notification of a deployment. 4 Create a deployment rule or modify an out-of-the-box deployment rule.
14 NetIQ AppManager for Agentless Monitoring Management Guide

5 Approve the deployment task. 6 View the results.
2.4.2 Checking In the Installation Package
You must check in the installation package, AM70-Agentless-8.x.x.0.xml, before you can deploy the module on an agent computer.
To check in a module installation package:
1 Log in to Control Center using an account that is a member of a user group with deployment permissions.
2 Navigate to the Deployment tab.3 In the Deployment folder, select Packages.4 On the Tasks pane, click Check in Deployment Packages.5 Navigate to the folder where you saved AM70-Agentless-8.x.x.0.xml and select the file. 6 Click Open. The Deployment Package Check in Status dialog box displays the status of the
package check in.
2.5 Silently Installing the ModuleTo silently (without user intervention) install a module using the default settings, run the following command from the folder in which you saved the module installer:
msiexec.exe /i "AM70-Agentless-8.x.x.0.msi" /qn
where x.x is the actual version number of the module installer.
To create a log file that describes the operations of the module installer, add the following flag to the command noted above:
/L* "AM70-Agentless-8.x.x.0.msi.log"
The log file is created in the folder in which you saved the module installer.
NOTE: To perform a silent install on an AppManager agent running Windows Server 2008 R2, open a command prompt at the administrative level and select Run as administrator before you run the silent install command listed above.
To silently install the module to a remote AppManager repository, you can use Windows authentication or SQL authentication.
Windows authentication:
AM70-Agentless-8.x.x.0.msi /qn MO_B_QDBINSTALL=1 MO_B_MOINSTALL=0 MO_B_SQLSVR_WINAUTH=1 MO_SQLSVR_NAME=SQLServerName MO_QDBNAME=AM-RepositoryName
SQL authentication:
AM70-Agentless-8.x.x.0.msi /qn MO_B_QDBINSTALL=1 MO_B_MOINSTALL=0 MO_B_SQLSVR_WINAUTH=0 MO_SQLSVR_USER=SQLLogin MO_SQLSVR_PWD=SQLLoginPassword MO_SQLSVR_NAME=SQLServerName MO_QDBNAME=AM-RepositoryName
Installing AppManager for Agentless Monitoring 15
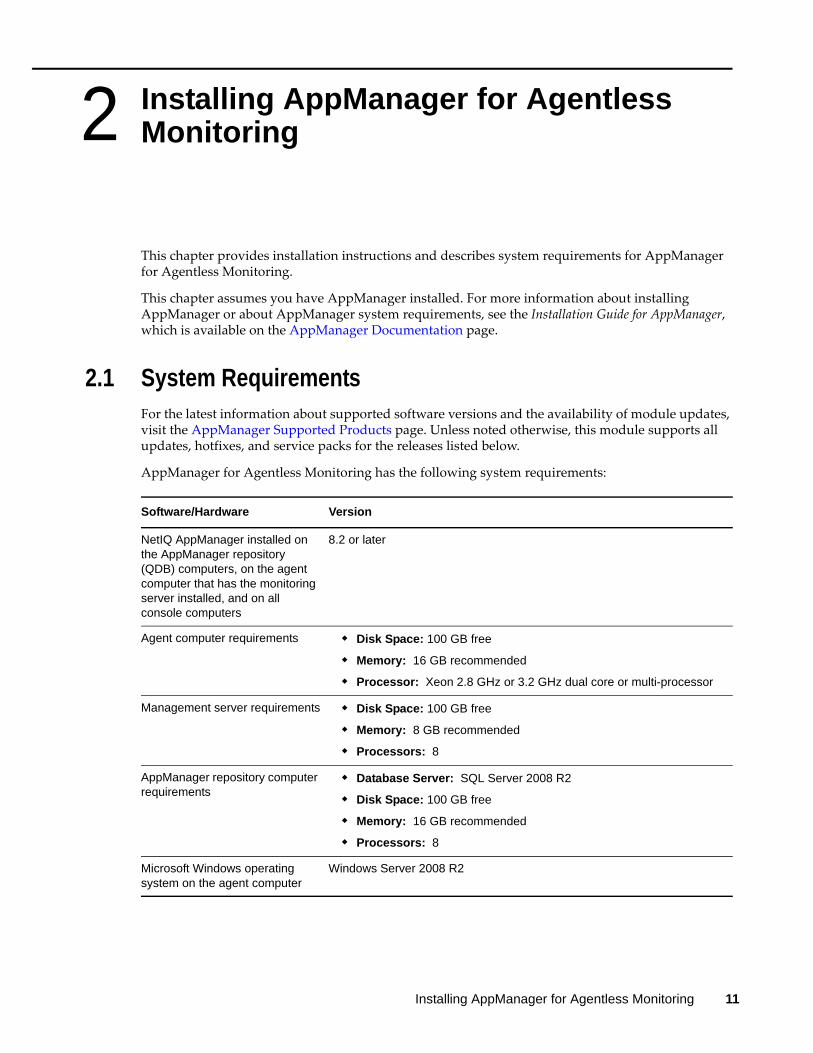
2.6 Configuring Security CredentialsYou must configure the following credentials in AppManager Security Manager before you run the Knowledge Script:
Section 2.6.1, “Configuring Monitoring Server Credentials,” on page 16 Section 2.6.2, “Configuring Remote Computer Credentials,” on page 16
2.6.1 Configuring Monitoring Server Credentials
Configuring monitoring server credentials provides the agent with the account information needed to connect to the monitoring server. Add these credentials to AppManager Security Manager before you run Knowledge Scripts.
On the Custom tab in Security Manager, complete the following fields:
IMPORTANT: If you modify the previously specified monitoring server credentials in Security Manager, you must restart the NetIQ AppManager Client Resource Monitor (NetIQmc) service for the new credentials to be effective.
2.6.2 Configuring Remote Computer Credentials
Before you run the Discovery_Agentless Knowledge Script, you must configure the remote computer credentials in the Security Manager. Depending on whether you want to discover computers listed in a file or discover computers within a specified IP address range, review the following sections:
“Discovering Computers Listed in a File” on page 16 “Discovering Computers Within an IP Address Range” on page 18
Discovering Computers Listed in a File
On the agent computer, use a spreadsheet program such as Microsoft Excel to list all the remote computers you want to monitor in the following format:
Field Description
Label Agentless
Sub-label Monitoring_Server
Value 1 For local account: IP address or computer name of the AppManager agent computer as shown in the Control Center or Operator Console.
For domain account: Domain name of the user account that has access to the monitoring server
Value 2 User name for the account that has the permission to log on to the monitoring server. The user specified in this field can be a local user or a domain user.
Value 3 Password for the user name identified in the Value 2 field.
Extended application support Required field. Encrypts the user name and password in Security Manager. Do not leave this option unselected.
16 NetIQ AppManager for Agentless Monitoring Management Guide

where:
ComputerName: List the NetBIOS, FQDN, or IP Address of the remote computer in column 1 of the spreadsheet.
GroupName: All remote computers that have the same type of operating system and use the same set of credentials can be grouped together and provided a common group name. List the group name to which the remote computer belongs in column 2 of the spreadsheet.
OperatingSystem: List the type of operating system (Windows or UNIX) installed on the remote computer in column 3 of the spreadsheet.
Every remote computer you want to monitor must have an entry on a separate row in this spreadsheet. Save the spreadsheet as a .csv file. To run the Discovery_Agentless script, you need to provide the full path to this .csv discovery input file in the Discovery Parameters section of the Discovery_Agentless script.
A sample discovery input file is as follows:
On the Custom tab in Security Manager, complete the following fields for every computer group entered in the discovery input file:
ComputerName GroupName OperatingSystem
10.0.0.1 Group1 Windows
computer_name.domain_name.com Group2 Windows
10.0.0.2 Group3 UNIX
10.0.0.5 Group2 Windows
computer_name Group3 UNIX
10.0.0.9 Group1 Windows
Field Description
Label Agentless
Sub-label The group name provided in the second column of discovery input file, such as Group1 in the sample discovery input .csv file.
Value 1 User name for the account that has the permission to connect to the remote computer and retrieve the required information. You can type the user name with the domain name, such as Domain\User name. The user specified in this field can be a local user or a domain user.
Value 2 Password for the user name identified in the Value 1 field.
Value 3 Leave this field blank.
Extended application support Required field. Encrypts the user name and password in Security Manager. Do not leave this option unselected.
Installing AppManager for Agentless Monitoring 17

Discovering Computers Within an IP Address Range
On the Custom tab in Security Manager, complete the following fields for every IP address range of computers you want to discover:
2.7 Monitoring the Health of the Monitoring ServerNetIQ Corporation recommends using the following AppManager Knowledge Scripts to monitor the health of the monitoring server:
Field Description
Label Agentless
Sub-label The group name for all remote computers within an IP address range, having the same type of operating system, and using the same set of credentials.
Value 1 User name for the account that has the permission to connect to the remote computer and retrieve the required information. You can type the user name with the domain name, such as Domain\User name. The user specified in this field can be a local user or a domain user.
Value 2 Password for the user name identified in the Value 1 field.
Value 3 Leave this field blank.
Extended application support Required field. Encrypts the user name and password in Security Manager. Do not leave this option unselected.
Knowledge Script What it Monitors
NT_ServiceDown Monitors the stopped and started status of the following monitoring services:
PlateSpin Recon Monitoring Service
PlateSpin Recon Service
Optionally, starts services that are stopped.
SQL_DBSpace Monitors the available database space and the percentage of database space being used for the following monitoring databases:
platespin_powerrecon_410_application
platespin_powerrecon_410_monitoring
IIS_HealthCheck Monitors the status of IIS services and Web sites. Optionally, restarts the IIS service or Web site.
18 NetIQ AppManager for Agentless Monitoring Management Guide

2.8 Scalability ConsiderationsTo achieve the best performance when monitoring up to 700 remote computers, NetIQ Corporation recommends you configure the following settings.
On the AppManager Management Server:
1. Edit the Data Thread and PIOC file setting:a. Navigate to the following location in the Registry Editor:
\SOFTWARE\Wow6432Node\NetIQ\AppManager\4.0\NetIQms\Config
b. Set Data Thread to 4. The default is 2.c. Set PIOC Data Map File Size MB to 100. The default is 25.d. Restart the NetIQms service.
2. Disable tracing:a. Navigate to the AppManager installation path.b. Double-click the NetIQDiag.exe program.c. On the NetIQ Diagnostic Trace Setting page:
i. Set the trace level for selected components to Disable Tracing.ii. Select AppManager Agent, AppManager Management Service, and AppManager
KS.iii. Click Set.iv. Restart the NetIQ AppManager Client Resource Monitor service and NetIQ
AppManager Management service.3. Disable antivirus software.4. Disable User Account Control (UAC) and firewall.5. Disable Windows Update.
On the QDB Computer:
1. Set minimum memory per query:a. Start the SQL Server Management Studio on the SQL Server computer.b. Right-click the server and click Properties. c. Click Memory.d. Set Minimum memory per query (in KB) to 4096. The default value is 1024.e. Click OK.
2. Disable antivirus software.3. Disable User Account Control (UAC) and firewall.4. Disable Windows Update.
On the Computer that has AppManager Agent and Monitoring Server Installed:
1. Edit the value for the monitoring service memory limit:a. Open the
MonitoringsServerInstallationPath\services\Monitoring\PlateSpin.Monitoring.Service.exe.config file in a text editor.
Installing AppManager for Agentless Monitoring 19

b. Edit the following line to change the UpperMemoryLimit value from 1200000000 to 4294967296: <setting name="UpperMemoryLimit" serializeAs="String">
<value>1200000000</value>
2. Configure the monitoring server to use only Windows Management Instrumentation (WMI) for inventory:
a. Launch the monitoring client (PlateSpin Recon Client) and click Tools.b. Press the Ctrl key and click Optionsc. Click Inventory > Advanced.d. Set Install Remote Service for WMI Failure to False. The default value is True.
3. Disable antivirus software.4. Disable User Account Control (UAC) and firewall.5. Disable Windows Update.
2.9 Discovering Remote Computer ResourcesUse the Discovery_Agentless Knowledge Script to discover resource information for the remote computers that you want to monitor. You can either discover computers listed in a file or discover computers that are within a specified IP address range. NetIQ Corporation recommends that you must not run parallel discovery jobs. For reliable discovery of remote computes, run only one discovery job at any point of time.
If you delete or add a resource object, or if you make any other kind of change that might affect the monitoring of your resources, run the Discovery_Agentless Knowledge Script again to update your list of resource objects. Use the delta discovery feature in Control Center to run discovery on a schedule to more quickly detect changes to your environment.
NOTE: The discovery process might take considerable time depending on the network conditions and the number of remote computers you want to discover. For example, it might take approximately three hours to discover 500 computers.
If a remote computer is not discovered even after multiple retries, ensure the following:
The remote computer is available for monitoring The credentials you specified in the Security Manager are correct Multiple entries of the remote computer is not listed in the monitoring client
By default, this script runs once for each computer.
Set the Values tab parameters as needed.
Description How to Set It
General Settings
Job Failure Notification
Event severity if discovery job fails unexpectedly
Set the event severity level, from 1 to 40, to indicate the importance of an event in which the discovery job fails unexpectedly. The default is 5.
Additional Settings
20 NetIQ AppManager for Agentless Monitoring Management Guide

Event Details
Event detail format Select whether to view event details in an HTML Table or in Plain Text. The default is HTML Table.
Discover Agentless Computers
Raise event if discovery succeeds?
Select Yes to raise an event if discovery succeeds in finding the remote computers. The default is Yes.
Event severity when discovery succeeds
Set the event severity level, from 1 to 40, to indicate the importance of an event in which discovery succeeds in finding the remote computers. The default is 25.
Raise event if discovery is partial? Select Yes to raise an event if the discovery process is partially successful. For example, if the discovery process was not able to discover some of the remote computers. The default is Yes.
Event severity when discovery is partial
Set the event severity level, from 1 to 40, to indicate the importance of an event in which discovery is partially successful. The default is 15.
Raise event if discovery fails? Select Yes to raise an event if discovery fails to find the remote computers. The default is Yes.
Event severity when discovery fails Set the event severity level, from 1 to 40, to indicate the importance of an event in which discovery fails to find the remote computers. The default is 5.
Discovery Type Select how you want to discover remote computers. You can use a comma-separated-value (.csv) file, or you can specify an IP address range for the computers you want to discover. The default discovery type is CSV file.
Discover computers listed in a file
Full path to file containing list of computers to discover
Provide the path to a location on the agent computer or the UNC path that contains the .csv discovery input file containing the list of remote computers you want to discover. For more information about the discovery input file, see “Discovering Computers Listed in a File” on page 16.
Discover computers within an IP address range
IP address range of computers to discover
Specify the IP address range of the computers you want to discover. For example:
10.0.0.1-10.0.0.25
Sub-label configured in Security Manager
Specify the sub-label configured for this IP address range in the Security Manager. For more information on the sub-label, see “Discovering Computers Within an IP Address Range” on page 18.
Type of operating system on the computers to discover
Select the type of operating system for the computers you want to discover. You can choose Windows or UNIX. The default is Windows.
Description How to Set It
Installing AppManager for Agentless Monitoring 21

22 NetIQ AppManager for Agentless Monitoring Management Guide
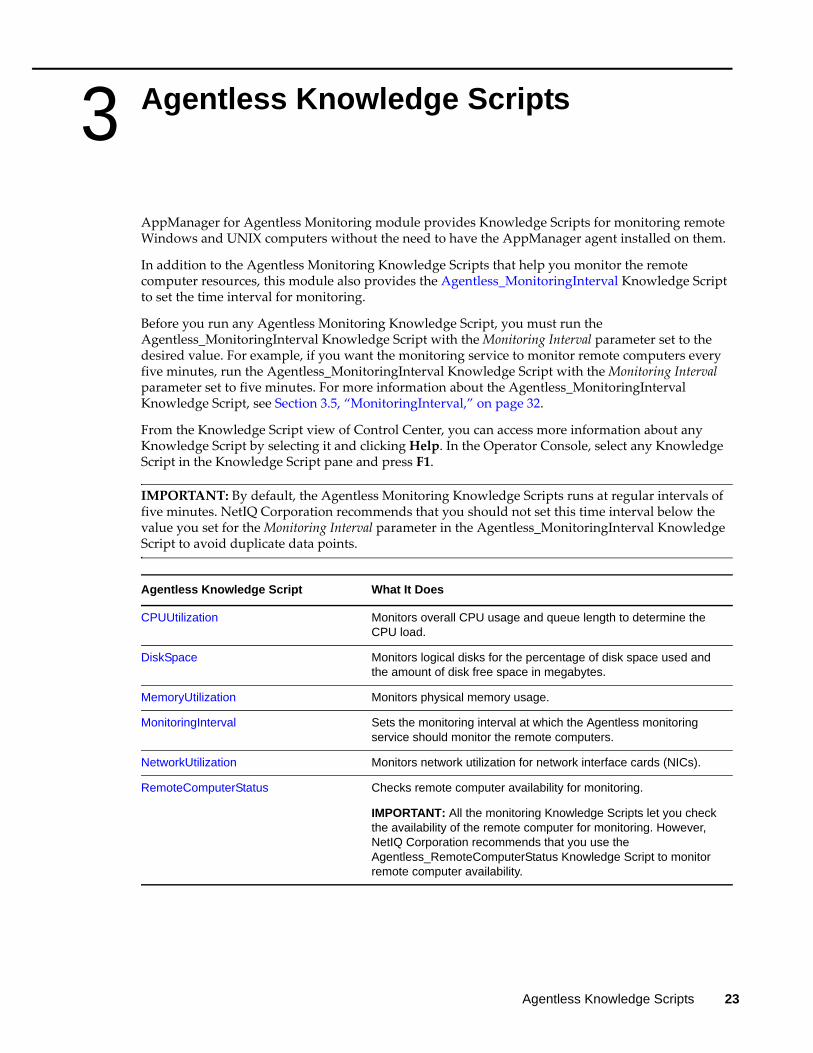
3 3Agentless Knowledge Scripts
AppManager for Agentless Monitoring module provides Knowledge Scripts for monitoring remote Windows and UNIX computers without the need to have the AppManager agent installed on them.
In addition to the Agentless Monitoring Knowledge Scripts that help you monitor the remote computer resources, this module also provides the Agentless_MonitoringInterval Knowledge Script to set the time interval for monitoring.
Before you run any Agentless Monitoring Knowledge Script, you must run the Agentless_MonitoringInterval Knowledge Script with the Monitoring Interval parameter set to the desired value. For example, if you want the monitoring service to monitor remote computers every five minutes, run the Agentless_MonitoringInterval Knowledge Script with the Monitoring Interval parameter set to five minutes. For more information about the Agentless_MonitoringInterval Knowledge Script, see Section 3.5, “MonitoringInterval,” on page 32.
From the Knowledge Script view of Control Center, you can access more information about any Knowledge Script by selecting it and clicking Help. In the Operator Console, select any Knowledge Script in the Knowledge Script pane and press F1.
IMPORTANT: By default, the Agentless Monitoring Knowledge Scripts runs at regular intervals of five minutes. NetIQ Corporation recommends that you should not set this time interval below the value you set for the Monitoring Interval parameter in the Agentless_MonitoringInterval Knowledge Script to avoid duplicate data points.
Agentless Knowledge Script What It Does
CPUUtilization Monitors overall CPU usage and queue length to determine the CPU load.
DiskSpace Monitors logical disks for the percentage of disk space used and the amount of disk free space in megabytes.
MemoryUtilization Monitors physical memory usage.
MonitoringInterval Sets the monitoring interval at which the Agentless monitoring service should monitor the remote computers.
NetworkUtilization Monitors network utilization for network interface cards (NICs).
RemoteComputerStatus Checks remote computer availability for monitoring.
IMPORTANT: All the monitoring Knowledge Scripts let you check the availability of the remote computer for monitoring. However, NetIQ Corporation recommends that you use the Agentless_RemoteComputerStatus Knowledge Script to monitor remote computer availability.
Agentless Knowledge Scripts 23

3.1 Monitoring Remote Computers Having Different Threshold Values You can use a single monitoring job to monitor multiple remote computers that have different threshold values. When you run the monitoring job, you must provide the full path to the threshold file that contains the threshold values for individual computers. If the computer you want to monitor does not have an entry in the threshold file, the job uses the threshold values specified in the Knowledge Script.
3.1.1 Creating the Threshold File
Use a spreadsheet program such as Microsoft Excel to create a threshold file and save the file as a .csv file. You must create a separate threshold file for every Knowledge Script. Every row in this file must list the following values, separated by a comma and no spaces:
Identifier of the computer you want to monitor (NetBIOS, FQDN, or IP Address) The threshold values for the Knowledge Script metrics
Use a hash symbol (#) to comment lines in the threshold file.
KnowledgeScript and Metrics Threshold File Entry Per Computer Examples
CPUUtilization
Maximum threshold for CPU usage
Maximum threshold for CPU queue length
computer_identifier,CPU_usage_max_thresholdvalue,CPU_queuelength_max_thresholdvalue
Computer1,60,3
10.0.0.0,80,5
DiskSpace
Minimum threshold for logical disk free space in MB
Minimum per-disk threshold for logical disk free space in MB
Maximum threshold for logical disk space usage in %
Maximum per-disk threshold for logical disk space usage in %
computer_identifier,disk_freespace_min_thresholdvalue,per_disk_freespace_min_thresholdvalue,disk_spaceused_max_thresholdvalue,per_disk_spaceused_max_thresholdvalue
10.0.0.60,8800,/=9890;/boot=6760,35,/=25;/boot=20
Computer2,9500,C:=8600;E:=7770,65,C:=30;E:=50
NOTE: Use semicolon to specify multiple disk drives.
MemoryUtilization
Maximum threshold for physical memory usage
computer_identifier,physical_memory_usage_max_thresholdvalue
Computer3,70
10.0.0.7,80
NetworkUtilization
Maximum threshold for network utilization
computer_identifier,network_usage_max_thresholdvalue
Computer1,45
10.0.0.7,30
24 NetIQ AppManager for Agentless Monitoring Management Guide

3.1.2 Understanding the Threshold Values Format
If the threshold values specified in the threshold file are not in a valid format, the monitoring job does one the following based on the scenario:
Not enough threshold values or no threshold values listed in the threshold file: To monitor computers that do not have enough threshold value entries in the file, the monitoring job uses all the valid threshold values specified for the computer in the file. For any threshold value that is missing in the file, the job uses the threshold value specified in the Knowledge Script.
Correct number of threshold values listed in the threshold file, but one or more values are not in valid format: The monitoring job generates an event. To monitor computers that have invalid threshold value entries in the file, the monitoring job uses all the valid threshold values specified in the file. For any invalid threshold value in the file, the job uses the threshold value specified in the Knowledge Script.
Too many threshold values listed in the threshold file: The monitoring job generates an event. To monitor computers that have too many threshold value entries in the file, the monitoring job skips all the threshold values specified in the file and uses the threshold values specified in the Knowledge Script.
3.2 CPUUtilizationUse this Knowledge Script to monitor overall CPU usage and queue length to determine whether the CPU is overloaded. This script raises an event when the CPU usage and CPU queue length values exceed the thresholds you set.
3.2.1 Resource Objects
CPU object
3.2.2 Default Schedule
The default schedule for this script is Every 5 minutes.
3.2.3 Setting Parameter Values
Set the Values tab parameters as needed.
Description How to Set It
General Settings
Job Failure Notification
Event severity when job fails unexpectedly
Set the event severity level, from 1 to 40, to indicate the importance of an event in which the CPUUtilization job fails. The default is 5.
Unavailable Data Points
Agentless Knowledge Scripts 25

Raise event if the remote computer is not available for monitoring?
Select Yes to raise an event if the remote computer is not available for monitoring. The default is No.
NetIQ Corporation recommends you use the Agentless_RemoteComputerStatus Knowledge Script to check the availability status of the remote computer you want to monitor. For more information about RemoteComputerStatus Knowledge Script, see “RemoteComputerStatus” on page 35.
If you select Yes for this parameter and run the Agentless_RemoteComputerStatus Knowledge Script, you might encounter duplicate events, one raised by this Knowledge Script and the other by Agentless_RemoteComputerStatus Knowledge Script.
Event severity when the remote computer is not available for monitoring
Set the event severity level, from 1 to 40, to indicate the importance of an event in which the remote computer is not available for monitoring. The default is 15.
Raise event if CPU metrics are not available beyond the threshold time?
Select Yes to raise an event if the CPU metrics are not available even after the threshold time is reached.The default is No.
Maximum threshold time since the last collected data point
Specify the maximum wait time from the time the last data point is collected before an event is raised. The default is 10 minutes.
Event severity when CPU metrics are not available beyond the threshold time
Set the event severity level, from 1 to 40, to indicate the importance of an event in which the CPU metrics are not available even after the threshold time is reached. The default is 15.
Threshold Values For Individual Computers
Full path to file containing threshold values
Provide the full path to the threshold file containing the maximum threshold values for overall CPU usage and queue length.
For information about creating the threshold file, see Section 3.1.1, “Creating the Threshold File,” on page 24.
Raise event if the threshold values specified for a computer are not in valid format?
Select Yes to raise an event if the threshold values specified for a computer are not in valid format. The default is Yes.
For information about the threshold values format, see Section 3.1.2, “Understanding the Threshold Values Format,” on page 25.
Event severity when the threshold values specified for a computer are not in valid format?
Set the event severity level, from 1 to 40, to indicate the importance of an event in which threshold values specified for a computer are not in valid format. The default is 15.
Additional Settings
Event Details
Event detail format Select whether to view event details in an HTML Table or in Plain Text. The default is HTML Table.
Monitor CPU Usage
Event Notification
Raise event if overall CPU usage exceeds the threshold?
Select Yes to raise an event if overall CPU usage exceeds the threshold you set. The default is Yes.
Description How to Set It
26 NetIQ AppManager for Agentless Monitoring Management Guide

3.3 DiskSpaceUse this Knowledge Script to monitor logical drives for the percentage of disk space used and the amount of free space in megabytes.
Each time you run this script, it automatically monitors all logical disks on a server. You can also provide a list of drives to exclude from monitoring.
This script raises an event if the percentage of used space exceeds the threshold you set, or the amount of free space falls below the threshold you set.
3.3.1 Resource Object
Logical disk drive
3.3.2 Default Schedule
The default schedule for this script is Every 5 minutes.
Maximum threshold for overall CPU usage
Specify the maximum overall CPU usage that can occur before an event is raised. The default is 95%.
Event severity when overall CPU usage exceeds threshold
Set the event severity level, from 1 to 40, to indicate the importance of an event in which the percentage of the CPU usage exceeds the threshold. The default is 15.
Data Collection
Collect data for overall CPU usage?
Select Yes to collect data about the percentage of CPU usage for charts and reports. The default is unselected.
Monitor CPU Queue Length
Event Notification
Raise event if processor queue length exceeds the threshold?
Select Yes to raise an event if maximum processor queue length exceeds the threshold you set. The default is Yes.
Maximum threshold for processor queue length
Specify the maximum number of processes the CPU queue can contain before an event is raised. CPU queue length indicates how many processes are ready to run. The default is 2 processes.
Event severity when processor queue length exceeds threshold
Set the event severity level, from 1 to 40, to indicate the importance of an event in which processor queue length usage exceeds the threshold. The default is 15.
Data Collection
Collect data for processor queue length?
Select Yes to collect data for charts and reports. If enabled, data collection returns the number of threads waiting to execute on all processors. The default is unselected.
The detail data contains information about processor queue length and the threshold for processor queue length.
Description How to Set It
Agentless Knowledge Scripts 27

3.3.3 Setting Parameter Values
Set the Values tab parameters as needed.
Parameter How to Set It
General Settings
Job Failure Notification
Event severity when job fails unexpectedly
Set the event severity level, from 1 to 40, to indicate the importance of an event in which the DiskSpace job fails. The default is 5.
Unavailable Data Points
Raise event if the remote computer is not available for monitoring?
Select Yes to raise an event if the remote computer is not available for monitoring. The default is No.
NetIQ Corporation recommends you use the Agentless_RemoteComputerStatus Knowledge Script to check the availability status of the remote computer you want to monitor. For more information about RemoteComputerStatus Knowledge Script, see “RemoteComputerStatus” on page 35.
If you select Yes for this parameter and run the Agentless_RemoteComputerStatus Knowledge Script, you might encounter duplicate events, one raised by this Knowledge Script and the other by Agentless_RemoteComputerStatus Knowledge Script.
Event severity when the remote computer is not available for monitoring
Set the event severity level, from 1 to 40, to indicate the importance of an event in which the remote computer is not available for monitoring. The default is 15.
Raise event if logical disk metrics are not available beyond the threshold time?
Select Yes to raise an event if the logical disk metrics are not available even after the threshold time is reached.The default is No.
Maximum threshold time since the last collected data point
Specify the maximum wait time from the time the last data point is collected before an event is raised. The default is 10 minutes.
Event severity when logical disk metrics are not available beyond the threshold time
Set the event severity level, from 1 to 40, to indicate the importance of an event in which the logical disk metrics are not available even after the threshold time you set is reached. The default is 15.
Threshold Values For Individual Computers
Full path to file containing threshold values
Provide the full path to the threshold file containing the maximum threshold values for percentage of disk space used and the amount of free space in megabytes.
For information about creating the threshold file, see Section 3.1.1, “Creating the Threshold File,” on page 24.
Raise event if the threshold values specified for a computer are not in valid format?
Select Yes to raise an event if the threshold values specified for a computer are not in valid format. The default is Yes.
For information about the threshold values format, see Section 3.1.2, “Understanding the Threshold Values Format,” on page 25.
28 NetIQ AppManager for Agentless Monitoring Management Guide

Event severity when the threshold values specified for a computer are not in valid format?
Set the event severity level, from 1 to 40, to indicate the importance of an event in which threshold values specified for a computer are not in valid format. The default is 15.
Additional Settings
Event Details
Event detail format Select whether to view event details in an HTML Table or in Plain Text. The default is HTML Table.
Monitor Disk Space
Drives to exclude Provide a comma-separated list of the drives you do not want to monitor. This script automatically monitors all drives except those listed in this parameter.
For example:
C:,E:,HARDDISKVOLUME18
In this example, the script automatically monitors all drives except C, E, and HARDDISKVOLUME18 drives on a Windows computer.
/boot, /
In this example, the script automatically monitors all drives except the boot drive and root drive on a UNIX computer.
Event Notification
Raise separate events for individual drives?
Select Yes to raise separate events for individual drives. The default is unselected.
When you enable this parameter, the script raises separate events that detail the disk usage for each monitored logical drive.
Raise event if logical disk free space falls below the threshold?
Select Yes to raise an event if the amount of available disk space falls below the threshold you set. The default is Yes.
When you enable this parameter, the script raises one event that details the available disk space for all monitored logical drives.
Minimum threshold for logical disk free space
Specify the minimum amount of disk space that must be available to prevent an event from being raised. The default is 100 MB.
This threshold applies to all disks unless you provide a per-disk threshold value in the Minimum per-disk threshold for logical disk free space in MB parameter.
Parameter How to Set It
Agentless Knowledge Scripts 29

Minimum per-disk threshold for logical disk free space in MB
Specify the minimum amount of disk space that must be available on individual disks to prevent an event from being raised. Use commas to separate multiple thresholds.
For example:
C:=90500,D:=550
In this example, the threshold for minimum disk space on the C: disk is 90500 MB. The threshold for the D: disk is 550 MB.
/boot=500,/=2500
In this example, the threshold for minimum disk space on /boot is 500 MB. The threshold for root is 2500 MB.
Event severity when logical disk free space falls below the threshold
Set the event severity level, from 1 to 40, to indicate the importance of an event in which the amount of available disk space falls below the threshold you set. The default is 15.
Raise event if logical disk space usage exceeds the threshold?
Select Yes to raise an event if the percentage of disk utilization exceeds the threshold you set. The default is Yes.
When you enable this parameter, the script raises one event that details the disk usage for all monitored logical drives.
Maximum threshold for logical disk space usage
Specify the maximum percentage of disk utilization that can occur before an event is raised. The default is 90%.
This threshold applies to all disks unless you provide a per-disk threshold value in the Maximum per-disk threshold for logical disk space usage in % parameter.
Maximum per-disk threshold for logical disk space usage in %
Specify the maximum percentage of disk utilization that can occur on individual disks before an event is raised. Use commas to separate multiple thresholds. For example:
For example:
C:=50,D:=80
In this example, the threshold for maximum disk utilization on the C: disk is 50%. The threshold for the D: disk is 80%.
/boot=35,/=20
In this example, the threshold for maximum disk utilization on /boot is 35%. The threshold for root is 20%.
Event severity when logical disk space usage exceeds the threshold?
Set the event severity level, from 1 to 40, to indicate the importance of an event in which the percentage of disk utilization exceeds the threshold you set. The default is 15.
Data Collection
Collect data for logical disk free space
Select Yes to collect data for charts and reports. If enabled, data collection returns the amount of available disk space for the selected drives. The default is unselected.
Collect data for logical disk usage?
Select Yes to collect data for charts and reports. If enabled, data collection returns utilization details for used space (%). The default is unselected.
Parameter How to Set It
30 NetIQ AppManager for Agentless Monitoring Management Guide

3.4 MemoryUtilizationUse this Knowledge Script to monitor the usage of physical memory. This script raises an event if the physical memory usage exceeds the threshold. In addition, this script generates data streams for the physical memory usage.
3.4.1 Resource Objects
Physical memory object
3.4.2 Default Schedule
The default schedule for this script is Every 5 minutes.
3.4.3 Setting Parameter Values
Set the Values tab parameters as needed.
Description How to Set It
General Settings
Job Failure Notification
Event severity if job fails unexpectedly
Set the event severity level, from 1 to 40, to indicate the importance of an event in which the MemoryUtilization job fails. The default is 5.
Unavailable Data Points
Raise event if the remote computer is not available for monitoring?
Select Yes to raise an event if the remote computer is not available for monitoring. The default is No.
NetIQ Corporation recommends you use the Agentless_RemoteComputerStatus Knowledge Script to check the availability status of the remote computer you want to monitor. For more information about RemoteComputerStatus Knowledge Script, see “RemoteComputerStatus” on page 35.
If you select Yes for this parameter and run the Agentless_RemoteComputerStatus Knowledge Script, you might encounter duplicate events, one raised by this Knowledge Script and the other by Agentless_RemoteComputerStatus Knowledge Script.
Event severity when the remote computer is not available for monitoring
Set the event severity level, from 1 to 40, to indicate the importance of an event in which the remote computer is not available for monitoring. The default is 15.
Raise event if memory metrics are not available beyond the threshold time?
Select Yes to raise an event if the memory metrics are not available even after the threshold time you set is reached.The default is No.
Maximum threshold time since the last collected data point
Specify the maximum wait time from the time the last data point is collected before an event is raised. The default is 10 minutes.
Event severity when memory metrics are not available beyond the threshold time
Set the event severity level, from 1 to 40, to indicate the importance of an event in which the memory metrics are not available even after the threshold time you set is reached. The default is 15.
Agentless Knowledge Scripts 31

3.5 MonitoringInterval Before you run any Agentless Monitoring Knowledge Script, you must run the Agentless_MonitoringInterval Knowledge Script with the Monitoring Interval parameter set to the desired value. For example, if you want the monitoring service to monitor remote computers every five minutes, run the Agentless_MonitoringInterval Knowledge Script with the Monitoring Interval parameter set to the default five minutes.
3.5.1 Resource Objects
NT_MachineFolder
Threshold Values For Individual Computers
Full path to file containing threshold values
Provide the full path to the threshold file containing the maximum threshold values for physical memory usage.
For information about creating the threshold file, see Section 3.1.1, “Creating the Threshold File,” on page 24.
Raise event if the threshold values specified for a computer are not in valid format?
Select Yes to raise an event if the threshold values specified for a computer are not in valid format. The default is Yes.
For information about the threshold values format, see Section 3.1.2, “Understanding the Threshold Values Format,” on page 25.
Event severity when the threshold values specified for a computer are not in valid format?
Set the event severity level, from 1 to 40, to indicate the importance of an event in which threshold values specified for a computer are not in valid format. The default is 15.
Additional Settings
Event Details
Event detail format Select whether to view event details in an HTML Table or in Plain Text. The default is HTML Table.
Monitor Physical Memory Usage
Event Notification
Raise event if physical memory usage exceeds the threshold?
Select Yes to raise an event if physical memory usage exceeds the threshold you set. The default is Yes.
Maximum threshold for physical memory usage
Specify the maximum percentage of physical memory that can be in use before an event is raised. The default is 90%.
Event severity when physical memory usage exceeds threshold
Set the event severity level, from 1 to 40, to indicate the importance of an event in which the physical memory usage exceeds the threshold. The default is 15.
Data Collection
Collect data for physical memory usage?
Select Yes to collect data for charts and reports. If enabled, data collection returns the percentage of physical memory usage during the monitoring period. The default is unselected.
Description How to Set It
32 NetIQ AppManager for Agentless Monitoring Management Guide

3.5.2 Default Schedule
By default, this script runs once.
3.5.3 Setting Parameter Values
Set the Values tab parameters as needed.
3.6 NetworkUtilizationUse this Knowledge Script to monitor the percentage of data sent or received over the network. This script raises an event if the network utilization exceeds the threshold. In addition, this script generates data streams for the network usage.
3.6.1 Resource Objects
Network interface folder
3.6.2 Default Schedule
The default schedule for this script is Every 5 minutes.
Description How to Set It
General Settings
Monitoring Interval Specify how often you want the Agentless monitoring service to monitor the remote computers. The default is 5 minutes.
Additional Settings
Event Details
Event detail format Select whether to view event details in an HTML Table or in Plain Text. The default is HTML Table.
Raise event if monitoring interval changed successfully?
Select Yes to raise an event if the monitoring interval has successfully changed. The default is Yes.
Event severity when monitoring interval changed successfully
Set the event severity level, from 1 to 40, to indicate the importance of an event in which the monitoring interval successfully changed. The default is 25.
Raise event if monitoring failed to change?
Select Yes to raise an event if the monitoring interval failed to change. The default is Yes.
Event severity when monitoring interval failed to change
Set the event severity level, from 1 to 40, to indicate the importance of an event in which the monitoring interval failed to change. The default is 5.
Agentless Knowledge Scripts 33

3.6.3 Setting Parameter Values
Set the Values tab parameters as needed.
Description How to Set It
General Settings
Job Failure Notification
Event severity when job fails unexpectedly
Set the event severity level, from 1 to 40, to indicate the importance of an event in which the NetworkUtilization job fails. The default is 5.
Unavailable Data Points
Raise event if the remote computer is not available for monitoring?
Select Yes to raise an event if the remote computer is not available for monitoring. The default is No.
NetIQ Corporation recommends you use the Agentless_RemoteComputerStatus Knowledge Script to check the availability status of the remote computer you want to monitor. For more information about RemoteComputerStatus Knowledge Script, see “RemoteComputerStatus” on page 35.
If you select Yes for this parameter and run the Agentless_RemoteComputerStatus Knowledge Script, you might encounter duplicate events, one raised by this Knowledge Script and the other by Agentless_RemoteComputerStatus Knowledge Script.
Event severity when the remote computer is not available for monitoring
Set the event severity level, from 1 to 40, to indicate the importance of an event in which the remote computer is not available for monitoring. The default is 15.
Raise event if network metrics are not available beyond the threshold time?
Select Yes to raise an event if the network metrics are not available even after the threshold time you set is reached.The default is No.
Maximum threshold time since the last collected data point
Specify the maximum wait time from the time the last data point is collected before an event is raised. The default is 10 minutes.
Event severity when network metrics are not available beyond the threshold time
Set the event severity level, from 1 to 40, to indicate the importance of an event in which the network metrics are not available even after the threshold time you set is reached. The default is 15.
Threshold Values For Individual Computers
Full path to file containing threshold values
Provide the full path to the threshold file containing the maximum threshold values for network usage.
For information about creating the threshold file, see Section 3.1.1, “Creating the Threshold File,” on page 24.
Raise event if the threshold values specified for a computer are not in valid format?
Select Yes to raise an event if the threshold values specified for a computer are not in valid format. The default is Yes.
For information about the threshold values format, see Section 3.1.2, “Understanding the Threshold Values Format,” on page 25.
Event severity when the threshold values specified for a computer are not in valid format?
Set the event severity level, from 1 to 40, to indicate the importance of an event in which threshold values specified for a computer are not in valid format. The default is 15.
34 NetIQ AppManager for Agentless Monitoring Management Guide

3.7 RemoteComputerStatus Use this Knowledge Script to check if the remote computer that you want to monitor is available for monitoring. This Knowledge Script raises the following events depending on the availability status of the remote computer:
Additional Settings
Event Details
Event detail format Select whether to view event details in an HTML Table or in Plain Text. The default is HTML Table.
Monitor Network Utilization
Network interfaces to exclude List the display names of all active network interfaces that you do not want to monitor. Separate each interface name with a comma and without any spaces.
For interface names, you can only use asterisk (*) as a wildcard character. The exclusion filter is case sensitive.
The default is: *Loopback*,*Pseudo*,*isatap*,*tunnel*,*Virtual*. These settings exclude the set of interfaces that are part of the operating system and do not map to actual network cards.
Event Notification
Raise event if network utilization exceeds the threshold?
Select Yes to raise an event if network usage exceeds the threshold you set. The default is Yes.
Maximum threshold for network utilization
Specify the maximum percentage of network usage that can be in use before an event is raised. The default is 35%.
Event severity when network utilization exceeds threshold
Set the event severity level, from 1 to 40, to indicate the importance of an event in which the network usage exceeds the threshold. The default is 15.
Data Collection
Collect data for network utilization?
Select Yes to collect data for charts and reports. If enabled, data collection returns the percentage of network usage during the monitoring period. The default is unselected.
Description How to Set It
Event Raised What it means
Monitoring Health Error: The network path was not found
The remote computer is not in the network, or the remote computer is not up and running.
Monitoring Health Error: Access is denied The user whose credentials are specified does not have sufficient permissions to access the performance counter from the remote computer.
The RPC server is too busy to complete this operation VM_NetworkInterface_PacketsPerSecond
The Remote Procedure Call (RPC) service on the remote computer is busy. Restart the service.
Agentless Knowledge Scripts 35
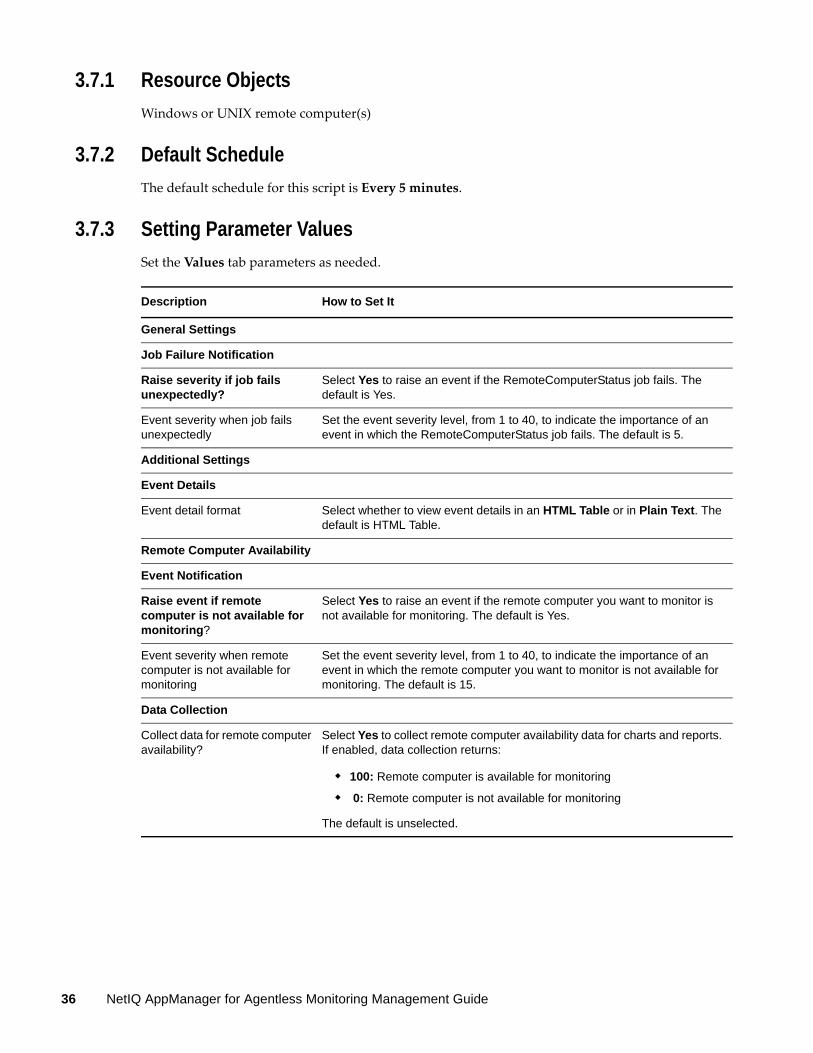
3.7.1 Resource Objects
Windows or UNIX remote computer(s)
3.7.2 Default Schedule
The default schedule for this script is Every 5 minutes.
3.7.3 Setting Parameter Values
Set the Values tab parameters as needed.
Description How to Set It
General Settings
Job Failure Notification
Raise severity if job fails unexpectedly?
Select Yes to raise an event if the RemoteComputerStatus job fails. The default is Yes.
Event severity when job fails unexpectedly
Set the event severity level, from 1 to 40, to indicate the importance of an event in which the RemoteComputerStatus job fails. The default is 5.
Additional Settings
Event Details
Event detail format Select whether to view event details in an HTML Table or in Plain Text. The default is HTML Table.
Remote Computer Availability
Event Notification
Raise event if remote computer is not available for monitoring?
Select Yes to raise an event if the remote computer you want to monitor is not available for monitoring. The default is Yes.
Event severity when remote computer is not available for monitoring
Set the event severity level, from 1 to 40, to indicate the importance of an event in which the remote computer you want to monitor is not available for monitoring. The default is 15.
Data Collection
Collect data for remote computer availability?
Select Yes to collect remote computer availability data for charts and reports. If enabled, data collection returns:
100: Remote computer is available for monitoring
0: Remote computer is not available for monitoring
The default is unselected.
36 NetIQ AppManager for Agentless Monitoring Management Guide