Embed Size (px)
Citation preview

Zero Energy Buildings A concept review and case study of terraced houses in Sweden
Kristina Nilsson Bromander
Gina Sjöberg
2016

Master of Science Thesis
Zero Energy Buildings – a concept review and case study
of terraced houses in Sweden
Kristina Nilsson Bromander
Gina Sjöberg
Approved
Examiner
Jaime Arias Hurtado
Supervisor
Jaime Arias Hurtado
Commissioner
Björn Berggren
Contact person

Abstract
The building sector consumes about 40 % of the total global primary energy, 60 % of the total
electricity and accounts for about 30 % of all greenhouse gas emissions (UNEP, 2015). The
zero energy building (ZEB) concept is considered as a step towards reducing the
environmental impact of the building sector (European Parliment, Council of the European
Union, 2010). This work has reviewed the concept of ZEBs by looking at three different
definitions available in Sweden: nearly ZEB by Boverket (the Swedish Board of Housing,
Building and Planning), ZEB by Sveriges Centrum för Nollenergihus (SCNH), Swedish center
for ZEBs, and net primary ZEB by Skanska. The proposal by Boverket may form a basis for
the statutory requirements for all new buildings in Sweden after 2020. The work also
comprised a performance analysis, as well as a review of the development process, of terraced
houses in Sweden built by Skanska according to their net primary ZEB definition.
The overall objective was to facilitate the implementation of future ZEB projects. This was
done by highlighting differences among the three definitions and how the implementation of
Boverket’s proposal will impact other definitions. The performance analysis and process
review pinpointed problem areas, acknowledging both technical, social, and economic aspects
linked to the ZEB concept, which can be improved in order to successfully implement ZEBs
in the future.
To compare the definitions, a framework developed by Sartori et al. was used (Sartori, et al.,
2012). A deductive approach was then used where a numerical analysis of one the terraced
houses energy system was compared to simulations. The focus for the definition and
performance analysis was the energy use of the building. In order to take other perspectives
into account, the occupant experience as well as the building development process were
investigated. This was done using an inductive approach by conducting semi-structured
qualitative interviews with occupants and employees of the construction company.
The definition comparison showed that there are important differences among the three
definitions. The main differences were the system boundaries, the net balance and the energy
efficiency requirements. It also showed that Skanska’s definition is directly affected by
Boverket’s proposal, while SCNH’s definition may be indirectly affected.
The performance analysis together with the interviews with occupants showed that
uncomfortable indoor temperatures were the main problem in the buildings of study. The
conclusion was that the specifications of a ZEB has to be acknowledged when choosing
technical installations in a building. Furtherly, information to the occupants is seen as an
important aspect in order to help them maintain a comfortable indoor environment in their
homes.
Interviews with employees showed that some problems may have occurred due to a lack of
understanding of and commitment to the ZEB concept. Furtherly, all involved in a ZEB project
needs to be informed of the concept and energy targets and encouraged to successfully reach
goals and to avoid miscommunication.
For “pilot projects” like the one studied in this report, it is suggested to include detailed design earlier in the project, in order to include cost for specific solutions needed for a ZEB.
Interviews with occupants indicated that some may be willing to pay more for a ZEB building,
therefore it is recommended to investigate the value of marketing this.

Sammanfattning
Byggnadssektorn står för runt 40 % av världens totala primärenergibehov, 60 % av elbehovet
samt ger upphov till omkring 30 % av alla växtgasutsläpp (UNEP, 2015). Konceptet
nollenergihus anses vara ett steg på vägen till att reducera byggnadssektorns miljöpåverkan
(European Parliment, Council of the European Union, 2010). Detta arbete har granskat
konceptet nollenergihus genom att utvärdera tre olika svenska definitioner för detta: nära
nollenergihus enligt Boverket, nollenergihus enligt Sveriges Centrum för Nollenergihus
(SCNH) och netto noll primärenergihus enligt Skanska. Förslaget för nära nollenergihus av
Boverket kan komma att ligga till grund för de lagstadgade kraven för alla nya byggnader i
Sverige från 2020. Detta arbete behandlar även en driftutvärdering samt en analys av
utvecklingsprocessen av ett grupp radhus i Sverige byggda av Skanska enligt deras definition av
netto noll primärenergihus.
Det övergripande målet var att förenkla för nollenergiprojekt i framtiden. Detta gjordes genom
att belysa skillnader mellan de tre definitionerna och hur implementeringen av Boverkets
förslag kan komma att påverka de övriga. Driftsanalysen och granskningen av
utvecklingsprocessen utfördes för att visa på problemområden med förbättringspotential, både
vad gäller tekniska, sociala och ekonomiska aspekter, kopplade till konceptet nollenergihus.
För att jämföra de tre nollenergidefinitionerna, användes ett ramverk utvecklat av Sartori et
al. (Sartori, et al., 2012). För att driftsutvärdera byggnadens energisystem användes en deduktiv
metod där uppmätt och normaliserad data jämfördes med simulerade värden. Fokus för
definitions – och driftsutvärderingen var byggnadens energianvändning. För att få ett bredare
perspektiv så undersöktes användarnas upplevelser samt utvecklingsprocessen. En induktiv
metod användes för detta där semistrukturerade, kvalitativa intervjuer med boende och
personer som arbetat i projektet genomfördes.
Jämförelsen av de tre definitionerna visade att det finns viktiga skillnader mellan dessa. De
huvudsakliga skillnaderna berör systemgränser, nettobalanser och krav på energieffektivitet.
Jämförelsen visar också att Skanskas definition skulle bli direkt påverkat om Boverkets förslag
skulle träda i kraft, medan SCNHs förslag kan komma att bli indirekt påverkat.
Driftsutvärderingen tillsammans med boendeintervjuerna visade att obekväma
inomhustemperaturer har utgjort huvudproblemet i de undersökta radhusen. Slutsatsen som
kan dras av detta är att hänsyn måste tas till specifika förutsättningar för nollenergihus vid val
av tekniska lösningar i en sådan byggnad. Vidare anses information till de boende vara en annan
viktig aspekt för att de ska kunna bibehålla en behaglig inomhusmiljö i sina hem.
Intervjuer med anställda i projektet visar att vissa problem har uppkommit p.g.a. en bristande
förståelse och engagemang för konceptet nollenergihus. Således behöver alla involverade i ett nollenergihusprojekt informeras om koncept och energimål och uppmuntras att arbeta enligt
dessa för att kunna säkerställa att målen av ett nollenergihus kan nås, samt för att undvika
missförstånd.
För “pilotprojekt”, likt det som studerats i detta arbete, föreslås det att projektering bör
tidigareläggas i arbetsprocessen, så att kostnaden för de specifika lösningarna inkluderas tidigt.
Intervjuer med boende har indikerat att vissa kan tänka sig att betala mer för ett nollenergihus,
varför det också rekommenderas att denna marknadspotential undersöks vidare.

Acknowledgement
The following work was conducted as a master thesis at the Department of Energy Technology
at KTH Royal Institute of Technology during the spring of 2016.
The authors would like to thank Skanska for the corporation and opportunity to conduct this
work. Special thanks to Björn Berggren, our supervisor at Skanska, as well as all other Skanska
employees who have patiently answered all our questions. We would also like to express our
gratitude to our supervisor at KTH Jaime Arias for guidance and support. Last but not least,
thank you to everyone who have participated in our interviews.
Stockholm, Sweden
May 2016
Kristina Nilsson Bromander and Gina Sjöberg

Table of contents
Abstract ...........................................................................................................................................................
Sammanfattning ..............................................................................................................................................
Acknowledgement ........................................................................................................................................
Table of contents ..........................................................................................................................................
Nomenclature ................................................................................................................................................
Terminology ...................................................................................................................................................
Table of figures ..............................................................................................................................................
List of tables ...................................................................................................................................................
Introduction ......................................................................................................................................... 1
1.1 Previous work ............................................................................................................................. 2
1.2 Objectives .................................................................................................................................... 3
1.3 Methodology ................................................................................................................................ 3
1.4 Delimitations ............................................................................................................................... 4
ZEB definitions .................................................................................................................................... 5
2.1 Nearly ZEB according to Boverket ........................................................................................ 5
2.2 ZEB according to SCNH........................................................................................................... 6
2.3 Net primary ZEB according to Skanska ................................................................................ 7
2.4 Comparison of ZEB definitions ............................................................................................... 9
2.5 Discussion of ZEB definitions ............................................................................................... 15
Performance review ........................................................................................................................ 17
3.1 Technical specifications .......................................................................................................... 17
3.2 Performance analysis .............................................................................................................. 19
3.3 Compliance with definitions .................................................................................................. 33
3.4 Discussion of performance analysis ..................................................................................... 36
Occupant experience ...................................................................................................................... 38
4.1 Qualitative interviews with occupants ................................................................................ 38
4.2 Discussion of occupant experience ..................................................................................... 42
Development process review ....................................................................................................... 44
5.1 Skanska’s development process ........................................................................................... 44
5.2 Interviewed employees .......................................................................................................... 45
5.3 Qualitative interviews with employees ............................................................................... 46
5.4 Discussion of qualitative interviews with employees ...................................................... 55
Conclusion and future work ......................................................................................................... 58

References ......................................................................................................................................... 60
Appendix 1. Skanska Color Palette™ ............................................................................................... i
Appendix 2. Definition comparison .................................................................................................. ii
Appendix 3. Map of measuring points ............................................................................................. iii
Appendix 4. Energy demand .............................................................................................................. iv
Appendix 5. Energy use ........................................................................................................................ v
Appendix 6. Questions used in interviews with occupants. ....................................................... ix
Appendix 7. Questions used in interviews with employees ....................................................... xi
Nomenclature
BBR Boverkets byggregler (Building regulations issued by the Swedish National Board of Housing, Building and Planning)
COP Coefficient of performance
DD Degree days
DDP Detailed development plan
DHW Domestic hot water
DOT Design outdoor temperature
ECBCS Energy Conservation in Buildings and Community Systems Program
EP European Parliament
EPBD Energy Performance of Buildings Directive
EU European Union
FEBY Forum för Energieffektiva Byggnader (forum for energy efficient buildings)
GHG Greenhouse gas
GSHP Ground source heat pump
g-value Solar Factor for solar energy transmittance of glass
IEA International Energy Agency
kWh/m2a Kilowatt hour per square meter Atemp and year
PV Photovoltaics
SCNH Sveriges Centrum för Nollenergihus (Swedish center for zero energy buildings)
SHC Solar Heating and Cooling Program
SIS Swedish Standards Institute
SMHI Sveriges Meteorologiska och Hydrologiska Institut (Swedish Meteorological
and Hydrological Institute)
Sveby Standardisera och verifiera energiprestanda i byggnader (a program that
standardizes and verifies energy performance in buildings)
UK The United Kingdom
UN United Nations
U-value Heat transfer coefficient
ZEB Zero energy building

Terminology
Below follow brief definitions of some central concepts discussed in the report.
Atemp Conditioned space i.e. the area enclosed by the inside of the
building envelope intended to be heated to more than 10°C
(Boverket, 2013).
Directly used
electricity
Electricity provided by PV-cells that can be instantaneously used for
the building energy demand
Energy demand Energy needed for heating, cooling, domestic hot water (DHW) and
property energy (Boverket, 2013).
Energy use The energy that needs to be supplied to a building (“bought
energy”) for heating, comfort cooling, DHW and the building’s
property energy, taking produced energy on site which can be
directly assimilated in the building into account (Boverket, 2013).
Free flowing energy Renewable energy generated on site or nearby which can be
directly assimilated in the building (Boverket, 2015).
Domestic energy Energy used for domestic purposes (Boverket, 2013).
Primary energy Primary energy is the total energy used to produce a given measure
of energy, i.e. all energy needed from the extraction of raw
materials to when energy is delivered to the asset, including
transmission and distribution losses (Boverket, 2015).
Primary energy
conversion factor
The relation between primary energy and the useful energy
delivered to the asset is defined as primary energy conversion
factors. This can be seen as an evaluation of different energy
sources. These can differ between different countries and may vary
locally, depending on how the energy is extracted (SCNH, 2013).
Also called metrics and weighting factors.
Property energy Electricity needed for pumps, fans etc. (Boverket, 2015).
Renewable energy Renewable energy is defined as energy derived from natural
processes that are replenished at a faster rate than they are
consumed. Examples of common renewable energy sources are
solar, wind, geothermal, hydro and some forms of biomass (IEA,
2016).
Specific energy use The building’s energy use divided by Atemp, expressed in kWh/m2a
(Boverket, 2013).
Table of figures
Figure 1. Solallén, Växjö (Photo: Skanska). ............................................................................................ 2
Figure 2. Nearly ZEB by Boverket. ......................................................................................................... 5
Figure 3. ZEB by SCNH. ............................................................................................................................ 7
Figure 4. Energy category of Skanska Color Palette™ (Skanska, 2015). ........................................ 8
Figure 5. Net primary ZEB by Skanska. .................................................................................................. 9
Figure 6. The Kyoto pyramid (Andresen, et al., 2008). ................................................................... 17
Figure 7. Solallén’s facades (Photo: Skanska). .................................................................................... 18
Figure 8. Energy system of Solallén. ..................................................................................................... 20
Figure 9. Outdoor temperature............................................................................................................ 22
Figure 10. Indoor temperature in apartment 1. ................................................................................ 23
Figure 11. Indoor temperature in apartment 2. ................................................................................ 23
Figure 12. Indoor temperature in apartment 3. ............................................................................... 24
Figure 13. SIS acceptable indoor temperatures for buildings without mechanical cooling. .... 24
Figure 14. Power of the fan in apartment 1. ...................................................................................... 25
Figure 15. Power of the fan in apartment 2. ...................................................................................... 25
Figure 16. Power of the fan in apartment 3. ...................................................................................... 26
Figure 17. Energy demand of the GSHP. ............................................................................................. 26
Figure 18. Energy demand of the free cooling pump. ...................................................................... 27
Figure 19. Property energy demand..................................................................................................... 27
Figure 20. Domestic energy demand. .................................................................................................. 28
Figure 21. Produced solar energy. ........................................................................................................ 28
Figure 22. Specific energy demand. ...................................................................................................... 29
Figure 23. Specific energy use. ............................................................................................................... 30
Figure 24. Solar electricity distribution. .............................................................................................. 30
Figure 25. Energy use – directly used solar electricity impact on energy demand. .................. 31
Figure 26. Electricity import/export. ................................................................................................... 31
Figure 27. Energy system for nearly ZEB by Boverket. ................................................................... 33
Figure 28. Energy system for ZEB by SCNH. .................................................................................... 34
Figure 29. Energy system for net primary ZEB by Skanska. ........................................................... 35
Figure 30. Logged temperatures in occupant B's apartment. ......................................................... 40
Figure 31. Skanska's building process................................................................................................... 44
Figure 32. Monthly heating energy demand. ........................................................................................ iv
Figure 33. Monthly DHW energy demand. .......................................................................................... iv
Figure 34. Import energy need for GSHP. ............................................................................................. v
Figure 35. Import energy need for cooling. ........................................................................................... v
Figure 36. Imported energy need for property purposes. ................................................................ vi
Figure 37. Import energy need for domestic purposes. .................................................................... vi
Figure 38. Directly used solar electricity within the building, for heating, DHW, cooling and
property energy. ........................................................................................................................................ vii
Figure 39. Total exported solar electricity, to both domestic energy use and the grid. .......... vii
Figure 40. Exported solar electricity to the grid. .............................................................................. viii

List of tables
Table 1. Main differences overview. ..................................................................................................... 14
Table 2. Normal and actual global irradiation in Växjö (SMHI, 2016). ......................................... 22
Table 3. Numerical result overview [kWh/m2a]. .............................................................................. 32
Table 4. Deviation from simulated values. .......................................................................................... 32
Table 5. Result overview for normalized data [kWh/m2a]. ............................................................ 35
Table 6. Result overview for measured data [kWh/m2a]. ............................................................... 36
Table 7. Result overview for simulated data [kWh/m2a]. ............................................................... 36

1
Introduction
The building sector consumes about 40 % of the total global primary energy, 60 % of the total
electricity and accounts for about 30 % of all greenhouse gas (GHG) emissions (UNEP, 2015).
Due to population growth and urbanization, environmental issues related to buildings may
double by 2050 (IEA, 2011). As acknowledged during the UN’s (United Nations’) Paris Climate
Change Conference in December 2015, it is central to decrease the building sector’s
environmental impact in order to promote a sustainable future (UNEP, 2015). The European
Union (EU) has set up target goals regarding this for its member states, which should be
implemented latest by 2020. One of these goals is increasing the total energy efficiency in the
EU by 20% compared to the level of 2010 (Europeiska komissionen, 2014).
As a part of this work, directives concerning energy performance of buildings from the
European Parliament (EP) and the Council of the EU state that all new buildings in member
states should be “nearly zero energy buildings” (nearly ZEBs) by the 31st of December 2020.
All new public buildings should be nearly ZEBs by 2018. However, while the Energy
Performance of Buildings Directive (EPBD) sets a framework for this classification, there is no
clear and standardized definition of the concept. Hence, it is left to the member states to
define nearly ZEBs according to their own country specific conditions and cost-optimality
(European Parliment, Council of the European Union, 2010). Definitions proposed by various
member states vary noteworthy. For example, the United Kingdom (the UK) defines nearly
ZEBs as zero-carbon buildings, while Cyprus uses a numerical indicator of maximum energy
use, i.e. the energy that needs to be supplied to a building (“bought energy”) for heating,
comfort cooling, DHW and the building’s property energy, i.e. electricity needed for pumps,
fans etc. (Boverket, 2015), taking produced energy on site which can be directly assimilated in
the building into account (Boverket, 2013), (180 kWh/m2a for residential buildings) in
combination with a requirement of minimum percentage of renewable energy supplied to the
building. Denmark also uses a numerical indicator, but of 20 kWh/m2a (European Commision,
2013). A review performed by the European Council for an Energy Efficient Economy (ECEEE)
identified more than 70 different definitions of ZEB in 17 different countries (Ecofys, 2012).
Studies on ZEBs as an innovative solution to problems related to the building sector
(Santamoiris, 2016) also support the problem with inconsistent definitions (Marszal, et al.,
2011).
Boverket, the Swedish National Board of Housing, Building and Planning, has been assigned by
the Swedish government to propose a quantitative guideline for nearly ZEBs in Sweden. Other
similar concepts have also been developed by other institutions, such as ZEB by Sveriges
Centrum för Nollenergihus (SCNH), the Swedish Center for Zero Energy Buildings, and net
primary ZEB by Skanska. However, the perception of how to define a ZEB differs and today
there are no standardized definition used in Sweden (Boverket, 2015).
Energy policies including a long-term vision of ZEBs which use a balance for used and produced
energy, so called net ZEBs, has been developed in a cooperation between several countries
and the International Energy Agency (IEA). This collaboration took form as a research program
and was called Task 40/Annex 52 with the goal to overcome the uncertainties of how net
ZEBs should be defined (IEA SHC, 2014). The aim of one of the subtasks within the research
2
program was to establish an internationally agreed understanding of net ZEBs based on a
common methodology (SHC, 2016). This resulted in a framework for setting net ZEB
definitions in a systematic way (Sartori, et al., 2012).
A study from the University of Shanghai has elaborated on the fact that local conditions such
as culture, climate, living conditions and economic factors are important to take into account
when evaluating an energy efficient building (Deng, et al., 2014). There are numerous reasons
why ZEB labeling is interesting to take into account when developing energy efficient buildings.
Apart from the environmental advantages such as reducing energy consumption and GHG
emissions, green marketing has been identified to have a positive correlation with brand
perception (Laheri, et al., 2014). Therefore, investigations in the potential for ZEBs are of
interest for the building sector, not only to follow future legislation and help reducing the
sectors environmental impact, but also in order to promote their corporate brand.
Skanska is a Swedish construction company with 58 000 employees and a turnover of 145
billion SEK (Swedish krona) on a global basis (Skanska, 2016). Sustainability is one of their
stated corner stones and they claim that one of their objectives is to be pioneers in green
building. According to their own definition, they have built the first residential ZEBs in Sweden
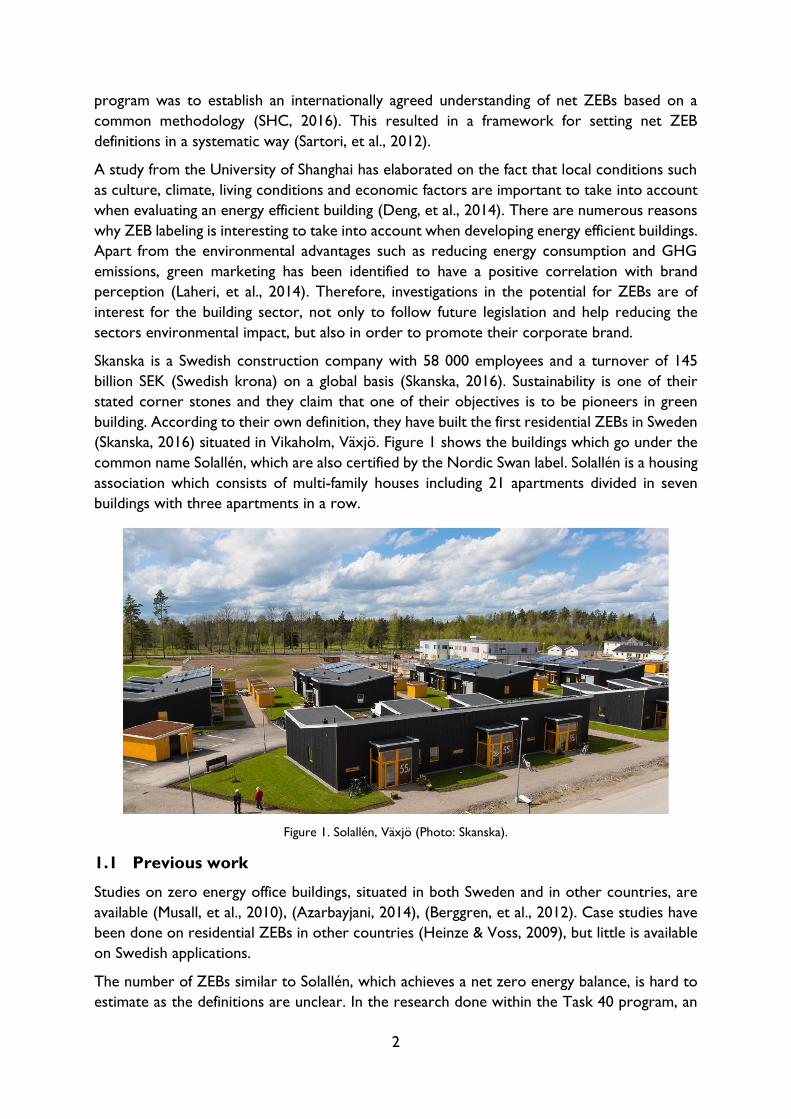
(Skanska, 2016) situated in Vikaholm, Växjö. Figure 1 shows the buildings which go under the
common name Solallén, which are also certified by the Nordic Swan label. Solallén is a housing
association which consists of multi-family houses including 21 apartments divided in seven
buildings with three apartments in a row.
Figure 1. Solallén, Växjö (Photo: Skanska).
1.1 Previous work
Studies on zero energy office buildings, situated in both Sweden and in other countries, are
available (Musall, et al., 2010), (Azarbayjani, 2014), (Berggren, et al., 2012). Case studies have
been done on residential ZEBs in other countries (Heinze & Voss, 2009), but little is available
on Swedish applications.
The number of ZEBs similar to Solallén, which achieves a net zero energy balance, is hard to
estimate as the definitions are unclear. In the research done within the Task 40 program, an

3
evaluation has been performed to overview 300 buildings which fall, or most probably would
fall, under a net ZEB definition applied in their country of location. Both residential and non-
residential, new and renovated buildings were represented, using varying sets of energy
efficiency and supply measures (Voss, et al., 2011).
One of the evaluated buildings is the solar estate Solarsiedlung Freiburg in southwestern
Germany. These houses are designed according to a German passive house standard in
combination with district heating and electricity generation from photovoltaic (PV) cells which
are connected to the grid (Heinze & Voss, 2009) achieving a net zero energy balance over the
year. Other projects are found in Denmark, the UK, Canada, Italy, Australia etc. using different
combinations of technological solutions such as heat pumps, solar collectors, wind turbines,
biogas and so on (Voss, et al., 2011). A multi-family building located outside of Halmstad
Sweden built in 2013, uses PV-cells in order to achieve a net plus energy balance (NCC, 2015).
1.2 Objectives
The overall objective is to facilitate the implementation of future ZEB projects. This work will
do so focusing on the Swedish conditions for residential ZEBs by investigating differences
among three ZEB definitions used in Sweden. This will point out the possibility of different
outcomes depending on which definition a building is compared against. This work will also
investigate how possible future legislation regarding nearly ZEB by Boverket will impact the
other definitions, since this will be statutory for all new buildings.
This work will also investigate if there are any complications associated with the energy
performance of ZEBs by looking at the case of Solallén in Växjö. Potential problems will be
pinpointed in order to highlight areas that should be carefully considered when building ZEBs.
The result from the performance analysis will also be compared against the three different
ZEB definitions to see if Solallén fulfills the requirements for these or not.
This work will also investigate the origin of the problems found during the performance
analysis. General problems that can occur when developing ZEBs will also be addressed. The
objective is to offer suggestions on how to avoid these in future, similar projects.
The outcome will be cross-disciplinary, acknowledging both environmental aspects as well as
cultural and social aspects such as user behavior in combination with technological solutions
and economy.
1.3 Methodology
To reach the objectives, a four-step methodology will be used in order to answer the research
questions.
Firstly, the three different ZEB definitions used in Sweden will be investigated and compared
according to a framework developed by (Sartori, et al., 2012). This will enable the comparison
of differences.
Secondly, a deductive approach will be used where a numerical analysis of the building’s energy
system will be conducted, comparing the measured and normalized performance data with the
expected values obtained from simulations. The data analysis will locate potential technical
problems and give an overview of the system as a whole. Solallén’s energy performance will
be reviewed according to the three definitions evaluated in the first step.

4
In order to get a holistic view of problems in Solallén, occupant experience will be investigated
using qualitative semi-structured interviews. This is done in order to highlight additional
problems that may not show during a performance analysis into account, such as social, cultural
and economic aspects.
The results from the performance analysis and the occupant interviews will give indications on
what to be assessed in the last step.
Lastly, an inductive approach will be used to investigate the building development process of
Solallén. Studies show that the challenges regarding ZEBs exist in the approach towards energy
performance of those involved in a building design process: architects, engineers and others
(Butera, 2013). Therefore, qualitative interviews will be conducted with people who worked
with Solallén in order to highlight issues that have emerged during the course of the
development. The choice of interviewees will be done depending on the result from the
previous steps. The interviews will be focusing on the employee’s specific role in the project
team; his/her responsibilities, tasks and issues that have emerged.
The results from all four steps will be analyzed with consideration to one another. The reason
for using this methodology is the possibility to find both technical problems, areas of
dissatisfaction for occupants together with issues involved in the development process which
can be harder to quantify. This will be done in order to take both technological solutions,
climate, social and cultural behavior and economy in consideration.
1.4 Delimitations
This report will treat the concept of nearly ZEB by Boverket, ZEB by SCNH and, net
primary ZEB by Skanska. Other definitions will not be taken into consideration.
The levels of requirements which are presented in this report are valid for electrically
heated multi-family houses smaller than 400 m2 located in climate zone III in Sweden.
Requirements for other buildings are not accounted for.
The comparison of the different definitions will focus energy use but will not take all
aspects of energy performance, for example heat transfer coefficients (U-values) and
heat loss factors, into account. Other environmental aspects such as emissions and
material choices will not be addressed either.
The version of Boverket’s Building Regulations (BBR20) and Skanska’s Color Palette™
treated in this report was valid when Solallén was built. Changes in these will not be
considered.
The data analyzed is obtained from one building of three apartments, out of a total of
seven buildings with 21 apartments. Other differences than those treated in this report
may exist.
All data in this report is based on one-hour-interval simulations or measurements.
Trends taking place in shorter periods than this are therefore not addressed.
The heating demand, domestic hot water (DHW) use and solar electricity
production are normalized. The used building and domestic energy as well as the free
cooling during the period are not normalized.

5
ZEB definitions
The following section will describe three different concepts of ZEBs which have been chosen
for further study. The proposed definition of nearly ZEB by Boverket is first presented. Then,
the definition of ZEBs from SCNH is presented as well as Skanska’s own net primary ZEB
definition, which was considered when developing Solallén (Schlegel, et al., 2015). Later they
will be reviewed and compared using a framework by (Sartori, et al., 2012).
2.1 Nearly ZEB according to Boverket
In line with the EU directives described in Chapter 1, Boverket has been assigned by the
Swedish government to propose a quantitative guideline for nearly ZEBs in Sweden in order
to fulfill the requirements made by the EPBD. The proposal was published in June 2015 and
has been sent to several instances for referral and will later be updated (Boverket, 2016).
The proposal concludes that bought energy for heating, cooling, DHW and property energy
delivered to the physical building should be used as the building system boundary, represented
by the red dashed line in Figure 2. Free flowing energy, i.e. renewable energy which can be
directly assimilated in the building (converted to heat, cold or electricity) which is generated
on site or nearby can be credited. This means it does not have to be included in the specific
energy performance requirements. In order to promote small scale energy generation,
Boverket specifies that a renewable energy source may be placed outside the building
property, which can be shared by multiple buildings. However, the energy source specifically
has to be put up in order to cover the specific energy needs of the buildings. Renewable energy
supplied by the public grid cannot be credited.
Figure 2. Nearly ZEB by Boverket.
6
To minimize the amount of electricity used for heating, cooling and DHW, the proposal
suggest this is weighted by 2,5 in the calculation of a building’s specific energy use. A weighting
factor of 1 is used for all other types of energy.
The delivered (bought) energy to the building, the building’s specific energy use, 𝐸𝑠𝑝𝑒𝑐, is
calculated as follows (Boverket, 2015):
𝐸𝑠𝑝𝑒𝑐 =
(𝐸𝑒𝑙,ℎ𝑒𝑎𝑡 + 𝐸𝑒𝑙,𝑑ℎ𝑤 + 𝐸𝑒𝑙,𝑐𝑜𝑜𝑙) ∙ 2,5 + 𝐸𝑒𝑙,𝑝𝑟𝑜𝑝 + 𝐸ℎ𝑒𝑎𝑡 + 𝐸𝑑ℎ𝑤 + 𝐸𝑐𝑜𝑜𝑙
𝐴𝑡𝑒𝑚𝑝 (1)
where the following stand for
𝐸𝑒𝑙,ℎ𝑒𝑎𝑡 Electric energy for heating, kWh/year
𝐸𝑒𝑙,𝑑ℎ𝑤 Electric energy for DHW, kWh/year
𝐸𝑒𝑙,𝑐𝑜𝑜𝑙 Electric energy for cooling, kWh/year
𝐸𝑒𝑙,𝑝𝑟𝑜𝑝 Property energy, kWh/year
𝐸ℎ𝑒𝑎𝑡 Other energy for heating, kWh/year
𝐸𝑑ℎ𝑤 Other energy for DHW, kWh/year
𝐸𝑐𝑜𝑜𝑙 Other energy for cooling, kWh/year
𝐴𝑡𝑒𝑚𝑝 Conditioned space: area maintained at a temperature above 10°C, m2
(Boverket, 2015).
The proposal states that the weighted specific energy use for electrically heated multifamily
houses in climate zone III, like Solallén, must not exceed 55 kWh/m2a (Boverket, 2015).
2.2 ZEB according to SCNH
SCNH is a nonprofit association which mission is to stimulate energy efficient building in
Sweden (SCNH, 2013). Criteria for ZEBs were developed by the Forum för energieffektiva
byggnader (FEBY), the Swedish Forum for Energy Efficient Buildings, and the responsibility for
this work was later taken over by SCNH. The criteria include requirements on energy
performance as well as a net import/export balance (SCNH, 2012).
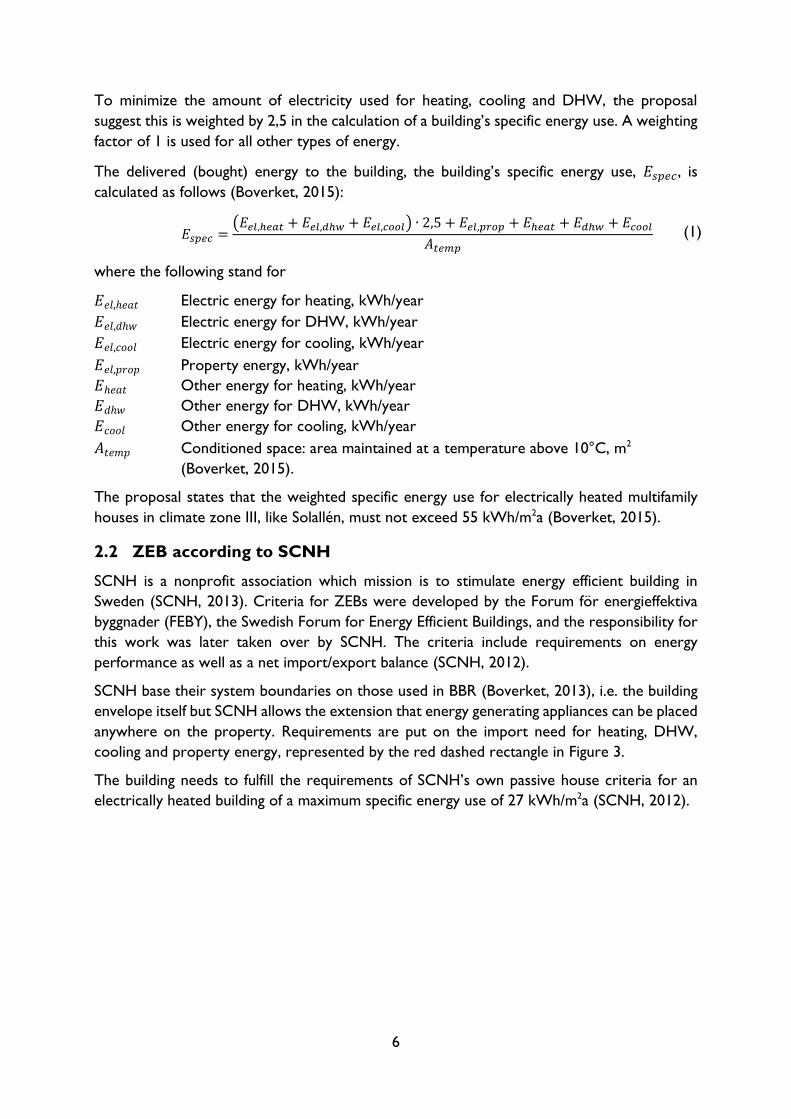
SCNH base their system boundaries on those used in BBR (Boverket, 2013), i.e. the building
envelope itself but SCNH allows the extension that energy generating appliances can be placed
anywhere on the property. Requirements are put on the import need for heating, DHW,
cooling and property energy, represented by the red dashed rectangle in Figure 3.
The building needs to fulfill the requirements of SCNH’s own passive house criteria for an
electrically heated building of a maximum specific energy use of 27 kWh/m2a (SCNH, 2012).
7
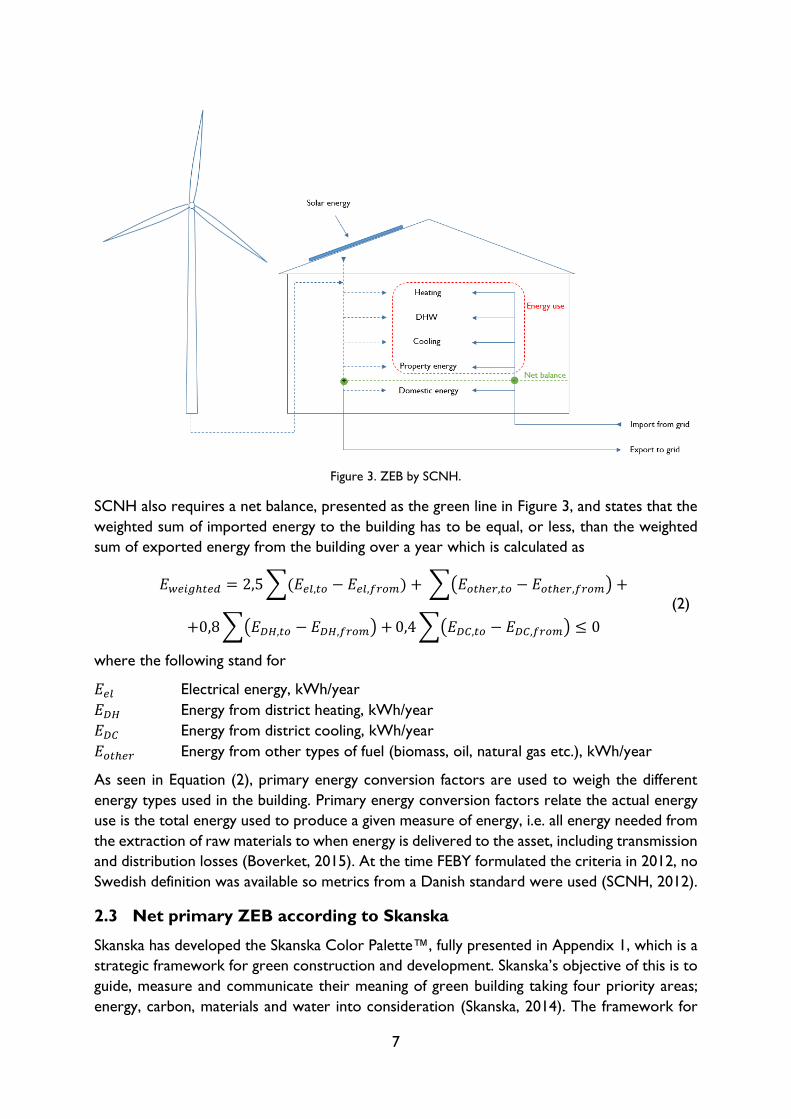
Figure 3. ZEB by SCNH.
SCNH also requires a net balance, presented as the green line in Figure 3, and states that the
weighted sum of imported energy to the building has to be equal, or less, than the weighted
sum of exported energy from the building over a year which is calculated as
𝐸𝑤𝑒𝑖𝑔ℎ𝑡𝑒𝑑 = 2,5 ∑(𝐸𝑒𝑙,𝑡𝑜 − 𝐸𝑒𝑙,𝑓𝑟𝑜𝑚) + ∑(𝐸𝑜𝑡ℎ𝑒𝑟,𝑡𝑜 − 𝐸𝑜𝑡ℎ𝑒𝑟,𝑓𝑟𝑜𝑚) +
(2)
+0,8 ∑(𝐸𝐷𝐻,𝑡𝑜 − 𝐸𝐷𝐻,𝑓𝑟𝑜𝑚) + 0,4 ∑(𝐸𝐷𝐶,𝑡𝑜 − 𝐸𝐷𝐶,𝑓𝑟𝑜𝑚) ≤ 0
where the following stand for
𝐸𝑒𝑙 Electrical energy, kWh/year
𝐸𝐷𝐻 Energy from district heating, kWh/year
𝐸𝐷𝐶 Energy from district cooling, kWh/year
𝐸𝑜𝑡ℎ𝑒𝑟 Energy from other types of fuel (biomass, oil, natural gas etc.), kWh/year
As seen in Equation (2), primary energy conversion factors are used to weigh the different
energy types used in the building. Primary energy conversion factors relate the actual energy
use is the total energy used to produce a given measure of energy, i.e. all energy needed from
the extraction of raw materials to when energy is delivered to the asset, including transmission
and distribution losses (Boverket, 2015). At the time FEBY formulated the criteria in 2012, no
Swedish definition was available so metrics from a Danish standard were used (SCNH, 2012).
2.3 Net primary ZEB according to Skanska
Skanska has developed the Skanska Color Palette™, fully presented in Appendix 1, which is a
strategic framework for green construction and development. Skanska’s objective of this is to
guide, measure and communicate their meaning of green building taking four priority areas;
energy, carbon, materials and water into consideration (Skanska, 2014). The framework for

8
energy is developed based on the work by Sartori et al., 2012 (Berggren, 2016) and includes
the company’s own definition of net primary ZEBs. A brief overview of the energy section of
the Color Palette™ is shown in Figure 4.
Figure 4. Energy category of Skanska Color Palette™ (Skanska, 2015).
The Color Palette™ illustrates the energy performance of a building by placing it on a scale
going from vanilla to deep green. Vanilla stands for compliance with BBR directives concerning
energy performance requirements, whereas deep green comprises Skanska’s definition of a
net primary ZEB. This includes that the following requirements must be fulfilled:
Green 1: 25 % annual improvement of building energy demand i.e. energy needed for heating,
cooling, domestic hot water (DHW) and property energy (Boverket, 2013) compared to
BBR’s energy use requirements. The energy demand requirement is represented by the red
dashed line in Figure 5 and includes the total demand for heating, DHW, cooling and property
energy. Generation of renewable energy on site cannot be credited in this step.
Green 2: In addition to fulfilling the requirements for Green 1, the building needs to achieve
an annual 50 % improvement of energy balance compared to BBR. In this step the energy
balance is defined as yearly energy demand minus generated, renewable energy within the
property over the year. Hence the additional 25 % improvement compared to Green 1 can
therefore be achieved by either further energy demand reduction or by generating a
corresponding amount of renewable energy within the building property.
Green 3: In addition to fulfilling the requirements for Green 2, the building need to achieve a
75% improvement of energy balance compared to BBR. In this step the energy balance is
defined as yearly energy demand minus newly invested renewable energy. The additional 25%
improvement compared to Green 2 can therefore be achieved by either further building
energy demand reductions, on site renewable energy generation or investing in the installing
of new, renewable energy generation systems regardless of their location.
Deep Green: In addition to fulfilling the requirements for Green 2, the building needs to fulfill
a net zero primary energy balance between the total energy demand and total energy
generation, represented by the green dashed lines in Figure 5. This is calculated as follows
𝐸𝑝𝑟𝑖𝑚𝑎𝑟𝑦 = ∑ 𝑤𝑖𝐸𝑑𝑒𝑚,𝑖
𝑖
− ∑ 𝑤𝑖𝐸𝑛𝑒𝑤 𝑖𝑛𝑣𝑒𝑠𝑡,𝑖
𝑖
≤ 0 (3)
where the following stand for
𝑤𝑖 Primary energy conversion factor
𝐸𝑑𝑒𝑚,𝑖 Energy demand per energy carrier, kWh/year
𝐸𝑛𝑒𝑤 𝑖𝑛𝑣𝑒𝑠𝑡,𝑖 Newly invested, renewable energy per energy carrier, kWh/year
Renewable energy should be used for the building’s primary energy demand but it does not
have to cover the domestic energy demand. The primary energy conversion factors used are
based on the metrics from SCNH (Skanska, 2014).

9
A representation of the specific energy requirements and net balance is available in Figure 5.
Figure 5. Net primary ZEB by Skanska.
2.4 Comparison of ZEB definitions
The following section compares the three different definitions described in Sections 2.1-2.3
according to the framework for net ZEB definitions developed by (Sartori, et al., 2012). This
framework does not define how to implement net ZEBs, but focus instead which areas should
be elaborated when doing so. Some topics treated in the framework are not applicable to the
nearly ZEB proposal by Boverket. However, the definition is still evaluated towards this
framework in order to enable comparison between the different definitions.
The methodology evaluates net ZEBs according to the following criteria and sub-criteria:
Building system boundary
Physical boundary Defines the boundary for energy flows in and out of the system
and determines what is considered as “on-site”.
Balance boundary Defines which energy uses are included in the balance
calculation.
Boundary conditions Defines external circumstances so that different buildings can be
evaluated for similar conditions regarding climate, comfort,
usage etc.
Weighting system
Metrics Converts energy data to quantification of interest, for example
site energy, primary energy, energy cost or carbon emissions.

10
Symmetry Defines if demand and supply energy are weighted equally.
Time dependent accounting Defines if the metrics are static or vary over time.
Net ZEB Balance
Balancing period Defines the time span for the balancing period.
Type of balance Defines if the balance is based on energy demand versus
renewable generation or energy import versus export through
the physical boundary.
Energy efficiency Defines requirements on energy efficiency of the building such
as energy use or properties of the building envelope.
Energy supply Defines requirements on minimum renewable energy use to
cover the buildings energy demand.
Temporal energy match characteristics
Load matching Defines how the building’s generation installation simultaneously
matches the building’s demand.
Grid interaction Defines how the building’s generation installation simultaneously
matches the needs of the electricity grid.
Measurement and
verification
Defines the requirements on how to follow up the energy
performance of the building.
2.4.1 Evaluation of nearly ZEB by Boverket
The following section describes Boverket’s nearly ZEB proposal (Boverket, 2015) according
to Sartori’s framework.
Building system boundary
Physical boundary Defined as the building envelope, according to BBR, but
expanded so that free flowing energy on site or near the building
can be credited.
Balance boundary Defined as bought energy delivered to the building for heating,
cooling, DHW and property energy. Bought energy is defined as
imported energy from the grid.
Boundary conditions Follows BBR. Numerous factors should be accounted for, for
example design outdoor temperature (DOT), minimum levels of
temperatures in the occupied zone and requirements for DHW
temperatures etc. (Boverket, 2015).

11
Weighting system
Metrics Electricity used for heating, cooling and DHW is weighted by
2,5. A weighing factor of 1 is used for all other types of energy.
Symmetry Not applicable since no export is accounted for.
Time dependent accounting The weighing factors are static.
Net ZEB Balance
Balancing period Not applicable since no export is accounted for. However, for
energy efficiency requirements the balancing period is one year.
Type of balance Not applicable since no export is accounted for.
Energy efficiency Energy use requirements of 55 kWh/m2a, Other energy
efficiency requirements are according to BBR22 (Boverket,
2015).
Energy supply No quantitative requirements are stated. However, the EPBD
states that energy should be provided by renewable sources “to
a very significant extent” (Ecofys, 2012, p. 18). In order to fulfill
the intention of the EPBD, the proposed system boundary allows
free flowing energy to be credited, as mentioned above.
Temporal energy match characteristics
Load matching Not applicable since no export is accounted for.
Grid interaction Not applicable since no export is accounted for.

12
Measurement and
verification
The buildings energy use must continuously be measured so that
the energy use for a wanted time period can be calculated. This
should be done by measuring the energy used for heating,
comfort cooling, DHW and property energy. For electrically
heated buildings, household and property energy need to be
measured separately (Boverket, 2015).
2.4.2 Evaluation of ZEB by SCNH
The following section describes SCNH the net ZEB definition (SCNH, 2012) according to
Sartori’s framework.
Building system boundary
Physical boundary Defined as the building property.
Balance boundary Defined as energy use of the building for heating, cooling, DHW
and property energy.
Boundary conditions Energy use should be calculated for DOT using a set indoor
temperature of 21 °C and behavioral templates for internal gains
etc. from the association of Standardisera och verifiera
energiprestanda i byggnader (Sveby), a program that
standardizes and verifies energy performance in buildings (Sveby,
2012).
Weighting system
Metrics Primary energy conversion factors based on Danish building
regulations are used. Weighting factors are 2,5 for electricity,
0,8 for district heating, 0,4 for district cooling and 1 for all other
types of energy.
Symmetry Symmetric weighting is used.
Time dependent accounting Static weighting factors are used.
Net ZEB Balance
Balancing period The balancing period is one year.
Type of balance The balance used is an import/export balance which is presented
in Section 2.2.
Energy efficiency The building needs to fulfill the requirements of SCNH’s own
passive house criteria. This entails that the specific energy use
must be lower than 27 kWh/m2a.
Energy supply Renewable energy generation within the property is accounted
for.

13
Temporal energy match characteristics
Load matching No requirements.
Grid interaction No requirements.
Measurement and
verification
The requirements cover separate measuring for the following
areas: electricity, heating energy and DHW. The measurements
should separate the energy used inside and outside the balancing
boundary, e.g. property energy and domestic energy. To verify
the performance of the building, some of the building energy
characteristics must be measured so that they can be read at
least monthly.
2.4.3 Evaluation of net primary ZEB by Skanska
The following section describes Skanska’s the net primary ZEB definition (Skanska, 2014)
according to Sartori’s framework.
Building system boundary
Physical boundary The boundary for the energy demand of the building is defined
as the property. However, the boundary for energy generation
that is accounted for is expanded to all newly invested
renewable energy regardless of location.
Balance boundary Defined as energy use of the building for heating, cooling, DHW
and property energy.
Boundary conditions Based on Skanska’s internal guidelines. If no instructions are at
hand guidelines user data from Sveby should be used as input.
Otherwise calculation instructions given by SCNH can be used.
Weighting system
Metrics The metrics are based on SCNH’s primary energy conversion
factors. Weighting factors are 2,5 for electricity, 0,8 for district
heating, 0,4 for district cooling and 1 for all other types of
energy.
Symmetry Symmetric weighting is used.
Time dependent accounting Static weighting factors are used.
14
Net ZEB Balance
Balancing period The balancing period is one year.
Type of balance The balance used is demand/generation balance as presented in
Section 2.3.
Energy efficiency Requires a 25% improvement of energy demand compared to
BBR’s energy use requirements. This entails that the specific
energy demand must be lower than 41 kWh/m2a, compared to
BBR20’s requirements of a maximum energy use of 55 kWh/m2a
(Boverket, 2013).
Energy supply Renewable energy must cover the building’s specific energy
demand. Off-site renewable energy is accounted for as long as it
is newly invested.
Temporal energy match characteristics
Load matching No requirements.
Grid interaction No requirements.
Measurement and
verification
Buildings have to be followed up during at least two years. The
following posts must be measured: energy for heating, DHW,
ventilation, cooling and property energy (Skanska Sverige / Grön
Affärsutveckling, 2013).
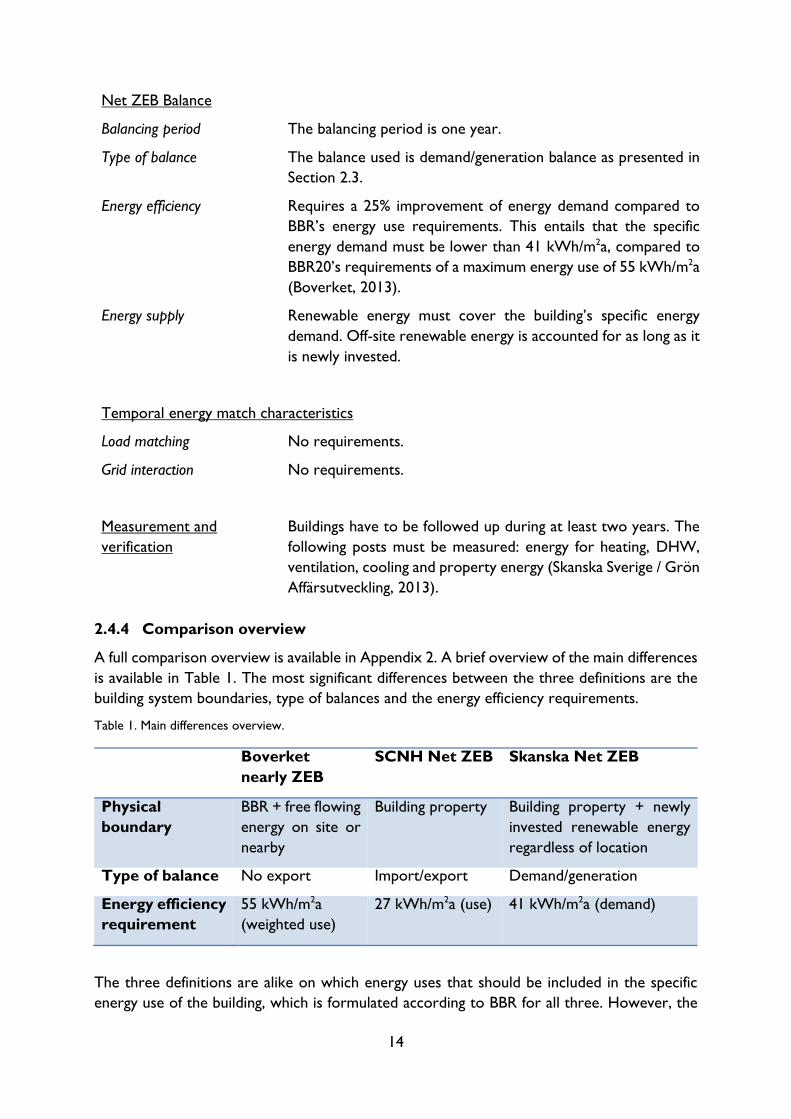
2.4.4 Comparison overview
A full comparison overview is available in Appendix 2. A brief overview of the main differences
is available in Table 1. The most significant differences between the three definitions are the
building system boundaries, type of balances and the energy efficiency requirements.
Table 1. Main differences overview.
Boverket
nearly ZEB
SCNH Net ZEB Skanska Net ZEB
Physical
boundary
BBR + free flowing
energy on site or
nearby
Building property Building property + newly
invested renewable energy
regardless of location
Type of balance No export Import/export Demand/generation
Energy efficiency
requirement
55 kWh/m2a
(weighted use)
27 kWh/m2a (use) 41 kWh/m2a (demand)
The three definitions are alike on which energy uses that should be included in the specific
energy use of the building, which is formulated according to BBR for all three. However, the

15
system boundaries are drawn differently. In Boverket’s nearly ZEB definition, all free flowing
energy onsite or nearby can be credited. SCNH draws the system boundary within the
property and Skanska’s system boundary is expanded so that all newly invested energy can be
credited as energy generation.
There is also the difference that Boverket’s definition does not include an energy balance.
SCNH uses an import/export balance while Skanska uses a demand/generation balance.
Defining the energy efficiency requirements, Boverket uses a weighting equation for a
maximum allowed level of specific energy use. In this equation, a distinction is made between
electricity for heating and property energy, which are weighted differently, where the former
is limited more strictly. SCNH and Skanska have defined the criteria as a maximum level of
energy use. SCNH’s ZEB definition includes their own passive house criteria while Skanska’s
net primary ZEB is based on a percentage improvement of energy demand compared to BBR’s
energy use requirements.
Skanska’s net primary ZEB definitions requires a maximum energy demand of 41 kWh/m2a
while SCNH requires a maximum energy use of 27 kWh/m2a. The nearly ZEB separates
electricity for heating and property energy, as presented in Section 2.1, and presents a
requirement for a maximum weighted energy use of 55 kWh/m2a.
2.5 Discussion of ZEB definitions
As the nearly ZEB proposal by Boverket will apply to all new buildings, not only ZEBs, the use
of Sartori’s framework may not seem applicable in order to review this definition. However,
since Boverket specifies the possibly to credit free flowing energy, the discussion on system
boundaries etc. is relevant to examine and compare this proposal to other ZEB definitions
available.
Skanska’s net primary ZEB has the most permissive system boundary, as it is allowed to credit
all newly invested renewable energy regardless of location. SCNH, where only energy
generated on site can be credited, uses an import/export balance together with passive house
requirements on maximum specific energy use according to BBR’s system definition.
It is not straightforward to conclude which energy demand or use requirement that is the
most demanding, exclusively based on the requirements presented in Table 1. This is due to
the fact they are not calculated in the same way. The energy efficiency requirements for nearly
ZEB by Boverket are, in accordance with current BBR and ZEB by SCNH, stated as restrictions
on energy use, i.e. bought energy to the building. However, Boverket’s requirement accounts
weighted electricity for heating while the requirement for solely electrically heated buildings
presented by SCNH’s is for unweighted energy use. Skanska is the only definition which
requests a limitation of the specific energy demand of the building. In order to make sure that
the building envelope are built in an energy efficient way, Boverket and SCNH instead state requirements of U-values and heat loss factors respectively, which are not covered in this
report as stated in Section 1.4.
In accordance with the delimitations of this report, this means it could be possible to focus
the decrease of specific energy use to an acceptable level according to Boverket, by using
more generation of free flowing energy that can be directly used within the building. This can
be seen as an incentive for construction companies to focus on investing in renewable energy
generation, rather than investing in efficiency measurements of the building envelope.

16
Investigations on costs related to energy efficiency measures compared to using energy storage
could be conducted in order to improve the buildings in a cost-optimum way.
If nearly ZEB by Boverket is implemented, the requirements on energy efficiency for Skanska’s
net primary ZEB will consequently be stricter. This is because the requirement of Skanska’s
maximum energy demand is based on a percentage of the current BBR’s requirements of
maximum energy use, which nearly ZEB by Boverket will constitute as, if the proposal goes
through. However, it cannot directly be concluded how the possible implementation of the
nearly ZEB proposal will affect the energy efficiency requirements for ZEB by SCNH. This is
due to Boverket’s distinction in weighting between the electricity used for heating or cooling
and electricity as property energy. This can be seen in Equations (1) and (3). Depending on
the ratio between electricity for heating, cooling and property energy, two buildings which
have the same specific energy use according to current BBR definition (which SCNH follows),
may have different outcomes if compared to the nearly ZEB definition.
Boverket states that the reason that electricity for heating is weighted is to limit the use of
electricity for heating. However, to verify the required levels in reality, if this distinction is
made between property and heating electricity, this entails that additional measuring points
would have to be installed within a building to be able to separate the electricity uses. Since it
is stated in the EU directive that the new implementations should maintain cost-effective this
could be considered as unnecessary. It could therefore be argued that the total use of
electricity should be weighted and that possibly the requirements of specific energy use could
be somewhat increased, to make the following up more easy and applicable to reality.
It must be remembered that the authors of the three definitions are likely to have different
incentives for formulating their definition of ZEBs since Boverket, SCNH and Skanska are
three different organizations with different missions. SCNH is a non-profit organization which
mission is to stimulate energy efficient building in Sweden, which would therefore be expected
to have the strictest requirements of the definitions. Skanska is a limited company and thereby
dependent on the economical outcome of their definition. It is believed that this is the reason
for Skanska to have the most permissive requirements regarding e.g. system boundary. The formulation of the requirements on energy use as a percentage of the BBR, is seen as an
effective way of communicating the company’s energy performance as “better than
benchmark”. The net primary ZEB is believed to be formulated with the objective, not only
to quantify the company’s energy efficiency measurements internally, but also to be used as a
marketing tool.
17
Performance review
In this section, the performance of the energy system in Solallén is reviewed. First, the system
design will be overlooked. Secondly, the compliance between simulated values obtained during
the development process and measured and normalized data from the first year of operation
id reviewed. Lastly, a review of how Solallén’s performance complies with the three ZEB
definitions described in Section 2.1- 2.3 is conducted.
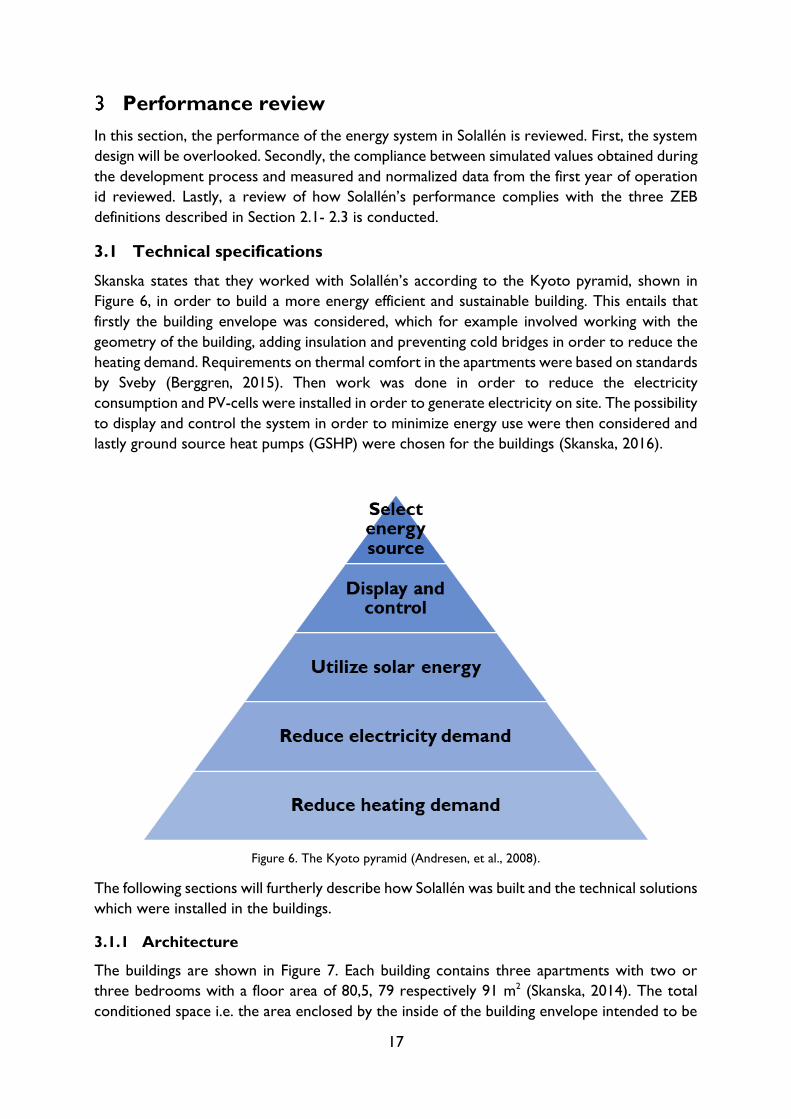
3.1 Technical specifications
Skanska states that they worked with Solallén’s according to the Kyoto pyramid, shown in
Figure 6, in order to build a more energy efficient and sustainable building. This entails that
firstly the building envelope was considered, which for example involved working with the
geometry of the building, adding insulation and preventing cold bridges in order to reduce the
heating demand. Requirements on thermal comfort in the apartments were based on standards
by Sveby (Berggren, 2015). Then work was done in order to reduce the electricity
consumption and PV-cells were installed in order to generate electricity on site. The possibility
to display and control the system in order to minimize energy use were then considered and
lastly ground source heat pumps (GSHP) were chosen for the buildings (Skanska, 2016).
Figure 6. The Kyoto pyramid (Andresen, et al., 2008).
The following sections will furtherly describe how Solallén was built and the technical solutions
which were installed in the buildings.
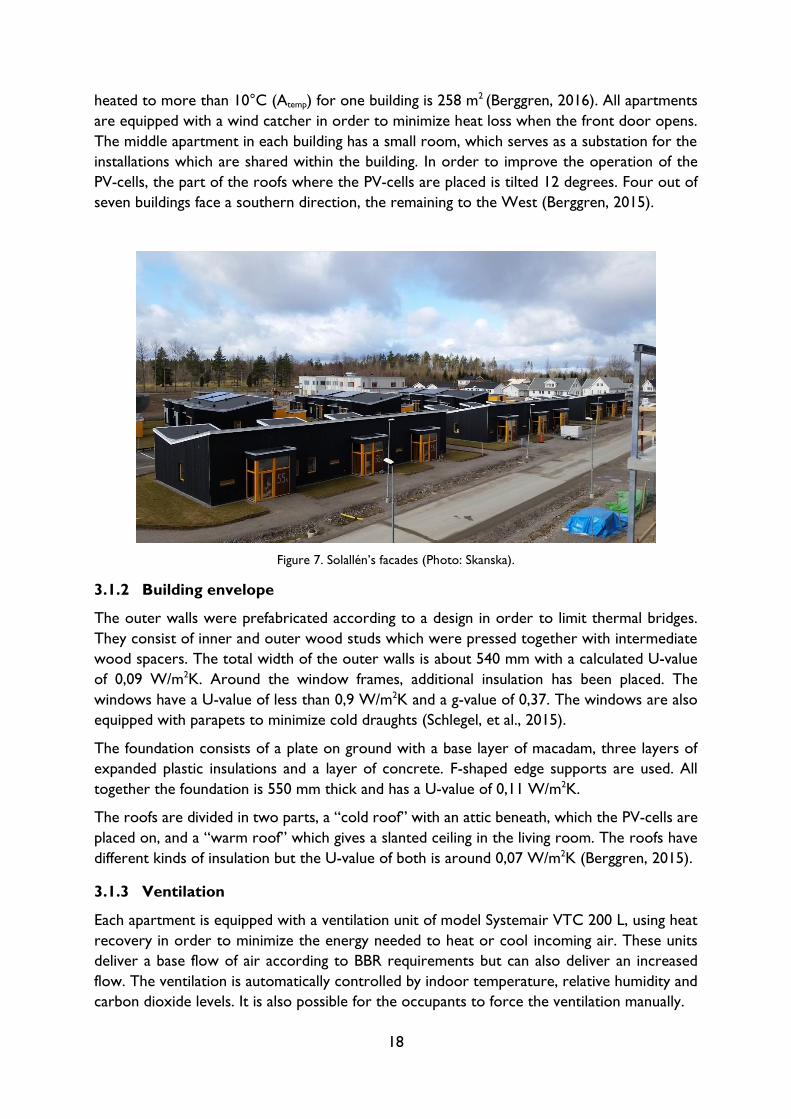
3.1.1 Architecture
The buildings are shown in Figure 7. Each building contains three apartments with two or
three bedrooms with a floor area of 80,5, 79 respectively 91 m2 (Skanska, 2014). The total
conditioned space i.e. the area enclosed by the inside of the building envelope intended to be
18
heated to more than 10°C (Atemp) for one building is 258 m2 (Berggren, 2016). All apartments
are equipped with a wind catcher in order to minimize heat loss when the front door opens.
The middle apartment in each building has a small room, which serves as a substation for the
installations which are shared within the building. In order to improve the operation of the
PV-cells, the part of the roofs where the PV-cells are placed is tilted 12 degrees. Four out of
seven buildings face a southern direction, the remaining to the West (Berggren, 2015).
Figure 7. Solallén’s facades (Photo: Skanska).
3.1.2 Building envelope
The outer walls were prefabricated according to a design in order to limit thermal bridges.
They consist of inner and outer wood studs which were pressed together with intermediate
wood spacers. The total width of the outer walls is about 540 mm with a calculated U-value
of 0,09 W/m2K. Around the window frames, additional insulation has been placed. The
windows have a U-value of less than 0,9 W/m2K and a g-value of 0,37. The windows are also
equipped with parapets to minimize cold draughts (Schlegel, et al., 2015).
The foundation consists of a plate on ground with a base layer of macadam, three layers of
expanded plastic insulations and a layer of concrete. F-shaped edge supports are used. All
together the foundation is 550 mm thick and has a U-value of 0,11 W/m2K.
The roofs are divided in two parts, a “cold roof” with an attic beneath, which the PV-cells are
placed on, and a “warm roof” which gives a slanted ceiling in the living room. The roofs have
different kinds of insulation but the U-value of both is around 0,07 W/m2K (Berggren, 2015).
3.1.3 Ventilation
Each apartment is equipped with a ventilation unit of model Systemair VTC 200 L, using heat
recovery in order to minimize the energy needed to heat or cool incoming air. These units
deliver a base flow of air according to BBR requirements but can also deliver an increased
flow. The ventilation is automatically controlled by indoor temperature, relative humidity and
carbon dioxide levels. It is also possible for the occupants to force the ventilation manually.

19
Water heating and cooling batteries are installed after the supply fan in order to provide the
building with appropriately heated or cooled incoming air (Schlegel, et al., 2015).
3.1.4 GSHP
Heating and DHW is provided by a Thermia Diplomat GSHP shared within each building. For
heating purposes, the heat pump supplier claims to have a coefficient of performance (COP)
of higher than four. The heat is distributed through floor heating (Schlegel, et al., 2015).
3.1.5 Free cooling
Free cooling is provided from the borehole using a pump which provides cold water to a
cooling battery where incoming ventilation air is cooled. (Schlegel, et al., 2015).
3.1.6 PV-cells
On each building 40 Solarwatt 60P PV-cells, each with 250Wp, are mounted. This entails a
total installed power of 10 kWp (kilowatt peak) for each building. The PV-cells are
dimensioned in order to generate as much energy as the specific energy demand of the building
in order to achieve a net zero balance over the year. All together the PV-cells on Solallén
should generate 56 MWh every year (Schlegel, et al., 2015).
3.1.7 Measuring instruments
To be able to follow up on the building energy performance, extensive measurements are
installed in one of the buildings, hereafter referred to as “house four”. Electricity generated
by the PV-cells, electricity for fans, pumps etc. as well as different flows and temperatures
throughout the building installations are measured in this building. A complete representation
of this is attached in Appendix 3 (Berggren, 2015). The data are measured every hour.
However, in the analysis described in the upcoming section, occasionally some data points
were missing. In these cases, a mean value between the closest measuring points were used.
3.2 Performance analysis
The energy performance of building four in Solallén is overviewed, comparing if the simulated
values obtained during the development process correspond to the ones measured and
normalized during the first year of operation. The energy performance of the building will also
be reviewed according to the different ZEB definitions described in Chapter 2.
The energy system of Solallén is shown in Figure 8. Electricity is provided to the building via
the PV-cells, here called directly used electricity, and from the grid in order to cover the
building’s total energy demand. If the PV-cells generate more electricity than the instantaneous
demand of the building and the domestic energy use at the time has been covered as well,
electricity is exported to the grid.
If the demand is larger than the instantaneous generation of solar electricity, electricity is
imported from the grid. As stated in Section 3.1, some of the installations, such as the GSHP,
are shared within the building and some are household specific, such as the ventilation fans.
As this analysis comprises one building, i.e. three apartments, the energy for installations which
are installed in each apartment are added together to get a total value for the entire building
(Schlegel, et al., 2015).

20
Figure 8. Energy system of Solallén.
3.2.1 Normalization
In order to account for differences in climate and user behavior compared to normal
conditions, the measured data obtained from building four is normalized using normal climate
statistics from Sveriges Meteorologiska och Hydrologiska Institut (SMHI), Swedish
Meteorological and Hydrological Institute, (SMHI, 2016) and normal use data from Sveby
(Sveby, 2012). This is done to enable the comparison of the building performance and the
expectations from simulations.
The obtained data from building four for the GSHP comprises the total energy use for both
heating and DHW, i.e.
𝐸𝐺𝑆𝐻𝑃 = 𝐸ℎ𝑒𝑎𝑡 + 𝐸𝐷𝐻𝑊 (5)
To be able to normalize these separately, the energy needed for DHW is subtracted using a
benchmark value from Sveby of 55 kWh/m3 used liters of DWH (Sveby, 2012) together with
a COP of 3 for the GSHP (Schlegel, et al., 2015) according to
𝐸ℎ𝑒𝑎𝑡,ℎ𝑜𝑢𝑟 = 𝐸𝐺𝑆𝐻𝑃,ℎ𝑜𝑢𝑟 − 𝑉𝐷𝐻𝑊,ℎ𝑜𝑢𝑟 ∙𝐸𝐷𝐻𝑊,𝑛𝑜𝑟𝑚𝑎𝑙
𝐶𝑂𝑃𝐺𝑆𝐻𝑃 (6)
where the following stand for
𝐸𝐺𝑆𝐻𝑃,ℎ𝑜𝑢𝑟 Total electricity needed for the GSHP [kWh/hour]
𝐸ℎ𝑒𝑎𝑡,ℎ𝑜𝑢𝑟 Electricity needed for heating [kWh/hour]
𝑉𝐷𝐻𝑊,ℎ𝑜𝑢𝑟 Volume of the used DHW [m3/hour]
𝐸𝐷𝐻𝑊,𝑛𝑜𝑟𝑚𝑎𝑙 Benchmark value for energy needed for DHW preparation [kWh/m3]
𝐶𝑂𝑃𝐺𝑆𝐻𝑃 COP of the GSHP [-]

21
The electricity input to the GSHP is normalized using monthly values for normal and actual
degree days (DD) provided by SMHI. Normal values are based on the period 1981-2010
(SMHI, 2015).
The heating demand of the building for a normal temperature year is calculated as follows
𝐸ℎ𝑒𝑎𝑡,𝑛𝑜𝑟𝑚𝑎𝑙 = ∑ 𝐸ℎ𝑒𝑎𝑡,𝑎𝑐𝑡𝑢𝑎𝑙,𝑖
𝐷𝐷𝑛𝑜𝑟𝑚𝑎𝑙,𝑖
𝐷𝐷𝑎𝑐𝑡𝑢𝑎𝑙,𝑖𝑖
(7)
where the following stand for
𝐸ℎ𝑒𝑎𝑡,𝑛𝑜𝑟𝑚𝑎𝑙 Normalized energy need for heating [kWh/year]
𝐸ℎ𝑒𝑎𝑡,𝑎𝑐𝑡𝑢𝑎𝑙,𝑖 Actual energy need for heating [kWh/month]
𝐷𝐷𝑛𝑜𝑟𝑚𝑎𝑙,𝑖 Normal monthly values for number of degree days
𝐷𝐷𝑎𝑐𝑡𝑢𝑎𝑙,𝑖 Actual monthly values for number of degree days.
The DHW is normalized using a normal yearly DHW energy use of 1718 kWh used in the
simulations, which are based on normal data from Sveby (Sveby, 2012). In order to maintain a
realistic DHW usage pattern, the distribution of the yearly energy use is set as the same
distribution pattern as the actual, measured DHW use in building four according to the
following equation
𝐷𝐻𝑊𝑛𝑜𝑟𝑚𝑎𝑙,ℎ𝑜𝑢𝑟 =
𝑉𝐷𝐻𝑊,ℎ𝑜𝑢𝑟𝑙𝑦
𝑉𝐷𝐻𝑊,𝑦𝑒𝑎𝑟𝑙𝑦∙ 𝐷𝐻𝑊𝑛𝑜𝑟𝑚𝑎𝑙,𝑦𝑒𝑎𝑟 (8)
The electricity output from the PV-cells is also normalized using normal and actual global
irradiance provided by SMHI. Normal values are based on the period 1961-1990 (SMHI, 2016).
Normalization is done by using the following methodology
𝐸𝑠𝑜𝑙,𝑛𝑜𝑟𝑚𝑎𝑙 = ∑ 𝐸𝑠𝑜𝑙,𝑎𝑐𝑡𝑢𝑎𝑙,𝑖
𝐺𝐼𝑛𝑜𝑟𝑚𝑎𝑙,𝑖
𝐺𝐼𝑎𝑐𝑡𝑢𝑎𝑙,𝑖𝑖
(9)
where
𝐸𝑠𝑜𝑙,𝑛𝑜𝑟𝑚𝑎𝑙 Normalized solar electricity [kWh/year]
𝐸𝑠𝑜𝑙,𝑎𝑐𝑡𝑢𝑎𝑙,𝑖 Actual solar electricity [kWh/month]
𝐺𝐼𝑛𝑜𝑟𝑚𝑎𝑙,𝑖 Normal monthly values of global irradiation [kWh/m2]
𝐺𝐼𝑎𝑐𝑡𝑢𝑎𝑙,𝑖 Actual monthly values of global irradiation [kWh/m2]
22
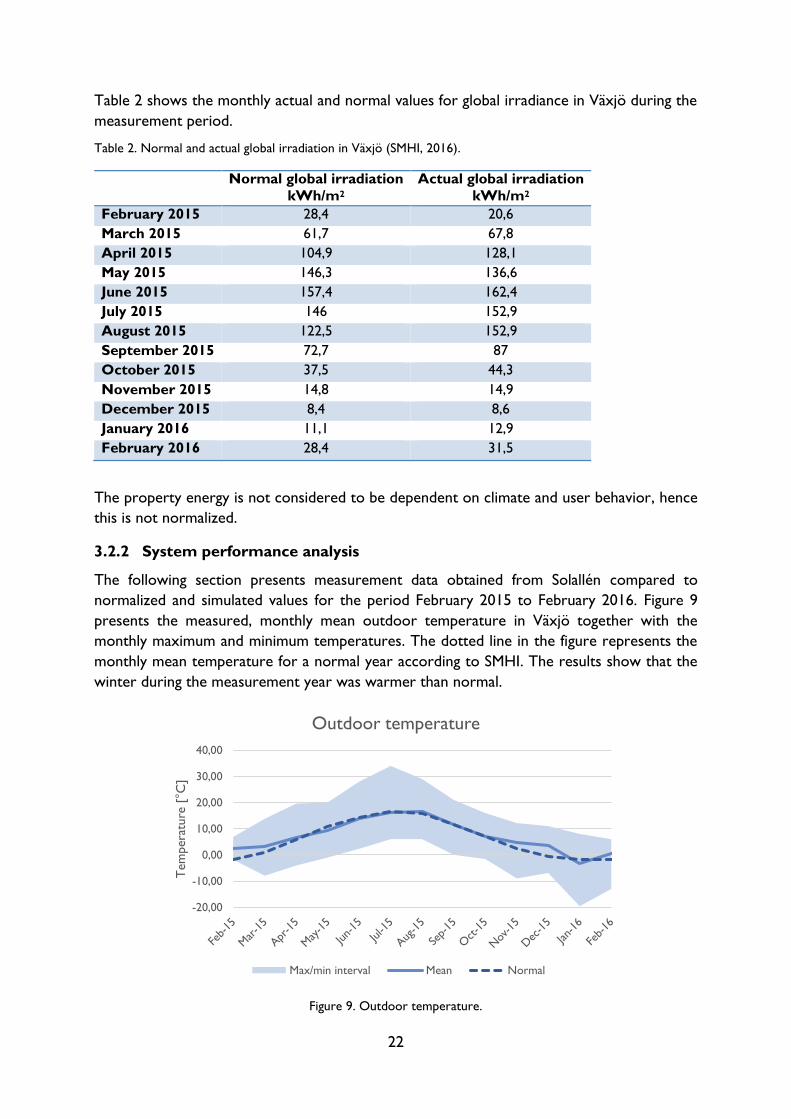
Table 2 shows the monthly actual and normal values for global irradiance in Växjö during the
measurement period.
Table 2. Normal and actual global irradiation in Växjö (SMHI, 2016).
Normal global irradiation
kWh/m2
Actual global irradiation
kWh/m2
February 2015 28,4 20,6
March 2015 61,7 67,8
April 2015 104,9 128,1
May 2015 146,3 136,6
June 2015 157,4 162,4
July 2015 146 152,9
August 2015 122,5 152,9
September 2015 72,7 87
October 2015 37,5 44,3
November 2015 14,8 14,9
December 2015 8,4 8,6
January 2016 11,1 12,9
February 2016 28,4 31,5
The property energy is not considered to be dependent on climate and user behavior, hence
this is not normalized.
3.2.2 System performance analysis
The following section presents measurement data obtained from Solallén compared to
normalized and simulated values for the period February 2015 to February 2016. Figure 9
presents the measured, monthly mean outdoor temperature in Växjö together with the
monthly maximum and minimum temperatures. The dotted line in the figure represents the
monthly mean temperature for a normal year according to SMHI. The results show that the
winter during the measurement year was warmer than normal.
Figure 9. Outdoor temperature.
-20,00
-10,00
0,00
10,00
20,00
30,00
40,00
Tem
pera
ture
[°C
]
Outdoor temperature
Max/min interval Mean Normal

23
Figure 10 - Figure 12 presents the indoor temperatures in the three apartments in building
four. These show the mean temperatures lie between 21 and 25 °C throughout the year. The
lowest temperature is around 19 °C. The highest is registered in apartment 3 in July, where it
has been around 29 °C as a maximum.
Figure 10. Indoor temperature in apartment 1.
Figure 11. Indoor temperature in apartment 2.
15,00
18,00
21,00
24,00
27,00
30,00
Tem
pera
ture
[°C
]
Indoor temperature apartment 1
Max/min interval Mean
15,00
18,00
21,00
24,00
27,00
30,00
Tem
pera
ture
[°C
]
Indoor temperature apartment 2
Max/min interval Mean
24
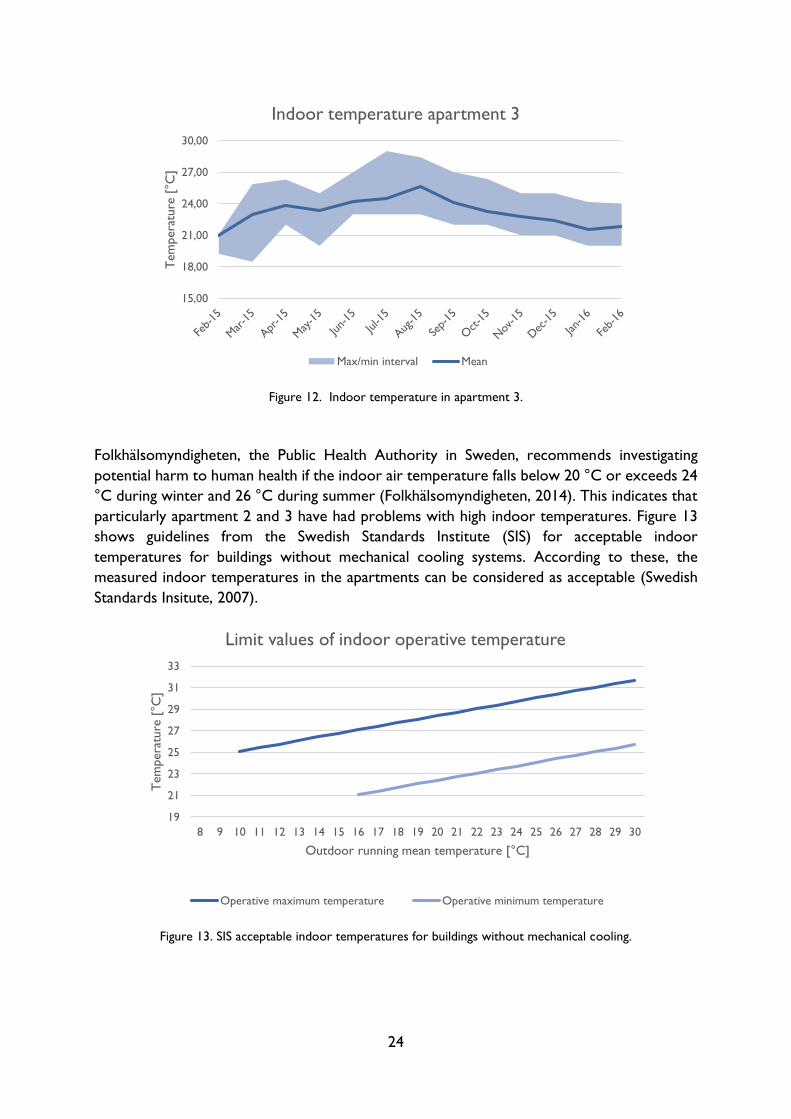
Figure 12. Indoor temperature in apartment 3.
Folkhälsomyndigheten, the Public Health Authority in Sweden, recommends investigating
potential harm to human health if the indoor air temperature falls below 20 °C or exceeds 24
°C during winter and 26 °C during summer (Folkhälsomyndigheten, 2014). This indicates that
particularly apartment 2 and 3 have had problems with high indoor temperatures. Figure 13
shows guidelines from the Swedish Standards Institute (SIS) for acceptable indoor
temperatures for buildings without mechanical cooling systems. According to these, the
measured indoor temperatures in the apartments can be considered as acceptable (Swedish
Standards Insitute, 2007).
Figure 13. SIS acceptable indoor temperatures for buildings without mechanical cooling.
15,00
18,00
21,00
24,00
27,00
30,00
Tem
pera
ture
[°C
]
Indoor temperature apartment 3
Max/min interval Mean
19
21
23
25
27
29
31
33
8 9 10 11 12 13 14 15 16 17 18 19 20 21 22 23 24 25 26 27 28 29 30
Tem
pera
ture
[°C
]
Outdoor running mean temperature [°C]
Limit values of indoor operative temperature
Operative maximum temperature Operative minimum temperature

25
Figure 14 - Figure 16 show the daily mean power of the ventilation fans in the apartments. The
results show that the fans have had different usage patterns during the year of measurement.
The fans in apartment 1 and 3 run on a high power during the summer months, but lower
during the remaining months. However, the base flow in apartment 1 seems to have increased
after the summer. The fan in apartment 2 runs on a constant power throughout the year,
similar to the base level in apartment 1 after the summer, even though the temperatures in
apartment 2 had the highest temperature of the apartments as seen in Figure 11.
Figure 14. Power of the fan in apartment 1.
Figure 15. Power of the fan in apartment 2.
0
0,5
1
1,5
2
2,5
3
Pow
er
[kW
]
Fan apartment 1
0
0,5
1
1,5
2
2,5
3
Pow
er
[kW
]
Fan apartment 2

26
Figure 16. Power of the fan in apartment 3.
The GSHP provides the building with heating and DHW. Figure 17 shows the monthly and
annual energy demand of the GSHP. Figures of the monthly and annual energy demand of
heating and DHW separately are presented in Appendix 4. The normalized energy demand
for the GSHP follows the trend of the simulation, but was larger than expected.
Figure 17. Energy demand of the GSHP.
0
0,5
1
1,5
2
2,5
3
Pow
er
[kW
]
Fan apartment 3
0
5
10
15
20
25
30
0
0,5
1
1,5
2
2,5
3
3,5
4
Annual
energ
y [k
Wh/m
2a]
Month
ly energ
y [k
Wh/m
2a]
GSHP energy demand
Measured Normalized Simulated
Annual measured Annual Normalized Annual Simulated
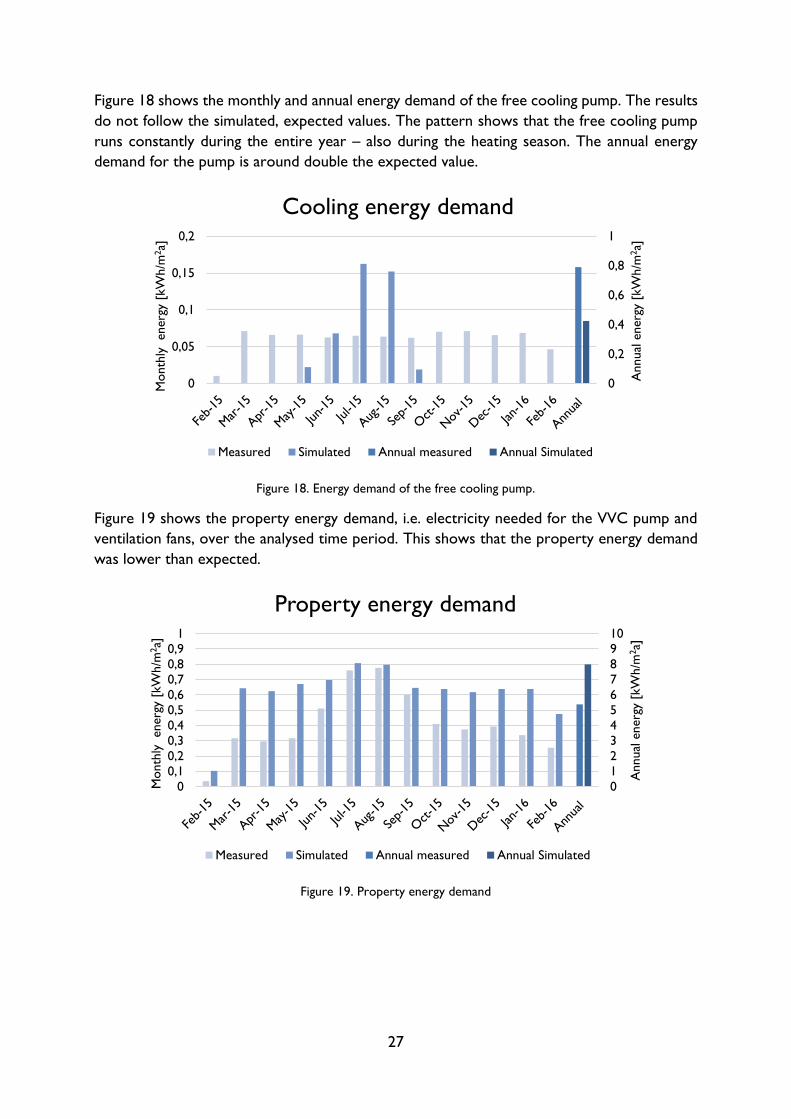
27
Figure 18 shows the monthly and annual energy demand of the free cooling pump. The results
do not follow the simulated, expected values. The pattern shows that the free cooling pump
runs constantly during the entire year – also during the heating season. The annual energy
demand for the pump is around double the expected value.
Figure 18. Energy demand of the free cooling pump.
Figure 19 shows the property energy demand, i.e. electricity needed for the VVC pump and
ventilation fans, over the analysed time period. This shows that the property energy demand
was lower than expected.
Figure 19. Property energy demand
0
0,2
0,4
0,6
0,8
1
0
0,05
0,1
0,15
0,2
Annual
energ
y [k
Wh/m
2a]
Month
ly energ
y [k
Wh/m
2a]
Cooling energy demand
Measured Simulated Annual measured Annual Simulated
0
1
2
3
4
5
6
7
8
9
10
0
0,1
0,2
0,3
0,4
0,5
0,6
0,7
0,8
0,9
1A
nnual
energ
y [k
Wh/m
2a]
Month
ly energ
y [k
Wh/m
2a]
Property energy demand
Measured Simulated Annual measured Annual Simulated

28
Figure 20 presents the domestic energy demand. This shows that the domestic energy demand
was lower than expected for all months, especially during winter.
Figure 20. Domestic energy demand.
Figure 21 shows the electricity generation from the PV-cells installed on the building. This
shows that more solar electricity was generated than expected. This can indicate that the
observed time period was sunnier than normal. However, the normalized values show that
the PV-cells produce more energy than expected during a normal year as well.
Figure 21. Produced solar energy.
0
5
10
15
20
25
30
35
0
0,5
1
1,5
2
2,5
3
3,5
4
4,5
5
Annual
energ
y [k
Wh/m
2a]
Month
ly energ
y [k
Wh/m
2a]
Domestic energy demand
Measured Simulated Annual measured Annual Simulated
0
5
10
15
20
25
30
35
40
0
1
2
3
4
5
6
Annual
energ
y [k
Wh/m
2a]
Month
ly energ
y [k
Wh/m
2a]
Generated solar electricity
Measured Normalized Simulated
Annual measured Annual Normalized Annual Simulated

29
3.2.3 Energy use in Solallén
Figure 22 shows a comparison of simulated, measured and normalized values of the specific
energy demand in the building, i.e. energy need for heating & DHW, cooling, property energy.
It also presents the specific domestic energy demand.
Figure 22. Specific energy demand.
The results show that the simulated specific energy demand of the building complies well with
the measured values, however the used domestic energy is lower than expected.
The specific energy use of the building is defined as the imported (bought) energy for heating,
cooling, DHW and property energy according to BBR (Boverket, 2011). Calculating how the
solar electricity is distributed within the building the assumption has been made that it is
primarily used to cover the heating demand, secondly the property energy and thirdly the
domestic energy, since the last is outside to the system boundary this is considered as export.
The specific energy use in Solallén is then
𝐸𝑠𝑝𝑒𝑐 =
𝐸ℎ𝑒𝑎𝑡 + 𝐸𝑐𝑜𝑜𝑙 + 𝐸𝑝𝑟𝑜𝑝
𝐴𝑡𝑒𝑚𝑝 (10)
where
𝐸ℎ𝑒𝑎𝑡 Imported (bought) electricity for GSHP which provides heating and DHW
[kWh/year]
𝐸𝑐𝑜𝑜𝑙 Imported (bought) electricity for free cooling pump [kWh/year]
𝐸𝑝𝑟𝑜𝑝 Imported (bought) electricity for ventilation fans and VVC pump [kWh/year]
𝐴𝑡𝑒𝑚𝑝 Conditioned space [m2]
The energy use of the building is presented in Figure 23. This shows that the energy use for
GSHP and cooling were both higher than expected, while energy use for property and
domestic energy were both lower than expected.
0
10
20
30
40
50
60
70
Measured Normalized Simulated
Energ
y [k
Wh/m
2a]
Specific energy demand
Heating & DHW Cooling Property energy Domestic energy

30
Figure 23. Specific energy use.
The annual amount of generated solar electricity is seen in Figure 24. The buildings are not
equipped with any energy storage. Therefore, the solar electricity which is not directly used
for the building demand is exported, i.e. used for domestic energy or exported to the grid.
Figure 24. Solar electricity distribution.
This shows that the amount of solar electricity that could be used directly in the building was
lower than expected. How the solar electricity affects the different energy demands in the
buildings, i.e. the energy use (import need) for different installations after taking directly used
solar electricity into account, is fully presented in Appendix 5.
0
10
20
30
40
50
Measured Normalized Simulated
Energ
y [k
Wh/m
2a]
Specific energy use
Heating & DHW Cooling Property energy Domestic energy
0
5
10
15
20
25
30
35
40
Measured Normalized Simulated
Energ
y [k
Wh/m
2a]
Use of solar electricity
Exported Directly used
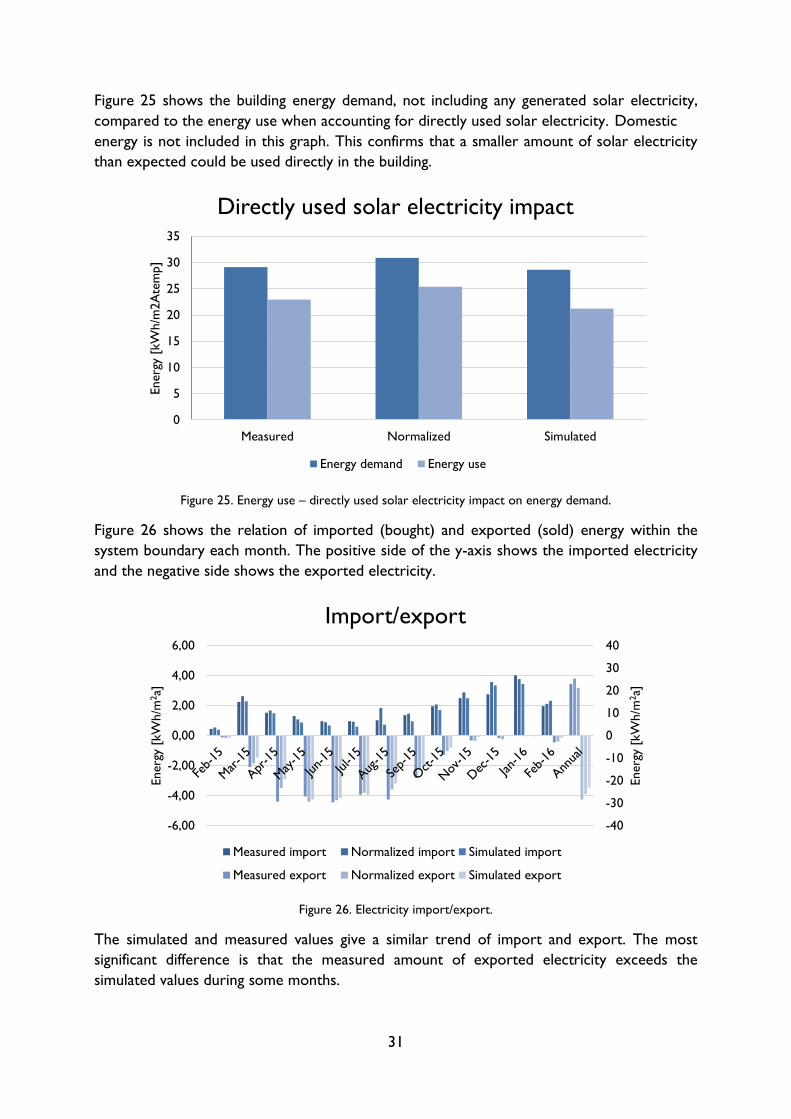
31
Figure 25 shows the building energy demand, not including any generated solar electricity,
compared to the energy use when accounting for directly used solar electricity. Domestic
energy is not included in this graph. This confirms that a smaller amount of solar electricity
than expected could be used directly in the building.
Figure 25. Energy use – directly used solar electricity impact on energy demand.
Figure 26 shows the relation of imported (bought) and exported (sold) energy within the
system boundary each month. The positive side of the y-axis shows the imported electricity
and the negative side shows the exported electricity.
Figure 26. Electricity import/export.
The simulated and measured values give a similar trend of import and export. The most
significant difference is that the measured amount of exported electricity exceeds the
simulated values during some months.
0
5
10
15
20
25
30
35
Measured Normalized Simulated
Energ
y [k
Wh/m
2A
tem
p]
Directly used solar electricity impact
Energy demand Energy use
-40
-30
-20
-10
0
10
20
30
40
-6,00
-4,00
-2,00
0,00
2,00
4,00
6,00Energ
y [k
Wh/m
2a]
Energ
y [k
Wh/m
2a]
Import/export
Measured import Normalized import Simulated import
Measured export Normalized export Simulated export

32
The overall results are summarized in Table 3, presented as kWh/m2a.
Table 3. Numerical result overview [kWh/m2a].
Measured Normalized Simulated
Energy demand Total demand 29,1 30,9 28,6
Heating & DHW 23,0 24,7 20,2
Cooling 0,8 0,8 0,4
Property energy 5,4 5,4 8,0
Domestic energy 21,3 21,3 30,1
Solar electricity Generation 34,6 31,6 30,6
Direct use 6,2 5,5 7,4
Energy use Total import 22,9 25,4 21,2
Heating & DHW 18,9 21,3 15,9
Cooling 0,5 0,5 0,1
Property energy 3,5 3,5 5,3
Export Total export 28,4 26,1 23,2
Direct use for domestic energy 5,0 4,9 6,7
Export to grid 23,4 21,1 16,5
In order to pinpoint areas from the performance analysis that is not working as expected the
difference between the actual performance of Solallén’s and the simulated values are
compared. The percentage deviations are presented in Table 4.
Table 4. Deviation from simulated values.
Measured Normalized
Energy demand Total demand 2 % 8 %
Heating & DHW 14 % 22 %
Cooling 86 % 86 %
Property energy -33 % -33 %
Solar electricity Generation 13 % 3 %
Direct use -17 % -26 %
Energy use Total import 8 % 20 %
Heating & DHW 19 % 34 %
Cooling 699 % 700 %
Property energy -33 % -33 %
Export Total export 23 % 12 %
Direct use for domestic energy -25 % -25 %
Export to grid 42 % 28 %
This entails that the following areas will be furtherly investigated in the process review: heating
& DHW, cooling energy and direct use of solar electricity. The different usage patterns of the
ventilation fans, presented in Section 3.2.2, will also be investigated since these are not as
expected due to similarity in indoor temperatures for the three apartments.

33
3.3 Compliance with definitions
The following section presents the compliance of normalized, measured data for the analyzed
time period with the energy performance requirements for the different definitions presented
in Chapter 2. To enable comparison, the results for measured and simulated values will briefly
be presented as well.
3.3.1 Compliance with nearly ZEB by Boverket
A schematic of Solallén energy system and its boundaries according to nearly ZEB by Boverket
is shown in Figure 27. The dashed rectangle highlights that only the imported energy is
accounted for.
Figure 27. Energy system for nearly ZEB by Boverket.
Equation (1) in Section 2.1 presents how the specific energy use of the house in Solallén is
calculated according to the nearly ZEB definition according to Boverket. For Solallén, this
applies to
𝐸𝑠𝑝𝑒𝑐 =
(𝐸𝑒𝑙,ℎ𝑒𝑎𝑡 + 𝐸𝑒𝑙,𝑑ℎ𝑤 + 𝐸𝑒𝑙,𝑐𝑜𝑜𝑙) ∙ 2,5 + 𝐸𝑒𝑙,𝑝𝑟𝑜𝑝
𝐴𝑡𝑒𝑚𝑝 (6)
The normalized specific energy use for Solallén is 58 kWh/m2a according to Equation (6) using
the normalized values for energy use presented in Table 3. Hence Solallén does not pass the
requirements of a maximum specific energy use of 55 kWh/m2a.

34
3.3.2 Compliance with ZEB by SCNH
A schematic of Solallén’s energy system and its boundaries according to ZEB by SCNH is
shown in Figure 28. The dashed red rectangle highlight that only the imported energy is
accounted for. The mark for net balance indicates that the net balance calculation is based on
the import and export of energy according BBRs system boundaries.
Figure 28. Energy system for ZEB by SCNH.
Table 3 presents that the total normalized specific energy use of a building in Solallén according
to SCNH’s definition is 25 kWh/m2a, which is below the maximum level for SCNH’s passive
house criteria of 27 kWh/m2a.
Table 3 also presents the normalized, total imported and exported energy. Equation (2) from
Section 2.2 gives the following net balance for Solallén:
𝐸𝑤𝑒𝑖𝑔ℎ𝑡𝑒𝑑 = 2,5 ∑(𝐸𝑒𝑙,𝑡𝑜 − 𝐸𝑒𝑙,𝑓𝑟𝑜𝑚) (7)
This results in a net balance of -2 kWh/m2a for Solallén.
This entails that Solallén passes the requirements for both net zero energy balance and specific
energy use according to SCNH’s standard.
3.3.3 Compliance with net primary ZEB by Skanska
A schematic of Solallén’s energy system and its boundaries according to net primary ZEB by
Skanska is shown in Figure 29. The dashed red rectangle highlight that the entire energy
demand for the building operation is accounted for. The dashed green rectangle show the net
balance is based on the energy demand versus energy generation from the PV cells.

35
Figure 29. Energy system for net primary ZEB by Skanska.
Given that the specific energy demand of Solallén is 31 kWh/m2a, the specific energy demand
requirement from Section 2.3 of 41 kWh/m2a is passed.
Table 3 presents the amount of electricity generated by the PV-cells together with the energy
demand for the building. Applying Equation (3) in Section 2.3, the net primary energy balance
of Solallén is calculated as
𝐸𝑝𝑟𝑖𝑚𝑎𝑟𝑦 = ∑ 2,5𝐸𝑑𝑒𝑚,𝑖
𝑖
− ∑ 2,5𝐸𝑛𝑒𝑤 𝑖𝑛𝑣𝑒𝑠𝑡,𝑖
𝑖
≤ 0 (8)
This shows that the primary energy balance is -2 kWh/m2a. Altogether Solallén passes the
requirements for Skanska’s net primary ZEB definition.
3.3.4 Result overview
An overview of the energy requirement results according to the different definitions is
presented in Table 5.
Table 5. Result overview for normalized data [kWh/m2a].
Value Requirement Result
Nearly ZEB by
Boverket
Espec 58,1 <55 Fail
Enet - - -
ZEB by SCNH Espec 25,4 <27 Pass
Enet -1,8 <0 Pass
Net Primary
ZEB by Skanska
Edem 30,9 <41 Pass
Enet -1,8 <0 Pass

36
Table 6 show the results for the measured data (not normalized) according to the different
definitions.
Table 6. Result overview for measured data [kWh/m2a].
Value Requirement Result
Nearly ZEB by
Boverket
Espec 52,0 <55 Pass
Enet - - -
ZEB by SCNH Espec 22,9 <27 Pass
Enet -13,8 <0 Pass
Net Primary
ZEB by Skanska
Edem 29,1 <41 Pass
Enet -13,8 <0 Pass
In this case, Solallén passes all requirements. The net balance for SCNH’s and Skanska’s
definition has the largest surplus of energy exported/generated.
Table 7 show the results for the simulated values compared to the energy performance
requirements of the different definitions.
Table 7. Result overview for simulated data [kWh/m2a].
Value Requirement Result
Nearly ZEB by
Boverket
Espec 45,1 <55 Pass
Enet - - -
ZEB by SCNH Espec 21,2 <27 Pass
Enet -5,0 <0 Pass
Net Primary
ZEB by Skanska
Espec 28,6 <41 Pass
Enet -5,0 <0 Pass
This shows that according to the expected energy performance, Solallén would have passed
the requirements for all definitions.
3.4 Discussion of performance analysis
Firstly, the accuracy of the measurement data can be discussed. Some data points were missing,
and sometimes the energy meters seemed to stop counting for a short period followed by a
jump to a higher level indicating problems with the measuring equipment. This entails some
unreliability to the obtained result.
The energy performance of building four was measured using hour-long intervals for the data
collection. This could be considered as too long an interval in order to make correct
estimations of how the energy was used instantaneously within the building. The data was for
example used in order to estimate how much of the generated solar electricity that could be
directly used within the building, by comparing the measured power of the PV-cells with the
power of the GSHP, VVC-pump etc. at a specific time each hour. The accuracy of this
estimation can be discussed since the result is sensitive to external conditions such as the
weather. For example, during a day with partial cloudy sky the result is highly sensitive to
whether or not it was sunny exactly at the specific time when the power of the PV-cells was
logged.
37
When normalizing the measurement data for normal occupant behavior, no measurement data
of how much DHW the GSHP produced specifically was available. Instead, two other
measuring points had to be used: the momentary power of the GSHP, including power for
both heating and DHW, together with the flow of DHW in the taps of each apartment. The
time which is registered when DHW flows out of the tap is therefore not the same as the
time which is logged when electricity runs the compressor for the GSHP in order to heat the
DHW. Therefore, the division of the total energy use of the GSHP between DHW and heating
became incorrect. However, these errors were evened out when comparing to larger time
spans why this method was seen as satisfactory.
The nearly ZEB definition proposed by Boverket, where the building’s specific energy use is
calculated according to Equation (1), entails that electricity for different purposes within the
building is weighted differently. Boverket allows to credit free flowing energy, in Solallén’s case
the solar electricity used directly within the building. However, there is no guidance on how
to distribute the generated solar electricity over the different applications in the building.
Therefore, an assumption was made that the solar electricity could be “earmarked” by using
the solar electricity for heating, DHW and cooling at firsthand. This assumption was made
since this makes it easier to pass Boverket’s requirements and that it is therefore believed that
this is how the equation would be used by the building developers.
When the obtained data was normalized, some differences between simulations and reality
increased. Looking at simulations and measured values, Solallén passes all three energy
requirements. However, when normalized, Solallén does not pass the energy requirement for
being a nearly ZEB according to Boverket. One of the reasons for this could be that less than
expected domestic energy, which stands outside Boverket’s system boundary, was used in the
building during the measurement period. This may indicate that occupants of ZEBs use less
domestic energy. Even though domestic energy is not considered as a part of the system
boundary, it does impact the thermal loads of a building (Ward, et al., 2016). This was later
confirmed in an interview with the energy consultant, see Section 5.3.3. Therefore, it is
important to take domestic energy into account in early energy calculations in order to make sure that the requirements are reached.
Simulations of domestic energy are based on benchmarks of normal behavior from Sveby
(Sveby, 2012). The possibility that occupants living in ZEBs behave differently than what is
considered as normal by Sveby indicates that further studies need to be done. These could
comprise how much domestic electricity use to account for in energy simulations for a ZEB
energy performance. Also, the development of more energy efficient appliances and the usage
of these in ZEBs, could also be a contributing factor to the decreased domestic electricity use.
Hence, this should also be accounted for.
The areas chosen as potential problem areas to investigate further in the next steps were
based on deviations from simulated values and expectations. These were heating & DHW,
cooling energy and direct use of solar electricity as well as the usage patterns of the ventilation
fans. The performance analysis also showed that considerably less property energy was used
than expected. This was however considered to be due to higher ventilation efficiency and
was not considered as a problem area why this was not furtherly investigated.

38
Occupant experience
To get a holistic view of Solallén, qualitative interviews with occupants are conducted. The
interviews are designed using a semi-structured method with a standard set of open-ended
questions. The method allows the interviewer to ask additional questions if needed, as well
can the respondent elaborate on a larger variety of noteworthy viewpoints compared to if
structured interviews had been used (Britten, 2006). This increases the flexibility for both the
interviewer and respondent and creates a more relaxed interview situation (Mukherjee, 1997).
To furtherly promote an easy flow of conversation, the questions are arranged in a systematic
way in order to minimize the gaps between the interview topics as much as possible. A risk of
using semi-structured interviews is that the results from different interviews may not be
comparable if the respondents reply to different questions (Mitchell & Jolley, 2012, p. 277). As
the previous overview in Chapter 3 has been purely focused on the performance data of
Solallén, the possibility of reviewing a wider range of perspectives, including social, cultural and
economic perspectives, the semi-structured method is seen to be more advantageous than
the risk of achieving an uneven result.
4.1 Qualitative interviews with occupants
The interview questions for the occupants, presented in Appendix 6, are inspired by questions
used interviewing occupants in passive houses, developed by (Boström, et al., 2003). The
following section presents findings from interviews with three occupants (Martinsson, 2016),
(Carlsson, 2016), (Falck, 2016) in different buildings in Solallén.
4.1.1 General
Occupant A lives alone in a 3-room gable apartment. Occupant A is originally from the area
but had lived in another city before moving to Solallén. Occupant A chose to move to Solallén
since it was a small, terraced house with one floor which still belonged to a housing association
in an area close to nature. Occupant A also emphasizes on that it was economically beneficial
to move to Växjö compared to finding a similar apartment in the city Occupant A lived in
earlier. Occupant A also found it positive that the apartment was newly built and that it would
not need to be renovated for a long time. However, occupant A had hoped to have more
influence on how to design the apartment than what was offered. Occupant A would have
liked to be informed that the apartment was equipped with energy saving taps which includes
that the handle actively need to be held to the left in order to get warm water. This affects
occupant A’s ability to use them due to an illness.
Two people live in occupant B’s apartment, which is a 4-room gable apartment. They moved
from a rental apartment in Växjö to Solallén since they did not find a cheap house. Occupant
B considered it to be economically beneficial that Solallén was equipped with solar PV-cells
but also that Solallén, since it is a net ZEB, has other valuable aspects, environmental and
emotional ones. Occupant B received information about the apartment through a brochure.
Occupants B was happy with the apartment at the time of moving in and is very pleased with
the surface of the apartment. Occupant B would have preferred if a reference apartment was
available at the time of purchase. Overall occupant B is pleased with the apartment besides
from the low indoor temperatures during winter.

39
Three people live in occupant C’s apartment, which is a 4-room gable apartment. They were
looking for a larger apartment or house with five rooms but decided to buy a four room
apartment in Solallén. Occupant C liked that the apartment had one floor with no stairs and
that it had a small garden. Occupant C was sceptic to the location outside of Växjö but is now
however pleased with the closeness to nature. Overall, occupant C is pleased with the
apartment.
It should be noted that none of the interviewed occupants live in house number four, which
the performance analysis is based on. Participation in has been offered to the inhabitants of all
21 apartments in Solallén.
4.1.2 Indoor environment
During summer the indoor temperatures were high according to measurement data from
building four, as seen in Section 3.2.2.
Both occupant B and C experienced that the indoor temperature got too high during the
summer. Occupant A was not at home during the summer time and did therefore not know
if the indoor temperatures in the apartment was high during the period or not. Occupant C
mostly experience problems with high indoor temperatures in the living room when it is sunny
outside. Occupant B managed the problem by forcing the analog outputs of the cooling
actuators to a maximum. Occupant C lowered the heat recovery of the ventilation system in
order to keep the indoor temperatures as low as possible. Both occupant B and C mention
that the free cooling system did not work as intended, that it had not been running on full
capacity, and that they have been told that this will be fixed. Occupant B says that this has now
been fixed in occupant B’s apartment by the supplier who has installed new software.
Occupant C also says that the free cooling system does not match the expectations occupant
C had on its effect on the indoor temperature.
Occupant C explains that the solar blind system works automatically. Occupant B thinks that
the blinds would be more effective if they were darker and less see-through. Occupant B also
points out was that the sensor for the solar blinds for all three apartments is placed above the
windows of the middle apartment. For a couple of the houses, this entails that sometimes the
sensor is shadowed, and therefore all blinds remain up, while the windows of the gavel
apartment are in direct sunlight. This may increase the problem with high indoor temperatures
in these apartments according to occupant B.
All interviewed occupants express that they experience problems with low indoor
temperatures during winter.
Occupant A explains that the indoor temperature in occupant A’s apartment were so low in
both of occupant A’s bedrooms during the winter that it was not possible to sleep in the
rooms. Instead occupant A slept in the living room. The indoor temperature in the living room,
which faces the neighboring apartment, was acceptable. Occupant A has not measured the
exact temperature but assumes it was around 15 °C. Occupant A would prefer around 22 °C.
Occupant A expected the floors in the bathrooms to be warm since floor heating is installed
and expected the function of this to be similar to comfort heating.
Occupant B has installed measurement equipment and logs temperatures in the apartment as
well as temperatures in the ventilation unit, as presented in Figure 30. This shows that the
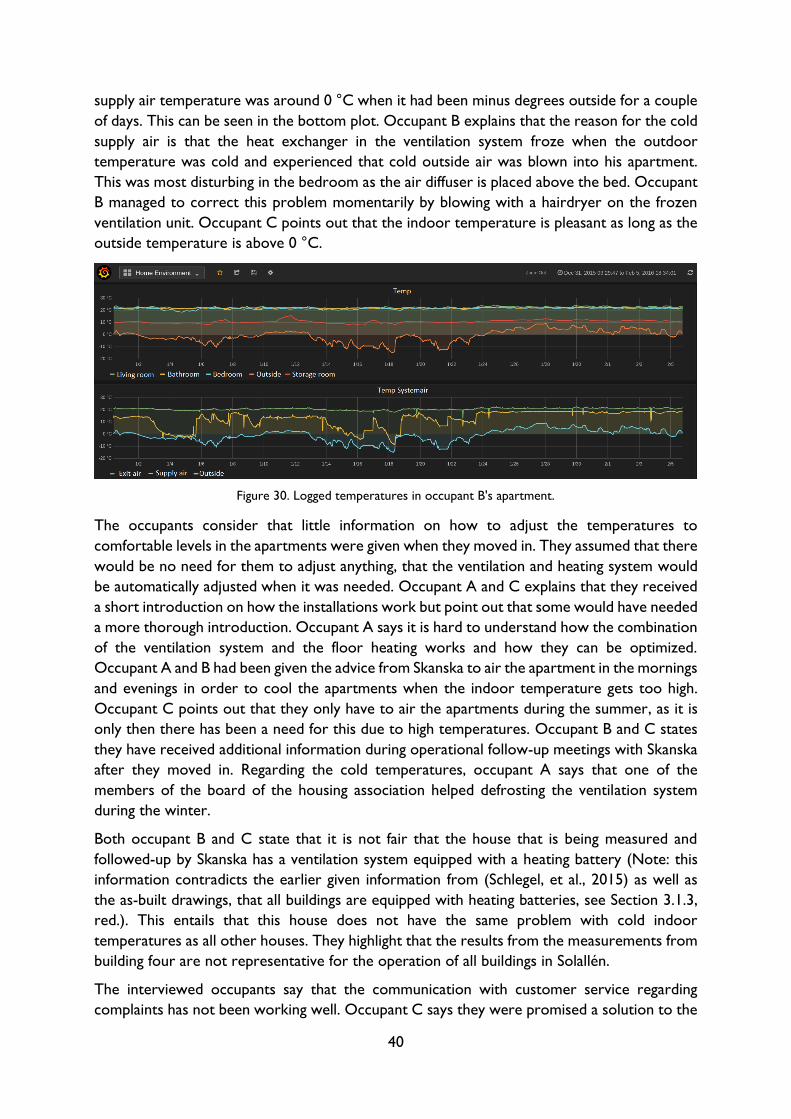
40
supply air temperature was around 0 °C when it had been minus degrees outside for a couple
of days. This can be seen in the bottom plot. Occupant B explains that the reason for the cold
supply air is that the heat exchanger in the ventilation system froze when the outdoor
temperature was cold and experienced that cold outside air was blown into his apartment.
This was most disturbing in the bedroom as the air diffuser is placed above the bed. Occupant
B managed to correct this problem momentarily by blowing with a hairdryer on the frozen
ventilation unit. Occupant C points out that the indoor temperature is pleasant as long as the
outside temperature is above 0 °C.
Figure 30. Logged temperatures in occupant B's apartment.
The occupants consider that little information on how to adjust the temperatures to
comfortable levels in the apartments were given when they moved in. They assumed that there
would be no need for them to adjust anything, that the ventilation and heating system would
be automatically adjusted when it was needed. Occupant A and C explains that they received
a short introduction on how the installations work but point out that some would have needed
a more thorough introduction. Occupant A says it is hard to understand how the combination
of the ventilation system and the floor heating works and how they can be optimized.
Occupant A and B had been given the advice from Skanska to air the apartment in the mornings
and evenings in order to cool the apartments when the indoor temperature gets too high.
Occupant C points out that they only have to air the apartments during the summer, as it is
only then there has been a need for this due to high temperatures. Occupant B and C states
they have received additional information during operational follow-up meetings with Skanska
after they moved in. Regarding the cold temperatures, occupant A says that one of the
members of the board of the housing association helped defrosting the ventilation system
during the winter.
Both occupant B and C state that it is not fair that the house that is being measured and
followed-up by Skanska has a ventilation system equipped with a heating battery (Note: this
information contradicts the earlier given information from (Schlegel, et al., 2015) as well as
the as-built drawings, that all buildings are equipped with heating batteries, see Section 3.1.3,
red.). This entails that this house does not have the same problem with cold indoor
temperatures as all other houses. They highlight that the results from the measurements from
building four are not representative for the operation of all buildings in Solallén.
The interviewed occupants say that the communication with customer service regarding
complaints has not been working well. Occupant C says they were promised a solution to the
41
problem with the ventilation system taking in cold air months ago, but they have still not heard
anything.
All occupants experience the indoor air quality as good. Occupant B points out that it would
have been better if the ventilation system not only had one higher flow setting which is turned
on when the carbon dioxide level reach a certain limit, but that the ventilation flow would
have been designed to increase gradually with increasing carbon dioxide levels in the
apartment. Occupant C says that the carbon dioxide and air humidity control seems to work
and that they never experience that they need to air due to low air quality, not even when
they have a large number of people over.
Occupant B points out that the walls of the closet where the ventilation system is placed are
not isolated, so sometimes the ventilation system could be heard from adjacent rooms. Other
than that all interviewees considered the sound environment in the apartments as good.
4.1.3 Solar energy
Occupant A is not familiar with the function of the PV-cells other than that they generate
electricity which can be sold to the grid. Occupant A does not know how the exported
electricity is accounted for.
Both occupant B and C mentions that they would have liked the system to be designed so that
the solar electricity could benefit each household directly instead of the housing association.
Occupant B explains that the electricity meter for each apartment does not register if the
used electricity comes from the grid or from the PV-cells, and that therefore they have to pay
for the electricity from the PV-cells as well.
Occupant B explains that according to their measurements it turns out that the amount of
generated solar electricity does not differ as much as expected, only around 1%, among the
buildings that faces south respectively west why it would not be unfair letting the occupants
use the solar electricity that their building generated.
The occupants express that prior to moving in, it was not clear how the income of solar
electricity would be accounted for. All interviewees think it is positive that the houses are
equipped with PV-cells for both economically and social aspects. The occupants express they
get encouraged to limit their own energy use by living in Solallén. However, they cannot
confirm that their behavior is more energy efficient now when living in Solallén. Occupant C
says to already have been accustomed to choosing energy efficient solutions prior the move
to Solallén, such as buying LED lights instead of classic light bulbs etc. Occupant C also highlight
the fact that they now live in an apartment which is a part of a housing association also
contributes to the encouragement of reducing energy use.
4.1.4 Net zero energy concept
All interviewed occupants knew that the buildings were energy efficient and equipped with
GSHP and solar PV-cells when they bought their apartments, but were not aware that they
were net ZEBs. Occupant A has to this day, not received any additional information about the
energy performance of the apartments other than the sums on the energy bills. Occupant A
is positive to a function which can show the energy use of the apartment and thinks that this
could lead to less energy use.

42
Occupant A considers that the net ZEB concept of the buildings as a bonus, but says this was
not a critical aspect in the decision to buy the apartment or not. Occupant A points out that
since heating and DHW was not fully included in the commission to the housing association,
it was important to know from the beginning that the costs for this would not get too high.
Occupant C also points out that it was good to know that the energy costs would not be too
high but also that it feels good to live in an environmental friendly building.
Occupant C says that to not have known much about the energy system of Solallén before
moving to Solallén, but both occupant B and C have attended operational follow-up meetings
with Skanska together with those who delivered the systems, and there they have received
information. Occupants B and C express that this has been working well.
Occupant B experience that no information was given by Skanska on how this would work,
yet occupant B has acquired knowledge of the energy system. This since occupant B, as
mentioned earlier, has looked into the function of the installations and installed own measuring
instrument in the apartment. Occupant B emphasizes that this knowledge is attained on
occupant B’s own initiative. Occupant B furtherly explains that a website for overviewing the
households’ energy consumption is under construction by occupant B. The idea is that all
households will be able to login and overview the use of water, DHW and electricity.
All interviewed occupants say that they are willing to pay more for a net ZEB than for a regular
building. Occupant B and C state that they would have been willing to pay more for the
apartments in Solallén specifically due to this reason. Occupant C also highlights the Nordic
Swan labelling as an aspect which increases the willingness to pay more for the apartment.
Overall, all interviewed occupants are pleased with their apartments. Occupant B adds that
the customer satisfaction survey was handed to them one week after they moved in and they
consider it would have been better to receive after they had lived in the apartments during a
longer period in order to give correct feedback.
4.2 Discussion of occupant experience
As only three occupants are interviewed it should be noted that this result should be seen
only as an indication. It cannot be concluded that all occupants have the same experiences as
the interviewees. However, the fact that the interviewed occupants live in different buildings
decreases the sensitivity to this.
Results from interviews indicate that not all occupants know how they can help reduce
problems with uncomfortable indoor temperatures. For example, not all occupants knew how
to control the ventilation system or how to air the apartment in order to lower the indoor
temperatures. This is something that building developers could inform occupants on more
clearly in order to reduce issues related to the uncomfortable indoor temperatures related to
occupant behavior.
The interviews with occupants revealed that in addition to the high indoor temperatures
during summer shown in the performance analysis, the main problem in the apartments have
been low indoor temperature during winter. This show that solely the performance analysis
of building four does not give a correct view of the general problems in Solallén. The earlier
given information on the ventilation system, see Section 3.1, will be furtherly investigated as
this stated that all houses had a heating battery.

43
Another noteworthy aspect from the interviews are that the occupants themselves show
interest in following up their behavior energy saving measures. One of the occupants in Solallén
has taken the initiative and responsibility to design a website so that all other occupants will
be able to follow their energy use. However, it cannot be assumed that occupants of all ZEB
project will have the knowledge to create such a tool. Therefore, it is recommended that the
possibilities for designing a user oriented follow-up tool are examined by the building
developer.
Lastly, it is noted that the interviews indicate there is a higher willingness to pay for ZEBs, at
least in the case of Solallén which was marked by the Nordic Swan label. This could furtherly
be investigated in order for companies to take full advantage of this market potential.

44
Development process review
The following section will review the development process of Solallén. Emphasis will be put
on examining the areas which were found not to be working as expected in the previous
sections, i.e. the installations which deviated from the simulated values shown in Table 4 as
well as remarks given by the occupants. Firstly, information about Skanska’s way of working
will be given. Secondly, the development process of Solallén is examined by interviewing
people who have been involved in the project, which may have input on the discovered
problem areas, in order to get insight on the project as a whole.
5.1 Skanska’s development process
The following section briefly describes the building process Solallén is developed according to,
which involves a collaboration between Skanska’s branches. Skanska consists of multiple
business areas which are legally and financially separated companies, although a part of the
larger corporation Skanska. In the case of Solallén, Skanska Nya Hem is the developer while
Skanska Hus has the role as the total contractor. Skanska Teknik has provided consulting
regarding energy and architecture. Numerous subcontractors are also procured and involved
in the project. Figure 31 shows the building process (Skanska, 2015).
Figure 31. Skanska's building process.
Both the developer and the total contractor are involved during the entire project. The overall
responsibility alters throughout the process. Skanska Nya Hem has the overall responsibility
of the three initial phases of the project. These include the overall economy, considering the
business conditions, developing the concept as well as defining the values which are important
to the customer. During this period, Skanska Hus has the responsibility for optimization of the
production, estimating costs and determining the maximum cost. After the commercial launch,
Skanska Hus has the overall responsibility as the total contractor. This involves procurement
of subcontractors, detailed design, production, economy, time and quality management.
During this period Skanska Nya Hem is responsible for marketing, sales and customer care.
The responsibility for aftersales is shared between Nya Hem and Hus, Nya Hem mainly answer
for the customer contact and Hus for modifications (Skanska, 2016).
Idea
Land and business development
DDP and project
development
Project design
Detailed design
Production Aftersales

45
5.2 Interviewed employees
This section summarizes the interviews held with the people who have worked with the
Solallén project (Fredriksson, 2016), (Roos, 2016), (Abrahamsson, 2016), (Andersson, 2016),
(Wettergren, 2016), (Nilsson, 2016), (Berggren, 2016). The interviewees are people involved
in the project from all three branches of Skanska as well as subcontractors. Below the roles
of the interviewees are briefly described.
5.2.1 Project developer A
Project manager A was the manager at Skanska Nya Hem during the early part of the project.
Project manager A was working with the initial idea, business development and early design.
Project manager A left the project at the time of the commercial launch.
5.2.2 Project developer B
Project developer B continued the manager position at Skanska Nya Hem at the time of the
commercial launch and onwards. Project manager B has worked as a linkage between the
production and the client, i.e. the housing association. Project manager B has also been
involved in the follow-up of Solallén.
5.2.3 Project manager
The project manager was the manager at Skanska Hus and has been involved throughout the
project. The project manager has been responsible for the project’s economy as well as
appointing the project organization and procurement of subcontractors.
5.2.4 Energy consultant
The energy consultant has been responsible to coordinate the energy topic in the project.
This, for example, involves calculations and simulations for the energy performance of the
buildings. In larger building projects, an installation manager is available, however in small
project like Solallén the energy consultant has also constituted a similar role. The energy
consultant has been involved during the entire project.
5.2.5 Architect
The architect was working at the developer side mainly in the early phases of the project. The
architect was main responsible for the architectural design of the buildings.
5.2.6 Piping entrepreneur
The piping entrepreneur works at an external subcontractor and has been responsible for the
designing of heating and sanitation installations in Solallén, i.e. GSHP, DHW and heating
distribution system. The piping entrepreneur was involved in the project during the detailed
design and the production phase.
5.2.7 Ventilation design engineer
The ventilation design engineer has designed and constructed the ventilation system in
cooperation with the ventilation entrepreneur. The ventilation entrepreneur was involved
during the detailed design phase of the project.

46
5.2.8 Ventilation entrepreneur
The ventilation entrepreneur was involved during the detailed design of ventilation
installations. The work involved designing the ventilation system and choosing a type of
ventilation unit together with the ventilation design engineer according to the given requests
from the contractor.
5.2.9 The chairman of the interim board
The chairman of the interim board was an external consult and had the role as the client
during the development process. The chairman of Solallén’s interim board has competence in
energy issues and worked advisory during the work with Solallén, but did not have any
technical responsibilities.
5.3 Qualitative interviews with employees
The interview questions used for employees treat the respondent’s relation to the Solallén
project, the results from the performance review, the ZEB concept together with
communication, expectations and learning outcomes from the project. The full overview of
questions is available in Appendix 7. As for interviews with occupants, semi-structured
interviews are also used for the employees. The reason for choosing this methodology is
previously explained in Section 3.4.
Below follows a summary of outcome of the interviews. The interviews are done separately
with each interviewee, but the summary is here divided by subject to increase the simplicity
to read.
5.3.1 Indoor environment
Both project developer A and B express they were worried about high indoor temperatures
due to the air tightness of the buildings. Project developer A emphasizes on that numerous
simulations were conducted by the energy consultant, which showed that the temperature
would be at an acceptable level. Project developer B refers to the energy consultant as
responsible for these questions.
The energy consultant says that the expectations were for the indoor environment to be
satisfactory, and that complaints from occupants were not anticipated. The energy consultant
reasons that the high indoor temperatures may be due to numerous aspects. These include
heat dissipation from the GSHP unit and underestimation of the permeability of blinds. The
energy consultant discuss that the problem may have been reduced if ventilation had been
installed in the substation and if sunscreen film for the widows would have been used. The
installation of sunscreen films was discussed during the course of the project, but the idea was
rejected due to aesthetic reasons among other things.
The energy consultant also brings up the possibility that occupants may have too large a
confidence in the function of the free cooling, so that they do not air their apartments
sufficiently. The piping entrepreneur explains that there is an adequate cooling capacity
available in the borehole to manage the high indoor temperatures. Nevertheless, the
ventilation air flow is not large enough to cool the rooms sufficiently.

47
5.3.2 Ventilation fans
Regarding the different usage patterns of the fans in the measured building shown in the
performance analysis in Section 3.2, the energy consultant explains that this most likely is
linked to occupant behavior. In the second apartment where the ventilation air flow was
constant during the year, as seen in Figure 15, the fans were probably put on manual control
and the occupants may not have known that it is possible to force the ventilation. The energy
consultant highlights that if this is the case, it is an information failure from Skanska.
The energy consultant also discusses the fact the ventilation fans of the third apartment have
been running on lower power even though it is a larger apartment and elaborates on that this
could be due to larger ducts which gives lower pressure drop. The ventilation entrepreneur
says that the usage patterns of the apartments should have been more similar and explains
that if this was due to a problem with the settings of the fan, this is something that is easily
fixed. However, no information about this problem had reached the ventilation entrepreneur.
The energy consultant explains that an energy framework was developed early during the
project, which stated requests on the energy system of Solallén. This included demands on
how the ventilation system needed to be controlled. It also stated that it should be able to be
automatically controlled by indoor temperature, relative humidity and carbon dioxide levels.
It also entailed that it should be possible to manually control the ventilation system. The energy
consultant furtherly explains that there was a miscommunication regarding the placement of
the signal sensor for the ventilation system. Most often high relative humidity levels are related
to running numerous appliances such as the washing machine and the tumble dryer at the
same time. Therefore, the signal generator should be placed in the bathroom, to have the
needed effect. This signal generator is however placed in the living room, why this function
does not work properly.
The energy consultant mentions that the idea was for the ventilation system to have three
levels, a basic flow, a forced flow and a decreased flow that could be used when the occupants
were not at home. This could have been used to save energy. However, the system was
installed with only two levels; basic and forced levels which can be set either manually or on
automatic control.
Heating battery
As stated in Section 4.1.2, the occupants’ main problem has been low indoor temperatures
and that the ventilation system has been supplying air of around 0°C to the apartments
whenever the outside temperature has decreased below 0°C during a couple of days. The
energy consultant explains that this problem has occurred in all buildings, expect building four
which is equipped with a heating battery. The heat exchanger in the ventilation system in the
other buildings have been freezing indicating that the defrost function does not work as
expected.
During defrost, the energy consultant says, air is not supposed to be taken in via the ventilation,
as exhaust air from the apartment heats the unit. The energy consultant clarifies that in larger
buildings, a bypass function is often used, where only a part of the inflow of air is shut down
during defrost. In Solallén, which has small ventilation units, the entire inflow of air is shut
down during defrost. Since the buildings are air tight due to their energy efficient envelope, a

48
pressure difference is created. This is due to the fact that almost no air is taken in through
infiltration which would be expected in “regular” buildings. The pressure difference entails that
cold air is drawn into the apartments and the ventilation unit is not defrosted as it should be.
Building four which is equipped with a heating battery does not have this problem. The energy
consultant explains further that preheating of the ventilation air using free heating from the
GSHP borehole, could also have been used to avoid this problem. However, it has turned out
that this solution increases the energy demand if the system is not carefully controlled.
The energy consultant recalls that the question of whether or not heating batteries were
necessary, was discussed during a phone call with the ventilation entrepreneur. They talked
over if the efficiency of the ventilation system was enough in order to achieve good function
without heating batteries during defrost. The energy consultant recalls the outcome of the
conversation was that preparations to install heating batteries in all apartments would be done.
The energy consultant highlights as well that if more extensive calculations had been done
maybe it would have shown that the heating batteries were in fact necessary. However, the
energy consultant does not know why a heating battery was installed in one of the buildings
and reflects negatively on the fact that not all buildings are equipped equally.
The ventilation entrepreneur also remembers the discussion with the energy consultant. The
ventilation entrepreneur says the information they had received from the manufacturer
ensured that the ventilation aggregates would have an efficiency of about 90 to 95 % and
therefore had confidence in the function of these. The ventilation entrepreneur did not foresee
the problem with the defrost function and recalls the outcome of the discussion about the
heating batteries as that there was no need to install these.
Both project developers elaborate on the low indoor temperatures due to the problem with
the ventilation system. To them it is unclear why not all buildings were equipped equally.
Project developer A underlines that the project was under economic stress. Project developer
B says that this is a “systematic error” and that all buildings were supposed to be prepared for
by adding a heating battery but that they were not.
The piping entrepreneur however says that it is in fact prepared for heating batteries in all
apartments. The piping entrepreneur does not know why heating batteries were placed in only
one of the buildings either.
The project manager explains that the reason for not equipping all buildings with heating
batteries was financial. The project manager says that this decision was made by a mutual
agreement in an early design phase. Both the project manager and the ventilation entrepreneur
explain that one building was equipped extra as this was an “experiment building” which was
financed by subsidies from Energimyndigheten. The ventilation entrepreneur put forward that
the reason for installing heating batteries in this house could have been requested by
Energimyndigheten, but is not certain of this.
The project manager did not know that heating batteries were included in the as-built drawings
but confirms what the piping entrepreneur said; that it is prepared for it in all buildings. The
project manager clarifies that if they do not find another solution to the problem with cold
air, heating batteries will be placed in all buildings.
49
The chairman of the interim board confirms that the decision to remove the heating batteries
was taken for economic reasons and that this was done democratically against expert advice.
This since it was believed that the ventilation system would work well without them.
The ventilation entrepreneur highlights another issue regarding the ventilation system. When
the kitchen fan is used, an under pressure is created in the apartments, making it hard to e.g.
open the front door. A way to solve the problem would have been to choose kitchen fans
with carbon filter. This was rejected, says the ventilations entrepreneur, even though
previously prohibitions on these kinds of filters had been removed. To manage the problem
with under pressure, a voltage sensor was installed on the kitchen fan’s electrical cord which
shuts off the ventilation exhaust function stepwise depending on which level the kitchen fan is
run on. This means no heat can be recovered by the incoming air, hence the supply air has the
same temperature as the outdoor air, the ventilation entrepreneur explains. This is considered
as a problem connected to energy efficient buildings with air-tight envelopes like Solallén.
5.3.3 GSHP
Several interviewees mention that it was up for discussion if GSHPs or district heating in the
buildings. The energy consultant explains that Skanska uses primary energy conversion factors,
so both solutions would demand the same amount of PV-cells in order to achieve the net zero
energy balance according to Skanska’s net primary ZEB definition. Both the energy consultant
and the project developer A explain that one of the main reasons why GSHPs were installed
was that it was easier to understand and communicate the net ZEB concept as the PV-cells
generate electricity which can be utilized by the GSHP. The energy consultant highlights
another aspect: the possibility to use free cooling and by that recharging the ground. This
minimizes long-term efficiency decrease if the installation, since the local ground temperature
can be decreased in the long-run when heat is extracted from the boreholes.
The energy consultant elaborates on why the GSHP have been running more than expected
as seen in the results presented in Section 3.2 and says that a possible reason for this is that
the occupants had used less domestic energy than accounted for in the simulations. The energy
consultant has run the simulations again using the measured values for domestic energy.
Decreasing internal gains and domestic energy demand by 28% increased the energy demand
for the GSHP by 19%, which matches well with simulated values.
Regarding the cold temperatures due to the failure in defrost of the ventilation unit, the piping
entrepreneur explains that the heating system was not dimensioned for a ventilation supply
air temperature around 0°C. In order for the system to be able to cope with such low
ventilation supply temperatures a higher supply temperature from the heating system would
have been needed. This would have had several effects, e.g. the floors would have been
damaged due to the hot floor heating piping.

50
5.3.4 Free cooling
The pump running the free cooling has, as seen in Section 3.2, been running on constant low
effect throughout the year, during heating season as well. The energy consultant explains that
simulations were done supposing that unlimited power could be extracted from the boreholes.
This explains the difference between simulations and measurements of the free cooling pump’s
power during summer. Regarding the results showing constant power throughout the year,
the energy consultant elaborates on if the supply air is cooled and heated at the same time
and that something may be wrong with the system control.
The piping entrepreneur explains the pattern is due to the design of the system and placement
of the measurement equipment. Cooling water is constantly circulated in a pipe by the free
cooling pump, why the performance analysis shows a constant power curve. Cooling power
is only achieved when a control valve opens, letting cold water flow to the cooling battery in
the ventilation unit. This means the apartments are not actively cooled during heating season
even though the free cooling pump is running. Both the energy consultant and the piping
entrepreneur says that cooling pump can be turned off manually in order to save energy.
However, the piping entrepreneur explains that the pump then has to be operated a couple
of hours every week, in order to avoid that the pump seizes. The piping entrepreneur also say
to improve the system, an automatic switch can be used in further project to switch off the
pump during heating seasons.
Project developer A explains that the fact that free cooling could be utilized was one of the
reasons that a GSHP was chosen over district heating. Even though it is not a cooling system,
but only cools the supply air a couple of degrees, this is something that can be used during
marketing. Both project developer A and B as well as the energy consultant and project
manager highlights that they were careful about marketing the free cooling and that they clearly
communicated that it only would lower the temperature of the supply air a couple of degrees.
Project developer A also says that it is pedagogic to communicate to the customers, that the
sun is cooling the building.
The piping entrepreneur says that more cooling power could be utilized if higher ventilation
flows were used. The ventilation entrepreneur says they proposed that a cooling unit with
higher capacity could be installed since more cooling power were available. However, the
proposal was rejected.
5.3.5 Direct use of solar electricity
The performance analysis, seen in Section 3.2 showed that the solar PV system produced more
electricity than expected. However, not as much energy as expected could be used directly in
the building. The energy consultant express that this is not surprising. From previous
experience, working with similar projects, the energy consultant knew that very little solar
electricity can be used within the building and that this is hard to estimate.
The energy consultant further explains that the simulations for Solallén’s internal loads were
done using a more realistic pattern than for usual simulations, accounting for demand peaks
during the morning and the evening and with variations over the year. The energy consultant
says that the simulations showed that around 1/3 of the solar electricity could be used directly
within the building. However, this was considered as a too high value, why it was estimated

51
that around 1/6 could be directly used instead. The energy consultant furtherly explains that
the simulations were performed using a one-hour step interval, which may be a too long a
time frame to predict the use of instantaneously generated electricity. However, increasing
the sophistication of the calculation is not seen as a cost-effective solution.
The energy consultant also highlights that it is hard to increase the amount of directly used
solar electricity by using home appliances during the day. The energy consultant concludes
that the best solution for using more of the solar electricity within the building is to use energy
storage, such as batteries.
Regarding the division of the income from solar electricity, in order for it to be fair for all
occupants, project developer B explains, the revenues go to the housing association. This has
to do with the fact that different buildings are placed in different directions, so the PV-cells on
these buildings may generate different amounts of electricity. Project developer A also
elaborates on the fact that the costs for grid connection fees would have increased if each
building would have needed to have one.
5.3.6 Land allocation
In the beginning of the project, during the land allocation phase, project developer A, the
energy consultant as well as the architect describes that the municipality had offered a lower
price for the property if passive houses were built. Project developer A says that passive
houses were not a new idea and that the idea of building a net ZEB was more interesting. The
energy consultant highlights that they discussed that it is not cost effective to add a vast amount
of insulation in order to achieve passive house criteria of energy use. Instead investments could
be made in installing PV-cells in order to generate energy on-site.
Project developer A and the energy consultant describe a meeting between the
representatives for Skanska and for the municipality, to discuss a possible redesign of the
project. During this meeting, the function of Skanska’s Color Palette™ was described to the
municipality together with the planned energy efficiency measures for Solallén as well as the
installation of PV-cells.
The outcome of the meeting was that the municipality agreed to follow Skanska’s suggestion
of building a net ZEB according to Skanska’s definition instead of passive houses. Project
developer A, the energy consultant, as well as the architect and the project manager emphasize
that the project has led to an improved contact and collaboration with the municipality, also
after the end of the project. Project developer A highlights the fact that Skanska has
contributed to the creation of a more positive view of the surrounding area of Solallén.
5.3.7 Communication
The energy consultant says that the collaboration between the early stakeholders involved in
the first phases of the project; the project developer A, the architect and the energy
consultant, went well. Both the energy consultant and the architect highlight their particular
collaboration as well-functioning. The architect explains that the main challenge was to design
the building as a normal building and still reach the energy targets. The architect and energy
consultant both experience that they compromised in order to achieve high energy
performance while maintaining the design of the building.
52
As mentioned in Section 5.3.2, during the initial period of the project, an energy framework
was developed in order to stipulate the requirements for Solallén’s energy performance.
According to the energy consultant, during the procurement of the subcontractors, insufficient
information about the conditions for the project was given to them. This led to that the hired
subcontractors, were not set to the goals stated in the energy framework, which entailed that
the framework was not used as planned. The chairman of the interim board experienced that
the communication went well generally but little attention was paid to the expertise of the
chairman of the interim board.
Several interviewees, such as the project developers, the project manager and the energy
consultant, underlines that there was a lack of commitment to the energy profile of the project,
which was Skanska’s goal to build deep green according to Skanska’s Color Palette™. The
energy consultant explains that it was hard to communicate the vision of the project to
subcontractors, as the main contact often goes via an administrator. Project developer B lay
emphasis on the low attendance on project design meetings during the project. The energy
consultant also points out that not all involved in the project, such as all subcontractors, may
have been present at the energy start meeting when energy goals were discussed. The energy
consultant also explains that a lot of the communication was done via mail which may have
added to miscommunication problems. The energy consultant mentions partnering as a
contract form which may increase involvement and commitment of subcontractors.
The energy consultant experience that the project design was performed as a regular building,
which also was underpinned during the interview with the ventilation design engineer who
said that the ventilation system was designed as for a regular house. The project manager also
says that the people working with Solallén did not fully comprehend the complexity of the
project from the beginning. The project manager and the energy consultant furtherly state that
the developer and contractor side has to work more closely together – especially in projects
with a special profile like Solallén.
Several interviewees highlight that the energy issues should be lifted earlier in the project
process. For example, the architect points out that the decision regarding which heating
system that was going to be used, was not chosen when the layout of the apartments were
drawn. This meant that the layout had to be redrawn when a GSHP finally was chosen and
that substations were placed inside the middle apartments. Both the project manager and the
piping entrepreneur mentions that in the end, the GSHP did not fit into the designated space
and that they had to place them outside the substation, in the wind catcher. The architect
went on a leave during the project and was therefore little involved during the building process.
The architect explains that some things were changed during this leave, which were not in line
with the original design. Examples of this are the solar blinds, the size of the substation and
the placement of PV-cells. The architect expresses that these changes change the overall
impression of the buildings but believes that these were done for economic reasons.
53
5.3.8 Economy
All interviewees say that the project was under financial pressure. Project developer A and B
describe that in the early course of the project, an external firm was commissioned to conduct
a market analysis to examine the possible feasibility of the project. This market analysis showed
that the project would not be feasible. The project was however continued and according to
project developer B, the selling price for the project was set higher than the price which the
market analysis had stated. Project developer A explains that the sale requirements to
continue the project were reached early during the commercial launch, which is something
that project developer A highlights as a positive aspect of the project.
The energy consultant says that the calculation which formed the basis for the selling price
was done as too much of a “standard calculation”, not paying attention to the specific
conditions of the project’s energy efficiency requirements. This is also something which project
developer A and the project manager elaborate on. Both the energy consultant and the project
manager mention that since some of the apartments need to be sold before the detailed design
is allowed to start according to Skanska’s process, the price was determined before all
technical solutions were defined. This entailed that when subcontractors were hired and the
technical solutions needed to reach the energy goals were determined, it became clear that
the budget was set too low.
The energy consultant emphasizes that energy expenses often have a low priority, that interior
design etc. is often prioritized financially and that energy efficiency measures are often seen as
something that needs to be profitable. The project manager describes that calculations for the
project’s feasibility on the construction side, early showed that break-even would not be
reached. However higher authorities at district and regional levels decided that the project
would continue. This meant that the project had to seek new ways of saving on expenses as
well as additional financing.
The energy consultant says that the intention was to install measurement equipment in all
buildings in order to follow-up on their energy performance. Due to economic reasons this
was not possible and the energy consultant explains that the project applied for money from
external contributors in order to support the project. Among these were Energimyndigheten,
the Swedish Energy Agency, which financed that building four could be equipped with extensive
measurement equipment.
The project also received financing from Lågan, a program working to stimulate energy efficient
building, and from the Green Concept Lab, Skanska’s own program to motivate deep green
projects. The project manager explains that even though some external and internal back-up
could be obtained, the subcontractors, employees at Skanska etc. suffered due to the
economic constraints. The project manager clarifies further that since the decision to continue
the project was made from higher authorities, even though indications early on showed that
the budget could not be reached, further assistance from higher levels would have been
needed to minimize the harm.
Project developer A explains that the knowledge in the beginning of the project was not
enough to predict the financial issues. However, looking back it would have been possible to
set a higher price for the apartments. Project developer B as well as the energy consultant
underline that if the selling price had been set higher, the project would not have been

54
approved at the time by the market council of Skanska. The project manager and project
developer A say that the decision to license the buildings with the Nordic swan label should
have been made earlier. The project manager elaborates on the possibility that the apartment
could have been sold for a higher price if this would have been marketed prior to the
commercial launch.
Both project developers and the project manager say that even though the revenue of the
Solallén project was not as large as hoped for neither one of the company’s branches, it has
still had a positive impact on Skanska as a whole. Project developer A explains it has led to
positive branding for the company. There have been reportages on television about Solallén
and the project increased Skanska’s hits on LinkedIn considerably. Project developer A claims
that Skanska is the leading company for sustainable building in Växjö today and that the
previously mentioned improved collaboration with the municipality has given Skanska
additional projects in Växjö, both residential and non-residential. Project developer B brings
up other projects Skanska now are doing in Norrköping and Linköping, where it helped that
the company could show Solallén as a reference project during the land allocation.
5.3.9 Net ZEB concept
Project developer A and the project manager say that reaching a net ZEB balance for the
buildings was not a set goal from the beginning, but that the realization that this goal could be
reached came during the course of the project. Project developer B explains to have entered
the project after the decision to aim for the net ZEB concept was taken.
The ventilation design engineer however says that no information about the concept was given
and did not adjust the way of designing the ventilation system compared to a normal house.
The piping entrepreneur experienced that information about the concept came late and that
it was not included in the initial project design. The ventilation entrepreneur however
experienced to have been informed about the concept early during the project, which brought
the problems related to kitchen fans in this type of houses to mind, as described in Section
5.3.2.
The energy consultant considers that there is no need to communicate the net ZEB concept
earlier, but that in needs to be communicated clearer in order to maintain commitment and
vision goals throughout the process. The energy consultant continues that this commitment
was to an extent lost during the detailed design phase in this project. The energy consultant
highlights that it might be a good idea to hand over the responsibility of the net ZEB vision to
someone present during the production in order to keep this goal in mind.
The chairman of the interim board highlights that the meaning of “net ZEB” needs to be
clarified compared to the “nearly ZEB” concept by Boverket that will be indicative in the
future.
Project developer B emphasizes on the fact that the result of the net ZEB concept has to work
for all people. To increase the knowledge transfer to occupants, project developer B proposed
to arrange a “home school”, i.e. a workshop for the future occupants where they learn about
the apartments and the technology which comes with. This proposal was however never
implemented.
55
Project developer A emphasizes on the fact that if the goal of achieving a net zero primary
energy balance turned out not to be reached with the given installations, solving the problem
was just to add more PV-cells. Project developer A says that Solallén has shown that this
concept works, in future, similar projects the net ZEB concept can be more openly stated
early in projects.
5.3.10 Outcome
The project manager thinks that the project turned out well and of high quality and that, if
looking at it from a larger perspective, it has been beneficial for Skanska. However, in the work
group at the construction side, the project manager’s experience is that people have seen it
as more of a defeat due to the economic setback. In the future, to motivate the work group,
more preparations have to be made to prevent the same mistake and to encourage fellow
staff.
Project developer A says that this project increased the general interest of sustainable
buildings, both internally and externally. Both project developer A and the chairman of the
interim board mentions that this kind of project should be marketed better in the future.
The energy consultant as well as project developer A highlights that it is crucial to gain more
knowledge about the costs of installations in this kind of buildings in order to make the right
calculations early in the project. The energy consultant is pleased with the measuring of
building four, even though it would have been preferable to be able to follow-up all buildings.
It is now not possible to verify the energy performance in the other buildings. The energy
consultant is also pleased that they have operational follow-up meetings.
Overall the architect thinks that Solallén was a good project and that it was good that energy
consultants were involved early. The architect has learned about environmental friendly
buildings and how cooperation with different parties can work.
5.4 Discussion of qualitative interviews with employees
The results should be interpreted bearing in mind that the interviews are not designed to
verify the exact timeframe for the course of events. Therefore, some of the findings cannot
be put in exact relation to another chronologically. To improve similar interviews in the future,
a suggestion could to use some kind of time axis as a tool during the interviews, in order to
clarify the cause effect relationship between different events.
When the energy consultant recalculated the heating demand based on the actual domestic
energy use, the new simulations matched the measured energy demand of the GSHP. This
confirms that the GSHP had to provide the building with the extra heating due to lower
domestic energy use. This information confirms the reasoning in in Section 2.5, that if the use
of domestic energy had been higher, it is possible that Solallén would have passed the requirements for nearly ZEB by Boverket.
During the interviews with employees, the main problem stated by the occupants in Section
4.1 concerning cold indoor temperatures were discussed. The employees explained that this
could be due to the fact that the building envelopes are well-insulated and airtight. This entails
that an under pressure is created inside, for example during the ventilation defrost cycle or
whenever the kitchen fans are used. This results in that outside air is drawn inside the
apartment through the ventilation unit. Since the heating system is not dimensioned for such
low air supply temperatures, the indoor temperature decreases. Reducing the energy demand
56
by using a well-insulated building envelope is a key factor for developing energy efficient
buildings, as presented in the Kyoto pyramid in Chapter 3, therefore this is a problem that
one needs to take into account when choosing technical solutions for ZEBs. As mentioned in
Section 5.3.2, using a carbon filter fan in the kitchen instead of an exhaust fan avoids problem
with under pressure when the kitchen fan is used, and may therefore be considered when
building ZEBs in the future.
It is clear that the ventilation system used in ZEB’s need to be designed in order to manage
the frost in the ventilation unit without supplying unheated outside air to the building. The
interviews showed that the ventilation supplier had claimed that the high efficiency was enough
in order for the defrost cycle to work during colder periods when the unit froze. However,
according to information provided today on the supplier’s website regarding the ventilation
units used in Solallén it is clear that the unit only works down to 0 °C in air tight buildings
without preheaters (Systemair, 2016). It is however unclear if this information has been
realized by the supplier after the solution was presented for Solallén or if it was a
misunderstanding that the system should work in Swedish climates without heating batteries.
The performance analysis of building four shows that using a heating battery does in fact work;
the indoor temperatures of the apartments in building four does not fall below the
recommendations of minimum indoor temperatures made by Folkhälsomyndigheten.
Heating batteries were present on the as-built drawings as well as in reports about Solallén
(Schlegel, et al., 2015). Why heating batteries are not installed in all apartments is however
not fully clarified. The fact that it is included in the as-built drawings, in addition to what have
been said during the interviews, it can be assumed that the original thought was to install
heating batteries in all buildings. A vast majority of the interviewed employees state that all
involved parties in the project were under financial pressure. The interviews have pointed out
the contractor side, to have been especially strained economically and that this led to cutbacks.
It is possible that if the budget had been more permissive, the issue regarding the freezing heat
exchangers may never have emerged since all building then probably would have been
equipped with heating batteries.
Another aspect of the problem could be miscommunication regarding the purpose of why
measuring equipment were installed in building four. In the interviews with the contractor
side, several people refer to building four as the “experiment house”, which indicates the
perception was that other conditions were applicable to this building. It appeared that the
economy was not sufficient in order to equip all buildings why the heating battery was only
installed in the “experiment house”. It is also mentioned that it is possible that
Energimyndigheten had requested that a heating battery should be included in this specific
building in order to give subsidies to the project. To prevent similar problems in the future,
the reason for collaborating with external parties should be communicated more thoroughly
between the developer and the contractor.
According to Skanska’s building process, more detailed design of the installations can only be
done after commercial launch. This means the price of the buildings must be set prior to the
detailed design. This is seen as problematic in the case of Solallén since the knowledge in the
beginning of the project was limited on how to allocate the costs, which is something that
several interviewees elaborate on. The possibility to incorporate the detailed design earlier in
the project process should also be looked over to avoid unforeseen costs for projects where
experiences from earlier cost calculations are limited.
The project manager explains that it was realized early that it would not be beneficial for the
contractor side, yet the decision to continue the project was made on a higher instance. The
decision-makers have not been interviewed, so the overall reasons for continuing the project
57
are not clarified. However, it is also elaborated by numerous interviewees that the project has
led to positive corporate branding for Skanska, which can be one aspect of the decision.
Another interviewee mentioned subsidies given to the project by Skanska’s Green Concept
Lab. However, this support might not have been enough, or it never reach the contractor
side, since the project was not economically feasible for the contractors. Summarizing this, the
project is considered as beneficial in a larger perspective. If a pioneering project in the future
face a similar problem, but still has to go forward, further backup from higher instances should
be available. How well internal support functions, such as the Green Concept Lab, is known
and used within Skanska could also be furtherly investigated.
The interviews show that the perception of the net ZEB concept vary among the partakers.
Most of the people interviewed from the developer side state that their work was affected by
the fact that Solallén aimed to be net ZEBs. Two subcontractors say that the information
regarding the aim at net ZEB was given late during the course of the project or not at all.
Several interviewees highlight the fact that the commitment to the energy profile of the project
was insufficient. Altogether, the commitment to energy issues and the concept of ZEBs needs
to be encouraged. In order for all involved to work towards the same goal it is also important
that the vision is clearly communicated to the subcontractors as well.
The interviews showed that the market analysis conducted early during the project may not
have reflected the actual market at the commercial launch. Sales requirements at launch were
reached early during the project and interviewed occupants state that they would have been
willing to pay more for the apartments since they are net ZEBs. Further investigations in the
possible value increase and the potential in marketing this type of building is therefore
encouraged. Several interviews with employees specify that this is becoming more and more
accentuated in current projects.

58
Conclusion and future work
The definition comparison shows that there are important differences among the three ZEB
definitions. The main differences were the system boundaries, type of balance and energy
efficiency requirements. The results show that Solallén has different outcomes depending on
which definition it is compared against. Solallén passes the requirements for ZEB by SCNH
and net primary ZEB by Skanska, but does not pass the energy efficiency requirements for
nearly ZEB by Boverket.
It can be concluded that one of the contributing reasons for not passing the nearly ZEB
requirement, is the larger than expected use of electricity to the GSHP, which is weighted by
2,5 in the definition. In order to pass the requirement future work, either further energy
efficiency measures or increasing the direct use of free flowing energy in the building, should
be done. For example, the possibility of installing energy storage in buildings could be
investigated.
Also, since the increased use of GSHP electricity could be due to lower use of domestic
energy, it can be concluded that a larger focus on calculating for the right amount of used
domestic energy in simulations is an important factor to be able to ensure passing of
requirements for future nearly ZEBs. It could also be of interest to investigate how involving
domestic energy within the system boundaries would affect the energy evaluation.
If the proposal of nearly ZEB is implemented as statutory, the requirements in Skanska’s net
primary ZEB will become stricter if the definition of today is retained. Skanska then has to
reformulate their own definition or improve their work on energy efficiency in buildings in
order to pass the requirements of primary net ZEB.
The requirements of SCNH are independent of BBR and are therefore not directly affected
by the implementation of nearly ZEB. With the delimitations of this work, it is not possible to
conclude how the implementation of nearly ZEB by Boverket would impact ZEB by SCNH.
Future work on how other energy efficiency measures, such as the heat loss factor
requirements by SCNH, impact the comparison between definitions should be done, in order
to fully compare them.
The performance analysis was done using measurement data obtained from building four.
However, this cannot be considered as representative for Solallén since it was equipped
differently compared to the other buildings. The result of the performance analysis should
therefore be interpreted with this in mind.
The main problem area which was found during the performance analysis and interviews with
the occupants, linked to the ZEB concept, was the uncomfortable indoor temperatures in
Solallén. The reason for cold temperatures during winter is considered to be due to the
combination of an airtight building envelope and a regular ventilation system. The main reasons
found for hot temperatures during summer were social and cultural aspects such as insufficient
information about how to use the ventilation system and how to air the apartments. That the
building has an air-tight envelope, large windows and that the free cooling may not have been
run in its full capacity also may have had an impact.

59
The conclusion is that the specifications of a ZEB has to be acknowledged when choosing
technical installations in this type of building, since these have an impact on the indoor
environment. Furtherly, information to the occupants is seen as an important aspect in order
to ensure they can maintain a comfortable indoor environment in their homes.
Further investigations are recommended regarding which ventilation solutions are suitable in
airtight buildings like the ones in Solallén.
In order to make correct energy performance analyses in the future, an investigation of which
measuring points that needs to be installed in the building should be done. Also the length of
the needed data collection intervals should be overviewed to make the analysis as correct as
possible.
It is important that the development process of a ZEB acknowledge the unique specifications
linked to the concept. In the case of Solallén, some problems are seen to have occurred due
to a lack of understanding of and commitment to the ZEB concept. Furtherly, all involved in
project needs to be informed and encouraged to work according to the ZEB vision in order
to avoid miscommunication.
For “pilot projects” such as Solallén, it is recommended to include detailed design earlier in
the project, in order to include cost for specific solutions needed for a ZEB in the commercial
price. Since the interviews with occupants indicated that some may be willing to pay more for
a ZEB building and for the Nordic swan label, it is recommended to investigate the value of
marketing this from the beginning. This may help avoiding setbacks.
60
References
Abrahamsson, T., 2016. [Interview] (02 05 2016).
Andersson, F., 2016. [Interview] (03 05 2016).
Andresen, I., Kleiven, T., Knudstrup, M.-A. & Heiselberg, P., 2008. State-of-the-art Review Vol.
2B Methods and Tools for Designing Integrated Building Concepts, Aalborg: Aalborg University.
Author, N., 2010. Book Title. Stockholm: Publishername.
Azarbayjani, M., 2014. The road map to the integrated design process of a net-zero energy
solar house: A case study of a solar decathlon competition entry.. Journal of Green Building,
9(2), pp. 20-37.
Belleri, A. & Napolitano, A., 2012. Net ZEB evaluation tool – User guide, Bolzano, Italy: SHC.
Berggren, B., 2015. Solallén - från idé till verklighet. s.l.:Skanska.
Berggren, B., 2016. [Interview] (24 02 2016).
Berggren, B., 2016. [Interview] (28 04 2016).
Berggren, B., Wall, M., Flodberg, K. & Sandberg, E., 2012. Net ZEB office in Sweden – A case
study, testing the Swedish Net ZEB definition. International Journal of Sustainable Built
Environment, Dec, 1(2), pp. 217-226.
Boström, T. et al., 2003. Tvärvetenskaplig analys av lågenergihusen i Lindås, Linköping: Linköping
University.
Boverket, 2011. Boverkets föreskrifter om ändring i verkets byggregler BBR19, s.l.: Boverket.
Boverket, 2013. Boverkets författningssamling - BBR20, s.l.: s.n.
Boverket, 2015. Boverkets byggregler - föreskrifter och allmäna råd, BBR 22, s.l.: s.n.
Boverket, 2015. Förslag till svensk tillämpning av nära-nollenergibyggnader - definition av
energiprestanda och kvantitativ riktlinje., s.l.: s.n.
Boverket, 2016. Tidplan för Boverkets föreskrifter om nära-nollenergibyggnader. [Online]
Available at: http://www.boverket.se/sv/byggande/uppdrag/nara-nollenergibyggnader-i-
sverige/andrad-tidplan-for-boverkets-foreskrifter-om-nara-nollenergibyggnader/
[Accessed 17 03 2016].
Britten, N., 2006. Qualitative Research in Health Care. 3 ed. s.l.:Blackwell Publishing.
Butera, M. F., 2013. Zero-energy buildings: the challenges. Advances in Building Energy
Research, 7(1), pp. 51-65.
Carlsson, H., 2016. [Interview] (29 04 2016).
Deng, S., Wang, R. & Y.J, D., 2014. How to evaluate performance of net zero energy
buildings - A litterature research. Energy volume 71, pp. 1-16.
Ecofys, 2012. Towards Nearly Zero Energy Buildings - Definition of common principles under EPBD
Final report, s.l.: European Comission.
61
European Commision, 2013. Progress by Member States towards Nearly Zero-Energy Buildings,
Brussels: s.n.
European Parliment, Council of the European Union, 2010. Directive 2010/31/EU of the
European Parliament and of the Council of 19 May 2010 on the energy performance of buildings,
s.l.: s.n.
Europeiska komissionen, 2014. Europa 2020 i korthet. [Online]
Available at: http://ec.europa.eu/europe2020/europe-2020-in-a-nutshell/index_sv.htm
[Accessed 10 02 2016].
Falck, J., 2016. [Interview] (29 04 2016).
Folkhälsomyndigheten, 2014. FoHMFS 2014:17 Folkhälsomyndighetens allmänna råd om
temperatur inomhus, s.l.: s.n.
Fredriksson, D., 2016. [Interview] (09 05 2016).
Fredriksson, D., 2016. [Interview] (09 05 2016).
Heinze, M. & Voss, K., 2009. Goal: zero energy building. Exemplary Experience Based on the
Solar Estate Solarsiedlung Freiburg am Schlierberg, Germany.. Journal of Green Building,
November, Volume 4, pp. 93-100.
IEA SHC, 2014. 2013 Highlights SHC Task 40 / Energy Conservation in Buildings and Community
Systems ProgrammeAnnex 52 Towards Net-Zero Energy Solar Buildings, s.l.: s.n.
IEA, 2011. Technology Roadmap Energy Efficient Buildings: Heating and Cooling Equipment, Paris:
s.n.
IEA, 2012. World Energy Outlook, s.l.: s.n.
IEA, 2016. Renewable energy. [Online]
Available at: 10
Laheri, V. K., Dangi, H. & Vohra, A., 2014. Green Marketing: Development of Construct and
Its Evolution. Asia-Pacific Journal of Management, 10(2), pp. 147-155.
Marszal, A. et al., 2011. Zero Energy Building - A review of definitions and calculation
methodologies. Energy and Buidlings, 43(4), pp. 971-979.
Marszal, A. J. & Heiselberg, P., 2011. Zero Energy Building definition – a literature review,
Aalborg, Denmark: SHC.
Martinsson, T., 2016. [Interview] (02 05 2016).
Mitchell, L. M. & Jolley, M. J., 2012. Research Design Explained. s.l.:s.n.
Mukherjee, N., 1997. Participatory Appraisal of Natural Resources. 3 ed. s.l.:Concept Publishing
Company.
Musall, E. et al., 2010. Net Zero Energy Solar Buildings: An Overview and Analysis on Worldwide
Building Projects, s.l.: s.n.
NCC, 2015. Plusenergihus, Harplinge. [Online]
Available at: http://www.ncc.se/vara-projekt/plusenergihus-harplinge/
[Accessed 18 05 2016].

62
Nilsson, L., 2016. [Interview] (10 05 2016).
Roos, U.-G., 2016. [Interview] (13 05 2016).
Santamoiris, M., 2016. Innovating to zero the building sector in Europe: Minimising the
energy consumption, eradication of the energy poverty and mitigating the local climate
change.. Solar Energy, Volume 128, pp. 61-94.
Sartori, I., Napolitano, A. & Voss, K., 2012. Net zero energy buildings: A consistent definition
framework. Energy and Buildings, pp. 220-232.
Schlegel, L., Berggren, B. & Togerö, Å., 2015. Kvalitetssäkring av Nollenergihus Solallén med
ByggaE, L och F, s.l.: Lågan.
SCNH, 2012. FEBY 12 - Kravspecifikation för nollenergihus, passivhus och minimienergihus,
Bostäder, s.l.: s.n.
SCNH, 2013. Energiformsfaktor. [Online]
Available at: http://www.nollhus.se/feby-12/nollenergihus/nollenergihus/energiformsfaktor
[Accessed 10 02 2016].
SCNH, 2013. Om föreningen. [Online]
Available at: http://www.nollhus.se/om-foereningen
[Accessed 22 05 2016].
SCNH, 2013. Utomhusklimatet. [Online]
Available at: http://www.nollhus.se/feby-12/passivhus-vaermefoerlusttal/utomhusklimatet
[Accessed 17 03 2016].
SHC, 2016. Subtasks. [Online]
Available at: http://task40.iea-shc.org/subtasks
Skanska Sverige / Grön Affärsutveckling, 2013. Driftuppföljning Energi - Korrigering av uppmätt
energianvändning, s.l.: Skanska.
Skanska, 2014. Gröna kartan för byggnader , s.l.: s.n.
Skanska, 2014. Gröna kartan för byggnader. Internal document, not for external publication. , s.l.:
s.n.
Skanska, 2014. Solallén Vikaholm - Energistarmöte Bygga E. s.l.:s.n.
Skanska, 2015. Color Palette Definitions, s.l.: s.n.
Skanska, 2015. Color Palette Detailed Definitions, s.l.: s.n.
Skanska, 2015. How we define Green. [Online]
Available at: http://group.skanska.com/sustainability/our-journey-to-deep-green/how-we-
define-green/
Skanska, 2015. Vårt sätt att arbeta - Nya Hem. [Online]
Available at: https://vsaa.skanska.se/nya-hem
Skanska, 2016. Gröna Kartan. [Online]
Available at: http://www.skanska.se/sv/om-skanska/prioriterade-omraden/hallbarhet/sa-har-

63
arbetar-vi/grona-kartan/
[Accessed 19 05 2016].
Skanska, 2016. Samarbete Nya Hem och Hus. Internal document, no external publication..
[Online]
Available at: https://vsaa.skanska.se/nya-hem/samarbete-nya-hem-och-hus
Skanska, 2016. Skanska i siffror. [Online]
Available at: http://www.skanska.se/sv/Om-Skanska/Skanska-i-siffror/
[Accessed 11 02 2016].
Skanska, 2016. Solallén, Växjö. [Online]
Available at: http://www.skanska.se/sv/projekt/projekt/?pid=10503
[Accessed 11 02 2016].
SMHI, 2015. SMHI Energi-Index. [Online]
Available at: http://www.smhi.se/professionella-tjanster/professionella-tjanster/fastighet/smhi-
energi-index-normalarskorrigering-1.3494
[Accessed 07 03 2016].
SMHI, 2015. SMHI Graddagar – normalårskorrigerad energiuppföljning. [Online]
Available at: http://www.smhi.se/professionella-tjanster/professionella-tjanster/fastighet/smhi-
graddagar-normalarskorrigerad-energiuppfoljning-1.3478
[Accessed 08 04 2016].
SMHI, 2016. Statistik från väder och vatten. [Online]
Available at: http://www.smhi.se/klimatdata/meteorologi/2.1240
[Accessed 21 03 2016].
SMHI, 2016. Års- och månadsstatistik. [Online]
Available at: http://www.smhi.se/klimatdata/meteorologi/2.1240
Sveby, 2012. Brukarindata bostäder, s.l.: s.n.
Swedish Standards Insitute, 2007. SS-EN 15251:2007, s.l.: s.n.
Systemair, 2016. SAVE VTC 200L. [Online]
Available at: https://www.systemair.com/in/India/Products/residential-systems-
cb62003a/counter-flow-units/top-connected/save/SAVE-VTC-200-L/
[Accessed 22 06 2016].
UNEP, 2015. Why buildings. [Online]
Available at: http://www.unep.org/sbci/AboutSBCI/Background.asp
UNEP, 2015. Why Buildings. [Online]
Available at: http://web.unep.org/climatechange/buildingsday/why-buildings
[Accessed 11 02 2016].
Wang, L., Gwilliam, J. & Jones, P., 2009. Case study of zero energy house design in UK.
Energy and Buildings, Nov, 41(11), pp. 1215-1222.
Ward, R., Choudhary, R., Yeonsook, H. & Rysanek, A., 2016. Exploring the impact of
different parameterisations ofoccupant-related internal loads in building energy simulation.
Energy and Buildings, Volume 123, pp. 92-105.

64
Wettergren, S., 2016. [Interview] (03 05 2016).
Voss, K., Musall, E. & Lichtmeß, M., 2011. From Low-Energy to Net Zero-Energy Buildings:
Status and Perspectives. Journal of Green Building, pp. 46-57.

Appendix 1. Skanska Color Palette™

ii
Appendix 2. Definition comparison
Building system boundary Near Zero Energy Building,
BBR
Zero Energy Building,
SCNH
Net Zero Primary Energy
Building, Skanska
1.1. Physical boundary
Physical building + free flowing energy
on-site or nearby.
Physical building + renewable energy
produced on the estate
Physical building + newly invested energy
independent of location
1.2. Balance boundary
Energy demand for heating, cooling,
DHW and property energy.
Energy demand for heating, cooling,
DHW and property energy.
Energy demand for heating, cooling,
DHW and property energy.
1.3. Boundary conditions
Follows BBR 22 DOT. Indoor
temperature must be at least 18 °C
DOT. Indoor temperature of 21 °C.
Operation data according to Sveby.
DOT. Indoor temperature of 21 °C.
Operation data according to Sveby.
Weighting system
2.1. Metrics El=2,5; Other=1 El = 2,5; DH=0,8; DC=0,4;
Other=1
El = 2,5; DH=0,8; DC=0,4;
Other=1
2.2. Symmetry N/A Symmetric Symmetric
2.3. Time dependent
accounting No No No
Net ZEB Balance
3.1. Balancing period 1 year 1 year 1 year
3.2. Type of balance N/A Import/Export Demand/generation
3.3. Energy efficiency 55 kWh/m2a 27 kWh/m2a 41 kWh/m2a
3.4. Energy supply No requirements No requirements Renewable energy must cover the
building energy demand
Temporal energy match
characteristics
4.1. Load matching N/A No requirements No requirements
4.2. Grid interaction N/A No requirements No requirements
Measurement and
verification
Heating, cooling, DHW & property
energy. Separate household and
property energy.
Electricity, heating energy and DHW.
Separate inside/outside boundary. Heating, DHW, ventilation, cooling and
property energy. During 2 years

iii
Appendix 3. Map of measuring points

iv
Appendix 4. Energy demand
Figure 32. Monthly heating energy demand.
Figure 33. Monthly DHW energy demand.
0
5
10
15
20
0
0,5
1
1,5
2
2,5
3
3,5
Annual
energ
y [k
Wh/m
2a]
Month
ly e
nerg
y [k
Wh/m
2a]
Heating energy demand
Measured Normalized Simulated
Annual measured Annual Normalized Annual Simulated
0
1
2
3
4
5
6
7
0
0,1
0,2
0,3
0,4
0,5
0,6
0,7A
nnual
energ
y [k
Wh/m
2a]
Month
ly energ
y [k
Wh/m
2a]
DHW energy demand
Measured Normalized Simulated
Annual measured Annual Normalized Annual Simulated

v
Appendix 5. Energy use
Figure 34. Import energy need for GSHP.
Figure 35. Import energy need for cooling.
0
5
10
15
20
25
30
0
0,5
1
1,5
2
2,5
3
3,5
4
Annual
energ
y [k
Wh/m
2a]
Month
ly energ
y [k
Wh/m
2a]
GSHP energy use
Measured Normalized Simulated
Annual measured Annual Normalized Annual Simulated
0
0,2
0,4
0,6
0,8
1
0
0,02
0,04
0,06
0,08
0,1
Annual
energ
y [k
Wh/m
2a]
Month
ly energ
y [k
Wh/m
2a]
Cooling energy use
Measured Normalized Simulated
Annual measured Annual Normalized Annual Simulated

vi
Figure 36. Imported energy need for property purposes.
Figure 37. Import energy need for domestic purposes.
0
2
4
6
8
10
0
0,2
0,4
0,6
0,8
1
Annual
energ
y [k
Wh/m
2a]
Month
ly energ
y [k
Wh/m
2a]
Property energy use
Measured Normalized Simulated
Annual measured Annual Normalized Annual Simulated
0
5
10
15
20
25
30
35
0
1
2
3
4
5
Annual
energ
y [k
Wh/m
2a]
Month
ly energ
y [k
Wh/m
2a]
Domestic energy use
Measured Normalized Simulated
Annual measured Annual Normalized Annual Simulated

vii
Figure 38. Directly used solar electricity within the building, for heating, DHW, cooling and property energy.
Figure 39. Total exported solar electricity, to both domestic energy use and the grid.
0
2
4
6
8
10
0
0,2
0,4
0,6
0,8
1
Annual
energ
y [k
Wh/m
2a]
Month
ly energ
y [k
Wh/m
2a]
Directly used solar electricity
Measured Normalized Simulated
Annual measured Annual Normalized Annual Simulated
0
5
10
15
20
25
30
35
40
0
1
2
3
4
5
6
Annual
energ
y [k
Wh/m
2a]
Month
ly energ
y [k
Wh/m
2a]
Exported solar electricity
Measured Normalized Simulated
Annual measured Annual Normalized Annual Simulated

viii
Figure 40. Exported solar electricity to the grid.
0
5
10
15
20
25
30
35
40
0
1
2
3
4
5
6
Annual
energ
y [k
Wh/m
2a]
Month
ly energ
y [k
Wh/m
2a]
Exported electricity to grid
Measured Normalized Simulated
Annual measured Annual Normalized Annual Simulated

ix
Appendix 6. Questions used in interviews with
occupants.
Inspired by (Boström, et al., 2003)
1. Who lives in the apartment? What ages are they?
2. For how long have you lived in the apartment?
3. Why did you move to Solallén?
4. What information did you get about Solallén? By who? Was it enough?
5. What is positive with your apartment?
6. What is negative with your apartment?
7. Is it something you think is missing in the apartment? Something that could have been
designed differently? Why?
8. What indoor temperature would you preferably have at home? Do you usually have
that?
9. How varies the indoor temperature in different rooms? During different time of day?
10. How varies the indoor temperature during different seasons?
11. If the indoor temperature gets too high, how do you do to decrease it?
12. If the indoor temperature gets too low, how do you increase it?
13. Have you received any suggestions on how to act to get at an even and comfortable
indoor temperature? What kind of tips was that? Who gave them to you?
14. How do you experience the sound environment in the apartment?
15. How do you experience the indoor air quality? Do you experience any difference if
there are more people in your apartment?
16. Have you received any information on how to handle the ventilation system? By who?
How?
17. How have you ever adjusted the operation of the ventilation in your apartment?
Why? How?
18. What are your procedures for airing?
19. Have you received any information on how the free cooling works? By who? How?
20. Does the function of the free cooling correspond to your expectations?
21. What do you know about the solar PV-cells? How did you gain that knowledge?
22. Does the function of the solar PV-cells correspond to your expectations?
23. Have the solar PV-cells affected your economy? How?
24. Do you know how the income from exported (sold) solar electricity is distributed?
25. What did you know about Solallén’s energy use when you bought your apartment?
Have you received more information afterwards? By who? How?
26. Does the energy use of Solallén affect your perception of the houses/your
apartment? How?
27. Solallén is a “net zero energy building” – does that affect your perception of the
houses/your apartment? How?
28. Did the fact that Solallén was a net zero energy building affect your ability/willingness
to pay more for your apartment?
29. How do you receive information about the energy use in your apartment?

x
30. Is this method satisfactory? If not, how would you like to receive this information?
31. Is there anything else you would like to add?
32. Who should we contact for interviews about Solallén?
33. Can we get back to you if we have further questions?

xi
Appendix 7. Questions used in interviews with
employees
1. Tell us about your role in the Solallén project? (profession, company)
2. How long did you work with the project? During which phases?
3. What went well during the project?
4. What went less well during the project?
Operational evaluation
Indoor environment
5. How was your work linked to the indoor environment in Solallén?
6. What were your expectations on the indoor environment in Solallén? Did you worry
about extreme temperatures? When? Why?
After showing the actual indoor temperatures in Solallén:
7. What do you think is the reason for this result?
8. What could have been done during the project in order for the indoor environment
to work as expected? When should this have been done?
Ventilation system
9. How was your work linked to the ventilation system in Solallén?
10. How was the ventilation system expected to be controlled and used?
After showing the actual use pattern of the fans in Solallén:
11. What do you think is the reason for this result?
12. What could have been done during the project in order for the ventilation system to
work as expected? When should this have been done?
Free cooling
13. How was your work linked to the free cooling system in Solallén?
14. What were your expectations on how the free cooling system should be controlled
and used?
After showing the actual use pattern of the free cooling system in Solallén:
15. What do you think is the reason for this result?
16. What could have been done during the project in order for the free cooling system
to work as expected? When should this have been done?
Ground source heat pump
17. How was your work linked to the ground source heat pump system?
18. What were your expectations on how the ground source heat pump should be
controlled and used?
After showing the actual use pattern of the ground source heat pump system in Solallén:
19. What do you think is the reason for this result?

xii
20. What could have been done during the project in order for ground source heat
pump system to work as expected? When should this have been done?
Direct use of solar electricity
21. How was your work linked to the solar PV-cells?
22. What were your expectations on how the solar electricity could be directly used in
the apartments?
After showing how the solar electricity was directly used in Solallén:
23. What do you think is the reason for this result?
24. What could have been done during the project in order for the direct use of solar
electricity to work as expected? When should this have been done?
Zero energy buildings
25. What information did you receive regarding the goal for Solallén to be “net zero
energy buildings”? When? By who?
26. How did this affect your work?
Process
27. How has the communication worked during the project?
28. Would your work have been affected if the goal “net zero energy buildings” had been
communicated earlier in the process?
29. When would you have preferred to receive this information?
30. How was your work linked to the energy monitoring system?
31. Are you pleased with the energy monitoring?
32. How did the handover to the occupants work? How did they receive information on
the installations and how they worked?
Economy
33. How did the fact that Solallén was a net zero energy project affect the economy?
34. Was the project economically beneficial? Was the project beneficial in other ways?
Closure
35. What have you learned from the project?
36. Is there anything else we should know in order to get an accurate picture of the
project?
37. Who else should we contact regarding this project?
38. Can we get back to you if we have further questions?