Embed Size (px)
Citation preview

AuthorMark Jensen
Agilent Technologies, Inc.
2850 Centerville Road
Wilmington, DE 19808-1610
USA
Abstract
This application note describes how the Agilent Technologies 2100 bioanalyzer and the DNA 500 LabChipcan be used to detect polymerase chain reaction productscorresponding to genetically modified elements andendogenous sequences in corn and soy beans. The DNAextraction protocol used in the preparation of polymerasechain reaction samples was characterized using the Protein 200 Plus LabChip.
Introduction
Six years after the introduction of genetically modi-fied organisms (GMO), consumer concerns aboutthe presence of such modified organisms in foodremains an ongoing issue. There has been a contin-uous debate surrounding issues of how food prod-ucts that contain GMO ingredients should beregulated and labeled. This debate has been furthercomplicated by disagreements over how GMOsshould be detected and the significance of the
Nested Multiplex Polymerase ChainReaction for the Determination of DNAFrom Genetically Modified Corn and SoyBeans Using the Agilent 2100 BioanalyzerApplication
detected levels. In spite of these issues, thenumber of available transgenic events has contin-ued to grow. At the current time there are 14 trans-genic varieties of corn and soy beans that havebeen deregulated by the Animal and Plant HealthInspection Service of the United States Departmentof Agriculture (USDA).
Although enzyme immunoassay is an efficientmeans for detecting transgenic proteins in rawproducts, only DNA analysis has proved to beeffective for the entire range of sample matricesfrom raw materials to highly processed foods. Thepolymerase chain reaction (PCR) has been widelyaccepted as a method for the detection of DNAfrom genetically modified ingredients such as soyaor corn [1, 2]. PCR detection of GMOs can be doneeither as a screening test using endpoint PCR or asa quantitative test using real-time fluorescencedetection of the PCR product.
Quantitation by real-time PCR is an expensiveanalysis requiring assay calibration for eachsample lot and multiple replicates of eachunknown sample. Typical service charges for asingle analysis are between $150–$300. Since eachtransgenic event must be evaluated individually,the cost of rigorously testing an unknown foodsample for all the possible current transgenicevents is cost prohibitive.
These cost constraints make it necessary to screensamples for DNA components that are present in
Agriculture
2
most GMOs prior to any quantitative analysis. Thistype of screening analysis can be carried out witha commercially available PCR test kit, such as theBiosmart Allin 1.0 GMO Screening System fromPromega (Madison, Wisconsin). This kit provides aprotocol and reagents for a nested multiplex PCRassay for the detection of DNA from modifiedorganisms containing the 35S promoter. Thisgenetic element is derived from the cauliflowermosaic virus and is found in most transgeniccrops. In addition to the 35S promoter, the multi-plex PCR reaction also detects sequences for soya(lectin), corn (zein) and an internal positive con-trol. These multiplex PCR products are all easilyresolved and detected using the DNA 500 LabChipand the Agilent 2100 bioanalyzer.
Experimental
DNA Extraction
Three DNA extraction protocols were evaluatedprior to the PCR analysis. These protocols were theDNeasy Plant Mini Kit from Qiagen N. V. (Venlo,Netherlands), the Wizard Genomic DNA PurificationKit from Promega (Madison, Wisconsin) and acetyltrimethylammonium bromide (CTAB) precipi-tation procedure that was developed in-house.Detailed descriptions of the DNeasy and WizardGenomic kit protocols can be found in the technicalmanuals that accompany these products. The CTABprotocol is described below.
CTAB Extraction protocol:
1. A 50-mg sample was added to a 1.0-mL aliquotof CTAB extraction buffer (0.055 M CTAB(cetyltrimethylammonium bromide), 0.1 M Tris,1.4 M NaCl, 0.2 M disodium EDTA pH 8.0),heated at 65 °C for 15 min and then placed onice.
2. The extract mixture was centrifuged at 15,000 gfor 10 min to remove particulates.
3. The supernatant was removed and stored in anew microfuge tube at 4 °C. (Samples with highstarch levels, for example corn, were treatedwith 0.2 µL of α-amylase and incubated at 37 °C for 30 min.)
4. The recovered supernatant was combined withan equal volume of chloroform mixed for 30 sand then centrifuged for 10 min at 15,000 g.The upper (aqueous) phase was transferred toa new tube.
5. Two volumes of the CTAB precipitation solu-tion (0.014 M CTAB, 0.04 M NaCl ) were addedto aqueous extract and mixed.
6. The mixture was incubated at 25 °C for 30 minand then centrifuged for 10 min at 15,000 g.The supernatant was discarded.
7. The precipitate was redissolved by adding 250 µL of the 1.2 M NaCl and incubating 37 °Cfor 10 min. The mixture was centrifuged for 5 min at 15,000 g and the supernatant wastransferred to a new tube.
8. One volume of isopropanol was added to themixture and then the mixture was stored at 4 °C for at least 30 min.
9. The solution was centrifuged for 10 min at15,000 g and then the supernatant was discarded.
10. The pellet was washed with 500 µL of cold 70%ethanol, the mixture was centrifuged for 5 minat 15,000 g, and then the ethanol solution wasdiscarded.
11. After drying the tube, the DNA pellet was redissolved in 25 µL of Tris buffer (0.01 M Tris,0.001 M EDTA pH 8.0).
The soya reference standards were used in theevaluation of the DNA extraction because soya con-tains a high level of protein that can be accuratelytracked through each step of the extraction proce-dure. Although the soya protein is not problematicfor the PCR assay, it serves as a useful indicator ofoverall DNA purity. Protein levels in the final DNAextracts were determined by a protein measure-ment using the Protein 200 Plus LabChip and theAgilent 2100 bioanalyzer. Absorbance measure-ments were made with the ND-1000 spectropho-tometer from NanoDrop Technologies, Inc.(Wilmington, Delaware).
PCR Protocol
Samples used in the GMO analysis consisted ofInstitute for Reference Materials and Measure-ments (IRMM) Certified Reference GMO Soy andGMO Corn, as well as commercial corn meal andsoya powder. The PCR analysis was carried outusing the Biosmart Allin 1.0 GMO ScreeningSystem from Promega (Madison, Wisconsin). Amodified PCR cycling protocol was developed foruse with the PTC 200 Peltier Thermal Cycler fromMJ Research, Inc. (Waltham, Massachusetts). ThePCR protocol is described below.

3
Multiplex PCR Protocol
1. Dilute the DNA sample to an initial concentra-tion of 5–50 ng/µL. (This corresponds to anoptical density, (OD), at 260 nm of 0.1–1.0 for a1-cm cell.)
2. For the first stage of the multiplex PCR com-bine the following per reaction:
17-µL 2X Qiagen Multiplex PCR Master Mix
27-µL Allin Mix 1
5-µL Internal control
1-µL Extracted DNA
3. Vortex the solution.
4. Perform first stage of PCR amplification usingthe following cycling program.
TemperatureStep Time (°C)1 15 min 952 15 s 953 60 s 554 30 s 725 Repeat steps 2–4 an additional 39 times6 3 min 72
5. For the second stage of the Multiplex PCR combine the following per reaction
24.5-µL 2X Qiagen Multiplex PCR Master Mix
24.5-µL Allin Mix 2
1.0-µL Product from first stage PCR
6. Perform second stage of PCR amplificationusing the following cycling program.
TemperatureStep Time (°C)1 15 min 952 15 s 953 60 s 574 30 s 725 Repeat steps 2–4 an additional 39 times6 3 min 72
Analysis of PCR Products
The PCR products were analyzed using the DNA500 LabChip and the Agilent 2100 bioanalyzer. For comparison, the same PCR products were alsocharacterized by gel electrophoresis in a 4% NuSieve 3:1 Plus Gel. The electrophoretic sepa-ration conditions were 150 V for 60 min in a 1X Tris-borate-EDTA (TBE) buffer.
Results
DNA Extraction
DNA extraction protocols were evaluated for bothyield and purity of DNA. Protein levels in the DNAextracts were determined using the Protein 200 PlusLabChip [3]. The results of this comparison aresummarized in Table 1.
Yield DNA/ProteinMethod (%) w/w A260/A280
CTAB 0.008 2.7 1.82
DNeasy 0.004 2.5 1.89
Wizard Genomic 0.008 0.3 1.62
Table 1. Summary of DNA Extraction
The CTAB and Wizard Genomic protocols showedthe highest levels of DNA recovery with final DNAyields of 0.008% of the initial sample weight. TheDNA/protein ratio of 0.3 found in the Wizard DNAextract indicated that this extract still contained ahigh level of protein. The corresponding ratio forCTAB was 2.7, indicating that the protein contentof the CTAB extract was only 1/9 of the Wizard protocol.
The A260/A280 ratio is also a useful indicator of DNApurity, with high purity DNA having an absorbanceratio of 1.8–1.9. A comparison of the A260/A280
ratios for the CTAB and Wizard extracts, 1.82 and1.62 respectively, confirmed the higher DNA purityin the CTAB process. The DNeasy extractionprocess produced DNA of comparable quality tothe CTAB process, but at a significantly loweryield. Since the CTAB extraction protocol gave thehighest yield of high purity DNA, this protocol wasused to prepare the DNA extracts used in the PCRanalysis.
Analysis of PCR Products
The Biosmart Allin 1.0 GMO Screening System is amultiplex PCR kit that is capable of generating fourPCR products. These PCR products include the following:Base pairs
(bp) Product118 Soy lectin gene150 35S Promoter217 Internal control (corn zein
sequence added to the PCR mix)278 Corn zein gene
4
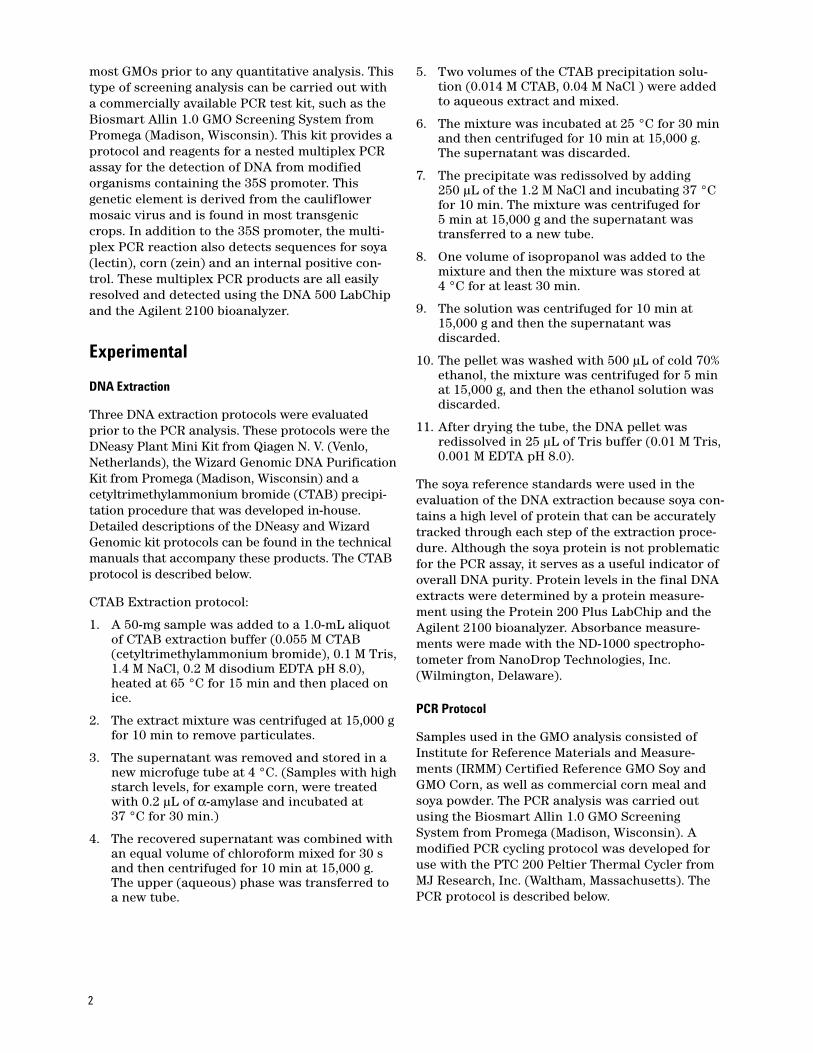
All four of these products can be found in eitherthe positive or the negative control reactions usingthe Biosmart GMO Screening System. The DNA 500LabChip has ample separation to resolve all ofthese PCR products. This resolution is illustratedin Figure 1, which shows a composite of the bioan-alyzer electropherograms for the positive and negative controls.
1
2
3
4
5
Migration time
Fluo
resc
ence
6
7
Figure 1. Composite of bioanalyzer electropherograms for positive and negative controls.
1 Low molecular weight marker
2 Primer-dimer in negative control
3 Soy lectin - 118 bp
4 35S GMO - 153 bp
5 Internal control - 217 bp
6 Corn zein - 278 bp
7 High molecular weight marker
The PCR analysis was carried out on corn and soyasample sets. The corn sample set consisted of IRMMCertified Reference MON810TM corn standards atthe following levels: 0% MON810, 0.1% MON810,0.5% MON810, 1.0% MON810, 2.0% MON810, and5.0% MON810, and commercial corn meal. The soyasample set was made of IRMM Certified ReferenceRoundup Ready® soya samples at the followinglevels: 0% Roundup Ready, 0.1% Roundup Ready,0.5% Roundup Ready, 1.0% Roundup Ready, 2.0% Roundup Ready, and 5.0% Roundup Readyand commercial soya powder. Both sample setscontained a positive control with 0.5% each Bt176corn and Roundup Ready soya, and deionizedwater as a negative control.

5
Figure 2 shows the electrophoretic gel separationand a gel-like bioanalyzer image for all of the sam-ples listed above. The PCR products for the cornsamples are shown in Figures 2A and 2C. Figures2B and 2D show the soya results.
500
400
300
250
200
150
100
500
400
300
250
200
150
100
L 1 2 3 4 5 6 7 8 9 L 1 2 3 4 5 6 7 8 9
L 1 2 3 4 5 6 7 8 9 L 1 2 3 4 5 6 7 8 9
A B
C D
Figure 2A and 2B. 4% NuSieve 3:1 Plus Gel, 150 V for 60 min.
Figure 2C and 2D. Gel-like bioanalyzer image.
Figure 2. 2A (gel) and 2C (bioanalyzer)
L) Molecular weight ladder: 501, 489, 404, 353, 242, 190, 147, 110, 89, 67, 34, 34,
and 26 bps 1) 0% MON810 corn, 2) 0.1% MON810 corn, 3) 0.5% MON810 corn,
4) 1.0% MON810 corn, 5) 2.0% MON810 corn, 6) 5.0% MON810 corn, 7) Commercial
corn meal, 8) Allin positive control (0.5% Bt 176 maize and 0.5% Roundup Ready soy-
bean), and 9) Negative control (deionized water).
2B (gel) and 2D (bioanalyzer)
L) Molecular weight ladder, 1) 0% Roundup Ready soya, 2) 0.1% Roundup Ready soya,
3) 0.5% Roundup Ready soya, 4) 1.0% Roundup Ready soya, 5) 2.0% Roundup Ready
soya, 6) 5.0% Roundup Ready soya, 7) Commercial soya powder, 8) Allin positive con-
trol (0.5% Bt 176 maize and 0.5% Roundup Ready soybean), and 9) Negative control
(deionized water).
6
Comparison of Gel and Bioanalyzer Response
The bioanalyzer DNA 500 LabChip clearly showssuperior resolution and uniformity of band locationcompared to the 4% NuSieve gels. The enhancedreproducibility of band location in the gel-like bio-analyzer image is readily apparent in a visual com-parison of Figures 2C and 2D to Figures 2A and2B. Both the 4% gel and the bioanalyzer have suffi-cient sensitivity to visualize the 35S PCR productat the minimum corn and soy reference standardlevels of 0.1% GMO.
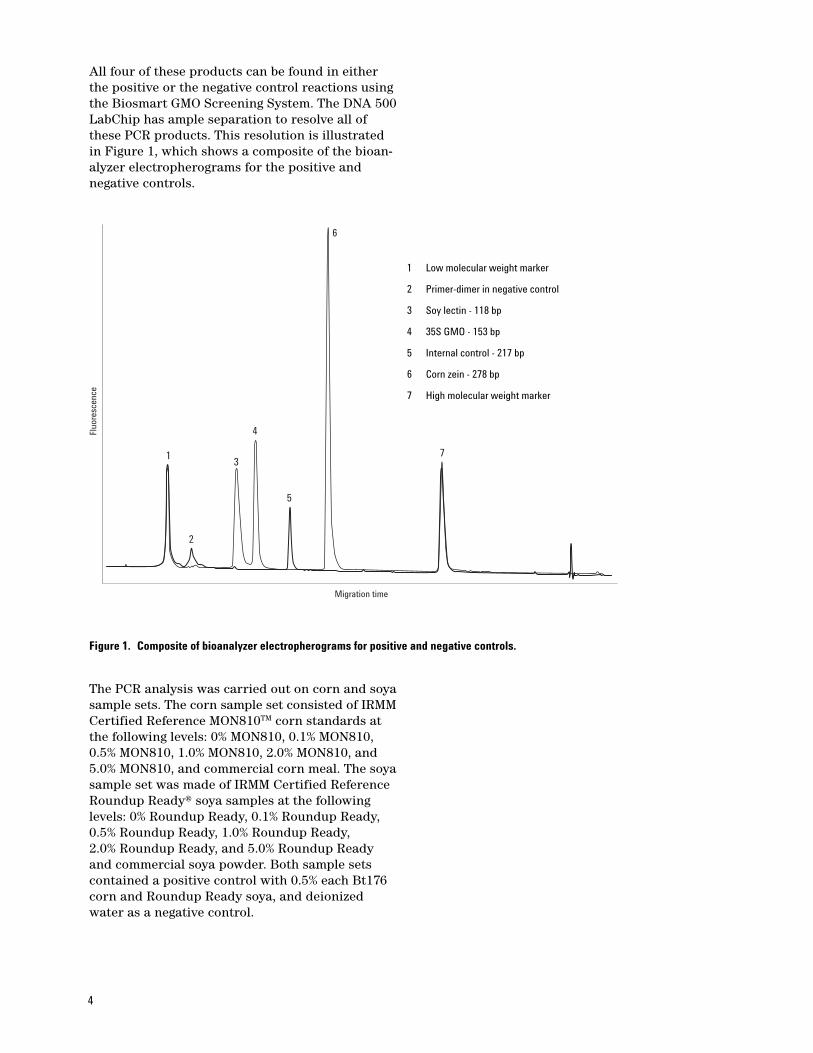
A comparison of the initial 35S level in the sampleto the amount of 35S PCR product shows that the35S GMO PCR band increases as the GMO contentincreases. The PCR response in both corn and soysamples appears to saturate before the maximumGMO standard level of 5% is reached. This effectcan be clearly demonstrated using the bioanalyzer’sability to measure PCR product concentrations.Tables 2 and 3 show the concentrations of thecorn, soy, and 35S PCR products. For the cornsamples, the PCR product response saturates at 1.0% GMO. In the soy samples, the saturationoccurs at 0.5% GMO.
Table 2. GMO Corn Response - Corn and 35S PCR Products
278 bp-Corn 153 bp-35S Ratio of 35S/Sample amplicon (ng/µL) amplicon (ng/µL) corn amplicons
0% MON810 Corn 2.5 0.03 0.01
0.1% MON810 Corn 3.4 1.2 0.4
0.5% MON810 Corn 6.2 3.8 0.6
1.0% MON810 Corn 3.5 4.3 1.2
2.0% MON810 Corn 5.2 4.4 0.9
5.0% MON810 Corn 4.7 4.7 1.0
Corn meal 6 5.2 0.9
Table 3. GMO Soya Response - Soya and 35S PCR Products
118 bp-Soya 153 bp-35S Ratio of 35S/Sample amplicon (ng/µL) amplicon (ng/µL) soya amplicons
0% Roundup Ready soy 5.1 0.1 0.02
0.1% Roundup Ready soy 5.4 0.8 0.15
0.5% Roundup Ready soy 4.9 3.4 0.7
1.0% Roundup Ready soy 5.3 4.0 0.8
2.0% Roundup Ready soy 5.1 4.4 0.9
5.0% Roundup Ready soy 4.8 5.0 1.0
Soya powder 4 0.9 0.2
Positive control 4.8 2.2 0.5

7
Although concentrations of PCR products can bedetermined quite accurately, some care must beexercised in the interpretation of these quantita-tive results. Under conditions where a correlationcan be seen between the GMO content and the con-centration of GMO amplicon, for example, GMO<0.5%, a rough estimate of GMO concentration canbe made. However, such an estimate is only reliableif the same PCR master mix and thermocycler areused for all the amplification reactions. In addi-tion, sample and calibration standard matricesmust also be highly similar.
For the Biosmart GMO Screening System, quantita-tive conclusions cannot be made at concentrations>0.5% GMO because the PCR response is saturated.Once the PCR product concentrations have reachedthis level, small differences in amplicon concentra-tions are not useful in making quantitative esti-mates. An example of this can be seen in Table 3.The 0.5% GMO soy reference has a 35S/soy ampli-con ratio of 0.7. In the positive control, where thesample has 0.5% GMO soy and 0.5% GMO corn, thecorresponding ratio is only 0.5. Since the positivecontrol contains at least twice as much 35S GMOmarker as the 0.5% soy reference, this ratio wouldbe expected to be greater than 0.7. It is difficult toexplain why the ratio is lower in the positive con-trol. This behavior could be the result of the com-plex reaction kinetics in a multiplex nested PCRassay or may simply reflect the imprecision in endpoint PCR amplicon concentrations.
PCR Product Composition
The internal control in the Biosmart Allin 1.0 GMOScreening System is a 217 bp corn sequence thatuses the same primer sequences as the corn PCRproduct. According to the manufacturer, whenhigh levels of corn DNA are present, competitionfor primer may result in the loss of the internalcontrol PCR product. An examination of the cornPCR products in Figure 2C shows this effect in thatthe 217 bp is either absent or visible only at tracelevels. However, in the soy PCR assay in Figure 2D,the 217 bp fragment can easily be seen in all thesamples except the positive control that containscorn DNA.
In the corn sample set, a weak band can be seen ataround 120 bp. This suggests that during the DNAisolation step, trace amounts of soya DNA wereintroduced into the corn samples. Likewise, the
presence of a band at 280 bp in some of the soysamples indicates low levels of corn DNA were pre-sent in several of the soy samples. It is not surpris-ing that trace levels of cross contamination shouldbe apparent in a nested PCR assay. Since all of thesamples undergo a net 80 cycles of amplification,even a few copies of soy or corn DNA will be sufficient to produce a detectable PCR product.
In PCR assays using a large number of amplifica-tion cycles, it is not uncommon for amplicons ofsimilar sequence to cross hybridize. In the case ofthe Biosmart Allin 1.0 GMO Screening System,both the corn PCR product and the internal con-trol share a region of common DNA sequence.When these two amplicons cross-hybridize, theresulting product has both single-stranded anddouble-stranded regions. These structures, knownas heteroduplexes, have substantially lower mobil-ity than a corresponding double-stranded struc-ture. The relative mobility shift depends on suchfactors as gel composition, ionic strength, and geltemperature [4]. In Figure 2, PCR products thatare larger than the 278 bp corn amplicon areobserved. These bands occur at about 320 bps inthe 4% gel and at 400 and 500 bps in the bioana-lyzer electropherogram. Cross hybridization of thecorn and the internal control amplicons is probablyresponsible for these products.
Conclusion
This application note described the use of the Agilent 2100 bioanalyzer with the Protein 200 Plusand DNA 500 LabChip Kits in the evaluation ofsample preparation and the analysis of multiplexPCR products. The Protein 200 Plus was used todetermine which DNA extraction procedure wasmost effective in removing residual protein. TheDNA 500 LabChip was used to characterize theBiosmart Allin 1.0 GMO Screening System, anested multiplex PCR assay for the geneticallymodified corn and soy beans. Resolution and sen-sitivity in these assays was sufficient to identify allof the targeted multiplex PCR amplicons and todifferentiate these targets from PCR artifacts. Sen-sitivity of the assay was sufficient to detect GMOcontent even at the minimum GMO standard levelof 0.1% in both corn and soy reference standards.
Agilent shall not be liable for errors contained herein or for incidental or consequentialdamages in connection with the furnishing, performance, or use of this material.
Information, descriptions, and specifications in this publication are subject to changewithout notice.
MON810TM is a trademark of the Monsanto Company. Roundup Ready® is a registered trademark of the Monsanto Company.
© Agilent Technologies, Inc. 2003
Printed in the USAOctober 23, 20035989-0124EN
www.agilent.com/chem
For More Information
For more information on our products and services,visit our Web site at www.agilent.com/chem.
References1. S. Vollenhofer, K. Burg, J. Schmidt and H.
Hroath, “Genetically Modified Organisms inFood - Screening and Specific Detection byPolymerase Chain Reaction” (1999) J. Agric.Food Chem. 47, 5038-5043.
2. S. Garret, O. Arun and J. Dooley, “Analysis ofGenetically Modified Soya Using the Agilent2100 bioanalyzer”, Agilent Technologies, publication 5988-4070ENwww.agilent.com/chem.
3. D. Dempsey, and M. Jensen, “Characterizationof Transgenic Soybean Seedlines by ProteinExpression with the Agilent 2100 bioanalyzer”,Agilent Technologies, publication 5988-9441EN,www.agilent.com/chem.
4. M. A. Jensen, and N. Straus, “Effect of PCRConditions on the Formation of Heteroduplexand Single-stranded DNA Products in theAmplification of Bacterial Ribosomal DNASpacer Regions”, (1993) PCR Methods andApplications 3, 186.