Embed Size (px)
Citation preview
i
Passing through school: the evolution of attainment of England’s ethnic minorities 13 August 2009 Simon Burgess Deborah Wilson Jack Worth CMPO, University of Bristol Research commissioned by the National Equality Panel Introduction ii Data and Methods iii Results Commentary iv List of Tables and Figures viii Tables and Figures 1 End 44
ii
1 Introduction 1.1 This report updates the research carried out in Wilson et al (2005)1, and uses the latest pupil census (PLASC/NPD) to track pupils’ progress through school from Key Stage 1 (KS1; age 7) to Key Stage 4 (GCSEs and equivalent; age 16). The focus is on the different trajectories followed by different ethnic groups, both in the raw data and once we account for correlating variables such as gender, income, and the neighbourhoods in which the pupils live. 1.2 The present study includes two key extensions to the original analyses: (a) Using PLASC/NPD 2007 we are now able to track the same cohort through from KS1 to KS4, so we can analyse how the cohort of students who took GCSEs in 2007 have done, relative to their peers, since the age of 7. We have carried out all the analyses using two datasets:
(i) a balanced panel, i.e. including only those students for whom we have data at every Key Stage;
(ii) cross sections, i.e. including all students for whom we have data at each Key Stage separately.
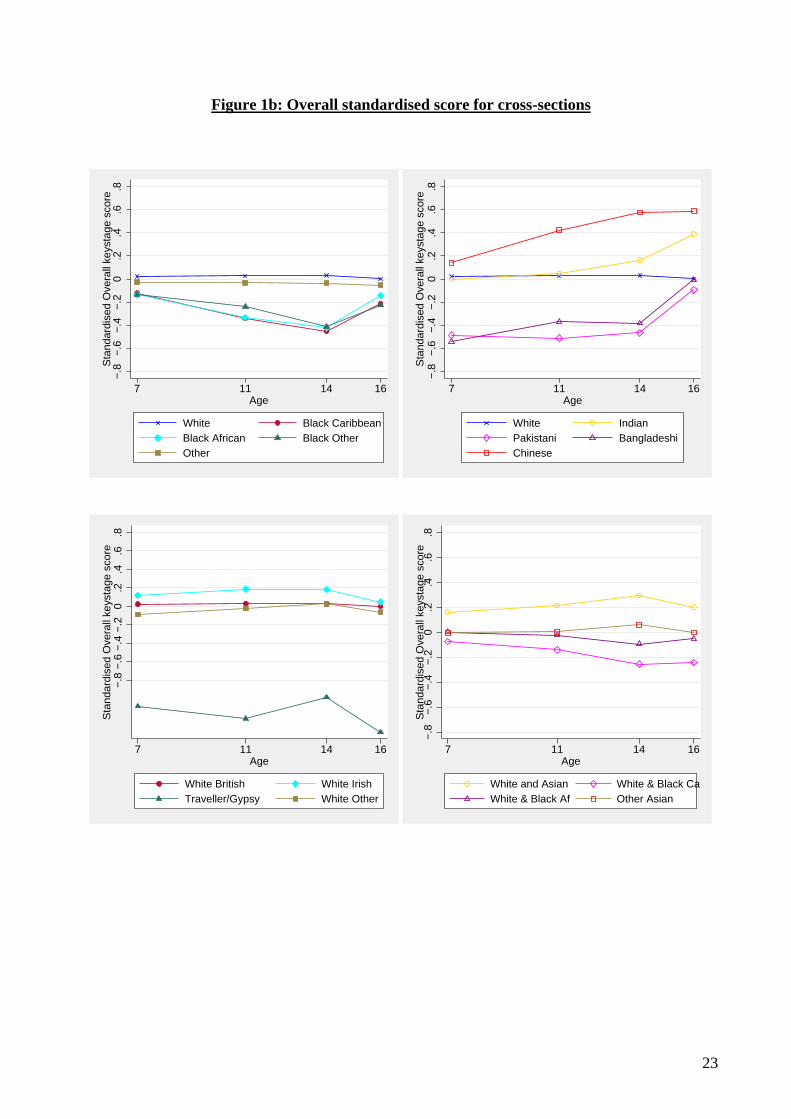
The advantage of (i) is that differences in performance at different ages cannot be due to selection, since exactly the same group of students are present each time. The advantage of (ii) is that it uses all available data. Problems in interpretation may arise if there are significant differences between the two samples. We include both sets of analyses in this report. The key point to note is that for all students other than those with Black African ethnicity there is very little difference in the results across the two datasets. This concurs with our previous work, and derives from the extent of recent immigration for this group. Appendix Figure A1 illustrates the differences between the balanced panel and the cross sections at KS3 (age 14) and KS4 for Black African students. This summary refers to the balanced panel results unless otherwise stated. (b) There are now more disaggregated ethnicity categories available. We can therefore investigate the mixed heritage groups for the first time, as well as those who identify themselves as Traveller/Gypsy. Table 1 contains details of the sample. Note that the numbers in some of the groups are small; in particular there are very small numbers in the Traveller/Gypsy category. This needs to be borne in mind when interpreting the results.
1 Wilson, D, Burgess, S and Briggs, A (2005) The dynamics of school attainment of England’s ethnic minorities, CMPO DP 05/130, CMPO, University of Bristol. Forthcoming in the Journal of Population Economics, 2009.
iii
2 Data and Methods 2.1 We use PLASC/NPD 2007 from which we obtain the pupils’ test score history at each Key Stage of the National Curriculum, at ages 7 (KS1); 11 (KS2, the end of primary schooling); 14 (KS3) and 16 (KS4 or GCSEs, the end of compulsory education). PLASC/NPD also contains the following individual characteristics: ethnicity; gender; month of birth; eligibility for free school meals (FSM; an indicator of family poverty); an indicator of special educational needs (SEN); and each pupil’s full home postcode. 2.2 Some of the pupil characteristics are time-varying: FSM-eligibility; SEN status; school attended; home postcode. We measure all of these variables at one date only, taking them all from the 2007 census. 2.3 We focus on state school pupils in England, and carry out the analyses on both the balanced panel and cross sections, as outlined above. Table 1 provides details of our sample sizes by ethnicity, gender, and FSM-eligibility. 2.4 Using pupils’ postcodes, we match in data on neighbourhoods. We use two measures of neighbourhood: the MOSAIC classification at postcode level2, and the Income Deprivation Affecting Children Index (IDACI), measured at Super Output Area level. Our favoured specification includes the IDACI index. 2.5 We want to compare the progress through the Key Stages of different ethnic groups. Because Key Stage tests are scored differently at the different stages, we standardise each Key Stage score. Results for all but the value-added analysis are therefore presented in units of standard deviation of scores, separately for each age. So a value of -0.1 for a group at KS2, for example, means that the average test score for that group is 10% of a standard deviation of test scores below the mean, the standard deviation being for all KS2 scores of that cohort. 2.6 The methods used in the analyses for this report replicate those of our original work (see footnote 1) and are explained in great detail there. One extension to note: in some of the regressions (Results section 3.5) we include dummy variables interacting ethnicity, gender and FSM status. This is to allow the effect of FSM-eligibility on attainment to vary by ethnicity and gender. 2.7 For our analyses of differences across ethnic groups in the value-added between Key Stages, we again use the DfES (now DCSF) method of calculating value-added, detailed on page 14 of Wilson et al (2005).
2 For more information see http://www.experian.co.uk/business/products/data/113.html

iv
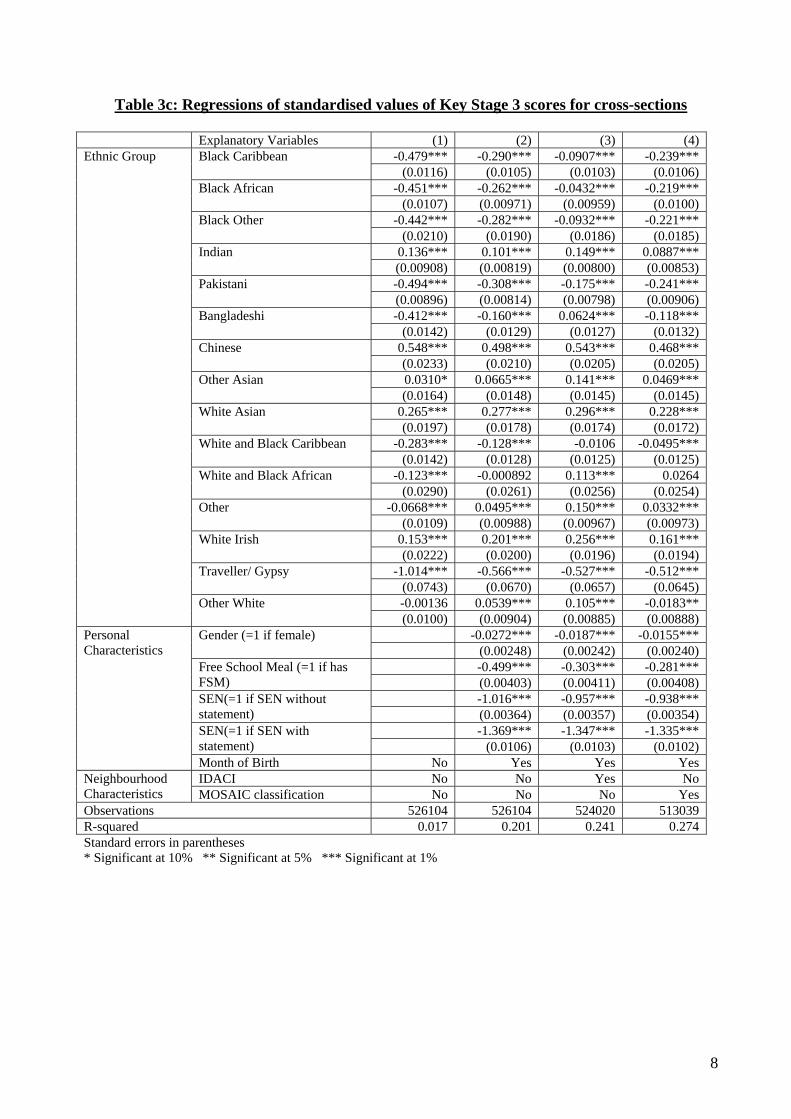
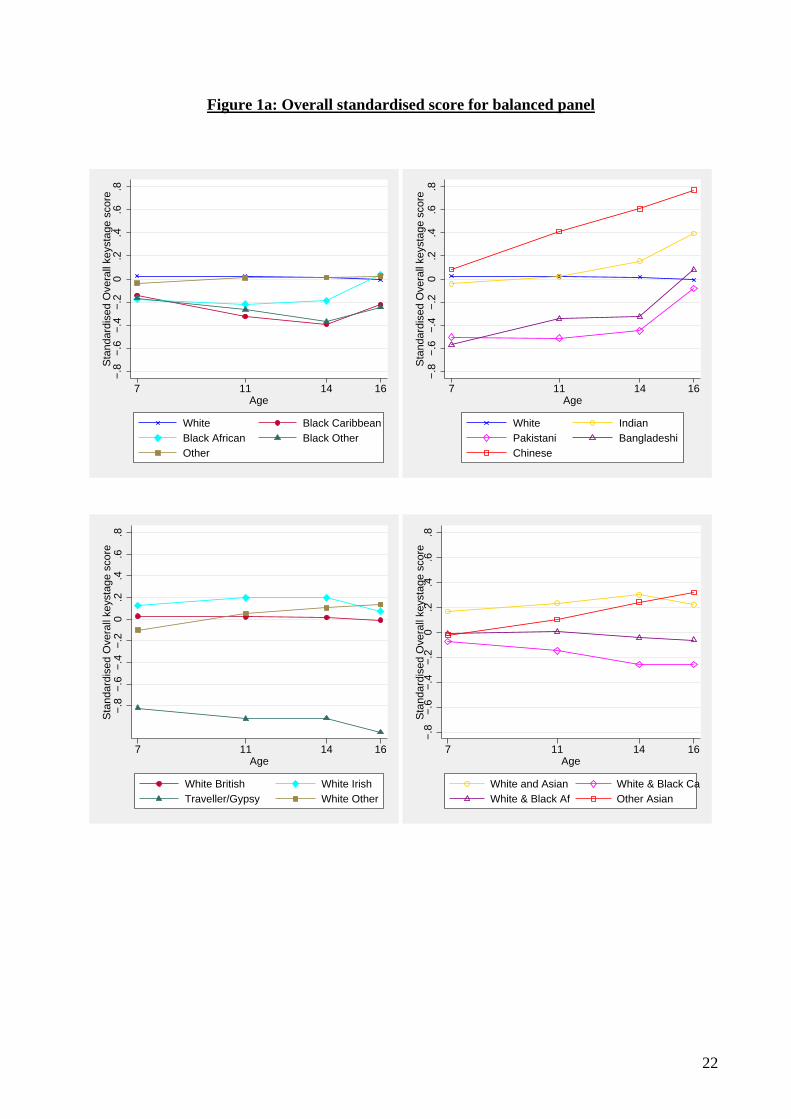
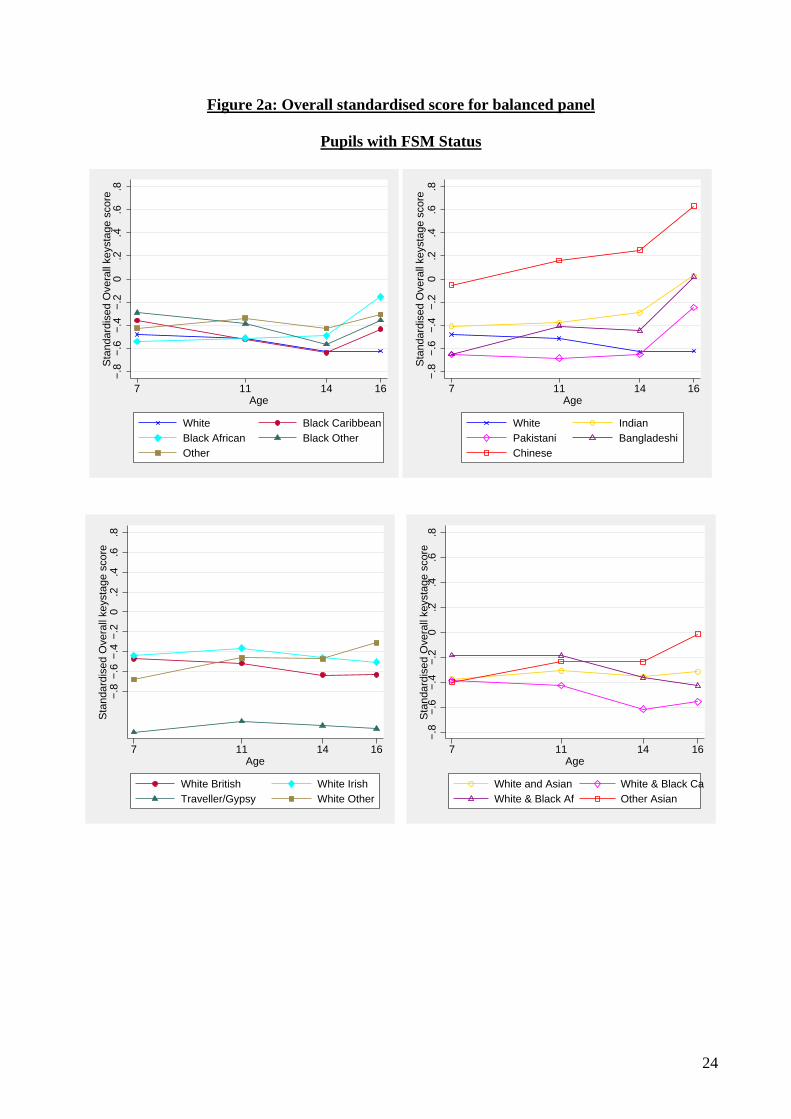
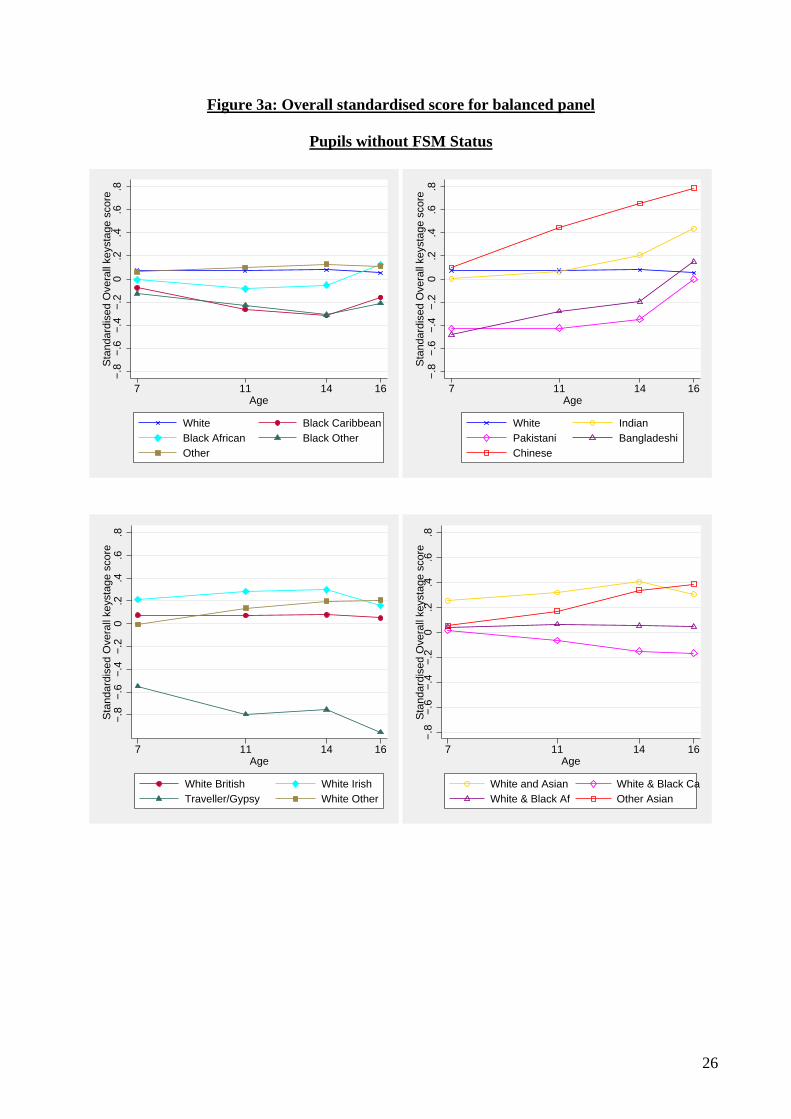
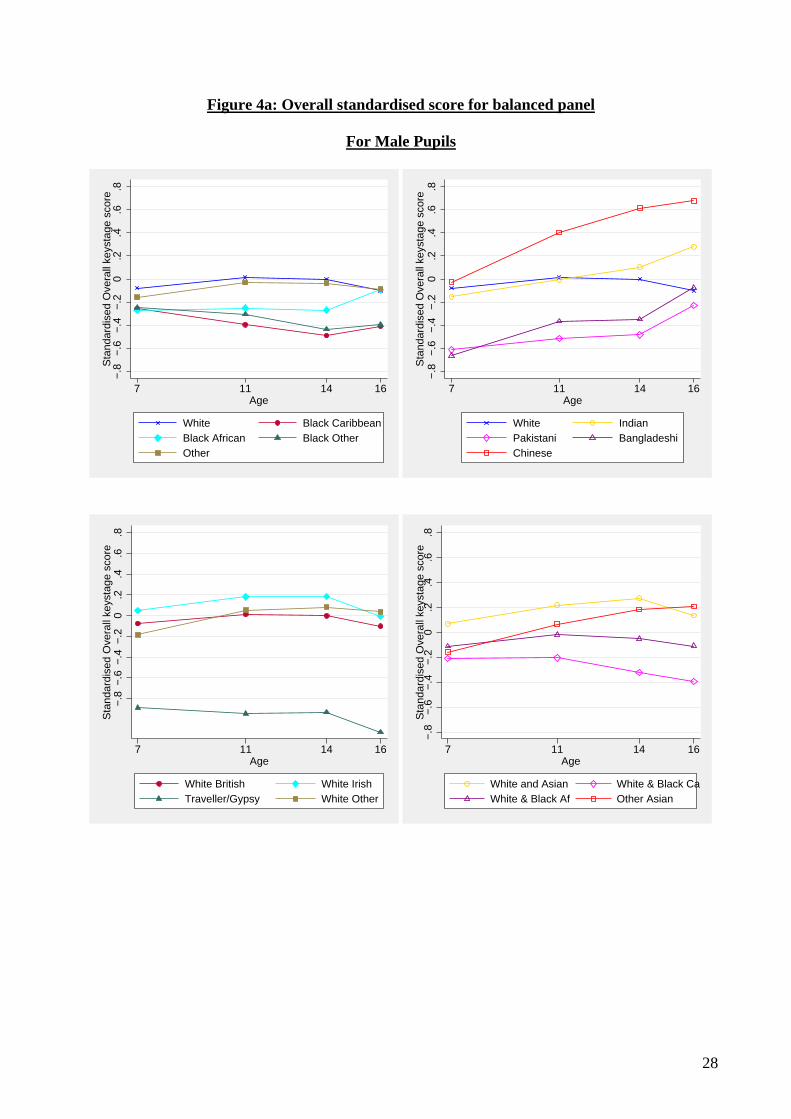
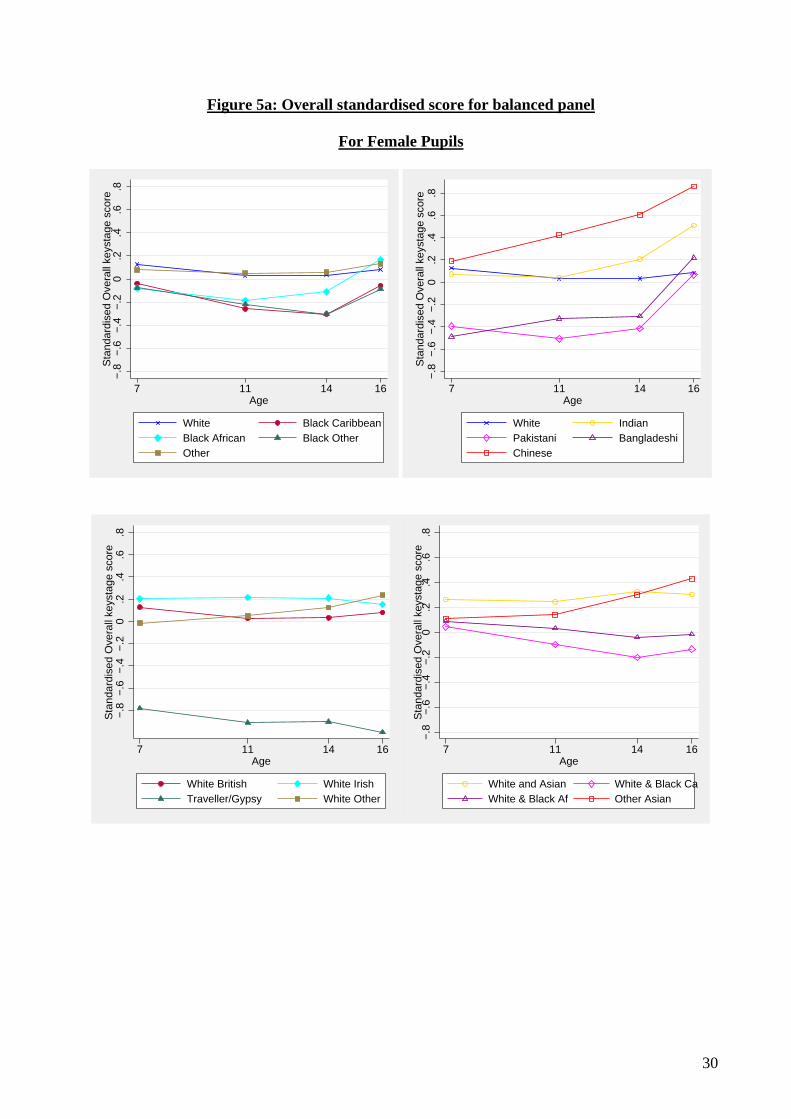
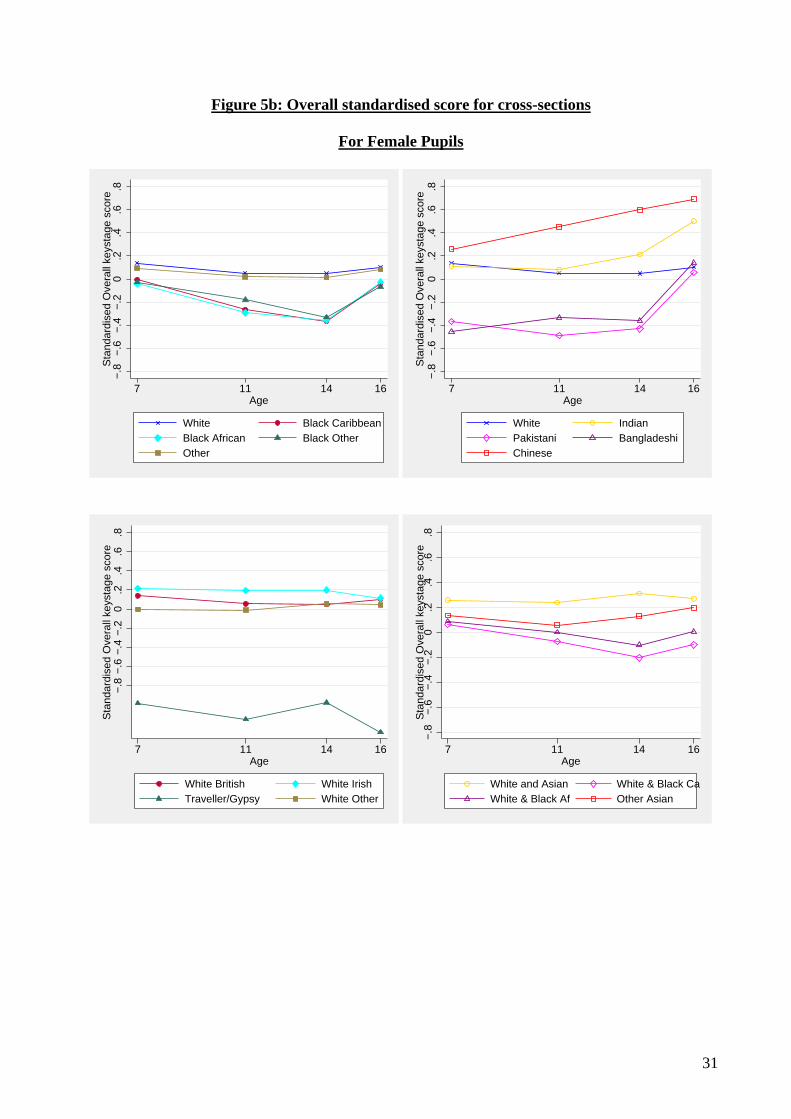
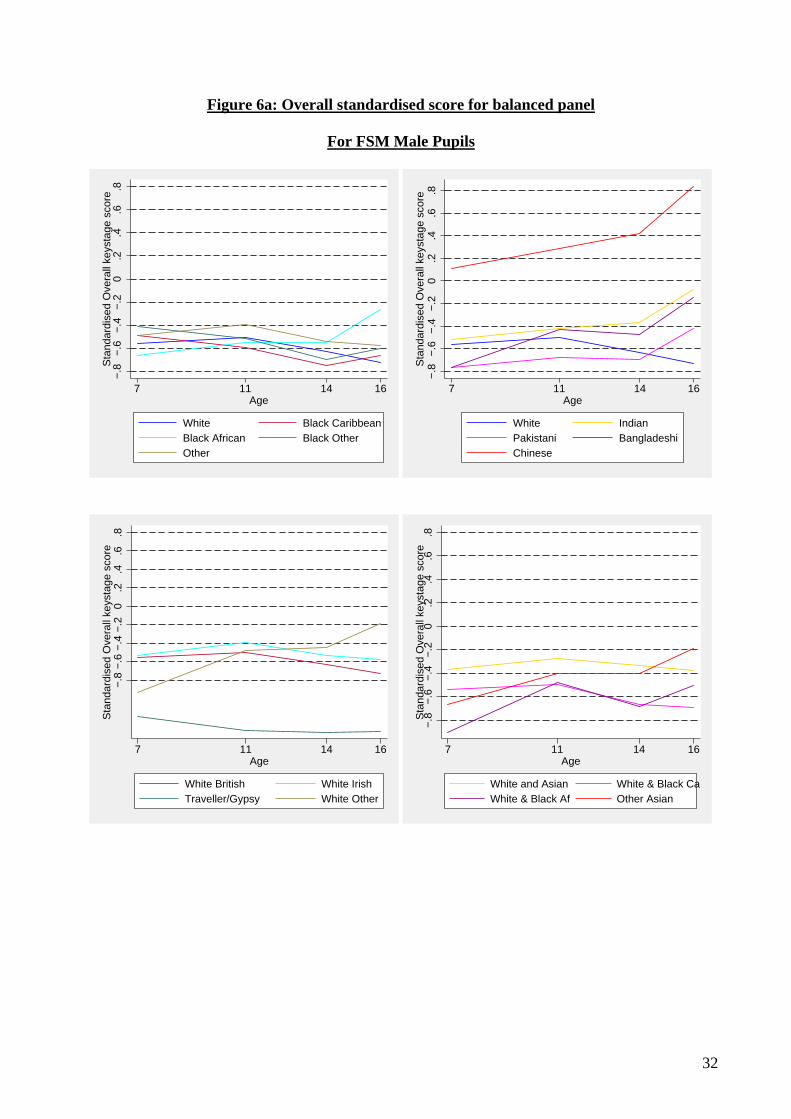
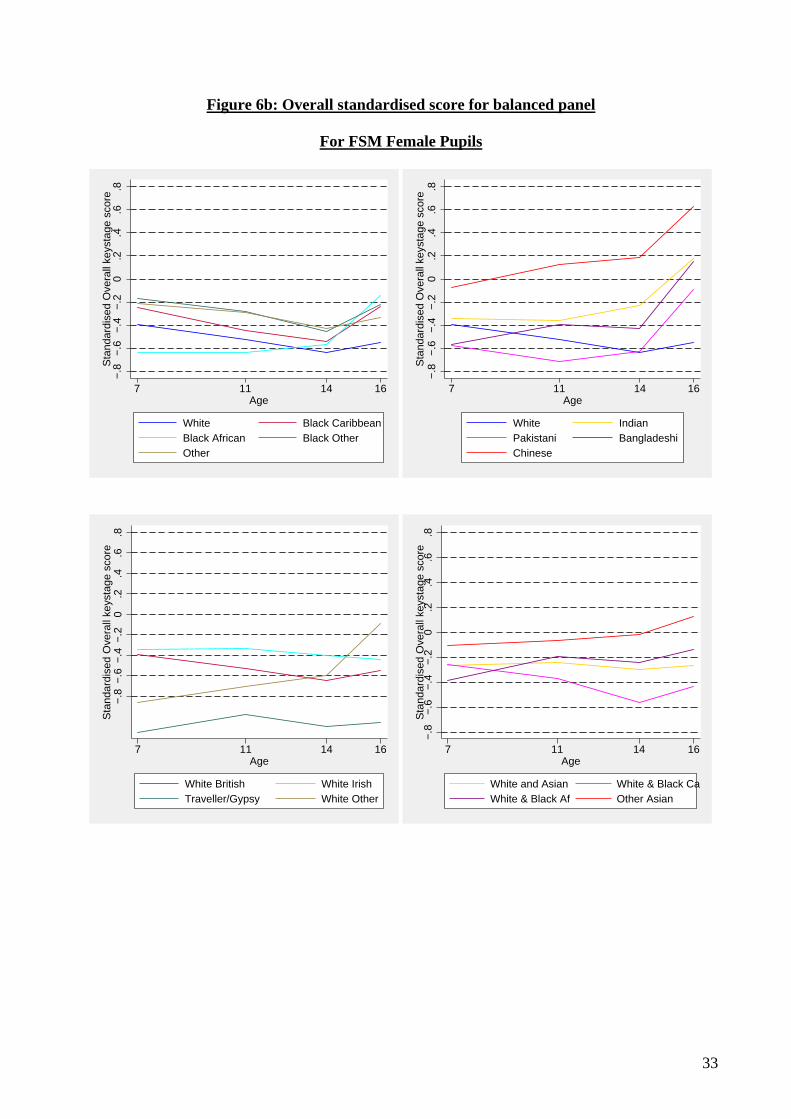
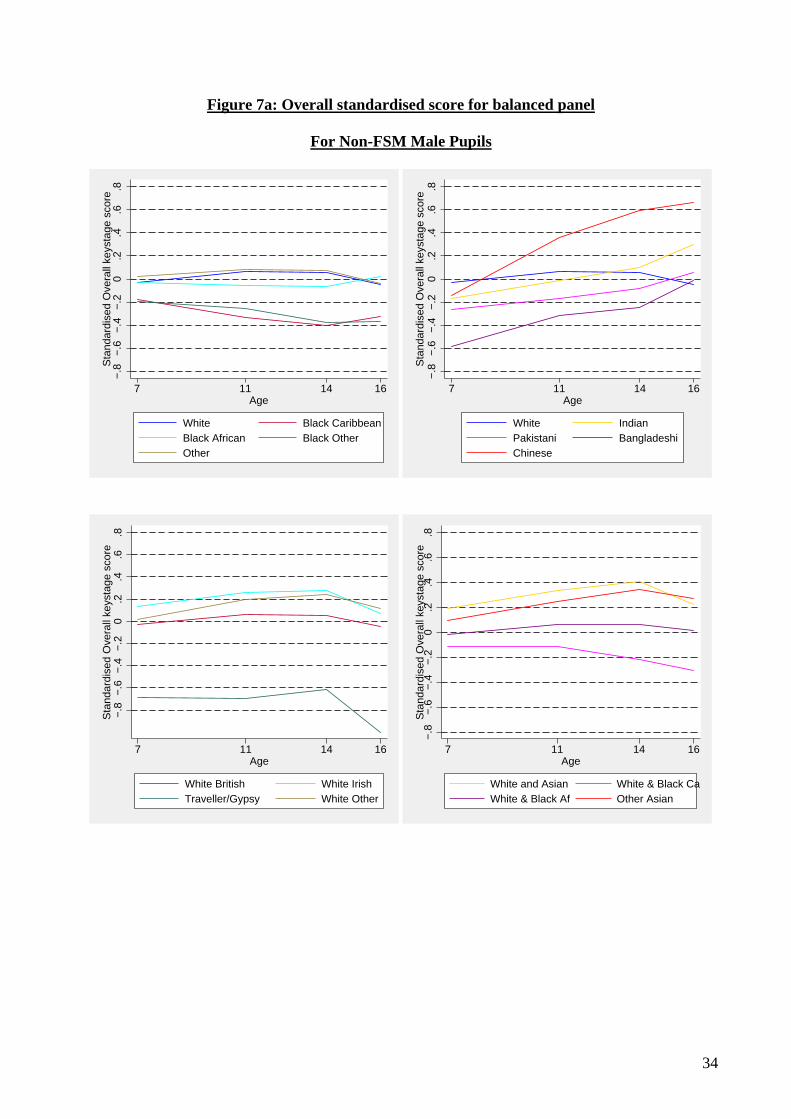
3 Results 3.1 We start this results section with the observation that the key results from our previous analyses are again found using the more recent data. 3.2 Here we briefly summarise these results, plus our additional findings, below, referencing the relevant Figures and Tables included in this report. 3.3 Raw attainment gaps By ethnicity: Figures 1a-b 3.3.1 We find that all quantitatively numerous minority ethnic groups show rapid progression, relative to White students, between KS3 and KS4 (top two panels of the Figures). The exceptions to this are the Mixed Heritage groups, White Irish and Traveller/Gypsy. This is one case in point where it is important to bear in mind the caveat on our results in cases where the groups contain very small numbers. 3.3.2 The South Asian groups make progress relative to White students throughout compulsory schooling, including Pakistani and Bangladeshi students who start from a low attainment level at KS1. 3.3.3 By contrast, Black Caribbean and Black Other groups exhibit a relative decline from the age of 7 to 14 (KS3), with the Black African trajectory much flatter. All three groups then progress faster on average between KS3 and KS4 as described above. 3.3.4 Notwithstanding the more rapid progress of most minority groups, the levels of attainment of some groups at age 16 are below that of White students on average. This is true for Black Caribbean; Black Other; Pakistani; Traveller/Gypsy; Mixed Heritage White and Black Caribbean; Mixed Heritage White and Black African. For some groups, the level is only marginally below white students, for others considerably so. By ethnicity and eligibility for free school meals (FSM): Figures 2a-b & 3a-b 3.3.5 When we additionally split the sample by FSM-eligibility, we find similar patterns to those described for the whole sample above. 3.3.6 The key point to note, across all ethnic groups, is the vertical shift downwards when comparing FSM-eligible students to those who are not eligible. By ethnicity and gender: Figures 4a-b & 5a-b 3.3.7 When we split the sample by gender, we find that female students, in general, achieve higher attainment levels at the age of 16 than male students.
v
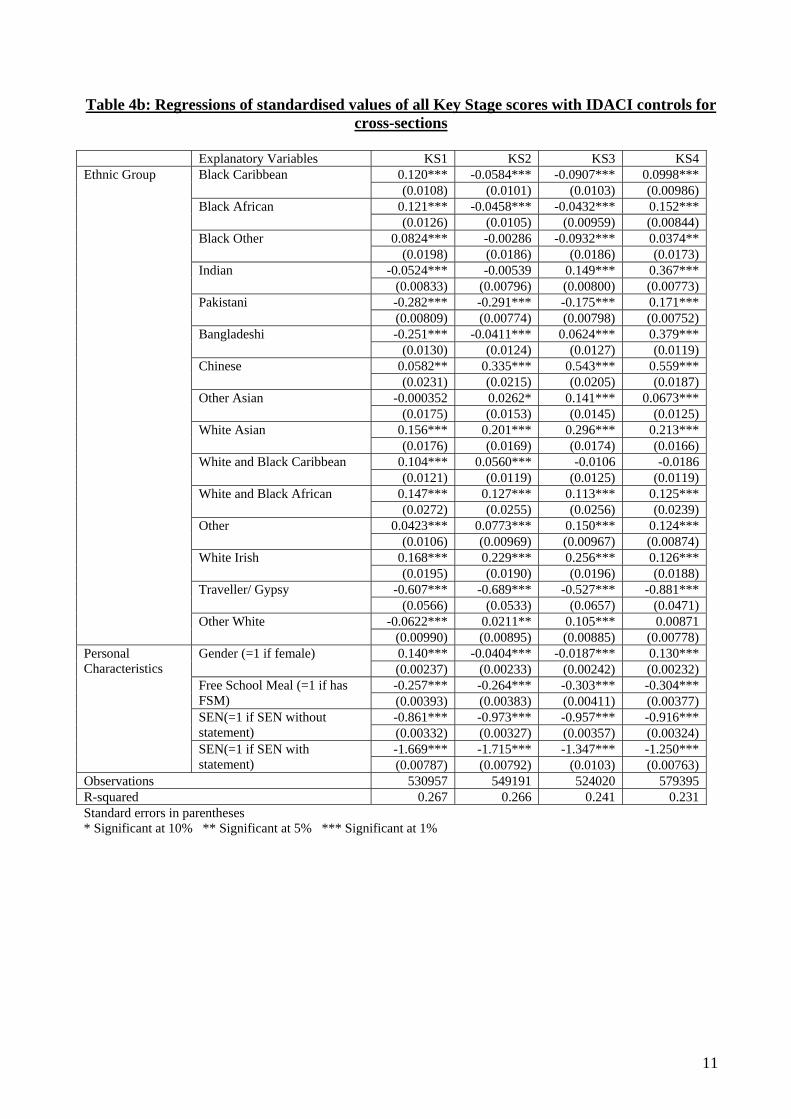
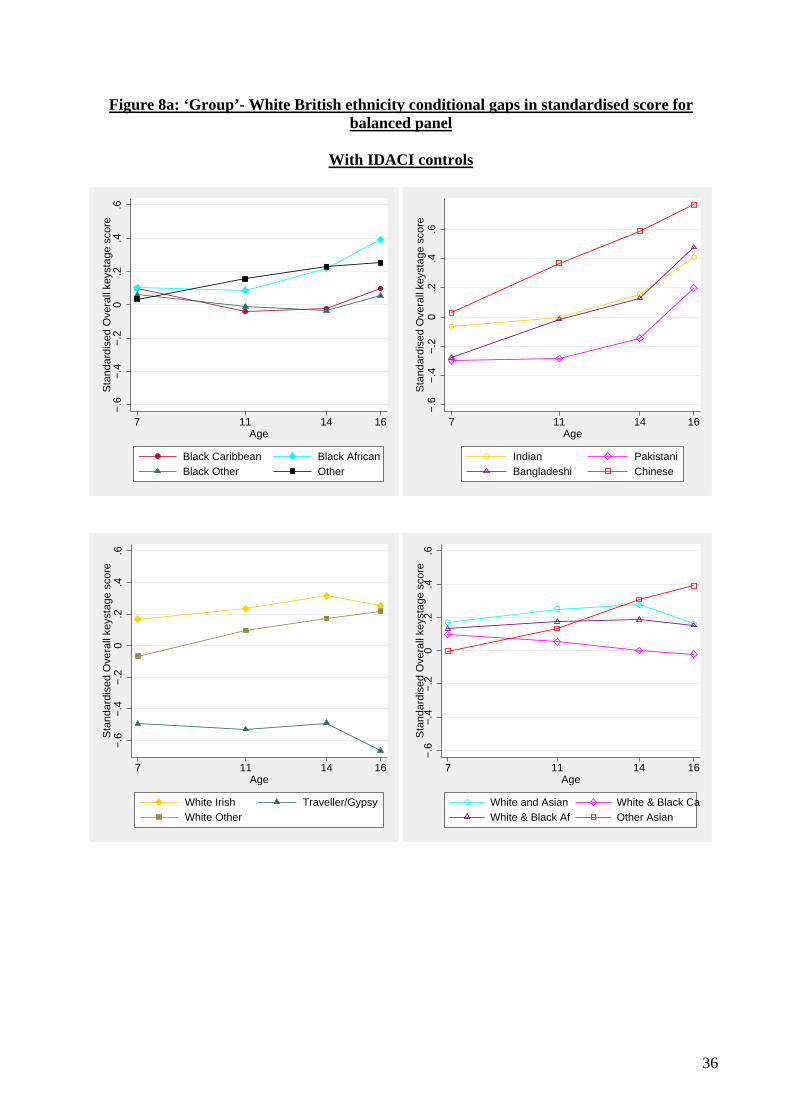
3.3.8 Much of their relative gain comes between the ages of 14 and 16, particularly among the South Asian groups, while the performance of White, Traveller/Gypsy and Mixed Heritage boys declines in this age range. By ethnicity, gender and FSM-eligibility: Figures 6a-b & 7a-b 3.3.9 The relative performance of FSM-eligible, White (British and Irish) boys declines through secondary school (ages 11-16), with no reversal in that trend after age 14. This is not the case for FSM-eligible White girls, nor for most minority ethnic FSM-eligible boys, who generally reverse the trend post-14. 3.3.10 In general, FSM-eligible female students progress faster than their male peers between KS3 and KS4. 3.4 Conditional attainment gaps 3.4.1 Following the same method as our earlier paper, we now include individual controls for gender, FSM status (as a proxy for poverty), month of birth, special educational needs (SEN) status, and two characterisations of neighbourhood, MOSAIC and the IDACI index of child deprivation. 3.4.2 In Table 2d we show the impact on the estimated ethnicity factors of adding these controls to the age 16 regression. Column 1 has no controls and so simply replicates the raw figures shown in Figure 1. We add individual controls in Column 2. Unsurprisingly, these add a lot to the explanatory power of the model – raising the R2 from 0.008 to 0.168. This change in the R2 makes an important point: ethnicity itself explains very little of the difference between scores, less than 1%. But including gender and poverty and the other variables raises this considerably. 3.4.3 We adopt specification 3 of Table 2d (which includes the IDACI index as our neighbourhood variable) and run this set of controls on tests at each Key Stage. The results are in Table 4a. Poverty has a significant, negative, effect at all test ages3. 3.4.4 These regressions produce a set of conditional ethnicity effects and for convenience we present the ethnicity coefficients from Table 4a graphically in Figure 8a. Since ‘White’ is the omitted category in the regressions, the lines should be compared to zero to judge relative progress. 3.4.5 Again, the results of our 2005 analysis are largely repeated for the KS1 – KS4 balanced panel: 3.4.6 South Asian groups progress faster than White students, regardless of their relative starting points at KS1.
3 Recall that we only measure the time-varying characteristics such as FSM-eligibility at one date, 2007.
vi
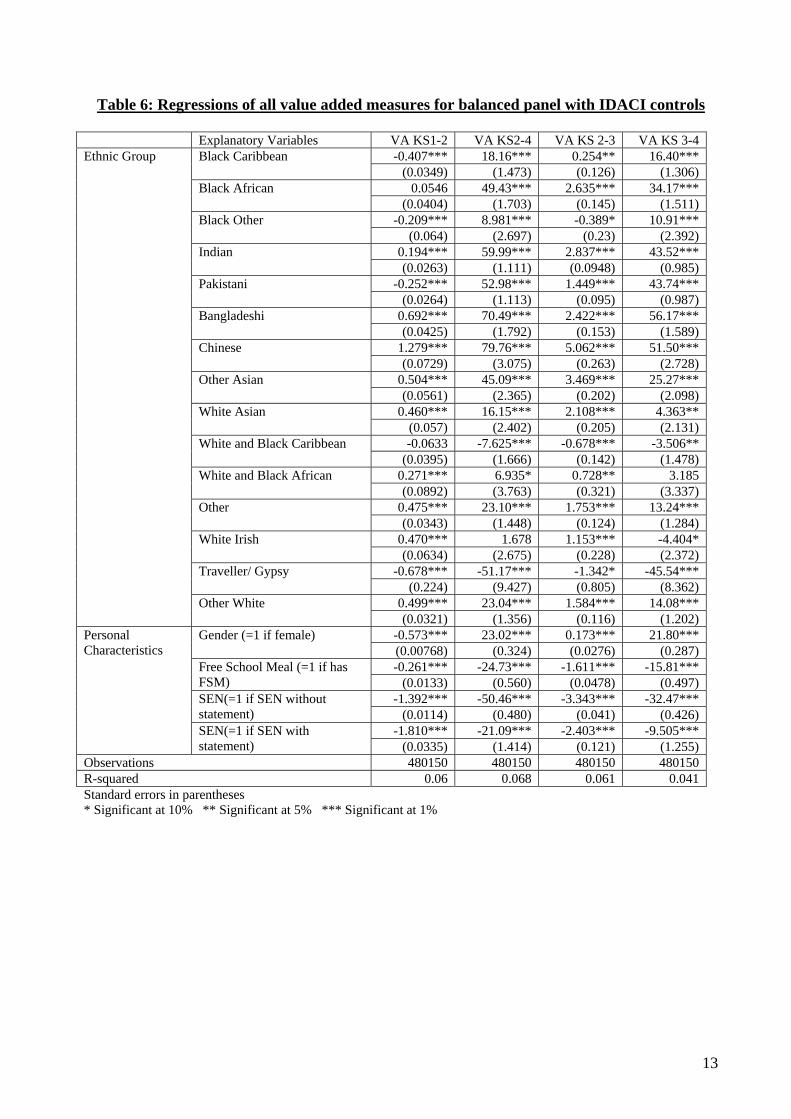
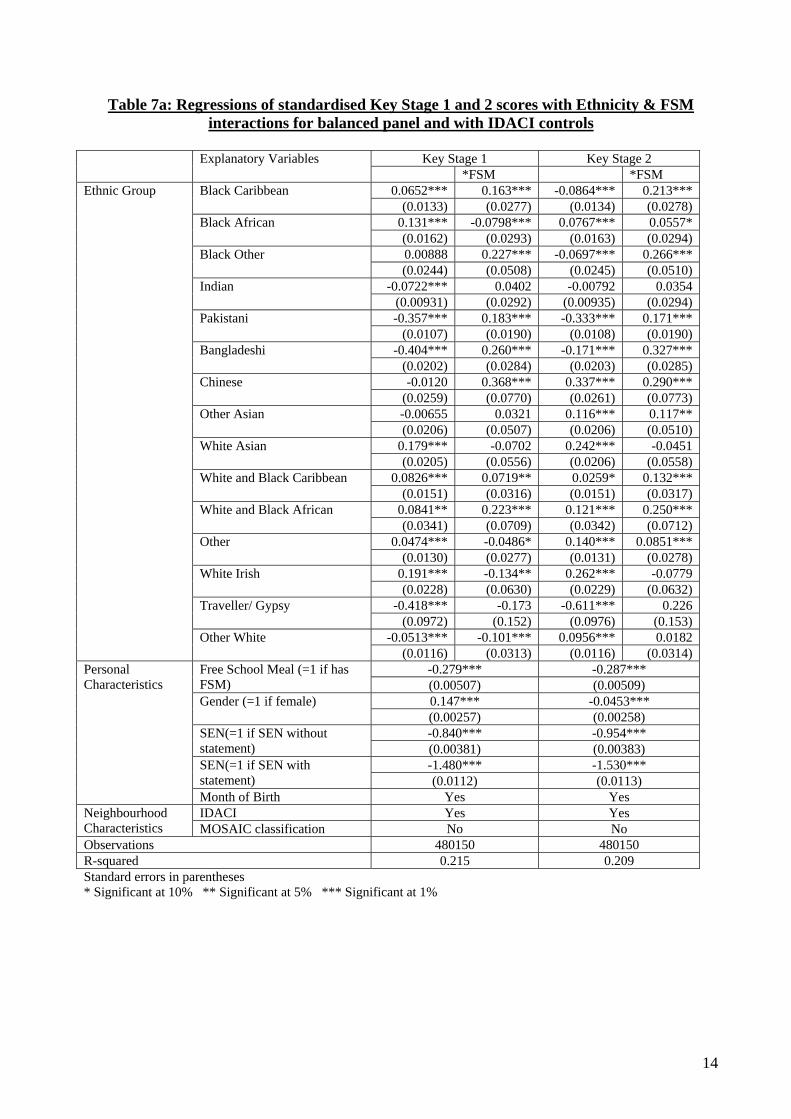
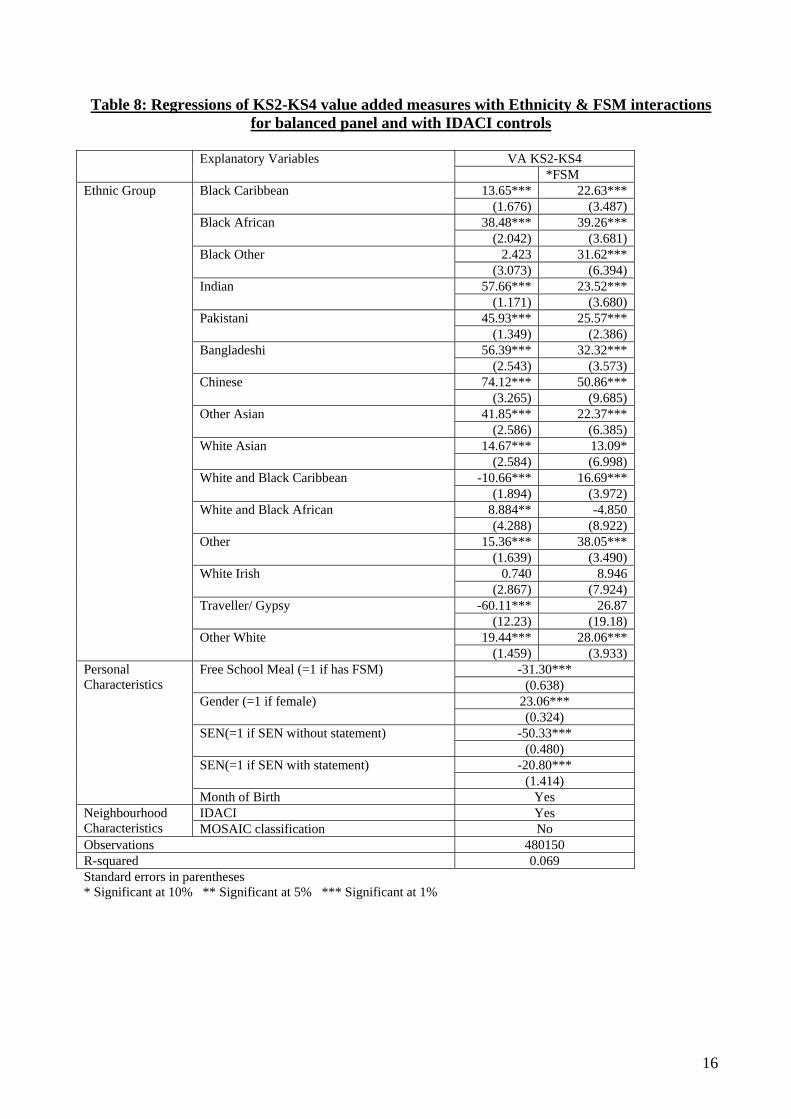
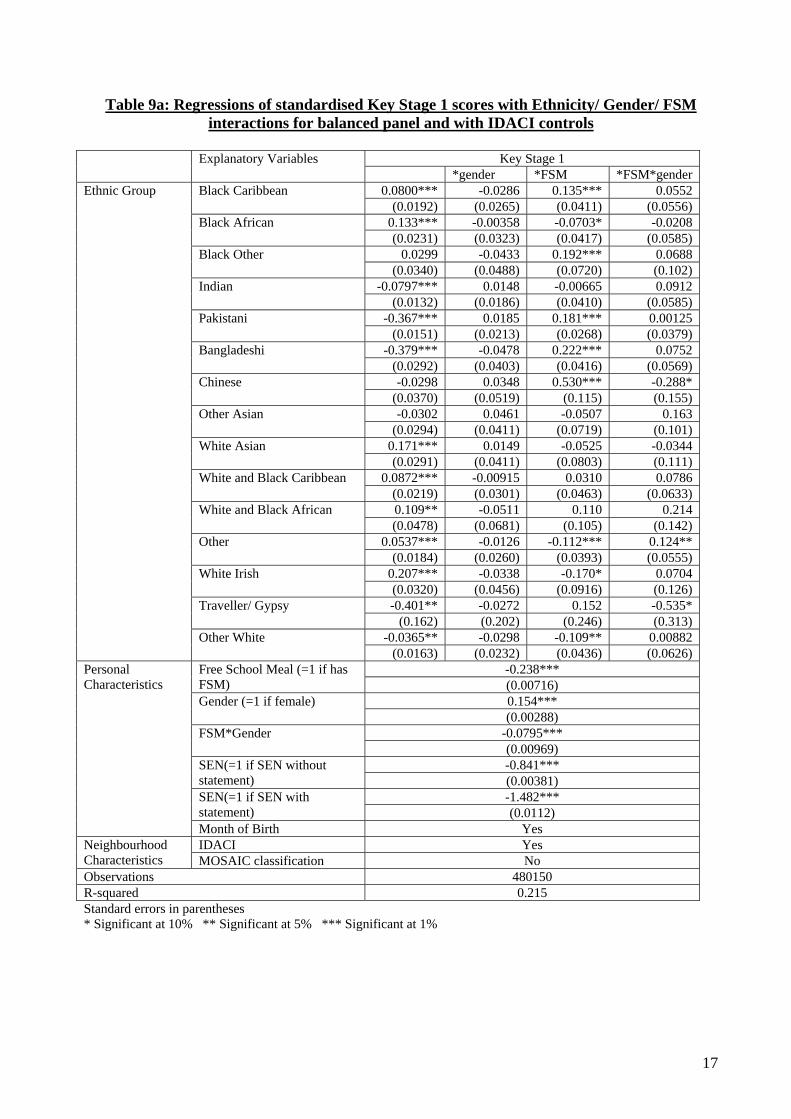
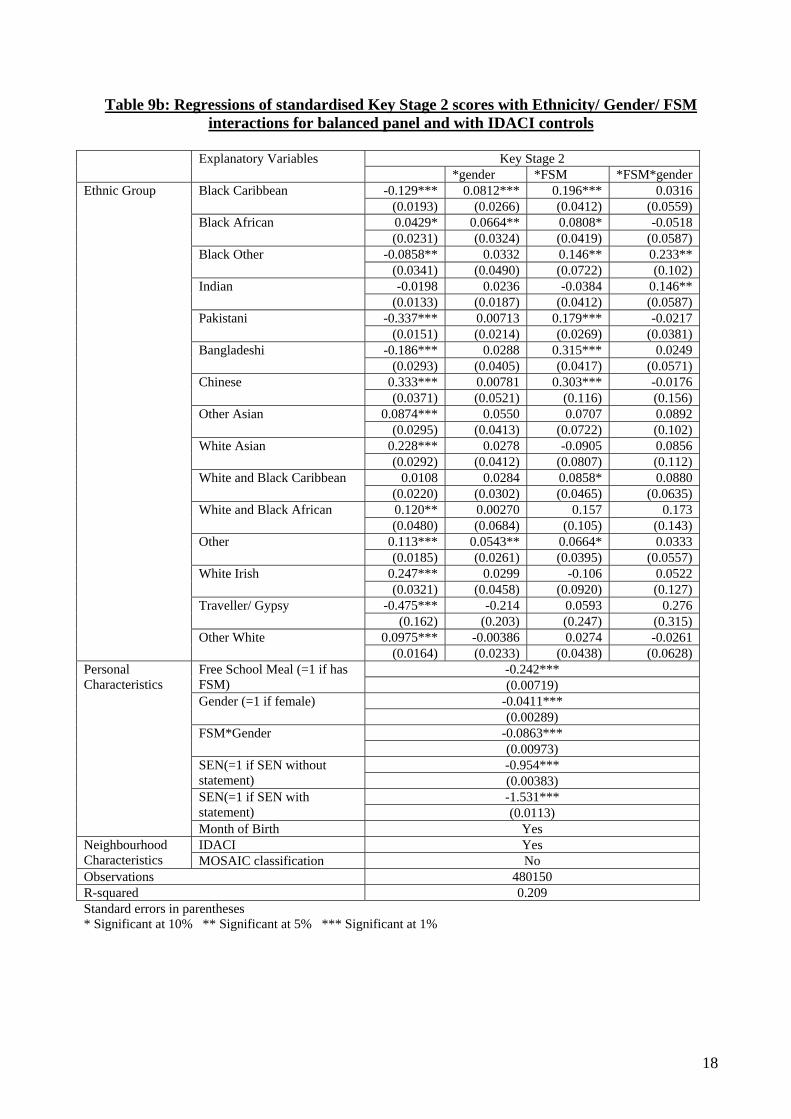
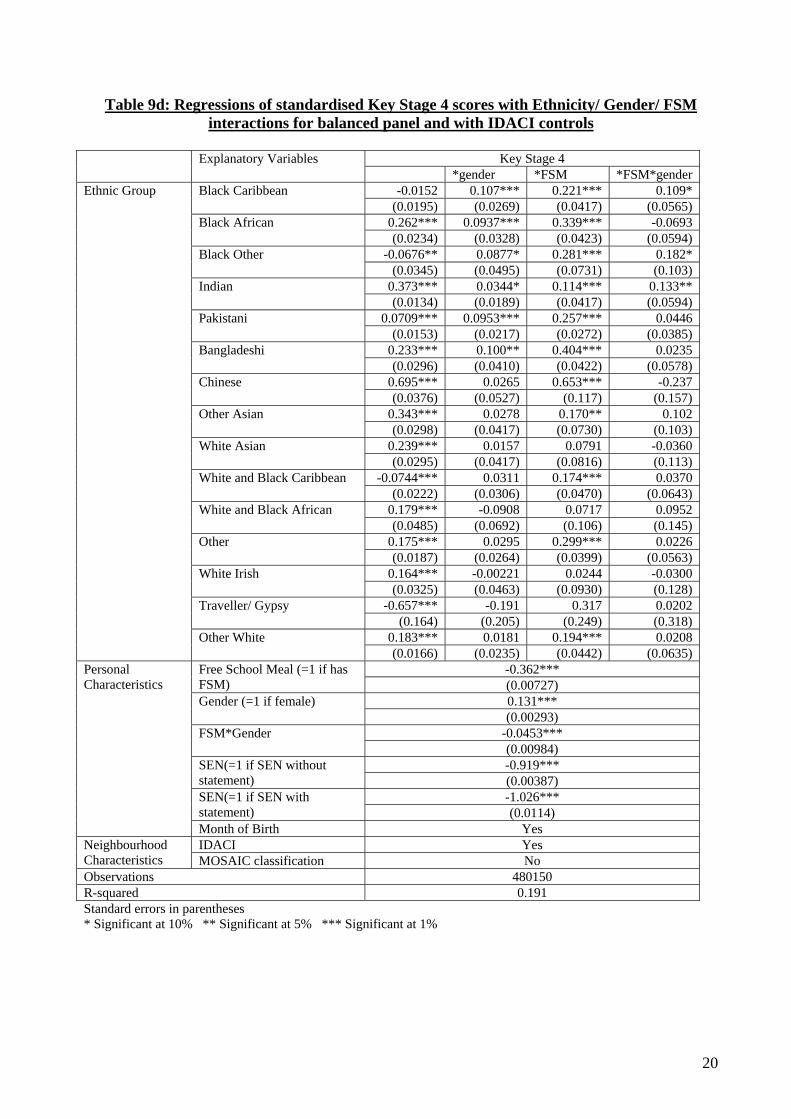
3.4.7 The picture for the Black groups is more mixed. While all Black groups start above Whites at KS1, the performance of Black Caribbean and Black Other students relatively declines on average until age 14, but they regain their advantage through more rapid progress between 14 and 16. Black African students on average perform better than their White peers throughout compulsory schooling, once individual factors are controlled for. 3.4.8 Conditional on these individual factors, White students are out-performed at KS4 by all other ethnic groups apart from Mixed Heritage White and Black Caribbean (marginally below) and Traveller/Gyspy (who through all analyses perform relatively extremely poorly). 3.5 Interaction of FSM-eligibility, gender and ethnicity 3.5.1 Using the same model as above, we now include dummy variables interacting ethnicity and FSM status. This is to allow the effect of FSM-eligibility on attainment to vary by ethnicity. 3.5.2 The results of the FSM interactions are shown in Tables 7a-b. They are consistent with the unconditional FSM and ethnicity test score gaps shown in Figures 2a-b and 3a-b. FSM-eligible pupils attain, on average, lower scores across all Key Stages and all ethnic groups, with the exception of Chinese and Bangladeshi students. For these two groups FSM status makes little difference to attainment. 3.5.3 To allow flexibility in the effect of FSM-eligibility across gender as well as ethnicity, we run a further model which includes ethnicity, FSM and gender interactions. 3.5.4 The results of the FSM and gender interactions with ethnicity are shown in Tables 9a-d. Many of the additional coefficients are insignificant, and, as there is no difference in the R2, it is clear that these interactions are not adding much explanatory power to the model. The results are largely consistent with Figures 6a-b and 7a-b, and highlight the poor and declining relative performance of FSM-eligible White boys through secondary school. 3.6 Value-added gaps 3.6.1 We now follow each pupil through the tests at different ages, and measure progress following the DfES (now DCSF) approach to value-added. Again, this replicates our 2005 methodology. We use GCSE points as the metric. 3.6.2 As expected, given the patterns of relative progress described so far, in general minority ethnic groups have higher value-added than White students on average, both between KS2 and KS4 and between KS3 and KS4 (see Table 6). 3.6.3 When we include interactions for FSM-eligibility with ethnicity, we confirm that the value-added of minority ethnic groups is higher relative to White pupils through secondary school (see Table 8).

vii
3.6.3 Finally, also including gender interactions as above suggests that this relative slow progress between KS2 and KS4 among White students is particularly strong among FSM-eligible boys (see Table 10).
viii
Contents
Tables Page Table 1 1 Sample Sizes by Ethnicity, Gender & FSM 2 2a Regressions of standardised values of Key Stage 1 scores for balanced panel 3 2b Regressions of standardised values of Key Stage 2 scores for balanced panel 4 2c Regressions of standardised values of Key Stage 3 scores for balanced panel 5 2d Regressions of standardised values of Key Stage 4 scores for balanced panel 6 3a Regressions of standardised values of Key Stage 1 scores for cross-sections 7 3b Regressions of standardised values of Key Stage 2 scores for cross-sections 8 3c Regressions of standardised values of Key Stage 3 scores for cross-sections 9 3d Regressions of standardised values of Key Stage 4 scores for cross-sections 10 4a Regressions of standardised values of all Key Stage scores with IDACI controls
for balanced panel 11 4b Regressions of standardised values of all Key Stage scores with IDACI controls
for cross-sections 12 5 Regressions of Key Stage 2 to 4 value added for balanced panel 13 6 Regressions of all value added measures for balanced panel with IDACI controls 14 7a Regressions of standardised Key Stage 1 and 2 scores with Ethnicity & FSM
interactions for balanced panel and with IDACI controls 15 7b Regressions of standardised Key Stage 3 and 4 scores with Ethnicity & FSM
interactions for balanced panel and with IDACI controls 16 8 Regressions of KS2-KS4 value added measures with Ethnicity & FSM
interactions for balanced panel and with IDACI controls 17 9a Regression of standardised Key Stage 1 scores with Ethnicity/ Gender/ FSM
interactions for cross-sections and with IDACI controls 18 9b Regression of standardised Key Stage 2 scores with Ethnicity/ Gender/ FSM
interactions for cross-sections and with IDACI controls 19 9c Regression of standardised Key Stage 3 scores with Ethnicity/ Gender/ FSM
interactions for cross-sections and with IDACI controls 20 9d Regression of standardised Key Stage 4 scores with Ethnicity/ Gender/ FSM
interactions for cross-sections and with IDACI controls 21 10 Regression of KS2-KS4 value added measures with Ethnicity/ Gender/ FSM
interactions for balanced panel and with IDACI controls Figures Page Figure 22 1a Overall standardised score by ethnicity for balanced panel 23 1b Overall standardised score by ethnicity for cross-sections 24 2a Pupils with FSM status – Overall standardised score by ethnicity for
balanced panel 25 2b Pupils with FSM status – Overall standardised score by ethnicity for
cross-sections 26 3a Pupils without FSM status – Overall standardised score by ethnicity
ix
for balanced panel 27 3b Pupils without FSM status – Overall standardised score by ethnicity
for cross-sections 28 4a Male Pupils – Overall standardised score by ethnicity for balanced
panel 29 4b Male Pupils – Overall standardised score by ethnicity for cross-
sections 30 5a Female Pupils – Overall standardised score by ethnicity for balanced
panel 31 5b Female Pupils – Overall standardised score by ethnicity for cross-
sections 32 6a Male Pupils with FSM status – Overall standardised score by
ethnicity for balanced panel 33 6b Female Pupils with FSM status – Overall standardised score by
ethnicity for balanced panel 34 7a Male Pupils without FSM status – Overall standardised score by
ethnicity for balanced panel 35 7b Female Pupils without FSM status – Overall standardised score by
ethnicity for balanced panel 36 8a ‘Group’- White British ethnicity conditional gaps in standardised
score for balanced panel with IDACI controls 37 8b ‘Group’- White British ethnicity conditional gaps in standardised
score for cross-sections with IDACI controls 38 9a ‘Group’- White British ethnicity conditional gaps in standardised
score for balanced panel with MOSAIC controls 39 9b ‘Group’- White British ethnicity conditional gaps in standardised
score for cross-sections with MOSAIC controls 40 10a ‘Group’- White British ethnicity conditional gaps in standardised
score for balanced panel without neighbourhood controls 41 10b ‘Group’- White British ethnicity conditional gaps in standardised
score for cross-sections without neighbourhood controls Appendix Tables Page Table 42 A1 Sample Size – Balanced Panel as % of all observations at key-stage 43 A2 Observations missing some Key Stage score data before age 14 Appendix Figures Page Figure 44 A1 Attainment of Black African pupils

1
Table 1: Sample Sizes by Ethnicity, Gender & FSM
Ethnicity
Sample Size (Balanced Panel)
Male FSM Female FSMMale Non-
FSMFemale Non-
FSM TotalPercentage of sample
(Balanced Panel) Black Caribbean 618 763 2,177 2,375 5,933 1.23Black African 678 705 1,505 1,545 4,433 0.92Black Other 198 205 691 642 1,736 0.36Indian 537 515 4,623 4,696 10,371 2.15Pakistani 1,763 1,750 3,549 3,493 10,555 2.19Bangladeshi 948 1,134 930 1,017 4,029 0.84Chinese 68 84 579 595 1,326 0.28Other Asian 185 186 916 960 2,247 0.47White and Asian 143 155 936 941 2,175 0.45White and Black Caribbean 487 568 1,665 1,861 4,581 0.95White and Black African 91 113 347 337 888 0.18Other 675 684 2,362 2,356 6,077 1.26White British 17,565 19,285 191,041 190,763 418,654 86.89White Irish 107 123 775 750 1,755 0.36Traveller/Gypsy 23 35 30 53 141 0.03Other White 497 462 3,004 2,954 6,917 1.44Total 24,583 26,767 215,130 215,338 481,818 100.00

2
Table 2a: Regressions of standardised values of Key Stage 1 scores for balanced panel
Explanatory Variables (1) (2) (3) (4) Ethnic Group Black Caribbean -0.168*** -0.0215* 0.101*** 0.0188
(0.0130) (0.0117) (0.0117) (0.0121) Black African -0.200*** -0.0459*** 0.103*** -0.0144
(0.0150) (0.0135) (0.0135) (0.0143) Black Other -0.191*** -0.0632*** 0.0594*** -0.00848
(0.0239) (0.0215) (0.0214) (0.0216) Indian -0.0665*** -0.0981*** -0.0683*** -0.110***
(0.00989) (0.00890) (0.00883) (0.00958) Pakistani -0.530*** -0.385*** -0.301*** -0.354***
(0.00981) (0.00888) (0.00885) (0.0103) Bangladeshi -0.596*** -0.416*** -0.277*** -0.397***
(0.0157) (0.0143) (0.0142) (0.0149) Chinese 0.0570** -0.00217 0.0295 -0.0201
(0.0274) (0.0246) (0.0244) (0.0246) Other Asian -0.0481** -0.0493*** -0.00255 -0.0697***
(0.0210) (0.0189) (0.0188) (0.0190) White Asian 0.140*** 0.155*** 0.168*** 0.126***
(0.0214) (0.0192) (0.0191) (0.0191) White and Black Caribbean -0.101*** 0.0233* 0.0968*** 0.0767***
(0.0148) (0.0133) (0.0132) (0.0133) White and Black African -0.0364 0.0606** 0.133*** 0.0835***
(0.0334) (0.0301) (0.0299) (0.0299) Other -0.117*** -0.0273** 0.0342*** -0.0350***
(0.0129) (0.0116) (0.0115) (0.0117) White Irish 0.0993*** 0.137*** 0.172*** 0.116***
(0.0238) (0.0214) (0.0213) (0.0212) Traveller/ Gypsy -0.847*** -0.490*** -0.494*** -0.443***
(0.0838) (0.0754) (0.0749) (0.0744) Other White -0.126*** -0.0928*** -0.0661*** -0.142***
(0.0121) (0.0109) (0.0108) (0.0109) Personal Characteristics
Gender (=1 if female) 0.141*** 0.147*** 0.150*** (0.00259) (0.00257) (0.00257)
Free School Meal (=1 if has FSM)
-0.385*** -0.259*** -0.239*** (0.00430) (0.00445) (0.00446)
SEN(=1 if SEN without statement)
-0.879*** -0.841*** -0.826*** (0.00383) (0.00381) (0.00382)
SEN(=1 if SEN with statement)
-1.498*** -1.481*** -1.471*** (0.0113) (0.0112) (0.0113)
Month of Birth No Yes Yes Yes Neighbourhood Characteristics
IDACI No No Yes No MOSAIC classification No No No Yes
Observations R-squared
481818 481818 480150 470389 0.010 0.199 0.215 0.231
Standard errors in parentheses * Significant at 10% ** Significant at 5% *** Significant at 1%
3
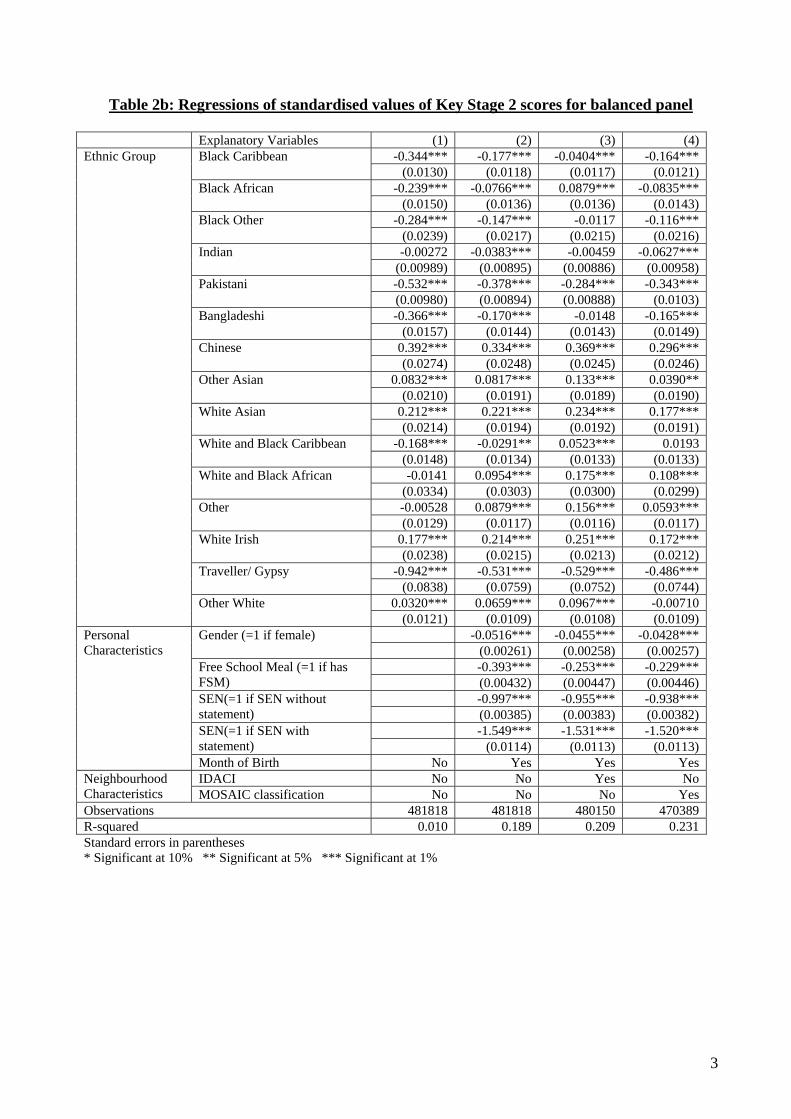
Table 2b: Regressions of standardised values of Key Stage 2 scores for balanced panel
Explanatory Variables (1) (2) (3) (4) Ethnic Group Black Caribbean -0.344*** -0.177*** -0.0404*** -0.164***
(0.0130) (0.0118) (0.0117) (0.0121) Black African -0.239*** -0.0766*** 0.0879*** -0.0835***
(0.0150) (0.0136) (0.0136) (0.0143) Black Other -0.284*** -0.147*** -0.0117 -0.116***
(0.0239) (0.0217) (0.0215) (0.0216) Indian -0.00272 -0.0383*** -0.00459 -0.0627***
(0.00989) (0.00895) (0.00886) (0.00958) Pakistani -0.532*** -0.378*** -0.284*** -0.343***
(0.00980) (0.00894) (0.00888) (0.0103) Bangladeshi -0.366*** -0.170*** -0.0148 -0.165***
(0.0157) (0.0144) (0.0143) (0.0149) Chinese 0.392*** 0.334*** 0.369*** 0.296***
(0.0274) (0.0248) (0.0245) (0.0246) Other Asian 0.0832*** 0.0817*** 0.133*** 0.0390**
(0.0210) (0.0191) (0.0189) (0.0190) White Asian 0.212*** 0.221*** 0.234*** 0.177***
(0.0214) (0.0194) (0.0192) (0.0191) White and Black Caribbean -0.168*** -0.0291** 0.0523*** 0.0193
(0.0148) (0.0134) (0.0133) (0.0133) White and Black African -0.0141 0.0954*** 0.175*** 0.108***
(0.0334) (0.0303) (0.0300) (0.0299) Other -0.00528 0.0879*** 0.156*** 0.0593***
(0.0129) (0.0117) (0.0116) (0.0117) White Irish 0.177*** 0.214*** 0.251*** 0.172***
(0.0238) (0.0215) (0.0213) (0.0212) Traveller/ Gypsy -0.942*** -0.531*** -0.529*** -0.486***
(0.0838) (0.0759) (0.0752) (0.0744) Other White 0.0320*** 0.0659*** 0.0967*** -0.00710
(0.0121) (0.0109) (0.0108) (0.0109) Personal Characteristics
Gender (=1 if female) -0.0516*** -0.0455*** -0.0428*** (0.00261) (0.00258) (0.00257)
Free School Meal (=1 if has FSM)
-0.393*** -0.253*** -0.229*** (0.00432) (0.00447) (0.00446)
SEN(=1 if SEN without statement)
-0.997*** -0.955*** -0.938*** (0.00385) (0.00383) (0.00382)
SEN(=1 if SEN with statement)
-1.549*** -1.531*** -1.520*** (0.0114) (0.0113) (0.0113)
Month of Birth No Yes Yes Yes Neighbourhood Characteristics
IDACI No No Yes No MOSAIC classification No No No Yes
Observations 481818 481818 480150 470389 R-squared 0.010 0.189 0.209 0.231 Standard errors in parentheses * Significant at 10% ** Significant at 5% *** Significant at 1%
4
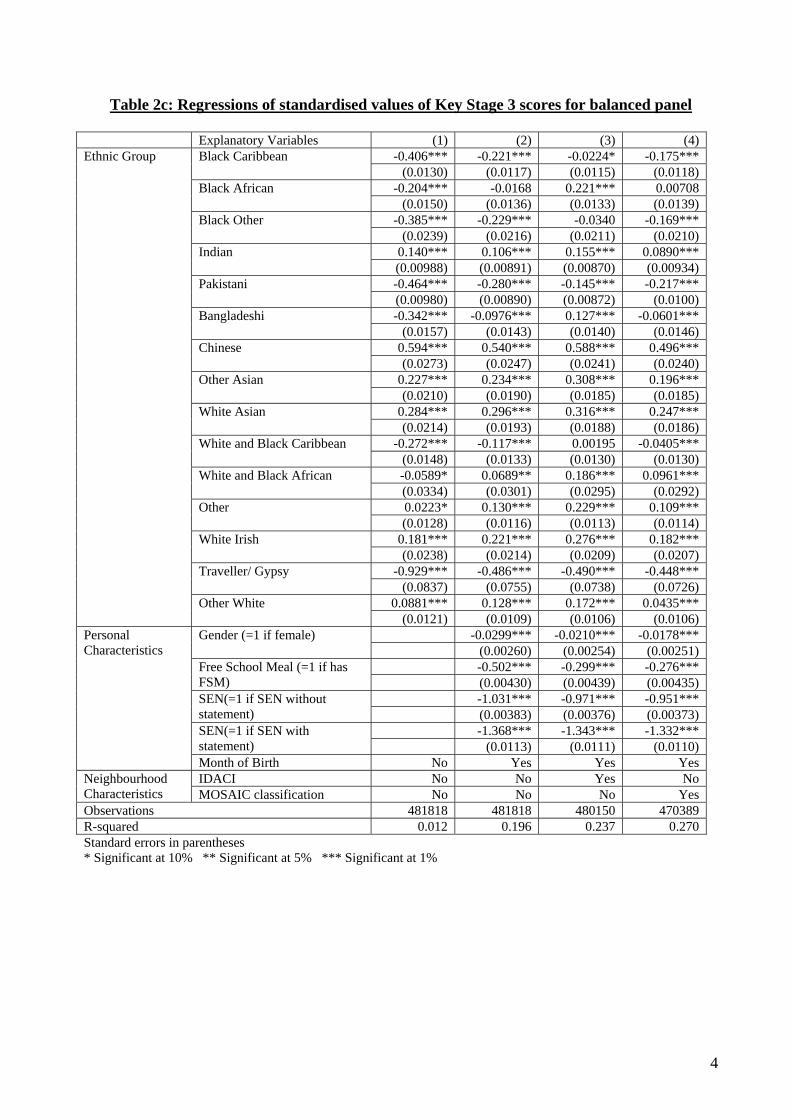
Table 2c: Regressions of standardised values of Key Stage 3 scores for balanced panel
Explanatory Variables (1) (2) (3) (4) Ethnic Group Black Caribbean -0.406*** -0.221*** -0.0224* -0.175***
(0.0130) (0.0117) (0.0115) (0.0118) Black African -0.204*** -0.0168 0.221*** 0.00708
(0.0150) (0.0136) (0.0133) (0.0139) Black Other -0.385*** -0.229*** -0.0340 -0.169***
(0.0239) (0.0216) (0.0211) (0.0210) Indian 0.140*** 0.106*** 0.155*** 0.0890***
(0.00988) (0.00891) (0.00870) (0.00934) Pakistani -0.464*** -0.280*** -0.145*** -0.217***
(0.00980) (0.00890) (0.00872) (0.0100) Bangladeshi -0.342*** -0.0976*** 0.127*** -0.0601***
(0.0157) (0.0143) (0.0140) (0.0146) Chinese 0.594*** 0.540*** 0.588*** 0.496***
(0.0273) (0.0247) (0.0241) (0.0240) Other Asian 0.227*** 0.234*** 0.308*** 0.196***
(0.0210) (0.0190) (0.0185) (0.0185) White Asian 0.284*** 0.296*** 0.316*** 0.247***
(0.0214) (0.0193) (0.0188) (0.0186) White and Black Caribbean -0.272*** -0.117*** 0.00195 -0.0405***
(0.0148) (0.0133) (0.0130) (0.0130) White and Black African -0.0589* 0.0689** 0.186*** 0.0961***
(0.0334) (0.0301) (0.0295) (0.0292) Other 0.0223* 0.130*** 0.229*** 0.109***
(0.0128) (0.0116) (0.0113) (0.0114) White Irish 0.181*** 0.221*** 0.276*** 0.182***
(0.0238) (0.0214) (0.0209) (0.0207) Traveller/ Gypsy -0.929*** -0.486*** -0.490*** -0.448***
(0.0837) (0.0755) (0.0738) (0.0726) Other White 0.0881*** 0.128*** 0.172*** 0.0435***
(0.0121) (0.0109) (0.0106) (0.0106) Personal Characteristics
Gender (=1 if female) -0.0299*** -0.0210*** -0.0178*** (0.00260) (0.00254) (0.00251)
Free School Meal (=1 if has FSM)
-0.502*** -0.299*** -0.276*** (0.00430) (0.00439) (0.00435)
SEN(=1 if SEN without statement)
-1.031*** -0.971*** -0.951*** (0.00383) (0.00376) (0.00373)
SEN(=1 if SEN with statement)
-1.368*** -1.343*** -1.332*** (0.0113) (0.0111) (0.0110)
Month of Birth No Yes Yes Yes Neighbourhood Characteristics
IDACI No No Yes No MOSAIC classification No No No Yes
Observations 481818 481818 480150 470389 R-squared 0.012 0.196 0.237 0.270 Standard errors in parentheses * Significant at 10% ** Significant at 5% *** Significant at 1%

5
Table 2d: Regressions of standardised values of Key Stage 4 scores for balanced panel
Explanatory Variables (1) (2) (3) (4) Ethnic Group Black Caribbean -0.213*** -0.0443*** 0.0993*** 0.0257**
(0.0130) (0.0119) (0.0119) (0.0122) Black African 0.0484*** 0.220*** 0.392*** 0.281***
(0.0150) (0.0138) (0.0138) (0.0145) Black Other -0.234*** -0.0859*** 0.0545** -0.0110
(0.0240) (0.0220) (0.0218) (0.0218) Indian 0.404*** 0.373*** 0.408*** 0.364***
(0.00990) (0.00907) (0.00897) (0.00968) Pakistani -0.0729*** 0.0989*** 0.197*** 0.145***
(0.00982) (0.00905) (0.00899) (0.0104) Bangladeshi 0.0912*** 0.315*** 0.476*** 0.357***
(0.0158) (0.0146) (0.0145) (0.0151) Chinese 0.780*** 0.731*** 0.766*** 0.710***
(0.0274) (0.0251) (0.0248) (0.0249) Other Asian 0.330*** 0.336*** 0.389*** 0.319***
(0.0211) (0.0193) (0.0191) (0.0192) White Asian 0.230*** 0.238*** 0.252*** 0.205***
(0.0214) (0.0196) (0.0194) (0.0193) White and Black Caribbean -0.247*** -0.107*** -0.0215 -0.0293**
(0.0148) (0.0136) (0.0134) (0.0135) White and Black African -0.0519 0.0671** 0.154*** 0.118***
(0.0335) (0.0307) (0.0304) (0.0302) Other 0.0804*** 0.180*** 0.252*** 0.186***
(0.0129) (0.0118) (0.0117) (0.0118) White Irish 0.0829*** 0.120*** 0.162*** 0.107***
(0.0238) (0.0218) (0.0216) (0.0215) Traveller/ Gypsy -1.033*** -0.650*** -0.664*** -0.616***
(0.0839) (0.0769) (0.0761) (0.0752) Other White 0.146*** 0.185*** 0.217*** 0.141***
(0.0121) (0.0111) (0.0109) (0.0110) Personal Characteristics
Gender (=1 if female) 0.127*** 0.134*** 0.138*** (0.00264) (0.00261) (0.00260)
Free School Meal (=1 if has FSM)
-0.468*** -0.321*** -0.284*** (0.00438) (0.00452) (0.00451)
SEN(=1 if SEN without statement)
-0.965*** -0.920*** -0.897*** (0.00390) (0.00388) (0.00386)
SEN(=1 if SEN with statement)
-1.048*** -1.028*** -1.014*** (0.0115) (0.0114) (0.0114)
Month of Birth No Yes Yes Yes Neighbourhood Characteristics
IDACI No No Yes No MOSAIC classification No No No Yes
Observations 481818 481818 480150 470389 R-squared 0.008 0.168 0.190 0.214 Standard errors in parentheses * Significant at 10% ** Significant at 5% *** Significant at 1%
6
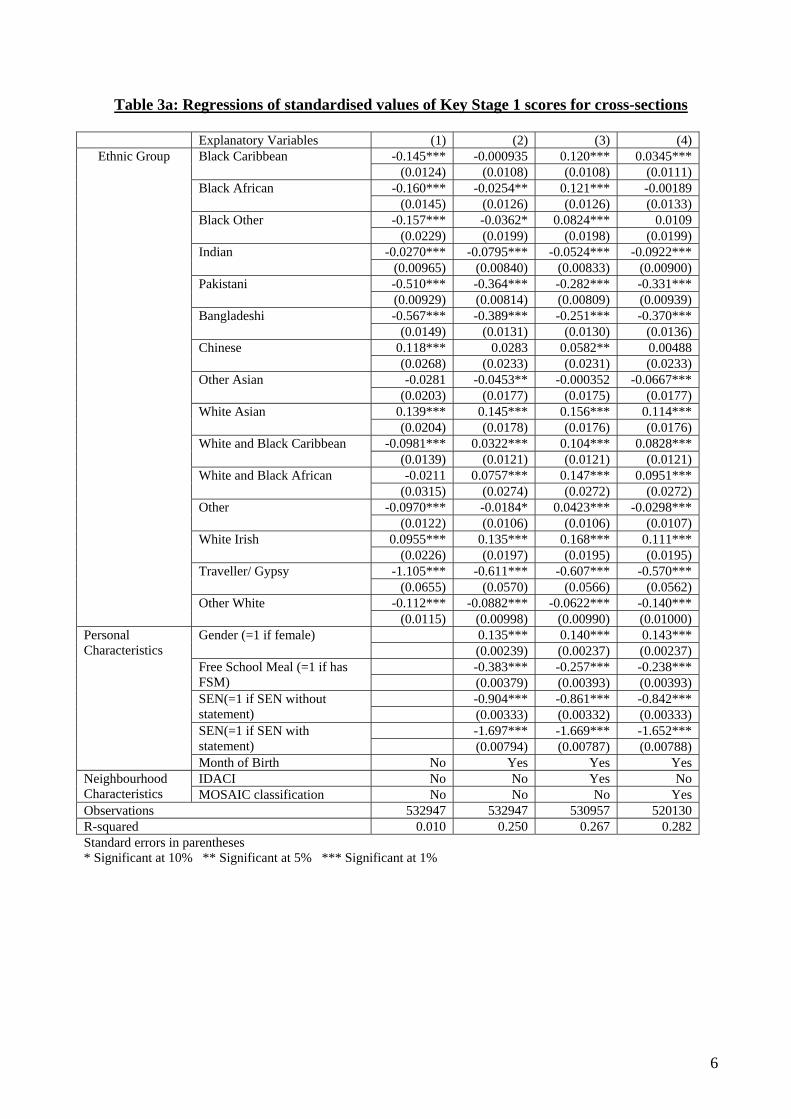
Table 3a: Regressions of standardised values of Key Stage 1 scores for cross-sections Explanatory Variables (1) (2) (3) (4)
Ethnic Group Black Caribbean -0.145*** -0.000935 0.120*** 0.0345*** (0.0124) (0.0108) (0.0108) (0.0111)
Black African -0.160*** -0.0254** 0.121*** -0.00189 (0.0145) (0.0126) (0.0126) (0.0133)
Black Other -0.157*** -0.0362* 0.0824*** 0.0109 (0.0229) (0.0199) (0.0198) (0.0199)
Indian -0.0270*** -0.0795*** -0.0524*** -0.0922*** (0.00965) (0.00840) (0.00833) (0.00900)
Pakistani -0.510*** -0.364*** -0.282*** -0.331*** (0.00929) (0.00814) (0.00809) (0.00939)
Bangladeshi -0.567*** -0.389*** -0.251*** -0.370*** (0.0149) (0.0131) (0.0130) (0.0136)
Chinese 0.118*** 0.0283 0.0582** 0.00488 (0.0268) (0.0233) (0.0231) (0.0233)
Other Asian -0.0281 -0.0453** -0.000352 -0.0667*** (0.0203) (0.0177) (0.0175) (0.0177)
White Asian 0.139*** 0.145*** 0.156*** 0.114*** (0.0204) (0.0178) (0.0176) (0.0176)
White and Black Caribbean -0.0981*** 0.0322*** 0.104*** 0.0828*** (0.0139) (0.0121) (0.0121) (0.0121)
White and Black African -0.0211 0.0757*** 0.147*** 0.0951*** (0.0315) (0.0274) (0.0272) (0.0272)
Other -0.0970*** -0.0184* 0.0423*** -0.0298*** (0.0122) (0.0106) (0.0106) (0.0107)
White Irish 0.0955*** 0.135*** 0.168*** 0.111*** (0.0226) (0.0197) (0.0195) (0.0195)
Traveller/ Gypsy -1.105*** -0.611*** -0.607*** -0.570*** (0.0655) (0.0570) (0.0566) (0.0562)
Other White -0.112*** -0.0882*** -0.0622*** -0.140*** (0.0115) (0.00998) (0.00990) (0.01000)
Personal Characteristics
Gender (=1 if female) 0.135*** 0.140*** 0.143*** (0.00239) (0.00237) (0.00237)
Free School Meal (=1 if has FSM)
-0.383*** -0.257*** -0.238*** (0.00379) (0.00393) (0.00393)
SEN(=1 if SEN without statement)
-0.904*** -0.861*** -0.842*** (0.00333) (0.00332) (0.00333)
SEN(=1 if SEN with statement)
-1.697*** -1.669*** -1.652*** (0.00794) (0.00787) (0.00788)
Month of Birth No Yes Yes Yes Neighbourhood Characteristics
IDACI No No Yes No MOSAIC classification No No No Yes
Observations 532947 532947 530957 520130 R-squared 0.010 0.250 0.267 0.282 Standard errors in parentheses * Significant at 10% ** Significant at 5% *** Significant at 1%

7
Table 3b: Regressions of standardised values of Key Stage 2 scores for cross-sections
Explanatory Variables (1) (2) (3) (4) Ethnic Group Black Caribbean -0.370*** -0.192*** -0.0584*** -0.181***
(0.0116) (0.0101) (0.0101) (0.0104) Black African -0.363*** -0.200*** -0.0458*** -0.207***
(0.0120) (0.0105) (0.0105) (0.0111) Black Other -0.268*** -0.131*** -0.00286 -0.106***
(0.0214) (0.0187) (0.0186) (0.0186) Indian 0.0208** -0.0356*** -0.00539 -0.0605***
(0.00921) (0.00805) (0.00796) (0.00856) Pakistani -0.540*** -0.380*** -0.291*** -0.345***
(0.00886) (0.00780) (0.00774) (0.00889) Bangladeshi -0.397*** -0.193*** -0.0411*** -0.186***
(0.0142) (0.0125) (0.0124) (0.0130) Chinese 0.394*** 0.303*** 0.335*** 0.264***
(0.0249) (0.0217) (0.0215) (0.0216) Other Asian -0.0237 -0.0238 0.0262* -0.0608***
(0.0177) (0.0155) (0.0153) (0.0154) White Asian 0.186*** 0.189*** 0.201*** 0.144***
(0.0195) (0.0171) (0.0169) (0.0168) White and Black Caribbean -0.169*** -0.0232* 0.0560*** 0.0235**
(0.0137) (0.0120) (0.0119) (0.0119) White and Black African -0.0501* 0.0538** 0.127*** 0.0607**
(0.0295) (0.0258) (0.0255) (0.0255) Other -0.0853*** 0.0101 0.0773*** -0.0209**
(0.0112) (0.00978) (0.00969) (0.00981) White Irish 0.158*** 0.192*** 0.229*** 0.151***
(0.0219) (0.0192) (0.0190) (0.0189) Traveller/ Gypsy -1.243*** -0.716*** -0.689*** -0.673***
(0.0613) (0.0536) (0.0533) (0.0526) Other White -0.0529*** -0.0141 0.0211** -0.0810***
(0.0103) (0.00904) (0.00895) (0.00903) Personal Characteristics
Gender (=1 if female) -0.0462*** -0.0404*** -0.0380*** (0.00236) (0.00233) (0.00232)
Free School Meal (=1 if has FSM)
-0.401*** -0.264*** -0.240*** (0.00370) (0.00383) (0.00383)
SEN(=1 if SEN without statement)
-1.020*** -0.973*** -0.953*** (0.00328) (0.00327) (0.00326)
SEN(=1 if SEN with statement)
-1.744*** -1.715*** -1.696*** (0.00800) (0.00792) (0.00790)
Month of Birth No Yes Yes Yes Neighbourhood Characteristics
IDACI No No Yes No MOSAIC classification No No No Yes
Observations 551267 551267 549191 537784 R-squared 0.013 0.246 0.266 0.287 Standard errors in parentheses * Significant at 10% ** Significant at 5% *** Significant at 1%
8
Table 3c: Regressions of standardised values of Key Stage 3 scores for cross-sections
Explanatory Variables (1) (2) (3) (4) Ethnic Group Black Caribbean -0.479*** -0.290*** -0.0907*** -0.239***
(0.0116) (0.0105) (0.0103) (0.0106) Black African -0.451*** -0.262*** -0.0432*** -0.219***
(0.0107) (0.00971) (0.00959) (0.0100) Black Other -0.442*** -0.282*** -0.0932*** -0.221***
(0.0210) (0.0190) (0.0186) (0.0185) Indian 0.136*** 0.101*** 0.149*** 0.0887***
(0.00908) (0.00819) (0.00800) (0.00853) Pakistani -0.494*** -0.308*** -0.175*** -0.241***
(0.00896) (0.00814) (0.00798) (0.00906) Bangladeshi -0.412*** -0.160*** 0.0624*** -0.118***
(0.0142) (0.0129) (0.0127) (0.0132) Chinese 0.548*** 0.498*** 0.543*** 0.468***
(0.0233) (0.0210) (0.0205) (0.0205) Other Asian 0.0310* 0.0665*** 0.141*** 0.0469***
(0.0164) (0.0148) (0.0145) (0.0145) White Asian 0.265*** 0.277*** 0.296*** 0.228***
(0.0197) (0.0178) (0.0174) (0.0172) White and Black Caribbean -0.283*** -0.128*** -0.0106 -0.0495***
(0.0142) (0.0128) (0.0125) (0.0125) White and Black African -0.123*** -0.000892 0.113*** 0.0264
(0.0290) (0.0261) (0.0256) (0.0254) Other -0.0668*** 0.0495*** 0.150*** 0.0332***
(0.0109) (0.00988) (0.00967) (0.00973) White Irish 0.153*** 0.201*** 0.256*** 0.161***
(0.0222) (0.0200) (0.0196) (0.0194) Traveller/ Gypsy -1.014*** -0.566*** -0.527*** -0.512***
(0.0743) (0.0670) (0.0657) (0.0645) Other White -0.00136 0.0539*** 0.105*** -0.0183**
(0.0100) (0.00904) (0.00885) (0.00888) Personal Characteristics
Gender (=1 if female) -0.0272*** -0.0187*** -0.0155*** (0.00248) (0.00242) (0.00240)
Free School Meal (=1 if has FSM)
-0.499*** -0.303*** -0.281*** (0.00403) (0.00411) (0.00408)
SEN(=1 if SEN without statement)
-1.016*** -0.957*** -0.938*** (0.00364) (0.00357) (0.00354)
SEN(=1 if SEN with statement)
-1.369*** -1.347*** -1.335*** (0.0106) (0.0103) (0.0102)
Month of Birth No Yes Yes Yes Neighbourhood Characteristics
IDACI No No Yes No MOSAIC classification No No No Yes
Observations 526104 526104 524020 513039 R-squared 0.017 0.201 0.241 0.274 Standard errors in parentheses * Significant at 10% ** Significant at 5% *** Significant at 1%

9
Table 3d: Regressions of standardised values of Key Stage 4 scores for cross-sections
Explanatory Variables (1) (2) (3) (4) Ethnic Group Black Caribbean -0.218*** -0.0482*** 0.0998*** 0.0135
(0.0111) (0.00992) (0.00986) (0.0101) Black African -0.147*** -0.00726 0.152*** 0.0527***
(0.00940) (0.00845) (0.00844) (0.00886) Black Other -0.229*** -0.101*** 0.0374** -0.0302*
(0.0195) (0.0174) (0.0173) (0.0173) Indian 0.385*** 0.331*** 0.367*** 0.329***
(0.00876) (0.00784) (0.00773) (0.00825) Pakistani -0.0953*** 0.0731*** 0.171*** 0.132***
(0.00844) (0.00759) (0.00752) (0.00854) Bangladeshi -0.00866 0.213*** 0.379*** 0.258***
(0.0134) (0.0120) (0.0119) (0.0124) Chinese 0.585*** 0.521*** 0.559*** 0.520***
(0.0212) (0.0189) (0.0187) (0.0188) Other Asian -0.00298 0.00991 0.0673*** 0.0282**
(0.0141) (0.0126) (0.0125) (0.0126) White Asian 0.199*** 0.198*** 0.213*** 0.169***
(0.0189) (0.0169) (0.0166) (0.0166) White and Black Caribbean -0.246*** -0.103*** -0.0186 -0.0290**
(0.0135) (0.0121) (0.0119) (0.0119) White and Black African -0.0541** 0.0423* 0.125*** 0.0931***
(0.0270) (0.0242) (0.0239) (0.0238) Other -0.0519*** 0.0458*** 0.124*** 0.0553***
(0.00986) (0.00883) (0.00874) (0.00885) White Irish 0.0434** 0.0817*** 0.126*** 0.0684***
(0.0213) (0.0190) (0.0188) (0.0186) Traveller/ Gypsy -1.366*** -0.935*** -0.881*** -0.874***
(0.0531) (0.0475) (0.0471) (0.0464) Other White -0.0666*** -0.0372*** 0.00871 -0.0536***
(0.00879) (0.00786) (0.00778) (0.00787) Personal Characteristics
Gender (=1 if female) 0.124*** 0.130*** 0.134*** (0.00235) (0.00232) (0.00231)
Free School Meal (=1 if has FSM)
-0.450*** -0.304*** -0.271*** (0.00365) (0.00377) (0.00375)
SEN(=1 if SEN without statement)
-0.966*** -0.916*** -0.890*** (0.00326) (0.00324) (0.00323)
SEN(=1 if SEN with statement)
-1.278*** -1.250*** -1.228*** (0.00772) (0.00763) (0.00759)
Month of Birth No Yes Yes Yes Neighbourhood Characteristics
IDACI No No Yes No MOSAIC classification No No No Yes
Observations 581918 581918 579395 567122 R-squared 0.008 0.207 0.231 0.257 Standard errors in parentheses * Significant at 10% ** Significant at 5% *** Significant at 1%

10
Table 4a: Regressions of standardised values of all Key Stage scores with IDACI controls for balanced panel
Explanatory Variables KS1 KS2 KS3 KS4 Ethnic Group Black Caribbean 0.101*** -0.0404*** -0.0224* 0.0993***
(0.0117) (0.0117) (0.0115) (0.0119) Black African 0.103*** 0.0879*** 0.221*** 0.392***
(0.0135) (0.0136) (0.0133) (0.0138) Black Other 0.0594*** -0.0117 -0.0340 0.0545**
(0.0214) (0.0215) (0.0211) (0.0218) Indian -0.0683*** -0.00459 0.155*** 0.408***
(0.00883) (0.00886) (0.00870) (0.00897) Pakistani -0.301*** -0.284*** -0.145*** 0.197***
(0.00885) (0.00888) (0.00872) (0.00899) Bangladeshi -0.277*** -0.0148 0.127*** 0.476***
(0.0142) (0.0143) (0.0140) (0.0145) Chinese 0.0295 0.369*** 0.588*** 0.766***
(0.0244) (0.0245) (0.0241) (0.0248) Other Asian -0.00255 0.133*** 0.308*** 0.389***
(0.0188) (0.0189) (0.0185) (0.0191) White Asian 0.168*** 0.234*** 0.316*** 0.252***
(0.0191) (0.0192) (0.0188) (0.0194) White and Black Caribbean 0.0968*** 0.0523*** 0.00195 -0.0215
(0.0132) (0.0133) (0.0130) (0.0134) White and Black African 0.133*** 0.175*** 0.186*** 0.154***
(0.0299) (0.0300) (0.0295) (0.0304) Other 0.0342*** 0.156*** 0.229*** 0.252***
(0.0115) (0.0116) (0.0113) (0.0117) White Irish 0.172*** 0.251*** 0.276*** 0.162***
(0.0213) (0.0213) (0.0209) (0.0216) Traveller/ Gypsy -0.494*** -0.529*** -0.490*** -0.664***
(0.0749) (0.0752) (0.0738) (0.0761) Other White -0.0661*** 0.0967*** 0.172*** 0.217***
(0.0108) (0.0108) (0.0106) (0.0109) Personal Characteristics
Gender (=1 if female) 0.147*** -0.0455*** -0.0210*** 0.134*** (0.00257) (0.00258) (0.00254) (0.00261)
Free School Meal (=1 if has FSM)
-0.259*** -0.253*** -0.299*** -0.321*** (0.00445) (0.00447) (0.00439) (0.00452)
SEN(=1 if SEN without statement)
-0.841*** -0.955*** -0.971*** -0.920*** (0.00381) (0.00383) (0.00376) (0.00388)
SEN(=1 if SEN with statement)
-1.481*** -1.531*** -1.343*** -1.028*** (0.0112) (0.0113) (0.0111) (0.0114)
Observations 480150 480150 480150 480150 R-squared 0.215 0.209 0.237 0.190 Standard errors in parentheses * Significant at 10% ** Significant at 5% *** Significant at 1%
11
Table 4b: Regressions of standardised values of all Key Stage scores with IDACI controls for cross-sections
Explanatory Variables KS1 KS2 KS3 KS4 Ethnic Group Black Caribbean 0.120*** -0.0584*** -0.0907*** 0.0998***
(0.0108) (0.0101) (0.0103) (0.00986) Black African 0.121*** -0.0458*** -0.0432*** 0.152***
(0.0126) (0.0105) (0.00959) (0.00844) Black Other 0.0824*** -0.00286 -0.0932*** 0.0374**
(0.0198) (0.0186) (0.0186) (0.0173) Indian -0.0524*** -0.00539 0.149*** 0.367***
(0.00833) (0.00796) (0.00800) (0.00773) Pakistani -0.282*** -0.291*** -0.175*** 0.171***
(0.00809) (0.00774) (0.00798) (0.00752) Bangladeshi -0.251*** -0.0411*** 0.0624*** 0.379***
(0.0130) (0.0124) (0.0127) (0.0119) Chinese 0.0582** 0.335*** 0.543*** 0.559***
(0.0231) (0.0215) (0.0205) (0.0187) Other Asian -0.000352 0.0262* 0.141*** 0.0673***
(0.0175) (0.0153) (0.0145) (0.0125) White Asian 0.156*** 0.201*** 0.296*** 0.213***
(0.0176) (0.0169) (0.0174) (0.0166) White and Black Caribbean 0.104*** 0.0560*** -0.0106 -0.0186
(0.0121) (0.0119) (0.0125) (0.0119) White and Black African 0.147*** 0.127*** 0.113*** 0.125***
(0.0272) (0.0255) (0.0256) (0.0239) Other 0.0423*** 0.0773*** 0.150*** 0.124***
(0.0106) (0.00969) (0.00967) (0.00874) White Irish 0.168*** 0.229*** 0.256*** 0.126***
(0.0195) (0.0190) (0.0196) (0.0188) Traveller/ Gypsy -0.607*** -0.689*** -0.527*** -0.881***
(0.0566) (0.0533) (0.0657) (0.0471) Other White -0.0622*** 0.0211** 0.105*** 0.00871
(0.00990) (0.00895) (0.00885) (0.00778) Personal Characteristics
Gender (=1 if female) 0.140*** -0.0404*** -0.0187*** 0.130*** (0.00237) (0.00233) (0.00242) (0.00232)
Free School Meal (=1 if has FSM)
-0.257*** -0.264*** -0.303*** -0.304*** (0.00393) (0.00383) (0.00411) (0.00377)
SEN(=1 if SEN without statement)
-0.861*** -0.973*** -0.957*** -0.916*** (0.00332) (0.00327) (0.00357) (0.00324)
SEN(=1 if SEN with statement)
-1.669*** -1.715*** -1.347*** -1.250*** (0.00787) (0.00792) (0.0103) (0.00763)
Observations 530957 549191 524020 579395 R-squared 0.267 0.266 0.241 0.231 Standard errors in parentheses * Significant at 10% ** Significant at 5% *** Significant at 1%

12
Table 5: Regressions of Key Stage 2 to 4 value added for balanced panel
Explanatory Variables (1) (2) (3) (4) Ethnic Group Black Caribbean -0.732 9.271*** 18.16*** 18.28***
(1.501) (1.466) (1.473) (1.526) Black African 27.94*** 38.81*** 49.43*** 48.37***
(1.734) (1.694) (1.703) (1.811) Black Other -9.217*** 0.387 8.981*** 8.630***
(2.762) (2.693) (2.697) (2.728) Indian 59.28*** 57.83*** 59.99*** 58.60***
(1.142) (1.113) (1.111) (1.213) Pakistani 35.34*** 46.93*** 52.98*** 50.72***
(1.132) (1.111) (1.113) (1.298) Bangladeshi 45.17*** 60.71*** 70.49*** 66.43***
(1.818) (1.786) (1.792) (1.890) Chinese 79.82*** 77.77*** 79.76*** 78.01***
(3.159) (3.078) (3.075) (3.118) Other Asian 40.82*** 41.86*** 45.09*** 43.16***
(2.429) (2.368) (2.365) (2.400) White Asian 14.90*** 15.27*** 16.15*** 14.36***
(2.469) (2.406) (2.402) (2.419) White and Black Caribbean -21.18*** -12.95*** -7.625*** -5.871***
(1.706) (1.665) (1.666) (1.685) White and Black African -6.467* 1.339 6.935* 7.639**
(3.858) (3.760) (3.763) (3.787) Other 12.13*** 18.54*** 23.10*** 21.94***
(1.484) (1.448) (1.448) (1.477) White Irish -3.425 -1.248 1.678 0.575
(2.747) (2.677) (2.675) (2.686) Traveller/ Gypsy -69.10*** -48.80*** -51.17*** -48.11***
(9.673) (9.429) (9.427) (9.420) Other White 18.28*** 20.97*** 23.04*** 21.04***
(1.392) (1.357) (1.356) (1.377) Personal Characteristics
Gender (=1 if female) 22.60*** 23.02*** 23.36*** (0.324) (0.324) (0.326)
Free School Meal (=1 if has FSM)
-33.95*** -24.73*** -21.52*** (0.537) (0.560) (0.565)
SEN(=1 if SEN without statement)
-53.24*** -50.46*** -48.52*** (0.478) (0.480) (0.484)
SEN(=1 if SEN with statement)
-22.30*** -21.09*** -19.93*** (1.415) (1.414) (1.424)
Month of Birth No Yes Yes Yes Neighbourhood Characteristics
IDACI No No Yes No MOSAIC classification No No No Yes
Observations 481818 481818 480150 470389 R-squared 0.012 0.061 0.068 0.076 Standard errors in parentheses * Significant at 10% ** Significant at 5% *** Significant at 1%
13
Table 6: Regressions of all value added measures for balanced panel with IDACI controls
Explanatory Variables VA KS1-2 VA KS2-4 VA KS 2-3 VA KS 3-4 Ethnic Group Black Caribbean -0.407*** 18.16*** 0.254** 16.40***
(0.0349) (1.473) (0.126) (1.306) Black African 0.0546 49.43*** 2.635*** 34.17***
(0.0404) (1.703) (0.145) (1.511) Black Other -0.209*** 8.981*** -0.389* 10.91***
(0.064) (2.697) (0.23) (2.392) Indian 0.194*** 59.99*** 2.837*** 43.52***
(0.0263) (1.111) (0.0948) (0.985) Pakistani -0.252*** 52.98*** 1.449*** 43.74***
(0.0264) (1.113) (0.095) (0.987) Bangladeshi 0.692*** 70.49*** 2.422*** 56.17***
(0.0425) (1.792) (0.153) (1.589) Chinese 1.279*** 79.76*** 5.062*** 51.50***
(0.0729) (3.075) (0.263) (2.728) Other Asian 0.504*** 45.09*** 3.469*** 25.27***
(0.0561) (2.365) (0.202) (2.098) White Asian 0.460*** 16.15*** 2.108*** 4.363**
(0.057) (2.402) (0.205) (2.131) White and Black Caribbean -0.0633 -7.625*** -0.678*** -3.506**
(0.0395) (1.666) (0.142) (1.478) White and Black African 0.271*** 6.935* 0.728** 3.185
(0.0892) (3.763) (0.321) (3.337) Other 0.475*** 23.10*** 1.753*** 13.24***
(0.0343) (1.448) (0.124) (1.284) White Irish 0.470*** 1.678 1.153*** -4.404*
(0.0634) (2.675) (0.228) (2.372) Traveller/ Gypsy -0.678*** -51.17*** -1.342* -45.54***
(0.224) (9.427) (0.805) (8.362) Other White 0.499*** 23.04*** 1.584*** 14.08***
(0.0321) (1.356) (0.116) (1.202) Personal Characteristics
Gender (=1 if female) -0.573*** 23.02*** 0.173*** 21.80*** (0.00768) (0.324) (0.0276) (0.287)
Free School Meal (=1 if has FSM)
-0.261*** -24.73*** -1.611*** -15.81*** (0.0133) (0.560) (0.0478) (0.497)
SEN(=1 if SEN without statement)
-1.392*** -50.46*** -3.343*** -32.47*** (0.0114) (0.480) (0.041) (0.426)
SEN(=1 if SEN with statement)
-1.810*** -21.09*** -2.403*** -9.505*** (0.0335) (1.414) (0.121) (1.255)
Observations 480150 480150 480150 480150 R-squared 0.06 0.068 0.061 0.041 Standard errors in parentheses * Significant at 10% ** Significant at 5% *** Significant at 1%
14
Table 7a: Regressions of standardised Key Stage 1 and 2 scores with Ethnicity & FSM interactions for balanced panel and with IDACI controls
Explanatory Variables Key Stage 1 Key Stage 2
*FSM *FSM Ethnic Group Black Caribbean 0.0652*** 0.163*** -0.0864*** 0.213***
(0.0133) (0.0277) (0.0134) (0.0278) Black African 0.131*** -0.0798*** 0.0767*** 0.0557*
(0.0162) (0.0293) (0.0163) (0.0294) Black Other 0.00888 0.227*** -0.0697*** 0.266***
(0.0244) (0.0508) (0.0245) (0.0510) Indian -0.0722*** 0.0402 -0.00792 0.0354
(0.00931) (0.0292) (0.00935) (0.0294) Pakistani -0.357*** 0.183*** -0.333*** 0.171***
(0.0107) (0.0190) (0.0108) (0.0190) Bangladeshi -0.404*** 0.260*** -0.171*** 0.327***
(0.0202) (0.0284) (0.0203) (0.0285) Chinese -0.0120 0.368*** 0.337*** 0.290***
(0.0259) (0.0770) (0.0261) (0.0773) Other Asian -0.00655 0.0321 0.116*** 0.117**
(0.0206) (0.0507) (0.0206) (0.0510) White Asian 0.179*** -0.0702 0.242*** -0.0451
(0.0205) (0.0556) (0.0206) (0.0558) White and Black Caribbean 0.0826*** 0.0719** 0.0259* 0.132***
(0.0151) (0.0316) (0.0151) (0.0317) White and Black African 0.0841** 0.223*** 0.121*** 0.250***
(0.0341) (0.0709) (0.0342) (0.0712) Other 0.0474*** -0.0486* 0.140*** 0.0851***
(0.0130) (0.0277) (0.0131) (0.0278) White Irish 0.191*** -0.134** 0.262*** -0.0779
(0.0228) (0.0630) (0.0229) (0.0632) Traveller/ Gypsy -0.418*** -0.173 -0.611*** 0.226
(0.0972) (0.152) (0.0976) (0.153) Other White -0.0513*** -0.101*** 0.0956*** 0.0182
(0.0116) (0.0313) (0.0116) (0.0314) Personal Characteristics
Free School Meal (=1 if has FSM)
-0.279*** -0.287*** (0.00507) (0.00509)
Gender (=1 if female) 0.147*** -0.0453*** (0.00257) (0.00258)
SEN(=1 if SEN without statement)
-0.840*** -0.954*** (0.00381) (0.00383)
SEN(=1 if SEN with statement)
-1.480*** -1.530*** (0.0112) (0.0113)
Month of Birth Yes Yes Neighbourhood Characteristics
IDACI Yes Yes MOSAIC classification No No
Observations 480150 480150 R-squared 0.215 0.209 Standard errors in parentheses * Significant at 10% ** Significant at 5% *** Significant at 1%

15
Table 7b: Regressions of standardised Key Stage 3 and 4 scores with Ethnicity & FSM interactions for balanced panel and with IDACI controls
Explanatory Variables Key Stage 3 Key Stage 4
*FSM *FSM Ethnic Group Black Caribbean -0.0734*** 0.238*** 0.0408*** 0.283***
(0.0131) (0.0273) (0.0135) (0.0281) Black African 0.186*** 0.137*** 0.310*** 0.304***
(0.0160) (0.0288) (0.0165) (0.0297) Black Other -0.0914*** 0.267*** -0.0251 0.376***
(0.0241) (0.0501) (0.0248) (0.0516) Indian 0.147*** 0.0836*** 0.391*** 0.180***
(0.00918) (0.0288) (0.00945) (0.0297) Pakistani -0.205*** 0.209*** 0.118*** 0.281***
(0.0106) (0.0187) (0.0109) (0.0193) Bangladeshi -0.0138 0.303*** 0.286*** 0.418***
(0.0199) (0.0280) (0.0205) (0.0288) Chinese 0.553*** 0.315*** 0.708*** 0.520***
(0.0256) (0.0759) (0.0263) (0.0782) Other Asian 0.302*** 0.0545 0.357*** 0.222***
(0.0203) (0.0500) (0.0209) (0.0515) White Asian 0.325*** -0.0535 0.247*** 0.0606
(0.0202) (0.0548) (0.0208) (0.0565) White and Black Caribbean -0.0223 0.126*** -0.0581*** 0.194***
(0.0148) (0.0311) (0.0153) (0.0321) White and Black African 0.145*** 0.197*** 0.135*** 0.117
(0.0336) (0.0699) (0.0346) (0.0720) Other 0.205*** 0.130*** 0.190*** 0.312***
(0.0128) (0.0273) (0.0132) (0.0282) White Irish 0.286*** -0.0662 0.163*** 0.00779
(0.0225) (0.0621) (0.0231) (0.0639) Traveller/ Gypsy -0.559*** 0.199 -0.780*** 0.334**
(0.0958) (0.150) (0.0987) (0.155) Other White 0.163*** 0.0792** 0.192*** 0.205***
(0.0114) (0.0308) (0.0118) (0.0317) Personal Characteristics
Free School Meal (=1 if has FSM)
-0.339*** -0.386*** (0.00499) (0.00514)
Gender (=1 if female) -0.0208*** 0.134*** (0.00253) (0.00261)
SEN(=1 if SEN without statement)
-0.969*** -0.919*** (0.00376) (0.00387)
SEN(=1 if SEN with statement)
-1.342*** -1.026*** (0.0111) (0.0114)
Month of Birth Yes Yes Neighbourhood Characteristics
IDACI Yes Yes MOSAIC classification No No
Observations 480150 480150 R-squared 0.238 0.191 Standard errors in parentheses * Significant at 10% ** Significant at 5% *** Significant at 1%
16
Table 8: Regressions of KS2-KS4 value added measures with Ethnicity & FSM interactions for balanced panel and with IDACI controls
Explanatory Variables VA KS2-KS4
*FSM Ethnic Group Black Caribbean 13.65*** 22.63***
(1.676) (3.487) Black African 38.48*** 39.26***
(2.042) (3.681) Black Other 2.423 31.62***
(3.073) (6.394) Indian 57.66*** 23.52***
(1.171) (3.680) Pakistani 45.93*** 25.57***
(1.349) (2.386) Bangladeshi 56.39*** 32.32***
(2.543) (3.573) Chinese 74.12*** 50.86***
(3.265) (9.685) Other Asian 41.85*** 22.37***
(2.586) (6.385) White Asian 14.67*** 13.09*
(2.584) (6.998) White and Black Caribbean -10.66*** 16.69***
(1.894) (3.972) White and Black African 8.884** -4.850
(4.288) (8.922) Other 15.36*** 38.05***
(1.639) (3.490) White Irish 0.740 8.946
(2.867) (7.924) Traveller/ Gypsy -60.11*** 26.87
(12.23) (19.18) Other White 19.44*** 28.06***
(1.459) (3.933) Personal Characteristics
Free School Meal (=1 if has FSM) -31.30*** (0.638)
Gender (=1 if female) 23.06*** (0.324)
SEN(=1 if SEN without statement) -50.33*** (0.480)
SEN(=1 if SEN with statement) -20.80*** (1.414)
Month of Birth Yes Neighbourhood Characteristics
IDACI Yes MOSAIC classification No
Observations 480150 R-squared 0.069 Standard errors in parentheses * Significant at 10% ** Significant at 5% *** Significant at 1%
17
Table 9a: Regressions of standardised Key Stage 1 scores with Ethnicity/ Gender/ FSM interactions for balanced panel and with IDACI controls
Explanatory Variables Key Stage 1
*gender *FSM *FSM*gender Ethnic Group Black Caribbean 0.0800*** -0.0286 0.135*** 0.0552
(0.0192) (0.0265) (0.0411) (0.0556) Black African 0.133*** -0.00358 -0.0703* -0.0208
(0.0231) (0.0323) (0.0417) (0.0585) Black Other 0.0299 -0.0433 0.192*** 0.0688
(0.0340) (0.0488) (0.0720) (0.102) Indian -0.0797*** 0.0148 -0.00665 0.0912
(0.0132) (0.0186) (0.0410) (0.0585) Pakistani -0.367*** 0.0185 0.181*** 0.00125
(0.0151) (0.0213) (0.0268) (0.0379) Bangladeshi -0.379*** -0.0478 0.222*** 0.0752
(0.0292) (0.0403) (0.0416) (0.0569) Chinese -0.0298 0.0348 0.530*** -0.288*
(0.0370) (0.0519) (0.115) (0.155) Other Asian -0.0302 0.0461 -0.0507 0.163
(0.0294) (0.0411) (0.0719) (0.101) White Asian 0.171*** 0.0149 -0.0525 -0.0344
(0.0291) (0.0411) (0.0803) (0.111) White and Black Caribbean 0.0872*** -0.00915 0.0310 0.0786
(0.0219) (0.0301) (0.0463) (0.0633) White and Black African 0.109** -0.0511 0.110 0.214
(0.0478) (0.0681) (0.105) (0.142) Other 0.0537*** -0.0126 -0.112*** 0.124**
(0.0184) (0.0260) (0.0393) (0.0555) White Irish 0.207*** -0.0338 -0.170* 0.0704
(0.0320) (0.0456) (0.0916) (0.126) Traveller/ Gypsy -0.401** -0.0272 0.152 -0.535*
(0.162) (0.202) (0.246) (0.313) Other White -0.0365** -0.0298 -0.109** 0.00882
(0.0163) (0.0232) (0.0436) (0.0626) Personal Characteristics
Free School Meal (=1 if has FSM)
-0.238*** (0.00716)
Gender (=1 if female) 0.154*** (0.00288)
FSM*Gender -0.0795*** (0.00969)
SEN(=1 if SEN without statement)
-0.841*** (0.00381)
SEN(=1 if SEN with statement)
-1.482*** (0.0112)
Month of Birth Yes Neighbourhood Characteristics
IDACI Yes MOSAIC classification No
Observations 480150 R-squared 0.215 Standard errors in parentheses * Significant at 10% ** Significant at 5% *** Significant at 1%
18
Table 9b: Regressions of standardised Key Stage 2 scores with Ethnicity/ Gender/ FSM interactions for balanced panel and with IDACI controls
Explanatory Variables Key Stage 2
*gender *FSM *FSM*gender Ethnic Group Black Caribbean -0.129*** 0.0812*** 0.196*** 0.0316
(0.0193) (0.0266) (0.0412) (0.0559) Black African 0.0429* 0.0664** 0.0808* -0.0518
(0.0231) (0.0324) (0.0419) (0.0587) Black Other -0.0858** 0.0332 0.146** 0.233**
(0.0341) (0.0490) (0.0722) (0.102) Indian -0.0198 0.0236 -0.0384 0.146**
(0.0133) (0.0187) (0.0412) (0.0587) Pakistani -0.337*** 0.00713 0.179*** -0.0217
(0.0151) (0.0214) (0.0269) (0.0381) Bangladeshi -0.186*** 0.0288 0.315*** 0.0249
(0.0293) (0.0405) (0.0417) (0.0571) Chinese 0.333*** 0.00781 0.303*** -0.0176
(0.0371) (0.0521) (0.116) (0.156) Other Asian 0.0874*** 0.0550 0.0707 0.0892
(0.0295) (0.0413) (0.0722) (0.102) White Asian 0.228*** 0.0278 -0.0905 0.0856
(0.0292) (0.0412) (0.0807) (0.112) White and Black Caribbean 0.0108 0.0284 0.0858* 0.0880
(0.0220) (0.0302) (0.0465) (0.0635) White and Black African 0.120** 0.00270 0.157 0.173
(0.0480) (0.0684) (0.105) (0.143) Other 0.113*** 0.0543** 0.0664* 0.0333
(0.0185) (0.0261) (0.0395) (0.0557) White Irish 0.247*** 0.0299 -0.106 0.0522
(0.0321) (0.0458) (0.0920) (0.127) Traveller/ Gypsy -0.475*** -0.214 0.0593 0.276
(0.162) (0.203) (0.247) (0.315) Other White 0.0975*** -0.00386 0.0274 -0.0261
(0.0164) (0.0233) (0.0438) (0.0628) Personal Characteristics
Free School Meal (=1 if has FSM)
-0.242*** (0.00719)
Gender (=1 if female) -0.0411*** (0.00289)
FSM*Gender -0.0863*** (0.00973)
SEN(=1 if SEN without statement)
-0.954*** (0.00383)
SEN(=1 if SEN with statement)
-1.531*** (0.0113)
Month of Birth Yes Neighbourhood Characteristics
IDACI Yes MOSAIC classification No
Observations 480150 R-squared 0.209 Standard errors in parentheses * Significant at 10% ** Significant at 5% *** Significant at 1%

19
Table 9c: Regressions of standardised Key Stage 3 scores with Ethnicity/ Gender/ FSM interactions for balanced panel and with IDACI controls
Explanatory Variables Key Stage 3
*gender *FSM *FSM*gender Ethnic Group Black Caribbean -0.128*** 0.104*** 0.204*** 0.0608
(0.0189) (0.0261) (0.0405) (0.0548) Black African 0.117*** 0.135*** 0.151*** -0.0308
(0.0227) (0.0318) (0.0411) (0.0576) Black Other -0.125*** 0.0701 0.166** 0.193*
(0.0335) (0.0481) (0.0709) (0.100) Indian 0.119*** 0.0551*** 0.00509 0.156***
(0.0130) (0.0183) (0.0404) (0.0576) Pakistani -0.219*** 0.0268 0.185*** 0.0435
(0.0148) (0.0210) (0.0264) (0.0374) Bangladeshi -0.0262 0.0235 0.297*** 0.0143
(0.0288) (0.0398) (0.0410) (0.0561) Chinese 0.568*** -0.0298 0.368*** -0.0869
(0.0365) (0.0511) (0.114) (0.153) Other Asian 0.263*** 0.0754* 0.00823 0.0901
(0.0290) (0.0405) (0.0709) (0.100) White Asian 0.305*** 0.0400 -0.0770 0.0432
(0.0287) (0.0405) (0.0792) (0.110) White and Black Caribbean -0.0393* 0.0320 0.0875* 0.0740
(0.0216) (0.0297) (0.0457) (0.0624) White and Black African 0.154*** -0.0174 0.174* 0.0492
(0.0471) (0.0672) (0.103) (0.140) Other 0.182*** 0.0462* 0.0865** 0.0832
(0.0181) (0.0256) (0.0388) (0.0547) White Irish 0.292*** -0.0115 -0.129 0.121
(0.0315) (0.0449) (0.0903) (0.124) Traveller/ Gypsy -0.389** -0.266 -0.00658 0.338
(0.159) (0.199) (0.242) (0.309) Other White 0.157*** 0.0131 0.0618 0.0289
(0.0161) (0.0228) (0.0429) (0.0616) Personal Characteristics
Free School Meal (=1 if has FSM)
-0.292*** (0.00705)
Gender (=1 if female) -0.0190*** (0.00284)
FSM*Gender -0.0902*** (0.00955)
SEN(=1 if SEN without statement)
-0.970*** (0.00376)
SEN(=1 if SEN with statement)
-1.343*** (0.0111)
Month of Birth Yes Neighbourhood Characteristics
IDACI Yes MOSAIC classification No
Observations 480150 R-squared 0.238 Standard errors in parentheses * Significant at 10% ** Significant at 5% *** Significant at 1%
20
Table 9d: Regressions of standardised Key Stage 4 scores with Ethnicity/ Gender/ FSM interactions for balanced panel and with IDACI controls
Explanatory Variables Key Stage 4
*gender *FSM *FSM*gender Ethnic Group Black Caribbean -0.0152 0.107*** 0.221*** 0.109*
(0.0195) (0.0269) (0.0417) (0.0565) Black African 0.262*** 0.0937*** 0.339*** -0.0693
(0.0234) (0.0328) (0.0423) (0.0594) Black Other -0.0676** 0.0877* 0.281*** 0.182*
(0.0345) (0.0495) (0.0731) (0.103) Indian 0.373*** 0.0344* 0.114*** 0.133**
(0.0134) (0.0189) (0.0417) (0.0594) Pakistani 0.0709*** 0.0953*** 0.257*** 0.0446
(0.0153) (0.0217) (0.0272) (0.0385) Bangladeshi 0.233*** 0.100** 0.404*** 0.0235
(0.0296) (0.0410) (0.0422) (0.0578) Chinese 0.695*** 0.0265 0.653*** -0.237
(0.0376) (0.0527) (0.117) (0.157) Other Asian 0.343*** 0.0278 0.170** 0.102
(0.0298) (0.0417) (0.0730) (0.103) White Asian 0.239*** 0.0157 0.0791 -0.0360
(0.0295) (0.0417) (0.0816) (0.113) White and Black Caribbean -0.0744*** 0.0311 0.174*** 0.0370
(0.0222) (0.0306) (0.0470) (0.0643) White and Black African 0.179*** -0.0908 0.0717 0.0952
(0.0485) (0.0692) (0.106) (0.145) Other 0.175*** 0.0295 0.299*** 0.0226
(0.0187) (0.0264) (0.0399) (0.0563) White Irish 0.164*** -0.00221 0.0244 -0.0300
(0.0325) (0.0463) (0.0930) (0.128) Traveller/ Gypsy -0.657*** -0.191 0.317 0.0202
(0.164) (0.205) (0.249) (0.318) Other White 0.183*** 0.0181 0.194*** 0.0208
(0.0166) (0.0235) (0.0442) (0.0635) Personal Characteristics
Free School Meal (=1 if has FSM)
-0.362*** (0.00727)
Gender (=1 if female) 0.131*** (0.00293)
FSM*Gender -0.0453*** (0.00984)
SEN(=1 if SEN without statement)
-0.919*** (0.00387)
SEN(=1 if SEN with statement)
-1.026*** (0.0114)
Month of Birth Yes Neighbourhood Characteristics
IDACI Yes MOSAIC classification No
Observations 480150 R-squared 0.191 Standard errors in parentheses * Significant at 10% ** Significant at 5% *** Significant at 1%

21
Table 10: Regressions of KS2-KS4 value added measures with Ethnicity/ Gender/ FSM interactions for balanced panel and with IDACI controls
Explanatory Variables Value Added Key Stage 2-4
*gender *FSM *FSM*gender Ethnic Group Black Caribbean 9.012*** 8.921*** 15.10*** 13.14*
(2.416) (3.335) (5.165) (7.001) Black African 34.32*** 8.205** 41.84*** -5.110
(2.901) (4.061) (5.245) (7.359) Black Other -2.707 10.57* 27.86*** 6.987
(4.272) (6.139) (9.054) (12.79) Indian 56.26*** 2.789 20.17*** 6.912
(1.662) (2.341) (5.161) (7.359) Pakistani 39.15*** 13.65*** 21.15*** 8.789*
(1.895) (2.683) (3.372) (4.769) Bangladeshi 49.77*** 12.69** 31.43*** 1.071
(3.674) (5.075) (5.230) (7.162) Chinese 73.20*** 1.813 68.70*** -32.04
(4.654) (6.529) (14.51) (19.49) Other Asian 42.19*** -0.651 18.48** 7.747
(3.697) (5.170) (9.048) (12.77) White Asian 14.74*** -0.144 19.16* -11.60
(3.659) (5.166) (10.11) (14.01) White and Black Caribbean -11.59*** 1.818 17.64*** -1.840
(2.752) (3.787) (5.830) (7.964) White and Black African 15.36** -13.19 -3.075 -1.713
(6.014) (8.574) (13.17) (17.92) Other 15.79*** -0.873 37.93*** 0.263
(2.313) (3.273) (4.950) (6.979) White Irish 1.992 -2.563 14.12 -9.499
(4.022) (5.734) (11.53) (15.88) Traveller/ Gypsy -55.63*** -6.828 37.18 -17.98
(20.35) (25.46) (30.90) (39.43) Other White 18.10*** 2.691 24.94*** 6.530
(2.053) (2.917) (5.483) (7.870) Personal Characteristics
Free School Meal (=1 if has FSM)
-31.74*** (0.901)
Gender (=1 if female) 22.17*** (0.363)
FSM*Gender 0.868 (1.220)
SEN(=1 if SEN without statement)
-50.30*** (0.480)
SEN(=1 if SEN with statement)
-20.81*** (1.414)
Month of Birth Yes Neighbourhood Characteristics
IDACI Yes MOSAIC classification No
Observations 480150 R-squared 0.069 Standard errors in parentheses * Significant at 10% ** Significant at 5% *** Significant at 1%
22
Figure 1a: Overall standardised score for balanced panel
−.8
−.6
−.4
−.2
0.2
.4.6
.8S
tand
ardi
sed
Ove
rall
keys
tage
sco
re
7 11 14 16Age
White Black CaribbeanBlack African Black OtherOther
−.8
−.6
−.4
−.2
0.2
.4.6
.8S
tand
ardi
sed
Ove
rall
keys
tage
sco
re
7 11 14 16Age
White IndianPakistani BangladeshiChinese
−.8
−.6
−.4
−.2
0.2
.4.6
.8S
tand
ardi
sed
Ove
rall
keys
tage
sco
re
7 11 14 16Age
White British White IrishTraveller/Gypsy White Other
−.8
−.6
−.4
−.2
0.2
.4.6
.8S
tand
ardi
sed
Ove
rall
keys
tage
sco
re
7 11 14 16Age
White and Asian White & Black CaWhite & Black Af Other Asian
23
Figure 1b: Overall standardised score for cross-sections
−.8
−.6
−.4
−.2
0.2
.4.6
.8S
tand
ardi
sed
Ove
rall
keys
tage
sco
re
7 11 14 16Age
White Black CaribbeanBlack African Black OtherOther
−.8
−.6
−.4
−.2
0.2
.4.6
.8S
tand
ardi
sed
Ove
rall
keys
tage
sco
re
7 11 14 16Age
White IndianPakistani BangladeshiChinese
−.8
−.6
−.4
−.2
0.2
.4.6
.8S
tand
ardi
sed
Ove
rall
keys
tage
sco
re
7 11 14 16Age
White British White IrishTraveller/Gypsy White Other
−.8
−.6
−.4
−.2
0.2
.4.6
.8S
tand
ardi
sed
Ove
rall
keys
tage
sco
re
7 11 14 16Age
White and Asian White & Black CaWhite & Black Af Other Asian
24
Figure 2a: Overall standardised score for balanced panel
Pupils with FSM Status
−.8
−.6
−.4
−.2
0.2
.4.6
.8S
tand
ardi
sed
Ove
rall
keys
tage
sco
re
7 11 14 16Age
White Black CaribbeanBlack African Black OtherOther
−.8
−.6
−.4
−.2
0.2
.4.6
.8S
tand
ardi
sed
Ove
rall
keys
tage
sco
re
7 11 14 16Age
White IndianPakistani BangladeshiChinese
−.8
−.6
−.4
−.2
0.2
.4.6
.8S
tand
ardi
sed
Ove
rall
keys
tage
sco
re
7 11 14 16Age
White British White IrishTraveller/Gypsy White Other
−.8
−.6
−.4
−.2
0.2
.4.6
.8S
tand
ardi
sed
Ove
rall
keys
tage
sco
re
7 11 14 16Age
White and Asian White & Black CaWhite & Black Af Other Asian

25
Figure 2b: Overall standardised score for cross-sections
Pupils with FSM Status
−.8
−.6
−.4
−.2
0.2
.4.6
.8S
tand
ardi
sed
Ove
rall
keys
tage
sco
re
7 11 14 16Age
White Black CaribbeanBlack African Black OtherOther
−.8
−.6
−.4
−.2
0.2
.4.6
.8S
tand
ardi
sed
Ove
rall
keys
tage
sco
re
7 11 14 16Age
White IndianPakistani BangladeshiChinese
−.8
−.6
−.4
−.2
0.2
.4.6
.8S
tand
ardi
sed
Ove
rall
keys
tage
sco
re
7 11 14 16Age
White British White IrishTraveller/Gypsy White Other
−.8
−.6
−.4
−.2
0.2
.4.6
.8S
tand
ardi
sed
Ove
rall
keys
tage
sco
re
7 11 14 16Age
White and Asian White & Black CaWhite & Black Af Other Asian
26
Figure 3a: Overall standardised score for balanced panel
Pupils without FSM Status
−.8
−.6
−.4
−.2
0.2
.4.6
.8S
tand
ardi
sed
Ove
rall
keys
tage
sco
re
7 11 14 16Age
White Black CaribbeanBlack African Black OtherOther
−.8
−.6
−.4
−.2
0.2
.4.6
.8S
tand
ardi
sed
Ove
rall
keys
tage
sco
re
7 11 14 16Age
White IndianPakistani BangladeshiChinese
−.8
−.6
−.4
−.2
0.2
.4.6
.8S
tand
ardi
sed
Ove
rall
keys
tage
sco
re
7 11 14 16Age
White British White IrishTraveller/Gypsy White Other
−.8
−.6
−.4
−.2
0.2
.4.6
.8S
tand
ardi
sed
Ove
rall
keys
tage
sco
re
7 11 14 16Age
White and Asian White & Black CaWhite & Black Af Other Asian
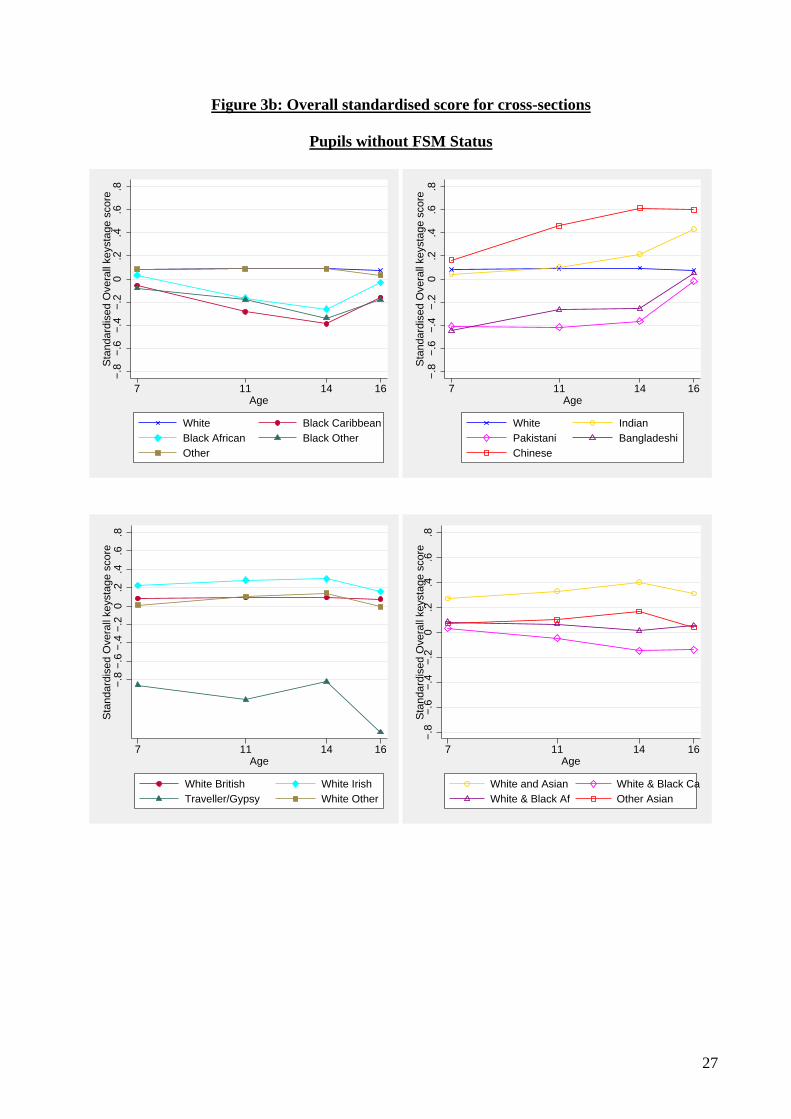
27
Figure 3b: Overall standardised score for cross-sections
Pupils without FSM Status
−.8
−.6
−.4
−.2
0.2
.4.6
.8S
tand
ardi
sed
Ove
rall
keys
tage
sco
re
7 11 14 16Age
White Black CaribbeanBlack African Black OtherOther
−.8
−.6
−.4
−.2
0.2
.4.6
.8S
tand
ardi
sed
Ove
rall
keys
tage
sco
re
7 11 14 16Age
White IndianPakistani BangladeshiChinese
−.8
−.6
−.4
−.2
0.2
.4.6
.8S
tand
ardi
sed
Ove
rall
keys
tage
sco
re
7 11 14 16Age
White British White IrishTraveller/Gypsy White Other
−.8
−.6
−.4
−.2
0.2
.4.6
.8S
tand
ardi
sed
Ove
rall
keys
tage
sco
re
7 11 14 16Age
White and Asian White & Black CaWhite & Black Af Other Asian
28
Figure 4a: Overall standardised score for balanced panel
For Male Pupils
−.8
−.6
−.4
−.2
0.2
.4.6
.8S
tand
ardi
sed
Ove
rall
keys
tage
sco
re
7 11 14 16Age
White Black CaribbeanBlack African Black OtherOther
−.8
−.6
−.4
−.2
0.2
.4.6
.8S
tand
ardi
sed
Ove
rall
keys
tage
sco
re
7 11 14 16Age
White IndianPakistani BangladeshiChinese
−.8
−.6
−.4
−.2
0.2
.4.6
.8S
tand
ardi
sed
Ove
rall
keys
tage
sco
re
7 11 14 16Age
White British White IrishTraveller/Gypsy White Other
−.8
−.6
−.4
−.2
0.2
.4.6
.8S
tand
ardi
sed
Ove
rall
keys
tage
sco
re
7 11 14 16Age
White and Asian White & Black CaWhite & Black Af Other Asian

29
Figure 4b: Overall standardised score for cross-sections
For Male Pupils
−.8
−.6
−.4
−.2
0.2
.4.6
.8S
tand
ardi
sed
Ove
rall
keys
tage
sco
re
7 11 14 16Age
White Black CaribbeanBlack African Black OtherOther
−.8
−.6
−.4
−.2
0.2
.4.6
.8S
tand
ardi
sed
Ove
rall
keys
tage
sco
re
7 11 14 16Age
White IndianPakistani BangladeshiChinese
−.8
−.6
−.4
−.2
0.2
.4.6
.8S
tand
ardi
sed
Ove
rall
keys
tage
sco
re
7 11 14 16Age
White British White IrishTraveller/Gypsy White Other
−.8
−.6
−.4
−.2
0.2
.4.6
.8S
tand
ardi
sed
Ove
rall
keys
tage
sco
re
7 11 14 16Age
White and Asian White & Black CaWhite & Black Af Other Asian
30
Figure 5a: Overall standardised score for balanced panel
For Female Pupils
−.8
−.6
−.4
−.2
0.2
.4.6
.8S
tand
ardi
sed
Ove
rall
keys
tage
sco
re
7 11 14 16Age
White Black CaribbeanBlack African Black OtherOther
−.8
−.6
−.4
−.2
0.2
.4.6
.8S
tand
ardi
sed
Ove
rall
keys
tage
sco
re
7 11 14 16Age
White IndianPakistani BangladeshiChinese
−.8
−.6
−.4
−.2
0.2
.4.6
.8S
tand
ardi
sed
Ove
rall
keys
tage
sco
re
7 11 14 16Age
White British White IrishTraveller/Gypsy White Other
−.8
−.6
−.4
−.2
0.2
.4.6
.8S
tand
ardi
sed
Ove
rall
keys
tage
sco
re
7 11 14 16Age
White and Asian White & Black CaWhite & Black Af Other Asian
31
Figure 5b: Overall standardised score for cross-sections
For Female Pupils
−.8
−.6
−.4
−.2
0.2
.4.6
.8S
tand
ardi
sed
Ove
rall
keys
tage
sco
re
7 11 14 16Age
White Black CaribbeanBlack African Black OtherOther
−.8
−.6
−.4
−.2
0.2
.4.6
.8S
tand
ardi
sed
Ove
rall
keys
tage
sco
re
7 11 14 16Age
White IndianPakistani BangladeshiChinese
−.8
−.6
−.4
−.2
0.2
.4.6
.8S
tand
ardi
sed
Ove
rall
keys
tage
sco
re
7 11 14 16Age
White British White IrishTraveller/Gypsy White Other
−.8
−.6
−.4
−.2
0.2
.4.6
.8S
tand
ardi
sed
Ove
rall
keys
tage
sco
re
7 11 14 16Age
White and Asian White & Black CaWhite & Black Af Other Asian
32
Figure 6a: Overall standardised score for balanced panel
For FSM Male Pupils
−.8
−.6
−.4
−.2
0.2
.4.6
.8S
tand
ardi
sed
Ove
rall
keys
tage
sco
re
7 11 14 16Age
White Black CaribbeanBlack African Black OtherOther
−.8
−.6
−.4
−.2
0.2
.4.6
.8S
tand
ardi
sed
Ove
rall
keys
tage
sco
re
7 11 14 16Age
White IndianPakistani BangladeshiChinese
−.8
−.6
−.4
−.2
0.2
.4.6
.8S
tand
ardi
sed
Ove
rall
keys
tage
sco
re
7 11 14 16Age
White British White IrishTraveller/Gypsy White Other
−.8
−.6
−.4
−.2
0.2
.4.6
.8S
tand
ardi
sed
Ove
rall
keys
tage
sco
re
7 11 14 16Age
White and Asian White & Black CaWhite & Black Af Other Asian
33
Figure 6b: Overall standardised score for balanced panel
For FSM Female Pupils
−.8
−.6
−.4
−.2
0.2
.4.6
.8S
tand
ardi
sed
Ove
rall
keys
tage
sco
re
7 11 14 16Age
White Black CaribbeanBlack African Black OtherOther
−.8
−.6
−.4
−.2
0.2
.4.6
.8S
tand
ardi
sed
Ove
rall
keys
tage
sco
re
7 11 14 16Age
White IndianPakistani BangladeshiChinese
−.8
−.6
−.4
−.2
0.2
.4.6
.8S
tand
ardi
sed
Ove
rall
keys
tage
sco
re
7 11 14 16Age
White British White IrishTraveller/Gypsy White Other
−.8
−.6
−.4
−.2
0.2
.4.6
.8S
tand
ardi
sed
Ove
rall
keys
tage
sco
re
7 11 14 16Age
White and Asian White & Black CaWhite & Black Af Other Asian
34
Figure 7a: Overall standardised score for balanced panel
For Non-FSM Male Pupils
−.8
−.6
−.4
−.2
0.2
.4.6
.8S
tand
ardi
sed
Ove
rall
keys
tage
sco
re
7 11 14 16Age
White Black CaribbeanBlack African Black OtherOther
−.8
−.6
−.4
−.2
0.2
.4.6
.8S
tand
ardi
sed
Ove
rall
keys
tage
sco
re
7 11 14 16Age
White IndianPakistani BangladeshiChinese
−.8
−.6
−.4
−.2
0.2
.4.6
.8S
tand
ardi
sed
Ove
rall
keys
tage
sco
re
7 11 14 16Age
White British White IrishTraveller/Gypsy White Other
−.8
−.6
−.4
−.2
0.2
.4.6
.8S
tand
ardi
sed
Ove
rall
keys
tage
sco
re
7 11 14 16Age
White and Asian White & Black CaWhite & Black Af Other Asian

35
Figure 7b: Overall standardised score for balanced panel
For Non-FSM Female Pupils
−.8
−.6
−.4
−.2
0.2
.4.6
.8S
tand
ardi
sed
Ove
rall
keys
tage
sco
re
7 11 14 16Age
White Black CaribbeanBlack African Black OtherOther
−.8
−.6
−.4
−.2
0.2
.4.6
.8S
tand
ardi
sed
Ove
rall
keys
tage
sco
re
7 11 14 16Age
White IndianPakistani BangladeshiChinese
−.8
−.6
−.4
−.2
0.2
.4.6
.8S
tand
ardi
sed
Ove
rall
keys
tage
sco
re
7 11 14 16Age
White British White IrishTraveller/Gypsy White Other
−.8
−.6
−.4
−.2
0.2
.4.6
.8S
tand
ardi
sed
Ove
rall
keys
tage
sco
re
7 11 14 16Age
White and Asian White & Black CaWhite & Black Af Other Asian
36
Figure 8a: ‘Group’- White British ethnicity conditional gaps in standardised score for balanced panel
With IDACI controls
−.6
−.4
−.2
0.2
.4.6
Sta
ndar
dise
d O
vera
ll ke
ysta
ge s
core
7 11 14 16Age
Black Caribbean Black AfricanBlack Other Other
−.6
−.4
−.2
0.2
.4.6
Sta
ndar
dise
d O
vera
ll ke
ysta
ge s
core
7 11 14 16Age
Indian PakistaniBangladeshi Chinese
−.6
−.4
−.2
0.2
.4.6
Sta
ndar
dise
d O
vera
ll ke
ysta
ge s
core
7 11 14 16Age
White Irish Traveller/GypsyWhite Other
−.6
−.4
−.2
0.2
.4.6
Sta
ndar
dise
d O
vera
ll ke
ysta
ge s
core
7 11 14 16Age
White and Asian White & Black CaWhite & Black Af Other Asian
37
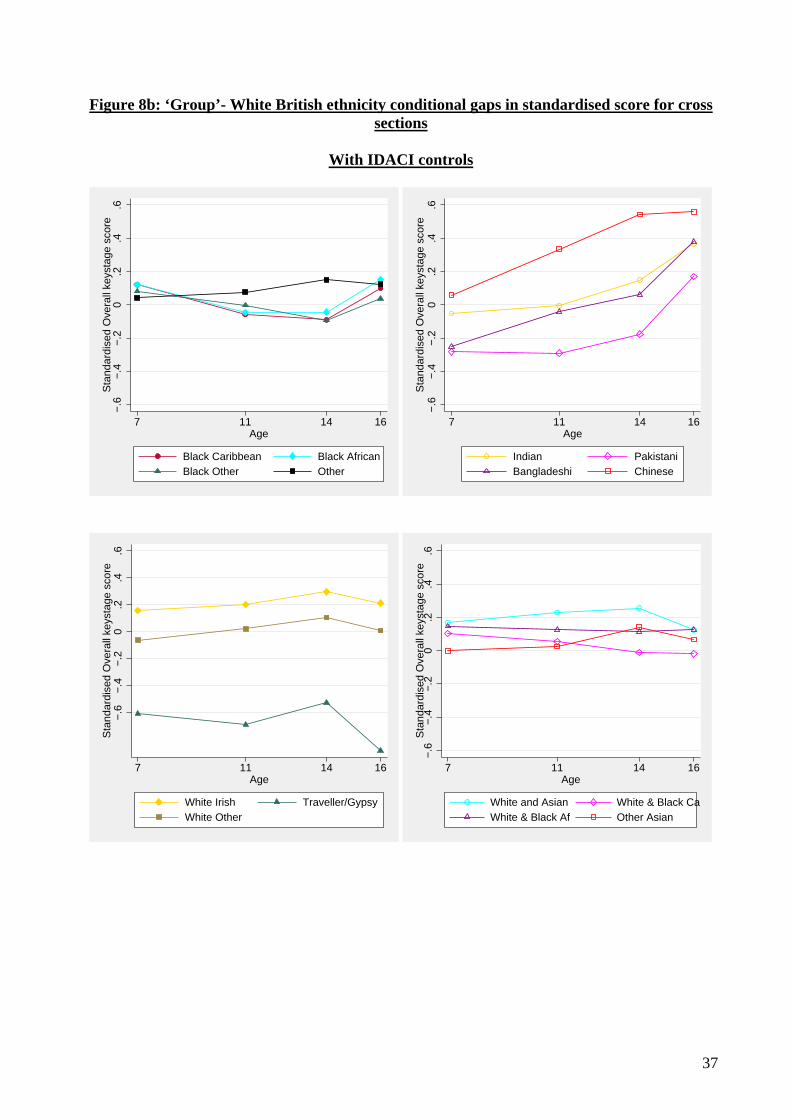
Figure 8b: ‘Group’- White British ethnicity conditional gaps in standardised score for cross sections
With IDACI controls
−.6
−.4
−.2
0.2
.4.6
Sta
ndar
dise
d O
vera
ll ke
ysta
ge s
core
7 11 14 16Age
Black Caribbean Black AfricanBlack Other Other
−.6
−.4
−.2
0.2
.4.6
Sta
ndar
dise
d O
vera
ll ke
ysta
ge s
core
7 11 14 16Age
Indian PakistaniBangladeshi Chinese
−.6
−.4
−.2
0.2
.4.6
Sta
ndar
dise
d O
vera
ll ke
ysta
ge s
core
7 11 14 16Age
White Irish Traveller/GypsyWhite Other
−.6
−.4
−.2
0.2
.4.6
Sta
ndar
dise
d O
vera
ll ke
ysta
ge s
core
7 11 14 16Age
White and Asian White & Black CaWhite & Black Af Other Asian
38
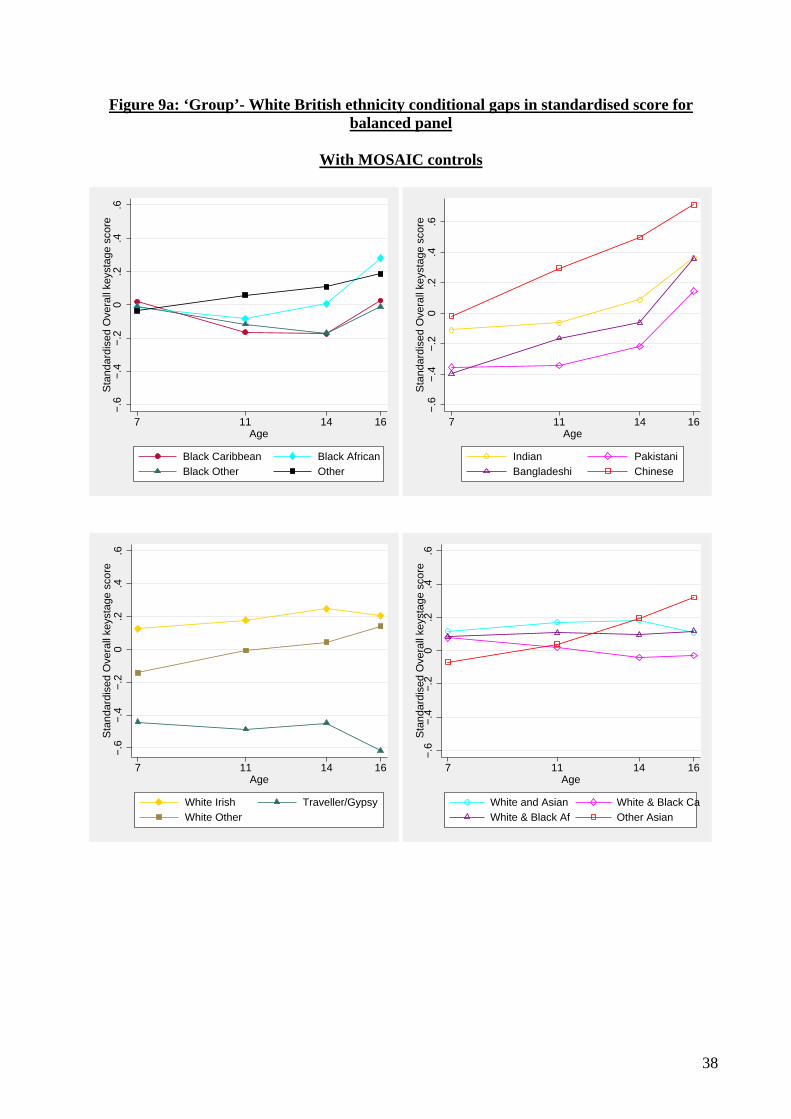
Figure 9a: ‘Group’- White British ethnicity conditional gaps in standardised score for balanced panel
With MOSAIC controls
−.6
−.4
−.2
0.2
.4.6
Sta
ndar
dise
d O
vera
ll ke
ysta
ge s
core
7 11 14 16Age
Black Caribbean Black AfricanBlack Other Other
−.6
−.4
−.2
0.2
.4.6
Sta
ndar
dise
d O
vera
ll ke
ysta
ge s
core
7 11 14 16Age
Indian PakistaniBangladeshi Chinese
−.6
−.4
−.2
0.2
.4.6
Sta
ndar
dise
d O
vera
ll ke
ysta
ge s
core
7 11 14 16Age
White Irish Traveller/GypsyWhite Other
−.6
−.4
−.2
0.2
.4.6
Sta
ndar
dise
d O
vera
ll ke
ysta
ge s
core
7 11 14 16Age
White and Asian White & Black CaWhite & Black Af Other Asian

39
Figure 9b: ‘Group’-White British ethnicity conditional gaps in standardised score for cross sections
With MOSAIC controls
−.6
−.4
−.2
0.2
.4.6
Sta
ndar
dise
d O
vera
ll ke
ysta
ge s
core
7 11 14 16Age
Black Caribbean Black AfricanBlack Other Other
−.6
−.4
−.2
0.2
.4.6
Sta
ndar
dise
d O
vera
ll ke
ysta
ge s
core
7 11 14 16Age
Indian PakistaniBangladeshi Chinese
−.6
−.4
−.2
0.2
.4.6
Sta
ndar
dise
d O
vera
ll ke
ysta
ge s
core
7 11 14 16Age
White Irish Traveller/GypsyWhite Other
−.6
−.4
−.2
0.2
.4.6
Sta
ndar
dise
d O
vera
ll ke
ysta
ge s
core
7 11 14 16Age
White and Asian White & Black CaWhite & Black Af Other Asian
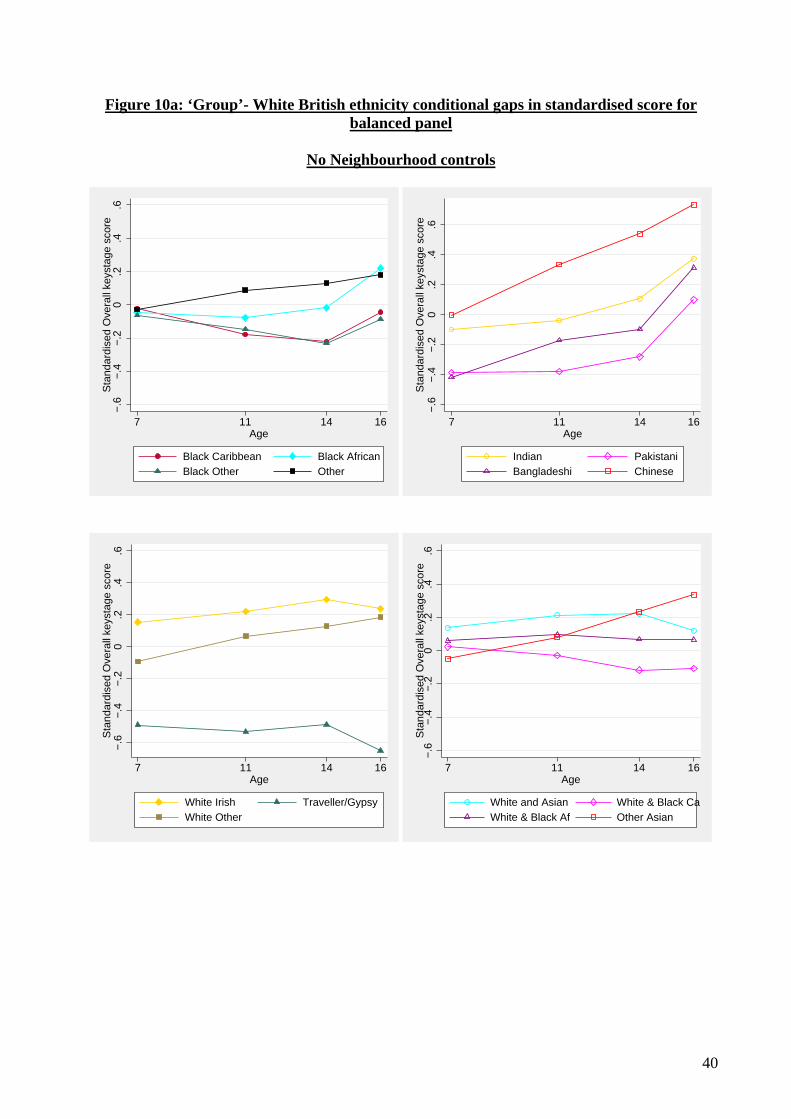
40
Figure 10a: ‘Group’- White British ethnicity conditional gaps in standardised score for balanced panel
No Neighbourhood controls
−.6
−.4
−.2
0.2
.4.6
Sta
ndar
dise
d O
vera
ll ke
ysta
ge s
core
7 11 14 16Age
Black Caribbean Black AfricanBlack Other Other
−.6
−.4
−.2
0.2
.4.6
Sta
ndar
dise
d O
vera
ll ke
ysta
ge s
core
7 11 14 16Age
Indian PakistaniBangladeshi Chinese
−.6
−.4
−.2
0.2
.4.6
Sta
ndar
dise
d O
vera
ll ke
ysta
ge s
core
7 11 14 16Age
White Irish Traveller/GypsyWhite Other
−.6
−.4
−.2
0.2
.4.6
Sta
ndar
dise
d O
vera
ll ke
ysta
ge s
core
7 11 14 16Age
White and Asian White & Black CaWhite & Black Af Other Asian
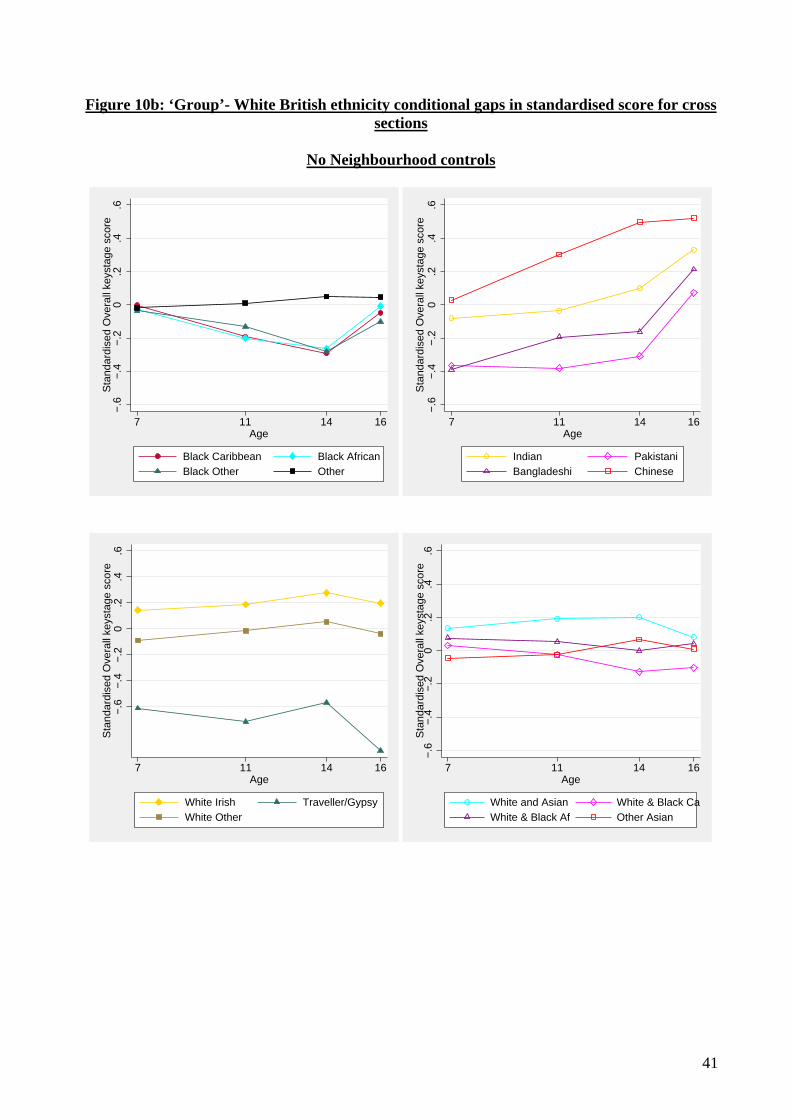
41
Figure 10b: ‘Group’- White British ethnicity conditional gaps in standardised score for cross sections
No Neighbourhood controls
−.6
−.4
−.2
0.2
.4.6
Sta
ndar
dise
d O
vera
ll ke
ysta
ge s
core
7 11 14 16Age
Black Caribbean Black AfricanBlack Other Other
−.6
−.4
−.2
0.2
.4.6
Sta
ndar
dise
d O
vera
ll ke
ysta
ge s
core
7 11 14 16Age
Indian PakistaniBangladeshi Chinese
−.6
−.4
−.2
0.2
.4.6
Sta
ndar
dise
d O
vera
ll ke
ysta
ge s
core
7 11 14 16Age
White Irish Traveller/GypsyWhite Other
−.6
−.4
−.2
0.2
.4.6
Sta
ndar
dise
d O
vera
ll ke
ysta
ge s
core
7 11 14 16Age
White and Asian White & Black CaWhite & Black Af Other Asian

42
Appendix Table A1: Sample Size – Balanced Panel as % of all observations at key-stage
Ethnicity KS1 KS2 KS3 KS4 KS1 or KS2 KS3 or KS4Black Caribbean 90.96 79.21 80.25 72.21 92.44 80.56Black African 92.59 63.86 50.75 38.58 95.25 51.03Black Other 91.18 80.18 77.78 66.21 93.03 78.06Indian 95.34 86.97 84.72 78.13 96.53 85.11Pakistani 89.73 81.75 83.78 73.57 92.08 84.05Bangladeshi 89.32 81.10 82.14 71.68 93.31 82.75Chinese 95.67 82.82 72.66 59.60 97.21 73.34White 90.27 88.51 93.85 85.67 91.75 94.60 White British 90.29 88.84 94.44 86.63 91.74 95.19 White Irish 90.18 85.15 87.88 79.56 92.42 88.46 Traveller/Gypsy 61.04 53.61 79.21 40.06 65.89 81.03 Other White 90.34 73.52 69.18 52.41 92.81 69.75Other 90.37 78.70 77.11 63.55 92.29 77.67 Other Asian 93.16 70.82 60.91 44.69 95.13 61.29 White and Asian 91.23 83.75 85.73 77.51 93.07 86.38 White and Black Caribbean 88.97 85.87 92.77 83.23 90.41 93.11 White and Black African 88.62 77.96 75.64 65.25 90.80 76.95 Other 90.39 75.54 72.60 58.29 92.67 73.22

43
Table A2: Observations missing some Key Stage score data before age 14
Ethnicity Number of observations
missing in KS1/KS2/bothNumber of observations
in cross-sections Proportion of observations
missing in KS1/KS2/bothBlack Caribbean 1,812 8,275 21.90Black African 6,904 11,586 59.59Black Other 758 2,638 28.73Indian 2,535 13,358 18.98Pakistani 2,690 14,443 18.62Bangladeshi 1,246 5,696 21.88Chinese 881 2,251 39.14Other Asian 2,678 5,070 52.82White and Asian 477 2,836 16.82White & Black Caribbean 429 5,545 7.74White & Black African 394 1,384 28.47Other 3,919 10,548 37.15White British 27,021 487,890 5.54White Irish 314 2,228 14.09Traveller/Gypsy 140 362 38.67Other White 5,821 13,337 43.65
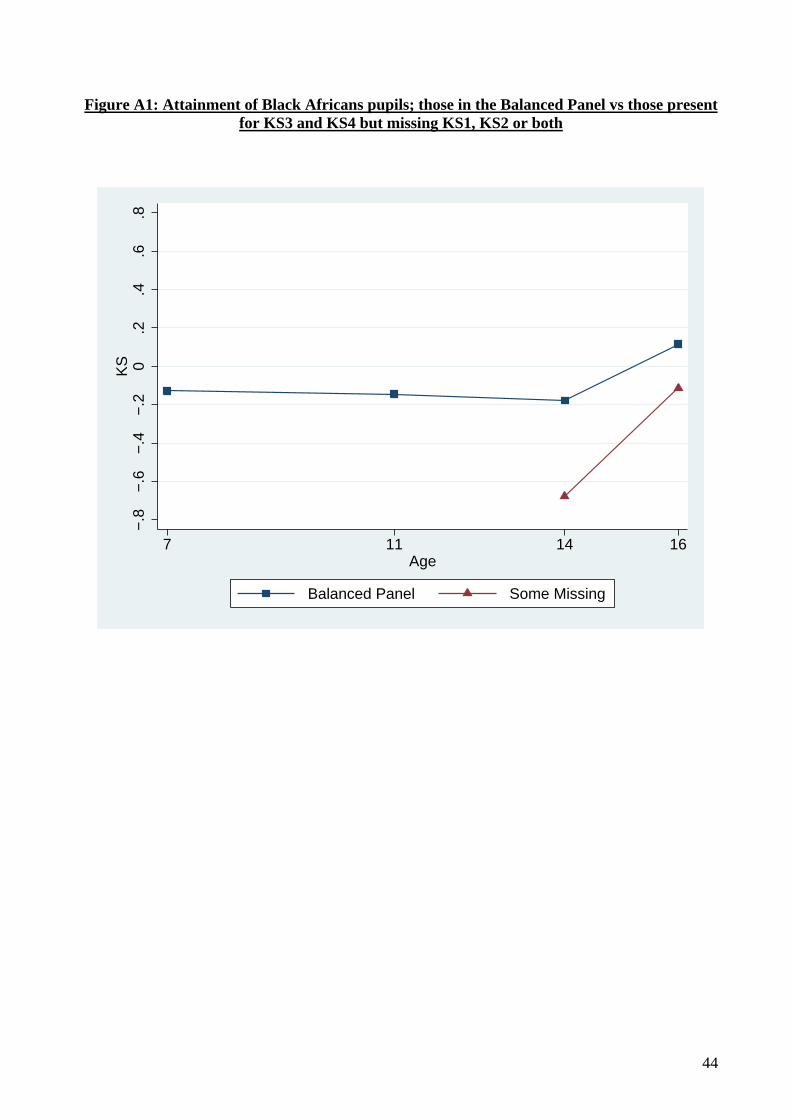
44
Figure A1: Attainment of Black Africans pupils; those in the Balanced Panel vs those present for KS3 and KS4 but missing KS1, KS2 or both
−.8
−.6
−.4
−.2
0.2
.4.6
.8K
S
7 11 14 16Age
Balanced Panel Some Missing