Embed Size (px)
Citation preview

Munich Personal RePEc Archive
Neoliberalism’s relationship with
economic growth in the developing
world: Was it the power of the market or
the resolution of financial crisis?
Cohen, Joseph N
City University of New York, Queens College
15 July 2010
Online at https://mpra.ub.uni-muenchen.de/24399/
MPRA Paper No. 24399, posted 12 Aug 2010 21:14 UTC

Neoliberalism’s Relationship with Economic Growth in the Developing World: Was It the Power of the Market or the Resolution of Financial Crisis?
Joseph Nathan Cohen Assistant Professor of Sociology
City University of New York, Queens College 65-30 Kissena Blvd
Flushing, NY 11367 [email protected]
www.josephncohen.com
FIRST DRAFT Please do not cite or circulate
July 27, 2010

1
The developing world adopted neoliberal reforms while mired in economic crisis, and
enjoyed a sustained economic recovery after these reforms were implemented. This record
seems to vindicate arguments that market-, as opposed to government-, dominated economies
promote better aggregate resource allocation and decision-making, and in turn economic
prosperity. A range of econometric studies support these conclusions, finding statistically
significant relationships between liberal economic policies and faster economic growth supports
these conclusions.
In this paper, I argue that such conclusions neglect important contextual factors that, once
considered, alter the apparent relationship between liberalism and growth in important ways.
Economic liberalism differentiated fast- from slow-growth countries in one period – the early
1990s – when Western governments and global investors were channeling capital to countries
that embraced neoliberal reforms. These capital influxes were desperately needed to resolve the
systemic financial crises in which developing countries were mired, and reversed a situation in
which capital was fleeing the developing world en masse. Capital influxes and public debt
refinancing helped resolve several economic problems, including chronic budgetary crises,
runaway inflation and collapsing foreign exchange rates, all of which placed economies in a state
of paralysis. When neoliberal policies’ effects on growth are tested net of the concurrent relief
of public financial distress and boom in foreign investment, they exert no discernible effect on
growth.
These results are taken to suggest that macrofinancial problems, and not the inherent
backwardness of state-managed economies, stood at the root of the economic malaise from
which neoliberalism emerged. If true, this interpretation questions the wisdom of free market

2
reforms that do not restore the fiscal health of governments and extricate economies from
financial crisis.
This paper proceeds in six sections. Section One describes the protracted economic crisis
from which neoliberalism emerged in the developing world, and profiles some of the arguments
justifying these reforms on the grounds that market-dominated economies were more likely to
make better aggregate resource allocations and economic decisions compared to government-
dominated ones. Section Two levies three methodological criticisms against studies that purport
to show a positive relationship between economic liberalism and growth, related to
measurement, sample representation, and omitted variable bias due to the ahistorical nature of
their analyses. Section Three provides methodological details, including the redresses used to
deal with the criticisms levied in Section Two. Section Four establishes the empirical basis for
the historical narrative presented in Section One. Section Five presents the regression analysis.
Section Six discusses the implications of these results in terms of how we interpret
neoliberalism’s effects on the developing world’s quest for prosperity.
1. Background Between WWII and the 1980s, the world’s economies were governed by policy strategies
in which governments played a powerful and highly-active role in shaping the behavior of
economic markets. These strategies materialized concretely in a wide range of ―government
interventions‖ in economic markets: high taxation and spending, public ownership of economic
enterprises and strategic resources, barriers on international trade and capital exchange, heavy
domestic market regulation, high levels of public employment and a rich range of government-
sponsored social programs. Neoliberalism was a political and ideological counter-movement

3
against governments’ expansive postwar economic roles, which advocated a return to the small
―hands-off‖ economic governance that prevailed prior to the world wars.
The details of neoliberalism’s rise are treated at length elsewhere (Yergin and Stanislaw
2002; Harvey 2005; Centeno and Cohen 2010). What is clear is that this movement became
highly influential by the 1980s, leading to a range of policy reforms that came to define the
organization of the world’s economies during the 1990s and 2000s. Globalization, deregulation,
privatization, welfare state cutbacks, regressive taxation and overall government downsizing are
trends that require the government’s assent, and this assent was secured in a period in which
policy-makers came to see liberalization as important, if not necessary, to extricate themselves
from the economic quagmire into which they fell during the 1970s and 1980s.
The serious economic crisis from which neoliberalism was born is important in
understanding why these policy reforms gained wide purchase. In the 1970s, the concatenation
of several (geo)political, economic and social problems caused the rich world to fall into an
economic crisis characterized by high inflation, economic stagnancy and high unemployment
(see Block 1977; Barsky and Kilian 2001; Yergin and Stanislaw 2002; Harvey 2005). These
problems spilled over into developing countries, but their immediate impact was conditioned by
their economic insularity and a sovereign lending bubble that provided them with abundant,
cheap and easy credit. Easy credit from Western lenders enabled developing countries to
weather the 1970s stagflation crisis while avoiding much stagnation, but these countries amassed
massive debts that became harder to finance and roll over as global interest rates rose. Mexico’s
threatened default in 1982 triggered a panic in sovereign lending markets, which, combined with
the ongoing fragility of the global financial system, produced a serious stagflation in developing
countries (for detailed examinations of these crises' causes, see Cuddington 1989; Sachs 1989).

4
The debt crisis left many developing world governments in a state of virtual bankruptcy,
creating a range of serious economic and political problems. Many of them fell into a state of
paralysis, unable to borrow enough money to finance their operations and often trapped in a
political gridlock that prevented them from setting decisive policy courses (see Snider 1996;
Mainwaring, Bejarano, and Pizarro Leongómez 2006). As a last resort, many of them printed
money to sustain government finances, feeding a well-entrenched inflationary spiral.
Government bankruptcy, paralysis and high inflation unleashed a wider range of problems that
caused economic hardship in the developing world over the 1980s. In the absence of a
functional government, working money and credit systems, and unstable access to foreign
resources, economies tend not to work well.
Advocacy for deep liberalization reforms gained credence and support in this context,
and this influence came from several quarters. One source of pro-neoliberal discourse came
form theoretical economists generally associated with the Chicago School. These movements
attacked government intervention as a faulty principle of economic governance, arguing that it
was likely to be ill-informed, ill-directed, ill-timed, ineffective or even counter-productive
(Hayek 1945; Friedman 1968; Kruger 1990). The system was characterized as being vulnerable
to corruption or anti-economic political influences (Kruger 1974; Dornbusch and Edwards 1989).
Regulations were often characterized as producing waste (reviewed in Guash and Hahn 1999).
A second source of advocacy stemmed from interpretations of East Asian countries’
apparent economic successes during the 1980s (reviewed in Bruton 1998). The economic
successes of these countries’ export-led development strategies were held up as examples of
unfettered markets’ capacity to fuel development. Although there was a wide-ranging literature
that suggested East Asia’s Tigers were not hands-off, but rather took a fairly active in managing

5
the economy, ―[economists] at large seemed reluctant to acknowledge such a role‖ (Bruton 1998:
924).
A third source of advocacy, which includes the often-cited ―Washington Consensus‖
(Williamson 1990) was more firmly oriented towards the resolution of the debt crisis itself.
Despite many studies that characterize this consensus as a raw, forceful endorsement of
neoliberal policies writ large, Williamson (1990) explicitly states that the reforms advocated by it
– fiscal austerity, tax reforms, easing capital market price controls, trade and inward investment
liberalization, privatization, deregulation and property rights protection – were not being implied
to secure long-term growth.1 Likewise, they did not advocate wholesale cutbacks for
government programs and power.2 Rather, the Consensus was engaging the issue that
developing countries’ governments were hemorrhaging money and their politicians could not
agree on policy changes that would stop the bleed. Potential donor governments and private
investors were reluctant to extend new loans to these governments out of fear that, without
serious fiscal changes, such loans would be tantamount to pouring money down a black hole. As
a result, capital rushed out of the country, governments often had to print money to cover their
obligations, and confidence in the financial system was negligible.
By the end of the 1980s, and the conclusion of the Cold War, the major potential
financiers of a developing world bailout, particularly the US government and IMF, developed
programs in which distressed government would have their debt issues underwritten in exchange
1 ―Dornbusch … has recently raised the question of whether the Washington agenda described above can be relied on to restore growth once stabilization has been achieved. He points to the disappointing experiences of Bolivia and Mexico, where determined and effective stabilization has not yet resulted in a resumption of growth. If he is right in his contention that entrepreneurs may adopt a wait-and-see policy after stabilization rather than promptly committing themselves to the risks involved in new investment, the important question arises as to what must be added to Washington's policy advice in order to restore growth‖ (Williamson 1990) 2 For example, the Consensus saw education, health care and public infrastructure investment as appropriate subjects of state intervention

6
for liberalization-oriented reforms (Edwards 1995; Kolodko 2000: 299 - 301; Dreher 2002).
Developing world politicians could deflect some of the anger that would inevitably arise as a
result of spending cuts, tax changes and public sector cutbacks to these donors, portraying
themselves as having been strong-armed into embracing neoliberalism. With these debt
refinancing schemes, capital holders came to see developing countries’ money and markets as
viable investment outlets. They were also beset by a euphoria surrounding the Cold War’s end,
and were anxious to capitalize on an expected ―new world order‖ by funneling money into
newly-integrated and –restructured economies in hopes of securing market share in emerging
markets. The result was hard currency inflows to developing countries, an easing of the debt
crisis, and a new-found prosperity in many previously-distressed developing countries.
What Caused the Recovery? Explanations of the developing world’s emergence from
the developing world’s economic crisis carries strong political overtimes, as they provide a
commentary on the rich world’s domestic economic policies in addition to developing countries’
policies. The politics of domestic policy in the rich world has often involved struggles over
government taxation, regulation and the co-opting of private decision-making throughout the
postwar era. If the developing world’s emergence from crisis can be attributed to the intrinsic
superiority of unfettered markets in the pursuit of prosperity, then their story can be used in
support of limited government at home.
The notion that small government and unfettered markets induce economic prosperity is
often recited by some, but by no means all, economists. In broad terms, this line of discussion
holds that unfettered markets are superior to modes of organizing economic activity, and that
economic power should be transferred to private sector actors as a rule. Anyone reviewing the
mainstream academic literature will have some difficulty assembling a body of market that

7
advocates laissez-faire with few conditions. Much of this literature does chronicle the benefits
of intermediate policy goals for which neoliberal policies strive – like large trade sectors, deep
private capital markets or adaptive labor markets– does not establish a direct relationship
between neoliberal policy and economic performance. In most corners of the academic
economics literature, support for neoliberal policy is rather conditional. Surveys of academic
economists suggest that orthodox laissez-faire attitudes are rare outside of trade policy, and most
of them see moderate economic intervention as desirable (Klein and Stern 2007).
The strongest and least conditional advocacy of harder neoliberal positions comes from
studies sponsored by conservative leaning think tanks, like the Heritage Foundation/Wall St.
Journal’s Index of Economic Freedom (Miller and Holmes 2010) or the Frasier Institute’s
Economic Freedom of the World (EFW) (Gwartney and Lawson 2009). Due in part to these
agencies acumen in media relations, these studies attract a level of public sphere attention that
would be envied by most academic scholars.3 These kinds of studies publish indexes that assess
the degree to which the world’s economies can be characterized as ―free‖, and offer
impressionistic comparisons suggesting that freer economies are better off. The comparison
methods used to support these conclusions would generally most pass muster in academic
journals, because they usually involve rough, uncontrolled descriptive comparisons. However,
the EFW has been examined in the scholastic literature, in part because its index is reasonably
rigorous and transparent. The EFW authors estimated in 2003 that this data has been used in
over 200 scholarly articles (Gwartney and Lawson 2006: 5), and these lines of discussion have
3 A Lexis-Nexis search finds that, from 2007 until September 2009, the IEF and EFW were mentioned 162 and 48 times, respectively in the ―major US and world publications‖ it catalogs. Google News registers 581 and 191 mentions, respectively, over this same period across the public sphere discussions it databases.

8
continued throughout the decade. Many of them support the conclusion that ―freer‖ economies
grow faster (for a review, see De Haan, Lundstrom, and Sturm 2006).
2. Studies Supporting the Neoliberalism-Growth Relationship, and
Methodological Qualms An extended overview of the EFW liberalism index is given in the methods section of
this paper. EFW-based studies assessing the relationship between economic growth and overall
levels of liberalism have generally confirmed this relationship using a range of sophisticated
regression methods and wide array of controls. At first glance, the fact that this relationship’s
confirmation in multiple studies lends credence to the often-recited policy axiom that freer
markets are more generally prosperous. However, I argue that there are three more basic
methodological problems that unduly contribute to these confirmatory findings: (1) the validity
of the EFW index as a measure of free market capitalism, (2) missing data’s effects of sample
representativeness, and (3) ahistoricity in these analyses, whereby the EFW-growth relationship
is assumed to be stable over time. Below, I show that addressing these three concerns affects our
results, leading to substantially different analytical findings. Each qualm is discussed in turn.
2.1 Purity of Measurement Scholastic studies that use the EFW treat it as a proxy for a ―market economy‖ (Berggren
2003), ―liberalization‖ (De Haan, Lundstrom, and Sturm 2006), ―neoliberal‖ economies (Tures
2003) or some cognate concept that suggests laissez-faire capitalism. With this understanding of
what is signaled by the EFW index, its relationships with growth are thus taken as relationships
between prosperity and laissez-faire.
In strict terms, EFW purports to measure ―economic freedom‖, which the study’s authors
describe as ―institutions and policies are consistent with economic freedom when they provide an
infrastructure for voluntary exchange and protect individuals and their property from aggressors‖

9
(Gwartney and Lawson 2009: 4). Empirically, this notion of ―economic freedom‖ sees
government as the chief ―aggressor‖, stressing minimal government ownership or control of
society’s economic resources and enterprises and minimal state interference in non-state property
holders’ disposal of the property to which they lay claim. Roughly 80% of a country’s ―freedom‖
score is determined by the relative absence of government economic intervention.
This view of ―economic freedom‖ is quite similar to those that underwrote the neoliberal
policy reforms that took place over much of the 1980s and 1990s, and generic policy axioms
pushed by many conservative political platforms today. It is a negative or libertarian conception
of freedom, where the absence of governmental economic power, manifested in things like small
public sectors, low levels of public investment or enterprise ownership, few fetters on
international transacting or less market regulation, contribute to a country’s ―freedom‖ score.
Unlike more positive views of economic freedom, which prioritize an economy’s provision of
basic necessities or economic opportunities for its members (e.g., Sen 1999), the EFW’s
formulation of freedom prioritizes private property rights and individuals’ capacity to employ
their property for whatever purposes they personally deem fit.
Although it has much overlap with laissez-faire, its empirical construction of the index
considers constituent measures that incorporate additional factors. Cohen (2009) presents
empirical evidence that the index’s construction effectively measures the degree to which a
country’s national economic policy model resembles those of the English-speaking OECD and
Switzerland, rich and well-governed countries that have pursued free market policies. Although
it is true that ―economic freedom‖, as defined by its authors, is a hallmark of the rich world
overall, the non-Anglo-Swiss OECD’s scores are buoyed by its Legal Structure & Property
Rights sub-index, which shows a stronger relationship via confirmatory factor analysis to the

10
World Bank’s Governance Indicators (Kaufmann, Kraay, and Mastruzzi 2009) than other, more
strictly laissez-faire related EFW sub-indices. This discrepant EFW sub-index is argued by
Cohen (2009) to be capturing what is typically understood as ―good governance‖ (discussed in
Burki and Perry 1998) – the degree to which a political economic system is politically
accountable, politically stable, ruled by law, non-corrupt and managed by a professional and
competent civil service – and its inclusion in the EFW is tantamount to a conflation of two
related but distinct concepts.. While economic liberalism and good governance are often both
present in the world’s most advanced countries, many OECD national economic models
maximize good governance without maximizing economic liberalism. Distinguishing good
governance from economic liberalism is not only a methodologically valid re-specification of a
country’s economic policy environment, given Cohen’s (2009) findings, but is also meaningful
because it enables us to assess the relative effectiveness of Anglo-Swiss economic models versus
other models used in the rich world.
A second issue that is identified in, but not pursued by, Cohen (2009) is the possible
conflation of ―economic freedom‖ and macroeconomic performance. Specifically, the EFW’s
Access to Sound Money sub-index uses inflation rates and variability as constituent measures.
While a stable money system is essential to a well-functioning market economy, and inflation
can be the result of government actions (e.g., seigniorage, aggressive monetary policy or chronic
deficit spending), the degree to which these metrics capture hands-off economic governance
versus the success of macroeconomic policy merits questioning. Inflation can be pursued and
influenced, but not completely controlled, by policy-makers, and in this sense resembles
economic growth or unemployment rather than deregulation or tax reductions. Furthermore,
there are situations in which ―economically free‖ countries can be more vulnerable to inflation

11
problems. For example, economic openness can make a country more vulnerable to price
destabilization stemming from external price shocks not directly attributable to their own
economic failings (for example, in currency crises rooted in contagion or self-fulfilling prophesy,
see Flood and Marion 1999).
With these two concerns in mind, the analysis that follows seeks to parse the EFW’s
governance and inflation components from its other measures of ―economic freedom‖. This is
done by separating the index into three different measures, whose empirical construction mirrors
the agglomerative techniques used to construct the original EFW index.
Sample Representation Any analysis that contemplates the causes of economic growth engages concepts whose
data coverage can be limited both cross-sectionally and longitudinally. Limited data coverage
poses several problems in the inference-making process, and is particularly problematic in
analyses comparing political and economic variables across developing countries. Conventional
methods for coping with missing data discard any country-year in which a single variable score
is missing, which means that our model results (and in turn our inferences) tend to only
incorporate the experiences of well-represented countries (like the OECD) or years (typically
more recent ones), or the effects of well-represented predictors (e.g., per capita GDP or trade). If
no such restrictions are made, there will be very little data left to analyze. These restrictions are
cause for concern, as the results of cross-national political economic analyses may not to be
robust to sample composition (Honaker and King 2010). One can sacrifice the use of poorly-
covered variables, but may avoid considering highly important controls in the process. The
analysis below presents evidence that sample composition can affect the estimated effects of the
variables we examine.

12
This concern suggests that it is important to capitalize on recent developments in
analytical redresses to missing data. This analysis employs the multiple imputation framework
advanced by Gary King et al. (2001), which tends to render results that ―will normally be better
than, and almost always not worse than, listwise deletion.‖ (p. 51). An accessible introduction to
multiple imputation with randomness is offered by Allison (2002).
Ahistoricity & Omitted Variables The issue of ahistoricity in time series analysis is discussed in Isaac and Griffin (1989).
Ahistorical time series analyses tend to ignore meaningful differences in the historical contexts
modeled by their theories and measured by their quantitative data. In terms of our present
discussion, ahistoricism produces the impression that liberalism’s relationship with economic
activity operates in the same way over recent history. The effectiveness of these reforms are
often understood as intrinsic to market- versus government-dominated economies, and not
contingent on, for example, states’ fiscal crises during the 1980s and early-1990s, the boom in
international investment that materialized after the Cold War’s end, or today’s ongoing global
financial crisis.
I tackle this issue empirically by reexamining economic liberalism’s relationship growth
across historical periods. The periodization is data-driven (see below), but corresponds roughly
to definable contexts in which liberalization and prosperity were pursued in the developing
world. Neoliberalism took root at a time when developing countries were plagued by public
financial and money system problems during the 1980s, and neoliberal policy was implemented
as part of a broader recovery package and broader set of historical circumstances that included
public debt bailouts and an ―emerging markets‖ investment mania in the rich world from the
early-1990s. Understanding the potential importance of the debt crisis from which neoliberal
13
reforms emerged is important for several reasons. The debt crisis itself is a reason that
developing countries performed so poorly in the 1980s, but claims about the economic benefit of
liberalization often extend beyond the resolution of such macrofinancial crises. Any observed
improvement in economic growth realized after 1990 is produced by comparing countries in the
midst of a systemic financial meltdown versus those that returned to macrofinancial stability. If
these improvements are the product of the developmental benefits conferred by neoliberal
policies per se, as opposed to the debt aid and global investment mania that occurred
concurrently, then we can be better assured that free markets help countries grow. My analysis
suggests that scholars’ common attribution of developing world prosperity may be confusing the
effectiveness of free markets from the idiosyncratic political and economic factors that helped
resolve a very specific historical crisis.
When neoliberalism’s relationship with growth is examined on a period-by-period basis,
the former exerts a predictive power only in the early-1990s, when developing countries were
being rewarded by debt bailout programs and an emerging markets investment mania.
Neoliberalism’s failure to differentiate fast- from slow-growth countries outside of the early-
1990s suggests that, in contrast to what is suggested by Gwartney and Lawson (2009), countries
are not engaged in some kind of trans-historical process that rewards the world’s most liberal
countries. Its capacity to discern growth rates in only one historical period suggests that some
important set of variables is being omitted.
The EFW’s secondary literature has attempted to deal with this concern over omitted
controls by using exreme bounds analysis (Levine and Renelt 1992), a method in which a
regression’s key predictors’ robustness is tested against the inclusion of tens of controls through
thousands of regressions that use them in different combinations. This technique for dealing
14
with omitted variable bias resembles a form a data mining, in which an analysis throws a bucket
of controls at a relationship without making a large investment in discerning which of these
controls may be of particular relevance, given the broader context in which these case studies
unfolded. As such, potential controls that seem highly relevant – like the easing of public
financial pressures or the boom in developing market investment – are included as one of many
controls in a larger grab-bag of standard, off-the-shelf and often marginally successful other
controls.4 When the threshold for accepting a hypothesis under sensitivity analysis is lowered to
accept predictors that commonly, rather than strictly, maintain predictive power net of this grab
bag (Sala-i-Martin 1997), it can be less surprising that they pass the test. The vast majority of
the controls included in the sensitivity analyses had non-compelling reasons for being included
in the first place, and predictors that maintain significance net of these controls pass the test.
By paying close attention to periodicity, the potential that empirical relationships vary
over time, an analysis can be alerted to the possibility that the relationships inhereing in one
context drive the findings obtained in larger panels. When these consequential historical
moments are identified, they can be examined in depth to find more meaningful controls. Doing
so in this analysis drew attention to the potential importance of financial concerns, which
ultimately steered this examination to substantially different conclusions.
Methods
The analyses presented below examine the relationship between economic growth and
liberalization, with the intent of probing empirically the often-cited proposition that
economically ―freer‖ economies are generally more prosperous. It engages existing literature on
4 The literature offers a huge number of potential economic growth determinants, as the opening paragraph of Wacziarg (2002) illustrates.

15
this topic and data with three methodological qualms: the measurement of liberalism, sample
composition and ahistoricity.
Units of Analysis
The data examines individual countries as a panel of six five-year periods from 1980 to
2007 (with the last period covering only three years). This panel design is the product of the
EFW being assessed over five-year intervals prior to 2000. EFW scores represent the mean of
each period’s starting and end points, and data that is available on a yearly basis is presented as a
within-period mean.
This panel design loses some information, but superior methods of dealing with missing
data are not readily available. EFW scores on a year-by-year basis cannot be reconstructed with
full confidence because many sub-indicators are indexed via methods that involve judgment calls
that are not entirely clear in the report and could not be obtained. Interpolating or imputing
missing EFW scores on a yearly basis is difficult, because the progression of these reforms was
not linear within periods. Assessing this data over five-year periods involves a loss of
information, but this panel design makes this loss more easily comprehended and avoids the
stronger introjections of assumptions about missing values were some alternative method to be
used.
Data
Dependent Variable. The study’s dependent variable is the growth rate of per capita
GDP (2005 $PPP) from the World Bank (2010).
Economic Liberalism, “Good Governance” and Inflation. The EFW was deconstructed
to parse out constituent measures that capture laissez-faire policy from other components. The

16
original EFW index is constructed as an average score of five sub-indices, each of which
purports to capture some facet of ―economic freedom‖ as its authors define the concept. These
five sub-indices are listed below in Table 1. Each sub-index is, in turn, an averaging of rescaled
empirical indicators that suggest the presence or absence of its corresponding sub-domain of
freedom. The empirical indicators are listed in the right column of Table 1, and further details
are given in Gwartney and Lawson’s (2009) methodological index.
[Insert Table 1 about here]
The Legal Structure & Security of Property Rights sub-index is treated as an independent
variable that captures ―good governance‖ (along the lines of Burki and Perry 1998; Kaufmann,
Kraay, and Mastruzzi 2009). Inflation rates are assessed as raw GDP deflator change measures
(from World Bank 2010) that are log-transformed.5 The remaining EFW measures are re-
agglomerated using the same averaging of nested sub-indexes without the extricated measures,
resulting in an assessment of ―economic liberalism‖ that is separate from good governance and
stable prices.6
This reconceptualization offers a different sense of countries’ political-economic and
policy environment compared to Gwartney and Lawson’s original index.
5 And shifted +4 6 The reconstructed Access to Sound Money Index, which is built as the mean scores of the EFW’s money growth and access to foreign-currency denominated bank accounts, has a 0.8647 pairwise correlation with the original Access measure. The modified EFW overall index, which uses the modified Access to Sound Money index and does not include the Legal Structure & Security of Property Rights sub-index, registers a 0.9183 correlation with the original EFW overall index.

17
Table 2 (below) illustrates these changes by presenting the mean predictor scores by
world region and income groups and among selected countries.
[Insert Table 2 about here]
The deconstructed index offers a somewhat different vantage point on countries’ policy-
making environments. While wealthier countries tend to be more liberal, better governed and
more price stable, the rich world is more strongly distinguished from developing countries by
virtue of their governance and price system stability than their liberalism. Some regions –
notably Latin America – have made great strides towards laissez-faire without improving
governance commensurately.
The table also compares original ―economic freedom‖ scores and their constituent
measures among G7 and BRIC economies. It shows how aggressive liberalization is more
common in the English-speaking countries, while liberalism levels outside of that group
approach the means of developing regions like Latin America or East Asia. Many G7 members
maximize good governance instead of or in addition to economic liberalism, but their overall
―economic freedom‖ scores may not diverge from highly liberal, less well-governed countries
because liberalism indicators are strongly weighted in the EFW. The BRIC economies are not
outstanding in terms of liberalism or governance. Their distinguishing characteristics is that they
are large markets, and hence attractive investment destinations because even a small market
share in these economies can translate into sizeable profits.
International Financial Flows. In this account, international investment and the
stabilization of public finances play a potentially important role in shaping developing countries’
economic fates. The former concept is captured by measures of net FDI (% GDP), the sum of

18
equity capital, reinvested earnings and other capital investment inflows minus outflows. A
country with higher scores in this measure is experiencing a higher influx of real investment in
factories, infrastructure and business startups and expansions. The latter is measured by the costs
of public and publicly-guaranteed debt service (% GDP), principal and interest repayments on
debt obligations held by the state and those whose debt issues have been underwritten by the
state. If a government is saddled with heavy debt obligations and a market reluctance to lend to
it, these scores will be higher. Both data series are from the World Bank (2010).
Per Capita GDP. In addition to these measures, the analysis considers logged real per
capita GDP (PPP) (from World Bank 2010) as a proxy for a society’s aggregate wealth. Doing
so enables us to distinguish the effects of being rich from being liberal, well-governed or price-
stable.
Regression Models Our analysis asks whether economic prosperity (as measured by the growth rate of real
per capita GDP) is more strongly influenced by economic liberalism, good governance or price
stability, and whether these relationships have varied across historical context.
To assess the degree to which these factors have differentiated high- from low-growth
countries in individual historical periods, I employ a cross-sectional robust OLS regression of
economic growth on its predictors in five year intervals from 1980 to 2007.7 If economic
liberalism is a timeless predictor across these periods, we can take neoliberal principles to be a
strong general guide to policy. If it does not, then we have to examine what contextual changes
led it to differentiate high- from low-growth countries when they did.
7 With 2005 through 2007 representing its own period. The choice of a robust regression is rooted in diagnostics’ suggestion that simple OLS would violate the assumptions of homoskedasticity and may be vulnerable to influential outliers.

19
My analysis will show that liberalism effectively differentiates high- from low-growth
countries in a specific historical context: the early 1990s. As already noted, this period was one
in which much of the developing world emerged from chronic stagflation. These countries made
the greatest strides towards liberalism in this context, but also enjoyed debt relief and a global
―emerging markets‖ investment mania. I use an autoregressive panel corrected standard error
(PCSE) OLS (Beck and Katz 1995) to examine this relationship in a panel design. 8
Missing Data
It was implemented using the Amelia II package (Honaker, King and Blackwell 2007).
Missing data are assumed to be missing at random (MAR),9 and imputed as described in King et
al. (2001).10 Diagnostics generally suggested credible results, although the imputations appear to
underestimate extreme values on many indicators.11
The Changing Contexts of Economic Growth’s Pursuit As noted above, the past thirty years’ economic record is made up of smaller, empirically
distinguishable sub-periods. Prior to the late-1980s, much of the developing world (and hence
much of the world as a whole), was mired in crises of government insolvency and money system
collapse. Countries spent much of the 1980s trying, but often failing, to restore their public
finances and financial system stability often through illiberal, interventionist policies (see Sachs
8 The model choice is a product of diagnostics’ assessment of serial correlation and contemporaneous correlation. 9 As opposed to missing completely at random (Allison 2002). In this analysis, the MAR assumption is rooted in the observation that other covariates examined here often offer reasonable predictors of missingness, particularly per capita GDP. Breusch-Pagan / Cook-Weisberg tests for heteroskedasticity rendered p-values below 0.10 for all periods except the early-1980s. Cook’s distance tests for outliers suggested that between 5% and 15% of observations could be influential. 10 See Honaker, King and Blackwell (2007) for an extended explanation. Lags and leads were included for all variables in the model. Variable shifts and transformations were performed before the imputation process. A polynomial of time was specified at 2. Ten sets were imputed. 11 Imputation diagnostics suggest that imputed values were generally reasonable estimates. Overimputation diagnostics suggest that the imputation model tends to estimates extreme values are more moderate (i.e., large and negative values were predicted to be negative, but only moderately large, and vice--versa for very large positive values), but there was a positive relationship between observed values and their imputed estimates in this diagnostic.

20
1989 for case studies). Near the time of the Soviet Union’s collapse, the US, IMF, World Bank
and other rich world agents offered to bail out financially-distressed countries in exchange for
liberalization reforms. Many countries accepted the offer, and were rewarded with large influxes
of private foreign investment. As time progressed, the growth-related downsides of
liberalization were becoming increasingly apparent to researchers, but the momentum of then-
institutionalized liberalization orthodoxies remained. These historical changes in
macroeconomic performance and policy are illustrated below.
Economic Prosperity Over most of the 1980s, the developing world was mired in chronic stagflation, a
problem that became acute after these countries assumed massive debts during a sovereign
lending mania over the 1970s and a developing world debt crisis after Mexico’s threatened
default in 1982. By the end of the 1980s and early-1990s, the confluence of several events
discussed above helped contain this stagflation. From 1995 to 2007, the developing world
enjoyed a relatively stable prosperity compared to the crisis years of the 1980s. Time will tell
how their economic fates will fare after the 2008 crisis.
Figure 1 (below) presents two box plots depicting the distribution of growth (left) and
inflation (right) rates in the developing world from 1980 to 2007.12
[Insert Figure 1 about here]
The figures collectively offer the following view of macroeconomic performance’s
changing character. Prior to 1995, economic contraction and comparatively high inflation rates
were quite common in developing countries. Approximately 28% of all country-years depicted
12 The boxes denote the inter-quartile range of growth and inflation rates in any given year. Near the middle range of each box, a horizontal line marks the year’s median score. The lines stretching from these boxes provide a sense of the spread of values occurring outside of the IQR. The graphs suppress outliers.

21
in the left box plot contracted throughout this period, compared to 16% after 1995. Likewise,
approximately 24% and 13% of these country-years experienced inflation rates in excess of 20%
and 40%, respectively, compared to 12% and 4% afterward. Pairwise t-tests for differences in
group proportions suggests that these differences are highly significant. Virtually all world
regions experienced improvements in growth and inflation at the median after 1995 except for
East Asia, whose economic performance was generally strong prior to 1995.
The transition from chronic stagflation to stable prosperity is often argued to have been
produced by liberalization reforms that were implemented widely over the 1990s. We examine
the bivariate relationship between liberalization and possible alternative explanations for the
developing world’s recovery next.
Liberalization Policy & Growth
When metrics of economic liberalism are parsed from governance- and inflation-related
measures, the data suggest that developing countries have steadily embraced free market reforms
during the developing world’s recovery. Governance, in contrast, exhibits more modest
improvements in this period. Figure 2 (below) presents a median line plot of countries’
―economic freedom‖, liberalism and governance scores over five year intervals from 1980 to
2007.
[Insert Figure 2 about here]
The graph shows how developing countries began a long reform trend towards laissez-
faire between 1985 and 1990, the period in which the Cold War ended and a range of
liberalization-conditioned debt aid programs were launched. At the median, these reforms
continued over the long era of prosperity that occurred between the mid-1990s and 2007. All of

22
the world’s regions liberalized across all four policy domains assessed by the EFW (size of
government, sound money, free trade and regulation). The progress of liberalization reforms
were strongest in the former communist countries, which had the most room to liberalize. Aside
from this group, the world’s regions have all made definitive moves towards free markets in
different policy domains. Latin America, for example, led the world in containing expansionary
monetary policy and liberalizing capital controls. The Middle East and Africa cut the size of
government and regulation more aggressively. South Asia embraced free trade with gusto.
The developing world made great strides towards embracing free market ideals, and
enjoyed a concurrent rise in prosperity. Over the entire period under study, our liberalism index
exhibits an insignificant mean period-wise pairwise correlation of r=0.1800 with growth rates.
At first glance, more liberal countries exhibit statistically identical growth rates to less liberal
ones. Growth’s pairwise relationships with our governance index and per capita GDP are also
not significant. Only inflation exhibits a mildly significant correlation with growth rates (r=-
0.11, p<0.10). In other words, the only countries that have made straightforward headway in
securing stronger growth rates are those that have tended to keep their price systems under
control.
Relieving the Financial Strains of the 1980s
In addition to liberalizing, the developing world saw major changes in the stability of
their financial system and the reemergence of inward direct investment. The containment of
inflation is one indicator of the macrofinancial improvements enjoyed by the developing world
over the 1990s and 2000s. Below, I consider two additional improvements: easing debt strains
and a boom in international investment. These changes are depicted in a table of two box plots
presented as Figure 3 below.

23
[Insert Figure 3 about here]
Changes in public and publicly-guaranteed (PPG) debt service are depicted in the left box
plot. A few benchmarks can help interpret this graph. One percentage point of GNI represents a
large sum of money, equivalent to roughly $98 billion for the US in 2009. In 2009, Moody’s
estimated US debt service obligations to be 7% of its revenues (Brown 2010), which corresponds
to roughly 1.4% of GNI.13 America’s comparatively low debt service obligations are further
eased by its government’s markedly greater capacity to extract tax revenues from their populace
and enjoy a stronger position in the global financial system, which in turn given them a greater
capacity to borrow affordably and attract external capital that mitigates the strains of public debt
service on overall macrofinancial stability. Over much of the 1980s, developing countries had
difficulty raising taxes, securing export revenues or accessing credit. They were already
suffering from inflation, which presents systemic financial concerns of their own.
The uptick in PPG debt service pressures is visible around the 1982 Mexican default,
with those obligations rising by a median of roughly one percentage point from 1981 to 1983.
They grow continuously over much of the 1980s, peaking in 1986 and dropping precipitously
around 1989. This drop followed a range of previously-mentioned debt relief initiatives, which
helped ease credit and the temerity of potential sovereign lenders more generally. Although
there is a brief uptick in debt service costs around 1994, when the Mexican peso crisis spooked
markets, these obligations see a broad diminishments over the 1990s and 2000s, mirroring the
changes experienced in laissez-faire’s reach.
13 Given the US Office of Management and Budget’s estimate of roughly $2 trillion in on-budget receipts (Budget 2010)

24
Net FDI exhibits a similar pattern of long-term growth beginning around the turn of the
1990s. The shape of the boxes in this graph suggest that a more limited range of choice FDI
destinations benefitted from the ―emerging markets‖ financial boom during the 1990s, but that
broader improvements were realized as countries emerged from their transition pains and
inflation of the early-1990s and globalization became more deeply entrenched.
These two changes represent a dramatic easing of the problems that plagued much of the
developing world over the 1980s. During that decade, governments were being paralyzed and
choked by financing problems and inflation, and faced a souring lending market and very little
inward investment to offset these pains. The confluence of the Cold War’s end, serious fiscal
restructuring and the emergence of a new world economy helped ease these pressures.
One might argue that liberalization was necessary to elicit these changes. Lenders would
not have channeled capital to fiscally-hemorrhaging pre-reform governments and no incentive
for FDI would have existed prior to austerity measures and the opening of the global economy.
This is probably true, but seeing neoliberalism’s effect as accruing through the relief of these
macrofinancial problems represents a much more limited understanding of these reforms’
benefits. If neoliberalism benefitted country by resolving crisis only, why pursue further
liberalization reforms once the crisis has passed? Could the same results have been obtained
were countries to have simply defaulted, or been given debt relief without such strong
conditionalities? How many of these changes were the result of liberalization policies not
directly related to opening one’s markets to foreign investment or restoring fiscal balance on
one’s own without strong deregulation, tax inducements, union-busting or welfare state cutbacks,
for example? And what about the free market’s other purported benefits, like its ability to spur

25
domestic entrepreneurship, innovation, economic flexibility or incentives for economic
participation?
Next, I examine liberalism’s purported economic benefit net of these financial pressure-
easing changes through regression analysis.
Regression Analysis
This analysis’ findings are rooted in the observation that periodicity governs economic
liberalism’s relationship with growth, and a subsequent assessment of the contextually-specific
concurrent changes that could render this relationship spurious. They are presented below.
Periodicity in Neoliberalism’s Cross-Sectional Relationship with Growth. ―Economic
freedom‖ exhibits a significant relationship with growth rates prior to 2000, after which its
relationship becomes negative though insignificant. When we parse elements of ―economic
freedom‖ that suggest laissez-faire policy from those that suggest good governance or the
restoration on money system stability, we find that hands-off economic governance is clearly
related to faster economic growth in one period: 1990 to 1995. As noted above, this was the
period in which new public debt relief schemes and a booming ―emerging markets‖ investment
mania helped alleviate the strains of a profound general financial crisis in which much of the
developing world was enmeshed during the 1980s.
Table 3 (below) presents robust regressions of growth rates on ―economic freedom‖
measures and per capita GDP levels in developing countries over five-year intervals from 1980
to 2007. They provide a profile of what differentiated faster- from slower-growing countries
during each of the time periods in question:

26
[Insert Table 3 about here]
The odd-numbered models in Table 3 assess the original EFW index’s relationship with
growth rates, which resembled the method used in prior analyses of this data. Prior to 2000, the
index exhibits a significant, positive relationship with growth at the p<0.10 level or better. The
coefficient sizes of these models suggest fairly strong effects, amounting to a difference of 1.2 to
3.9 percentage point annual growth rates between countries scoring at the developing world’s
75th versus 25th percentile ―freedom‖ measures. If one were to accept the original EFW index as
a measure of ―free markets‖ in the sense of laissez-faire policy, then these results might be taken
as suggesting a roughly twenty-year record of success for neoliberal policy. However, the index
conflates laissez-faire with good governance and a stable price system, necessitating a
deconstruction of the index in which we isolate measures that strictly suggest free market policy
from other constituent measures.
The even-numbered models in Table 3 run these same regressions on the deconstructed
EFW, and reveal very different results. During the early-1980s (Model II), the positive
relationship between ―economic freedom‖ and growth appears to be the product of its
governance and inflation components, while economic liberalism itself shows a negative
relationship with growth. This period’s prosperous countries were ones that avoided inflation
problems, maintained civilian governments, had fair and well-functioning legal systems and a
state that was not abusing private property rights. If anything, small government, low tax, low
regulation countries fared poorly in terms of growth. In the late-1980s (Model IV) and late-
1990s (Model VIII), the data exhibit similar relationships. Liberalism shows no relationship
with growth, inflation’s effects become inert and only good governance remains significant.

27
Liberalism’s relationship with growth is strong only in the early-1990s (Model VI), when
government bailouts and an emerging markets investment mania were taking place. Consistent
with views that markets were rewarding liberalization reforms, perhaps regardless of its
implementation’s finer details, Model VI suggests that a strong legal system and property rights
hurt growth rates in this period. Inflation control was a significant growth predictor, which
could be interpreted as signaling the importance of a stable money system in some kind of
endogenously-generated development process. Alternatively, however, inflation’s effects could
be understood as an important factor in attracting foreign capital that flowed to developing
countries after the Cold War.
After 2000, only inflation is associated with growth, and its effects are positive. This
may be a product of reverse-causality. Inflation was reasonably well-controlled in these periods,
meaning that relatively higher rates from these eras do not signal the kind of money system
distress that relatively high rates for the 1980s through early 1990s signaled. I interpret these
results as a product of faster growth creating more inflation. When inflation is stable globally,
comparatively higher rates are not necessarily problematic. After 2007, as much of the world
economy seems threatened by deflation, inflation’s positive relationship with growth may
continue or even strengthen.
Cross-sectional regressions presented in Table 3 establish that economic liberalism fails
to differentiate prosperous from non-prosperous countries across most historical contexts.
Contrary to some interpretations and uses of the EFW reports, and similar ones in contemporary
policy-oriented debates, what has ailed the economic world’s economic basket cases in any given
period is not their comparative lack of unfettered markets. There does not appear to be some

28
kind of continuous race towards economic growth in which the more liberal economy is
constantly rewarded with more growth.
These results do not establish that neoliberal reforms were generally irrelevant in
countries’ pursuit of growth. During the 1980s, most of the developing world was substantially
more illiberal and more economically stagnant. After the Cold War, they collectively took major
steps towards economic liberalism and more prosperity. These cross-sectional comparisons
cannot determine whether or not post-Cold War reforms helped everyone in similar ways. There
may not be an ever-lasting race towards maximal growth by maximizing liberalism, but everyone
might be better off as a result of the neoliberal reforms that became entrenched in the early-
1990s. These longitudinal changes can be examined by looking at countries’ economic records
as panels.
Pooled Cross-Sectional Time Series Regressions. In the previous section, we
established that comparative levels of economic liberalism fail to differentiate high- from low-
growth countries cross-sectionally over much of the thirty years, aside from the early 1990s.
This period was one in which many features of the global economy changed. It embraced
liberalization broadly, had its heavy public debts restructured through external aid, saw a
massive emerging markets boom, and finally brought inflation under control. After these
changes became entrenched, the developing world enjoyed faster growth rates.
In an attempt to discern the relative importance of these different factors over time, I
employ a PCSE OLS, whose results are given below in Table 4:
[Insert Table 4 about here]

29
Models XIII through XVII employ listwise deletion to handle missing data, biasing the
sample in favor of countries and time periods that tend to report data. Model XIII shows
―economic freedom‖ to be a significant growth predictor, and its deconstruction in Model XIV
suggests that economic liberalism, governance and inflation are all significant in isolation.
Concretely, Model XIII suggests that a country whose ―economic freedom‖ score sits at the
sample’s 75th percentile will growth at an average annual rate of roughly 2.7 percentage points
higher than one at the 25th percentile. For liberalism, governance and inflation, these estimated
growth rate differences are 1.3, 1.4 and -8 percentage points, respectively (Model XIV).
Model XV introduced net FDI and public debt service to the model to see if its inclusion
washed out any constituent measures of economic freedom. The result is a dramatic drop in the
size and significance of liberalism’s effects, and some loss of influence for governance measures.
In other words, once we control for the possibility that liberalism’s apparent growth effects are
the product of the investment it attracted and public debt refinancing opportunities it afforded,
liberalism shows no demonstrable direct effects on growth. Possible liberalism-related effects
that have nothing to do with FDI or debt relief – like incentivizing local entrepreneurship,
promoting organizational flexibility and adaptability, spurring innovation, etc. – exhibit no clear
independent effect on growth.
One potential problem with Model XV is that the inclusion of these additional controls
causes a loss of observations, amounting to roughly 21% of Model XIV’s sample. To test
whether the washing out of liberalism and governance’s effects is a product of change in sample
composition, I re-ran Models XIII and XIV using only the countries represented in Model XV.
The results suggest that liberalism’s loss of predictive power is partly attributable to sample

30
changes, but the predictor remains sizeable and reasonably significant in this sample before the
inclusion of FDI and PPG debt serve controls.
A better way of handling missing data is through multiple imputation with randomness.
Models XVIII through XX replicate XIII through XV using multiple imputation with
randomness, and their results offer a somewhat different view of the data. The ―economic
freedom‖ indicators’ predicted effects are quite similar in a fully-represented sample (Model
XVIII). In Model XIX, the analysis suggests that the previously-observed effects of liberalism
(in Models XIV and XVII) may be a product of sample composition as well. A stronger missing
data handling method suggests its effects were weakly probably from the outset. Governance
retains its predictive power in Model XIX.
When the FDI and debt service predictors are included in Model XX, both liberalism and
governance lose their predictive power again. This suggests that economic gains to liberalism
and governance can be attributed to the effects of these two new controls, perhaps especially
FDI. I interpret these results as suggesting that observations of increased prosperity following
the world’s liberalization and governance improvements may be attributable to the concurrent
international investment boom that took place.
Inflation, for its part, remains a significant predictor, suggesting that price system
stabilization has played an important role through this process.
Discussion
Over the past thirty years, conventional policy wisdom has held that free markets help
countries develop. The free market was often held to be an intrinsically superior means of

31
organizing economic activity for the purposes of fostering growth. It was thought to produce
incentives that encouraged micro-level actors to invest, innovate and adapt, while releasing the
economy from the grip of high-minded, impractical, unsustainable and often politically-
motivated government influence. This view seemed to be vindicated by a historical record that
saw the developing world emerge from economic stagnancy once neoliberal reforms were
adopted.
In this paper, I showed that freer markets did not differentiate faster- from slower-
growing developing economies outside of the early 1990s, and hypothesize that the historical
specificity of this relationship is associated with the debt aid and inward investment that was
rewarded to countries that liberalized in that period. Debt aid and inward investment were
desperately needed in that context because, during the prior decade, much of the developing
world suffered from virtual government bankruptcy, collapsing money systems and the many
economic problems that occur in such a context.
These findings offer several interesting vantage points form which we can reconsider the
neoliberal revolution, its economic consequences and the process of development more
generally. I interpret these results as suggesting that systemic financial crisis and not over-
reaching government interventionism may have been a principle cause of the economic problems
from which neoliberalism emerged. These two problems are not the same thing. An expansive
public sector can be fiscally sustainable so long as its tax base, capacity to restrain spending and
economic growth rates are sufficiently high. This analysis suggests that laissez-faire exerts
weak, if any, independent effect on growth. Likewise, a ―small government‖ economy can run
into fiscal problems if its tax base is weak and politicians profligate.

32
Neoliberalism’s chief developmental benefits may have been in resolving a serious,
seemingly-intractable period of fiscal and monetary crisis in developing countries. It is worth
emphasizing that government initiative, and not markets alone, helped resolve it. State programs
like the US Brady Plan or IMF lending may have played a decisive role in restoring financial
order in the developing world’s financial markets. The question of whether the crisis was
resolved by markets per se, or a cooperative attitude on the part of rich countries that came to see
the stabilization of the developing world as aligned with their own interests, is worth pursuing. It
is worth noting that, prior to the late-1980s, Western countries often placed the onus of resolving
these crises more squarely on the shoulders of distressed sovereign borrowers, even though their
own financial institutions lent the money recklessly.
More broadly, the debt crisis served as a possible first indication that unfettered capital
markets were prone to destabilizing risk-taking. It took several decades, and a crisis that hurt the
rich countries themselves, to develop the notion that unregulated private financiers could play a
role in creating crisis. One might ask whether the Lost Decade and our current crisis would have
been averted had governments understood that unregulated global financial markets posed
threats to states collectively. The 1980s was an occasion for states to entertain the potential
usefulness of cooperating to contain their exposure to private financial interests. Then, as now,
the opportunity passed.
Within developing countries themselves, one of neoliberalism’s key benefits was the
opportunities it provided to break the political gridlock that kept states bankrupt. Fiscal crises
can spark fierce distributional battles, which can paralyze states. Loan conditionality enabled
politicians to break this gridlock by externalizing the impetus for austerity measures. Anger of
tax or spending changes could be diverted to the US or IMF. Breaking gridlock in this way is

33
not the only weak to overcome budgetary impasses. An alternative means involves advancing
political positions that pursue reasonable sacrifices across society. If an electorate can be
convinced that everyone needs to make sacrifices, and that no one is using the occasion of
sacrifice-making to enrich themselves personally, countries may be able to resolve similar
problems with more incremental and consensual, rather than forceful and disruptive, reforms.
From a sociological vantage point, the story of neoliberalism offers a case study in some
of the finer details by which institutionalized policy beliefs emerge. Institutionalized beliefs and
practices often begin as practical strategies for resolving concrete problems – as was the case
with the Washington Consensus. Over time, strategies used to resolve concrete problems
become conventionalized, and applied as generic solutions to a broader class of problems. This
may describe what happened with neoliberalism. It was a concrete attempt to rescue developing
countries from a specific financial crisis by incentivizing inward investment and debt
refinancing. Over time, its concrete manifestations came to be understood as a fall-back solution
to policy problems. It was a hammer in search of nails. The disadvantages of strongly
conventionalized policy axioms are now apparent, especially in terms of incentivizing finance.
Governments sought to stimulate investment as a matter of practice, and in so doing cultivate
massive and risky speculative markets. These markets ultimately created the current global
economic crisis.
Finally, the study suggests the benefits of considering historicity in the analysis of
policies’ effectiveness. Policies can work differently in changing contexts, and the global
economy is a complex system that changes continually. Analysts should be wary of assuming
that the relationships in their theories operate trans-historically. Aside from the fact that most

34
policy strategies behave a certain way in particular times and places, ignoring the possibility for
historicity closes the door to potentially interesting findings.

35
Works Cited
Allison, Paul David. 2002. Missing Data. Thousand Oaks, CA: Sage Publications. Barsky, Robert B. and Lutz Kilian. 2001. "Do We Really Know That Oil Caused the Great Stagflation? A Monetary Alternative."
NBER Macroeconomics Annual 16:137-183. Beck, Nathaniel and Jonathan Katz. 1995. "What to do (and not to do) with Time-Series Cross-Section Data." American Political
Science Review 89:634 - 647. Berggren, Niclas. 2003. "The Benefits of Economic Freedom: A Survey." The Independent Review 8:193 - 211. Block, Fred L. 1977. The origins of international economic disorder : a study of United States international monetary policy
from World War II to the present. Berkeley: University of California Press. Brown, Matthew. 2010. "U.S., U.K. Move Closer to Losing Rating, Moody's Says." in Bloomberg. New York: Bloomberg. Bruton, Henry J. 1998. "A Reconsideration of Import Substitution." Journal of Economic Literature 36:903 - 936. Budget, United States Office of Management and. 2010. "Historical Tables: Budget of the United States Government FY 2009."
United States Department of Management and Budget, Washington, DC. Burki, Shahid Javed and Guillermo Perry. 1998. Beyond the Washington Consensus: Institutions Matter. Washington, D.C.:
World Bank. Centeno, Miguel A. and Joseph N. Cohen. 2010. Global Capitalism: A Sociological Perspective. Malden, MA: Polity Press. Cohen, Joseph N. 2009. "Is "Economic Freedom" Strictly Free Market Capitalism? A Decompositional Analysis of the Economic
Freedom of the World Index." in MPRA Working Paper No. 22437: http://mpra.ub.uni-muenchen.de/22437/. Cuddington, John T. 1989. "The Extent and Causes of the Debt Crisis of the 1980s." Pp. 15 - 41 in Dealing with the Debt Crisis,
edited by I. Husain and I. Diwan. Washington, DC: World Bank Publications. De Haan, Jakob, Susanna Lundstrom, and Jan-Egbert Sturm. 2006. "Market-Oriented Institutions and Policies and Economic
Growth: A Critical Survey." Journal of Economic Surveys 20:157 - 191. Dornbusch, Rudiger and Sebastian Edwards. 1989. The Macroeconomics of Populism in Latin America. Washington, DC: World
Bank. Dreher, Axel. 2002. "The Development and Implementation of IMF and World Bank Conditionality." Hamburg Institute of
International Economics, Hamburg. Edwards, Sebastian. 1995. Crisis and Reform in Latin America : From Despair to Hope. Oxford ; New York: Published for the
World Bank by Oxford University Press. Flood, Robert P. and Nancy P. Marion. 1999. "Perspectives on the Recent Currency Crises Literature." International Journal of
Finance and Economics 4:1 - 26. Friedman, Milton. 1968. "The Role of Monetary Policy." American Economic Review 58:1-17. Guash, J. Luis and Robert W. Hahn. 1999. "The Costs and Benefits of Regulation: Implications for Developing Countries."
World Bank Research Observer 14:137 - 158. Gwartney, James and Robert Lawson. 2006. "Economic Freedom of the World: 2006 Annual Report." Frasier Institute,
Vancouver. —. 2009. "Economic Freedom of the World: 2009 Annual Report." Frasier Institute, Vancouver. Harvey, David. 2005. A brief history of neoliberalism. New York: Oxford University Press. Hayek, Friedrich A. 1945. "The Use of Knowledge in Society." American Economic Review 35:519 - 530. Honaker, James and Gary King. 2010. "What to Do about Missing Values in Time-Series Cross-Section Data." American Journal
of Political Science 54:561 - 581. Honaker, James, Gary King, and M. Blackwell. 2007. "Amelia II: A Program for Missing Data." Cambridge, MA. Isaac, Larry W. and Larry J. Griffin. 1989. "Ahistoricism in Time-Series Analysis of Historical Processes: Critique, Redirection
and Illustrations from US Labor History." American Sociological Review 54:873 - 890. Kaufmann, Daniel, Aart Kraay, and Massimo Mastruzzi. 2009. "Governance Matters VIII: Aggregate and Individual Governance
Indicators, 1996 - 2008." World Bank, Washington, DC. King, Gary, James Honaker, Anne Joseph, and Kenneth Scheve. 2001. "Analyzing Incomplete Political Science Data: An
Alternative Algorithm for Multiple Imputation." American Political Science Review 95:49 - 69. Klein, Daniel B. and Charlotta Stern. 2007. "Is there a Free Market Economist in the House? The Policy Views of American
Economics Association Members." American Journal of Economics and Sociology 66:309 - 334. Kolodko, Grzegorz W. 2000. From shock to therapy : the political economy of postsocialist transformation. New York: Oxford
University Press. Kruger, Anne O. 1974. "The Political Economy of the Rent-Seeking Society." American Economic Review 64:291 - 303. —. 1990. "Government Failures in Development." Journal of Economic Perspectives 4:9 - 23. Levine, Ross and David Renelt. 1992. "A Sensitivity Analysis of Cross-Country Growth Regressions." American Economic
Review 82:942- 963. Mainwaring, Scott, Ana María Bejarano, and Eduardo Pizarro Leongómez. 2006. The Crisis of Democratic Representation in the
Andes. Stanford: Stanford University Press. Miller, Terry and Kim R. Holmes. 2010. "2010 Index of Economic Freedom." Washington, DC: Heritage Foundation/Wall St.
Journal.

36
Sachs, Jeffrey. 1989. "Introduction." Pp. 1 - 36 in Developing country debt and the world economy, edited by J. Sachs. Chicago: University of Chicago Press.
Sala-i-Martin, Xavier. 1997. "I Just Ran Two Million Regressions." American Economic Review 87:178 - 183. Snider, Lewis W. 1996. Growth, Debt, and Politics: Economic Adjustment and the Political Performance of Developing
Countries. Boulder, CO: Westview Press. Tures, J. A. 2003. "Economic Freedom and Conflict Reduction: Evidence from the 1970s, 1980s and 1990s." Cato Journal
22:533 - 542. Wacziarg, Romain. 2002. "Review of Easterly's "The Elusive Quest for Growth"." Journal of Economic Literature 40:907 - 918. Williamson, John. 1990. "What Washington Means by Reform." Pp. Ch. 2 in Latin American Adjustment: How Much has
Happened?, edited by J. Williamson. Washington: Institute for International Economics. World Bank. 2010. "World Development Indicators." World Bank. Yergin, Daniel and Joseph Stanislaw. 2002. The Commanding Heights: The Battle for the World Economy. New York: Simon &
Schuster.
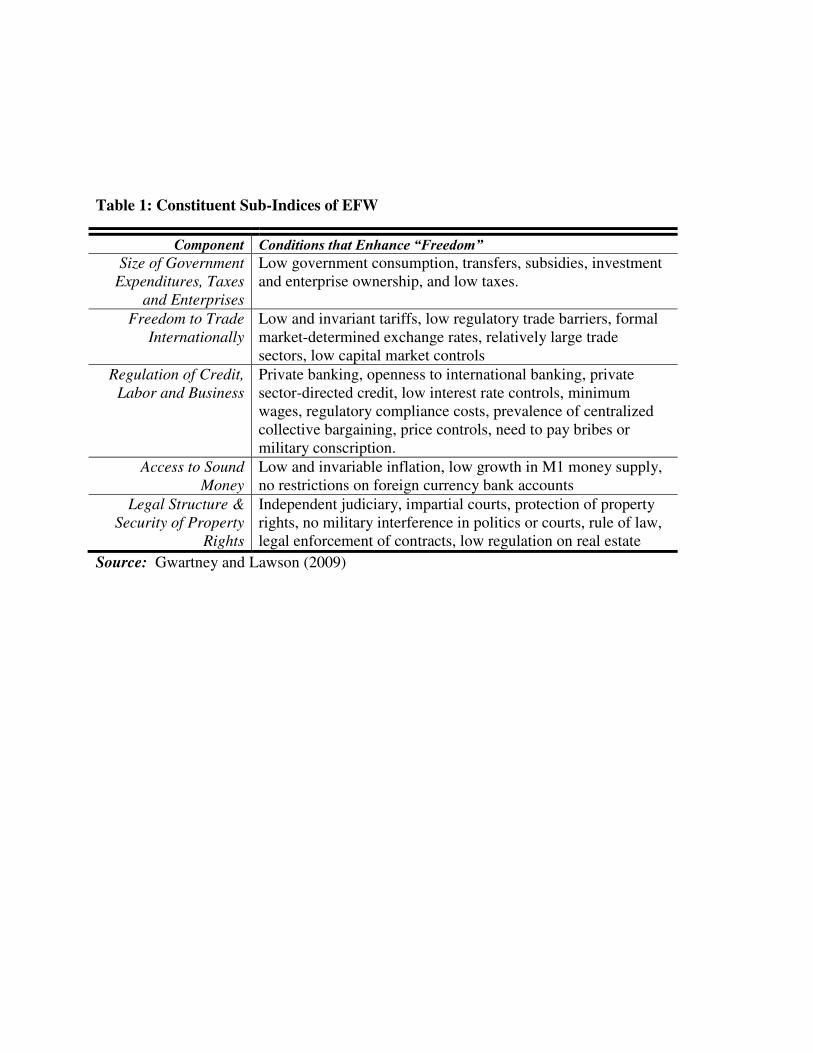
Table 1: Constituent Sub-Indices of EFW
Component Conditions that Enhance “Freedom”
Size of Government
Expenditures, Taxes
and Enterprises
Low government consumption, transfers, subsidies, investment and enterprise ownership, and low taxes.
Freedom to Trade
Internationally
Low and invariant tariffs, low regulatory trade barriers, formal market-determined exchange rates, relatively large trade sectors, low capital market controls
Regulation of Credit,
Labor and Business
Private banking, openness to international banking, private sector-directed credit, low interest rate controls, minimum wages, regulatory compliance costs, prevalence of centralized collective bargaining, price controls, need to pay bribes or military conscription.
Access to Sound
Money
Low and invariable inflation, low growth in M1 money supply, no restrictions on foreign currency bank accounts
Legal Structure &
Security of Property
Rights
Independent judiciary, impartial courts, protection of property rights, no military interference in politics or courts, rule of law, legal enforcement of contracts, low regulation on real estate
Source: Gwartney and Lawson (2009)

Table 2: Original & Modified EFW Index & Sub-Index Scores by World Region and Income Group and For Selected Countries, 2005 - 2007
Econ. Freedom
Econ. Liberalism Governance Inflation
Per Capita
GDP GDP
Growth*
OECD 7.6 7.5 8.2 2.8 $35,069 2.1
Eastern Europe 6.9 7.1 5.9 5.8 $14,306 3.1
Latin America & Caribbean 6.7 7.0 5.1 7.6 $8,722 1.8
East Asia & Pacific 6.6 6.6 5.7 6.8 $9,115 2.7
Ex-USSR 6.6 6.7 5.5 16.1 $5,693 1.8
Middle East & North Africa 6.6 6.6 6.3 10.9 $17,751 1.3
South Asia 6.0 5.8 4.6 7.5 $2,534 4.0
Sub-Saharan Africa 5.9 6.0 4.4 15.1 $3,299 1.2
High Income 7.6 7.4 7.9 4.3 $34,749 2.0
Upper-Middle Income 6.9 7.0 6.1 8.1 $13,908 2.8
Lower-Middle Income 6.4 6.5 5.2 8.7 $5,427 2.2
Low Income 5.9 6.0 4.3 14.4 $1,444 1.1
United States 8.1 8.2 7.7 2.8 $42,556 1.9
United Kingdom 8.0 7.9 8.4 2.5 $33,623 2.2
Canada 8.0 7.9 8.5 3.2 $35,786 1.7
France 7.2 7.1 7.6 2.4 $30,317 1.5
Germany 7.6 7.2 8.7 1.2 $32,643 1.9
Japan 7.5 7.3 8.0 -0.9 $31,094 2.1
Italy 7.0 7.2 6.2 2.3 $28,439 1.5
China 6.3 6.2 6.0 5.5 $4,800 8.8
India 6.5 5.9 6.3 5.1 $2,492 4.4
Russia 6.4 6.3 5.7 16.9 $13,327 0.8
Brazil 6.0 5.9 5.2 5.7 $8,978 1.0
Total 6.6 6.7 5.7 9.4 $11,941 1.9
*GDP growth rates for 1980 - 2007

Table 3: Robust Cross-Sectional OLS Regressions of Economic Growth Rates, by Five-Year Period, 1980 - 2007
Period Model
Econ.
Freedom Econ. Liberalism
Govern-
ance Inflation
(logged)
Per Cap
GDP
(logged) Constant N R2
1980 - 1985
I 0.922^
-- -- -- -0.447 -1.268 80 0.05
(0.488) (0.405) (3.351)
II -- -0.326 0.836* -0.732 -0.517 4.318 78 0.15
(0.343) (0.322) (0.446) (0.424) (3.448)
1985 - 1990
III 1.171**
-- -- -- -0.269 -3.218 83 0.12
(0.321) (0.321) (2.454)
IV -- 0.447 0.631* -0.043 -0.438 -0.778 79 0.11
(0.302) (0.282) (0.219) (0.364) (2.654)
1990 - 1995
V 1.991***
-- -- -- -0.124 -9.210*** 94 0.24
(0.408) (0.337) (2.596)
VI -- 1.039** 0.022 -1.030*** 0.149 -3.009 94 0.35
(0.356) (0.366) (0.277) (0.412) (2.835)
1995 - 2000
VII 0.631^
-- -- -- 0.394^ -5.244** 95 0.14
(0.318) (0.235) (1.845)
VIII -- -0.009 0.678* -0.542^ 0.195 -2.020 95 0.24
(0.255) (0.235) (0.312) (0.262) (2.248)
2000 - 2005
IX 0.167
-- -- -- 0.690** -4.029^ 113 0.11
(0.378) (0.251) (2.094)
X -- -0.060 0.013 0.761* 0.521^ -3.753 113 0.11
(0.264) (0.171) (0.358) (0.268) (2.634)
2005 - 2007
XI 0.408
-- -- -- 0.507* -2.970 113 0.12
(0.338) (0.236) (1.847)
XII -- 0.210 0.173 1.714 ** 0.479^ -6.635** 112 0.17
(0.266) (0.233) (0.549) (0.252) (2.507) ***p<0.001, **p<0.01, *p<0.05, ^p<0.10
Standard errors in parentheses below coefficient estimates

Table 4: Regression of Economic Growth on Economic Liberalism Metrics and Other Controls, Developing Countries, Five Year Intervals from 1980 - 2007
Model XIII XIV XV XVI XVII XVII XIX XX
“Economic Freedom” 1.684*** -- -- 1.622*** -- 1.475*** -- --
(0.290)
(0.285)
(0.399) Economic Liberalism -- 0.620** 0.198 -- 0.542* -- 0.579^ 0.392
(0.206) (0.266)
(0.235)
(0.329) (0.344)
Governance -- 0.525** 0.409* -- 0.575*** -- 0.513* 0.383
(0.187) (0.167)
(0.166)
(0.232) (0.227)
Inflation (logged) -- -0.764** -0.748*** -- -0.712** -- -0.807^ -0.827*
(0.263) (0.225)
(0.249)
(0.422) (0.406)
Net FDI (logged) -- -- 1.948* -- -- -- -- 1.315*
(0.852)
(0.535)
PPG Debt Service (logged) -- -- -0.963^ -- -- -- -- -0.141
(0.543)
(0.440)
Per Capita GDP (logged) -0.144 -0.131 0.404 0.090 0.228 -0.267 -0.331 -0.266
(0.172) (0.167) (0.253) (0.232) (0.195) (0.212) (0.209) (0.220)
Constant -6.629*** -0.992 -3.930** -7.969*** -3.597* -4.496* 0.906 0.145
(1.031) (1.493) (1.208) (1.317) (1.510) (1.904) (2.094) (1.974)
N 579 572 453 452 453 1,008 1,008 1,008
N(groups) 114 114 91 91 91 168 168 168
R-Squared 0.14 0.15 0.23 0.15 0.15 Missing Data Handling LWD LWD LWD LWD LWD MIR MIR MIR
***p<0.001, **p<0.01, *p<0.05, ^p<0.10. Standard errors in parentheses under coefficients. LWD = listwise deletion, MIR = multiple imputation with randomness R-squared estimates for MIR models represent averages of models run on ten imputed sets used to generate results
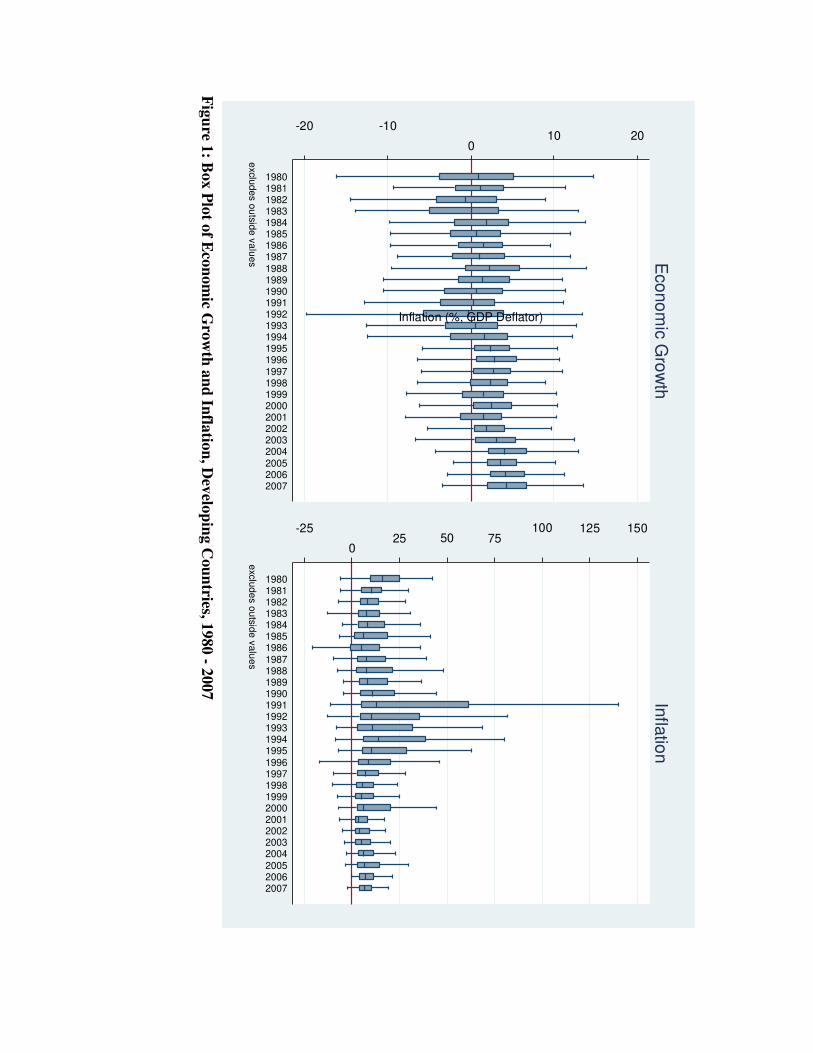
F
igu
re 1: B
ox P
lot o
f Eco
nom
ic Gro
wth
an
d In
flatio
n, D
evelo
pin
g C
ou
ntries, 1
980 - 2
007
-20 -10
010 20
19801981198219831984198519861987
198819891990199119921993199419951996
19971998199920002001200220032004
200520062007
exclu
de
s o
uts
ide
va
lue
s Eco
no
mic
Gro
wth
-25
025 50 75
100 125 150
Inflation (%, GDP Deflator)
1980198119821983198419851986
198719881989199019911992199319941995
199619971998199920002001200220032004
200520062007
exclu
de
s o
uts
ide
va
lue
s
Infla
tion
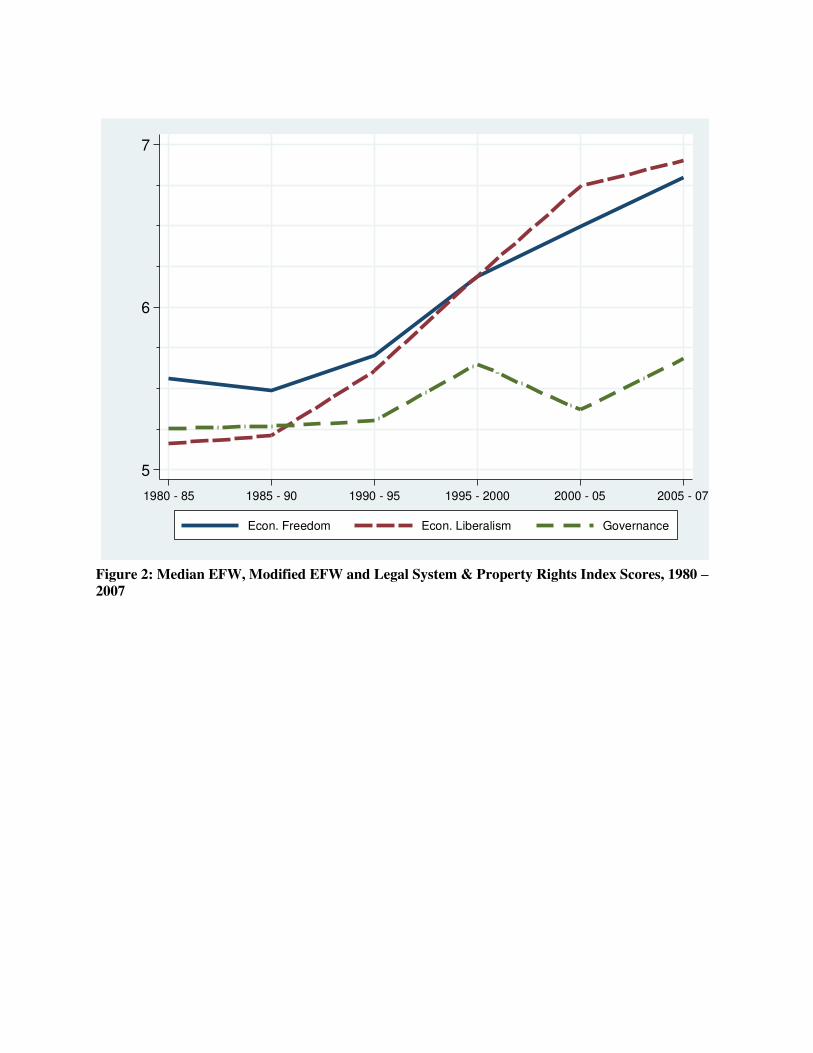
Figure 2: Median EFW, Modified EFW and Legal System & Property Rights Index Scores, 1980 – 2007
5
6
7
1980 - 85 1985 - 90 1990 - 95 1995 - 2000 2000 - 05 2005 - 07
Econ. Freedom Econ. Liberalism Governance

Fig
ure 3
: Pu
blic a
nd
Pu
blicly
Gu
ara
nteed
Deb
t Serv
ice an
d N
et FD
I, Dev
elop
ing C
ou
ntries, 1
980 - 2
007
0 510 15
19801981198219831984198519861987
198819891990199119921993199419951996
19971998199920002001200220032004
200520062007
exclu
de
s o
uts
ide
va
lue
s PP
G D
eb
t Se
rvic
e
-10
010 20
Foreign direct investment, net inflows (% of GDP)
1980198119821983198419851986
198719881989199019911992199319941995
199619971998199920002001200220032004
200520062007
exclu
de
s o
uts
ide
va
lue
s
Net F
DI