Embed Size (px)
DESCRIPTION
Test upload
Citation preview
Impact of Trade Liberalization on Agriculturein the Near East and North Africa
NEAR EAST AND NORTH AFRICA DIVISION 2007
Enabling the rural poor to overcome poverty
Impact of Trade Liberalization on Agriculturein the Near East and North Africa
Enabling the rural poor to overcome poverty

Copyright © 2007 International Food Policy Research Institute and International Fund for AgriculturalDevelopment. All rights reserved. Sections of this material may be reproduced for personal and not-for-profit use without the express written permission of but with acknowledgment to IFPRI and IFAD. Toreproduce the material contained herein for profit or commercial use requires express written permission. Toobtain permission, contact the Communications Division at [email protected] report contains preliminary material and research results. They have not been subject to formal externalreview managed by the IFPRI Publications Review Committee, but they have been reviewed by at least oneinternal or external reviewer. This report is circulated in order to stimulate discussion and critical comment.
Project funding: International Fund for Agricultural Development (IFAD)
Project manager: Mylène Kherallah (IFAD)
Authors: Nicholas Minot (IFPRI)Mohamed CheminguiMarcelle Thomas (IFPRI)Reno Dewina (IFPRI)David Orden (IFPRI)
Contact information:
International Food Policy Research Institute (IFPRI)2033 K Street NWWashington, DC 20006-1002 USATelephone: +1-202-862-5600Facsimile: +1-202-467-4439E-mail: [email protected] www.ifpri.org/divs/mtid.htm
International Fund for Agricultural Development (IFAD)Via del Serafico, 10700142 Rome, Italy Telephone: +39-06-54591 Facsimile: +39-06-5043463E-mail: [email protected] www.ifad.org www.ruralpovertyportal.org
3
Table of contents
LIST OF TABLES . . . . . . . . . . . . . . . . . . . . . . . . . . . . . . . . . . . . . . . . . . . . . . . . . . . . . . . . . . . . 6
LIST OF FIGURES . . . . . . . . . . . . . . . . . . . . . . . . . . . . . . . . . . . . . . . . . . . . . . . . . . . . . . . . . . . 7
ACRONYMS . . . . . . . . . . . . . . . . . . . . . . . . . . . . . . . . . . . . . . . . . . . . . . . . . . . . . . . . . . . . . . . . 8
CURRENCIES . . . . . . . . . . . . . . . . . . . . . . . . . . . . . . . . . . . . . . . . . . . . . . . . . . . . . . . . . . . . . . . 8
FOREWORD . . . . . . . . . . . . . . . . . . . . . . . . . . . . . . . . . . . . . . . . . . . . . . . . . . . . . . . . . . . . . . . . 9
PREFACE . . . . . . . . . . . . . . . . . . . . . . . . . . . . . . . . . . . . . . . . . . . . . . . . . . . . . . . . . . . . . . . . . 10
EXECUTIVE SUMMARY . . . . . . . . . . . . . . . . . . . . . . . . . . . . . . . . . . . . . . . . . . . . . . . . . . . . . . 11
1 Introduction . . . . . . . . . . . . . . . . . . . . . . . . . . . . . . . . . . . . . . . . . . . . . . . . . . . . . . . . . . . . . . 17Background . . . . . . . . . . . . . . . . . . . . . . . . . . . . . . . . . . . . . . . . . . . . . . . . . . . . . . . . . . . 18Objectives . . . . . . . . . . . . . . . . . . . . . . . . . . . . . . . . . . . . . . . . . . . . . . . . . . . . . . . . . . . . 19Organization of the report . . . . . . . . . . . . . . . . . . . . . . . . . . . . . . . . . . . . . . . . . . . . . . . . 19
2 Basic Characteristics of the Economies . . . . . . . . . . . . . . . . . . . . . . . . . . . . . . . . . . . . . . . 21Classification of NENA13 countries . . . . . . . . . . . . . . . . . . . . . . . . . . . . . . . . . . . . . . . . . 22Economic performance and growth . . . . . . . . . . . . . . . . . . . . . . . . . . . . . . . . . . . . . . . . . 23Poverty, inequality and other social indicators . . . . . . . . . . . . . . . . . . . . . . . . . . . . . . . . . 25Structure of GDP and the role of agriculture. . . . . . . . . . . . . . . . . . . . . . . . . . . . . . . . . . . 27Summary . . . . . . . . . . . . . . . . . . . . . . . . . . . . . . . . . . . . . . . . . . . . . . . . . . . . . . . . . . . . . 28
3 Agricultural Production and Trade Patterns . . . . . . . . . . . . . . . . . . . . . . . . . . . . . . . . . . . . 29Structure of agricultural production and trade . . . . . . . . . . . . . . . . . . . . . . . . . . . . . . . . . 30
Turkey . . . . . . . . . . . . . . . . . . . . . . . . . . . . . . . . . . . . . . . . . . . . . . . . . . . . . . . . . . 30Egypt . . . . . . . . . . . . . . . . . . . . . . . . . . . . . . . . . . . . . . . . . . . . . . . . . . . . . . . . . . . 34Algeria . . . . . . . . . . . . . . . . . . . . . . . . . . . . . . . . . . . . . . . . . . . . . . . . . . . . . . . . . . 35Morocco . . . . . . . . . . . . . . . . . . . . . . . . . . . . . . . . . . . . . . . . . . . . . . . . . . . . . . . . 36Tunisia . . . . . . . . . . . . . . . . . . . . . . . . . . . . . . . . . . . . . . . . . . . . . . . . . . . . . . . . . . 37Syria . . . . . . . . . . . . . . . . . . . . . . . . . . . . . . . . . . . . . . . . . . . . . . . . . . . . . . . . . . . 38Jordan . . . . . . . . . . . . . . . . . . . . . . . . . . . . . . . . . . . . . . . . . . . . . . . . . . . . . . . . . . 39Other countries . . . . . . . . . . . . . . . . . . . . . . . . . . . . . . . . . . . . . . . . . . . . . . . . . . . 41
Structure of protection . . . . . . . . . . . . . . . . . . . . . . . . . . . . . . . . . . . . . . . . . . . . . . . . . . . 44Trade agreements . . . . . . . . . . . . . . . . . . . . . . . . . . . . . . . . . . . . . . . . . . . . . . . . . . . . . . 49
The Uruguay Round under WTO . . . . . . . . . . . . . . . . . . . . . . . . . . . . . . . . . . . . . . 50The Doha Round under WTO . . . . . . . . . . . . . . . . . . . . . . . . . . . . . . . . . . . . . . . . 51The Euro-Mediterranean Partnership . . . . . . . . . . . . . . . . . . . . . . . . . . . . . . . . . . . 52The Everything But Arms Initiative . . . . . . . . . . . . . . . . . . . . . . . . . . . . . . . . . . . . . 54The US-Middle East Free Trade Initiative . . . . . . . . . . . . . . . . . . . . . . . . . . . . . . . . 54Trade agreements among NENA countries . . . . . . . . . . . . . . . . . . . . . . . . . . . . . . 54
Summary . . . . . . . . . . . . . . . . . . . . . . . . . . . . . . . . . . . . . . . . . . . . . . . . . . . . . . . . . . . . . 55
4 Impact of Trade Liberalization . . . . . . . . . . . . . . . . . . . . . . . . . . . . . . . . . . . . . . . . . . . . . . . 57Effects of trade liberalization on world agricultural markets. . . . . . . . . . . . . . . . . . . . . . . . 58
Wheat . . . . . . . . . . . . . . . . . . . . . . . . . . . . . . . . . . . . . . . . . . . . . . . . . . . . . . . . . . 58Rice . . . . . . . . . . . . . . . . . . . . . . . . . . . . . . . . . . . . . . . . . . . . . . . . . . . . . . . . . . . . 59Sugar . . . . . . . . . . . . . . . . . . . . . . . . . . . . . . . . . . . . . . . . . . . . . . . . . . . . . . . . . . . 60Cotton . . . . . . . . . . . . . . . . . . . . . . . . . . . . . . . . . . . . . . . . . . . . . . . . . . . . . . . . . . 61Dairy products . . . . . . . . . . . . . . . . . . . . . . . . . . . . . . . . . . . . . . . . . . . . . . . . . . . . 61Effect of higher agricultural prices on NENA countries . . . . . . . . . . . . . . . . . . . . . . 62
Effects of trade liberalization on NENA13 countries . . . . . . . . . . . . . . . . . . . . . . . . . . . . . 64Global trade liberalization . . . . . . . . . . . . . . . . . . . . . . . . . . . . . . . . . . . . . . . . . . . . 65Regional trade liberalization . . . . . . . . . . . . . . . . . . . . . . . . . . . . . . . . . . . . . . . . . . 67Bilateral trade liberalization with the EU and the US . . . . . . . . . . . . . . . . . . . . . . . . 68Unilateral trade liberalization . . . . . . . . . . . . . . . . . . . . . . . . . . . . . . . . . . . . . . . . . . 70
Summary . . . . . . . . . . . . . . . . . . . . . . . . . . . . . . . . . . . . . . . . . . . . . . . . . . . . . . . . . . . . . 72

44
5 Agriculture, Trade and Poverty in Egypt . . . . . . . . . . . . . . . . . . . . . . . . . . . . . . . . . . . . . . . 73Background . . . . . . . . . . . . . . . . . . . . . . . . . . . . . . . . . . . . . . . . . . . . . . . . . . . . . . . . . . . 74Agricultural sector . . . . . . . . . . . . . . . . . . . . . . . . . . . . . . . . . . . . . . . . . . . . . . . . . . . . . . 74
Agricultural production . . . . . . . . . . . . . . . . . . . . . . . . . . . . . . . . . . . . . . . . . . . . . . 74 Agricultural trade patterns . . . . . . . . . . . . . . . . . . . . . . . . . . . . . . . . . . . . . . . . . . . 75
Agricultural and trade policy . . . . . . . . . . . . . . . . . . . . . . . . . . . . . . . . . . . . . . . . . . . . . . . 75Agricultural policy . . . . . . . . . . . . . . . . . . . . . . . . . . . . . . . . . . . . . . . . . . . . . . . . . . 75Trade policy . . . . . . . . . . . . . . . . . . . . . . . . . . . . . . . . . . . . . . . . . . . . . . . . . . . . . . 76Trade agreements . . . . . . . . . . . . . . . . . . . . . . . . . . . . . . . . . . . . . . . . . . . . . . . . . 76
Poverty and household budget patterns . . . . . . . . . . . . . . . . . . . . . . . . . . . . . . . . . . . . . 77Poverty . . . . . . . . . . . . . . . . . . . . . . . . . . . . . . . . . . . . . . . . . . . . . . . . . . . . . . . . . 78Sources of income . . . . . . . . . . . . . . . . . . . . . . . . . . . . . . . . . . . . . . . . . . . . . . . . . 80Household consumption patterns . . . . . . . . . . . . . . . . . . . . . . . . . . . . . . . . . . . . . 82
Impact of commodity price changes on poverty. . . . . . . . . . . . . . . . . . . . . . . . . . . . . . . . 83Wheat . . . . . . . . . . . . . . . . . . . . . . . . . . . . . . . . . . . . . . . . . . . . . . . . . . . . . . . . . . 84Rice . . . . . . . . . . . . . . . . . . . . . . . . . . . . . . . . . . . . . . . . . . . . . . . . . . . . . . . . . . . . 85Cotton . . . . . . . . . . . . . . . . . . . . . . . . . . . . . . . . . . . . . . . . . . . . . . . . . . . . . . . . . . 86Fruit and vegetables. . . . . . . . . . . . . . . . . . . . . . . . . . . . . . . . . . . . . . . . . . . . . . . . 87Sugar cane . . . . . . . . . . . . . . . . . . . . . . . . . . . . . . . . . . . . . . . . . . . . . . . . . . . . . . 88Impact of crop price increases on overall poverty . . . . . . . . . . . . . . . . . . . . . . . . . 90
Summary . . . . . . . . . . . . . . . . . . . . . . . . . . . . . . . . . . . . . . . . . . . . . . . . . . . . . . . . . . . . . 91Annex to Chapter 5: Methods for estimating the impact of trade liberalization . . . . . . . . . . . . . . . . . . . . . . . . . . . . . . . . . . . . . . . . . . . . . . . . . . . . 92
6 Agriculture, Trade and Poverty in Tunisia . . . . . . . . . . . . . . . . . . . . . . . . . . . . . . . . . . . . . . 95Introduction . . . . . . . . . . . . . . . . . . . . . . . . . . . . . . . . . . . . . . . . . . . . . . . . . . . . . . . . . . . 96Agriculture and Food . . . . . . . . . . . . . . . . . . . . . . . . . . . . . . . . . . . . . . . . . . . . . . . . . . . . 96Agricultural and trade policy . . . . . . . . . . . . . . . . . . . . . . . . . . . . . . . . . . . . . . . . . . . . . . . 98
Agricultural and food policy . . . . . . . . . . . . . . . . . . . . . . . . . . . . . . . . . . . . . . . . . . 98Trade policy . . . . . . . . . . . . . . . . . . . . . . . . . . . . . . . . . . . . . . . . . . . . . . . . . . . . . . 99Trade agreements . . . . . . . . . . . . . . . . . . . . . . . . . . . . . . . . . . . . . . . . . . . . . . . . 102
Poverty. . . . . . . . . . . . . . . . . . . . . . . . . . . . . . . . . . . . . . . . . . . . . . . . . . . . . . . . . . . . . . 104Impact of trade liberalization on the poor . . . . . . . . . . . . . . . . . . . . . . . . . . . . . . . . . . . . 106
Methods . . . . . . . . . . . . . . . . . . . . . . . . . . . . . . . . . . . . . . . . . . . . . . . . . . . . . . . 106Results. . . . . . . . . . . . . . . . . . . . . . . . . . . . . . . . . . . . . . . . . . . . . . . . . . . . . . . . . 107
Summary . . . . . . . . . . . . . . . . . . . . . . . . . . . . . . . . . . . . . . . . . . . . . . . . . . . . . . . . . . . . 111Annex to Chapter 6: Method for estimating the impact of trade liberalization on Tunisia . . . . . . . . . . . . . . . . . . . . . . . . . . . . . . . . . . . . . . . . . . . 113
7 Agriculture, Trade and Poverty in Syria . . . . . . . . . . . . . . . . . . . . . . . . . . . . . . . . . . . . . . . 119Introduction . . . . . . . . . . . . . . . . . . . . . . . . . . . . . . . . . . . . . . . . . . . . . . . . . . . . . . . . . . 120Agricultural sector . . . . . . . . . . . . . . . . . . . . . . . . . . . . . . . . . . . . . . . . . . . . . . . . . . . . . 120
Agricultural production . . . . . . . . . . . . . . . . . . . . . . . . . . . . . . . . . . . . . . . . . . . . . 120Agricultural trade patterns . . . . . . . . . . . . . . . . . . . . . . . . . . . . . . . . . . . . . . . . . . 121
Agricultural and trade policies . . . . . . . . . . . . . . . . . . . . . . . . . . . . . . . . . . . . . . . . . . . . 121Agricultural policy . . . . . . . . . . . . . . . . . . . . . . . . . . . . . . . . . . . . . . . . . . . . . . . . . 121Trade policy . . . . . . . . . . . . . . . . . . . . . . . . . . . . . . . . . . . . . . . . . . . . . . . . . . . . . 123Effect of policy on agricultural prices . . . . . . . . . . . . . . . . . . . . . . . . . . . . . . . . . . 126Trade agreements . . . . . . . . . . . . . . . . . . . . . . . . . . . . . . . . . . . . . . . . . . . . . . . . 127
Poverty. . . . . . . . . . . . . . . . . . . . . . . . . . . . . . . . . . . . . . . . . . . . . . . . . . . . . . . . . . . . . . 128Impact of wheat market liberalization on small farmers . . . . . . . . . . . . . . . . . . . . . . . . . 130
Background . . . . . . . . . . . . . . . . . . . . . . . . . . . . . . . . . . . . . . . . . . . . . . . . . . . . . 130Methods . . . . . . . . . . . . . . . . . . . . . . . . . . . . . . . . . . . . . . . . . . . . . . . . . . . . . . . 130Results. . . . . . . . . . . . . . . . . . . . . . . . . . . . . . . . . . . . . . . . . . . . . . . . . . . . . . . . . 132
Summary . . . . . . . . . . . . . . . . . . . . . . . . . . . . . . . . . . . . . . . . . . . . . . . . . . . . . . . . . . . . 133Annex to Chapter 7: Design of a CGE model of the Syrian economy. . . . . . . . . . . . . . . 135

5
8 Agriculture, Trade and Poverty in Morocco. . . . . . . . . . . . . . . . . . . . . . . . . . . . . . . . . . . . 137Introduction . . . . . . . . . . . . . . . . . . . . . . . . . . . . . . . . . . . . . . . . . . . . . . . . . . . . . . . . . . 138Agricultural sector . . . . . . . . . . . . . . . . . . . . . . . . . . . . . . . . . . . . . . . . . . . . . . . . . . . . . 138
Agricultural production . . . . . . . . . . . . . . . . . . . . . . . . . . . . . . . . . . . . . . . . . . . . . 138Agricultural trade patterns . . . . . . . . . . . . . . . . . . . . . . . . . . . . . . . . . . . . . . . . . . 138
Agricultural and trade policies . . . . . . . . . . . . . . . . . . . . . . . . . . . . . . . . . . . . . . . . . . . . 139Pre-adjustment period . . . . . . . . . . . . . . . . . . . . . . . . . . . . . . . . . . . . . . . . . . . . . 139Structural adjustment period . . . . . . . . . . . . . . . . . . . . . . . . . . . . . . . . . . . . . . . . 139Global integration period . . . . . . . . . . . . . . . . . . . . . . . . . . . . . . . . . . . . . . . . . . . 140
Trade agreements . . . . . . . . . . . . . . . . . . . . . . . . . . . . . . . . . . . . . . . . . . . . . . . . . . . . . 141GATT and WTO . . . . . . . . . . . . . . . . . . . . . . . . . . . . . . . . . . . . . . . . . . . . . . . . . . 141The EMP agreement with the EU . . . . . . . . . . . . . . . . . . . . . . . . . . . . . . . . . . . . . 141Morocco-United States Free Trade Agreement . . . . . . . . . . . . . . . . . . . . . . . . . . 141
Poverty. . . . . . . . . . . . . . . . . . . . . . . . . . . . . . . . . . . . . . . . . . . . . . . . . . . . . . . . . . . . . . 142Impact of trade liberalization on small farmers . . . . . . . . . . . . . . . . . . . . . . . . . . . . . . . . 142
Background . . . . . . . . . . . . . . . . . . . . . . . . . . . . . . . . . . . . . . . . . . . . . . . . . . . . . 142Methods . . . . . . . . . . . . . . . . . . . . . . . . . . . . . . . . . . . . . . . . . . . . . . . . . . . . . . . 143Results. . . . . . . . . . . . . . . . . . . . . . . . . . . . . . . . . . . . . . . . . . . . . . . . . . . . . . . . . 143
Summary . . . . . . . . . . . . . . . . . . . . . . . . . . . . . . . . . . . . . . . . . . . . . . . . . . . . . . . . . . . . 144
9 Summary and Policy Implications . . . . . . . . . . . . . . . . . . . . . . . . . . . . . . . . . . . . . . . . . . . 145Summary . . . . . . . . . . . . . . . . . . . . . . . . . . . . . . . . . . . . . . . . . . . . . . . . . . . . . . . . . . . . 146
Introduction . . . . . . . . . . . . . . . . . . . . . . . . . . . . . . . . . . . . . . . . . . . . . . . . . . . . . 146Basic characteristics . . . . . . . . . . . . . . . . . . . . . . . . . . . . . . . . . . . . . . . . . . . . . . 146Agricultural and trade patterns . . . . . . . . . . . . . . . . . . . . . . . . . . . . . . . . . . . . . . . 147Impact of trade liberalization . . . . . . . . . . . . . . . . . . . . . . . . . . . . . . . . . . . . . . . . 148Agriculture, trade and poverty in Egypt . . . . . . . . . . . . . . . . . . . . . . . . . . . . . . . . 149Agriculture, trade and poverty in Tunisia. . . . . . . . . . . . . . . . . . . . . . . . . . . . . . . . 150Agriculture, trade and poverty in Syria . . . . . . . . . . . . . . . . . . . . . . . . . . . . . . . . . 151Agriculture, trade and poverty in Morocco . . . . . . . . . . . . . . . . . . . . . . . . . . . . . . 152
Policy implications . . . . . . . . . . . . . . . . . . . . . . . . . . . . . . . . . . . . . . . . . . . . . . . . . . . . . 152Policy on global trade liberalization. . . . . . . . . . . . . . . . . . . . . . . . . . . . . . . . . . . . 152Policy on regional trade liberalization . . . . . . . . . . . . . . . . . . . . . . . . . . . . . . . . . . 153Position with regard to bilateral liberalization . . . . . . . . . . . . . . . . . . . . . . . . . . . . 154Position with regard to unilateral liberalization . . . . . . . . . . . . . . . . . . . . . . . . . . . 155Complementary policies to facilitate adjustment. . . . . . . . . . . . . . . . . . . . . . . . . . 156Complementary policies to support agriculture . . . . . . . . . . . . . . . . . . . . . . . . . . 157Complementary policies to support farmers. . . . . . . . . . . . . . . . . . . . . . . . . . . . . 158Complementary policies to assist the rural poor. . . . . . . . . . . . . . . . . . . . . . . . . . 159
References . . . . . . . . . . . . . . . . . . . . . . . . . . . . . . . . . . . . . . . . . . . . . . . . . . . . . . . . . . . . . . . 162

6
Table 2-1. Food security and openness classification of NENA13 countries . . . . . . . . . . . . . . . . 23
Table 2-2. Summary statistics for the NENA13 economies, 2003 . . . . . . . . . . . . . . . . . . . . . . . 25
Table 2-3. Poverty and social indicators for the NENA13 countries, 2003 . . . . . . . . . . . . . . . . . 26
Table 2-4. Structure of the economies and the agricultural sector of NENA13 countries, 2003 . . . . . . . . . . . . . . . . . . . . . . . . . . . . . . . . . . . . . . . . . . . 28
Table 3-1. Agricultural land use, 2002 . . . . . . . . . . . . . . . . . . . . . . . . . . . . . . . . . . . . . . . . . . . . 31
Table 3-2. Agricultural production, 2002-04 average . . . . . . . . . . . . . . . . . . . . . . . . . . . . . . . . . 32
Table 3-3. Main agricultural exports and imports of Turkey . . . . . . . . . . . . . . . . . . . . . . . . . . . . 33
Table 3-4. Net exports of selected commodities, 2001-03 average. . . . . . . . . . . . . . . . . . . . . . 33
Table 3-5. Main agricultural exports and imports of Egypt . . . . . . . . . . . . . . . . . . . . . . . . . . . . . 35
Table 3-6. Main agricultural imports of Algeria . . . . . . . . . . . . . . . . . . . . . . . . . . . . . . . . . . . . . . 36
Table 3-7. Main agricultural exports and imports of Morocco . . . . . . . . . . . . . . . . . . . . . . . . . . . 37
Table 3-8. Main agricultural exports and imports of Tunisia . . . . . . . . . . . . . . . . . . . . . . . . . . . . 38
Table 3-9. Main agricultural exports and imports of Syria . . . . . . . . . . . . . . . . . . . . . . . . . . . . . . 39
Table 3-10. Main agricultural exports and imports of Jordan . . . . . . . . . . . . . . . . . . . . . . . . . . . 40
Table 3-11. Structure of agricultural imports, 2001-03 average . . . . . . . . . . . . . . . . . . . . . . . . . 45
Table 3-12. Structure of agricultural exports, 2001-03 average . . . . . . . . . . . . . . . . . . . . . . . . . 45
Table 3-13. Applied global and sector-level protection in NENA13 countries . . . . . . . . . . . . . . . 46
Table 3-14. Applied bilateral protection on agriculture, 2001 . . . . . . . . . . . . . . . . . . . . . . . . . . . 48
Table 3-15. Applied protection rates for selected commodities, 2001 . . . . . . . . . . . . . . . . . . . . 48
Table 3-16. Multilateral, regional and bilateral agreements . . . . . . . . . . . . . . . . . . . . . . . . . . . . . 51
Table 4-1. Impact of higher agricultural prices on NENA countries . . . . . . . . . . . . . . . . . . . . . . . 63
Table 5-1. Tariff rates in 2005 and value of imports . . . . . . . . . . . . . . . . . . . . . . . . . . . . . . . . . . 76
Table 5-2. Distribution of Egyptian households based on occupation and location. . . . . . . . . . . 78
Table 5-3. Expenditure and household size for different types of households in Egypt . . . . . . . . 79
Table 5-4. Incidence of poverty and number of poor people in Egypt. . . . . . . . . . . . . . . . . . . . . 79
Table 5-5. Incidence of poverty for different types of households in Egypt . . . . . . . . . . . . . . . . . 80
Table 5-6. Percentage of households involved in income activities by region . . . . . . . . . . . . . . . 81
Table 5-7. Sources of income for different types of households . . . . . . . . . . . . . . . . . . . . . . . . . 81
Table 5-8. Sources of income for rural households by expenditure tercile and farm size . . . . . . 83
Table 5-9. Expenditures patterns for different types of households. . . . . . . . . . . . . . . . . . . . . . . 84
Table 5-10. Percentage of households that are producers and consumers of wheat . . . . . . . . . 84
Table 5-11. Effects of increased wheat prices on poverty among wheat growers in Egypt . . . . . 85
Table 5-12. Percentage of households that are producers and consumers of rice . . . . . . . . . . . 86
Table 5-13. Effects of increased rice prices on poverty among rice growers in Egypt . . . . . . . . . 86
Table 5-14. Effects of increased cotton prices on poverty among cotton growers in Egypt . . . . 87
Table 5-15. Percentage of households that are producers and consumers of fruit and vegetables . . . . . . . . . . . . . . . . . . . . . . . . . . . . . . . . . . . . . . . . . . . . . . . 87
Table 5-16. Effects of increased fruit and vegetables prices on poverty among fruit and vegetable growers in Egypt . . . . . . . . . . . . . . . . . . . . . . . . . . . . . . . . . . . . . . . 88
Table 5-17. Percentage of households that are producers of sugar cane and consumers of sugar . . . . . . . . . . . . . . . . . . . . . . . . . . . . . . . . . . 88
Table 5-18. Effects of increased sugar cane prices on poverty among sugar cane growers in Egypt. . . . . . . . . . . . . . . . . . . . . . . . . . . . . . . . . . . . . . . . . . 89
Table 5-19. Effects of increased commodities prices on poverty among all households in Egypt . . . . . . . . . . . . . . . . . . . . . . . . . . . . . . . . . . . . . . . . 90
Table 6-1. Contribution of agriculture and food processing to GDP . . . . . . . . . . . . . . . . . . . . . . 96
Table 6-2. Composition of the Tunisian agriculture sector. . . . . . . . . . . . . . . . . . . . . . . . . . . . . . 96
Table 6-3. Share of crop area allocated to different crop categories by farm size . . . . . . . . . . . . 97
Table 6-4. Structure and importance of food subsidies . . . . . . . . . . . . . . . . . . . . . . . . . . . . . . . 99
Table 6-5. Nominal protection by major economic activity (1995-2003) . . . . . . . . . . . . . . . . . . 100
Table 6-6. Tariff rates in and out of quotas and utilization of tariff quotas . . . . . . . . . . . . . . . . . 100
List of tables

7
Table 6-7. Effective protection by major economic activity (1995-2002) . . . . . . . . . . . . . . . . . . 101
Table 6-8. Poverty lines and poverty incidence, 1990, 1995 and 2000. . . . . . . . . . . . . . . . . . . 105
Table 6-9. Household expenditures by occupation of the head of household . . . . . . . . . . . . . . 106
Table 6-10. Impact of trade liberalization on macroeconomic variables . . . . . . . . . . . . . . . . . . 108
Table 6-11. Impact of trade liberalization on food and agricultural production by sector. . . . . . 108
Table 6-12. Impact of trade liberalization on food and agricultural exports by sector . . . . . . . . 109
Table 6-13. Impact of trade liberalization on food and agricultural imports by sector . . . . . . . . 109
Table 6-14. Impact of trade liberalization on the incidence of poverty by occupation . . . . . . . . 110
Table 6-15. Representativeness of the sample by occupation of the head of household . . . . . 115
Table 6-16. Dimensions of the Tunisian SAM for the year 1996 . . . . . . . . . . . . . . . . . . . . . . . . 116
Table 7-1. Characteristics of farm households in Syria . . . . . . . . . . . . . . . . . . . . . . . . . . . . . . . 120
Table 7-2. Tariff equivalents of quantitative restrictions and tariffs on agricultural products . . . . 125
Table 7-3. Comparison of official and parity producer prices . . . . . . . . . . . . . . . . . . . . . . . . . . 127
Table 7-4. Government price intervention: costs and beneficiaries . . . . . . . . . . . . . . . . . . . . . . 127
Table 7-5. Proposed changes in EU quotas for Syrian exports . . . . . . . . . . . . . . . . . . . . . . . . . 128
Table 7-6. Poverty measures by region using the lower poverty line for 2003-04 . . . . . . . . . . . 129
Table 7-7. Distribution of the population by location and poverty status . . . . . . . . . . . . . . . . . . 129
Table 7-8. Poverty measures for households of which the head is working in agriculture . . . . . 130
Table 7-9. Budget cost of food and agricultural subsidies in Syria . . . . . . . . . . . . . . . . . . . . . . 131
Table 7-10. Impact of wheat subsidy removal on macroeconomic indicators . . . . . . . . . . . . . . 132
Table 7-11. Impact of wheat subsidy removal on prices and production . . . . . . . . . . . . . . . . . 133
Table 7-12. Impact of wheat subsidy removal on welfare by income decile . . . . . . . . . . . . . . . 133
List of figures
Figure 3-1. Ratio of food imports to total exports in Turkey, Egypt, Algeria, and Morocco . . . . . 31
Figure 3-2. Ratio of food imports to total exports in Tunisia, Syria, and Jordan . . . . . . . . . . . . . 38
Figure 3-3. Ratio of food imports to total exports in Djibouti, Lebanon, The Sudan,West Bank and Gaza, and Yemen . . . . . . . . . . . . . . . . . . . . . . . . . . . . . . . . . . . . . . 42
Figure 6-1. Evolution of poverty in Tunisia (1990-2000) . . . . . . . . . . . . . . . . . . . . . . . . . . . . . . 105

8
Acronyms
CGE computable general equilibrium (model)
EMAA European Union-Mediterranean Association Agreement
EMP Euro-Mediterranean Partnership (Agreement)
EU European Union
FTA free trade agreement
GAFTA Greater Arab Free Trade Agreement
GATT General Agreement on Tariffs and Trade
LDC least developed country
MENA Middle East and North Africa
NENA Near East and North Africa
OECD Organisation for Economic Co-operation and Development
SAM social accounting matrix
URAA Uruguay Round Agreement on Agriculture
WTO World Trade Organization
Currencies
Algeria Algerian dinar (DZD)
Djibouti Djibouti franc (DJF)
Egypt Egyptian pound (LE)
Jordan Jordanian dinar (JOD)
Lebanon Lebanese pound (LBP)
Morocco Moroccan dirham (DH)
Somalia Somali shilling (SOS)
Sudan Sudanese dinar (SDD)
Syria Syria pound (SYP)
Tunisia Tunisian dinar (TND)
Turkey Turkish lira (TL)
West Bankand Gaza Israeli shekel/Jordanian dinar
Yemen Yemeni rial (YER)

9
The impact of trade liberalization on developing countries has been a topic of some interest andcontroversy for many years, but the debate became prominent during the Doha Round ofmultilateral trade negotiations. The suspension of the Doha Round will likely shift attentiontoward regional and bilateral agreements and toward unilateral reforms, but the topic remainsrelevant to international organizations and decision makers in developing countries. Because tradeliberalization is expected to increase the world prices of agricultural commodities, concern aboutthe possible negative impact of trade liberalization has focused on net-food-importing regions,including the Near East and North Africa (NENA). The recent food price increases in 2006 and2007 have added to the relevance of the issue for these countries.
Given the importance of the topic, it is surprising that relatively few studies have examined theimpact of trade liberalization on small farmers and other poor households in the NENA region.With support from the International Fund for Agricultural Development (IFAD), this studyattempts to fill this gap. It combines a comprehensive review of the literature on tradeliberalization in the NENA region with four country case studies that examine the distributionalimpact in more depth. In addition to examining the likely impact of various types of tradeliberalization on farmers and the poor in the region, this study identifies a number of policies andprograms that would enhance the positive effects of these reforms and alleviate the negative effects.
This report is one of a series of studies carried out by the International Food Policy ResearchInstitute (IFPRI) on the impact of trade agreements and trade policy on the poor in developingcountries. Recent research on this theme includes studies of the impact of alternative Dohaoutcomes, the effect of global cotton markets on poverty in Pakistan, the impact of rice policy onpoverty in the Philippines, and a review of trade-related agricultural policies in four developingcountries. These studies aim to provide policymakers with objective, empirically-based analysesthat will contribute to informed, pro-poor decisions in the area of trade policy.
We gratefully acknowledge the support of IFAD in carrying out this study and hope that it willbe useful to IFAD staff and to their client countries.
DR. JOACHIM VON BRAUNDirector General
International Food Policy Research Institute
Foreword

10
In the past two decades, many countries in the Near East and North Africa region have reformedthe agricultural sector by lowering agricultural tariffs, liberalizing domestic prices and reducingconsumer food subsidies. However, trade restrictions and domestic price support mechanisms arestill prevalent for a few strategic commodities (such as wheat), and there is wide divergence amongthe countries in terms of the extent and depth of liberalization. Under the Euro-MediterraneanPartnership launched in 1995, ongoing and future bilateral free trade agreements between theEuropean Union and several Arab Mediterranean countries could lead to further tradeliberalization. In addition, some countries have recently signed free trade agreements with theUnited States of America, and more countries in the Near East and North Africa region are expectedto sign bilateral trade agreements with the United States in the near future.
Previous and ongoing domestic agricultural reform and bilateral and regional trade agreements, aswell as any future trade liberalization that may result from further multilateral trade negotiations underthe World Trade Organization, will have significant impact on the agricultural sector of the Near Eastand North Africa region. Some studies have tried to analyse the expected impact of these changes onthe region’s agricultural sector, with divergent results depending on the assumptions andmethodologies used, and no analysis has been done relating these changes to small farmers and poorrural households. Given its focus on improving the livelihoods of the rural poor in the region, the NearEast and North Africa Division of the International Fund for Agricultural Development, in partnershipwith the International Food Policy Research Institute, has undertaken this study to examine theexpected impact of agricultural domestic and international trade liberalization on this target group.
The results of the study are very useful in identifying the measures that could be employed eitherto mitigate the potential negative impacts of trade liberalization on small rural producers or to helpthese producers seize new domestic and international market opportunities. The study concludes thattrade policy by itself is an imprecise and costly instrument for addressing poverty. There is a need,however, for complementary policies to enhance the positive effects of trade liberalization (or reducethe negative impact); these include flexible factor markets (especially for labour), trade facilitationmeasures, support for public goods, direct income support for farmers, and safety net programmes.
The complementarity between the research capabilities of the International Food PolicyResearch Institute and the operational experience of the International Fund for AgriculturalDevelopment has greatly contributed to enhancing the relevance of this research to the Fund andits country and regional partners in formulating pro-poor policies, strategies and programmes foragricultural and rural development. The findings of this study will contribute to the establishmentof a common understanding of the impact of trade liberalization in the region and, hence, to anincrease in the effectiveness of the collaborative efforts among policymakers, the InternationalFund for Agricultural Development and other development cooperation partners in their ongoingjoint efforts to reduce rural poverty in the Near East and North Africa region.
It is hoped that the success of the International Fund for Agricultural Development-International Food Policy Research Institute collaboration in producing this study will lead the wayfor further, similar partnerships in the future.
DR. MONA BISHAYDirector
Near East and North Africa Division
International Fund for Agricultural Development
Preface

11
This report examines the impact of agricultural trade liberalization on the countries of the NearEast and North Africa (NENA), with emphasis on the impact on small-scale farmers in the region.In particular, the study has four objectives:
• to examine current agricultural trade policies in the NENA region;• to evaluate the degree of agricultural liberalization likely to occur as part of various trade
agreements;• to analyse the impact of further trade liberalization on small farmers and other poor
households; and• to explore policy options for mitigating the negative effects of agricultural trade
liberalization.
The study focuses on 13 countries and territories in the region: Algeria, Djibouti, Egypt, Jordan,Lebanon, Morocco, Somalia, the Sudan, Syria, Tunisia, Turkey, the West Bank and Gaza, andYemen. We refer to these as the NENA13 countries.
BackgroundMost of the NENA13 countries are semi-arid, with limited water and arable land per capita, makingagricultural production highly dependent on rainfall. The overall population density of the regionis low compared to other developing areas, though the region is also more urbanized than theaverage for developing countries. The economic performance of many of the NENA13 countrieshas been relatively weak, with real per capita GDP growth during the 1990s of only 1.3% per year.The region has been subject to various conflicts, including the Arab-Israeli conflict, the Sudanesecivil war, the insurgency in Algeria (until recently), the lack of a central government in Somalia, andthe Iraq War. The slow economic growth means little expansion in formal-sector employment,resulting in persistent problems of unemployment, particularly among youth. Nonetheless, strongeconomic performance in Lebanon, the Sudan (recently) and Tunisia suggests that these problemsare not insurmountable.
For most NENA13 countries, agricultural exports represent a relatively small share of totalexports. Wheat is a staple food and a major import for most of the NENA13 countries. Almost allthe NENA13 countries are net food importers. Some countries in the region have relatively highlevels of protection for farmers: Egypt, Morocco and Tunisia are among the 15 most protectedeconomies in the world, according to one study. The commodities that are the most protected inthe region are wheat, sugar, dairy, and livestock products. The European Union (EU) is the mostimportant trading partner for most of the countries in the region.
Trade agreementsThe NENA countries have signed a series of multilateral, regional and bilateral trade agreements.The Uruguay Round Agreement on Agriculture has had only a modest impact on trade policy in theregion. Seven of the NENA13 countries are either not members of the World Trade Organization(Somalia, Syria, and West Bank and Gaza) or they are least developed countries (Djibouti, Somalia,the Sudan and Yemen) and are thus exempt from most of the agreement’s commitments. For theremaining six countries, the bound rates are often far above the applied tariff rates, particularly foragricultural products. Thus, the agreement commitments to reduce the bound rate have had littleeffect on the actual level of agricultural protection.
The EU has signed European Union-Mediterranean Association Agreements (EMAAs) with fiveNENA countries, and three others are in the process of ratification, but the EMAAs generally make
Executive summary

12
exemptions for agriculture. In 2001, the EU launched the Everything But Arms Initiative, underwhich the least developed countries have duty-free access to EU markets for almost all goods.Within the NENA region, Djibouti, Somalia, the Sudan and Yemen can take advantage of theinitiative’s provisions. Bananas, rice and sugar were temporarily exempted, and duty-free access wasdelayed until January 2006, July 2009, and September 2009, respectively.
Under the US-Middle East Free Trade Initiative, the United States has signed bilateral free tradeagreements (FTAs) with Jordan and Morocco and intermediate agreements with four other NENAcountries. The effect of the US-Jordan FTA will be small because Jordan’s level of protection isalready low and because US-Jordan trade is small. The effect of the US-Morocco FTA will be largerbecause Moroccan trade barriers are higher. Of particular importance, Morocco’s wheat tariffs willbe phased out over ten years. The US African Growth and Opportunity Act allows duty-free accessto US markets for sub-Saharan African countries that meet certain criteria; however, within theNENA13 region, only Djibouti qualifies.
A number of bilateral and regional agreements within the NENA region have been signed, but theireffectiveness has been limited by the structural similarities of the NENA economies and the granting ofexceptions for sensitive products. Nonetheless, a number of NENA countries, most notably Egypt andTunisia, have reduced tariff barriers unilaterally in recent years. In other words, trade liberalization hasoccurred outside the context of global, regional and bilateral trade agreements.
Impact of trade liberalizationThe evidence suggests that global trade liberalization, by reducing agricultural support policies incountries of the Organisation for Economic Co-operation and Development and by reducingprotection, will increase world agricultural prices. The markets for wheat, rice, sugar, cotton anddairy products are the most distorted, and the prices in these markets will rise by 3-20%. Almostall the NENA13 countries are net agricultural importers; so, there is clearly some basis for concernthat these countries will lose as a result of global trade liberalization. Our analysis finds that theterms-of-trade effect of a 15% increase in all world agricultural prices on the NENA13 countries isapproximately US$1.2 billion, or 0.2% of regional GDP. This estimate is an upper limit because itassumes no response on the part of producers and consumers and because it does not include theefficiency gains associated with reducing distortions in domestic agricultural markets. Most studiesof trade liberalization suggest that the efficiency benefits are larger than the terms-of-trade losses.
Several dozen studies have been undertaken to examine the macroeconomic impact of varioustypes of trade liberalization in NENA. These studies suggest that multilateral trade liberalizationgenerally results in net gains to countries in the region, with real GDP expanding 1-3%. Thebenefits of trade liberalization to a given country depend largely on the degree of domesticliberalization carried out by the country. Most of the gains from agricultural trade liberalization areassociated with domestic reform rather than changes in trade policy in other countries.Furthermore, the benefits of multilateral trade liberalization are generally greater than the gainsassociated with bilateral trade agreements with the EU or the United States and the gains fromregional trade agreements within the region.
Effects on small farmers and the poorFew studies look at the distributional effect of liberalization on small farmers and the poor in theNENA countries. We use household survey data and computable general equilibrium (CGE) modelsto simulate the impact of trade liberalization on small farmers and the poor in four NENA countries.
Egypt has undertaken significant trade liberalization, but costly obstacles to doing business andinvesting remain. It is a major wheat importer and exports cotton, rice and horticulture. We analysethe data from the 1998 Egypt Integrated Household Survey to examine the distributional effect ofhypothetical changes in agricultural prices. According to this analysis, a 40% increase in wheatprices would reduce the incidence of poverty among wheat growers by 3 percentage points. In thecase of rice and cotton, a 40% price increase would decrease poverty among growers of those cropsby 7 percentage points. For fruits and vegetables, an equivalent price increase would lower povertyamong horticultural growers by 7 percentage points. The largest effect is for sugar cane growers, forwhom a 40% increase in sugar prices would reduce poverty by 20 percentage points, largely because

13
sugar cane growers are poorer and highly dependent on sugar cane income. However, the effect ofeach of these price increases on national poverty is negligible because only a small share of thepopulation grows each crop.
Unlike Egypt, Tunisia maintains high tariffs on many products, including agriculturalcommodities. At the same time, Tunisia has a relatively good investment climate, whichcontributed to significant inflows of foreign direct investment and a healthy growth rate throughthe 1990s. Tunisia’s main exports are olives and dates, while the principle imports are wheat andmaize. In order to study the distributional impact of trade liberalization in Tunisia, we use a CGEmodel linked to survey data for 400 representative households. The model is used to simulate theelimination of industrial tariffs on goods from the EU, the removal of all tariffs on imports fromthe EU, the elimination of all tariffs from all countries, and the elimination of all tariffs, combinedwith global liberalization, which is assumed to raise world agricultural prices by 15%. Domestictrade liberalization has the largest positive effect on GDP, but the fourth scenario (global tradeliberalization) has the most positive effect on agriculture and poverty. In this scenario, povertydeclines to its lowest level among the four scenarios.
Syria has one of the most highly regulated economies in the region. Reforms in recent years haveonly begun to dismantle some of these restrictions. Although Syria has been successful in achievingwheat self-sufficiency and promoting cotton exports, these accomplishments have come at a highcost in terms of inefficiency and an unsustainable fiscal burden. The likely depletion of oil reservesis forcing the Government to reduce costs and find new sources of revenue. We use a CGE model tosimulate the effect of liberalizing wheat markets on households in ten income categories. Themacroeconomic effects are relatively modest, although government savings increases by almost 3%of GDP. Complete liberalization reduces the producer price of wheat by about 17% and productionby about 2%. The effects of subsidy removal on the welfare of Syrian households is regressive in thesense that high-income households gain, while lower-income households lose. The size of theeffects, however, is less than 1% of base income for all but the richest income group.
Since the mid-1980s, Morocco has carried out a series of economic reforms to allow the market toplay a larger role in production and consumption decisions, including price liberalization, a reducedrole for state enterprises and the promotion of private investment. Morocco has signed an EMAA withthe EU and an FTA with the United States, but the level of agricultural protection remains relativelyhigh. A study by Ravallion and Lokshin (2004) uses a CGE model to simulate the effect of grainimport liberalization and then uses projected price changes to simulate the impact on households ina nationally representative survey. The CGE model suggests that full liberalization of grain importswould reduce the producer price of grain by 24% and the consumer price of grain by 27%. This wouldreduce poverty in urban areas, where households benefit from lower priced grain, but raise poverty inrural areas because of the losses among net sellers of grain. The overall incidence of poverty inMorocco rises from 20% to 22%. These results, however, do not take into account the effect of globaltrade liberalization, which is expected to increase the world price of wheat and other grains.
Implications for trade policyGlobal trade liberalization will likely increase world agricultural prices by 3-20%, imposing a terms-of-trade loss on 11 of the 13 countries under consideration (the Sudan and Turkey have smallagricultural trade surpluses). The net food-importing countries have used the expected terms-of-tradeloss associated with global trade liberalization to request special concessions in the form of reducedcommitments to opening their own borders. The flaw in the mercantilist logic is that it only takes intoaccount the gains and losses of producers, ignoring the effects of trade policy on consumers. Studiesof trade liberalization suggest that most of the benefits to a given country from trade liberalization arethe result of reforms within the country. Thus, the net food-importing countries appear to bedemanding the right to forgo the efficiency gains associated with domestic trade liberalization as“compensation” for the terms-of-trade losses associated with reforms in other countries.
The effect of agricultural trade liberalization on poverty varies widely across countries in partbecause the effect of liberalization on agricultural prices is ambiguous. Global agricultural tradereform is likely to increase world agricultural prices, but domestic trade liberalization will reducedomestic agricultural prices relative to the world price. The net effect of liberalization on domestic
EXECUTIVE SUMMARY

14
agricultural prices depends partly on the country’s trade patterns, the original level of protectionand the details of the liberalization. If the level of domestic protection is high, then full tradeliberalization is likely to reduce domestic agricultural prices. If, on the other hand, domesticprotection is modest, then full trade liberalization may increase domestic agricultural prices.
Furthermore, the impact of changes in agricultural prices on poverty is ambiguous. Higheragricultural prices benefit farmers who can produce a marketed surplus, but they hurt the urbanpoor and rural net buyers. The analysis presented in this report suggests that higher agriculturalprices benefit the poor on net, but the effect is quite small. Thus, the link between tradeliberalization and agricultural price changes is ambiguous, and the effect of agricultural pricechanges on poverty is weak. This suggests that trade policy is a poor instrument for addressingoverall poverty in the NENA13 region.
The economic benefits of regional integration (such as the Greater Arab Free Trade Agreement)have been limited to date. One reason for this is that these agreements tend to be fairly flexible,allowing numerous exceptions for “sensitive goods”. A relatively small number of exceptions canlargely negate the gains from trade liberalization. To generate significant gains for membercountries, the Greater Arab Free Trade Agreement and other regional agreements will have toachieve a greater level of discipline over tariff and non-tariff barriers. The second reason for themodest benefits associated with these trade agreements is that regional trade is hampered by avariety of factors in addition to trade policy. The transportation infrastructure linking NENAcountries is generally poor; transportation services in the region are characterized by lack ofcompetition and high costs, and many of the countries suffer from cumbersome customsprocedures that raise the cost of trade. Measures to streamline customs procedures and introducegreater competition in regional transportation services would enhance the benefits of regionaltrade agreements. The third reason for the modest gains associated with regional trade agreementsis the similarity of the economic structures in the member countries. If all member countriesimport wheat and maize, export fruits and vegetables and have similar wage rates, then the gainsfrom trade are likely to be limited.
Regarding bilateral agreements, the EMAAs generally exclude agriculture. Simulation studiesconfirm the economic intuition that the gains from these agreements would be much larger if theyincluded liberalization in the agricultural sector. The five countries with EMAAs should begin toexplore the feasibility of a second round of negotiations that would include agriculture. Whilerecognizing the political sensitivity of agricultural prices, NENA countries should keep in mind thatmost of the benefits of an expanded association agreement will be related to the degree of domesticliberalization in their own countries. At the same time, the liberalization of EU tariff and non-tariffbarriers on fruits, vegetables, olive oil and sugar would be particularly beneficial to NENA countries.
Regarding the US FTAs, the United States is a relatively minor trading partner with all of thesecountries; so, the NENA13 countries should not expect large impacts, positive or negative, as aresult of these agreements. On the other hand, these agreements may facilitate investment (localand foreign) in the NENA countries, partly because they include measures to create a morefavourable climate for private investment and partly because they signal a commitment to greaterintegration in the global economy.
Regarding unilateral liberalization, economic analysis suggests that, in general, unilaterallyreducing import protection and domestic support of agriculture will increase aggregate income.Indeed, it is easy to demonstrate that the benefits of lower domestic prices to consumers are greaterthan the losses to producers. Yet, policymakers, trade negotiators and many non-economists seereducing domestic protection as the “price” a country must pay to gain access to markets in othercountries. One argument is that, in developing countries in general and in the NENA region inparticular, poor farmers cannot compete with large-scale technologically advanced farmers indeveloped countries, particularly if the latter receive production subsidies. Certainly, commercialfarmers in developing countries are hurt by the subsidies given to farmers in the countries of theOrganisation for Economic Co-operation and Development. However, in spite of these subsidies,Egypt is a competitive exporter of cotton and rice, Morocco is able to export tomatoes to Europe,and Tunisia is a major exporter of olive oil. These examples suggest that NENA countries cancompete in markets where they have comparative advantage.

15
According to another argument, import barriers on agricultural products reduce poverty amongpoor agricultural producers. The analysis presented in this report suggests that higher agricultural priceshave small and mixed effects on the poor. This is because: (i) higher agricultural prices benefit some poorhouseholds (farmers with net sales), but they hurt other poor households (the urban poor and netbuyers in rural areas); (ii) the percentage of households that are net sellers of agricultural goods isrelatively small; (iii) farmers who are net sellers tend to be richer than the average farmer, so higher farmincome does not always translate into lower poverty; and (iv) even those farmers who are both poor andnet sellers rely on non-agricultural activities for a significant share of their incomes. In other words,agricultural protection is a costly and imprecise tool with which to address the problem of rural poverty.
Complementary policiesThe impact of trade liberalization on small farmers and other poor households in the NENA regionpartly depends on non-trade policies. Several studies have indicated that the size of the gains fromtrade liberalization will be greater when there are flexible factor markets that allow land, labour andcapital to be reallocated from formerly protected sectors to newly profitable sectors. Regulations thatconstrain the response of these factor markets reduce the positive impact of liberalization. Inagriculture, flexibility is likely to be enhanced by effective agricultural services such as extension andmarket information systems that can provide farmers with useful information about the agronomicand economic aspects of shifting into new commodities.
Another type of policy that enhances the economic effect of trade liberalization is tradefacilitation. This refers to measures that reduce the transaction costs related to trade, includingexcessive documentation requirements, authorizations from multiple agencies, unclear orsubjective criteria for applications of duties, and delays and uncertainties related to customsclearance. One study found that the gains from trade liberalization are twice as large if combinedwith trade facilitation measures.
Under World Trade Organization rules, the agricultural sector can be directly supportedthrough a variety of green box programmes, such as agricultural research and extension, pest anddisease control, inspection services, marketing infrastructure, market information services,environmental protection programmes and regional assistance programmes. Most of theseinvestments involve the provision of public goods, implying that they may be justified in terms ofeconomic efficiency, as well as in terms of supporting poor farmers.
One type of green box programme does not involve the provision of public goods: decoupledpayments to farmers. Payments are decoupled when they are not based on current production, butrather on some fixed basis such as production or area planted in a base year. Over the last 15 years,economists and policymakers have become increasingly interested in agricultural reform that shiftsfrom producer subsidies and import protection towards decoupled payments to farmers. This typeof reform has been tried in the EU, Mexico, Turkey and the United States with some success. At thesame time, it should be recognized that switching from import protection to a programme ofdecoupled payments implies both a loss in tariff revenue and significant new expenditure.
If the objective is to assist poor and vulnerable households regardless of their occupation, adifferent type of programme should be considered. A wide variety of safety-net programmes havebeen established in developing countries with the goal of reducing poverty. Targeted food subsidiesmake subsidized food available to selected households either geographically, through low-priceshops located in poor neighbourhoods, or some form of ration card that entitles the bearer topurchase food at subsidized prices. Egypt, Jordan and Tunisia have attempted to introduce targetinginto food subsidy programmes. Labour-intensive public works programmes usually combineinfrastructure development (such as road building) with hiring policies to maximize the pro-poorimpact. If designed well, they can improve community infrastructure and provide assistance to thepoorest households with able-bodied members. Conditional cash transfer programmes havegenerated considerable interest in the last 10-15 years. These programmes provide cash grants tohouseholds that comply with certain requirements, usually keeping children in school, attendinghealth clinics, or receiving pre- and postnatal care. Conditional cash transfers serve a dual purpose:providing assistance to poor households and encouraging investments in human capital thatreduce the chance that poverty will be transmitted to the next generation.
EXECUTIVE SUMMARY


Introduction
1

18
1.1 BackgroundAgriculture is one of the most problematic areas in international trade negotiations. While
significant progress has been achieved in reducing trade barriers and other policy distortions in
manufacturing through various multilateral agreements, in regional and bilateral arrangements
and under unilateral trade reforms, agricultural markets remain highly distorted. Both industrial
and developing countries still provide relatively high levels of protection to agricultural sectors. In
addition, many countries, particularly the industrialized countries, provide various forms of
support for agriculture. Agricultural trade liberalization is particularly sensitive in developing
countries because policymakers are concerned about the potential impact on small-scale farmers,
who typically account for a large share of the poor. The issue is politically sensitive in industrialized
countries as well, at least partly because of the disproportionate political power of farm groups.In spite of this sensitivity, there is a widespread belief that reducing the trade barriers and
policy distortions affecting agriculture will increase economic efficiency and aggregate income.The theory of comparative advantage suggests that aggregate income is higher when trade barriersare lower. Empirical studies of trade liberalization generally show that the aggregate benefits oftrade liberalization outweigh the costs. Studies also show that more outward-oriented countriestend to grow more rapidly over time, suggesting that trade liberalization generates dynamic gainsthrough the free flow of investment and technology. By this logic, even unilateral tradeliberalization should usually benefit a country. In the political arena, however, there is resistanceto unilateral liberalization. In the view of many policymakers, reducing domestic protection is anecessary cost used as a bargaining chip to gain access to markets in other countries. In addition,there is concern that, even if liberalization brings benefits in the aggregate, the distributionalimpact may be negative.
Economic theory and empirical studies suggest that current agricultural policies suppress theworld price of many agricultural commodities below what they would be under liberalized trade.This is because import restrictions reduce world demand, and agricultural producer support tendsto stimulate supply. The effect on domestic agricultural prices in countries that protect theiragriculture is ambiguous, however, because multilateral trade liberalization may increase worldagricultural prices, but unilateral liberalization in the form of lower tariffs will reduce domesticprices relative to world prices.
The impact of trade policy reforms varies substantially across commodities, across countriesand across households within a country. Some commodity markets, such as those for sugar andrice, are more distorted than others; so, trade liberalization would have a larger effect on the pricesof these commodities. Some countries are net exporters of agricultural commodities; so, theywould gain from the higher agricultural prices associated with multilateral liberalization. Netimporters of agricultural commodities could lose from multilateral trade liberalization, though thisdepends on the degree of reform they carry out in their domestic policies. The negative effect ofmultilateral reform that raises prices of imports could be partially or wholly offset by domestictrade liberalization, which reduces market distortions and tends to lower agricultural prices.
Obviously, urban households gain from lower food prices and lose from higher prices, but theeffect is ambiguous for rural households because some are net sellers, while others are net buyersof agricultural products.
The region of the Near East and North Africa (NENA) examined in this report comprises 12countries considered traditional borrowing countries by IFAD. The countries are Algeria, Djibouti,Egypt, Jordan, Lebanon, Morocco, Somalia, the Sudan, Syria, Tunisia, Turkey and Yemen. The studyalso includes the West Bank and the Gaza territory, which has not yet achieved full sovereignty. Forconvenience, we will refer to the 13 as countries and refer to the group as the NENA13 region.
The NENA13 region has experienced slow economic growth in recent years, leading to varioussocial problems, including high levels of unemployment. The growth of per capita GDP in theregion has generally lagged behind the average of developing countries, and some countries, suchas Djibouti and West Bank and Gaza, have suffered negative growth rates over the period 1990-2003 (UNDP 2005a, Table 14). At the same time, the countries in this region often have levels oftrade protection (including agricultural trade protection) that are higher than the levels in many

19
other regions of the world. This raises the question whether a more outward-oriented trade policywould stimulate more rapid growth in the NENA13 region. Even if this is the case, one of the mainconcerns of policymakers regarding agricultural trade liberalization is whether it will adverselyaffect poverty and inequality in the region and thereby heighten social tensions.
1.2 ObjectivesIn light of the background described in the previous section, this report has four objectives:
• to describe the current agricultural and trade policies of the NENA countries and theirimpact on the agricultural economy of the region;
• to describe the current status of agricultural trade liberalization in the NENA region and theextent of additional agricultural trade liberalization that will result from the Euro-Mediterranean Partnership (EMP) agreements, bilateral FTAs, and World TradeOrganization (WTO) multilateral trade negotiations;
• to analyse the potential impact of unilateral, bilateral, and multilateral trade liberalizationefforts (including the reduction of domestic support) on the agricultural economy in theNENA region, with particular emphasis on agricultural commodity prices, rural wages andsmall farmer income; and
• to explore the types of measures that could be used to mitigate the potential negative impactof trade liberalization on small farmers and rural wage-earners in the NENA region.
Because of the large number of countries in the NENA region, we provide two levels of analysis. Forall 13 countries, we provide a descriptive analysis of trade patterns and levels of trade protectionand a review of previous research on the impact of trade liberalization. In addition, we providemore in-depth analysis of four countries in the region: Egypt, Morocco, Syria and Tunisia.
1.3 Organization of the reportThis report addresses trade policy issues and concerns through three complementary approaches.The first part of the report provides a regional overview that characterizes the current status of eachcountry with respect to its economic and international trade environment. Chapter 2 providesbackground information on NENA13 countries, based on various economic and social indicatorsof the economies. Chapter 3 describes the structure of agricultural production and trade in the 13countries, as well as ongoing trade liberalization initiatives under multilateral and regional tradeagreements. Chapter 4 discusses the likely impact of further trade liberalization, including theeffect on world agricultural prices and the effect on the NENA13 countries.
In the second part of the report, we provide a more in-depth assessment of the impact of tradeliberalization on four countries in the region: Egypt, Tunisia, Syria and Morocco. These fourcountries are broadly representative of the range of policies in the lower-middle income NENA13countries. We exclude the four least developed countries (LDCs) in the region (Djibouti, Somalia,the Sudan and Yemen) both because of lack of data and because these countries face very differentchallenges relative to the other NENA13 countries. We also exclude Turkey as the only food surpluscountry and one that is moving towards membership in the EU, albeit slowly. Among the remainingcountries, Egypt represents an early reformer with relatively low levels of agricultural protection,though it maintains a large system of consumer food subsidies. Morocco and Tunisia have madesignificant progress in recent years in opening their borders to trade and foreign investment, thoughthe overall level of agricultural protection remains high. And Syria retains many of the policies thatcharacterized the region 20 years ago: fixed producer prices, large-scale public procurement of majorcrops and high levels of agricultural protection. In the chapters devoted to each case study, weexamine the structure of the agricultural sector and the composition of international trade,agricultural and trade policies, trade agreements, a brief profile of poverty in the country, and thenan analysis of the impact of trade liberalization on small farmers and other poor households.
In Chapter 5, we examine the case of Egypt. After a description of agricultural and trade policiesin Egypt, we simulate the impact of trade liberalization on different types of households using apartial equilibrium analysis that combines household survey data and hypothetical changes in theprice of individual agricultural commodities. In this analysis, the impact of an agricultural price
CHAPTER 1: INTRODUCTION

20
change on the income of each household depends on the share of income from that commodityand the share of expenditure allocated to that commodity. Information on the income of eachhousehold before and after the price change allows us to estimate the change in poverty overall andfor specific types of households.
In contrast, the Syria and Tunisia case studies are based on computable general equilibrium(CGE) models for each country. In Chapter 6, a CGE model of the Tunisian economy is linked todata from 400 representative households, allowing estimation of the impact of three variants ofunilateral trade liberalization and one scenario combining unilateral and multilateral tradeliberalization. In Chapter 7, a CGE model of Syria is used to examine the distributional impact ofliberalization. The Syrian CGE model incorporates ten representative households, eachrepresenting an income decile of the population. Since wheat is the most distorted agriculturalmarket and the most sensitive crop politically, the model is used to simulate a reduction inproducer wheat subsidies and consumer bread subsidies of 20%, 50% and 100%.
The Moroccan case study in Chapter 8 includes a detailed description of an analysis byRavallion and Lokshin (2004). In their study, the authors use a CGE model to simulate the effectof unilateral trade liberalization on prices and then use detailed household survey data to simulatethe effect of these price changes on incomes and poverty.
In the final chapter of the report, we summarize the main findings and discuss the implicationsfor policy. In particular, we explore alternative policies and programmes that might enhance thepositive impact and alleviate some of the negative effects of trade liberalization, with particularattention to the impact on small farmers and other poor households.

Basic Characteristics of the Economies
2

22
2.1 Classification of NENA13 countriesAlthough NENA13 countries share geographical and cultural similarities, they form aheterogeneous group with respect to income, food security and their integration in the globaleconomy. They are all developing countries, but, based on their differing attributes, distinctions aredrawn among them by various international organizations and by researchers.
The Food and Agriculture Organization of the United Nations (FAO) classifies seven of theNENA13 countries as low-income food-deficit countries (Table 2-1). These countries are poor, withper capita gross national product of US$1,465 (at 2003 prices) or less. They also have had a deficitin grain trade over the preceding five years (FAO 2006). Included within this group are fourNENA13 countries that are classified by the United Nations as LDCs: Djibouti, Somalia, the Sudanand Yemen; also included are the developing countries, Egypt, Morocco and Syria.
In a related classification, WTO considers NENA13 member countries Egypt, Jordan, Moroccoand Tunisia as net food-importing developing countries (Table 2-1). WTO recognizes this group ofcountries, together with the LDCs, as vulnerable to the possible negative effects of implementingagreements for free trade in agriculture. Specifically, both LDCs and net food-importing developingcountries are expected to experience difficulties in financing food imports (WTO 2006a).1
In a recent study, Diaz-Bonilla et al. (2000) argue for better indicators of the food securitystatus of countries. They use cluster analysis to classify 163 developed and developing countriesbased on five measures of food security: food production per capita (measuring the ability of acountry to feed itself), the ratio of food imports to total exports (an indication of a country’s abilityto finance its food imports), calories per capita and protein per capita (measuring the level ofnutrition), and the nonagricultural population share (an indication of how vulnerable thepopulation is to changes in trade and agricultural policies). Results generated from the clusteranalysis classify NENA13 countries across all three groups of food security: food insecure, foodneutral and food secure. The listing of countries in Table 2-1 is organized using these categories.The classification of LDCs as food insecure is in accordance with the WTO definition, but Diaz-Bonilla et al. classify the other NENA13 countries as food neutral, with the exception of Turkey,which is classified as food secure. While this classification of countries differs from theclassification of low-income food-deficit countries and the net food-importing developingcountries, Diaz-Bonilla et al. (2000) report that the NENA13 countries classified as food neutral arenonetheless trade stressed due to a high ratio of food imports to total exports.
The NENA13 countries also vary in their integration into the global economy. Only sixcountries, Djibouti, Egypt, Jordan, Morocco, Tunisia and Turkey are WTO members. Four othercountries, Algeria, Lebanon, the Sudan and Yemen, are observers at various stages of accession. All13 countries have entered into some type of free trade arrangements with the EU or the UnitedStates or both. The various trade agreements and the composition of trade flows determine thedifferences in the level of protection and access to trading partner markets among the countries.
1/ While LDCs are defined by the United Nations, the net food-importing developing countries are a WTO defined group. Bothgroups are subject to differential treatment under a special ministerial decision agreed during the Uruguay Round WTOnegotiations. The decision recognizes that trade reforms in agriculture could have negative effects on these groups “in terms of theavailability of adequate supplies of basic foodstuffs from external sources on reasonable terms and conditions, including short-termdifficulties in financing normal levels of commercial imports of basic foodstuffs”. The ministerial decision recommends suchmeasures as food aid and aid for agricultural development. It also refers to the possibility of assistance from the InternationalMonetary Fund and the World Bank to finance commercial food imports (WTO 2006a). The definition of low-income food-deficitcountries provided by the Food and Agriculture Organization of the United Nations overlaps with the LDC and net food-importingdeveloping country classifications.

23
TABLE 2-1Food security and openness classification of NENA13 countries
World BankFAOa UNb WTOc
Opennessd
Income group Classification category
Food insecuree
Djibouti Lower middle LIFDC LDC HighSomalia Low income LIFDC LDC LowSudan Low income LIFDC LDC LowYemen Low income LIFDC LDC Low
Food neutralAlgeria Lower middle LowEgypt Lower middle LIFDC NFIDC LowJordan Lower middle NFIDC LowLebanon Middle income LowMorocco Lower middle LIFDC NFIDC LowSyria Lower middle LIFDC LowTunisia Lower middle NFIDC Low
Food secureTurkey Lower middle Low
Not classifiedWest Bank and Gaza Low
Sources: WTO (2005a); FAO (2006); UNCTAD (2004a, Part I, Annex 2); Bouet et al. (2004, Appendix I); Diaz-Bonilla et al. (2000, Table 8).a Low-income food-deficit countries (LIFDCs) are defined by the Food and Agriculture Organization of the United Nations (FAO) as those
countries that have a per capita gross national product below US$1,465 (2003) and that are net importers of food (defined on a caloriebasis).
b Least developed countries (LDCs) are defined by the United Nations with respect to income and human development indicators.c The net food-importing developing countries (NFIDCs) are so defined by the WTO Committee on Agriculture.d The openness clusters are defined with respect to GDP and trade openness indicators computed from the MAcMap-HS6 database
(Bouet et al. 2004, Appendix I).e The food security classification is defined with respect to five measures of food security: food production per capita, the ratio of total
exports to food imports, calories per capita, protein per capita and the share of non-agricultural population consumption and tradevariables (Diaz-Bonilla et al. 2000, Table 8).
Most of the NENA13 countries have high levels of import protection. According to Bouet(2006b), who has ranked 147 countries with respect to their overall level of protection, Egypt isranked 5th, Morocco 10th and Tunisia 11th among the most protectionist countries. Only Lebanonand Turkey are relatively open countries. Bouet finds that Algeria and Syria face relatively low dutieson their exports, while Jordan and Lebanon face relatively high levels. He concludes that, ingeneral, countries in the NENA13 region, while protectionist, benefit from relatively good access toworld markets, either as a result of a specialization in products that do not incur high taxation (e.g.,oil) or because of preferential agreements with the countries of the Organisation for Economic Co-operation and Development (OECD). The study also shows that all NENA countries face higherduties on their agricultural exports than they do on their non-agricultural exports. This pattern isnot surprising given the high protection of agriculture in the EU, a major trading partner, andexemptions afforded the agricultural sector in trade liberalization. The patterns of trade protectionare discussed in more depth in Section 3.2.
The next three sections examine economic performance, social indicators, and the role ofagriculture in the NENA13 countries.
2.2 Economic performance and growthNENA13 countries are low-income or lower-middle income countries according to the World Bankclassification (World Bank 2005a). Their national average per capita incomes range from belowUS$600 in the poorest LDCs (Somalia, the Sudan and Yemen) to US$3,925 in Lebanon (Table 2-2).The average growth in per capita GDP was only 1.3% across the NENA13 countries over the 1990sand barely 1.2% over 2000-03. The growth has been uneven among countries. Lebanon andTunisia experienced solid economic growth (at least 3% per year in per capita GDP) during the1990s, and the Sudan and Tunisia enjoyed solid growth in 2000-03. In contrast, Algeria, Djibouti,Somalia, and West Bank and Gaza experienced negative growth in the 1990s, and the declinecontinued (and even accelerated) in West Bank and Gaza during 2000-03. As a whole, the NENA13
CHAPTER 2: BASIC CHARACTERISTICS OF THE ECONOMIES

24
region has fared better than sub-Saharan Africa (excluding South Africa) and is on a par with SouthAsia during 2000-03 (World Bank 2005a), but the NENA13 region faces significant political andeconomic uncertainties.
Various hypotheses have been advanced for the relatively weak growth rates among theNENA13 countries, as follows:
• Conflict: The four countries with negative per capita GDP growth over the 1990s allexperienced some conflict. In Somalia, there has been no central government since 1991.Algeria experienced a decade-long civil war following the 1991 elections. Djibouti alsounderwent a civil war in the early 1990s. And the West Bank and Gaza stagnated during the1990s as a result of the Israeli-Palestinian conflict. Conflicts have direct costs in terms oflives and property, but they also destroy social capital (Collier 1999). Moreover, conflictscreate a climate of uncertainty and discourage investment.
• The policy and regulatory environment: In 2005, the International Finance Corporationstarted ranking countries annually on the ease of doing business based on 39 indicatorsgrouped into ten categories. The categories include starting a business, licensing, employingworkers, registering property, legal protections for investors and so on. In 2006, theInternational Finance Corporation ranked 175 countries, including all the NENA13 countries,except Somalia. Only three NENA13 countries are in the top half of the rankings (Jordan,Lebanon and Tunisia), and they are ranked in the 45th to 49th percentile range. According tothis ranking, Djibouti, Egypt and the Sudan are among the 25 countries in the world with themost adverse environment for private sector investment and operations (IFC 2006).
• Trade barriers: High import barriers in the region distort economic incentives and impedethe flow of new technology, thus reducing productivity growth. As discussed below inSection 3.2, the average import protection is higher in the NENA13 countries than in otherdeveloping countries. Agricultural import tariffs in particular are 50% higher than theaverage for other developing countries. Indeed, this hypothesis is one of the mainmotivations for this report.
The population of the NENA13 region has been estimated at slightly above 300 million in 2003(Table 2-2). During 2000-03, the average population growth rate was 1.9%, a decline from theprevious decade, when the rate averaged over 2% (World Bank 2005a). The average conceals thevery high population growth rates still experienced by some countries, notably, Jordan, Somalia,West Bank and Gaza, and Yemen. In Somalia and West Bank and Gaza, population growth rateshave increased compared to the 1990s (DeRosa 1997; Table 2-2). Lebanon, Tunisia and Turkey, thethree highest-income countries in the region, have among the lowest rates of population growth.
A serious economic problem facing many of the NENA countries is unemployment. Reflectingthe low rates of economic growth, combined with the rapid population growth in some countries,the unemployment rate averaged 13% for the NENA13. The worst situation is found in Djibouti,where half of the work force is unemployed, and in Yemen, where the unemployment rate is 35%.Among non-LDCs, Algeria registered the highest unemployment rate, 27% in 2001 (Table 2-2). Therate came down significantly in 2004, to less than 18%, but youth unemployment remainspersistently high (World Bank 2005b).

25
2/ The population density in Gaza is 3,853 persons per km2 (UNDP 2004a).
3/ The increase in restrictions since September 2000 on the movement of people and goods in West Bank and Gaza hascontributed to the loss of jobs and to the increase in the unemployment rate from around 10% before September 2000 to 27% in2002 (FAO 2003a, p. 21) to 31% in 2003 (Table 2-2).
Population density is high in Lebanon (440 persons per km2) and West Bank and Gaza (541persons per km2), but the average in the region is lower than the developing-country average of 63and just above the European average of 31 (WRI 2005).2 Yet, in Egypt for example, the nationalaverage of 68 persons per km2 hides the fact that most of the population is concentrated along theNile and in the Suez Canal regions, with an average of over 1,475 persons per km2. The NENA13region is relatively urbanized (on average, 53% of the population live in urban areas), but the levelof urbanization varies considerably across these countries. In the LDCs, less than 40% live in urbanareas, except in Djibouti, where two thirds of the population live in the capital area (CIA 2005).Lebanon and West Bank and Gaza have the largest share of the population living in urban areas (91and 87%, respectively), followed by Jordan with 79% (Table 2-2). The high rate of urbanpopulation is the result of a rural exodus due to the dwindling opportunities in rural areas.According to Fedjari (2000, cited in Radwan and Reiffers 2003), there are 180,000 rural migrantsper year in Morocco, and 60,000 of these head for Casablanca.
The statistics presented above illustrate an economic situation in NENA13 countriesdominated by relatively low GDP growth per capita and high unemployment. These features areparticularly notable in NENA13 LDCs and in countries that are developing in a conflictenvironment, notably Djibouti, Somalia, and West Bank and Gaza.3 GDP growth increased in theregion during 2000-03 relative to the preceding decade, especially in oil-exporting countries, butthe region faces substantial uncertainty in the mid-2000s.
2.3 Poverty, inequality and other social indicatorsThe incidence of poverty varies widely across NENA13 countries. The LDCs have higher rates ofpoverty than other NENA13 countries; Somalia and Djibouti record the highest share of thepopulation below the US$1-per-day poverty line, 72% and 56%, respectively (Table 2-3). Most other
CHAPTER 2: BASIC CHARACTERISTICS OF THE ECONOMIES
TABLE 2-2Summary statistics for the NENA13 economies, 2003
Real GDP Population Land Area Annual growth in Annual Unemploy- Share of Populationper capita GDP per capita population ment ratec urban density
growth population1990-2000a 2000-03b 2000-03
(2000 US$) (million) (1 000 km2) (%) (%) (%) (%) (%) (per km2)
Algeria 1 916 31.8 2 382 -0.3 2.9 1.5 27 59 13Djibouti 848 0.7 23 -4.0 0.7 2.0 50 85 30Egypt 1 622 67.6 995 2.3 1.4 1.8 11 43 68Jordan 1 801 5.3 89 0.6 1.3 2.8 13 79 60Lebanon 3 925 4.5 10 5.3 1.0 1.3 9 91 440Morocco 1 278 30.1 446 0.4 3.2 1.6 11 57 67Somalia 600 9.6 627 -8.1 - 3.3 - 29 15Sudan 433 33.5 2 376 3.3 3.8 2.1 19 39 14Syria 1 135 17.4 184 2.1 0.6 2.4 12 53 95Tunisia 2 214 9.9 155 3.1 2.8 1.1 14 67 64Turkey 2 977 70.7 770 1.7 0.2 1.6 10 67 92West Bank & Gaza 849 3.4 6 -1.7 -16.2 4.2 26 87 541Yemen 553 19.2 528 1.7 0.9 3.0 12 26 36
NENA13 1 530 303.7 8 592 1.3 1.2 1.9 13 53 35
Sources: World Bank (2005a) unless otherwise specified; CIA (2005) for the per capita GDP of Somalia (PPP estimate for 2004), for the land area of West Bank and Gazaand for the unemployment rate in Djibouti and the Sudan.
a Annual growth rates for West Bank and Gaza are 1994-2000.b Average growth rate excludes Somalia, for which GDP growth data do not exist.c Unemployment rates are from the last year available in World Bank (2006), covering 2000 to 2004 except for Lebanon, which refers to 1997.

26
4/ The Gini index measures the degree of inequality in income (or, in some cases, consumption expenditure) among individuals orhouseholds within an economy. The index may vary between 0, representing perfect equality, to 100, representing perfect inequality.
NENA13 countries show low levels of extreme poverty, but register higher poverty incidence at theUS$2-per-day and national levels. West Bank and Gaza also has a high proportion of people livingbelow the US$1-per-day poverty line, a reflection of the burden the Israeli-Palestinian conflictcontinues to impose on the economy. Given its per capita income, Egypt has the highest povertyincidence (44%) using the US$2-per-day poverty line, more than twice the incidence under thenational level. In contrast, Algeria, Jordan, Morocco and Turkey show higher incidence of povertywith respect to the national lines than with respect to the US$1-per-day or US$2-per-day povertylines. The national indicators reveal unambiguously that poverty is more prevalent in rural areasthan in urban areas. The ratio of rural to urban poverty ranges from 1.5 in Yemen to 4 in Tunisia.
The Gini index of income inequality does not differ much across the seven NENA13 countriesfor which it has been calculated.4 In general, the higher-income countries, such as Tunisia andTurkey, show greater inequality, while the lower-income countries, such as Egypt and Yemen, showrelatively low inequality by international standards (Table 2-3).
Except for the LDCs, the NENA13 countries have relatively long life expectancies of 68 to 73 years.In the four LDCs, life expectancy ranges from 44 to 58, and infant mortality is at least three timesas high as it is in the non-LDCs. These patterns reflect the low income and high poverty rates inthese four countries (Table 2-3).
The education index combines indicators of adult literacy and the gross enrolment ratios forprimary, secondary and tertiary schools (UNDP 2005a). This index is generally higher in the non-LDC Middle East countries (Jordan, Lebanon, and West Bank and Gaza) of the NENA13 regionthan in the North African countries (Algeria, Egypt, Morocco and Tunisia). It is lowest in the LDCsand in Morocco. Countries with the highest education index, Jordan and West Bank and Gaza, havealso the highest female to male literacy ratio. Adult literacy rates are roughly proportional toincome levels, though among NENA13 countries, Djibouti and the Sudan have relatively highliteracy rates given their income level, and literacy in Morocco is less than would be expected givenits income level (Table 2-3).
TABLE 2-3Poverty and social indicators for the NENA13 countries, 2003
Population below poverty linea Gini Life Education Adult Female/ Infant index expectancy index literacy male mortality
literacy rate$1 $2 National Urban Rural ratio
(per 1 000 (%) (%) (years) (%) live births)
Algeria <2 15 12 7 17 35 71 0.69 69 76 35Djibouti 56 87 29 - 45 - 43 0.52 65 71 97Egypt 3 44 17 9 22 34 69 0.62 56 65 33Jordan <2 7 12 10 18 36 72 0.86 91 90 23Lebanon - - 6 - 12 - 71 0.84 87 - 27Morocco <2 14 19 12 27 40 69 0.53 51 61 36Somalia 72 91 85 - 90 - 47 - 24 39 133Sudan 23 70 85 - 87 - 59 0.52 60 69 63Syria - 10 27 - 45 - 70 0.75 83 82 16Tunisia <2 7 4 2 8 40 73 0.74 73 76 19Turkey <2 10 16 - 40 40 69 0.80 87 83 33West Bank and Gaza 24 36 32 - 55 - 73 0.86 91 91 24Yemen 16 45 42 31 45 33 58 0.50 49 41 82
NENA13b 19 39 31 13 40 37 65 0.69 68 71 48
Sources: World Bank (2005a), unless otherwise indicated; World Bank (2005c, Table 2) for poverty headcount below the poverty line (national and rural); World Bank(2005b) for Algeria national poverty count; UNDP (2004a) for West Bank and Gaza literacy ratio; UNCTAD (2004a) for Djibouti and Somalia literacy ratio; UNDP (2005a,Statistical Table 1; Table 27) for education indices and Egypt’s literacy ratio and Syria poverty count under US$2 a day.a For Algeria (2003), Djibouti (1996), Egypt (1999/2000), Jordan (1997), Morocco (1998/99), Tunisia (1995), Turkey (2000) and Yemen (1998).b Unweighted averages.

5/ The last available figure for Somalia is for 1990 when the share was 82%.
27
The various indicators demonstrate that the criteria used for measuring poverty and socialcircumstances matters among the NENA13 countries. In general, incidence with respect to thenational poverty lines is greater than with respect to the US$1-per-day or US$2-per-day poverty lines.Poverty within the NENA13 region, as in many developing countries, is mainly rural. In terms ofeducation and literacy, the NENA13 region is not homogeneous, with the Middle Eastern countriesdoing better than the North African countries, which do not fare much better than the LDCs. Ahigher female to male literacy ratio is generally associated with lower infant mortality rates.
2.4 Structure of GDP and the role of agricultureThe GDP structure of the NENA13 countries indicates the dominant role of services and industryin these economies. On average for the region, the service sector contributes more than half of GDP,and industry nearly a third. But countries differ widely around these averages. Services account fortwo-thirds or more of GDP in Djibouti, Jordan, Lebanon, Tunisia, Turkey, and West Bank and Gaza.Algeria is the exception due to the dominance of the oil sector in the economy (Table 2-4).
The contribution of industry to GDP for most countries reflects the region’s average. For somecountries, this sector is dominated by manufacturing, and, in some countries, such as Syria,manufacturing accounts for nearly 90% of industry’s contribution to GDP (Table 2-4).
The trade structure also varies across countries. Jordan, Lebanon, and West Bank and Gazasuffer from large trade deficits; the share of imports in GDP ranges from 1.5 to 5 times that ofexports. Djibouti shows large shares of GDP for both imports and exports, reflecting the large shareof re-exports to Ethiopia, for which it is the main transit port (WTO 2006b).
In most of the countries in the region, agriculture comprises 10-20% of national output. Thecontribution of agriculture is highest in the Sudan (65%) and in Somalia (39%), which are LDCs.It is lowest in Djibouti, Jordan, and West Bank and Gaza. In all countries for which data areavailable, except in the Sudan, the contribution of agriculture to GDP has been declining since1993 (DeRosa 1997). This reflects a structural transformation of the economy that is an almostuniversal pattern among countries experiencing GDP growth.
For some countries (Algeria, Djibouti, Jordan and Morocco), the average annual growth rate ofthe agricultural sector has shown notable improvement between 1990-99 and 2000-03, but, formost NENA13 countries, it has stagnated (Egypt, the Sudan and Yemen) or deteriorated (Lebanon,Syria, Tunisia, Turkey, and West Bank and Gaza) (Table 2-4).
Still, agriculture continues to play a crucial role in the NENA13 region, as in most developingcountries, due to its contribution to employment (Table 2-4). This combination reflects the lowproductivity in agriculture in these countries and, consequently, the relatively large share of povertyin rural areas (IFAD 2003).
In the NENA13 LDCs, the labour force engaged in agriculture is significant, more than 70% inDjibouti and Somalia and more than 48% in the Sudan and Yemen. This is consistent with the factthat, at least in three of these countries (Djibouti is the exception), the majority of the populationlives in rural areas. Turkey has the highest share of employment in agriculture among non-LDCs,45%, followed by Morocco and Egypt with 35% and 32%, respectively (Table 2-4).
Another measure of the importance of the agricultural sector is the share of agricultural exportsin total exports. In NENA13 countries, the contribution of agriculture to exports is below 10% inevery country except the Sudan, and it has decreased since 1993 when it ranged between 10 and 28%(excluding LDCs). The Sudan saw a drastic fall from 95% in 1993 to 13% in 2003 (Table 2-4 andDeRosa 1997).5 However, the impact of agricultural trade liberalization on households may belarge even if only a small share of exports is from the agricultural sector, because agriculture tradeaffects food prices and, thus, food security, especially among poor households.
CHAPTER 2: BASIC CHARACTERISTICS OF THE ECONOMIES

28
2.5 SummaryThe 13 countries of Near East and North Africa under consideration in this study share a number ofcultural characteristics, including language and religion. In addition, most of the NENA13 countriesare semi-arid, with limited water and arable land per capita, making agricultural production highlydependent on rainfall. The exceptions are Turkey, which has relatively abundant water and landresources, and Egypt, where virtually all crop production is irrigated. The overall population densityof the region is low compared to other developing areas, though Lebanon and West Bank and Gazaare quite densely populated. The region is also more urbanized than the average for developingcountries, though Somalia, the Sudan and Yemen are exceptions to this pattern.
The 13 countries also have some economic similarities. Nine of the 13 countries are lower-middle income countries according to the World Bank (Lebanon is classified as a middle-incomecountry, while Somalia, the Sudan and Yemen are low-income countries). The economicperformance of many of the NENA13 countries has been relatively weak, with real per capita GDPgrowth during the 1990s of 1.3% per year. Performance was no better during 2000-03 in spite ofthe global economic recovery during those years. The economies have been adversely affected byvarious conflicts, including the Arab-Israeli conflict, the Sudanese civil war, the insurgency inAlgeria (until recently), the lack of a central government in Somalia and the Iraq War. Otherpossible explanations for the slow growth include the business climate and relatively high tradebarriers in many NENA countries. The slow economic growth means there has been little expansionin formal-sector employment, resulting in persistent problems of unemployment, particularlyamong youth. Nonetheless, strong economic performance in Lebanon, the Sudan (recently) andTunisia suggest that these problems are not insurmountable.
TABLE 2-4Structure of the economies and the agricultural sector of NENA13 countries, 2003
Structure of production Trade Agriculture(% share in GDP) (% share in GDP)
Agriculture Industry Services Exports Imports Annual growth (%) Share (%) Share (%)
Of which 1990-99 2000-03in total in total
mfg.employ- exports
ment
(%)
Algeria 10 55 7 35 39 24 4.1 6.0 24 <1Djiboutia 4 16 3 81 46 66 0.5 2.0 - <1Egypt 16 34 19 50 22 24 3.0 3.2 32 5Jordan 2 26 16 72 45 70 2.8 6.2 11 10Lebanon 12 20 9 68 13 39 2.5 1.5 3 9Morocco 17 30 17 54 32 36 5.5 8.9 35 7Somalia 65 10 5 25 2 7 1.3 - 70 -Sudana 39 20 9 41 16 12 6.4 6.6 59 13Syria 23 29 25 48 40 33 7.2 2.8 27 7Tunisia 12 28 18 60 43 47 6.7 1.9 24 4Turkey 13 22 13 65 28 31 1.7 0.7 45 7West Bank and Gaza 9 18 10 73 10 49 -4.8 -8.6 12 <1Yemen 15 40 5 45 31 36 5.4 5.3 48 3
NENA13b 18 27 12 55 27 40 3.3 3.0 36 7
Sources: World Bank (2005a) unless otherwise specified. CIA (2005) for Somalia’s structure of GDP; and West Bank and Gaza’s share of arable land. UNCTAD (2004a) for manufacturing share of GDP for Somalia; and employment in agriculture for 2002 for Djibouti and Somalia. WTO (2006b) for Djibouti’s trade shares in GDP, 2000-2004 average.a Djibouti’s indicators are for 2000 and Sudan’s for 2002.b Unweighted averages.

Agricultural Production and Trade Patterns
3
30
Trade liberalization is expected to result in relative price changes that will affect each country at thenational level according to its pattern of production and trade. NENA13 countries are characterizedby a high dependence on food imports, a situation that may threaten food security if internationalfood prices rise significantly. This chapter describes the patterns of agricultural trade and tradepolicy in the NENA13 countries so as to provide a background for the discussion of the impact oftrade liberalization in the next chapter. Section 3.1 examines the patterns of agricultural productionand trade in each of the 13 countries under consideration. In Section 3.2, measures of protectionare computed for the NENA13 countries and for commodities of importance for the region. Section3.3 provides an overview of the various trade agreements in the region.
3.1 Structure of agricultural production and tradeThe NENA13 region faces adverse climatic conditions, including low and highly variable annualrainfall patterns and poor soils for the most part. According to the Food and AgricultureOrganization of the United Nations (FAO 2004), 62% of the region is hyper-arid, 17% arid, 11% semi-arid and 4.4% sub-humid. Agriculture in the region operates under severe limitations inwater resources. Only a few countries rely strongly on irrigation (Egypt and Lebanon); the rest dependon rainfall (FAO 2003b). Yet, irrigated agriculture may provide the largest share of agriculturalexports. For example, in Morocco, products from irrigated arable land account for 75% of totalprimary and processed agricultural exports (Roe et al. 2005). In the countries where irrigatedagriculture is important, water for expansion will have to come mainly from efficiency savings onexisting schemes (FAO 2004).
Agricultural land represents 38% of total land area in the NENA13 region. Of the agriculturalland, almost three quarters (73%) is permanent pasture, while the remainder (23%) is used forcrop production. This type of distribution of area is a pattern found in the majority of countries.Egypt, Lebanon, Tunisia and Turkey are exceptions, with higher percentages of agricultural land incrops (Table 3-1).
In this section, we discuss patterns in agricultural production and trade. We devote moreattention to 7 of the 13 traditional borrowing countries of the Near East and North Africa. Theseseven represent the larger economies among the NENA13 that are not currently affected by civilconflict. They are discussed in the order of the size of their economies: Turkey, Egypt, Algeria,Morocco, Tunisia, Syria, and Jordan. The other six countries, most of which are smaller or haveexperienced some type of conflict in recent years, are also described, but in less detail.6
3.1.1 TurkeyTurkey is the most populous of the NENA13 countries under consideration, with almost 70 millioninhabitants. Per capita GDP is close to US$3,000, second to Lebanon among the 13 countriesunder consideration. As a result of the high income and large population, Turkey has, by far, thelargest economy in the NENA13 region, accounting for more than 40% of the region’s GDP. Turkeyis the only country among the 13 that is classified as food secure by Diaz-Bonilla et al. (2000).Turkey shows indicators of food security for the period 1997-99 comparable to those of developedcountries: high per capita calorie and protein consumption (3,522 calories and 100.5 g,respectively), high production per capita and a low ratio of food imports to exports. The ratio offood imports to total exports is quite low, around 2% since the mid-1990s (Figure 3-1). Theagricultural sector plays a fairly important role in the economy, considering the high income. Itemploys one third of the labour force, contributes 13% of GDP and accounts for 6% of exports.
In the 1980s, Turkey first launched a series of reforms to allow markets to play a greater role inthe economy. Some steps were taken towards trade liberalization, and banking system reforms wereimplemented. As a result of the trade reforms, the ratio of trade to GDP rose from only 17% in 1980to 33% in 1987, while the economic growth rate rose from 2% to 9%. In spite of these reforms,
6/ To be more precise, when measured in terms of GDP, the largest economies are, in order, Turkey, Egypt, Algeria, Morocco,Tunisia and Syria. Although Jordan has a smaller GDP than Lebanon, the Sudan and Yemen, we include it among the countriesthat are described in more depth.

31
macroeconomic stability was threatened by fiscal policy. The Government ran large budget deficitsin the mid-1980s and, again in the 1990s, leading to a 15-year period of relatively high inflation.From 1988 until 1998, the rate of inflation was above 60% every year. During the 1990s, economicgrowth was very volatile, including a sharp recession in 1994 (WTO 1998; World Bank 2004).
Under the Uruguay Round Agreement on Agriculture (URAA), Turkey bound 100% of dutieson agricultural products and committed itself to decreasing the simple average tariff rate by 24%by the year 2004 and to reduce each tariff line by at least 10%. Domestic support for agriculture iswell below the de minimis level; so, no further reduction was required. Turkey also agreed to reduceexport subsidies by 24% by 2004.
TABLE 3-1Agricultural land use, 2002
Share in Arable land agricultural land
Share of Ha per Share under Share of Share of Arable and Permanent arable land person cereal irrigated agricultural permanent pasture
in total production land area in cropsland in cropland total area
(%) (ha) (%) (%) (%) (%) (%)
Algeria 3 0.25 23 7 17 21 79Djibouti <1 0.00 1 100 56 0 100Egypt 3 0.04 94 100 3 100 0Jordan 3 0.05 19 19 13 35 65Lebanon 17 0.04 30 33 32 95 5Morocco 19 0.29 61 15 69 32 68Somalia 2 0.12 0 19 69 2 98Sudan 7 0.51 46 12 53 12 88Syria 25 0.28 66 26 74 40 60Tunisia 18 0.29 27 8 55 55 45Turkey 34 0.37 55 18 50 68 32West Bank and Gaza 18 - - - 32 - -Yemen 3 0.08 41 30 33 9 91
NENA13 - - 50 21 38 23 77
Sources: World Bank (2005a); FAO (2004, Appendix Tables); CIA (2005) for data on West Bank and Gaza.
FIGURE 3-1Ratio of food imports to total exports in Turkey, Egypt, Algeria, and Morocco(in %)
Sources: FAO (2005a); World Bank (2005a).
CHAPTER 3: AGRICULTURAL PRODUCTION AND TRADE PATTERNS
0
5
10
15
20
25
30
35
40
1990 1991 1992 1993 1994 1995 1996 1997 1998 1999 2000 2001 2002 2003
Turkey
Egypt
Algeria
Morocco

32
Starting in 1996, Turkey entered into a customs union with the EU that required far-reachingchanges in trade policy. Under this agreement, Turkey became committed to set external tariffs nohigher than those in the EU (except for a small number of goods) and provided preferentialtreatment to imports from the EU. The customs union covers industrial trade, but not agriculturaltrade, pending harmonization of Turkey’s agricultural policies with the common agricultural policyof the EU. Partly as a result of this customs union, the simple average tariff rate for imports declinedfrom 27% in 1993 to 13% in 1998 (WTO 1998). These measures have led to a more openeconomy, as the ratio of trade to GDP rose from 44% in 1995 to 60% in 2002 (World Bank 2004).In 1999, Turkey became a pre-accession candidate for membership in the EU. The Governmentcontinues to carry out legal, economic and political reforms to boost its case for EU membership.
In spite of these reforms, continued fiscal imbalance in the late 1990s (over 10% of GDP) ledto a banking and exchange rate crises in 1999-2001. A stabilization programme was implementedwith support from international financial institutions. Macroeconomic reforms and fiscal controlreduced inflation from 55% in 2000 to around 12% in 2004, while the economy has reboundedwith 6-8% GDP growth in recent years (World Bank 2004).
In the agricultural sector, Turkey maintained input and credit subsidies and output pricesupports that artificially raised agricultural prices through the 1990s. However, these policiesmostly benefited large farmers and proved fiscally unsustainable. In 2000, the Governmentimplemented a reform programme replacing the subsidy scheme with direct income support paidto farmers as a flat rate per hectare. These payments, intended to soften the shock from removingthe subsidies, are not linked to the production of any specific crop. In addition to direct incomesupport, the reform programme provides farmers with transition payments to facilitate switchingto more profitable crops or activities. Finally, it encouraged commercialization and theprivatization of national parastatals in sugar and tobacco and the restructuring of the Turkish GrainBoard (World Bank 2004; WTO 2003a).
Because 34% of the land is arable (the highest share in the region), and because there are 0.37ha of arable land per person (second highest in the region), agriculture continues to be a crucialsector of the economy (Table 3-1). Farming is carried out throughout the country, although it is lesscommon in the mountainous eastern regions, where animal husbandry is the main activity. In themid-1990s, crop cultivation accounted for about two thirds and livestock for one third of the grossvalue of agricultural production, forestry and fishing. Turkey’s leading crops (in terms of area) arewheat, barley, grapes for raisins, maize, chickpeas, cotton and olives. As shown in Table 3-2, Turkeyaccounts for a large share of the region’s agricultural output. Turkey produces between one thirdand one half of the total NENA13 output of wheat, fruits and vegetables, and meat and dairyproducts, and it produces over half of the region’s cotton and sugar beets.
TABLE 3-2Agricultural production, 2002-04 average
Meat and Total cereals Wheat Milled rice Fruits and Sugar Cotton lint Olive oildairy vegetables
products Beets Cane
(1 000 t)
Algeria 2 273 3 404 2 356 <1 4 678 - - <1 30Djibouti 25 0 - - 29 - <1 - -Egypt 6 517 17 781 6 882 6 143 22 302 2 741 16 229 260 -Jordan 366 95 45 - 1 355 - - - 27Lebanon 535 144 118 - 1 676 - - - 6Morocco 2 167 7 279 4 682 20 7 119 3 658 959 <1 50Somaliaa 2 319 369 - - 240 - 200 - -Sudan 5 851 4 626 304 13 3 027 - 5 500 74 -Syria 2 403 5 801 4 742 - 4 240 1 312 - 286 180Tunisia 1 286 1 672 1 376 - 3 260 - - 2 120Turkey 12 078 31 743 19 839 377 36 236 14 370 - 931 175West Bank & Gaza 314 71 48 - 779 - - - -Yemen 497 489 114 - 1 309 - - 10 -
NENA13 34 312 73 105 40 506 6 554 86 011 22 081 22 688 1 562 588
Sources: FAO (2004), (2005a).a Somalia production statistics are from FAO estimates for 2004.

33
TABLE 3-3Main agricultural exports and imports of Turkey
Commodity Net exports Commodity Net imports(average over 2000-02 (average over 2000-02
in US$ millions) in US$ millions)
Hazelnuts 402 Sheep skins 239Prepared nuts 172 Maize 108Raisins 170 Soybeans 97Sugar (refined) 127 Soybean cake 91Dry apricots 103 Palm oil 86Pastry 94 Soybean oil 62Confectionary sugar 90 Sunflower seed 58Prepared fruit 90 Dry natural rubber 58Cigarettes 85 Rice, paddy 44
Source: FAO (2005b).
TABLE 3-4Net exports of selected commodities, 2001-03 average
Total Wheat Rice, milled Sugar (raw Cotton lint Olive oilcereals equivalent)
(thousand metric tons)
Algeria -6 947 -4 872 -58 -1 024 -9 -1Djibouti -114 -65 -19 -57 0 0Egypt -8 668 -4 681 535 -467 135 0Jordan -1 430 -414 -110 -211 -1 1Lebanon -849 -396 -45 -150 0 1Morocco -4 366 -2 938 -2 -546 -36 -6Somaliaa -227 -60 -99 -179 - 0Sudan -1 088 -893 -38 -10 56 0Syria -231 569 -203 -807 192 9Tunisia -2 742 -1 552 -13 -317 -25 52Turkey -1 406 -709 -309 417 -466 65WBGS -515 -35 -53 -77 0 1Yemen -2 336 -1 464 -249 -569 1 0
NENA13 -30 691 -17 450 -487 -2 736 -154 123
Source: Based on trade volumes from FAOSTAT (2005).a Statistics for Somalia are for 1997-99.
Turkey’s export revenue7 in 2002 was US$55 billion, while agricultural exports represent about6% of the total (WTO 2003a). As shown in Table 3-3, Turkey has a relatively diversified base ofhigh-value agricultural exports. It exports over US$400 million in hazelnuts per year, followed byprepared nuts, raisins, sugar, and apricots (see also Table 3-4).
Total imports of goods and services by Turkey were US$55 billion in 2003. Of this amount,agricultural imports were 6% of the total. The largest agricultural imports are sheepskins, maize,soybeans, and cooking oil (Table 3-3 and Table 3-11). Thus, Turkey’s agricultural trade is unusualcompared to its NENA neighbours in three respects. First, agricultural exports are dominated, morethan in any other NENA country, by fruits and nuts. Second, the country is self-sufficient in grains,unlike most NENA countries which import large quantities of wheat, barley, and other grains.Third, Turkey has a surplus in agricultural trade; the value of agricultural exports greatly exceeds thevalue of agricultural imports.
7/ In this section, export revenue refers to revenue from the exports of goods and services, while imports refer to the value ofimports of goods and services. The data are from World Bank (2005a).
CHAPTER 3: AGRICULTURAL PRODUCTION AND TRADE PATTERNS

34
3.1.2 EgyptAmong the NENA13 countries under consideration, Egypt has the second largest population andthe second largest economy after Turkey. The per capita GDP is US$1,622, higher than most of theNENA13 countries, but significantly lower than that of Lebanon, Tunisia and Turkey. Thepopulation is concentrated in the Nile Delta and along the banks of the Nile River. With 43% ofthe population living in urban areas, Egypt is less urbanized than most of its NENA neighbours.
Like many developing countries, Egypt pursued a strategy of import-substitutionindustrialization in the 1960s and 1970s. Following a debt crisis in 1982, Egypt became one ofthe first NENA countries to launch a series of economic reforms to adopt a more outward-orientedtrade policy. These reforms included reduction and simplification in import tariffs, reduction innon-tariff barriers, unification of multiple exchange rates and depreciation of the real exchangerate to stimulate exports. According to the World Bank, the simple average tariff rate in Egypt islow by world standards, lower than 60% of the countries in the world. Furthermore, the progressin trade liberalization over 2000-04 was among the strongest in the world (World Bank 2005d).Egypt is currently enjoying a windfall as a result of the high world prices for its oil exports andincreased revenue from the Suez Canal, since the high cost of fuel has made the alternative –circumnavigating Africa – more costly.
Part of this liberalization was unilateral, and part was related to various trade agreements.Egypt signed an EMAA with the EU in 2001; the agreement came into force in 2004. It is a memberof the Greater Arab Free Trade Agreement (GAFTA), under which all intra-Arab trade would be dutyfree by 2005. Egypt also signed the Agadir Declaration, establishing free trade among Egypt, Jordan,Morocco and Tunisia (Hoekman and Konan 2005).
Agricultural production is highly concentrated along the Nile River and in the Nile Delta.About 97% of the area of Egypt is uncultivated due to the extremely limited rainfall. Virtually allagricultural land is allocated to crop production, and all crop production is irrigated (World Bank2004). Although the arable land per person is quite small (0.04 ha), this is offset by multiplecropping and intensive production. The main crops are wheat, cotton, rice, and fruit and vegetables.
Egypt is a net importer of food, and the self-sufficiency ratio in various food crops has declinedsince the 1960s. The rising dependence on imported food is a major concern among policymakersand has resulted in various attempts to restrict food imports and stimulate domestic production.On the other hand, the value of food imports as a ratio of total exports declined from 28% in 1990to 12% in 2003 (Figure 3-1). Diaz-Bonilla et al. (2000) classify Egypt as food neutral.
Egypt’s agricultural exports were US$800 million in 2002, about 5% of total exports. As shownin Table 3-5, cotton is the most important agricultural export. Egyptian cotton has long fibres andis considered one of the best in the world, fetching high prices on international markets. Theaverage value of cotton exports over 2000-02 was US$205 million, but, more recently, cottonexports have surpassed US$500 million thanks to expanded output and higher world prices.Cotton is also used in Egypt’s textile sector, which produces cloth and garments for domestic useand for export. Egypt also exports rice, fruits and vegetables, including oranges, onions, potatoesand mango juice (Table 3-4 and Table 3-5).
Agricultural imports were US$4 billion in 2002, or one fifth of the total. As in many countriesin the region, wheat is the most important agricultural import (Table 3-5). Over 2000-02, Egyptimported an average of US$732 million in wheat per year. Wheat is a politically sensitivecommodity because bread is the main staple food. Wheat production and marketing were strictlycontrolled until market reforms in the 1980s and 1990s. Agricultural input and output marketshave been liberalized to some degree, but the Government maintains subsidies on some types ofbread and attempts to boost domestic production by restricting imports of wheat and flour. Thesecond largest agricultural import is maize. Maize demand is rising due to the use of maize asanimal feed. Chapter 5 provides more information on the Egyptian agricultural sector, agriculturaltrade patterns and trade policies.

35
TABLE 3-5Main agricultural exports and imports of Egypt
Commodity Net exports Commodity Net imports(average over 2000-02 (average over 2000-02
in US$ millions) in US$ millions)
Cotton (lint) 205 Wheat 732Milled rice 100 Maize 561Molasses 22 Soybean cake 207Oranges 31 Beef and veal, boneless 185Onions (dry) 17 Tobacco leaves 168Vegetables dehydrated 15 Tea 112Potatoes 6 Soybean oil 76Vegetables frozen 9 Broad beans (dry) 66Flax fibre and tow 7 Soybeans 68Mango juice 4 Sugar (refined) 44
Source: FAO (2005b).
3.1.3 AlgeriaAmong the NENA13 countries, Algeria is the third largest economy, in terms of GDP, after Turkeyand Egypt. It is also the largest country in terms of area, but four fifths of the land is in the Sahara.Agricultural land accounts for 17% of total area, and more than three fourths of this is underpermanent pasture. Still, in terms of arable land per capita, Algeria is on a par with Morocco, Syriaand Tunisia (Table 3-1).
From independence until the late 1980s, the Government followed a socialist model ofdevelopment based on centralized planning, price controls and the creation of large numbers ofstate enterprises. The 1990s were also marked by violent conflict between the Government andIslamist rebels. The annulment of the 1992 elections, apparently won by the opposition, sparked aseven-year period of violence, costing over 150,000 lives. In 1999, the new Government ofPresident Bouteflika offered rebels amnesty and implemented a series of political reforms that havebeen credited with bringing peace to Algeria.
Starting in 1990 and accelerating in the mid-1990s, the Government began to liberalize prices,devalue the exchange rate, privatize state enterprises and promote private investment (IMF 2004a).It has liberalized the marketing of agricultural inputs and outputs, though it continues to controland subsidize the price of staple foods, such as wheat, for consumers.
Algeria’s simple average tariff rates remain quite high, among the top 5% of countries in theworld. On the other hand, its progress in trade liberalization over 2000-04 was greater than twothirds of the world’s countries (World Bank 2005d). The state continues to play a major role in theeconomy, accounting for 60% of GDP. The Government appears committed to changing thissituation. However, in December 2004, following the re-election of President Bouteflika, theGovernment announced a plan to sell off 1,200 of the 1,500 state-owned enterprises in Algeria,including the state oil company. The high price of oil in global markets has created a windfall forAlgeria, some of which is being devoted to addressing problems of unemployment and housing(Jeune Afrique 2005).
Some of this trade liberalization has been implemented in preparation for WTO membership.Algeria applied for WTO membership in 1987, but the working group to negotiate accession didnot meet until 1998. Since then, negotiations and regulatory reform have moved more quicklytowards WTO membership.
In the 1960s, the agricultural sector satisfied almost all the country’s food requirements andaccounted for over half of export revenues. The importance of agriculture, however, diminishedsteadily as oil and gas became driving forces of the economy. Following the “Dutch disease” pattern,oil and gas exports reduced the competitiveness of other exports such as agricultural commoditiesand facilitated food imports. By 1990, the share of agriculture in GDP had fallen to 11%. Althoughit is clear that agriculture’s role has declined appreciably, agriculture remains important. About 42%of the population lives in rural areas, and 26% depend on agriculture as a means of livelihood.
CHAPTER 3: AGRICULTURAL PRODUCTION AND TRADE PATTERNS

36
In 2002, Algerian export revenue was about US$20 billion per year, of which hydrocarbons (gasand oil) represented about 96%. Recent increases in oil prices have increased export revenues toUS$35 billion. Agricultural exports are very minor by comparison: less than US$50 million in 2000.The largest agricultural export commodity is cooking oil, which generates less than US$5 millionin revenue per year.
Algerian imports were about US$14 billion in 2002. Agricultural imports were roughly 20% ofthe total: US$2.8 billion in 2000. As shown in Table 3-6, Algeria imported US$800 million ofwheat and smaller amounts of maize, barley, rice and other commodities. Wheat production in thecountry supplies only 10-30% of domestic consumption. Almost all maize and most of the barleyconsumed in Algeria are imported. On the other hand, the country is self-sufficient in potatoes, thesecond most important commodity in terms of the volume of domestic production. Overall,Algeria is a net agricultural importer by a large margin. In spite of the fact that Algeria importsalmost all its food, the ratio of food imports to total exports is below 20%, thanks to oil exports(Figure 3-1).
3.1.4 MoroccoThe population of the Kingdom of Morocco is about 30 million, making it about half the size ofEgypt or Turkey. Per capita GDP is US$1,457, close to the average of the NENA13 countriesunder consideration. According to the World Bank classification, Morocco is a lower-middleincome country.
King Hassan II ruled Morocco from 1961 until his death in 1999. He was succeeded by his son,who became King Mohammed VI. Under the new Government, political, economic and socialreforms have been initiated. King Mohammed VI has allowed moderate Islamist parties to operatelegally, eased restrictions on the press and given greater rights to women. Since 1996, Morocco hasbeen liberalizing staple food marketing. The state monopoly on the importation of staple foodshas been dismantled except for the import of common wheat flour. Quantitative importrestrictions were converted into tariffs, resulting in import tariffs as high as 339%. Tariffs onagricultural imports average 33%. Price controls have been largely removed, although thelegislation allowed a continuation of price controls on common wheat flour, sugar and tobacco forfive years (until 2006). Consumer subsidies remain on common wheat flour and sugar. Variableimport duties are used to stabilize and support the farmgate price of wheat, barley, maize, rice andsorghum (WTO 2003b).
Morocco is a member of WTO and has signed an EMP agreement with the EU and an FTA withthe United States. In spite of these agreements, Morocco retains a relatively high tariff structure. TheWorld Bank estimates that the simple average tariff rate is among the highest 1% among the world’scountries (World Bank 2005d).
TABLE 3-6Main agricultural imports of Algeria
Commodity Net imports(average over 2000-02
in US$ millions)
Wheat 824Maize 206Barley 58Milled paddy rice 16Beer of barley 2Wheat flour 4Barley malt 3Pastry 2Oats 2Maize flour 1
Source: FAO (2005b).

37
Morocco has more agricultural potential than many NENA countries due to suitable soils andrainfall, combined with irrigation potential. Currently, Morocco satisfies about two thirds of itsgrain requirements, growing wheat, barley and maize in the rainfed areas. Wheat is the mainagricultural import, followed by sugar and soybean oil (Table 3-7). Food imports have been 7-15%of the total value of exports since the 1990s (Figure 3-1).
Agricultural exports are dominated by fruits and vegetables (Table 3-7). Citrus fruits, tomatoes,olives, potatoes and other horticultural crops are grown, often under irrigation, and exported toEurope. Exports are facilitated by the short distance across the Strait of Gibraltar to Spain. Fruit andvegetable exports account for about 80% of Moroccan agricultural exports. More information onagriculture and trade in Morocco is provided in Chapter 8.
3.1.5 TunisiaTunisia is a relatively small country, with only 10 million inhabitants. Although the country has fewnatural resources, per capita GDP grew at a healthy rate (around 3%) over the 1990s and into thefirst years of the current decade. Per capita GDP was over US$2,500 in 2002, giving Tunisia the thirdhighest income in the NENA13 region behind Lebanon and Turkey.
From independence in 1956 until 1987, Tunisia was ruled by President Habib Bourguiba. Heattempted to create a modern state, promoting the rights of women and implementing universalprimary schooling. In 1987, Ben Ali was elected president. President Ben Ali has implementedsome political and economic reforms; he was re-elected for a third time in 2004.
The high income and positive growth rate in Tunisia have been attributed to the relativelyfavourable investment climate, significant foreign investment, expanding industrial output(particularly textiles) and good relations with both Europe and the rest of North Africa. At the sametime, Tunisia maintains relatively high tariff barriers. According to the World Bank (2005d), theaverage tariff rate is among the top 1% of countries. There has been some trade liberalization,however: the average tariff rate came down from 29% in 2000 to about 25% in 2004.
Agriculture accounts for about 10% of GDP and employs about 20% of the labour force. Themain grain crops are wheat and barley. Olives, dates and citrus fruits are grown for both export anddomestic consumption.
Over 2000-02, the average value of Tunisian agricultural exports was about US$500 million. Thedominant agricultural export commodity has been olive oil, although the value of olive oil exportsfluctuates sharply from year to year. Other important agricultural exports include dates, wheat flour,tomato paste and pasta, reflecting the importance of the food processing sector (Table 3-8).
Agricultural imports were US$1.2 billion, about 12% of total imports. As is the case with manyother NENA countries, wheat is the most important agricultural import. Other importantagricultural imports are maize, barley, soybean cake, soybean oil and sugar (Table 3-8). Like mostother NENA countries, the value of agricultural imports exceeds the value of agricultural exports.However, the value of food imports has remained at only 5-10% of the total value of exports (Figure3-2). More information on the agricultural sector and trade in Tunisia is provided in Chapter 6.
CHAPTER 3: AGRICULTURAL PRODUCTION AND TRADE PATTERNS
TABLE 3-7Main agricultural exports and imports of Morocco
Commodity Net exports Commodity Net imports(average over 2000-02 (average over 2000-02
in US$ millions) in US$ millions)
Tangerines and other citrus 100 Wheat 531Oranges 90 Sugar (raw) 137Tomatoes 88 Soybean oil 123Olives, preserved 73 Maize 120String beans 31 Barley 91Prepared fruit 27 Tea 61Processed cheese 25 Soybeans 58Wheat flour 24 Cigarettes 46Crude organic materials 24 Butter 46Strawberries 20 Beet pulp 39
Source: FAO (2005b).

38
TABLE 3-8Main agricultural exports and imports of Tunisia
Commodity Net exports Commodity Net imports(average over 2000-02 (average over 2000-02
in US$ millions) in US$ millions)
Olive oil 123 Wheat 208Dates 60 Maize 82Wheat flour 23 Barley 65Tomato paste 22 Soybean cake 60Pasta 10 Soybean oil 52Oranges 8 Sugar (refined) 39Maize oil 7 Cotton 33Beverages (non-alcoholic) 7 Sugar (raw) 23Pastry 5 Tobacco leaves 17Food wastes 2 Potatoes 14
Source: FAO (2005b).
FIGURE 3-2Ratio of food imports to total exports in Tunisia, Syria, and Jordan(in %)
Source: FAO (2005a); World Bank (2005a).
3.1.6 SyriaThe Syrian Arab Republic has about 17 million inhabitants, about half of whom live in urban areas.Per capita GDP is US$831, above that of the poorest NENA countries (Djibouti, Somalia, the Sudanand Yemen), but below the others. The agricultural sector is relatively large, accounting for 23% oftotal GDP. This places Syria third after Somalia and the Sudan among the NENA13 countries underconsideration.
In the late 1950s, the Syrian Government adopted socialism, maintaining control of majorindustries, though private services and retail trade were allowed. The economy has been adverselyaffected by various conflicts in the region, including the Arab-Israeli wars of 1967 and 1973 andthe civil war in Lebanon. In the early 1990s, growth was stimulated by limited economic reformsand a major expansion in oil exports, but growth has been slow since then. The Government stillimposes significant controls on the economy, including price controls, state monopolies in certainsectors, large agricultural subsidies and a large number of state-owned enterprises. Overall, percapita GDP grew at 2.2% per year during the 1990s, an improvement over its performance duringthe 1980s, when per capita GDP fell in real terms.
0
5
10
15
20
25
30
35
40
1990 1991 1992 1993 1994 1995 1996 1997 1998 1999 2000 2001 2002 2003
Tunisia
Syrian Arab Republic
Jordan

39
TABLE 3-9Main agricultural exports and imports of Syria
Commodity Net exports Commodity Net imports(average over 2000-02 (average over 2000-02
in US$ millions) in US$ millions)
Cotton 204 Sugar 119Sheep 144 Maize 80Tomatoes 66 Tea 44Anise/fennel 65 Soybean cake 38Wheat 48 Milled rice 51Grapes 15 Cigarettes 11Oranges 12 Dry skim milk 8Fruit, prepared 10 Soybeans 18Cherries 9 Sugar (raw) 11Goats 8 Coffee, green 19
Source: FAO (2005b).
As in many NENA countries, wheat is the most important food crop. Syria is self-sufficient inwheat thanks to import restrictions and subsidies to promote wheat production. Barley and maizeare also grown, but domestic production is not sufficient to satisfy demand. Syria also producesgrapes, apples and olives in the highlands and citrus fruits along the coast. Horticulturalproduction is often irrigated. About 26% of the arable land in Syria is irrigated, much of this dueto the Euphrates Dam built in the 1970s.
Agricultural exports are about US$1 billion; the main exports are cotton, sheep, tomatoes andanise/fennel (Table 3-9). As a group, fruit and vegetable exports earn over US$100 million per year.Syria imports about US$860 million in agricultural products. The main agricultural imports aresugar, maize and tea (Table 3-9). These import patterns partly reflect import barriers on agriculturalgoods. According to the Foreign Agricultural Service of the US Department of Agriculture, “Processedfoods, canned foods, frozen foods, snack foods, meat, fruits, and vegetables are, in general, notpermitted to be imported.” The ratio of agricultural imports to total exports has fallen from over20% in the early 1990s to less than 10% in recent years thanks in part to oil exports (Figure 3-2).More information on agricultural and trade patterns in Syria is provided in Chapter 7.
3.1.7 JordanThe Hashemite Kingdom of Jordan is a relatively small country with a population of 5 million. Itis highly urbanized (79% of the population lives in urban areas), and the agricultural sector issmall, contributing only 2% of GDP. Jordan does not have oil reserves, unlike many of itsneighbours, and water resources are limited.
Jordan’s economy was severely affected by the 1967 Arab-Israeli war, in which it suffered heavycasualties, was forced to absorb large numbers of Palestinian refugees, and lost the West Bank,representing one third of its most fertile land and one third of its GDP. The civil war of 1970,conflicts with Israel, the Palestinians and Syria, and the two wars in Iraq have also curtailedeconomic growth. In 1989, Jordan suffered an exchange rate crisis; a spike in inflation and externalimbalance necessitated a 50% devaluation against the dollar, causing a sharp drop in thepurchasing power of Jordanian consumers.
In the 1990s, the Government was able to reduce inflation and stabilize the economy. It alsoinitiated a series of trade and market reforms. The tariff structure, which was characterized by highand variable tariff rates, was simplified, bringing the weighted average rate down from 34% in 1987to 25% in 1994 and 13% in 2004. Price controls on wheat, rice, barley, sugar, meat and milk hadbeen phased out by 1999. Food subsidies, the cost of which was 3% of GDP in 1990, were alsophased out, with the exception of a small subsidy on wheat. Universal food subsidies were replacedwith increased targeted assistance through the National Aid Fund (IMF 2004b). These policies havekept inflation below 5% and have led to sustained economic growth of 4-5% since 2000.
In 1997, Jordan signed an EMP agreement with the EU, involving phased reduction in tariffs.The following year, Jordan signed GAFTA with other Arab countries. In 1999, it joined WTO. And,
CHAPTER 3: AGRICULTURAL PRODUCTION AND TRADE PATTERNS

40
in 2000, Jordan signed an FTA with the United States. Over a ten-year period, the two countries willeliminate most tariffs on imports from each other. According to the World Bank, the degree of tradeopenness in Jordan is relatively low, in the 20th percentile among countries of the world.Nonetheless, progress over 2000-04 was relatively rapid, putting Jordan at the 86th percentile interms of progress (World Bank 2005d).
The Jordanian economy relies heavily on three foundations: (i) its status as the world’s thirdlargest producer of phosphates, (ii) its educated work force, and (iii) its role as a transit port fortrade between Europe and the Near East. Before the Iraq War, Jordan served as a key transshipmentpoint in the oil-for-food programme. The war disrupted these trade flows and adversely affected theeconomy, though Jordan benefits from the reconstruction effort. Because re-exports are animportant activity in Jordan, the trade ratio (the value of imports and exports expressed as apercentage of GDP) is over 100%.
Revenues from the export of goods and services by Jordan were US$4.3 billion in 2002(US$2.7 billion for goods exports). Phosphates and other fertilizers were the most importantexports during the 1990s. Agricultural exports were US$400 million, about 9% of the total. Themain agricultural exports are hydrogenated oil, tomatoes, cigarettes and other vegetables, as shownin Table 3-10. Since 2000, Jordanian exports have grown very rapidly (16.6% per year), drivenlargely by textile and apparel exports (IMF 2004b). The Multi-Fibre Arrangement, whichestablished quotas to regulate trade in textiles and apparel, expired in January 2005. This removesJordan’s preferential access to European markets, exposing textile and apparel exporters to greatercompetition, particularly from China, India and Pakistan.
Total imports in 2002 were US$6.2 billion; agricultural imports represented US$900 million.As in many NENA countries, wheat is the largest agricultural import product (US$79 million).Other major imports are maize, sugar, barley and rice (Table 3-10).
Unlike in many North African countries, domestic grain production is minimal in Jordan.Wheat and barley are grown in rainfed upland areas, but the domestic production of wheataccounts for less than 10% of consumption. Instead, agricultural production is focused on fruitsand vegetables, which are grown in the fertile Jordan Valley. In fact, nine of the top ten mostimportant agricultural commodities in terms of the volume of production are fruits and vegetables,led by tomatoes, olives, and cucumbers and gherkins. Merchandise imports are twice the value ofmerchandise exports; the difference is made up by foreign direct investment, foreign aid andremittances from Jordanian citizens working abroad.
TABLE 3-10Main agricultural exports and imports of Jordan
Commodity Net exports Commodity Net imports(average over 2000-02 (average over 2000-02
in US$ millions) in US$ millions)
Hydrogenated oils 67 Wheat 79Tomatoes 48 Maize 53Cigarettes 20 Sugar 52Cucumbers and gherkins 19 Barley 43Chilies and peppers 8 Milled paddy rice 38Cauliflower 8 Palm oil 35Eggplants 6 Soya bean cake 32Lettuce 5 Tobacco products 26Green beans 5 Prepared food 26
Source: FAO (2005b).

41
3.1.8 Other countriesThis section briefly describes the other six countries in the NENA13 group: Djibouti, Lebanon,Somalia, the Sudan, West Bank and Gaza, and Yemen. In general, these economies are smallerthan those described in more depth above. Furthermore, many of them have been affected by civilwar, insurgency, or some other type of conflict, making trade liberalization a less immediatelyrelevant issue.
DjiboutiDjibouti is one of the poorest among the NENA13 countries under consideration. Its GDP fell bymore than 25% over the 1990s, reaching about US$700 per capita in 2002. A large share of thepopulation (84%) lives in urban areas. The social indicators on Djibouti (such as life expectancy,primary school enrolment and unemployment) are among the lowest in the region.
Djibouti gained its independence from France in 1977 and has maintained a neutral stancewith respect to its two larger neighbours, Ethiopia and Somalia. It has few natural resources, andits economy is based largely on transport and service activities associated with its deep-water port.The port is a free trade zone and has become an international transshipment and refueling centre.The only rail link between Ethiopia and the Red Sea is in the port of Djibouti.
The agricultural sector is quite small, accounting for only 3% of GDP. In rural areas, nomadicpastoralism is a chief occupation; goats, sheep and camels are raised. Date palms and somevegetables are grown, and there is a small fishing industry. Manufacturing is mainly limited to foodprocessing, shipbuilding and repair. The main exports are hides, cattle and coffee (transshippedfrom Ethiopia). Djibouti imports transport equipment and petroleum, as well as consumer goodsand 90% of its food needs. The value of food imports in the 1990s was 20-30% of the total valueof exports (Figure 3-3). Diaz-Bonilla et al. (2000) classify Djibouti as a food insecure country. Itseconomic development depends largely on foreign investment and aid. The main trading partnersare France and other EU countries, Ethiopia, Japan, Saudi Arabia and Yemen.
LebanonLebanon has had a dynamic economy. Although imports are generally five to six times greater thanexports, the earnings from tourism, transit trade and remittances from abroad compensate for themerchandise trade deficit. The long-term civil war (1975-91) and the Israeli invasion in 1982damaged Lebanon’s economy. In 2005, Syrian troops and advisors left the country, giving Lebanonthe opportunity for greater autonomy in economic and political decisions. The optimism createdby this withdrawal was dashed by the Israeli invasion in July 2006 and the subsequent 34-dayconflict with Hezbollah forces.
The Lebanese economy is one of the most open economies in the NENA region. The simpleaverage tariff was 11% in 2000 and was reduced to 6% in 2004. This places Lebanon in the 81stpercentile in terms of the degree of trade openness among the world’s countries (World Bank 2005d).
Almost one fourth of Lebanon’s land is cultivated, the highest proportion in the Arab world.In the utilization of the arable land, almost one third is devoted to growing cereals. In spite of this,Lebanon produces only 15% of its wheat requirements, 45% of its legume needs and 10% of itssugar consumption. Its exports are primarily fruits and vegetables, including apples, potatoes, citrusfruit and tomatoes. Exports are primarily destined for neighbouring countries in the Middle East.The recent association agreement with the EU should make horticultural exports to the EU morefeasible, though it will be necessary to meet strict sanitary and phytosanitary requirements. Onestudy suggests that exports of tomatoes to the EU would not be feasible, but exports of cucumbersand eggplants would be (UNEP 2005).
Over the 1990s, the burden of food imports on the Lebanese economy declined markedly. Inparticular, the ratio of food imports to total exports fell from over 100% in the early 1990s to about40% in 2004 (Figure 3-3). Although the value of food imports roughly doubled over this period,the value of exports increased fourfold. Nonetheless, this food import ratio is second only to WestBank and Gaza in the NENA13 region.
CHAPTER 3: AGRICULTURAL PRODUCTION AND TRADE PATTERNS

0
15
30
45
60
75
90
105
120
1990 1991 1992 1993 1994 1995 1996 1997 1998 1999 2000 2001 2002 2003
42
SomaliaSomalia is one of the poorest and least developed countries in the world. In addition to the lack ofnatural resources and vulnerability to drought, a civil war has devastated the economy. After thedeath of President Siad Barre in 1991, clan leaders were unable to agree on a replacement and thecountry disintegrated into warring factions. Although the civil war has ended, no centralgovernment controls the entire territory. In some areas, local authorities collect taxes and providesome basic public services. Other areas are more chaotic, but, even there, banks, traders and evenmobile telephone companies operate in a lawless environment. Protracted negotiations in Kenyaled to the formation of an interim government backed by the United Nations, but it has not beenable to gain control over much of the country. In December 2006, the Ethiopian military, acting insupport of the Transitional Federal Government, defeated the Islamic Courts Union. Internationalpeacekeeping troops are now maintaining a fragile peace in the country.
The last time statistics were compiled, in 1990, agriculture was the most important sector,contributing 65% of GDP and absorbing about 70% of the labour force (Table 2-4). Less than 16%of the land area is considered arable, and 60% of this was allocated to grain production (Table 3-1).The use of agricultural inputs and equipment such as fertilizer and tractors was the lowest amongthe NENA13 countries under consideration. Nomads and semi-nomads who are dependent onlivestock production make up a large portion of the population. Trade data available fromSomalia’s trading partners on more recent years indicate that livestock (sheep, cattle, goats andcamels) account for almost all Somalia’s agricultural exports, though, in the 1980s, bananas werean important export. Sugar, wheat flour, rice and cooking oil are the main agricultural imports(FAO 2005b).
Serious humanitarian concerns continue to be expressed in several areas of the northern andcentral regions as a result of the effects of successive droughts and conflicts among factions. Insome areas, destitute pastoralists have congregated steadily to form camps in villages, along roadsand at permanent water points in Sool and Nugal. Water shortages, depleted pastures andexorbitant water prices still affect much of the region (FAO 2004).
FIGURE 3-3Ratio of food imports to total exports in Djibouti, Lebanon, The Sudan, West Bank and Gaza, and Yemen(in %)
Source: FAO (2005a); World Bank (2005a).
Djibouti
Lebanon
Sudan
West Bank and Gaza
Yemen

43
SudanThe Sudan is the largest of the NENA13 countries in terms of area and, with 33 million inhabitants,the third most populous. The country has significant natural resources, including oil reserves, goldand abundant arable land. It has suffered from a long-lived civil war between the Government in thenorth (which is largely Arab and Muslim) and separatists in the south (which is primarily Africanand Christian). President Bashir has been under considerable international pressure to end the warand control the activities of paramilitary groups in the south. In January 2005, the Government andthe Sudan People’s Liberation Movement and Army signed a peace agreement, known as theNaivasha Agreement, to put a formal end to the civil war, which had lasted over 20 years. Theconflict, however, continues with attacks by militia groups on residents in western Sudan.
In spite of the war, economic growth has been quite robust: 3.2% growth in per capita GDPover 1990-2002. This has been attributed to strong economic reforms carried out in the 1990s,favourable weather for agriculture and the development of oil reserves, with exports starting in1999. Inflation was reduced from 130% in 1996 to 8% in 2002.
Large investments continued to be made in the 1980s in mechanization and irrigation.Agriculture accounts for about 13% of total exports. The main agricultural exports are cotton, textilefibres and sesame. The most important agricultural import is wheat, which accounted for 38% ofagricultural imports in 2001-03 (Table 3-11). It should be kept in mind that these import statisticsinclude food aid. However, food aid has represented less than 10% of total wheat imports into theSudan in recent years.8 The value of food imports as a proportion of total exports fell from about40% in 1998 to about 10% in 2003 (Figure 3-3) as a result of oil exports beginning in 1999. On aper capita basis, the agricultural imports into the Sudan are small. Somalia and the Sudan each haveagricultural imports of only US$13 per person, compared to US$45-200 per person among all otherNENA13 countries. Diaz-Bonilla et al. (2000) classify the Sudan as a food insecure country.
Although the relative importance of the agricultural sector has declined, it still accounts for39% of GDP and 59% of employment. Relative to the size of the economy, the Sudan has thelargest agricultural sector among the NENA13 countries under consideration.
Crop cultivation is divided between a modern market-oriented sector comprising mechanized,large-scale irrigated and rainfed farming (mainly in central Sudan), and small-scale farmingfollowing traditional practices that is carried on in the other parts of the country where rainfall orother water sources are sufficient for cultivation.
The Sudan has about 1 million ha under irrigation, or 12% of the arable land in the country.The Gezira irrigation scheme established in 1925 accounts for somewhat more than half of thisarea. Today, the Gezira irrigation scheme is managed by the Government using tenant farmers whogrow cotton, sugar cane, wheat and sorghum. About 93% of the irrigated area is in governmentprojects; the remaining 7% belong to private operations. Although there is scope for expandingirrigation in the Sudan, the allocation of Nile River water is limited by international treaty.
West Bank and GazaWest Bank and Gaza is not a sovereign nation, but rather a territory with limited autonomy. Itrepresents land that has been occupied by Israel since the 1967 Arab-Israeli War. The 1993 OsloAccords provided for the establishment of the Palestinian National Authority and granted limitedself-rule to the territory. West Bank and Gaza has a population of 3.4 million and is the mostdensely populated of the NENA13 countries. Approximately 87% of the population lives in urbanareas, making it the second most urbanized country within the NENA13 region (only Lebanon ismore urbanized).
Per capita GDP was US$849 in 2003, towards the bottom of the range of lower-middle incomecountries. Agriculture represents only 9% of GDP; citrus and olives are important crops. Servicesaccount for 73% of GDP, partly due to the importance of public services, police and securityservices, and construction.
8/ Statistics of the Food and Agriculture Organization of the United Nations indicate that wheat imports have been around 1million t per year since 2000, while wheat received as food aid has been in the range of 50,000-90,000 t per year.
CHAPTER 3: AGRICULTURAL PRODUCTION AND TRADE PATTERNS

44
The economy of West Bank and Gaza is highly dependent on Israel. This is partly caused by theproximity of the two countries and the wage differentials between them. In 1992, it was estimatedthat one third of the Palestinian workforce was employed in Israel (Farsakh 2001). Furthermore,about 96% of West Bank and Gaza exports go to Israel, and Israel is the source of 76% of theimports of West Bank and Gaza (Astrup and Dessus 1998). The Protocol on Economic Relationsbetween Israel and the Palestinian Liberation Organization signed in 1994, established a de factocustoms union between Israel and West Bank and Gaza. The protocol calls for the elimination ofrestrictions on trade or the movement of workers between Israel and West Bank and Gaza.However, Israel closed the borders with and between the West Bank and Gaza more than 20% ofthe period between 1994 and 1999. The existence of Israeli settlements and movement restrictionswithin the West Bank and Gaza also limits the flow of goods and services. In response to the secondIntifada, which began in September 2000, Israel further restricted trade and the movement ofworkers across the border between West Bank and Gaza and Israel. This caused a sharp reductionin the number of Palestinians working in Israel and was a major factor in the 35% decline in percapita GDP between 2000 and 2003 (Farsakh 2001). Although West Bank and Gaza has signedtrade agreements with Egypt and Jordan, an association agreement with the EU, and an FTA withthe United States, its growth and trade remain highly dependent on access to the Israeli economy.
YemenThe Republic of Yemen has 19 million inhabitants, 75% of whom live in rural areas. It is one ofthe poorest countries in the region, with per capita GDP of barely US$300. The agricultural sectorrepresents 15% of GDP, down from 24% in 1990. Yemen became a net oil exporter in the late-1980s, which contributed to the fall in the share of agriculture in total exports from 11% in 1990to only 2% in 2002.
After years of border wars, the traditional North Yemen and Marxist South Yemen merged in1990. In 1994, there was a brief civil war in which forces in the south attempted to secede, but therevolt was suppressed. In April 2000, Yemen applied to become a member of WTO, and a workingparty has been established to negotiate the terms. The main export from Yemen is oil, and cottonis a distant second. In recent years, Yemen has benefited from the rise in world oil prices. In spiteof some reforms, the policy environment is not considered favourable for private investment.Foreign direct investment is only 0.1% of GDP, compared to the regional average of 0.7%.Furthermore, the World Bank estimates that the investment climate in Yemen is less favourablethan that in three quarters of the countries in the world (World Bank 2005d).
3.2 Structure of protectionThe agricultural trade structures in NENA13 reveal similar patterns across countries, characterizedby a high dependence on cereal imports (a regional average of 30% of agricultural imports), andthe importance of fruit and vegetables exports, a regional average of 44% of total agriculturalexports (Table 3-11 and Table 3-12). For most of these countries (Algeria, Egypt, Morocco, Syria,Tunisia and Turkey), the EU is the main trading partner: exports from these countries to the EUaverage between 41 and 80% of their respective total exports. The direction of trade flows isdifferent in the region’s LDCs: their main trading partners are other LDCs in the region and otherArab countries, particularly Saudi Arabia and the United Arab Emirates, with the exception of theSudan, which trades mostly with China, Japan, and other Asian countries (IMF 2005).
Table 3-13, Table 3-14 and Table 3-15 summarize the average level of protection among tenNENA13 countries and other groups computed using the MAcMap-HS6 database developed byBouet et al. (2004). The MAcMap-HS6 database is a collection of weighted averages of the tariffs ortariff equivalents of applied border protection for 165 reporting countries, 5,111 commodities and208 trading partners. The tariff equivalents reflect all regional agreements and trade preferences,resulting in true measures of the degree of trade discrimination. Table 3-13 indicates that, relativeto other regions in the world, the NENA13 countries have high levels of protection. Except forLebanon and Turkey, NENA13 countries have levels of protection ranging between 11 and 30%.Bouet (2006b) ranks Egypt, Morocco and Tunisia among the 11 most protectionist countries in theMAcMap set of countries. For these countries, the results are consistent with earlier tariff rankings

45
CHAPTER 3: AGRICULTURAL PRODUCTION AND TRADE PATTERNS
TABLE 3-11Structure of agricultural imports, 2001-03 average
Share in agricultural imports
Total Food Meat and Dairy Cereals Wheat Rice Fruit and Sugar Cotton Olive agriculture and meat and vegetables (raw lint oil
importsa animals products eggs equivalent)
(US$ ‘000s) (%)
Algeria 2 772 566 87.7 1.6 18.8 37.7 28.2 0.6 8.2 8.9 0.4 0.0Djibouti 144 695 64.0 1.1 12.6 19.9 11.3 3.6 8.2 8.7 0.2 0.1Egypt 3 151 279 81.9 6.3 4.2 40.4 22.1 0.5 7.8 3.2 0.4 0.0Jordan 897 943 80.9 5.9 9.3 24.7 7.8 4.8 10.9 5.9 0.1 0.0Lebanon 1 229 602 76.6 4.6 12.3 10.0 4.5 1.4 13.4 2.9 0.0 0.0Morocco 1 692 366 72.3 0.2 5.3 40.7 28.8 0.1 4.2 7.8 2.6 0.8Somaliab 121 333 92.5 0.0 1.0 48.9 10.9 28.1 1.6 34.6 0.0 0.0Sudan 443 422 85.4 0.0 5.5 47.0 38.3 2.2 5.9 4.3 0.0 0.0Syria 811 095 78.9 0.1 4.6 19.5 1.3 6.9 7.7 22.0 0.0 0.0Tunisia 944 523 73.6 0.2 3.0 40.9 24.2 0.4 4.4 7.1 3.1 0.1Turkey 3 223 593 33.8 0.0 1.1 12.9 4.9 2.8 4.0 0.0 17.1 0.1West Bankand Gaza 500 749 85.0 1.8 7.1 23.1 1.8 6.1 17.8 5.9 0.0 0.0Yemen 893 075 84.1 9.1 10.1 32.8 17.4 7.3 5.6 13.1 0.0 0.0
NENA13 16 826 242 71.9 2.7 7.4 29.5 16.9 2.1 7.2 5.9 3.9 0.1
Source: Based on trade values from FAO (2005a).a FAO defines imports to include food aid. FAO statistics on food aid indicate that, over the period 2000-04, the proportion of wheat imports that are in the form of food
aid has been 5-10% for the Sudan and Yemen and close to zero for Somalia.b Statistics for Somalia are for 1997-99.
TABLE 3-12Structure of agricultural exports, 2001-03 average
Share in agricultural exports
Total Food Meat and Dairy Cereals Wheat Rice Fruit and Sugar Cotton Olive agriculture and meat and vegetables (raw lint oil
exportsa animals products eggs equivalent)
(US$ ‘000s) (%)
Algeria 39 167 58.3 0.1 2.0 0.1 0.0 0.0 45.4 0.0 0.0 0.1Djibouti 10 565 91.6 0.0 3.2 52.0 43.4 5.9 8.0 2.7 0.0 0.0Egypt 777 612 53.0 0.2 1.7 17.3 0.0 16.7 24.2 1.5 37.8 0.1Jordan 389 514 66.5 1.7 11.3 0.6 0.0 0.3 38.9 0.2 0.0 0.5Lebanon 195 835 66.6 1.3 1.5 1.8 0.0 0.9 38.5 0.9 0.0 1.1Morocco 834 636 88.2 0.0 4.0 4.1 0.4 0.0 74.1 0.0 0.0 0.4Somaliaa 162 542 99.0 0.0 0.0 0.0 0.0 0.0 4.7 0.0 0.0 0.0Sudan 347 829 47.2 3.8 0.0 1.3 0.0 0.0 6.7 5.5 15.3 0.0Syria 771 701 67.7 0.0 1.2 13.9 11.7 0.0 23.3 0.0 23.7 2.4Tunisia 438 317 53.5 0.2 2.0 6.2 0.0 0.0 25.8 0.0 0.0 20.4Turkey 4 133 669 78.6 0.4 0.8 3.9 1.2 0.0 53.4 2.4 1.5 2.8West Bank and Gaza 61 036 88.6 1.1 3.7 2.7 0.2 0.6 62.8 1.3 0.0 1.9Yemen 87 279 68.8 0.0 3.7 3.1 0.5 0.0 31.5 0.2 1.2 0.0
NENA13 8 249 702 72.9 0.5 1.8 5.9 1.8 1.6 44.1 1.6 7.2 2.8
Source: Based on trade values from FAO (2005a).a Statistics for Somalia are for 1997-99.
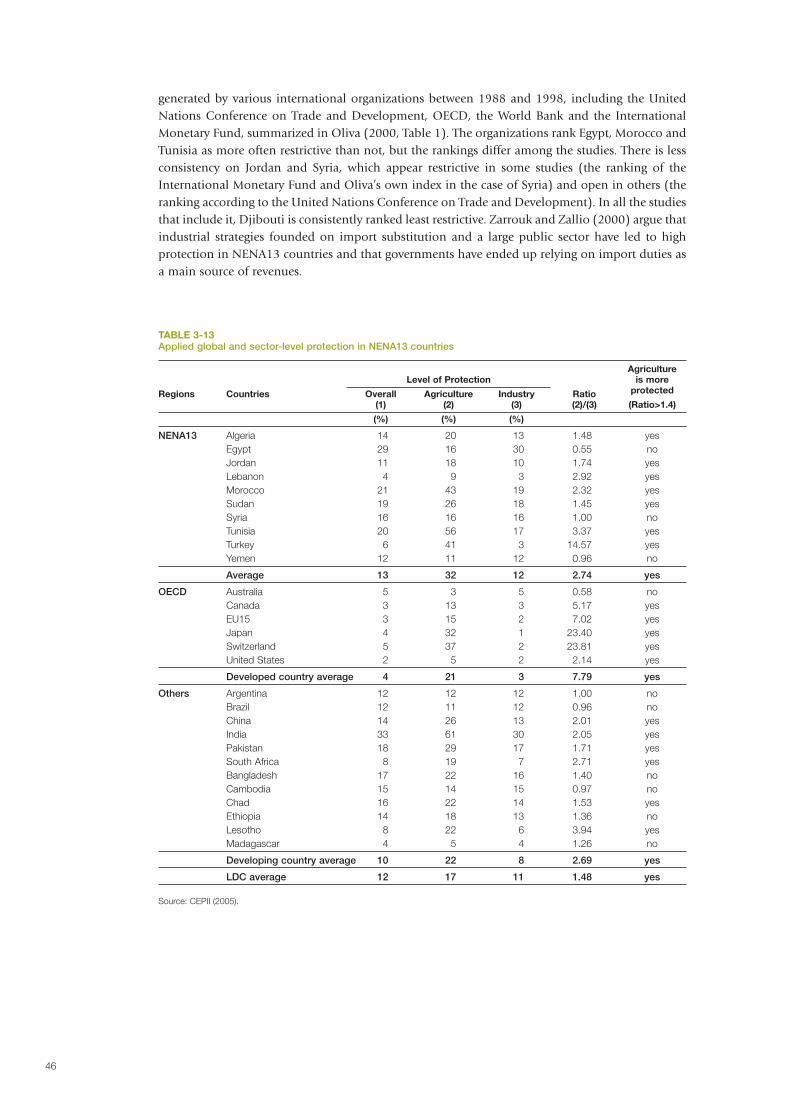
46
generated by various international organizations between 1988 and 1998, including the UnitedNations Conference on Trade and Development, OECD, the World Bank and the InternationalMonetary Fund, summarized in Oliva (2000, Table 1). The organizations rank Egypt, Morocco andTunisia as more often restrictive than not, but the rankings differ among the studies. There is lessconsistency on Jordan and Syria, which appear restrictive in some studies (the ranking of theInternational Monetary Fund and Oliva’s own index in the case of Syria) and open in others (theranking according to the United Nations Conference on Trade and Development). In all the studiesthat include it, Djibouti is consistently ranked least restrictive. Zarrouk and Zallio (2000) argue thatindustrial strategies founded on import substitution and a large public sector have led to highprotection in NENA13 countries and that governments have ended up relying on import duties asa main source of revenues.
TABLE 3-13Applied global and sector-level protection in NENA13 countries
AgricultureLevel of Protection is more
Regions Countries Overall Agriculture Industry Ratio protected
(1) (2) (3) (2)/(3) (Ratio>1.4)
(%) (%) (%)
NENA13 Algeria 14 20 13 1.48 yesEgypt 29 16 30 0.55 noJordan 11 18 10 1.74 yesLebanon 4 9 3 2.92 yesMorocco 21 43 19 2.32 yesSudan 19 26 18 1.45 yesSyria 16 16 16 1.00 noTunisia 20 56 17 3.37 yesTurkey 6 41 3 14.57 yesYemen 12 11 12 0.96 no
Average 13 32 12 2.74 yes
OECD Australia 5 3 5 0.58 noCanada 3 13 3 5.17 yesEU15 3 15 2 7.02 yesJapan 4 32 1 23.40 yesSwitzerland 5 37 2 23.81 yesUnited States 2 5 2 2.14 yes
Developed country average 4 21 3 7.79 yes
Others Argentina 12 12 12 1.00 noBrazil 12 11 12 0.96 noChina 14 26 13 2.01 yesIndia 33 61 30 2.05 yesPakistan 18 29 17 1.71 yesSouth Africa 8 19 7 2.71 yesBangladesh 17 22 16 1.40 noCambodia 15 14 15 0.97 noChad 16 22 14 1.53 yesEthiopia 14 18 13 1.36 noLesotho 8 22 6 3.94 yesMadagascar 4 5 4 1.26 no
Developing country average 10 22 8 2.69 yes
LDC average 12 17 11 1.48 yes
Source: CEPII (2005).

47
9/ To maintain consistency in comparing the results of Schiff and Valdes (1992) and the MAcMap database, we do not includethe indirect effect part of the tax on agriculture from the former study.
10/ The EU15 refers to the 15 members of the European Union prior to the accession of ten candidate countries on 1 May 2004.The EU15 includes Austria, Belgium, Denmark, Finland, France, Germany, Greece, Ireland, Italy, Luxembourg, Netherlands,Portugal, Spain, Sweden, United Kingdom.
Table 3-13, which classifies countries as protectors of agriculture if the ratio of the level ofagricultural protection to industrial protection is at least 1.4, shows that, on average, countriesprotect agriculture more than industry and that developed countries do this much more often thandeveloping countries. NENA13 countries, led by Turkey, have, on average, a slightly higher ratio(2.74) than do other developing countries (2.69) and a much higher ratio than the ratio in LDCs.
This is in contrast with the findings on 18 developing countries summarized in Schiff andValdes (1992, Table 1) that illustrate the bias against agriculture emanating from agricultural sectorpolicies (direct effects) and from industrial protection and macroeconomic policies (indirecteffects). Considering only the direct effects, one sees that taxation on agriculture was 25% in Egyptover the period 1964-84 and 15% in Morocco over the same period.9 In Turkey, agricultural policiesresulted in an average of 5% protection over the period 1961-83.
Since the structural adjustment programmes and accession to WTO, which curtailed industrialprotection, the average global tariff has decreased (WTO 2002), but agriculture protection has beenreduced at a much slower pace. By 2001, seven of the ten NENA13 countries included in theMAcMap database were protecting agriculture more than industry: for example, 41% versus 3% inTurkey, 56% versus 17% in Tunisia and 43% versus 19% in Morocco. Bayar (2001) finds similarrates for Turkey, slightly above 3% for industrial tariff (a consequence of the Customs Union withthe EU and implementation of the Uruguay Round reduction) and 41% for agriculture (which hasbeen left out of the Custom Union between the EU and Turkey and is lagging in multilateralnegotiations). Egypt, Syria and Yemen are classified as non-protectors of agriculture, with a ratioequal to or below 1.00 (Table 3-13).
Agricultural protection in NENA13 countries also varies relative to trading partners. NENA13countries impose an average agricultural tariff rate on imports from NENA13 countries, 31%, thatis nearly equal to the average tariff on the rest of the world, 32% (ROW in Table 3-14). Conversely,the tariff faced by the exports of NENA13 countries to other NENA13 countries, 31%, is higher, onaverage, than the tariffs faced by exports to other country groups: 12% to developed countries, 20%to developing countries and 22% to LDCs. In spite of the various regional agreements among Arabcountries, regional integration among NENA13 countries has been limited.
Within the NENA13 region, a few patterns emerge for agriculture: Tunisia and Turkey have thehighest protection rates on goods imported from other NENA13 countries, 72% and 41%,respectively. They also face the highest rate of protection from NENA13 countries, 36% in bothcases. Finally, they discriminate most against each other: Tunisia imposes a 97% tariff rate onimports from Turkey, and Turkey imposes a 60% rate on imports from Tunisia. These average hightariffs may fall because the two countries signed an FTA in 2004. The average tariff is zero betweenAlgeria and Morocco due to bilateral agreements between the two countries (Bouet 2006b).Djibouti and the Sudan face the lowest protection from other NENA13 countries, 4 and 20%, onaverage, respectively (Table 3-14).
In general, NENA13 countries face higher protection from Asian middle-income countriessuch as China, India and Pakistan (21, 42 and 25%, respectively) than from OECD countries (12%on average). Among OECD countries, Japan and Switzerland have the highest tariff rates, onaverage, especially with respect to imports from Egypt (60 and 68%, respectively) and from Jordan,which faces a 120% tariff rate in Switzerland. NENA13 countries face lower tariffs with respect tothe EU1510 and the United States. The rates are particularly low or zero in the case of LDCs due tothe Generalized System of Preferences accorded to them. Yet, although it entered into an FTA withthe EU15 in 1998, Tunisia faces a 26% tariff rate on exports to the EU15, higher than the union’saverage tariff of 6% for imports from the NENA13 countries and 16% on imports from the rest ofthe world. This is also true, though to a lesser extent, for Egypt and Jordan, although their FTAs withthe EU15, as of 2004 and 2002, respectively, would not be registered in the 2001 protection rates(Table 3-14).
CHAPTER 3: AGRICULTURAL PRODUCTION AND TRADE PATTERNS
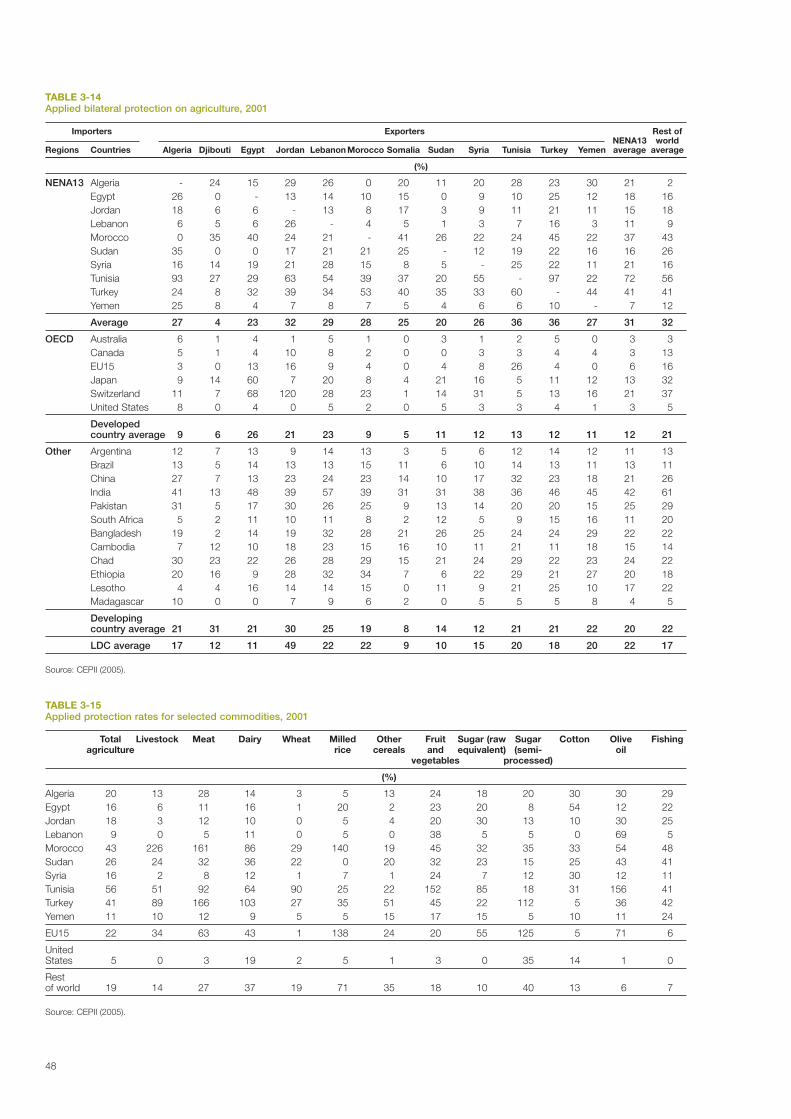
48
TABLE 3-14Applied bilateral protection on agriculture, 2001
Importers Exporters Rest of NENA13 world
Regions Countries Algeria Djibouti Egypt Jordan Lebanon Morocco Somalia Sudan Syria Tunisia Turkey Yemen average average
(%)
NENA13 Algeria - 24 15 29 26 0 20 11 20 28 23 30 21 2Egypt 26 0 - 13 14 10 15 0 9 10 25 12 18 16Jordan 18 6 6 - 13 8 17 3 9 11 21 11 15 18Lebanon 6 5 6 26 - 4 5 1 3 7 16 3 11 9Morocco 0 35 40 24 21 - 41 26 22 24 45 22 37 43Sudan 35 0 0 17 21 21 25 - 12 19 22 16 16 26Syria 16 14 19 21 28 15 8 5 - 25 22 11 21 16Tunisia 93 27 29 63 54 39 37 20 55 - 97 22 72 56Turkey 24 8 32 39 34 53 40 35 33 60 - 44 41 41Yemen 25 8 4 7 8 7 5 4 6 6 10 - 7 12
Average 27 4 23 32 29 28 25 20 26 36 36 27 31 32
OECD Australia 6 1 4 1 5 1 0 3 1 2 5 0 3 3Canada 5 1 4 10 8 2 0 0 3 3 4 4 3 13EU15 3 0 13 16 9 4 0 4 8 26 4 0 6 16Japan 9 14 60 7 20 8 4 21 16 5 11 12 13 32Switzerland 11 7 68 120 28 23 1 14 31 5 13 16 21 37United States 8 0 4 0 5 2 0 5 3 3 4 1 3 5
Developed country average 9 6 26 21 23 9 5 11 12 13 12 11 12 21
Other Argentina 12 7 13 9 14 13 3 5 6 12 14 12 11 13Brazil 13 5 14 13 13 15 11 6 10 14 13 11 13 11China 27 7 13 23 24 23 14 10 17 32 23 18 21 26India 41 13 48 39 57 39 31 31 38 36 46 45 42 61Pakistan 31 5 17 30 26 25 9 13 14 20 20 15 25 29South Africa 5 2 11 10 11 8 2 12 5 9 15 16 11 20Bangladesh 19 2 14 19 32 28 21 26 25 24 24 29 22 22Cambodia 7 12 10 18 23 15 16 10 11 21 11 18 15 14Chad 30 23 22 26 28 29 15 21 24 29 22 23 24 22Ethiopia 20 16 9 28 32 34 7 6 22 29 21 27 20 18Lesotho 4 4 16 14 14 15 0 11 9 21 25 10 17 22Madagascar 10 0 0 7 9 6 2 0 5 5 5 8 4 5
Developing country average 21 31 21 30 25 19 8 14 12 21 21 22 20 22
LDC average 17 12 11 49 22 22 9 10 15 20 18 20 22 17
Source: CEPII (2005).
TABLE 3-15Applied protection rates for selected commodities, 2001
Total Livestock Meat Dairy Wheat Milled Other Fruit Sugar (raw Sugar Cotton Olive Fishingagriculture rice cereals and equivalent) (semi- oil
vegetables processed)
(%)
Algeria 20 13 28 14 3 5 13 24 18 20 30 30 29Egypt 16 6 11 16 1 20 2 23 20 8 54 12 22Jordan 18 3 12 10 0 5 4 20 30 13 10 30 25Lebanon 9 0 5 11 0 5 0 38 5 5 0 69 5Morocco 43 226 161 86 29 140 19 45 32 35 33 54 48Sudan 26 24 32 36 22 0 20 32 23 15 25 43 41Syria 16 2 8 12 1 7 1 24 7 12 30 12 11Tunisia 56 51 92 64 90 25 22 152 85 18 31 156 41Turkey 41 89 166 103 27 35 51 45 22 112 5 36 42Yemen 11 10 12 9 5 5 15 17 15 5 10 11 24
EU15 22 34 63 43 1 138 24 20 55 125 5 71 6
United States 5 0 3 19 2 5 1 3 0 35 14 1 0
Rest of world 19 14 27 37 19 71 35 18 10 40 13 6 7
Source: CEPII (2005).

49
CHAPTER 3: AGRICULTURAL PRODUCTION AND TRADE PATTERNS
11/ The trade reform index measures the change in country rank in a worldwide ranking of simple average tariffs in 2000 and 2004(World Bank 2005d).
The NENA13 countries with the highest average tariff rates also have very high tariffs onselected commodities: Morocco has a 226% tariff on livestock, 161% on meat and 140% on rice.Tunisia protects fruits and vegetables at an average tariff of 152% and olive oil at 156%. Turkey hasa 166% average tariff rate on meat, 103% on dairy and 112% on sugar. Algeria has a more evenlydistributed protection pattern and lower rates, as does Egypt, except for cotton, which has a tariffrate of 54%. Fruit and vegetables and olive oil, the main export sectors in the NENA13 countries,are consistently protected (Table 3-15).
Among the protection instruments used by NENA13 countries, in addition to standard tariffs,are para-tariff measures (custom surcharges, additional taxes and surcharges, stamp taxes, statisticstaxes, and sales taxes levied on imports) and non-tariff barriers (quantitative restrictions andtechnical requirements). In 1994, 23% of the total custom value in Egypt came through customsclearance charges. Algeria imposed, on average, 64% specific additional taxes on imports in 1998.In 1996, the custom clearance tax of 6.7% on Sudanese imports was higher than the most favourednation average tariff rate of 5.4% (Oliva 2000). These measures are not included in the protectionindicators presented in this section and would not be addressed directly by trade policy reforms.Yet, they represent institutional constraints that would lower the ability of NENA13 countries tobenefit fully from trade liberalization.
Trade reform is sometimes seen as an area where the NENA13 countries have made progress,especially in dismantling non-tariff barriers. Yet, despite these initiatives, some countries, such asEgypt, Morocco and Tunisia, registered a high overall trade restrictive index in 2001 of 44, 25.4 and24.9, respectively, compared to an average of 10.7 for other developing countries. The index nearlydoubles for Morocco when non-tariff barriers are included in the measure (World Bank 2005d). Inthe case of Egypt, recent reforms are not reflected in the index. Since the swearing in of a newcabinet in July 2004, Egypt has reduced tariff bands, annulled import fees and surchargesincompatible with the old General Agreement on Tariffs and Trade (GATT) and made drastic cutsin tariff rates on most imports. Consequently, Egypt’s simple average tariff declined by half between2000 and 2004, to 20% (World Bank 2005d).
The progress (or lack thereof) towards trade openness in the region is captured in the WorldBank’s structural reform indicators (World Bank 2005d). These indicators are used to rankcountries with respect to the restrictiveness of their current trade policies and to the progress theyhave made in trade reforms over 2000-04. Algeria, Morocco and Tunisia are among the 5% ofcountries with the most restrictive trade policies, but the reform progress indicators of 66, 49 and49 for these countries, respectively, indicate sizable improvement (100 reflecting the country withgreatest improvement).11 Still, the countries with a higher ranking in terms of trade openness, suchas Egypt (60) and Lebanon (81), also exhibit the highest reform progress ranking, 100 and 87,respectively, implying more progress than 87% of the world’s countries.
3.3 Trade agreementsTrade reform in NENA13 countries has been motivated in part by the region’s participation inmultilateral negotiations in the context of the WTO framework and in regional agreements underthe EMP, or in the context of GAFTA, or the Mediterranean Arab Free Trade Area. In addition, asprogressive steps to the US-Middle East Free Trade Area initiative, six NENA13 countries (Algeria,Egypt, Jordan, Morocco, Tunisia and Yemen) have entered into bilateral Trade and InvestmentFramework Agreements or FTAs with the United States. Trade and Investment FrameworkAgreements establish mechanisms to address bilateral commercial issues and are often a first steptowards negotiating FTAs. Finally, NENA13 countries have entered into FTAs with each other(Table 3-16). In most cases, regional and bilateral trade accords are driven by political interests. Forexample, the creation of Associations Agreements within the EMP is seen as a key element insupport of peace and stability in the region both for the security of the EU and to reduce theproblem of illegal immigration (McQueen 2002). These agreements are usually limited by lack ofcoverage (agriculture and services, both crucial for NENA13 countries, are effectively excluded), by

50
lack of depth (technical barriers to trade remain because of differences in regulatory requirementsand the need to duplicate testing) and by restrictive rules of origin limiting the degree of effectivemarket access (World Bank 2005d; Zarrouk and Zallio 2000).
3.3.1 The Uruguay Round under WTOIn 1947, the GATT was signed with the goal of reducing protectionism and discrimination ininternational trade. The agreement was followed by a series of rounds of international negotiationsto reduce protectionism and other distortions in trade. These agreements have been successful indramatically reducing the protection on manufactured goods; the average tariff fell from 38% in1947 to only 4% in 1994. Because of a reluctance to extend trade liberalization to agriculture,however, the average agricultural tariff remained high, 60% in 1994 (Ingco and Nash 2004). TheUruguay Round, signed in 1994, established the WTO to monitor and enforce the tradeagreements; it also included the URAA, which attempts to reduce agricultural protection, limitagricultural subsidies and make trade policy more transparent.
The URAA reduces agricultural protection through the following commitments:• Quantitative restrictions (such as import quotas) and other non-tariff barriers (such as variable
levies) were to be converted to tariffs or tariff rate quotas. An exception is sanitary andphytosanitary import requirements; these are regulated by the Agreement on the Applicationof Sanitary and Phytosanitary Measures, which also came out of the Uruguay Round.
• Each country sets a maximum (bound) tariff rate for each product. In industrializedcounties, the bound tariff is the tariff equivalent of the earlier quantitative restrictions.
• Countries agree to reduce the bound tariff rate according to a specific schedule.• Developing countries are given special and differential treatment. They are allowed to set
bound tariffs above the tariff equivalent of the earlier quantitative restrictions. They have alonger schedule (ten years instead of six years) to implement the changes, and their tariffreductions are generally two thirds of those required of industrialized countries.
In order to reduce farm subsidies, the URAA defines different types of government spending onagriculture, as follows:
• Green box expenditures include agricultural research and extension, infrastructure, animaland plant health programmes, food safety programmes, disaster relief, anti-poverty feedingprogrammes and farm credit. These are not subject to limits by the URAA.
• Blue box expenditures include payments to farmers that are combined with supply controlsand are based on production or planted area in a base period. These are not subject to limitsby the URAA.
• Amber box expenditures include subsidies on agricultural inputs such as fertilizers andirrigation, as well as price supports for agricultural production. Under de minimusexemptions, product specific subsidies are permitted if they are less than 5% of the value ofthe output of the commodity, and non-product specific subsidies are permitted if they areless than 5% of the value of all agricultural output. The value of non-exempt amber boxexpenditures is called the aggregate measurement of support. Some 30 countries declaredthis support spending and made commitments to reduce it over 1995-2001.
Developing countries are given “special and differential treatment” in that their de minimusexemption is 10%, rather than 5%, and they have ten years (1995-2005) to reduce their aggregatemeasurement of support spending. In addition, the LDCs are not required to cap or reduce suchsupport spending.
As noted previously, six NENA13 countries are members of the WTO. The most recent memberis Jordan (2000). Four countries are in the process of accession: Algeria, Lebanon, the Sudan andYemen (Table 3-16). As developing countries, NENA13 countries that are WTO members have beengiven greater flexibility under the URAA with regard to cutting their subsidies and lowering theirtariffs: the average cuts for all agricultural products are two thirds the rates of developed countries.They were also given more time to meet their commitments: ten years from 1995 instead of six.LDCs are exempt from all URAA commitments.

51
12/ The rates quoted by WTO are different from the rates generated by the MAcMap database (Table 3-13) for several reasons.First, the MAcMap data set is for 2001, while WTO’s rates are usually more recent. Second, WTO takes simple averages, while theMAcMap data set rates are obtained by applying weights that rely on the composition of the imports of a reference group ofcountries similar to the reporting country, taking into account preferential agreements. If the structure of the imports of thereference group shows very low levels of imports on products at the highest tariff rates, the weighted average would result in ratesthat are lower than the simple average (see details in Bouet et al. 2004, p. 23).
TABLE 3-16Multilateral, regional and bilateral agreements
WTO EMP US-MEFTAa GAFTA MAFTAb Others
Algeria Observer 2005 TIFAc
Djibouti Member COMESAd
Egypt Member 2004 TIFA X X COMESAJordan Member 2002 FTA X XLebanon Observer Interim X
AccessionAgreement
Morocco Member 2000 FTA X X EFTAe (2004)Somalia Non-member XSudan Observer X COMESASyria Non-member Candidate XTunisia Member 1998 TIFA X X EFTA (2004)Turkey Member 1998West Bank & Gaza Non-member Interim X
AccessionAgreement
Yemen Observer TIFA X
Sources: WTO (2005b) web site; Europa (2005); USTR (2006).a MEFTA, Middle East Free Trade Area, includes other members such as Bahrain, Israel and Oman.b MAFTA, Mediterranean Arab Free Trade Area.c TIFA, Trade and Investment Framework Agreement; also FTA.d COMESA, Common Market for Eastern and Southern Africa.e EFTA, European Free Trade Association (Iceland, Lichtenstein, Norway and Switzerland).
For NENA13 countries, bound rates on agricultural products, on average, remain well abovethe duties applied to most favoured nations. For example, in 2005, Egypt’s average bound rate inagriculture (excluding alcoholic beverages) was 27%, while its average applied most favourednation tariff was 5.8% (WTO 2005c, Table III.1).12 Within the framework of the WTO tradenegotiations, large gaps between bound and most favoured nation tariffs may create uncertaintybecause countries could raise their protection to their higher bound rates. The gap between boundand applied tariffs is not large, on average, in Morocco, 60.4 and 53.2%, respectively (WTO 2003b,Table III.1), but, for some products, it can be quite large. For example, wheat has an average appliedrate of 29% against a bound rate of 144% (Table 3-15; WTO 2003b, Table AIII.2). These large gapsfor specific products are sometimes the result of tariff rate quotas whereby products may be subjectto two tariffs: a lower one on import quantities within the quota and a much higher one onquantities above the quota. Morocco and Tunisia have 16 and 13 tariff rate quotas in theircommitments, respectively (on cereals, meat, sugar and dairy).
3.3.2 The Doha Round under WTOThe Doha Round, launched in 2001, was supposed to reflect both the increased prominence ofdevelopment concerns in WTO negotiations and the increased participation by developingcountries in the trading system (World Bank 2002b). Specifically, the new round was to incorporatethe negotiations on agriculture and services that started in 2000. But, originally targeted toconclude by January 2005, this new round has been marked by missed deadlines, failed discussionsand inconclusive conferences (Pal and Prakash 2005). Ministerial meetings in Cancun (2003) andin Hong Kong (2005) saw few results in terms of achieving better market access for developingcountries. Developing countries continue to complain that they still face exceptionally high tariffs,“tariff peaks”, on selected products that are important for their exports (textiles, clothing, fish andfish products). They are also subject to tariff escalation, whereby an importing country protects its
CHAPTER 3: AGRICULTURAL PRODUCTION AND TRADE PATTERNS

52
processing or manufacturing industries by setting lower duties on imports of raw materials andcomponents and higher duties on finished products (WTO 2005d). This is especially important forNENA13 countries, which experience high levels of unemployment and would benefit from bettermarket access for their processed products.
According to Hanrahan and Schnepf (2005), the US proposals in the Doha Round negotiationsinclude:
• eliminate agricultural export subsidies;• cut amber box ceilings by at least 60%;• limit blue box expenditures to 2.5% of the value of production;• reduce de minimus exemptions to 2.5% of the value of production;• cut tariffs by 55-90%;• set maximum agricultural tariffs at 75% (100% for developing countries); and• limit “sensitive products” to 1% of tariff lines.
In contrast, the EU proposals include the following elements:• eliminate agricultural export subsidies;• reduce amber box ceilings by 60-70%;• reduce de minimus exemptions to 1% of the value of production;• tighten limits on blue box programmes;• reduce tariffs 35-60%;• limit sensitive products to 8% of tariff lines;• establish new provisions to protect geographic indication labelling;• implement smaller tariff cuts for developing countries; and• eliminate tariff cuts for LDCs.
Increasingly, WTO member countries are forming groups and alliances within WTO to increasetheir bargaining power in negotiations. The G20, a group of developing countries that becameactive at the WTO meeting in Cancun, favours substantial reforms of developed countryagricultural subsidies and protection. Other alliances, such as the G10 and the G33, have madeseparate proposals (Hanrahan and Schnepf 2005). Djibouti, Egypt, Morocco and Tunisia belong tothe African group and the G90. Egypt and Morocco have submitted their own proposals arguingfor the substantial and rapid dismantling of tariffs and the elimination of domestic support on thepart of developed countries, more flexibility for developing countries that is consistent with theirdevelopment needs and an increased level of technical and financial assistance to net food-importing developing countries and LDCs (WTO 2001a, 2001b).
3.3.3 The Euro-Mediterranean Partnership13
Apart from WTO, the EMP (or Barcelona Process) involves the largest number of NENA13countries. It was signed on 28 November 1995 by the EU and 12 Mediterranean partner countriesto create a framework for political, economic, cultural and social ties among the partners.14 Themain instruments of the EMP, the EMAAs, have replaced the cooperation agreements of the 1970s,which were characterized by non-reciprocal preferences accorded by the EU to developing countries(McQueen 2002). The EMAAs provide for the establishment of FTAs over a transitional periodlasting a maximum of 12 years from the date of the entry into force of the agreements. Animportant element of these association agreements is trade liberalization in goods, services andcapital. The main economic target is the creation of the EU-Mediterranean free trade area by 2010,which will constitute, when fully implemented, the world’s largest free trade area. By the end of2005, one NENA13 country – Turkey – had formed a customs union with the EU, and five –Algeria, Egypt, Jordan, Morocco and Tunisia – had ratified Associations Agreements with the EU.15
13/ This section is based on Beuchelt (2005), unless otherwise indicated.
14/ The 12 Mediterranean countries include nine NENA13 countries and Cyprus, Israel and Malta.
15/ In the case of Turkey, the agreement is aimed towards the country’s future accession to the EU.

53
Syria is still in the process of ratification, and Lebanon and West Bank and Gaza have entered intoan interim agreement for early implementation of trade measures while awaiting ratification(Table 3-16; see Panagariya 2002).16
EMAAs are based on reciprocal liberalization for industrial trade and eventual liberalization foragricultural and fisheries products. Measures to liberalize trade in manufactured products are welldefined and adhere to fixed timetables. However, with regard to agriculture and services, measuresare less clear and involve no specific schedule (McQueen 2002). Under the EMAAs, the EU has notoffered significant new concessions to Mediterranean partner countries in terms of market accessfor their agricultural exports. By contrast, at the end of a fixed schedule for phasing out the tariffson manufactured products, the EU will benefit from duty-free access to the partners’ markets(GarciaAlvarez-Coque 2002). Reciprocity in industrial trade makes a substantial difference withrespect to the earlier preferential agreements, increasing market access for European products.Agriculture remains an exception; this has limited the possible benefits for NENA13 countries,which, as exporters, find competing with European producers difficult given the high protectionthat the EU offers its agriculture. Furthermore, because of the high concentration among a fewproducts in agricultural exports from NENA13 countries, if the EU blocks entry of a fewcommodities, this could be equivalent, for some countries, to blocking their total agriculturalexports. While the EU absorbed nearly 46% (2001) of the agricultural exports of Mediterraneanpartner countries, these exports amount to only 2% of EU imports. That this share has not changedsignificantly since 1990, in spite of the partnership agreements, reflects the relative exclusion ofagriculture (Radwan and Reiffers 2003).
Some analysts have questioned the benefits of the EMP for partner countries in the region. Theagreements largely eliminate the tariffs on industrial goods exported from NENA to the EU, but thebenefits may be modest because EU industrial tariffs are already low and because themanufacturing sector in the NENA countries may face difficulties competing in European markets.Furthermore, the agreements open NENA markets to the imports of manufactured goods from theEU. This may have negative effects on employment in local industries that are unable to competewith EU imports. Finally, reducing import tariffs in the NENA region means the loss of tariffrevenue. During 1994-1996, import tax revenue from the EU as a share of fiscal revenue was 19.2%in Algeria, 8% in Egypt, 12% in Jordan, 29% in Lebanon, 10% in Morocco and nearly 16% inTunisia (McQueen 2002; Garcia-Alvarez-Coque 2002). At the same time, it must be recognized thateliminating distortions caused by import barriers produces efficiency gains for the liberalizingcountry. In other words, the losses to producers and the government are outweighed by the gainsto consumers who face lower prices. Most observers agree, however, that the EMP would be evenmore beneficial to partner countries if it included agricultural trade liberalization.
One reason for the slow progress in agricultural trade liberalization is the influence of southernEuropean producers, who tend to lose the most from agricultural liberalization. These are amongthe poorer farmers of Europe, and they fear they will be squeezed out of the markets if the EUopens its agricultural markets further to Mediterranean partner countries.
Still, there seems to exist seasonal market windows for Mediterranean partner countries that arenot competitive with EU production. In a study for the Forum Euro-Méditerranéen des InstitutsEconomiques Research, Muaz (2004) identifies five horticultural crops (green beans, grapes, melons,strawberries and dates) that could be produced and exported by the Mediterranean partners withoutcompeting with EU production seasons and enjoy a comparative advantage. The author predicts thatthe partner countries could fulfill unsatisfied EU demand for the above crops during the wintermonths. The study estimates that gains to the five countries from expanded grape exports could beUS$227 million, while expanded strawberry exports could generate benefits of US$167 million. Theexport of dates would have the most positive impact on employment, generating 98,000 jobs in fivecountries: Egypt, Jordan, Lebanon, Syria, and the West Bank and Gaza.
16/ Interim agreements generally cover non-political aspects of trade and cooperation between the parties.
CHAPTER 3: AGRICULTURAL PRODUCTION AND TRADE PATTERNS

54
In the long run, most benefits from trade liberalization are expected to result from thedomestic economic reforms encouraged by the EMAAs. Free trade areas have the potential tostimulate modernization and efficiency in the region. With services accounting for around 60% ofGDP, the nine NENA13 countries in the EMP stand to make substantial gains from the gradualopening of the services sector and by attracting new investment. They will benefit even more if thenegotiations not only open up trade with the EU, but also foster regional integration among theMediterranean countries themselves. Trade among south Mediterranean countries accounts for lessthan 15% of the region’s total trade. This is the lowest such rate in the world for any region of thissize (Europa 2005).
3.3.4 The Everything But Arms InitiativeThe Generalized System of Preferences was born as a result of years of discussion within the UnitedNations Conference on Trade and Development. It allows industrialized countries to grantautonomous and non-reciprocal trade preferences to all developing countries (Malvarosa 2002).17
In the case of LDCs, the EU has extended the Generalized System of Preferences arrangementsunder the Everything But Arms Initiative. Under the initiative, the EU allows all products fromLDCs to enter duty free into the EU. The initiative essentially added agricultural products to theprevious Generalized System of Preferences, with three important exceptions, bananas, rice andsugar, which are to be given unlimited duty free access in January 2006, July 2009 and September2009, respectively.18 Sugar is potentially important to the Sudan, one of four LDCs in the NENA13region that are beneficiaries of these preferences.19
3.3.5 The US-Middle East Free Trade InitiativeThe US-Middle East Free Trade Initiative was proposed in May 2003 by the United States to increasetrade and investment between Middle Eastern nations and the United States and others in theworld economy. For some countries, Algeria, Lebanon and Yemen, the US’s efforts consist inexpediting their accession to the WTO. As a second step, the US may enter in Trade and InvestmentFramework Agreements, as is the case of Algeria, Egypt, Tunisia and Yemen. Finally, the process mayresult in FTAs. To date, only Jordan and Morocco have signed FTAs with the United States. But thesecountries represent marginal US trade partners. US exports to the Middle East and North Africa(MENA) region amounts to less than 2% of US total exports, and two thirds are directed to Egyptand Saudi Arabia (Peridy 2005). Exports to the US account for 14% of total exports for Algeria,18% for Egypt, and 29% for Jordan. But the exports of Tunisia and Morocco to the US are only 1and 4% of their exports, respectively (IMF 2005). These agreements are too recent to assess theirimpact, but they suffer some of the same limitations on agriculture liberalization as the EMP.
3.3.6 Trade agreements among NENA countriesIntraregional integration is very limited in spite of several attempts towards that end in the past 50years (Zarrouk 1998; Khasawneh 2000). Among the various attempts at regional integration, therevived GAFTA (1997), ratified by 15 members of the Arab League, seemed to offer some hope ofsuccess where others have failed.20 The programme has more specific commitments and schedulesthan its earlier version. For example, Arab countries agreed to cut customs tariffs and tariff-like
17/ To implement this system, an authorization (the enabling clause) was required under GATT rules allowing for an exception tothe principle of most favoured nation treatment and establishing that a member cannot discriminate between imports from differentsources; all are equally most favoured. (This principle was established in Article 1 of the GATT.) Under this framework, developedcountries are authorized to establish individual Generalized Schemes of Tariff Preferences (Europa 2003).
18/ The European Commission committed to end the tariff quota regime for bananas by 1 January 2006. All non preferentialsuppliers would be subject to a most favoured nation tariff, whereas bananas from the African, Caribbean and Pacific Group ofStates (as well as bananas originating in the LDCs under the Everything But Arms Initiative) would continue to enter duty free. On 1January 2006, with the change of the import regime, a reform of the banana Common Market Organization was launched.Honouring the agreement concluded in 2001 with the United States, and taking into account the results of arbitrations within theWTO, the EU substituted a tariff-only regime for the previous system of import quotas by region of origin. A €176 per t customsduty now applies uniformly to banana imports, except for a volume of 0.77 million t from the African, Caribbean and Pacific Groupof States that can enter the EU duty free (Europa 2006).
19/ For a detailed discussion of EU preferential trade policies and developing countries, see Panagariya (2002).
20/ At present, 14 members of the Arab League are effective members of the free trade area and comply with total or partialprocedures of adhesion. These are Bahrain, Egypt, Iraq, Jordan, Kuwait, Lebanon, the Libyan Arab Jamahiriya, Morocco, Oman,Qatar, Saudi Arabia, Syria, Tunisia and United Arab Emirates. Five countries are in progress of adhesion (Mauritania, Palestine,Somalia, the Sudan and Yemen), and three countries, namely, Algeria, Comoros and Djibouti, have not yet adhered (Malvarosa 2002).

55
charges by 10% per annum, to be completed by 2007 (Zarrouk 1998). But Khasawneh (2000) seesmany potential problems in the agreement that may impair its success, including the potentialabuse by member countries in claiming exceptions in the application of the lower tariffs and theremoval of non-tariff barriers. For instance, in agriculture, the programme offers members theopportunity to suspend tariff reductions on some produce during peak harvest seasons. So far, tenGAFTA countries have submitted a list of 30 fruits and vegetables exempted from the programme(ERF 2000). Likewise, Lebanese olive oil producers, who have been highly protected until now, fearthey will not be able to compete with other Arab countries because they have higher labour costsand smaller government subsidies on irrigation, mechanization, or spraying pesticides thanproducers in other Arab countries (Rasmussen 2004).
This new attempt at regional cooperation among Arab countries has been viewed as a measureto counteract the potentially adverse effects of the European initiative on intraregional trade amongthe member states of the Arab League (Zarrouk and Zallio 2000). Moreover, Mediterranean Arabcountries, building on their relationship with the EU, have concluded a new generation of bilateralFTAs with one another. Four countries in the EMP – Jordan, Egypt, Morocco and Tunisia – have setup the Mediterranean Arab Free Trade Area. Egypt has signed bilateral FTAs with a number of otherArab countries (Jordan, Lebanon, Morocco and Tunisia). Bilateral FTAs have also been establishedbetween Morocco and Tunisia, Jordan and Tunisia, Jordan and Morocco, and Lebanon and Syria.Still, these agreements are seen as ineffective and not fully implemented, and they have shownlimited results in terms of fostering intraregional trade. Some of the reasons are economic: Arabcountries lack the incentives to integrate because they have similar production structures andimpose high levels of protection on agriculture (Galal and Hoekman 2003).
3.4 SummaryIn describing the agricultural trade patterns of the NENA13 countries, one notices some commonpatterns. Agricultural exports represent a relatively small share of total exports, exceeding 10%only in the Sudan. Wheat is a staple food and important import for many of the NENA13countries. It represents more than 20% of the agricultural imports of Algeria, Egypt, Morocco, theSudan and Tunisia. Most of the NENA13 countries are net food importers, the main exceptionbeing Turkey. Some countries in the region show relatively high levels of protection for farmers:Egypt, Morocco and Tunisia are among the 15 most protected economies, according to Bouet(2006a). The commodities that are the most protected in the region are wheat, sugar, dairy andlivestock products. And, finally, the EU is the most important trading partner for most of thecountries in the region.
The NENA countries have signed a series of multilateral, regional and bilateral tradeagreements. The URAA imposes some commitments on member countries, including theconversion of quantitative restrictions into tariffs or tariff rate quotas, the binding of tariff rates,reduction in bound tariff rates by an average of 36% and reduction in trade-distorting measures ofsupport to agriculture by 20%, on average. Developing countries have been given more modesttargets for tariff rate reductions and more time to comply, while the LDCs are effectively exemptedfrom most commitments under the URAA. The direct impact of these commitments on theNENA13 countries has been modest. Somalia, Syria, and West Bank and Gaza are not WTOmembers. Djibouti, the Sudan and Yemen, as LDCs, are exempt from most URAA commitments.For the remaining seven countries, the bound rates are often far above the applied tariff rates,particularly for agricultural products. Thus, commitments to reduce the bound rate have had littleeffect on the actual level of agricultural protection.
The EU has signed EMAAs with five NENA countries as part of the EMP, and three others arein the process of ratification. These EMAAs commit both parties to phase out almost all tariffs onmanufactured goods, though the NENA countries have a longer period during which to comply.Although there are plans to incorporate agriculture at a later date, there are no firm targets orschedules for agricultural liberalization.
CHAPTER 3: AGRICULTURAL PRODUCTION AND TRADE PATTERNS

56
In 2001, the EU launched the Everything But Arms Initiative, under which the LDCs have duty-free access to EU markets for almost all goods. Within the NENA region, Djibouti, Somalia, theSudan and Yemen can take advantage of the initiative’s provisions. Bananas, rice and sugar weretemporarily exempted, and duty-free access was delayed until January 2006, July 2009 andSeptember 2009, respectively.
As part of the US-Middle East Free Trade Initiative, the United States has signed bilateral FTAswith Jordan and Morocco and intermediate agreements with four other NENA countries. Theeffect of the US-Jordan FTA will be small because Jordan’s level of protection is already low andbecause US-Jordan trade is small. The effect of the US-Morocco FTA will be larger becauseMoroccan trade barriers are higher. Of particularly importance, Morocco’s wheat tariffs will bephased out over ten years.
Under the US African Growth and Opportunity Act, sub-Saharan African countries that meetcertain criteria in human rights, reducing corruption and combating terrorism will have free accessto US markets. Djibouti qualifies, but its exports to the United States are negligible. The other sub-Saharan African countries in the NENA13 (Somalia, the Sudan and Yemen) do not qualify.
A number of bilateral and regional agreements within the NENA region have been signed, buttheir effectiveness has been limited by the structural similarities of the NENA economies and thegranting of exceptions for sensitive products. Nonetheless, a number of NENA countries, mostnotably Egypt and Tunisia, have reduced tariff barriers unilaterally in recent years. In other words,trade liberalization does occur outside the context of global, regional and bilateral tradeagreements.

Impact of Trade Liberalization
4

58
In this chapter, we examine the evidence regarding the impact of trade liberalization on theNENA13 countries, with particular emphasis on small farmers in these countries. The effect ofchanges in trade policy on a given country can be divided into two components. First, the “terms-of-trade effect” refers to the gains or losses associated with changes in world prices as a result of thepolicy. Most countries are too small for their trade policy to have a noticeable effect on worldprices, but global trade agreements can significantly influence world prices. Second, the “efficiencyeffect” refers to gains or losses associated with removing distortions in the country’s own market.Unless there are significant externalities, a reduction in market distortions generally has positiveefficiency effects. In other words, domestic market liberalization, to the extent that it reducesdistortions in the economy, will generate more benefits than costs on aggregate.
This view of trade liberalization differs considerably from the perspective of trade negotiators,for whom the goal is often to maximize access to the export markets in other countries, whileminimizing access to markets in their own countries. Within this view, tariff reductions in one’sown country are unfortunate concessions that must be made to achieve tariff reduction in exportmarkets. Because it attempts to maximize exports and minimize imports, the approach isessentially mercantilist. This perspective is often attributed to the greater political influence ofproducers who compete with imports relative to consumers who would gain from lower prices.However, it probably reflects the opinions of most people, for whom the negative effects of importcompetition are more visible than the benefits of lower prices to consumers.
This chapter is divided into two sections. The first section summarizes studies that assess theimpact of global trade liberalization on agricultural markets. This information is important inunderstanding the direction and size of the terms-of-trade effect. We focus on a few commoditiesfor which the markets are more distorted by import barriers and production subsidies. The secondsection provides a selective review of studies that evaluate the impact of trade liberalization on theNENA13 countries. These studies consider the impact of global trade liberalization in the contextof WTO, regional trade liberalization, bilateral trade liberalization with the US and the EU andunilateral liberalization by NENA countries.
4.1 Effects of trade liberalization on world agricultural marketsIn this section, we review policies that distort the global markets for five agricultural commodities(wheat, rice, sugar, cotton, and dairy products), as well as estimates of the impact that global tradeliberalization would have on the related prices. As mentioned above, this information sheds lighton the direction and size of the terms-of-trade effects that global trade liberalization would haveon the NENA13 countries.
4.1.1 WheatWheat provides nearly one fifth of the world’s calorie supply. More than 18% of the global demandfor wheat is met through international trade, mostly as exports from the OECD countries todeveloping countries. Nearly 30% of wheat production is also stored as a buffer against productionshortages (Mitchell and Mielke 2004).
The major exporters are the United States (24%), Canada, Australia, the EU25 and Argentina;these last together account for more than 75% of world wheat exports. The 11 largest importingcountries account for half of the net imports. More than 60% of net wheat trade is destined forNorth Africa, the Middle East, or Eastern Asia (HGCA 2005). China’s imports nearly doubled in2004-05 relative to previous years to almost 7 million t as the Chinese Government decided toimport to limit stock reductions. Algeria and Egypt are among the world’s largest importers, at 5 million and 4 million t in 2004-05, respectively (FAO 2005b).
Since 2000, wheat exporters such as the EU and the US have largely eliminated export subsidiesunder the URAA, but continue to provide support to domestic production through programmesthat include marketing assistance loan payments, direct and countercyclical payments, cropinsurance and surplus disposal programmes for export assistance (Vocke, Allen and Ali 2005). TheOECD countries support for wheat, as measured through producer support estimates, averaged35% of the value of production (2002-04), amounting to nearly US$17 billion of income transfersto producers (OECD 2005a).

59
Among importing countries, most favoured nation tariffs can be set high, and bound tariffseven higher, especially when these result from tariff rate quotas. Bound tariffs are especially highfor Japan (414% out-of-quota and 249% in-quota), Morocco (198% out-of-quota and 144% in-quota) and Colombia (130% out-of-quota and 124% in-quota). However, regional tradingagreements have resulted in preferential tariffs. The EU, for example, enjoys a preferential tariff onits wheat exports to Morocco of 2.5% compared to an average applied tariff of 29% (MAcMap-Hs6database). Similarly, Canada and the United States receive preferential treatment from Mexicounder the North American Free Trade Agreement, with tariffs of 4.5% instead of an average appliedtariff of 28% (Mitchell and Mielke 2004). Japan is the highest protector of wheat; it shows anaverage applied tariff of 186% (MAcMap-HS6 database). Several kinds of non-tariff barriers havealso been administered by governments, such as import licenses, quantity and quality restrictions,state trading and bureaucratic red-tape, to control wheat imports (Mitchell and Mielke 2004).
Among studies that have estimated the effects of trade and domestic reforms on the world priceof wheat, a few have tried to isolate the impact of domestic support granted to producers indeveloped countries from full trade liberalization scenarios, including border measures. Theremoval of all distortions (full liberalization) leads to increases in wheat prices ranging from 4.8%(FAPRI 2002) to 18.1% (USDA 2001). But the studies show different outcomes when estimatingthe role of domestic support. The Food and Agricultural Policy Research Institute study (FAPRI2002) shows that the increase in wheat prices would be 7.6% higher under a tariff-removal-onlyscenario than under a full liberalization scenario. The difference reflects the effect of domesticsupport policies such as set-aside programmes in the EU and the US, which, when removed, resultin a substantial increase in production and exports (7.9% compared to 5% under the tariff-removal-only scenario), dampening the price effect. Conversely, in the US Department ofAgriculture study (USDA 2001), the increase in wheat prices resulting from the elimination ofOECD domestic policies (12%) is larger than the price effect from the elimination of tariffs (3.4%).
Poonyth and Sharma (2003) simulate three trade liberalization scenarios based on theHarbinson modalities and the EU and US proposals presented at the WTO negotiations during1999-2002. All simulations lead to price increases in the world market price of wheat. The proposalof the United States, which differs from the other two in suggesting cuts on applied tariffs insteadof bound tariffs, leads to the highest increase (12%).
4.1.2 RiceRice is one of the most important food grains, accounting for 20% of caloric intake overall and29% among low-income countries. However, only a small share of rice production (less than 7%)is traded internationally (Wailes 2004). Unlike wheat and other commodities for which most ofthe distortion in world markets is attributed to the policies of high-income countries, rice isprotected in both developed and developing countries. Perhaps because it is an important sourceof income for many farmers in developing countries, rice is one of the most protected agriculturalcommodities. According to Bouet (2006a), the average level of protection on rice is over 70%, thehighest of the nine commodities analysed.
The leading rice exporters are Thailand, India, Vietnam and the United States. Thailand has aloan programme that provided a 10% support price in 2002. India, the second largest producer andconsumer of rice in the world, has a large government procurement and distribution system, as wellas price supports and export subsidies. Vietnam has a largely market-driven rice sector, althoughstate enterprises play an important role in processing and exporting rice. The United States providesprice support to its rice farmers through a combination of fixed direct payments (decoupled fromcurrent production) and a countercyclical payment. According to OECD, these policies provide aproducer subsidy equivalent of 50% of the value of production, while the nominal protection is77%. China has a government procurement system that strongly supported the price of rice in the1990s. After accumulating large stocks in the late 1990s, China has reduced the level of support anddisposed of its stocks.
Most of the major rice importers use various measures to limit rice imports. Indonesia, thelargest rice importer, uses a state trading enterprise, BULOG, to support the domestic price, assistedby import tariffs of around 36%. Nigeria maintains an import tariff of 50%. The EU recently
CHAPTER 4: IMPACT OF TRADE LIBERALIZATION

60
switched from a variable levy to an import tariff that varies between 46% and 146%, depending onthe type of rice. To comply with the URAA, Japan and the Republic of Korea no longer ban theimportation of rice, but Japan maintains a tariff rate quota with a prohibitively high out-of-quotatariff, while Korea has a quota of about 200,000 t, a small fraction of consumption (Wailes 2004).
What is the effect of these policies on the world price of rice? Some models project relativelysmall increases in rice prices. For example, Bouet (2006a) and Tokarick (2005) project that fulltrade liberalization would increase world rice prices by only 2-3%. On the other hand, the USDepartment of Agriculture (USDA 2001) estimates that rice prices would rise by about 10%. Wailes(2004) presents the results from two models. A static partial equilibrium model of rice markets thatis highly disaggregated by type of rice projects that full trade liberalization would increase the priceof long grain rice by 2%, on average, and that of medium- and short-grain rice by a full 90%. Theweighted average price increase according to this model is 33%. The second model is lessdisaggregated by type of rice, but includes dynamic effects. According to this model, full tradeliberalization would increase rice prices by 25-35%.
4.1.3 SugarThe market for sugar is one of the most distorted in the world. According to Bouet (2006a), theaverage level of protection for sugar is over 50%, the second highest level among nine majoragricultural product categories after rice. The OECD countries provided about US$5.3 billion insupport to sugar farmers in their countries. Much of this support was provided by the EU, Japanand the United States. In 2002, the United States maintained a tariff rate quota of 1.3 million t,restricting imports enough to make domestic prices twice as high as the international price. Forty-two countries are given quotas to export sugar to the US, but US imports are only a fraction of whatthe US would import without import restrictions. The support given to US sugar cane producerswas US$1.2 billion in 2002.
The EU also maintains a tariff rate quota, with a large (€ 98 per t) in-quota tariff and aprohibitive (€ 339 per t) out-of-quota tariff. The quota of 1.3 million t is reserved for the African,Caribbean and Pacific Group of States, consisting mainly of former European colonies in sub-Saharan Africa, the Caribbean and the Pacific. Annual support for sugar producers (largely sugarbeet growers) in the EU was estimated at US$2.4 sugar policy, reducing the difference between thein-quota tariffs and the out-of-quota tariffs, thus eroding the preferences of the African, Caribbeanand Pacific Group of States (El-Obeid and Beghin 2005).
Japan uses a specific tariff to limit sugar imports and protect its farmers. The support given toJapanese farmers is roughly US$400 million. Many developing countries also have high levels ofprotection for local farmers. China, India, Mexico, the Philippines, Thailand and Turkey all havehigh tariff barriers that protect domestic farmers from import competition. A few countries alsomaintain production quotas or consumer subsidies, but these measures are less common. Egyptand Morocco are two of the few countries that have programmes to subsidize sugar for consumers.
A number of studies have estimated the impact of trade liberalization on the world sugarmarket. The Food and Agricultural Policy Research Institute carried out a study of sugarliberalization using a non-spatial partial equilibrium econometric model of the world sugar marketwith 29 countries and regions (El-Obeid and Beghin 2005). According to this model, the removalof all trade restrictions (including tariffs, tariff rate quotas and state trading) would increase theworld price of sugar by 27% at the end of the nine-year simulation period. When the removal ofall production support is included, the world price rises 48% compared to the base scenario. TheEU is changed from a net exporter to a net importer of sugar, while Brazil, Cuba and (to a lesserdegree) Australia expand net exports.
These sugar price increases are fairly typical of the results from other partial equilibriummodels. On the other hand, the results from CGE models tend to indicate that trade liberalizationhas smaller effects on world sugar prices. For example, Bouet (2006a) simulates the impact of fullglobal trade liberalization by using the MIRAGE CGE model, which represents 20 countries andregions of the world, including 14 developing countries and regions. In this simulation, tradeliberalization causes sugar prices to rise by only 2%.

61
4.1.4 Cotton21
Cotton prices slid from a peak in 1995 until 2001, but they have partially rebounded since then.The long-term trend is affected by competition with synthetic fibres, which increased their share ofthe textile fibre market from 48% in 1995 to 55% in 1999. In addition, the global recession of2001-02 depressed cotton prices further because textile demand is more income elastic than is thedemand for grains.
In addition to stagnant demand, cotton prices have been pushed down by increasedgovernment support for cotton growers. The International Cotton Advisory Committee estimatesthat worldwide direct assistance to cotton growers was US$4.9 billion in 2001/02. Of this amount,the United States accounted for US$2.3 billion, equivalent to US$0.24 per lb of cotton produced.Other sources, using a broader definition of assistance, estimate that the US Government providesUS$3.9 billion to the cotton sector (Oxfam 2002). US cotton policy consists of variousprogrammes, including two (the marketing loan programme and loan deficiency payments) thatensure that farmers receive at least US$0.52 per lb. This has the effect of insulating US farmers fromfalling world prices. In 2001, in spite of low world prices, the United States posted record cottonproduction and near-record export volumes.
The 2002 Farm Bill introduced target prices for the major commodities and programmes thateffectively pay farmers most of the difference between market prices and the target price. For uplandcotton, the target price is US$0.72 per lb. In addition, by allowing farmers to update their “baseacreage”, the new policy provides incentives for farmers to expand production.
China is the second largest provider of subsidies to local cotton growers. Until recently, itmaintained a reference price about 20% above the international price at a cost of US$1.2 billion,or US$0.10 per lb. To reduce cotton stocks, which reached 120% of consumption in 1998, Chinabegan to subsidize exports and effectively banned imports.
The EU spends US$700 million to provide generous support (over US$0.50 per lb) to smallnumbers of cotton growers in Greece and Spain, while India spends US$500 million on cottonsubsidies. Other cotton producers, such as Benin, Brazil, Egypt, Mali and Turkey, also providesubsidies to farmers, totaling US$211 million (4% of the world total), but the per-unit values aregenerally less than US$0.10 per lb (ICAC 2002).
Several recent studies have attempted to assess the impact of these subsidies on world prices.The Centre for International Economics, in Canberra, uses a five-region world model of fibre,textile and garment markets in 2000-01 to simulate the impact of US and European subsidies oncotton production and exports. They find that removing US and European subsidies to cottongrowers would raise the world cotton price by 11%. Removing import restrictions on textiles andclothing would independently raise cotton prices by 2% (CIE 2001). Another study, carried out bythe International Cotton Advisory Committee (ICAC 2002), estimates that the impact of removingUS cotton subsidies would have increased the world price by 20% in 2001/02. Removing all cottonsubsidies worldwide would have raised the world price by over 50%. Finally, a study by Sumner(2003) carried out the most up-to-date and perhaps the most detailed simulation of the impact ofUS cotton subsidies. His model incorporates 11 commodities and 24 regions of the world, and itsimulates the effects of six programmes that support US cotton producers. He estimates that, overthe marketing years 1999-2002, US subsidies depressed the world cotton price by 12.6%.
4.1.5 Dairy productsDairy products are not, in general, widely traded: only 7% of global demand is met throughinternational trade. Virtually all the trade in dairy products involves butter, cheese and dried milk.Australia, the EU and New Zealand are the dominant exporters of dairy products, while Canada,Japan and the United States are net importers of dairy products.
CHAPTER 4: IMPACT OF TRADE LIBERALIZATION
21/ This section borrows from Minot and Daniels (2005).

62
Dairy markets are highly protected through a combination of import restrictions (such as tariffand tariff rate quotas), consumer subsidies and, in the case of a few developed countries, income andprice supports, export subsidies and milk production quotas to limit supply. Average bound tariffs fordairy remain among the highest for all agricultural commodities (Blayney and Gehlhar 2005). TheOECD countries average support for the milk sector, as measured through producer supportestimates, amounted to 42% of the value of production in 2002-04, representing US$40 billion inincome transfers to producers. The protection rates presented in Table 12 of the MAcMap datasetshows estimates of applied average rates of 43% for the EU and 19% for the US. Support for dairyproducers makes up a large share of the aggregate domestic support in some countries: 84% inCanada, 55% in the United States and 12% in the EU. Although export subsidies under theAgreement on Agriculture were reduced, a third to a half of cheese, butter and dry milk exportscontinue to be subsidized (Langley, Somwaru and Normile 2006).
The EU dairy programme consists of a production quota for milk, import protection, anintervention programme that supports the price of skim milk powder and butter, and exportrefunds that are used to market surplus dairy products. In addition to the intervention programme,the EU subsidizes consumption of the butter used in pastry and ice cream and of skim milk for calffeed (Bailey 2005). The combination of border and domestic policies has resulted in a producersupport estimate of 51% (Turner 2005).
Japan maintains a complex network of policies that provide high protection for domestic milkproduction, including supply quotas, environmental subsidies, and a variety of programmes thatsupport farm and market infrastructure, extension services, and milk consumption, that benefitproducers of drinking milk, as well as manufacturing milk. The producer support estimate in 2003for milk represented 77% of the value of production, an indication that more than two thirds ofthe value of Japanese milk production relies on government interventions either through barriersto imports or through subsidies to farmers (Obara, Dyck and Stout 2005).
The US created the Milk Income Loss Contract Programme to provide targeted countercyclicalpayments to small dairy farms. In addition, the United States uses foreign donation programmesand casein production subsidies to reduce excessive stocks of surplus skim milk powder (Bailey2005). The producer support estimate for the US dairy sector is 45%, significantly lower than theestimate for Japan and somewhat lower than the estimate for the EU (Turner 2005).
Canada’s dairy policy is a complex web of interrelated policies, programmes and people nestedin a number of private and public institutions under the federal-provincial supply managementmarketing scheme; it results in a producer support estimate of around 60% (Stanbury 2002).
Results from global trade models have shown that trade liberalization causes shifts inproduction from more distorting countries such as the EU, Japan and the United States to moreefficient countries such as Argentina, Australia, Brazil and New Zealand (Shaw and Love 2001;OECD 2005a). A recent study used a partial equilibrium, multiple-commodity, multiple-regionmodel of agricultural trade to simulate the elimination of four policy instruments: (i) productionquotas, tariffs and tariff rate quotas; (ii) domestic price support and producer payments; (iii)export subsidies; and (iv) consumer subsidies. According to this model, full trade liberalizationin the dairy sector results in a lower volume of dairy products, but higher world prices. The priceincreases range from 13% for nonfat dry milk to 66% for butter. Australia and New Zealand gainthe most from liberalization because of higher prices and larger exports (Langley, Somwaru andNormile 2006).
4.1.6 Effect of higher agricultural prices on NENA countriesThe description of the effects of global trade liberalization on agricultural prices in the previoussections indicates that the agricultural prices of the most distorted commodities will rise between2% and 20%, with a fair amount of variation across estimates depending on the commodity, thetype of model (general equilibrium versus partial equilibrium), the type of liberalizationsimulated and the assumptions built into the model. In this section, we examine the possibleeffect of higher agricultural prices on the NENA countries. More specifically, we calculate thewelfare cost of a 15% increase in agricultural prices on each NENA country for which data are

63
available. This is done by multiplying the value of net agricultural imports of each NENA countryby 0.15 and expressing the result both in absolute value and as a percentage of GDP. This calculationyields the additional cost to the country to maintain its current pattern of production andconsumption. These estimates should be considered an upper limit of the impact of higheragricultural prices for several reasons, as follows:
• The analysis does not take into consideration the fact that farmers and consumers wouldrespond to the higher price by producing more and consuming less of these products, thusreducing the negative welfare impact (or increasing the positive welfare impact) of thehigher price.
• The analysis assumes a 15% increase in agricultural prices, but most studies show smallerincreases in the prices of the main commodities such as wheat, rice, cotton, sugar and dairy.
• The markets for the main agricultural commodities are more heavily protected than thosefor minor crops; so, the weighted average of the change in all agricultural prices as a resultof trade liberalization is likely to be even lower.
Furthermore, the analysis examines the terms-of-trade costs associated with trade liberalizationoutside the NENA region without taking into account the efficiency gains that may occur fromdomestic trade liberalization.
The analysis, shown in Table 4-1, indicates that the Sudan and Turkey are the only NENA13countries that are net exporters of agricultural goods in value terms (Somalia and the West Bankand Gaza are not included in the analysis because of a lack of data). Net imports by the othercountries range from US$199 million in Syria, which imposes high barriers to agricultural imports,to US$3 billion in Algeria, which has little agricultural production and pays for imports with its oilrevenue. Egypt and Lebanon also have net agricultural imports of more than US$1 billion. As apercentage of GDP, net agricultural imports are highest in Djibouti, where net agricultural importsare worth more than one quarter of GDP, followed by Yemen, where net agricultural imports are8% of GDP. For Algeria, Jordan and Lebanon, the ratio is between 4% and 6%, while the othercountries have ratios below 3%.
The last two columns of Table 4-1 show the cost of a uniform 15% increase in agriculturalprices. The dollar cost ranges from a US$451 million cost for Algeria to a US$98 million gain forTurkey. Relative to the size of the economy, Djibouti experiences the largest loss, 4% of GDP,followed by Yemen, 1.2% of GDP. Turkey and the Sudan, because they are net agriculturalexporters, gain from the higher prices, but the benefits are less than 0.05% of GDP. The othercountries lose between 0.1% (Syria) and 0.9% (Jordan).
CHAPTER 4: IMPACT OF TRADE LIBERALIZATION
TABLE 4-1Impact of higher agricultural prices on NENA countries
GDP Agricultural Agricultural Net Net Cost of a 15% increase in imports exports agricultural agricultural agricultural prices
imports imports
(US$ million) (% of GDP) (US$ million) (% of GDP)
Algeria 66 530 3 062 55 3 007 4.5% 451 0.7Djibouti 625 180 11 169 27.0% 25 4.0Egypt 82 427 2 741 938 1 803 2.2% 270 0.3Jordan 9 860 1 020 440 579 5.9% 87 0.9Lebanon 19 000 1 285 239 1 046 5.5% 157 0.8Morocco 43 727 1 671 981 690 1.6% 104 0.2Sudan 17 793 396 438 (42) -0.2% (6) 0.0Syria 21 499 1 050 851 199 0.9% 30 0.1Tunisia 25 037 976 470 506 2.0% 76 0.3Turkey 240 376 4 179 4 831 (652) -0.3% (98) 0.0Yemen 10 831 1 004 117 887 8.2% 133 1.2
Total or average 537 705 17 563 9 370 8 192 1.5% 1 229 0.2
Sources: World Bank (2005a) for GDP; FAO (2005b) for agricultural imports and exports.

64
4.2 Effects of trade liberalization on NENA13 countriesNumerous studies of the impact of trade liberalization have been carried out, usually using CGEmodels. CGE models have become a standard tool of empirical economic analysis, especially whenmeasuring the economy-wide effects of policy changes. Some versions of these models are able toidentify the winners and losers of policy reform (Devarajan and Robinson 2002). Although mostCGE analyses show aggregate benefits from trade liberalization, the size and sectoral details ofthese results vary widely. These differences in results arise from differences in the models and thepolicies being simulated. As discussed by Bouet (2006a), a number of factors explain much of thevariation, as follows:
• The geographic scope of the liberalization. The liberalization may be multilateral (globalreforms in the context of WTO negotiations), regional, bilateral (between two countries), orunilateral (reforms carried out by a single country in isolation).
• The sectoral scope of the liberalization. The liberalization may be limited to the agriculturalor industrial sector, or it may encompass all sectors.
• The type of liberalization. The study may simulate reductions in tariffs, cuts in exportsubsidies, lower domestic price supports, reduced input subsidies, or other reforms.
• The base year. Generally, the earlier the base year, the higher the base level of protection anddomestic support, implying that the effects of full liberalization will be larger.
• The extent of reform. Some studies simulate partial liberalization that corresponds to thepossible outcomes of trade negotiations, while others simulate full trade liberalization.
• Whether or not the model includes dynamic effects. Some models only count the one-timestatic impact, while other models attempt to capture the dynamic effects of tradeliberalization on investment and economic growth. Models that include dynamic gainsusually show much larger effects.
• The assumptions in the model. All trade models are based on a large number ofassumptions about the economy, including the operation of labour markets, investment,the trade balance and the degree of factor mobility, all of which may affect the results.
As discussed earlier, global trade liberalization generally results in higher international prices forgoods subject to protectionist policies and subsidies. This is because the elimination of importtariffs increases import demand, while the elimination of domestic subsidies reduces supply.Because agricultural products are subject to higher rates of protection and (in developed countries)large domestic support programmes, trade liberalization is expected to increase world agriculturalprices. This is particularly true for the products for which the markets are more distorted, such aswheat, rice, sugar, cotton and dairy products. Higher agricultural prices may worsen the terms oftrade of net importers of agricultural products (most NENA13 countries), while benefiting netexporters of agricultural products (Turkey).
The effect of trade liberalization on domestic producer prices depends on changes ininternational prices, as well as changes in the level of agricultural protection within a country. Ascountries dismantle agricultural trade barriers, imports of formerly protected commodities willexpand, pushing down domestic agricultural prices. Thus, multilateral and unilateral tradeliberalization generally has opposite effects on domestic agricultural prices.
How do changes in agricultural prices affect household income and poverty? The short-runeffect on households will largely depend on the direction of change in agricultural prices andwages, on the structure of household incomes and on the composition of household spending. Inthe long run, factors of production are mobile; so, the effect on households depends on changesin factor prices (e.g., wages and returns on land) and household factor endowments. Economictheory suggests that removing large distortions in the economy will increase aggregate output, butit does not tell us how farm income or poverty will be affected. These issues can only be addressedthrough empirical research, including simulations using trade models.

65
In the following subsections, we provide a selective review of studies of the impact of tradeliberalization on the NENA13 countries individually and on the region. No studies cover all 13 ofthe countries under consideration here, but some studies examine the impact of trade liberalizationon the MENA region.22
4.2.1 Global trade liberalizationBouet (2006a) compares 17 studies of global trade liberalization, including studies produced bythe US Department of Agriculture, the World Bank and individual researchers. They show that theestimates of the aggregate benefits of full global trade liberalization range from US$80 billion toUS$1.2 trillion, representing between 0.3% and 3% of world GDP. In spite of these differences,there are some common findings across these studies, as follows:
• Full trade liberalization is beneficial in terms of global income, as well as for all or most ofthe regions.
• Most of the benefits of full trade liberalization come from liberalizing the agricultural sectorprecisely because it tends to be the most well protected.
• A large majority of the benefits of trade liberalization come from reducing tariffs and otherimport barriers rather than from reducing producer subsidies. This is not surprising giventhat import barriers are almost universal across countries, while producer subsidies areconcentrated in a few (albeit large) economies: the EU, Japan and the United States.
• The benefits to developing countries are larger as a percentage of the incomes of thesecountries than are the corresponding benefits to developed countries.
• The benefits to each country or region derive largely from liberalization carried out withinthe country or region rather than from opening up the borders of trading partners. In otherwords, “what you get is what you do”.
Most of these studies are based on models that include 12 to 40 countries and regions; so, thereare usually results for a region that corresponds roughly to the MENA region. In 16 of the 17studies reviewed, the MENA region gains from global trade liberalization in spite of the terms-of-trade losses associated with status as net food importers.
Bouet, Mevel and Orden (2006) simulate the effects of global trade liberalization using theMIRAGE model, which covers 41 regions and 18 sectors. This model makes use of the MAcMapdatabase of import barriers, which is unusual in that it captures the effect of preferential agreementson bilateral tariffs rates. Three NENA13 countries (Morocco, Tunisia and Turkey) are included asseparate countries; three NENA13 countries (Djibouti, Somalia and the Sudan) are grouped in therest of sub-Saharan Africa; and the seven remaining NENA13 countries are included in the rest ofMENA. The sectoral decomposition includes activities that are of particular importance to NENA13countries because of their relation to staple foods or because they represent sources of foreignexchange earnings, namely, wheat, rice, sugar, meat, dairy products and cotton. Also, textiles andwearing apparel are specified as activities separate from the rest of manufacturing. These are alsohighly protected commodities. Although household decomposition is limited, the distinctionbetween skilled and unskilled labour as factors of production can give some insight to the possibleeffects on poverty.
Using the MIRAGE CGE model of the global economy, the authors compare the ambitious andunambitious partial liberalization scenarios to a full trade liberalization scenario.23 In theexperiments, average tariffs are eliminated incrementally over a five-year period starting in 2006. Themodel is dynamic and is run over a 15-year period from 2005 to 2020, taking into account GDPexpectations affecting factor productivity and capital reallocations resulting from depreciation andinvestment. The 2001 social accounting matrix (SAM) used as a database for the MIRAGE CGE model
CHAPTER 4: IMPACT OF TRADE LIBERALIZATION
22/ The MENA region, as defined by the World Bank, includes ten of the NENA13 countries: Algeria, Djibouti, Egypt, Jordan,Lebanon, Morocco, Syria, Tunisia, West Bank and Gaza, and Yemen. Three countries are in NENA13, but not in MENA: Somalia,the Sudan and Turkey. Ten countries are considered part of MENA, but not part of our NENA13 group: Bahrain, Iran, Israel, Kuwait,Libya, Malta, Oman, Qatar, Saudi Arabia and United Arab Emirates.
23/ Both partial liberalization scenarios call for the elimination of export subsidies; the ambitious scenario also includes a 20% cut indomestic supports, sharper reductions in agricultural tariffs, caps on agricultural tariffs and fewer exemptions (sensitive and specialproducts). A detailed presentation of the model and the corresponding assumptions is included in Bouet, Mevel and Orden (2006).

66
has been updated to include the main trade reforms that affected the world economy from 2001 to2005: the enlargement of the EU, the WTO accession of China, the end of the implementation of theUruguay Round and the implementation of the Everything But Arms Initiative and the US AfricanGrowth and Opportunity Act schemes.
Full liberalization leads to improved terms of trade for net agricultural exporters such asTurkey, to worsened terms of trade for net food-importing countries due to higher agriculturalprices, and to the erosion of preferences for some countries. Turkey experiences a 5.2% real incomeincrease, mainly as a result of higher returns to labour (both skilled and unskilled) and capital atthe expense of land and natural resources. Tunisia registers a real income gain of 1.6% in spite oflosses in the agricultural sector borne by the poor (whose main source of income, unskilled labour,has been negatively affected) and landowners. Morocco experiences a decline in real income by0.1% reflected across all productive factors, especially unskilled labour, implying a negative impacton poverty (Bouet, Mevel and Orden 2006, Tables 4 and 5).
Full trade liberalization implies larger increases in world agricultural prices and the completeerosion of preferences compared to ambitious partial liberalization. Current beneficiaries of tradepreferences among developed countries, as is the case for NENA13 countries, and agricultural netimporters may incur less gain in efficiency, but also smaller losses in the terms of trade underpartial liberalization than under full trade liberalization. For a net agricultural exporter like Turkey,better market access will unambiguously generate more gains.
Tokarick (2005) uses a partial equilibrium model of ten agricultural commodities to simulatethe effect of trade liberalization. In this model, full trade liberalization raises world agriculturalprices by 2-23%. By applying these price increases to agricultural trade patterns, he estimates theincrease in agricultural import costs for each developing country. The cost of agricultural importsincreases US$4 million-US$10 million for most NENA13 countries. The exceptions are Djibouti andthe Sudan, for which agricultural import costs decline because of higher prices for their exports.
Tokarick (2005) also presents the results of a separate analysis of trade liberalization using an 18-region global CGE model. He compares the effects of trade liberalization in developed countries, indeveloping countries and in all countries. The results suggest that MENA would lose US$1.9 billion(0.3% of GDP) from developed country trade liberalization. The higher agricultural prices hurt theregion because it is a net importer of agricultural goods, and there are no offsetting efficiency gainsfrom domestic trade liberalization. If trade liberalization is limited to the developing countries, theMENA region gains US$10.4 billion (1.4% of GDP), largely because it removes internal distortions.Global trade liberalization generates benefits of US$9 billion for the region (1.2% of GDP).
A study by Anderson (2003) confirms some of these general findings. He uses an 18-regionCGE model to simulate trade liberalization by developing and developed countries and indifferent sectors. According to this model, the global benefits of trade liberalization would beUS$254 billion, 65% of which comes from liberalizing the agricultural sector. The distribution ofgains between developed and developing countries depends on which countries liberalize. Ifdeveloped countries liberalize, they capture more than two thirds of the benefits, while if developingcountries are the ones that liberalize, they earn about 60% of the global benefits. These resultsconfirm the principle that the benefits a country or region derives from trade liberalization arelargely determined by the degree to which it participates in the trade liberalization. Looking at theregional results, this study finds that Turkey gains US$2 billion from global trade liberalization,while the MENA region loses US$1.8 billion. As mentioned above, this finding is relativelyuncommon; most studies find that the MENA region gains from trade liberalization. This isbecause the efficiency effect of reducing domestic distortions outweighs the terms-of-trade effectfrom higher world prices for agricultural commodities.
What is the impact of trade liberalization on small farmers and agricultural labourers? Tradetheory suggests that, under certain conditions, trade liberalization should equalize the return tolabour across countries because exports of labour-intensive goods from low-wage economies to high-wage economies increase wages in the former and reduce wages in the latter. In practice, the impactof liberalization is more complicated because of variations in protection across sectors, preferentialagreements and the imperfect mobility of factors. In particular, if trade liberalization reducesprotection on a labour-intensive sector such as agriculture, agricultural labour demand could decline.

67
Few of the global trade models are designed to simulate the impact of liberalization on differenttypes of households, but some of them disaggregate the labour market into skilled and unskilledcategories or rural and urban labour. Bouet (2006a) uses the MIRAGE model, which distinguishesthree categories of labour. Among the 20 regions it represents are Tunisia and the rest of MENA. InTunisia, full trade liberalization causes agricultural unskilled wages and industrial unskilled wages torise 1.0%, while skilled labour wages rise only 0.3%. In the rest of MENA, unskilled agriculturalwages fall 2.3%, while industrial unskilled wages and skilled wages rise about 1%.
Anderson, Martin and Van der Mensbrugghe (2005) simulate the impact of globalmerchandise trade liberalization using a dynamic recursive CGE model with labour types and 28regions, including Turkey and MENA. In Turkey, unskilled wages rise 1.3%, while, in MENA,unskilled wages increase 4.1%.
Bayar et al. (2000) simulates global trade liberalization using a CGE model with eight regions(including MENA) and two types of labour. Trade liberalization in manufactured goods induces a1.3% increase in wages for unskilled labour in MENA, while a broader all-sector trade liberalizationincreases unskilled wage rates by 1.4%. Thus, while there is some variation in the estimates, moststudies suggest that global trade liberalization would increase unskilled wage rates in MENA by 1.4%.
4.2.2 Regional trade liberalizationBouet (2006b) uses the same MIRAGE CGE model to examine the macroeconomic impact thatwould result from a South-South regional agreement that eliminates all tariff barriers amongMorocco, Tunisia, Turkey and a fourth zone comprising six other NENA countries (Algeria, Egypt,Jordan, Lebanon, Libya and Syria). Each country retains its trade policy with regard to other zonesor countries.
The main beneficiary from a South-South liberalization scenario is Turkey, where welfare rises3.8%. The sectoral results suggest that Turkey gains from the expanding production of grain, animalproducts and clothing, including exports to the rest of the region. Tunisia and the other southernMediterranean zone also gain, but to a lesser degree (1-2%). Morocco experiences a small (0.3%)welfare decline. In the case of Morocco, 77% of exports are directed to OECD countries, and only4.9% are directed towards southern Mediterranean countries (compared to 10% for Tunisia and 11%for Turkey); so, a South-South agreement would leave Moroccan exports practically untouched. Butthe agreement implies trade diversion for Morocco: imports of rice, wheat, fruit and vegetables, andmeat from Europe are partially replaced by imports from countries in the region.
Bouet (2006b) compares the impact of this South-South agreement with that of global tradeliberalization. In this simulation, welfare increases 2.4% in Turkey and more than 5% in Morocco,Tunisia and the other southern Mediterranean zone. These results reveal that multilateral fulltrade liberalization is a more efficient outcome for south Mediterranean countries. It allows for alarge reduction in domestic distortions and stimulates GDP growth, especially in Morocco,Tunisia and the other southern Mediterranean zone. The efficiency gains offset the deteriorationin the terms of trade linked to an augmentation of world agricultural prices, which is detrimentalto most of these countries.
Some argue that a regional trade agreement is a desirable step towards multilateralliberalization, preparing the countries for international competition, but in a less “brutal” mannerthan multilateral trade liberalization. Bouet (2006b) tests the validity of this argument using anindex of structural congruence that measures the similarity of sectoral changes between twosimulations. Numbers close to 1.0 indicate that two policies change production patterns in similarways, while an index of zero implies no similarity. Results show that the South-South agreementdoes not move the economies towards the multilateral trade liberalization structure. For somesectors, it changes the economies in the opposite direction. The index is much higher (closer to 1)in a comparison of an EU FTA and multilateral trade liberalization. The implication is thatintegration with the EU is a better “first step” towards integration into the global economy.
Dennis (2006a) uses a CGE model with 13 regions and 16 commodities to compare regionalintegration, based on GAFTA, with a combination of GAFTA and EU liberalization. The MENAregion includes Morocco, Tunisia, the rest of North Africa and the rest of the Middle East. In theGAFTA simulation, all tariffs between the four MENA zones are set to zero. In the GAFTA-EU
CHAPTER 4: IMPACT OF TRADE LIBERALIZATION

68
simulation, all tariffs between MENA zones are set to zero; all industrial tariffs between MENAzones and the EU are set to zero; and all agricultural tariffs between MENA zones and the EU arereduced by 50%. The results indicate that GAFTA would produce static welfare gains to MENA ofUS$913 million, or 0.1% of regional GDP. The gains to MENA under GAFTA-EU are roughly twiceas large, at US$1.8 billion, or 0.2% of regional GDP.
Dennis (2006a) also argues that intra-MENA trade is hampered by burdensome customsprocedures, poor infrastructure and regulations that impede efficient transportation services.Examples include regulations favouring national airlines, restrictions on private transportationcompanies, restrictions on foreign truck drivers, regulations prohibiting backhaul freight, andvarious fees and taxes. He cites studies that have shown that the removal of non-trade barriersimposing frictional costs on international trade can greatly enhance the welfare gains from tradeliberalization. For example, Hoekman and Konan (2005) estimate that the removal of non-tariffbarriers leads to an increase in welfare that is more than twice as large as that resulting from tariffliberalization. In an earlier study on Egypt, Konan and Maskus (1997) found that the eliminationof regulatory barriers and red-tape measures would result in larger welfare gains from an FTA.Dennis (2006a) simulates the effect of trade facilitation on the GAFTA and EU-GAFTA agreements,finding that the welfare benefits increase four- or fivefold when trade facilitation is included.
The effect of regional trade liberalization on the wage rates of unskilled labour is examined ina few studies. As mentioned above, Bouet (2006b) simulates the effect of trade liberalizationamong Morocco, Tunisia, Turkey and another region, including Algeria, Egypt, Jordan, Libya,Lebanon and Syria. In this South-South liberalization scenario, unskilled wage rates increase by 2%in Turkey, but decrease slightly (by less than 1%) in the other three zones. In another study,Hoekman and Konan (2005) find that GAFTA increases wage rates in Egypt by 0.7%, considerablyless than the wage rate increase associated with an EU partnership agreement (1.3%) and fromglobal liberalization (1.98%).
4.2.3 Bilateral trade liberalization with the EU and the USAugier and Gasiorek (2001) review studies that have used CGE models to estimate the welfare effectsof trade liberalization in the context of EMAAs. Studies on Turkey show very small welfare effects,ranging from 0.15% of GDP with a reduction in tariffs alone to between 1-1.5% of GDP when allowingfor improved access to EU markets, exchange rate changes and the harmonization of standards(Harrison, Rutherford and Tarr 1993, 1997). Mercenier and Yeldan (1997) find that forming acustom union with the EU results in welfare gains of only 1% of GDP for the Turkish economy.
Similar results are found for Egypt by Konan and Maskus (1997, 2000), with welfare gainsranging from 0.2 and 0.89% of GDP, and for Morocco and Tunisia by Cockburn, Decaluwé andCosti (1998). But, as in the case of Turkey, when tariff reduction in Egypt is extended to agricultureand services and accompanied by changes such as market access and improved harmonization ofstandards, the welfare gains increase to 13 to 21% of GDP (Hoekman and Konan 1998). Theselarge effects are due to the inclusion of dynamic effects, in which trade liberalization increasesinvestment or productivity growth.
From their review, Augier and Gasiorek (2001) conclude that, in most of these studies, staticwelfare gains from FTAs between southern Mediterranean countries and the EU are usually verysmall. One reason is that these agreements result in a large asymmetric reduction in tariffs on thepart of the southern Mediterranean countries that grant the EU better access to their markets, whilethe southern Mediterranean countries already have access to the EU. In contrast, Augier andGasiorek (2001) generate much larger results using a CGE model to simulate a full elimination oftariffs by southern Mediterranean economies on imports from the EU (leaving external tariffs onimports from the rest of the world unchanged, with the exception of Turkey, which adopts the EU’scommon external tariffs). They find that Egypt, Morocco and Tunisia experience welfare gains of6%, 13% and 18%, respectively. In all three countries, the trade creation effects are much largerthan the trade diversion effects. The cheaper and more abundant imports generate these gains,though all sectors in the economies experience a decline in production.
If other changes are realized, such as improved productivity through the pro-competitive effectof trade and greater integration with the EU markets resulting from a harmonization of standards

69
and regulations, the welfare effects reach 18%, 24% and 33% for Egypt, Morocco and Tunisia,respectively. Allowing changes in the exchange rate seems to reduce the welfare gains for Moroccoand Tunisia, but to improve the gains for Egypt. Finally, multilateral trade liberalization generatesthe largest results, while regional (intra-southern Mediterranean) trade liberalization generatespositive, but small welfare gains.
Chemingui and Dessus (2001) examine the impact of trade liberalization on Tunisia and theEU using a model of the Tunisian economy with 57 sectors and five types of labour. They findthat liberalization yields a 1% increase in real GDP, but family agricultural remuneration falls by1%, and unskilled agricultural wages fall by 3%. On the other hand, access to EU marketswithout any reduction in Tunisian import barriers results in higher returns to farm families andagricultural workers.
Chaherli (2002) conducted an extensive review of 17 studies of trade liberalization in the MENAregion that were carried out between 1997 and 2001. The size of the impact (measured by welfaregains as a share of GDP) tends to be higher from multilateral trade liberalization scenarios thanfrom bilateral scenarios (mostly illustrated by the implementation of FTAs between MENA countriesand the EU). Consistent with the results found in Augier and Gasiorek (2001), other studiesemphasize the superiority of multilateral trade liberalization over bilateral or regional liberalization.Thus, Egypt registers welfare gains of 4% of GDP from multilateral trade liberalization, while theimplementation of the FTA with the EU only adds less than 0.5% (Bayar 2001). Similar results arefound for Jordan (Hosoe 2001) and Morocco (Rutherford, Rutström and Tarr 1997).
Only a few studies reviewed by Chaherli (2002) focus on specific commodity changes inproduction. As a result of lower tariffs in agriculture, the production of import-substitutingproducts such as field crops and livestock will tend to suffer, while export-oriented sectors like fruitsand vegetables will gain from the increase in market access. For example, Lorca and Vicens (2000)estimates that expanding the FTAs with the EU to agricultural products may stimulate an increasein exports of 53% in fruits and 20% in vegetables in Morocco, a 28% increase in fruits andvegetables in Egypt and an 80% increase in olive oil exports in Tunisia. In Egypt and Morocco,sugar is another winner in that production increases by 16 and 13%, respectively, under the sameliberalization scenario.
These findings are supported by Bunte (2005), who simulates the effect of the elimination bythe EU of import tariffs on fruits and vegetables from the MENA region. This model projects asubstantial increase in exports of fruits and vegetables from MENA to the EU, along with lowerconsumer prices in the EU. Morocco and Turkey gain the most, while European horticulturalproducers such as France and Spain lose.
Finally, Radwan and Reiffers (2003) present results from agricultural trade liberalizationscenarios in the context of the EMAAs. The simulations focus on five NENA countries: Algeria,Egypt, Morocco, Tunisia and Turkey. Within a CGE framework, the authors consider threealternative scenarios simulated over a five year period, as follows:
• unilateral liberalization by the EU;• a reciprocal bilateral liberalization between the EU and partner countries (with or without
progress in multilateral liberalization in agriculture); and• an asymmetrical bilateral liberalization, whereby the EU liberalizes, but the Mediterranean
partner countries do not liberalize on all products and liberalize at a slower pace.
Results from the first scenario (unilateral liberalization by the EU) show positive, but modestgrowth in production, exports and employment, though this is inferior to the growth obtainedthrough multilateral liberalization. Only exportable products (essentially fruits and vegetables)gain from this scenario, but, for poor farmers and traditional agriculture, the situation does notchange and may even become worse now that they have to compete for resources and subsidies(such as water) with favoured exports.
The second scenario tests the effects of a reciprocal bilateral liberalization between the EU andMediterranean partner countries with and without agriculture liberalization in a multilateralcontext. Domestic trade liberalization reduces the local prices for formerly protected agriculturalcommodities. On the other hand, the multilateral liberalization of agricultural either under the
CHAPTER 4: IMPACT OF TRADE LIBERALIZATION

70
European Commission or the US proposal24 would result in higher international prices: forexample, a 10.5% increase for wheat, 19.7% for maize and nearly 7% for sugar.25 The net effect isa decrease in domestic prices, but by a smaller magnitude than would occur without themultilateral liberalization of agriculture. The results are particularly large for processed foodpreparations containing fruits; these sustain a price decrease of more than 40%, while the prices ofsugar fall by 14% and of wheat by nearly 7% (Radwan and Reiffers 2003, p. 20). The net effect ofthis scenario suggests that tariff dismantling by Mediterranean partner countries has a larger effectthan the removal of protection by OECD countries. The negative effects from a net price decreaseon rural producers and therefore rural income will be greater than the positive effects on urbanconsumers and exporters, making the distribution of gains from liberalization bias against themore vulnerable population group. Radwan and Reiffers (2003) conclude that the liberalizationshould be reciprocal but gradual, starting with the reduction of domestic support by the EU,followed by tariff reduction by Mediterranean partner countries.
The third scenario reproduces the second scenario, but, by taking into account the varyingcapacities to bear the changes among countries in the region, it introduces an asymmetricalimplementation process, whereby the EU liberalizes, while Mediterranean partner countriesliberalize partially and at a slower rate. It also provides for structural instruments similar to theFonds Europèens d’Orientation et de Garantie Agricole,26 a programme that removes pricesupports, includes support for agricultural modernization, upgrades infrastructure and institutionsand supports diversification in rural activities. If the implementation of these structural tools issuccessful, it could reduce (if not eliminate) the list of losers in Mediterranean partner countries.The main difficulties will be to avoid rent-seeking behaviour among farmers in Mediterraneanpartner countries and to target the support towards the sectors in rural areas that have been themost affected by the liberalization process.
4.2.4 Unilateral trade liberalizationOther studies focus on the impact of unilateral trade liberalization, whereby a NENA countryreduces import tariffs or non-tariff barriers without liberalization in other countries. Because theyfocus on one country, many of these studies provide more information on the distributional effectsof liberalization. Some of the studies have found that, contrary to the positive effects registered atthe national level, the agriculture sector tends to be affected negatively. For example, Cheminguiand Thabet (2001) find that rural households in Tunisia lose more than 3% of their income underunilateral liberalization covering agriculture. In contrast, Hosoe (2001) estimates that agriculturaloutput will go up by 1.5% under multilateral trade liberalization and 6% within an EU FTA, whileagricultural exports increase by 11 and 37% under the two scenarios, respectively.
Another study on Tunisia finds that unilateral liberalization would reduce the unskilledagricultural wage by 4%. In contrast, as mentioned in the previous section, improved access to theEU market or a reduction in EU support for its agriculture would raise the wage of unskilledagricultural labour in Tunisia (see Chemingui and Dessus 2001).
Feraboli (2004) uses a dynamic CGE model of Jordan with ten sectors to examine the effect ofalternative types of liberalization. He finds that the tariff reduction under an association agreementwith the EU would increase wages by 1.1%, while a broader trade liberalization that lowers importbarriers in a non-discriminatory way would increase wages 1.2%.
Several studies have examined unilateral trade liberalization in Morocco. Lofgren (1999)analyses the short-run equilibrium effects of alternative scenarios of reduced protection foragriculture and industry in Morocco. Because the agriculture sector represents the major incomesource among the poor rural population, it is also the most strongly protected. The results show
24/ These proposals are older than the ones referenced in Bouet, Mevel and Orden (2006): The EU proposed to decrease importtariffs by 36%, exports subsidies by 45% and trade distorting domestic support by 55%; the US proposed to reduce, in five years,the protection affecting trade to 5% of the total value of domestic production.
25/ The US proposal gives slightly higher results.
26/ The Fonds Europèens d’Orientation et de Garantie Agricole (European Agricultural Guidance and Guarantee Funds) have beenestablished within the overall EU budget for financing the common agricultural policy.

71
that lowering agricultural protection generates aggregate welfare gains, though a significant part ofthe disadvantaged rural population would lose out substantially. The tariff cut boosts agriculturalimports and reduces the demand, prices and factor returns in domestic agriculture. The welfarechanges for any household group primarily depend on the combined effects of changes in theprices of factors the group controls and the commodities it consumes. The incomes and resourcesof agricultural labour decline significantly, especially in rainfed areas since these depend mostheavily on livestock production, which is the most well protected sector initially. Agricultural wagesdecline 14% if agricultural labour cannot switch to non-agricultural activities. If we assume thatlabour can move among sectors, then agricultural wages decline only 6%. Upgrading the skill levelof the rural labour force – assuming some productivity increase – results in higher unskilled wagerates, thus benefiting the poor.
Lofgren, El-Said and Robinson (1999) use a dynamically recursive general equilibrium modelfor Morocco to examine options for unilateral trade liberalization that would go beyond the termsof the EMAA. Results from unilateral trade liberalization scenarios beyond the implementation ofthe EMAA indicate that tariff unification (tariffs ranging between 3 and 98% are set at 29% acrosssectors) has small aggregate effects, while the removal of non-tariff barriers has positive aggregateeffects, but favours skilled labour and capital. On average, real household income per capitaexpands, but in favour of urban households and non-poor households in rural areas. Combiningtrade liberalization with at least one complementary domestic policy27 results in a win-winoutcome, whereby the welfare of all household groups increases much more rapidly than if statusquo policies are followed.
A third study of Morocco combines a CGE model with household survey data to obtain adetailed picture of the distributional effect of unilateral trade liberalization. Ravallion and Lokshin(2004) measure the short-term welfare impacts of the price changes attributed to removing thecountry’s protection on cereals (they estimate cereal protection at 100% during 1997-98).28 Theprice changes are estimated from a CGE model simulating various levels of tariff reduction (10, 30,50 and 100%) for cereals and the removal of the government intervention in subsidizing cerealprices among consumers. Prices in cereals decrease by nearly 27% for consumers and by around24% for producers. Producer prices for fresh vegetables also decrease, by less than 10%, while theprices of other agricultural products (fruits, dairy products and eggs, meat and sugar) decrease atthe lower levels of tariff reductions on imported cereals, but increase at the higher levels. Inaggregate, the results show a small, but negative impact on mean household consumption and asmall increase in inequality. Heterogeneity in consumption behaviour and in income sources leadsto a diverse impact on households. For example, rural households have twice the budget share forcereals as urban households; also the share of income from production accounts for one quarter ofconsumption in urban areas (the rest is labour earnings, transfers and savings), while the share is87% in rural areas, and about one third of this is from cereals.
The household survey also shows that, at the national level, 16% of households are netproducers of cereals, while, in rural areas, the proportion is 36%. The majority of the rural poorproduce cereals for home consumption, and over one third of the poorest quintile tend to producemore than they consume. These households will be worse off from the fall in cereal prices. At thenational level, production losses outweigh consumption gains, and the poverty rate increasesoverall, but the impact is felt entirely in rural areas, where losses to net producers of cerealsoutweigh the gains to net consumers among the poor (Ravallion and Lokshin 2004).
In a recent study of labour markets in Morocco and Tunisia, Dennis (2006b) argues that theability of MENA countries to respond to trade liberalization is impeded by regulations that makefactor markets inflexible. He cites the legal constraints on dismissing workers, the high level oflegally mandated severance pay, the restrictions on the use of temporary labour, the highminimum-capital requirements for starting a new business and lengthy bankruptcy procedures. He
CHAPTER 4: IMPACT OF TRADE LIBERALIZATION
27/ Complementary policies include (i) transfers to owners of rainfed agricultural resources (land and pasture), in each period fullycompensating for losses from trade liberalization, and (ii) in each period, the stock of rural skilled labour is augmented by 5%, withadditional labour coming from the unskilled labour of rural households.
28/ The most favoured nation tariff on cereals reported in WTO (2003b) is 20.6% (simple average) with a range of 2.5 to 53.5%.

72
finds that Morocco and Tunisia have the least flexible labour markets among the 11 developingcountries studied. To examine this issue, Dennis uses a CGE model to simulate the impact of aunilateral 50% reduction in import barriers in Morocco and Tunisia with high and low factormarket flexibility. Factor market flexibility is simulated by making capital mobile and by doublingthe elasticity of substitution between factors of production. Dennis finds that flexible factormarkets increase the welfare gains from unilateral trade liberalization by a factor of three inMorocco and by a factor of six in Tunisia.
4.3 SummaryMost studies of global trade liberalization indicate that reducing agricultural subsidies andremoving import barriers will increase world agricultural prices. The prices of agriculturalcommodities for which the markets are distorted (including wheat, rice, sugar and dairy) wouldrise 515% according to most studies.
Almost all the NENA13 countries are net agricultural importers; so, there is clearly some basisfor concern that these countries will lose as a result of global trade liberalization. Our analysisconfirms that the terms-of-trade effect of a 15% increase in all world agricultural prices on theNENA13 countries would be approximately US$1.2 billion, or 0.2% of the regional GDP. Theactual impact of trade liberalization, however, is likely to be more positive for three reasons. First,this analysis does not take into account the response by producers and consumers. Second, itassumes that the price increase is the same for all commodities. For example, Egypt could gain fromglobal liberalization if the price of cotton (which it exports) increases more than the price of wheat(which it imports). And, third, the analysis estimates the terms-of-trade effect of tradeliberalization, but it does not include the efficiency gains associated with reducing distortions indomestic agricultural markets. Most studies of trade liberalization suggest that the efficiency effectsare larger than the terms-of-trade effects.
Several dozen studies have been undertaken to examine the macroeconomic impact of varioustypes of trade liberalization in NENA. Most of these studies use CGE models to simulate the effectof alternative trade policies. The results of these studies are summarized as follows:
• Multilateral trade liberalization generally results in net gains to countries in the region; realGDP expands 1-3%.
• The benefits of trade liberalization to a given country depend largely on the degree ofdomestic liberalization carried out by the country. Most of the gains from agricultural tradeliberalization are associated with domestic reform rather than changes in trade policy inother countries. This confirms the well-known concept in studies of trade liberalization:what you do determines what you get.
• The benefits of multilateral trade liberalization are generally greater than the benefits ofbilateral trade liberalization with the EU or the US and greater than the benefits of regionaltrade agreements within NENA.
• Trade liberalization usually results in lower production and more imports of wheat, buthigher production and more exports of fruits and vegetables.
Only a few studies have examined the distributional impact of trade liberalization, such as theeffect on farmers or other poor groups in the NENA13 countries. One of the most thorough studies,by Ravallion and Lokshin (2004), suggests that the lower agricultural prices associated withremoving agricultural protection in Morocco have a negative effect on poverty.

Agriculture, Trade and Poverty in Egypt
5

74
5.1 BackgroundWith 67 million people, Egypt is the most populous country in the Arab world and second in theNENA13 region after Turkey. Based on Egypt’s per capita GDP (US$1,622 in 2003), the World Bankclassifies Egypt as a lower-middle-income country. Real per capita GDP growth averaged 2.9% inthe 1980s, 2.3% in the 1990s and 1.4% in 2000-03 (World Bank 2005a). Regional instability,mainly due to the Israeli-Palestinian conflict, the war in Iraq and terrorist attacks, has contributedto slower growth since 1998.
Although the contribution from the agriculture sector has declined in recent decades, the sectorstill plays an important role in the Egyptian economy. It accounts for about 16% of GDP, downfrom around 20% in the early 1980s. Agriculture also accounts for about 34% of total employmentand 5% of exports. Domestic agriculture contributes to the overall food needs of the country andprovides domestic industry with raw materials.
In the 1970s, agricultural policy was characterized by heavy government intervention inproduction, trade and prices. Most crops were subject to compulsory sales to state enterprises atfixed prices. The agricultural sector was highly taxed relative to other sectors of the economy. Thishad several negative impacts on agricultural development and food security. Starting in 1987, theGovernment of President Mubarak launched a series of agricultural policy reforms to liberalizemarkets (Ender 2000).
As a result of broader economic reforms in the 1990s, the private sector emerged with a moreimportant role in terms of output and jobs. At the same time, the economy remained inwardlooking, as high tariff rates and an overvalued currency made the domestic market more attractivefor Egyptian business (El-Laithy, Lokshin and Banerji 2003). Egypt’s merchandise imports arealmost three times as large as its merchandise exports. The large trade deficit is sustained by foreignaid, revenue from tourism and remittances from Egyptians working overseas, particularly in Europeand the Gulf countries.
5.2 Agricultural sector5.2.1 Agricultural productionThe Nile River Valley has been cultivated for at least 8,000 years, and it continues to be the focusof almost all agriculture in Egypt. About 90% of the agricultural area is concentrated in the NileDelta, and most of the remainder falls within a few kilometres of the Nile and along theMediterranean. Egypt is unique in the NENA region in that 100% of crop production is irrigated.No other country in the region has more than 40% of irrigated cropland. As a result, crop yields inEgypt are relatively stable and are not subject to weather-related shocks as in most countries in theregion. About 97% of the area of Egypt is uncultivated due to the extremely limited rainfall (WorldBank 2004).
Per capita arable land is just 0.04 ha, one of the lowest rates in the world. However, thecombination of warm weather, fertile soil and irrigation allows Egyptian farmers to achieve high yieldsand practice multiple cropping. Also, Egypt has a relatively large number of tractors (3.9 per 100ha of cropland), most of which are used on a rental basis. Fertilizer use is the highest among theNENA countries, at over 400 kg per ha of arable land.
In 1960, Egypt was self-sufficient in all basic food commodities, with the exception of wheat,for which the country supplied 70% of it own needs. The self-sufficiency ratio declineddramatically for most products during the 1970s and 1980s due to a combination of rapidpopulation growth and rising foreign currency inflows from exports (including cotton and textileproducts), remittances and foreign aid. The rising dependence on imported food is a major concernamong policymakers and has resulted in various attempts to restrict food imports and stimulatedomestic production.
Because of irrigation, farmers can produce two or three harvests per year. The main summercrops are maize, rice and cotton; in winter, wheat, berseem (Egyptian clover) and broad beans aregrown. The nili (autumn) season is used for growing potatoes and vegetables. Grains account foralmost half (47%) of the cultivated area, and wheat is the most important, followed by maize andrice. Berseem, used for animal fodder, accounts for 17% of the planted area, while vegetablesrepresent 12% and fruit 8% (Siam 2005).

75
Domestic resource cost analysis indicates that Egypt has a strong comparative advantage in theproduction of cotton, wheat and fruits and vegetables, is moderately competitive in several less-water-intensive crops such as maize, beans and potatoes and has a disadvantage in producingwater-intensive crops such as rice and sugar cane (Madcour and Abou Zeid 1996).
5.2.2 Agricultural trade patternsIn 2000-02, Egypt’s total export revenue was about US$15 billion per year,29 about US$1 billion ofwhich was earned from oil and fuel exports. As described in section 3.1.2, agricultural exports wereUS$800 million, about 5% of the total and 20% of the merchandise exports. Cotton is the mostimportant agricultural export (Table 3-5). Egyptian cotton has long fibres and is considered one ofthe best in the world, fetching high prices on international markets. The average annual value ofcotton exports over 2000-02 was US$205 million, but, more recently, cotton exports have surpassedUS$500 million thanks to expanded output and higher world prices. Cotton is also used in Egypt’stextile sector, which produces cloth and garments for domestic use and for export. Egypt exportsrice and fruits and vegetables, including potatoes, oranges, onions and tomatoes.
Total imports were US$20 billion in 2002, of which agricultural imports represented US$4 billion,or one fifth of the total. As in many countries in the region, wheat is the most importantagricultural import (Table 3-5). Over 2000-02, Egypt imported an average of US$732 million inwheat per year, making it the largest wheat importer in the world. Wheat is a politically sensitivecommodity because bread is the main staple food. Wheat production and marketing were strictlycontrolled until market reforms in the 1980s and 1990s. Agricultural input and output marketshave been liberalized to some degree, but the Government maintains subsidies on some types ofbread and attempts to boost domestic production by restricting imports of wheat and flour.Egyptian wheat production is able to cover about 55-60% of domestic requirements. The secondlargest agricultural import is maize. Maize demand is rising due to its use as animal feed.
5.3 Agricultural and trade policy5.3.1 Agricultural policyAgricultural policy in Egypt has been characterized by heavy intervention by the Government insetting prices, granting marketing monopolies to state enterprises, subsidizing agricultural inputsand restricting imports. Before 1987, most field crops were subject to compulsory purchase by stateenterprises at fixed prices. The state restricted the allocation of land among crops through crop areacontrols. Likewise, input distribution was largely controlled by the Government. The exchange ratewas overvalued, and imports were tightly controlled.
Under pressure because of the growing fiscal burden and rising debt, Egypt began a process ofstructural adjustment in the 1980s. In 1987, the compulsory purchase of all crops was eliminatedexcept in rice, cotton and sugar cane. For wheat, maize and other crops, the Government switchedfrom compulsory purchase to voluntary purchase at Government-set floor prices. In 1990, therewas a massive devaluation of the exchange rate, moving it towards a market rate. In 1991, ricemarketing was liberalized, and input subsidies were reduced significantly. Input subsidies werephased out over 1991-93. Crop area controls were largely eliminated in this period as well. In 1994-95, cotton marketing and ginning were liberalized, allowing private enterprises to compete withstate enterprises (Siam 2005).
Although significant progress has been made in liberalizing agricultural markets, particularlybetween 1987 and 1996, the Government continues to intervene in a few areas. First, electricity andirrigation water are still heavily subsidized. Second, the General Authority for Supply Commoditiescontinues to plays an important role in the importation of food. For example, in 2004, it imported5.4 million t of wheat and 277,000 t of cooking oil, as well as significant quantities of tea, lentilsand beans. Although it does not have a monopoly on imports, it accounts for a large share of allwheat imports. Third, the Government maintains a large and complex system to subsidize bread,
29/ This figure refers to exports of goods and services. Excluding services (including tourism and revenue from the Suez Canal),merchandise exports were only US$4 billion (World Bank 2004).
CHAPTER 5: AGRICULTURE, TRADE AND POVERTY IN EGYPT

76
sugar and cooking oil. The cost of these subsidies was brought down to around LE 2 billion in2002, but expansion of the programme raised the cost to LE 8 billion in 2004.30 Wheat imports bythe General Authority for Supply Commodities are sold to millers to make baladi bread, which isprice controlled, while private sector imports are used to make unsubsidized bread and other wheatproducts (WTO 2005b).
5.3.2 Trade policyLike many of its neighbours, Egypt followed a policy of import-substitution industrialization in the1960s and 1970s. In response to a debt crisis in 1982, it became one of the first NENA countries tobegin to follow a more outward-oriented trade policy. The trade reforms of 1986 simplified a rangeof import taxes and reduced non-tariff barriers. Generally, manufacturing benefits from the highestprotection, except for cotton ginning, which has negative protection. Agriculture has relatively lowprotection, with some important exceptions. In 1998, the Government replaced import bans by hightariffs on clothing, poultry parts, meats, fruits, vegetables and consumer appliances.
The multiple exchange rates of the 1980s were unified into one exchange rate in 1991 (Reefat1999). In 2003, the Egyptian pound was allowed to float. In 2004, Egypt reduced the number oftariff bands, eliminated some import fees and cut tariff rates, resulting in a decline in the averagetariffs from 21% in 2000 to 9%. The tariff rates applied in 2005 are shown in Table 5-1. Althoughthe average tariff for beverages and spirits is very high and some of the tariff rates for traditionalexport commodities are high, the average rate on grains, oilseeds, fats and oils (which account fortwo thirds of agricultural imports) is under 10%.
According to the World Bank, the simple average tariff rate is low by world standards, lowerthan the rates in 60% of the countries in the world. Furthermore, progress in trade liberalizationover 2000-04 was among the strongest in the world (World Bank 2005d). Egypt is currentlyenjoying a windfall as a result of high world prices for its oil exports and increased revenue fromthe Suez Canal, since the high cost of fuel has made circumnavigating Africa more costly.
5.3.3 Trade agreementsPart of Egypt’s liberalization has been unilateral, and part has been related to various tradeagreements. Egypt signed an EMAA with the EU in 2001. Egypt is a member of the Common Marketfor Eastern and Southern Africa and GAFTA. Egypt also signed the Agadir Declaration, whichestablished a free trade area among Egypt, Jordan, Morocco and Tunisia.
TABLE 5-1Tariff rates in 2005 and value of imports
Category Simple average Range of tariff Value oftariff rate rates imports in 2003
(%) (%) (US$ million)
Agriculture 66.4 0-3 000 2 679.9Grains 3.3 2-5 1 136.7Oil seeds, fats, oils, etc. 6.4 0-32 421.9Fruit and vegetables 15.9 2-40 212.7Coffee, tea, cocoa, sugar, etc. 35.4 2-3 000 212.0Live animals and animal products 18.4 5-32 218.4Dairy products 11.5 2-32 123.8Cut flowers and plants 4.0 2-32 9.4Beverages and spirits 1 028.8 12-3 000 1.9Tobacco 22.0 22 188.6Other agricultural products 4.1 0-32 154.3
Source: WTO (2005b).
30/ In June 2004, the exchange rate was LE 6.20 per US$1.00, so LE 8 billion was equivalent to US$1.3 billion.

77
GATT/WTOBased on the Uruguay Round, Egypt presented base tariff rates for over 600 agricultural tariff linesand offered to bind all agricultural tariffs. For most products, the bindings were in the range of 5to 80%, and there was a commitment to reduce them progressively. Egypt did not declare anyagricultural support measures; so, it is bound by the 10% de minimus restriction under whichproduct-specific support may not exceed 10% of the value of that commodity and non-product-specific support may not exceed 10% of the value of agricultural production.
EMAA-EgyptEgypt signed an EMAA with the EU in 2001, and this came into force in 2004. The agreement seeksto establish a free trade area for industrial products over a 12-year period. The restricted access tothe EU agricultural market has been the most important barrier for the expansion of Egypt’sagricultural exports. The last version of the agreement includes an enlargement of quotas andlonger seasonal windows for some Egyptian exports.
Common Market for Eastern and Southern AfricaEgypt became a member of the Common Market for Eastern and Southern Africa in 1998. Theorganization includes 20 countries in eastern and southern Africa that are working to reduce tradebarriers. A subgroup of nine countries formed a free trade area and were planning to phase outinternal tariffs between 1992 and 2000. Two more countries joined the FTA in 2004, but Egypt is nota member of the FTA. A customs union, with common external tariffs, was to be established by 2003(Siam 2002), but disagreements over the levels of external tariffs prevented this from occurring.
GAFTAEgypt became a member of GAFTA in 1998. According to this agreement, tariffs will be graduallyphased out over a ten-year period from the signing of the agreement. Some topics are still subjectto negotiation among the 14 Arab countries, including an agricultural agenda and rules of origin.
Other bilateral FTAsThere are several bilateral FTAs between Egypt and other NENA countries. The Egypt-Tunisia FreeTrade Agreement was initiated in 1998. It gives an exemption on customs duties for specificproducts from both countries. A 20% reduction in customs duties was granted for some othergroups of commodities for five years. The Egypt-Turkey Free Trade Agreement was also signed in1998. It was intended to boost trade, investment ties and cooperation by using Turkey as a gatewayfor Egyptian products into the EU market. In turn, Egypt will serve as a gateway for Turkishcommodities in the Middle East and Africa. An FTA has been created on a bilateral basis betweenEgypt and Jordan.
Although one might think that the large number of FTAs implies relatively open trade policies,some have expressed concern about the proliferation of regional and bilateral agreements. UNDP(2005b) notes that “there are difficulties in administering different rules of origin and diversecustoms treatments related to various agreements. Adapting to different standards, laws andregulations may lead to delays in implementation.” The report proposes pursuing multilateral tradeliberalization through WTO and simultaneously working on trade facilitation, such as throughstreamlining customs procedures.
5.4 Poverty and household budget patternsThis section describes the living conditions and sources of income of Egyptian households, withparticular emphasis on small-scale farmers. The main source of data is the Egypt IntegratedHousehold Survey carried out by the International Food Policy Research Institute in 1997-98.Analysis of the survey suggests that 62.3% of the households are in Lower Egypt, while theremainder are in Upper Egypt (Table 5-2). Lower Egypt’s landscape is dominated by the Nile Deltaat Alexandria. The delta region is well watered and crisscrossed by channels and canals. UpperEgypt is a narrow strip of land that extends from the cataract boundaries of Aswan to the area southof Cairo. Historically, the land in Upper Egypt was more isolated from activities in the north.
CHAPTER 5: AGRICULTURE, TRADE AND POVERTY IN EGYPT

78
Nationally, 53.8% and 46.2% of the population reside in urban and rural areas, respectively. LowerEgypt is more urbanized, while Upper Egypt is more rural.
We define a farm household as a household relying on crop or livestock production. Onlyabout one third of the households in Lower Egypt are engaged in farming, compared to more thanhalf in Upper Egypt. More than three fourths of farmers reside in rural areas; the remainder are inurban areas. Farm households represent about 70% of rural households and 18% of urbanhouseholds. In terms of welfare, more than 60% of the poorest households are rural, and twothirds of the poorest households are classified as farm households.
5.4.1 PovertyThis study uses per capita consumption expenditure to measure family well-being and poverty. Asshown in Table 5-3, the national average consumption expenditure per capita in 1997/98 wasLE 1,782 (US$517 at the 1998 exchange rate of LE 3.45 per US$1.00). The figures at the regional levelshow that per capita expenditures are essentially equal in the Lower Nile and Upper Nile. This isconsistent with calculations of the Human Development Index that show the gap between Upper andLower Egypt narrowing over time (UNDP 2005b). Between urban and rural areas, the contrast ismuch sharper. The average per capita expenditure is only LE 1,368 annually among rural households,but almost 60% higher (LE 2,137) among urban households. The results also suggest that woman-headed households show per capita consumption at 12% higher than man-headed households.
Among farm households, those producing only livestock tend to be more well off than thoseproducing crops. Within crop-producing households, those producing sugar cane are the poorestgroup, with per capita expenditures averaging LE 1,042. Farm households growing rice are thewealthiest, followed by households producing wheat and fruit and vegetables.
TABLE 5-2Distribution of Egyptian households based on occupation and location
National Location
Urban Rural
(percentage of all Egyptian households)
Total Population 100.0 53.8 46.2Non-farmers 57.8 44.2 13.6Farmers 42.2 9.6 32.6
Lower Egypt 62.3 37.3 25.0Non-farmers 40.0 32.0 8.0Farmers 22.3 5.3 17.0
Upper Egypt 37.7 16.5 21.2Non-farmers 17.8 12.2 5.6Farmers 19.9 4.3 15.6
Poorest tercile 33.4 12.1 21.4Non-farmers 16.1 9.3 6.8Farmers 17.3 2.8 14.6
Middle tercile 33.3 17.7 15.7Non-farmers 18.6 14.4 4.2Farmers 14.7 3.3 11.5
Richest tercile 33.3 24.0 9.2Non-farmers 23.1 20.5 2.6Farmers 10.2 3.6 6.5
Source: 1997-98 Egypt Integrated Household Survey.
Note: Lower Egypt includes the following northern governorates: Cairo, Alexandria, Suez, Damietta, Dakhalia, Sharbia, Kalyubia, Kuer, Gharbia, El Menuf, Behera and Ismaila. Upper Egypt includes the following southern governorates: Menya, Giza, Fayoum, BeniSuef, Assiut, Souhag, Qena and Aswan.

79
TABLE 5-3Expenditure and household size for different types of households in Egypt
Household expenditure Per capita expenditure Household size
(LE/year) (LE/year) (number)
National 8 874 1 782 5.7
RegionLower Nile 8 607 1 794 5.4Upper Nile 9 318 1 764 6.2
LocationUrban 9 409 2 137 4.9Rural 8 249 1 368 6.6
Household statusFarmer 9 368 1 485 6.9Non-Farmer 8 515 1 998 4.8
Gender of heads of householdsMan 9 264 1 751 6.0Woman 6 664 1 962 4.2
Farm typeProducing livestock only 8 210 1 541 5.9Producing crops
Cotton 11 653 1 419 8.9Wheat 11 425 1 480 8.4Rice 11 861 1 517 8.8Fruit and vegetable 12 743 1 465 9.5Sugar cane 7 533 1 042 7.4Other crops 10 746 1 419 8.1
Source: 1997-98 Egypt Integrated Household Survey.
TABLE 5-4Incidence of poverty and number of poor people in Egypt
Year Share of population that is poor Number of poor people(%) (millions)
Poverty Line1981/82 30.2 12.91990/91 39.1 20.71995/96 48.2 28.31999/2000 42.0 26.9
Source: World Bank (2002a).
Note: These poverty figures correspond to the upper poverty line in the World Bank report. Thelower poverty line is the expenditure that typically allows a household to meet basic caloricneeds, but does not include any allowance for non-food expenditure.
In the cost-of-basic-needs approach, the poverty line represents the level of per capitaexpenditure at which the members of a household may be expected to meet their basic caloricneeds, as well as their minimum non-food requirements. About 27 million people in Egypt,representing 42% of the population, were living below the poverty line in 1999-2000. Althoughpoverty statistics are difficult to compare over time, it appears that poverty increased in the 1980sand early 1990s, but declined in the second half of the 1990s (Table 5-4).
Based on the 1997-98 Egypt Integrated Household Survey, we calculate the poverty rate usingthe poverty line calculated by Datt, Jolliffe and Sharma (1998) according to a method similar tothe approach in World Bank (2002). This analysis finds that the poverty rate in Egypt was 38% in1997/98, as shown in Table 5-5. This is comparable to, but slightly below the 42% reported for1999/2000 using the upper poverty line. The poverty rate is higher in rural areas than it is in urbanareas (40.9% compared to 35.8%). The poverty rate is highest in rural areas in Upper Egypt,followed by the rates in metropolitan areas; it is lowest in urban areas in Upper Egypt.
CHAPTER 5: AGRICULTURE, TRADE AND POVERTY IN EGYPT

31/ Often, the levels of reported household incomes in household surveys are less than the reported consumption expenditures.This is the case in the Egypt Integrated Household Survey, as shown in Table 5-4 and Table 5-8. Income estimates are generallyconsidered less accurate due to hesitance among households to reveal this information and income fluctuations over time.
80
TABLE 5-5Incidence of poverty for different types of households in Egypt
National Urban Rural
(%) (%) (%)
National 38.1 35.8 40.9
StrataMetropolitan 41.5 41.5 -Lower-urban 38.1 38.1 -Lower-rural 38.8 - 38.8Upper-urban 25.9 25.9 -Upper-rural 43.3 - 43.2
Household statusFarmer 39.4 39.5 39.4Non-farmer 37.2 35.0 44.4
Gender of heads-of-householdMale 38.0 35.9 40.5Female 38.9 35.4 42.8
Farm typeProducing livestock only 43.2 39.7 44.9Producing crops
Cotton 31.7 38.1 31.1Wheat 29.8 31.0 29.7Rice 33.5 27.4 33.9Fruit and vegetables 27.4 33.3 26.5Sugar cane 62.5 - 62.5Other crops 35.0 38.6 34.6
Source: 1997-98 Egypt Integrated Household Survey.
Farm households show a slightly higher incidence of poverty than non-farm households,although, in rural areas, where most farmers are located, the proportion in poverty is higher amongnon-farmers. In rural areas, non-farmers probably include landless agricultural labourers. Amongdifferent types of farmers, sugar cane growers show the highest incidence of poverty (62.5%), whilefruit and vegetable growers show the lowest (27%). Farmers producing livestock show the secondhighest poverty rate, despite the relatively high average consumption expenditures by this group.This suggests a highly skewed distribution, with many poor small-scale livestock producers and afew large-scale commercial livestock producers.
In rural areas, woman-headed households tend to be slightly poorer than man-headedhouseholds, while, in urban areas, the difference in poverty rates is negligible. Overall, theproportion of woman-headed households is about 15% according to the Egypt IntegratedHousehold Survey.
5.4.2 Sources of incomeWhile household consumption expenditures are considered the most accurate basis for assessingwell-being and poverty, the Egypt Integrated Household Survey also provides information onhousehold income and its sources. The total income of each household is divided into six sources:crop production, livestock production, wages, non-farm business income, transfers and other income.We include the value of home-consumed agricultural production in our calculation of income.
According to the Egypt Integrated Household Survey, almost three quarters of Egyptianhouseholds earn wages as one source of income, implying that wages are the most widespread singlesource.31 The proportion of all households with livestock income is 37%. About one fifth of thepopulation participates in crop production, and 29% receive transfers. As expected, the percentageof rural households with crop and livestock income is much higher than the percentage of urbanhouseholds with income from these sources. Surprisingly, though, the share of rural households

81
with wage income and non-farm business income is almost as high as the corresponding share inurban areas (Table 5-6).
Table 5-7 shows the composition of income for different types of households in Egypt. At thenational level, crop production contributes 11% of household income on average. Althoughlivestock production is carried out by nearly 40% of households, a large number of thesehouseholds only raise poultry; so, livestock production’s contribution to average householdincome is relatively small, less than 6%. Non-farm business income represents 15% of the total.Almost half of these non-farm businesses are in the retail, hotel and restaurant sectors, followed bymanufactures and services. Transfers contribute less than 4% of income, although they are receivedby nearly 20% of households.
CHAPTER 5: AGRICULTURE, TRADE AND POVERTY IN EGYPT
TABLE 5-6Percentage of households involved in income activities by region
Nationwide Urban Rural
Crop production 19.3 3.4 37.7Wheat 11.9 1.9 23.5Rice 5.4 0.7 10.9Cotton 4.2 0.6 8.4Fruit and vegetables 0.3 0.1 0.6Other cereals 3.4 0.6 6.7Pulses 0.2 0.1 0.4Tubers 0.2 0 0.5Oilseed 0.3 0.1 0.6Spices 0.1 0 0.1Sugar cane 1.3 0 2.7Other cash crops 1.2 0.2 2.5Clover 14.1 2.3 28.0
Livestock production 36.6 15.5 61.2Cattle 13.9 1.0 12.9Goats, sheep 7.7 1.2 6.5Chickens 32.9 7.6 25.3
Wage income 73.9 75.7 71.8Non-farm business income 14.8 16.8 12.6Transfers 29.4 30.2 28.4Other income 39.0 42.2 35.2
Source: 1997-98 Egypt Integrated Household Survey.
TABLE 5-7Sources of income for different types of households
Income category National Urban Rural Non-farm Farm Wheat Rice Cotton Fruit and Sugaraverage house- house- house- house- farmers farmers farmers vegetable cane
holds holds holds holds farmers farmers
Total (LE/household/year) 6 111 6 866 5 230 5 805 6 531 9 583 11 213 11 716 11 164 7 898Composition (% of total)
Crops 11.5 2.7 25.0 - 25.6 45.8 54.9 60.9 40.5 64.3Wheat 1.4 0.4 2.8 - 3.0 7.0 7.3 7.1 3.7 11.2Rice 2.2 0.4 4.9 - 4.9 9.4 21.9 8.4 3.0 -Cotton 1.6 0.5 3.4 - 3.6 7.0 8.3 21.9 5.9 0.4Fruit & vegetables 0.7 0.2 1.4 - 1.5 1.4 2.0 1.6 10.5 -0.1Sugar cane 0.6 - 1.4 - 1.3 1.9 - 0 - 31.8Other crops 5.1 1.2 11.1 - 11.3 19.1 15.3 21.8 17.4 21.1
Livestock 5.7 1.4 12.3 - 12.6 16.7 19.0 13.2 9.1 3.0Wages 49.5 55.6 40.1 61.2 35.2 19.3 15.8 16.1 26.5 11.5Non-farm business 14.7 18.5 8.8 16.1 12.9 6.8 3.6 1.8 16.0 1.1Transfers 3.6 3.6 3.6 3.9 3.2 1.3 -0.5 - -0.1 6.5Other 15.0 18.1 10.2 18.8 10.5 10.2 7.2 8.1 7.9 13.5
Source: 1997-98 Egypt Integrated Household Survey.

82
Although rural areas in developing countries are generally dependent on agriculture, the datafor Egypt indicate that the rural non-farm economy is quite important. Wages account for 40% ofthe income of rural households, compared to 56% among urban households. Crop and livestockincome provide 25% and 12% of rural household incomes, respectively. Even among farmhouseholds, farm income (crops and livestock) account for less than 40% of income. Thus, overall,the non-farm sector contributes almost two thirds of rural household income. These findings arecomparable with those recorded in other studies in the region. For example, non-farm incomerepresents the single most important source of income in rural areas of Jordan, accounting forabout 51% of total household income (Adams 2001).
Table 5-7 also shows the composition of income for farm households growing different typesof crops, especially wheat, rice, cotton, fruits and vegetables, and sugar cane. It is important to recallthat these are not exclusive categories: many farmers will fall into more than one category.Furthermore, it is not necessary that farmers growing a particular crop receive a large share of theirincome from that crop. Cotton and sugar cane farmers are the most specialized in crop production,earning more than 60% of their income from crops. Sugar cane farmers are fairly dependent onthat crop (32% of income), while wheat accounts for only 7% of the income of wheat farmers.Fruit and vegetable farmers have a higher share of their income from wages and from non-farmbusinesses than do growers of other crops. Perhaps the risk and expense of horticultural productionexclude households that do not have significant non-farm income sources.
Table 5-8 shows the sources of income from rural households based on expenditure tercile andfarm size. Wages play a significant role as a source of income in all terciles, but their contributionis greater among the poor (47%) than among the middle and upper terciles (less than 39%).Similarly, wheat is much more important to poor and middle-tercile households (13%) than toupper-tercile households (3%). This is not surprising given the position of wheat as the main staplefood. In contrast, rice, cotton, livestock and “other income” are more important sources of incomefor households in the upper terciles. Fruit and vegetable income is more important to the poorestand richest terciles compared to the middle tercile. This may reflect differences betweencommercial production and backyard horticultural production for households’ own consumption.
Looking at the right-hand side of Table 5-8, we see that landless households are the poorest;the annual household income of LE 3,450 is more than 30% lower than the average rural income.Not surprisingly, large-scale farms benefit from the land they own, earning an income that is morethan double the rural average income. However, it is interesting to note that medium-sized farmshave incomes that are slightly lower than the incomes of small-scale farms.
As expected, households with no land or small farms earn the highest share of income fromwages and non-farm businesses. Small farms also earn a relatively large share of their incomes fromrice production (28% compared to 21% and 17% in the other categories) and from “other crops”.Largescale farms earn a relatively large share of their incomes from wheat and cotton and fromcrops in general. Livestock and fruit and vegetable income seem to be more important amongmedium-sized farms. These results highlight the fact that small farmers should not be considereda synonym for poor rural households, particularly in a country where agroecological potential andcropping intensity vary widely.
5.4.3 Household consumption patternsTable 5-9 reports average household consumption expenditure and patterns for different types ofhouseholds. At the national level, the consumption expenditure among households is LE8,837annually. Household decisions on the allocation of resources to food spending and other needshave widespread implications for well-being. The food share in total household budgets at thenational level is 57%. Urban and non-farm households spend lower proportions of their totalexpenditures on food consumption (about 53%), while rural and farm households spend a largershare on food (62-64%). The results are consistent with the international patterns, whereby low-income households spend a larger share of their budgets on food, while richer households spenda larger portion on non-food items. Food, clothing and footwear appear to be necessities in thesense that their budget shares decline as income rises, while education, health, recreation and othergroups are luxuries in the sense that their budget shares rise with income.

83
It is interesting to note that the food consumption patterns are not closely related to the cropsgrown. For example, wheat farmers do not consume more wheat products, and rice farmersconsume no more rice than other farmers. This is a sign of the relatively commercial orientation ofEgyptian farmers and relatively low transaction costs, presumably due to the high populationdensity in settled areas. This is further supported by the fact that almost all farmers are either netbuyers or net sellers and few produce only for their own consumption without buying or selling.
5.5 Impact of commodity price changes on povertyTo understand the effects on household incomes and poverty of agricultural price changes, wesimulate the effect for several crops that are important in Egypt. We focus on wheat, rice, cotton,fruits and vegetables, and sugar cane. First, we compute the consumption expenditure of eachhousehold and the percentage of these households in poverty. Next, we simulate the effect on theirincomes resulting from an increase in producer prices and consumer prices, taking the household’sproduction and consumption of each crop into account. Adding the change in income to initialconsumption expenditures (under the assumption that all the change is spent on consumption),we compute a new per capita consumption expenditure level for each household and recomputethe average income and poverty measures for different types of households. The Foster-Greer-Thorbecke poverty measures are used as follows:
• the headcount index (incidence), which is the proportion of people below the poverty line;• the poverty gap index (intensity), which is the average shortfall of the income of the poor
from the poverty line, averaged over the whole population; and• the severity index, which addresses the inequality of incomes among the poor.
The short-run simulation holds production and consumption quantities fixed at their initial levels,while the long-run simulation allows producers and consumers to respond to price changes basedon plausible price elasticities. The simulation method is described in more detail in the Annex tothis chapter.
CHAPTER 5: AGRICULTURE, TRADE AND POVERTY IN EGYPT
TABLE 5-8Sources of income for rural households by expenditure tercile and farm size
Income category Per capita expenditure category Farm size category Average
Poor Middle Rich No land Small Medium Large
Total (LE/household/year) 4 144 5 743 6 074 3 450 5 690 5 523 12 055 5 230
Per capita (LE/person/year) 569 928 1 160 700 825 754 1 378 808
Composition (% of total)Crops 24.4 30.2 20.8 - 33.7 31.4 56.2 25.0
Wheat 13.0 13.3 3.2 - 7.7 1.8 14.6 11.3Rice 12.9 22.5 24.9 - 27.6 20.9 17.1 19.6Cotton 11.5 13.7 17.1 - 3.0 15.8 15.9 13.6Sugar cane 8.5 3.0 7.0 - 2.9 9.2 5.6 5.7Fruit and vegetables 8.0 3.0 6.4 - 4.3 12.6 4.0 5.4Other 46.2 44.5 41.4 - 54.6 39.6 42.7 44.3
Livestock 6.4 11.6 11.4 1.0 12.8 20.0 15.7 12.3Wages 46.9 37.5 38.6 63.4 36.9 34.2 15.2 40.1Non-farm business 9.5 8.3 9.9 15.7 6.3 2.6 3.9 8.8Transfers 4.9 2.1 4.2 6.3 2.5 1.3 1.5 3.6Other 7.9 10.4 14.9 13.5 7.9 10.9 7.5 10.2
Source: 1997-98 Egypt Integrated Household Survey.
Note: Per capita expenditure categories and farm-size categories are defined by terciles among rural households. Small farms have less than0.28 ha; medium-sized farms have 0.28 to 0.63 ha, and large farms have more than 0.63 ha.
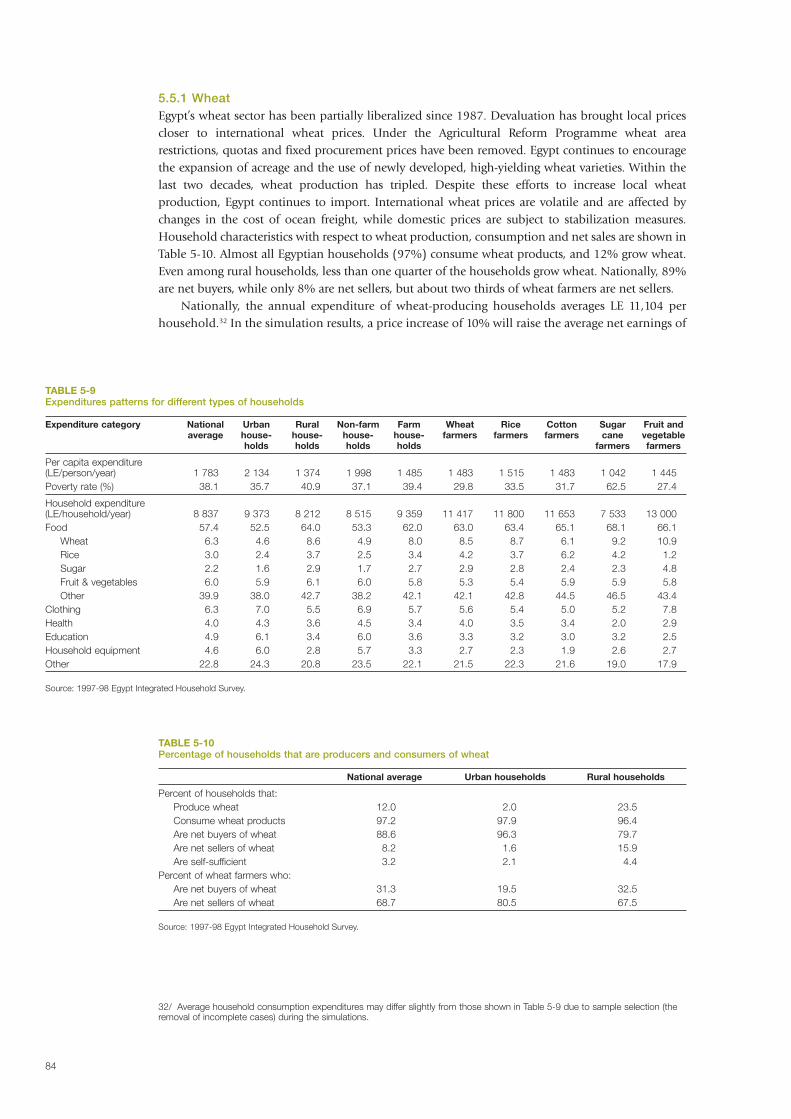
32/ Average household consumption expenditures may differ slightly from those shown in Table 5-9 due to sample selection (theremoval of incomplete cases) during the simulations.
84
5.5.1 WheatEgypt’s wheat sector has been partially liberalized since 1987. Devaluation has brought local pricescloser to international wheat prices. Under the Agricultural Reform Programme wheat arearestrictions, quotas and fixed procurement prices have been removed. Egypt continues to encouragethe expansion of acreage and the use of newly developed, high-yielding wheat varieties. Within thelast two decades, wheat production has tripled. Despite these efforts to increase local wheatproduction, Egypt continues to import. International wheat prices are volatile and are affected bychanges in the cost of ocean freight, while domestic prices are subject to stabilization measures.Household characteristics with respect to wheat production, consumption and net sales are shown inTable 5-10. Almost all Egyptian households (97%) consume wheat products, and 12% grow wheat.Even among rural households, less than one quarter of the households grow wheat. Nationally, 89%are net buyers, while only 8% are net sellers, but about two thirds of wheat farmers are net sellers.
Nationally, the annual expenditure of wheat-producing households averages LE 11,104 perhousehold.32 In the simulation results, a price increase of 10% will raise the average net earnings of
TABLE 5-9Expenditures patterns for different types of households
Expenditure category National Urban Rural Non-farm Farm Wheat Rice Cotton Sugar Fruit andaverage house- house- house- house- farmers farmers farmers cane vegetable
holds holds holds holds farmers farmers
Per capita expenditure(LE/person/year) 1 783 2 134 1 374 1 998 1 485 1 483 1 515 1 483 1 042 1 445Poverty rate (%) 38.1 35.7 40.9 37.1 39.4 29.8 33.5 31.7 62.5 27.4
Household expenditure(LE/household/year) 8 837 9 373 8 212 8 515 9 359 11 417 11 800 11 653 7 533 13 000Food 57.4 52.5 64.0 53.3 62.0 63.0 63.4 65.1 68.1 66.1
Wheat 6.3 4.6 8.6 4.9 8.0 8.5 8.7 6.1 9.2 10.9Rice 3.0 2.4 3.7 2.5 3.4 4.2 3.7 6.2 4.2 1.2Sugar 2.2 1.6 2.9 1.7 2.7 2.9 2.8 2.4 2.3 4.8Fruit & vegetables 6.0 5.9 6.1 6.0 5.8 5.3 5.4 5.9 5.9 5.8Other 39.9 38.0 42.7 38.2 42.1 42.1 42.8 44.5 46.5 43.4
Clothing 6.3 7.0 5.5 6.9 5.7 5.6 5.4 5.0 5.2 7.8Health 4.0 4.3 3.6 4.5 3.4 4.0 3.5 3.4 2.0 2.9Education 4.9 6.1 3.4 6.0 3.6 3.3 3.2 3.0 3.2 2.5Household equipment 4.6 6.0 2.8 5.7 3.3 2.7 2.3 1.9 2.6 2.7Other 22.8 24.3 20.8 23.5 22.1 21.5 22.3 21.6 19.0 17.9
Source: 1997-98 Egypt Integrated Household Survey.
TABLE 5-10Percentage of households that are producers and consumers of wheat
National average Urban households Rural households
Percent of households that:Produce wheat 12.0 2.0 23.5Consume wheat products 97.2 97.9 96.4Are net buyers of wheat 88.6 96.3 79.7Are net sellers of wheat 8.2 1.6 15.9Are self-sufficient 3.2 2.1 4.4
Percent of wheat farmers who:Are net buyers of wheat 31.3 19.5 32.5Are net sellers of wheat 68.7 80.5 67.5
Source: 1997-98 Egypt Integrated Household Survey.

85
wheat-producing households by LE 66 in the short run and LE 68 in the long run. The reason thesefigures are so small is that, on average, wheat accounts for only 7% of the income of wheat farmers(Table 5-7). Furthermore, many wheat farmers buy wheat products; so, the net gain from higherprices is reduced. One third of the wheat farmers are actually net buyers of wheat; these deficitwheat farmers lose when rice prices go up.
As shown in Table 5-11, the poverty rate among wheat growers is 30%. A 40% increase in thewheat price has negligible effects on the poverty rate among wheat farmers in the short run becausewheat does not represent a major source of income for many of them and because some of thempurchase wheat products. In the long run, wheat farmers expand output and substitute away fromwheat consumption; so, their gains are greater. A 40% price increase brings down the poverty ratefrom 30% to 27% in the long run. Increases in wheat prices have small and non-linear effects onthe depth and severity of poverty among wheat farmers.
5.5.2 RiceRice is a preferred food grain among many Egyptians, and a large segment of the population inEgypt consumes rice. Rice production occurs mostly in the Lower Nile, in about 10% of theagricultural area of Egypt. Egypt has recently been a net rice exporter. In 2005, rice production was6.3 million t, while domestic consumption was only 3.5 million t. According to the EgyptIntegrated Household Survey, more than 90% of households consume rice nationally, but only 5%grow rice (Table 5-12). Among rice farmers, almost 90% are net sellers.
The percentage of rural households growing rice that are poor is somewhat higher than thecorresponding figure among wheat growers, as shown in Table 5-13. A 10% increase in rice pricesleads to an average income increase of LE 272 in the short run and LE 277 in the long run. Thegains among rice growers of a 10% price increase are much greater than the gains among wheatgrowers because rice accounts for a larger share of rice grower income and because a smaller shareof rice growers are net buyers (only 10%).
A 40% price increase reduces the poverty rate among rice-producing households from 34% to28% in the short run and to 27% in the long run. Higher rice prices also reduce the depth andseverity of poverty among rice growers.
TABLE 5-11Effects of increased wheat prices on poverty among wheat growers in Egypt
Short run Long run
Base expenditures (LE/household/year) 11 104 11 104Change in income following a 10%wheat price rise (LE/household/year) 66 82
Incidence of poverty (P0)Base 0.30 0.3010% increase in wheat price 0.30 0.3020% increase in wheat price 0.30 0.2930% increase in wheat price 0.30 0.2840% increase in wheat price 0.30 0.27
Depth of poverty (P1)Base 0.075 0.07510% increase in wheat price 0.073 0.07220% increase in wheat price 0.074 0.06930% increase in wheat price 0.075 0.06640% increase in wheat price 0.076 0.074
Severity of poverty (P2)Base 0.028 0.02810% increase in wheat price 0.027 0.02620% increase in wheat price 0.027 0.02530% increase in wheat price 0.028 0.02440% increase in wheat price 0.028 0.023
Source: Calculated from the 1997-98 Egypt Integrated Household Survey.
CHAPTER 5: AGRICULTURE, TRADE AND POVERTY IN EGYPT

86
TABLE 5-12Percentage of households that are producers and consumers of rice
National average Urban households Rural households
Percent of households that:Produce rice 5.4 0.7 10.9Consume rice products 90.8 93.6 87.6Are net buyers of rice 84.9 92.2 76.5Are net sellers of rice 4.9 0.4 13.5Are self-sufficient 10.2 7.4 10.0
Percent of rice farmers who:Are net buyers of rice 10.2 37.7 8.2Are net sellers of rice 89.8 62.3 91.8
Source: 1997-98 Egypt Integrated Household Survey.
TABLE 5-13Effects of increased rice prices on poverty among rice growers in Egypt
Short run Long run
Base expenditures (LE/household/year) 11 861 11 861Change in income following a 10%rice price increase (LE/household/year) 272 277
Incidence of poverty (P0)Base 0.34 0.3410% increase in rice price 0.32 0.3220% increase in rice price 0.30 0.3030% increase in rice price 0.29 0.2940% increase in rice price 0.28 0.27
Depth of poverty (P1)Base 0.078 0.07810% increase in rice price 0.072 0.07220% increase in rice price 0.067 0.06730% increase in rice price 0.062 0.06140% increase in rice price 0.058 0.056
Severity of poverty (P2)Base 0.029 0.02910% increase in rice price 0.026 0.02620% increase in rice price 0.024 0.02330% increase in rice price 0.021 0.02140% increase in rice price 0.019 0.018
Source: Calculated from the 1997-98 Egypt Integrated Household Survey.
5.5.3 CottonCotton is one of the main agricultural exports of Egypt (along with fruits and vegetables). The cropis also important in terms of employment; among farmers, 9.9% produce cotton, and it isestimated that cotton production employs up to 1 million farm workers. Moreover, Egypt’s exportsof textiles and clothing products amounted to US$516 million in 2003, while imports wereUS$279 million.
Table 5-14 shows the effect of cotton price increases of 10% to 40% on different measures ofpoverty among cotton growers. In the base scenario, 32% of cotton farmers are living below thepoverty line, slightly higher than the rate among wheat farmers and slightly below the rate amongrice farmers. In the simulation analysis, a 10% increase in the cotton price raises the averagehousehold income among cotton growers by LE 306 in the short run and LE 310 in the long run.
A 40% increase in cotton prices brings the poverty rates down to 26% in the short run and 25%in the long run. This represents about a 16% reduction in the poverty level among cotton farmers.There are even larger relative falls in the depth and intensity of poverty among cotton growers.

87
TABLE 5-14Effects of increased cotton prices on poverty among cotton growers in Egypt
Short run Long run
Base expenditures (LE/household/year) 11 653 11 653Change in income caused by a 10%cotton price rise (LE/household/year) 306 310
Incidence of poverty (P0)Base 0.32 0.3210% increase in cotton price 0.30 0.3020% increase in cotton price 0.27 0.2730% increase in cotton price 0.26 0.2640% increase in cotton price 0.26 0.25
Depth of poverty (P1)Base 0.091 0.09110% increase in cotton price 0.085 0.08420% increase in cotton price 0.079 0.07930% increase in cotton price 0.074 0.07340% increase in cotton price 0.069 0.068
Severity of poverty (P2)Base 0.039 0.03910% increase in cotton price 0.036 0.03620% increase in cotton price 0.034 0.03330% increase in cotton price 0.031 0.03140% increase in cotton price 0.029 0.028
Source: Calculated from the 1997-98 Egypt Integrated Household Survey.
TABLE 5-15Percentage of households that are producers and consumers of fruit and vegetables
National average Urban households Rural households
Percent of households that:Produce fruits and vegetables 3.0 0.7 5.8Consume fruits and vegetables 96.8 97.6 95.9Are net buyers of fruits and vegetables 94.9 96.9 92.5Are net sellers of fruits and vegetables 1.9 0.6 3.5Are self-sufficient 3.2 2.5 4.0
Percent of fruit and vegetable farmers who:Are net buyers of fruits and vegetables 35.2 10.6 38.5Are net sellers of fruits and vegetables 63.6 89.4 60.1
Source: 1997/98 Egypt Integrated Household Survey.
5.5.4 Fruit and vegetablesDuring two decades (1982-2002), the total production of vegetables increased from 8.6 million to16.2 million t, an annual growth rate of 3.9%. The growth rate for fruits was almost 5% annually.In term of area shares, fruit and vegetable production represented about 20% of the cropped areain 2000/01, while cereals occupied 47% of the area.
Table 5-15 indicates that more than 95% of households consume fruits and vegetables.Expenditures on fruits and vegetables account for 6% of total consumption and over 10% of foodconsumption expenditures nationally, according to the Egypt Integrated Household Survey. About3% of all Egyptian households grow fruits and vegetables, while the figure is 6% among ruralhouseholds. Almost two thirds of horticultural growers are net sellers of fruits and vegetables, whilemore than one third are net buyers.
According to Table 5-16, the annual average household consumption expenditures of thesehouseholds are LE 12,743. The incidence of poverty among fruit and vegetable growers is 29%,somewhat lower than the figure related to other crops considered here. In the simulation analysis,
CHAPTER 5: AGRICULTURE, TRADE AND POVERTY IN EGYPT

88
a 10% increase in fruit and vegetable prices increases the net income of growers by LE 164 in theshort run and LE 167 in the long run. A price increase of 40% reduces the poverty rate among fruitand vegetable producers from 29% to 24% in both the short- and the long-run scenarios. This priceincrease reduces the depth and intensity of poverty by 20-30% of the original values.
5.5.5 Sugar caneThe total production of sugar increased from 649,000 t in 1982 to 1.4 million t in 2000, reflectingan annual growth of 4.4%. The Government continues to promote both cane and beet sugarproduction. However, given the extreme competition for Egypt’s limited land and water resources,the area under sugar cane cultivation is not expected to increase. The new sugar policy is aimed atpromoting beet sugar production by establishing three new sugar beet milling facilities.
Egypt is a major importer of sugar. Roughly one third of consumption needs are imported; theremainder comes from domestic production. Egypt continues to subsidize sugar consumption
TABLE 5-16Effects of increased fruit and vegetable prices on poverty among fruit and vegetable growers in Egypt
Short run Long run
Base expenditures (LE/household/year) 12 743 12 743Change in income caused by a 10% pricerise for fruits and vegetables (LE/household/yr) 164 167
Incidence of poverty (P0)Base 0.29 0.2910% increase in prices 0.26 0.2620% increase in prices 0.25 0.2530% increase in prices 0.24 0.2440% increase in prices 0.24 0.24
Depth of poverty (P1)Base 0.085 0.08510% increase in prices 0.081 0.08120% increase in prices 0.076 0.07630% increase in prices 0.073 0.07240% increase in prices 0.069 0.068
Severity of poverty (P2)Base 0.038 0.03810% increase in prices 0.035 0.03520% increase in prices 0.032 0.03230% increase in prices 0.029 0.02940% increase in prices 0.027 0.026
Source: Calculated from the 1997-98 Egypt Integrated Household Survey.
TABLE 5-17Percentage of households that are producers of sugar cane and consumers of sugar
National average Urban households Rural households
Percent of households that:Produce a sugar crop 1.3 0.0 2.7Consume sugar 91.7 91.7 96.4Are net buyers of sugar 90.0 91.1 88.7Are net sellers of sugar 1.3 0.0 2.7Are self-sufficient 8.7 8.9 8.6
Percent of sugar crop farmers who:Are net buyers of sugar 0 - 0Are net sellers of sugar 100 - 100
Source: 1997/98 Egypt Integrated Household Survey.

89
under the rationing system, albeit at a decreasing rate. As a long-term plan, the Government ismaking efforts to cut the cost of the sugar programme by reducing the amount of sugar availablethrough the ration system.
Although the proportion of households that grow sugar cane is barely 1%, all households thatproduce a sugar crop are net sellers (Table 5-17). The local effect could be larger, however, becausesugar cane growers are concentrated in the rural part of Upper Egypt. Furthermore, as mentionedelsewhere above, sugar cane farmers tend to be more specialized than growers of other crops,earning almost one third of their incomes from sugar cane. Sugar cane producing households haveper capita incomes significantly below the national average, and their poverty rate is 63%, far abovethe rural average of 41%.
As shown in Table 5-18, the incidence of poverty among sugar cane growers is 63%, far higherthan the rate among growers of other major crops. A 10% increase in the producer price of sugarcane raises the net average incomes of sugar cane growers by LE 461 in the short run and LE 468 inthe long run. A 40% increase in sugar cane prices results in a marked drop in the poverty amongsugar cane growers from 63% to 43%. Overall, the long-run simulation results indicate a slightlygreater poverty reduction than the results of the short-run simulation. The depth and severity ofpoverty among sugar cane producing households also decline with higher prices. The reason for thestrong relationship between sugar cane prices and the poverty rate among sugar cane growers is thatthese households derive a large share of their incomes from this crop.
TABLE 5-18Effects of increased sugar cane prices on poverty among sugar cane growers in Egypt
Short run Long run
Base expenditures (LE/household/year) 7 533 7 533Change in income caused by a 10%sugar cane price rise (LE/household/year) 461 468
Incidence of poverty (P0)Base 0.63 0.6310% increase in sugar cane price 0.55 0.5320% increase in sugar cane price 0.53 0.5330% increase in sugar cane price 0.48 0.4540% increase in sugar cane price 0.43 0.43
Depth of poverty (P1)Base 0.145 0.14510% increase in sugar cane price 0.119 0.11820% increase in sugar cane price 0.095 0.09330% increase in sugar cane price 0.073 0.07040% increase in sugar cane price 0.055 0.051
Severity of poverty (P2)Base 0.044 0.04410% increase in sugar cane price 0.031 0.03120% increase in sugar cane price 0.022 0.02130% increase in sugar cane price 0.015 0.01440% increase in sugar cane price 0.010 0.009
Source: Calculated from the 1997-98 Egypt Integrated Household Survey.
CHAPTER 5: AGRICULTURE, TRADE AND POVERTY IN EGYPT

90
5.5.6 Impact of crop price increases on overall povertyIn sections 5.5.1 to 5.5.5, we have simulated the impact of raising the prices of an individual cropon the growers of that crop. In this section, we simulate the impact of raising the prices of anindividual crop on the rural, urban and overall population, including growers and non-growers. Inthe interest of brevity and because the overall effects are small, we limit the simulations to 40%increases in each crop price. The results of these simulations are shown in Table 5-19.
Wheat price increases have a very small negative effect, on average, in the short run and a veryslight positive effect in the long run, as supply and demand respond to the higher prices. Similarpatterns hold in both rural and urban areas.
The effects of rice price increases on the whole population are quite small. Even a 40% increasein rice prices raises the poverty rate at the national level by only 1 percentage point.
While the incidence and depth of poverty among cotton growers are strongly affected by cottonprices (particularly in rural areas), the broader effect on poverty level reductions at the regionallevel is negligible. This is explained by the fact that cotton growers represent only 4.2% of allhouseholds nationally.
A 40% price increase in fruit and vegetable prices causes poverty to rise, but by only a smallamount. In both urban and rural areas, as well as at the national level, the poverty rate increasesabout 1 percentage point. This suggests that horticultural consumers are poorer or more numerousthan horticultural growers.
And a 40% increase in sugar cane prices has a small positive effect on rural poverty (reducingit by 1 percentage point), but no measurable effect on urban poverty. Because sugar producinghouseholds are such a small part of the national population, the effect of higher sugar prices onoverall poverty is quite small.
TABLE 5-19Effects of increased commodities prices on poverty among all households in Egypt
Effect on regional populations
Urban Rural National
Short Long Short Long Short Long run run run run run run
Base scenario Expenditures (LE/household/year) 9 401 9 401 8 236 8 236 8 863 8 863Poverty incidence (P0) 0.36 0.36 0.41 0.41 0.38 0.38Depth of poverty (P1) 0.105 0.105 0.118 0.118 0.111 0.111Severity of poverty (P2) 0.043 0.043 0.050 0.050 0.046 0.046
40% Average income increase -64 69 -135 24 -97 48increase in Poverty incidence (P0) 0.37 0.35 0.43 0.40 0.39 0.37wheat price Depth of poverty (P1) 0.109 0.102 0.125 0.119 0.116 0.110
Severity of poverty (P2) 0.045 0.041 0.053 0.050 0.049 0.045
40% Average income increase -45 -42 53 64 0 7increase in Poverty incidence (P0) 0.37 0.37 0.41 0.41 0.39 0.39rice price Depth of poverty (P1) 0.108 0.108 0.119 0.119 0.113 0.113
Severity of poverty (P2) 0.044 0.044 0.050 0.050 0.047 0.047
40% Average income increase 15 16 95 101 52 54increase in Poverty incidence (P0) 0.36 0.36 0.40 0.40 0.38 0.38cotton price Depth of poverty (P1) 0.105 0.105 0.117 0.117 0.110 0.110
Severity of poverty (P2) 0.043 0.043 0.049 0.049 0.046 0.046
40% Average income increase -140 -134 -84 -76 -114 -107increase in Poverty incidence (P0) 0.37 0.37 0.42 0.42 0.39 0.39fruit and Depth of poverty (P1) 0.110 0.110 0.123 0.123 0.116 0.116vegetable price Severity of poverty (P2) 0.045 0.045 0.052 0.052 0.048 0.048
40% Average income increase -3 -3 46 50 20 21increase in Poverty incidence (P0) 0.36 0.36 0.40 0.40 0.38 0.38sugar cane price Depth of poverty (P1) 0.105 0.105 0.116 0.116 0.110 0.110
Severity of poverty (P2) 0.043 0.043 0.049 0.049 0.046 0.046
Source: Calculated from the 1997-98 Egypt Integrated Household Survey.
Note: Average income increase refers to the average change in household income associated with a 40% increase in the crop price,expressed in LE per household per year. The three poverty measures are expressed as fractions.

91
5.6 SummaryIn the 1970s and 1980s, agricultural policy in Egypt intervened heavily in production, marketingand trade. A policy of import-substitution industrialization meant that the agricultural sector washeavily taxed through low official prices and compulsory sales. At the same time, somecommodities were protected by import restrictions. In the late 1980s and the 1990s, Egyptgradually liberalized agricultural markets and reduced the level of import protection. Wheatmarkets remained distorted by a combination of import controls, fixed producer prices, consumersubsidies on certain types of bread and government control over the channels leading to subsidizedbread. In 2004, a series of significant tariff reductions was implemented, leading the World Bankto declare that Egypt had made more progress in trade liberalization than almost any other country.Even so, the degree of protection is higher than in 40% of the countries of the world.
Full global trade liberalization would increase the prices of agricultural commodities by 5-15%. This would probably negatively affect the Egyptian economy because it is a net agriculturalimporter, though the exact effect depends on the price changes for each commodity. Egypt wouldgain from higher rice and cotton prices, but lose from higher wheat and maize prices. Domestictrade reform would reduce the domestic prices of imported commodities such as wheat, thusoffsetting the effect of global trade liberalization, as well as providing efficiency gains.
In this chapter, we review the income and consumption patterns of Egyptian households basedon the 1997-98 Egypt Integrated Household Survey and simulate the effects of changes in the pricesof five agricultural commodities on incomes and poverty rates among Egyptian households. Suchprice changes might arise from changes in world market prices or from changes in border orsubsidy policies within Egypt.
Overall, our results show that price changes can have a significant effect on poverty among theproducers of specific crops. However, individual price changes do not have a large impact on overallrates of poverty. One implication of this analysis is that agricultural trade policy is a relativelyineffective policy instrument for assisting poor rural households. Although agricultural protectiondoes affect the poverty among growers of the particular crop at issue, the effect on overall poverty(or even rural poverty) is negligible because: (i) the percentage of households growing a particularcrop is generally small, (ii) the share of household income from a particular crop is small, and (iii)many households (including poor rural households) purchase the crop or products made from thecrop and are thus harmed by higher prices. This suggests that anti-poverty programmes would dobetter by assisting the poor directly than by influencing the market for goods that (some) poorpeople produce.
Another interesting result is that wheat is the most politically sensitive agricultural commodity;yet, the effect of wheat protection on poverty is negligible even among wheat farmers themselves.This is because wheat farmers are not particularly poor (they are somewhat more well off than theaverage rural household), because their incomes are fairly diversified (wheat accounts for only8.5% of their incomes) and because many other households in urban and rural areas are net buyers(80% of rural households are net buyers). While policy decisions take into account a wide range offactors not considered here, this analysis should at least weaken the poverty argument for a wheatprotection policy.
Finally, the analysis suggests that some of the poorest households in Egypt are those that areinvolved in farming, but that do not own land. These households include agricultural labourersand tenants who farm land owned by others. Agricultural trade policy can only indirectly influencethe well-being of these households (through the labour market). More effective in addressing theneeds of these farmers would be policies to make the labour market for informal work moreefficient and policies to facilitate the purchase of farmland by landless farmers.
CHAPTER 5: AGRICULTURE, TRADE AND POVERTY IN EGYPT

92
Annex to Chapter 5Methods for estimating the impact of trade liberalization
DataThis analysis uses the Egypt Integrated Household Survey carried out by the International FoodPolicy Research Institute, in coordination with the Ministry of Agriculture and Land Reclamationand the Ministry of Trade and Supply. The nationally representative survey provides informationon income and expenditures, as well as on many household characteristics, including housing,landownership, education, employment, health and nutrition, access to facilities, migration, andcredit and savings. The sample consists of 2,500 households in 20 urban and rural governorates;the fieldwork took place during the first half of 1997. For this particular analysis, a subsample of2,452 households has been used because the data on the rest of the households in the full sampleare incomplete or missing. With this representative sample, it is possible to examine the averagecharacteristics of the poor at the national level and also through several dichotomous breakdowns,such as by urban-rural residence or residence in Upper or Lower Egypt.
Questionnaire and sample designThe questionnaire was divided into male and female components to reduce the time required tofill in the questionnaire. In the typical case, the male questionnaire was administered by a maleinterviewer to the male head of household (who, it is assumed, knows the most about non-foodhousehold expenses), and, similarly, the female questionnaire was administered by a femaleinterviewer to (most typically) the wife of the head of the household (who, it is assumed, knowsmore about household eating habits and food expenses). The male questionnaire contains most ofthe sections that deal with sources of income and large expenses, while the female questionnairecontains the sections focusing on tending to the house, including eating patterns, health care, andsmaller, more frequent expenses.
The questionnaire was administered to 2,500 households from 20 governorates using a two-stage, stratified selection process. The sample frame used for the selection process was supplied bythe Central Agency for Public Mobilization and Statistics (CAPMAS) and is based on the 1986Egypt census and a 1993 listing of households in selected primary sampling units. This sampleframe is used by CAPMAS as a master sample for most of their survey work. It consists of 492sampling units, 296 of which are urban, while 196 are rural.
Income calculationIncome is calculated as the sum of net revenues from the following sources: crop production,livestock production, wages, non-farm enterprises, transfers and other income. Net income fromeach crop is calculated as the value of production, minus the cost of production. It covers allcommodities, including by-products and home consumption. Crop production expenses (seeds,fertilizer, chemical insecticides, labour, utilities, storage, transportation, equipment rental andothers) are deducted to derive net crop income. Payments to landlords are also excluded fromincome. Livestock income includes all types of animals and by-products. Livestock productionexpenses (feeds, veterinary and labour) are deducted to derive net livestock income. Meat homeconsumption is also included as part of income. Because of uncertainty about how to calculatewage rates accurately among family members, no value was imputed for the family labour involvedin crop and livestock production.
Net revenues from non-farm enterprises is based on gross revenues, minus the operating costsover the past 12 months. Wage income is calculated as the sum of annual earnings in wages for themain job; cash and in-kind wages are also examined for each household member. Transfers arederived as the net value of cash and in-kind transfers received and sent. Other income covers rents(cash and in-kind) received through ownership of assets such as housing, land and equipment;interest, dividends, and pensions.

93
MethodsWe use the data from the Egypt Integrated Household Survey to estimate the short- and long-runimpact of changes in agricultural prices. In the absence of reliable estimates of the impact ofmultilateral and unilateral trade liberalization on agricultural prices in Egypt, we simulate theimpact of four price increases (10%, 20%, 30% and 40%) for each commodity of interest. Mostanalyses of the impact of multilateral trade liberalization suggest that agricultural prices would rise5-20%, well within the range of price increases considered here. We simulate the impact of changesin the price of wheat, rice, sugar, cotton, and fruits and vegetables. The global markets for wheat,rice, sugar and cotton are among the most distorted; so, we would expect trade liberalization tohave the largest effect on the world prices of these commodities. In addition, these fourcommodities are important in the agricultural economy of Egypt as sources of income (wheat, riceand cotton) and as components of the diet (wheat, rice and sugar). The global markets for fruitsand vegetables are not highly distorted, but fruit and vegetable exports from Egypt (and othercountries in the region) to the EU are constrained by strict quality and food safety standards, as wellas by seasonal restrictions to prevent competition with European growers. For this reason, we alsosimulate the impact on Egyptian households of improved market access to European fruit andvegetable markets, represented by increases in the prices for fruits and vegetables in Egypt.
In this analysis, we simulate both the short-run and the long-run impacts of higher agriculturalprices on each household in the Egypt Integrated Household Survey. The short-run impact refers tothe effect on household welfare before households have had an opportunity to respond to thehigher prices by producing more or consuming less. The change in per capita income of householdi after the price change in one commodity, say, wheat, can be calculated as follows:
, (1)
where Dyi is the change in per capita income of household i after the price increase, Hi is thenumber of members in household i, Qpi is the production of the commodity by household i, DPiis the increase in the price of the commodity and Qci is the quantity of wheat consumed byhousehold i. In graphic terms, this expression is the rectangular approximation of producer surplus,plus consumer surplus. If a household does not grow wheat, then Qpi = 0, and the direct effect ofhigher wheat prices will be negative; the magnitude will depend on the importance of wheatproducts in the household budget. If a household does grow wheat, then the welfare impactdepends on the value of wheat production compared to the value of wheat consumption.
In the long run, farmers and consumers will respond to the higher prices by growing more andconsuming less of the commodity, say, wheat. The long-run effect can be estimated as follows:
, (2)
where es is the supply elasticity of the commodity and eD is the price elasticity of demand for thecommodity. In graphic terms, this expression is the trapezoidal approximation of the producersurplus, plus the consumer surplus. The two terms with elasticities are positive regardless ofwhether the price change is positive or negative, implying that the long-term welfare effect of a pricechange is more positive (or less negative) than the short-term effect. In the absence of estimatedsupply and demand elasticities for the four commodities, we use 0.3 for the supply elasticities and-0.3 for the price elasticities of demand.
CHAPTER 5: AGRICULTURE, TRADE AND POVERTY IN EGYPT - ANNEX

94
Because the welfare impact is calculated for each household in the Egypt Integrated HouseholdSurvey sample based on the income and consumption patterns of each household, we can estimatethe change in the poverty measures caused by the change in prices. This microsimulation approachalso allows us to estimate the change in income for any subgroup of households that is defined byincome, farm size, or other variable. In this analysis, we use the class of poverty measures identifiedby Foster, Greer and Thorbecke (1984), defined as follows:
, (3)
where Pa is the poverty measure, N is the number of households, m is the poverty line and yi is theincome or expenditure of poor household i (the summation occurs only on poor households).When a = 0, the poverty measure, P0, is the incidence of poverty, that is, the proportion ofhouseholds for which the incomes are below the poverty line. When a = 1, the poverty measure,P1, indicates the depth of poverty, taking into account the degree of poverty, as well as thepercentage of households that are poor. If a = 2, the measure P2 indicates the severity of poverty,incorporating information on the degree of inequality among poor households, as well as thedepth of poverty and the number of poor households.

Agriculture, Trade and Poverty in Tunisia
6

96
6.1 IntroductionTunisia is a small country (10 million inhabitants) endowed with few natural resources. In spite ofthese constraints, the country has diversified the economy through important agricultural, mining,energy, tourism and manufacturing sectors. Growth in tourism and increased trade have been keyelements in the steady growth, although tourism has slowed since the 11 September 2001 attack.
Per capita GDP grew at a healthy rate (2.9%) over the 1990s, reaching over US$2,500 in 2002.This gives Tunisia the third highest income in the NENA region, behind Turkey and Lebanon.About two thirds of the population lives in urban areas.
Tunisia maintains relatively high tariff barriers. According to the World Bank (2005d), Tunisia’ssimple average tariff rate puts it among the top 1% of countries in trade restrictions. There has beensome trade liberalization; however, the average tariff rate came down from 29% in 2000 to about25% in 2004. This progress is about average compared to other countries over the same period.
Meanwhile, Tunisia has a relatively favourable investment climate. The World Bank (2005d)rates the investment climate in Tunisia as better than 79% of the countries in the world.Furthermore, reforms since 2000 indicate a degree of progress in the investment climate that isbetter than that in almost three quarters of the world’s countries. In particular, Tunisia hasstreamlined the procedures for opening and registering new businesses and for closing businesses.Tunisia, along with Morocco, has the highest ratio of foreign direct investment to GDP, over 3%.
6.2 Agriculture and FoodThe Tunisian economy has undergone significant structural changes, including industrialization,the growth of the service sector and the development of tourism. Nonetheless, the agriculturalsector remains economically and socially important for its contribution to food security,employment, regional balance and social cohesion. The contribution of agriculture and thefisheries sector has remained in the range of 11-14% of GDP since the mid-1990s. The value addedin the food processing sector has remained at around 3% of GDP. Together, they account for about15% of GDP (Table 6-1).
TABLE 6-1Contribution of agriculture and food processing to GDP
1995 1996 1997 1998 1999 2000 2001
(TND million)
GDP Nominal prices 17 052 19 066 20 898 22 561 24 672 26 685 28 7571990 prices 13 074 14 009 14 771 15 477 16 415 17 181 18 028
Agriculture Nominal prices 1 938 2 615 2 760 2 866 3 211 3 298 3 3471990 prices 1 573 2 038 2 098 2 077 2 306 2 283 2 249Contribution to GDP 11.4% 13.7% 13.2% 12.7% 13.0% 12.4% 11.6%
Food processing Nominal prices 556 586 701 708 817 863 9031990 prices 426 434 517 501 566 608 593Contribution to GDP 3.3% 3.1% 3.4% 3.1% 3.3% 3.2% 3.1%
Sources: Tunisian Ministry of Agriculture and Central Bank of Tunisia.
Note: The exchange rate was TND 1.10 per US$1.00 in 1997, TND 1.16 per US$1.00 in 1998, TND 1.21 per US$1.00 in 1999, TND 1.34per US$1.00 in 2000 and TND 1.50 per US$1.00 in 2001, according to the 30 June rates in www.oanda.com.
TABLE 6-2Composition of the Tunisian agriculture sector
1995 1996 1997 1998 1999 2000 2001 2001
(TND million at nominal prices) (share)
Value of agricultural production 2 291 2 986 3 167 3 285 3 684 3 761 3 862 100.0%Grains 162 650 275 429 460 285 364 9.4%Fruit 593 647 1 116 810 951 1 119 804 20.8%Vegetables 389 444 442 515 599 600 462 12.0%Livestock 898 964 1 091 1 182 1 317 1 379 1 390 36.0%Fisheries 184 202 241 248 249 273 278 7.2%
Sources: Tunisian Ministry of Agriculture and Central Bank of Tunisia.

97
Based on the gross value of output, livestock is the largest component of the agricultural sectorin Tunisia, representing 36% of the total (Table 6-2). This is followed by fruit and vegetables, whichtogether account for about 33% of the total. Agricultural production in Tunisia remains vulnerableto drought, however, as indicated by the annual variation in the value of output. The value of grainand fruit output has been particularly volatile.
According to the 2004/05 agricultural survey, wheat accounts for 23% of the planted area,barley 13%, olive trees 32%, fruit and nut trees 17%, forage crops 9%, and vegetables 4%.Agriculture in the north region is dominated by grains and horticulture, the centre by oliveproduction and the south by fruit, nuts and olives. Table 6-3 shows the cropping pattern by farmsize. The share of cultivated area allocated to grains ranges from 32% among farms with less than5 ha to 45% among farms with more than 100 ha, reflecting the fact that grains are less labourintensive than other crops. Hard wheat (used for couscous and pasta) represents roughly half thegrain area across farm size categories, while soft wheat is more important on large farms, and barleyis more important on small farms. Large farms devote a larger share of their cropland to hardwheat, soft wheat and forage crops, while small farmers allocate a larger share to barley, vegetablesand tree crops, most of which are olive trees (MARH 2006).
Tunisian exports were US$9.4 billion in 2002. One source of growth in exports has beentextiles and apparel, which earned US$2.9 billion in 2002. Tunisia enjoyed preferential access toEuropean markets as a result of the quota system under the Multi-Fibre Arrangement. However, theMulti-Fibre Arrangement expired in January 2005; so, Tunisian exporters will now compete moredirectly with exporters from Asia, particularly China, India and Pakistan.
As discussed in section 3.1.5, Tunisian agricultural exports in 2002 were about US$500 million,or about 5% of total exports. The largest agricultural export over 2000-02 was olive oil, althoughthe value of olive oil exports has fluctuated considerably over this period. Other importantagricultural exports include dates, wheat flour, tomato paste and pasta, reflecting the importanceof the food processing sector (Table 3-8).
Tunisian imports were worth about US$10 billion in 2002, while agricultural imports were atUS$1.2 billion, or 12% of the total. As in many other NENA countries, wheat is the most importantagricultural import. Wheat imports account for 60-80% of domestic consumption, depending onthe weather and the size of the wheat harvest. Other major agricultural imports are maize, barley,soybean cake, cooking oil and sugar (Table 3-8). Like most other NENA countries, the value ofagricultural imports exceeds the value of agricultural exports.
CHAPTER 6: AGRICULTURE, TRADE AND POVERTY IN TUNISIA
TABLE 6-3Share of crop area allocated to different crop categories by farm size
Farm size (ha)
0-5 ha 5-10 ha 10-20 ha 20-50 ha 50-100 ha More than Overall100 ha
Grains 31.8 32.8 33.7 37.1 41.3 45.1 36.5Hard wheat 16.9 18.0 18.5 19.3 23.5 22.6 19.3Soft wheat 0.6 1.0 1.0 2.2 3.7 11.3 3.7Barley 14.0 13.4 13.8 15.2 14.0 10.4 13.1Other grains 0.0 0.3 0.3 0.4 0.0 0.9 0.4
Pulses 1.8 1.9 1.8 1.4 1.6 2.1 1.8Forages 7.2 6.8 7 7.6 9.6 13.5 8.7Vegetables 5.5 5.6 3.5 2.4 2.2 1.2 3.7Industrial crops 0.5 0.5 0.3 0.4 0.8 0.6 0.5Tree crops 53.2 52.4 53.6 51.2 44.4 37.5 48.9
Total 100.0 100.0 100.0 100.0 100.0 100.0 100.0
Source: MARH (2006).

98
6.3 Agricultural and trade policyThe implementation of a structural adjustment programme for the agricultural sector between1986 and 1996 began the liberalization of Tunisian agriculture, the improvement in thecompetitiveness of agro-food industries and their adaptation to the qualitative and sanitaryrequirements of international markets. With the exception of wheat, agricultural productionactivities have been substantially liberalized. Agricultural input subsidies and interest rate subsidieshave been practically eliminated. Although irrigation water is still subsidized, fees continue to beadjusted. Agricultural marketing boards have lost some of their monopoly powers.
6.3.1 Agricultural and food policyConcerning domestic support, Tunisia declared to the WTO, a zero current total aggregatemeasurement of support for the year 2002 relative to a maximum commitment of TND 61 million(US$5.5 million) on the following products: durum and soft wheat, barley, milk, olive oil and sugarbeets. The support declared for 2002 was de minimis. It consisted of fixed producer buying pricesfor wheat and intervention prices for other products. Tunisia reported a similar amount spent ongreen box measures exempt from the reduction commitment; these mostly go towards water andsoil conservation and forestation programmes.
In addition, Tunisia has declared an additional TND 8.3 million (US$750,000) as an irrigationsubsidy. In fact, farmers in publicly irrigated areas still pay for water at below the real cost.Additionally, farmers and agro-food enterprises are entitled to special electricity and diesel tariffs.Tunisia also subsidizes exports of agricultural products. These subsidies consist of paymentsintended to reduce the cost of processing and air freight.
Agricultural pricing policyThe agricultural and fisheries sector has been subjected to two forms of price control: controls onproducer prices and controls on prices for agricultural inputs. Since 1986, Tunisia has beenconducting a programme of structural adjustment aimed at reforming the agricultural sector byshifting prices closer to those on world markets and reducing producer subsidies. While subsidieson inputs have been removed totally (except for water), support for agricultural productionthrough investment subsidies remain at a high level for some activities (see next subsection).
Concerning the control of producer prices, prices for all products are freely determined exceptfor grain and milk, which continue to benefit from guaranteed public prices. Instead of supportingfarm prices, Tunisian agricultural pricing policy has had the effect of holding farm prices down.When domestic production is limited for a given product, mainly for vegetables and meats, pricestend to rise. Public authorities implement a set of maximum prices on wholesale or retail markets,without any compensation to farmers. However, when prices are at low levels due to the abundanceof local production, no instrument of support for farmers is applied. This policy, intended tocontrol inflation, has heavily affected farm incomes during the last few years. Small farmersproducing vegetables are the most affected by this policy.
TaxationIn addition to tariffs, supplementary taxes are levied on the consumption of a whole range of foodproducts, in particular, maize and soybean cake, preserved food, fruit and vegetables, and fish. Thetaxes are earmarked for the Fund for the Development of Competitiveness in the Agriculture andFishing Sectors. These taxes are applied to locally produced goods, as well as to imports.
The tax code is used to encourage agricultural development. More specifically, the investmentincentives code includes the following provisions:
• deduction of amounts invested from taxable profits;• exemption from customs duties and the suspension of the value added tax and consumption
tax due on imports of capital goods for which there are no locally manufactured equivalents;• the suspension of the value added tax on locally manufactured capital goods; and• the exemption of investments from income tax for ten years.

99
Financial benefits include an (investment) subsidy of 7% of the cost of the investment (maximumTND 300,000 or US$33,500); another subsidy of 1% of the total cost of investment, with a ceilingof TND 5,000 as the state’s contribution to project design costs. In 2002, through its developmentprogrammes, Tunisia spent TND 91 million (US$8.2 million) to encourage investment in agricultureby subsidizing the cost of private investment in selected activities.
Consumer food subsidiesThe consumer price for each product for which the producer price is subject to administrativecontrol is also controlled. This is particularly true for grains and milk. By means of the GeneralCompensation Fund (Caisse Generale de Compensation), the Government has subsidized theconsumption of basic foodstuffs since 1970. The subsidies have been applied uniformly to whoeverchooses to buy subsidized products at whatever quantity. The subsidies of the fund have beenintroduced to satisfy a somewhat contradictory host of objectives: (i) stabilization of fluctuatingprices for basic products; (ii) preservation of the purchasing power of underprivileged households;and (iii) the redistribution of incomes in favour of low-income groups.
Since 2000, the products covered by the subsidies of the Fund are grains and their derivedproducts, vegetable oil and milk. Although the size of the food subsidies has been graduallyreduced since 1996, the subsidies still represent about 2% of government expenditure (Table 6-4).
The grain subsector accounts for the most politically sensitive, complex and costly part of thesystem of subsidies. Subsidies are injected at three levels in the marketing channel: the collection oflocal production, importation and flour milling. The Grain Board (Office des Céréales) manages thepayment of subsidies in the cereal subsector for the General Compensation Fund. The Grain Boardhas a monopoly on the importation of grains and on the collection of locally produced cereals byfarmers. Together with the Grain Board, two technically private, well-regulated cooperatives work inthe name of the Grain Board according to the same mechanism. For the subsidies for vegetable oil,the National Edible Oils Board (Office Nationale de Huiles) controls the importation and the refiningof vegetable oil. The consumption price of vegetable oil is set below cost, and the board is refundedthe difference through the General Compensation Fund. Presently, the milk subsector representsonly a small share of the consumption subsidies. This has been the result of the development oflocal production and improvements in the productivity of private industry.
6.3.2 Trade policyTunisian authorities use tariffs and non-tariff barriers to protect domestic production from outsidecompetition. These began to be modified in 1995 with the implementation of the URAA, but thetwo instruments are still widely used in Tunisia.
Tunisian customs duties are still among the highest in the world. In fact, non-discriminatoryduties rose to 34.5%, on average, in 2002, against an average rate of 12.8% among middle-incomecountries in the same year. The agricultural and food processing sectors continue to be highly
CHAPTER 6: AGRICULTURE, TRADE AND POVERTY IN TUNISIA
TABLE 6-4Structure and importance of food subsidies
1999 2000 2001 2002 2003 2004
Composition of food subsidies (%)Grains 64.2 73.9 80.5 72.5 64.4 70.7Oil 29.3 20.4 15.1 23.7 32.6 26.7Milk 5.5 5.7 4.4 3.8 3.0 2.5Sugar 1.0 0.0 0.0 0.0 0.0 0.0
Food subsidies/government expenditure (%) 2.1 2.0 2.1 1.8 1.7 1.9Food subsidies/GDP (%) 0.8 0.8 0.8 0.7 0.6 0.7Subsidies/person (TND/year) 21.1 19.5 21.0 18.1 17.3 19.4
Source: Author calculations using data from the Central Bank of Tunisia (2005) and the INS (2005).
Note: The exchange rate was TND 1.21 per US$1.00 in 1999, TND 1.34 per US$1.00 in 2000, TND 1.50 per US$1.00 in 2001, TND 1.38per US$1.00 in 2002, TND 1.36 per US$1.00 in 2003 and TND 1.25 per US$1.00 in 2004 according to the 30 June rates onwww.oanda.com.

100
protected. Since the partnership agreement with the EU has bearing only on non-agricultural andmanufactured food products, agricultural trade continues to be governed by the commitments thatTunisia has taken within the multilateral framework of the WTO. Quantitative restrictions havebeen converted to customs duties, but, as in many member states, bound tariff rates have been fixedat very high levels. While nominal protection rose on the eve of the GATT agreement signed inMarrakech in 1994 to an average rate of 39% and 46%, respectively, for the agriculture and foodprocessing sectors, the respective rates rose to 136% and 88% in 1997. They have been reducedthrough the years in conformity with the agreement on agriculture, but still remain at very highlevels, 89% on average for agricultural products and 72% for agro-industry products (Table 6-5).
For agricultural and food processing products, the tariffs vary greatly. Customs duties and otherimport taxes are generally high for fruit, forest cultivation products, tobacco, meat, dairy products,products derived from the processing of cereals, canned foods and beverages. They are not so highfor cereals, livestock, oils and sugar, four categories that, together, account for 60% of agriculturalimports. Nevertheless, Tunisia has preserved preferential customs duties as part of its proposals forthe GATT agreements in 1994, which are applied for certain products within the limits of quotasset by public authorities. Preferential rates are much lower than the bound tariffs (Table 6-6).
Import operations at preferential tariffs are generally granted to state enterprises. Accordingly,wheat, maize and barley are imported under tariff quotas exclusively by the Grain Board,vegetable oil by the National Edible Oils Board and tea and coffee by the Tunisian Trade Board.Special authorization is required to import products subject to tariff quotas. This license is issued
TABLE 6-5Nominal protection by major economic activity (1995-2003)
1995 2000 2001 2002 2002 2003 2003EU EU EU Rest of EU Rest of
world world
Agriculture and fishing 39 126 100 98 98 89 89Manufacturing 43 39 36 33 45 29 42Other sectors 11 11 3 3 9 1 3
Total 34 42 36 35 43 31 39
Total, except agriculture and food processing 30 21 16 15 24 12 22
Sources: Chemingui and Lahouel (2006).
TABLE 6-6Tariff rates in and out of quotas and utilization of tariff quotas
2005 Quota utilization rate (%)
Product Average Average Tariff 2001 2002 2003 2004in-quota out-of-quota quotatariff rate tariff rate commitments
(%) (%) (t)
Durum wheat 17 73 300 000 100 100 0 0Soft wheat 17 73 600 000 100 100 85 100Barley 17 73 200 000 100 100 100 100Beans 25 60 1 300 0 0 0 0Sugar 15 42 100 000 100 100 100 228Shelled almonds 43 60 1 335 70 100 0 0Tomato concentrate 43 100 155 0 0 0 100Milk powder 17 76 20 000 10 19 35 43Butter 35 100 4 000 60 88 48 49Cheese 27 139 1 500 100 100 100 100Calves and bullocks 27 82 3 000 0 0 0 97Bovine meat 27 88 8 000 0 0 0 100Sheep and goat meat 27 125 380 0 0 0 100
Source: WTO (2005b).
Note: The quota utilization rate refers to the level of imports as a percentage of the quota.

101
by the Ministry of Trade. Private operators are rarely able to import within the framework of thepreferential quotas.
Effective protection has decreased over time, but remains high. It increased during the firstyears of the dismantling of tariffs on European manufactured products because of the dismantlingsequence, which began with inputs and finished products that do not compete with localproduction. This situation has been redressed with the entry of the fourth list of competingproducts in the dismantling phase of customs duties (Table 6-7). Concerning agricultural and agro-industrial products, effective protection has followed a declining tendency, albeit very limited. Infact, effective protection in this sector decreased from 162% in 2000 to 108% in 2003. This is thedirect result of cost reductions in imported intermediate materials and equipment.
The monopolies on the importation of certain food and agricultural products by state enterprises(the Grain Board, the Tunisian Trade Board and the National Edible Oils Board) continue to representthe main tool of protection of the agricultural and food sector in Tunisia. These monopolies cover animportant share of Tunisian imports. The Tunisian Trade Board maintains the monopoly onimporting products considered basic, such as sugar, coffee, tea, black pepper, cocoa beans, rice, kidneybeans and dry yeast, as well as some fresh and dry fruit and vegetables and tinned food. For otheragro-alimentary products that might otherwise be freely imported, obtaining the authorization(rather than simply a license) makes importation almost impossible. Without offering anyjustification, the Tunisian administration often rejects import requests.
Technical barriers also represent an indirect tool for the protection of domestic production. Ingeneral, technical barriers aim at verifying the conformity of imported products with sanitary andfood safety norms. Technical control has been consolidated since the accession of Tunisia to WTOin 1995. Although it was only applied to around a quarter of the customs categories in 1994 (37%of the value of imports), the percentage of customs categories subject to this control rose to morethan 30% in 2001 (43% of the import value). Most of this increase involved the control ofconsumption goods through certification, but systematic control remains very important, applyingto almost 14% of the imports in terms of customs value. It is this kind of control that mostly causesdeadline and efficiency problems. The sanitary, phytosanitary and technical standards arelegitimate under WTO rules and are practiced in most countries, but, very often, technical controlis used for protectionist ends in Tunisia.
Customs clearance is another obstacle to importation, particularly for imports destined for thelocal market. Imports of agro-food products that are exclusively destined for the domestic marketstill suffer from very long clearance delays, estimated at three weeks on average, compared to onlya few days in other countries.
The tariff equivalent of non-tariff barriers provides an indicator of the scale of this type ofprotection. In order to assess this for the main agricultural products imported into Tunisia in 1992,Chemingui and Dessus (2001) used the price-gap approach which involves comparing local pricesand border prices. Of 19 agricultural and food products studied, six were subjected to significantlevels of nontariff barriers. Sugar had the highest non-tariff protection, with a tariff equivalent of28%, followed by hard wheat (20%). The other protected products were barley, soft wheat,vegetable produce and canned goods.
CHAPTER 6: AGRICULTURE, TRADE AND POVERTY IN TUNISIA
TABLE 6-7Effective protection by major economic activity (1995-2002)
1995 2000 2001 2002 2002 2003 2003EU EU EU Rest of EU Rest of
world world
Agriculture and fishing 45 162 123 120 118 110 108Manufacturing 85 68 60 57 92 49 87Other sectors 12 15 3 4 11 1 1
Total 41 63 50 49 60 44 54
Total, except agriculture and food processing 34 30 20 19 34 16 29
Sources: Institute of Quantitative Studies (2003).

102
6.3.3 Trade agreementsTunisia is currently involved in many regional trade agreements, in addition to its commitmentsunder the WTO. Overall, Tunisia has concluded trade agreements with about 60 countries; some ofthese agreements provide for preferential arrangements. Since its last trade policy reformimplemented in 1994, Tunisia has signed the WTO agreement, the bilateral agreement with the EU,bilateral agreements with the members of the Arab League and agreements with Turkey and theEuropean Free Trade Association. All of these agreements are classified as FTAs. In what follows, wedescribe the content of these trade agreements regarding agricultural products.
WTOTunisia acceded to the GATT in 1990 and has been a member of the WTO since March 1995. Thecommitments of Tunisia emerging from the Uruguay Round involve binding 4005 tariff lines in theagricultural and industrial sectors or 66% tariff lines under the Harmonized System. In theagricultural sector, the commitments made by Tunisia involve binding 1503 tariff lines (25% of thetotal) at rates that vary between 25% and 250%, along with a commitment to reduce these rates by24% over ten years (1995-2004). The commitments of Tunisia also involve insuring opening uptariffs quotas for the importation of agricultural and food processing products at lower customsduty rates. Furthermore, Tunisia is also committed to reducing the level of its domestic support foragriculture by 13.3% over 1995-2005.
Euro-Mediterranean Partnership AgreementThe EU is Tunisia’s main trading partner: 76% of Tunisia’s trade goes to or comes from the EU.Imports of European agricultural and food products account for a little under half of all imports ofproducts in these two categories. The European market takes up about 70% of Tunisia’s agriculturaltrade and food exports.
Tunisia is one of the most important exporters of several products, including olive oil, dates,citrus fruit, seafood and various organic fruits and vegetables. These are slowly being supplanted byincreases in exports of melons, table grapes, table olives and, potentially, tomatoes and strawberries.At the same time, Tunisia is a net importer of other agricultural products, mainly wheat, sugar andvegetable oils. For these products, the EU is a leading exporter country. Both the imports and exportsof agricultural products by Tunisia are sensitive to the common agricultural policy of the EU. In fact,import prices for agricultural products are significantly determined by the level of Europeansubsidies on exports under the common agricultural policy, and, likewise, exports of Tunisianagricultural products are subject to the protection instruments implemented through this policy.
Trade relations between Tunisia and the EU in agricultural and food products are governed bythe partnership agreement signed in 1995. This provides for the establishment of a free trade areafollowing a 12-year transitional period. The foundation of the partnership agreement is theprinciple of reciprocity. It provides for the removal of tariffs on all products, with the exception ofagricultural products. Agricultural products are excluded from the agreement and are subject tospecific arrangements. In fact, trade in agricultural and food products remains affected by barriersto entry in both markets. In the case of the EU market, the Common Agricultural Policy introducesmany barriers to the importation of Tunisian agricultural and food products.
Although agriculture was excluded from the 1995 agreement, the agreement provided that theEU and Tunisia would review the trade regime for agriculture in 2000. In December 2000, the EUand Tunisia agreed on measures to liberalize trade in agricultural products beginning in January2001. As an illustration, Tunisia has obtained better access to the EU market for olive oil (anincrease in the annual quota and a duty set to zero), cut flowers, tomato concentrate, new potatoesand oranges, for which an increase in the free duty quota has been agreed. The EU has obtainedimproved access for vegetable oils and wheat with the application of the preferential tariffs.
In accordance with Protocol 3 of the association agreement, Tunisia applies preferential tariffquotas to several agro-food products originating in the EU. With respect to meat, dairy products,

103
cereals and sugar, which are also covered by WTO tariff quotas, exports from the EU may draweither on the WTO quota or on the preferential quota. However, EU exports under preferentialtariff quotas are zero-rated; moreover, these quotas also cover other agricultural products such aseggs, poultry, potatoes, hazelnuts, maize (corn), meal, malt, starch, certain flours, fats, oils,glucose and dog and cat food.
For Tunisian agricultural exports to the European market, a new regime of trade implementedon 8 March 2001 ratified the association agreement between the parties through the modificationof the agricultural protocols annexed to the 1995 association agreement. In this respect, exportquotas, tariff reductions and schedules for products exported by Tunisia to the EU are indicated inthe first draft (protocol) of the agreement. For olive oil, the agreement clauses specify: (i) theinstitutionalization of the quota regime and permanent integration of these products in theassociation agreement, and (ii) increasing the quota from 50,000 t as of 1 January 2001 to 56,000 ton 1 January 2005, with a complete exemption from custom duties.
Protocol 2, which concerns fishing products, stipulates that fishing products from Tunisia maybe admitted to the EU with no quantitative limit and totally exempt from custom duties.Furthermore, the two parties agreed to examine in 2005 the possibility of granting each othermutual concessions in order to liberalize their trade in agricultural and fishing products. Thesenegotiations are still in progress, and no agreement has been reached to date.
It is important to note that the agricultural sector in Tunisia is affected by the general scarcityof water and arable land, occasional drought and natural resource degradation, all of which limitthe ability of Tunisian farmers to take advantage of further concessions by the EU. (Olive oil,however, is one product for which EU concessions could generate immediate benefits for Tunisianfarmers.) Furthermore, the integration of agricultural products into the FTA cannot be separatedfrom the issue of the support paid by the EU to its farmers. Without a substantial reform of thecommon agricultural policy, most agricultural activities in Tunisia will not be able to confront theEuropean competition, particularly in products that are highly subsidized in Europe.
GAFTAThe executive programme of the Convention on the Facilitation and Development of Inter-ArabTrade entered into force in January 1998; it is currently being applied by 17 of the 22 members ofthe League of Arab States. The GAFTA is a new Arab League initiative that aims to revive previouslyunsuccessful attempts at regional integration. According to the agreement, all Arab productsmoving among the members will be afforded the status of national goods in accordance with theprinciple of gradual liberalization through an annual reduction of 10% of customs duties and taxesthat have equivalent tariff effects. Initially, goods are scheduled to be traded duty free among themembers by 2007, but the Economic and Social Council decided, at its 69th meeting, in Cairo, toaccelerate the establishment of GAFTA, setting 2005 instead of 2007 as the deadline for the launch.In 2004, it was planned that all the Arab countries that had joined GAFTA would reduce theircustoms duties on bilateral trade by 80% and completely eliminate all tariffs by 2005.
Trade provisions for agricultural trade under the agreement offer members the opportunity tosuspend tariff reductions on some products during peak harvest seasons. In this regard, eachmember is allowed to submit a list of ten products for suspension, with a total exemption for allthese products for 45 months.
FTA with the European Free Trade AssociationThe member states of the European Free Trade Association – Iceland, Lichtenstein, Norway andSwitzerland – signed an FTA with Tunisia in Geneva on 17 December 2004. Negotiations on theEuropean Free Trade Association-Tunisia Free Trade Agreement were launched in Tunis in October1996 and were concluded in 2004 after six rounds of negotiations. The agreement covers trade inindustrial goods, as well as processed agricultural products.
The agreement takes into consideration the different levels of economic development of themembers of the European Free Trade Association on the one hand, and Tunisia on the other, byproviding for asymmetric tariff reduction. The states of the association will eliminate duties andother restrictions for covered products upon entry into force of the agreement, while Tunisia will
CHAPTER 6: AGRICULTURE, TRADE AND POVERTY IN TUNISIA

104
gradually abolish its duties during a transition period. The agreement contains rules of origin onthe model of the Euro-Mediterranean accumulation system. Trade in basic agricultural products iscovered by arrangements concluded bilaterally between each association state and Tunisia.
FTA with TurkeyThe association agreement establishing a free trade area between Tunisia and Turkey was signed on25 November 2004. The agreement covers provisions on preferential trade, state monopolies,competition and state aid, intellectual property rights, public procurement and economic andtechnical cooperation. With this agreement, Tunisia and Turkey aim at strengthening cooperation,removing trade barriers, including agricultural trade, establishing appropriate conditions forcompetition and promoting bilateral investments. A free trade area will be created within nine yearsfollowing the entry into force of the agreement.
Protocol II of the agreement establishes a preferential trade regime that will be applied toagricultural trade. Concessions are exchanged for a given number of agricultural, fishing and processedagricultural products on the basis of tariff quotas. This agreement entered into effect in June 2005.
6.4 PovertyTunisia has made significant progress in reducing poverty. It cut the incidence of poverty (definedusing the national poverty line) from 40% in 1960 to 11% in 1985 and to 7.4% in 1990. Thepoverty rate stagnated between 1990 and 1995 (8.1%),33 but resumed its decline between 1995 and2000, when incidence reached the lowest level (4.1%). At the same time, the population growthrate declined, and life expectancy increased markedly, regional disparities were reduced andimprovements were achieved in education, access to health care and basic infrastructure. Thedistribution of income improved until 1990, as the Gini coefficient fell from 0.434 in 1985 to0.401 in 1990, but increased to 0.417 in 1995 and fell again to 0.409 in 2000. Average per capitaexpenditures for the lowest deciles of the population moved closer to mean expenditures for thecountry as a whole. In absolute terms, the number of the poor increased from 600,000 in 1990 to690,000 in 1995 and fell to 400,000 in 2000 (World Bank 2003a). Given that the distribution ofconsumption is quite steep near the poverty line, many households are vulnerable to sliding backinto low incomes.
As is well known, changes in poverty depend upon income growth and changes in incomedistribution. The elasticity of poverty to growth was found to be negative in Tunisia, as in mostcountries. Therefore, the positive growth in per capita income over 1990-95 should have resulted indeclining poverty, all else being equal (Van Eeghen 1995). However, due to the increase of inequalityin income distribution, poverty may have risen between 1990 and 1995. This deterioration wasmainly due to the drop in agricultural incomes, which reduced the incomes of poor households moresignificantly than it did those of other households. During 1995-2000, the acceleration in growth andthe decrease in income inequality may explain why poverty incidence fell so significantly.
Regarding the characteristics of the poor in Tunisia, poverty remains primarily a ruralphenomenon. In 2000, the incidence of rural poverty was 8.3% compared to 0.8% in metropolitanareas and 2.3% in other urban areas (Table 6-8). With less than 40% of the total population, ruralareas accounted for 74% of the poor in 2000 compared to 76% in 1990 (World Bank 2003a).
There is a strong association between the lack of schooling and poverty in both rural and urbanareas. Over 60% of poor household heads have no formal education, compared to about 40% ofnon-poor household heads. Poor rural households engaged in production activities typically haveaccess to land, but their land holdings are small (averaging 2 ha), rarely irrigated and often exhibitlow productivity, especially in rainfed areas.
The urban poor are mostly wage-earners in low-skill occupations. According to data from theInstitut National de la Statistique (INS 2002), between 1990 and 1995, the incidence of povertyincreased in the agricultural, fishing and construction sectors and fell in tourism and commercialactivities. In 2000, the poorest households were still concentrated in the construction andagricultural sectors.
33/ Using a new World Bank and Institut National de la Statistique poverty line (World Bank 2003a).

105
The five-year censuses on household budgets and consumption conducted by the InstitutNational de la Statistique during 2000 show that the average annual expenditures per capitaamounted to TND 1,329, recording an improvement of 6.5% at current prices and 3.6% at constantprices compared to the same census conducted in 1995. The results show also that the increase inthe level of expenditures per capita was larger in rural areas (10%) than in urban areas (5.9%),which means there was a reduction in the gap between the two areas. The expenditures per capitain rural areas represented 58% of the expenditures per capita in urban areas in 2000. This share hasbeen estimated at 48% in 1995.
Table 6-9 gives the annual expenditures per household and per capita in 2000 according to thesocioprofessional category of the head of household. The table shows that the lowest level ofexpenditures concerns households in which the heads are unemployed, followed by those in whichthe heads are working in the agricultural sector as wage-workers. Poverty is closely linked tounemployment in Tunisia. Households with an unemployed head have a very high probability ofbeing poor (World Bank 2003a).
CHAPTER 6: AGRICULTURE, TRADE AND POVERTY IN TUNISIA
TABLE 6-8Poverty lines and poverty incidence, 1990, 1995 and 2000
Year Lower poverty lines Poverty incidence (%)(core poverty) (TND)
Metropolitan 1990 236 2.81995 306 1.82000 357 0.8
Other urban 1990 210 3.51995 272 4.22000 318 2.3
Rural 1990 194 14.81995 252 15.82000 294 8.3
Source: World Bank (2003a).
FIGURE 6-1Evolution of poverty in Tunisia (1990-2000)
Source: World Bank (2003a).
0
2
4
6
8
10
1990 1995 2000
Poverty incidence (%)
Number of poor (100 000)

106
6.5 Impact of trade liberalization on the poorThis section presents the results of a microsimulation analysis of the impact of trade liberalizationon Tunisian households.34 First, we briefly describe the methods used to generate the estimates. (Amore detailed description is found in the annex to this chapter.) Then, we describe the results ofthe simulations of four different types of trade liberalization. The impact is assessed in terms ofmacroeconomic variables, sectoral production, import and export values and the incidence ofpoverty among different socio-economic groups.
6.5.1 MethodsThis analysis involves using a CGE model to simulate the effect of four types of trade liberalizationon the Tunisian economy and households. The CGE model is built on a SAM calibrated to describethe Tunisian economy in 1996. It is a standard neoclassical CGE model, with imperfectsubstitution in consumption between imported and domestic goods and imperfect substitution inproduction between exports and production for the domestic market. Production combines rawmaterials and factors of production in fixed proportions, while the use of different factors variesaccording to relative factor prices. There are five categories of labour:
• farmers;• unskilled agricultural wage-earners;• skilled agricultural wage-earners;• unskilled non-agricultural workers; and• skilled non-agricultural workers.
Other factors are land, physical capital and natural resources. The model covers eleven agriculturaland processed food commodities and three non-agricultural products. It uses an infinite elasticityof substitution of capital between sectors, which means there is perfect mobility of physical capitalamong the different sectors.
In order to estimate the distributional impact of trade policy, data from 400 households areintegrated into the CGE model. These 400 households are a representative sample from the 1995Tunisian household expenditure survey. The survey contains detailed expenditure data, but notincome data. Thus, it was necessary to generate estimated income data based on survey informationon the main economic activity of each member of the household.
34/ The model used here has been developed through a study funded by the Poverty and Economic Policy Research Network(see Chemingui and Thabet 2006).
TABLE 6-9Household expenditures by occupation of the head of household
Socio-professional category of the household head Expenditure Expenditure (TND/month/household) (TND/month/person)
Senior managers and liberal professions 13 227 2 846Middle managers and liberal professions 10 151 2 110Other employers 8 182 1 597Small businessmen 8 064 1 537Artisans and independents 6 175 1 176Non-agricultural workers 5 365 1 036Farmers 5 732 1 024Agricultural workers 3 986 731Active labour force participants without jobs 3 329 656Retirees 7 590 1 744Other inactive workers 3 992 1 387Income coming from outside the household residence 4 320 1 064Average 6 450 1 329
Source: INS (2002).
Note: In 2000, the average exchange rate was TND 10.64 per US$1.00.
107
While this tool does not take into account many dynamic effects that will intervene during theliberalization process, it nevertheless allows measurement of the total gain related to the reallocationof production factors as a result of tariff reductions or tariff dismantling. The static analysis allowsus to determine the loss in customs income linked to the trade liberalization. This analysis dependsequally on the income available to households after the reform. If one thinks that consumers andbusinesses cannot substitute one product for another, this loss will be equal to the share of tariffincome coming from importing European products in the sum of all tariff income (Dessus andSuwa Eisenmann 2000). The household survey data, the SAM and the CGE model are described inmore detail in the annex to this chapter.
It is important to note that this is a static model that does not take into account the effect oftrade liberalization on investment or on the rate of adoption of new technology. To the extent thattrade liberalization encourages investment or accelerates the adoption of technology, as somestudies suggest, the model will understate the welfare benefits of liberalization.
6.5.2 ResultsWe analyse the impact of four alternative types of trade liberalization. Each scenario providesempirical estimations of the potential trade liberalization of agricultural products either with asingle partner or with various partners at the same time. These scenarios are:
1) elimination of tariffs on imports of industrial products from the EU as specified in thepartnership agreement signed between the two partners;
2) elimination of tariffs on imports of industrial and agricultural products from the EU;3) elimination of tariffs on imports of industrial and agricultural products from the EU and the
rest of the world; and4) elimination of tariffs on imports of industrial and agricultural products from the EU and the
rest of the world, together with multilateral trade liberalization, which is assumed to increaseinternational prices for all agricultural products by 15%.
Scenario 1In this scenario, Tunisia eliminates tariffs on industrial products from the EU, according to theprovisions of the FTA. According to Table 6-10, this trade policy change has a relatively weakmacroeconomic impact. Economic activity improves somewhat; there is an increase of 0.2% inGDP relative to the base year (1996). The total production of goods and services shows a moreimportant improvement, at a rate of 3.7%, whereas the value of final consumption falls by 1.9%relative to the base year.
Agricultural production does not appear to be stimulated by the increase in the openness ofthe Tunisian economy to trade and partnership with Europe since it remains largely outside theliberalization process in this scenario. Moreover, mobile production factors (physical capital andcasual labour) are drawn to industry, which causes a drop in domestic production in mostagricultural activities. Agricultural production is either stable or declines somewhat, with theexception of grains and “other agricultural activities” (Table 6-11).
Although total exports increase significantly (by 23%) relative to the base scenario, the increaseis due largely to the industrial sector. Agricultural export performance is mixed: exports of grain,vegetables and dairy products expand, while fishing and meat exports decline. These gains are dueto the reduction in prices of imported input products and a lessening of the distortion in non-agricultural trade (Table 6-12).
Overall, poverty declines slightly, from 6.8% to 6.7%. The gains in poverty reduction occuramong farmers, agricultural wage-earners and non-agricultural wage-earners. There is a slightincrease in poverty among two categories: (i) managers, professionals and self-employed people,and (ii) retirees, the unemployed and “other”. Since poverty declines among the poorer categoriesand rises slightly among the two more well-off groups, it appears that the liberalization of importsof industrial products from the EU reduces income inequality somewhat (Table 6-14).
CHAPTER 6: AGRICULTURE, TRADE AND POVERTY IN TUNISIA

108
Scenario 2In this scenario, the model is used to simulate the elimination of all tariffs on imports from theEU, including tariffs on industrial and agricultural products. This scenario can be seen as areinforcement of the FTA between the two partners. As shown in Table 6-10, this simulation alsohas a weak macroeconomic impact. Real GDP expands by an additional 0.1 percentage pointscompared to Scenario 1 (the liberalization of industrial imports from the EU). The cumulativeeffect of this reform is relatively modest; there is only a 0.3% improvement in GDP compared tothe base year. The loss in customs income represents almost 80% of total government customsincome in 1996. Only 8.6% of these losses are attributed to the liberalization of trade inagricultural products.
Overall output increases by 4.1% relative to the base (0.4% compared to Scenario 1). Thisincrease in production shows the extent to which lowering tariffs might improve the efficiency offactor allocation through a movement towards more profitable and more competitive activities.However, the production of fish, meat, dairy, and beverages and tobacco declines as a result of thereduced protection from imports from the EU. There is little change in the output of grains, pulses,fruits, vegetables and olive oil (Table 6-11).
TABLE 6-10Impact of trade liberalization on macroeconomic variables
Simulation
Base scenario 1 2 3 4
(% change relative to the base scenario)
Real GDP (TND million) 19 210 0.2 0.3 0.2 0.2Total output (TND million) 37 416 3.7 4.1 5.6 5.2Total final consumption (TND million) 14 586 -1.9 -1.7 -1.6 -1.9Total exports (TND million) 8 029 23.2 26.1 31.9 30.8Total imports (TND million) 8 326 15.9 17.9 22.0 20.6Absorption (TND million) 37 713 0.8 0.9 1.5 1.2GDP deflator (index) 1.00 3.4 3.1 4.2 5.1Consumer price index (index) 100.0 -2.3 -3.5 -4.1 -3.0Tariff revenue (TND million) 1 327 -71.0 -79.7 -92.9 -92.6
Source: Author calculations.
Note: Simulation 1 is the removal of tariffs on industrial goods from the EU. Simulation 2 is the removal of tariffs on all goods from the EU.Simulation 3 is the removal of tariffs on all goods from all countries. Simulation 4 is the removal of tariffs on all goods from all countries, plusmultilateral trade liberalization.
TABLE 6-11Impact of trade liberalization on food and agricultural production by sector
Simulation
Base value 1 2 3 4
(TND million) (% change relative to the base scenario)
Grains 811 4.6 0.9 -6.7 -0.6Pulses 32 -1.8 -0.8 -0.1 -1.8Fruits 840 -2.4 -1.8 -1.9 3.1Vegetables 526 -0.9 0.0 0.0 -1.6Other agricultural activities 29 7.5 4.1 6.7 -1.4Fishing 276 -6.4 -6.5 -8.5 -8.7Meat 633 -4.1 -8.2 -8.7 -8.0Dairy products 191 0.1 -14.7 -20.4 -13.5Olive oil 160 -0.6 -0.7 -0.6 2.6Sugar 141 -1.3 -2.9 -6.6 3.2Other food processing 2 247 -2.3 1.0 2.4 -0.8Beverages and tobacco 228 -4.0 -7.6 -7.7 -6.7
Total 6 116 -1.5 -1.7 -2.6 -1.9
Source: Author calculations.
Note: Simulation 1 is the removal of tariffs on industrial goods from the EU. Simulation 2 is the removal of tariffs on all goods from the EU.Simulation 3 is the removal of tariffs on all goods from all countries. Simulation 4 is the removal of tariffs on all goods from all countries, plusmultilateral trade liberalization.

109
Imports of fruit, vegetables, meat, dairy products, vegetable oil, beverages and tobacco increasesubstantially due to the reduction of import barriers on agricultural products (Table 6-13). Mostagricultural exports, except fishery products, also expand (Table 6-12). This illustrates the conceptin international trade economics that a tax on imports is an implicit tax on exports. In this case,removing import tariffs increases the demand for foreign currency, causing a depreciation of theexchange rate and stimulating exports.
In general, the effect of this reform on poverty is quite similar to that of Scenario 1: farmersand wage-earners gain, while managers, professionals and self-employed workers lose. The neteffect is a small reduction in overall poverty, a direct consequence of the decline in the prices ofimported agricultural and industrial products. This decline affects final household consumption asmuch as it does equipment and intermediary consumption linked to production operations.
CHAPTER 6: AGRICULTURE, TRADE AND POVERTY IN TUNISIA
TABLE 6-12Impact of trade liberalization on food and agricultural exports by sector
Simulation
Base year 1 2 3 4
(TND million) (% change relative to the base scenario)
Grains 2.5 23.3 49.6 84.3 159.6Pulses 1.9 5.7 18.6 28.6 95.7Fruits 57.1 0.1 5.7 6.8 30.9Vegetables 5.8 11.2 22.2 24.9 8.4Other agricultural activities 9.2 18.2 28.0 38.4 5.1Fishing 21.3 -19.8 -20.1 -27.4 -26.3Meat 1.6 -8.5 -4.2 -2.8 74.6Dairy products 1.8 12.5 17.5 21.3 132.5Olive oil 117.1 -2.9 2.5 4.7 18.8Sugar 3.6 3.2 14.5 14.0 128.5Other food processing 153.8 0.1 25.0 37.0 12.1Beverages and tobacco 16.9 1.6 3.2 4.5 9.5
Total 392.6 -1.0 12.0 17.8 17.6
Source: Author calculations.
Note: Simulation 1 is the removal of tariffs on industrial goods from the EU. Simulation 2 is the removal of tariffs on all goods from the EU.Simulation 3 is the removal of tariffs on all goods from all countries. Simulation 4 is the removal of tariffs on all goods from all countries, plusmultilateral trade liberalization.
TABLE 6-13Impact of trade liberalization on food and agricultural imports by sector
Simulation
Base year 1 2 3 4
(TND million) (% change relative to the base scenario)
Grains 249 -6.9 -1.3 4.7 -4.9Pulses 70.6 -4.5 -4.5 13.6 -9.1Fruits 8 -7.0 63.0 203.3 215.5Vegetables 13 -5.8 14.1 13.2 17.9Other agricultural activities 20 0.8 24.2 37.5 46.2Fishing 1.6 2.4 1.6 4.0 2.4Meat 9.9 -2.3 163.5 165.2 106.6Dairy products 27.9 -4.8 59.7 76.4 46.8Vegetable oil 0 4.1 21.2 36.7 25.0Sugar 87.4 -3.4 -1.6 11.5 -6.1Other food processing 258.3 -2.0 -9.9 -12.3 -7.4Beverages and tobacco 7.2 4.2 103.6 105.3 103.8
Total 752.9 -4.1 2.5 9.3 2.2
Source: Author calculations.
Note: Simulation 1 is the removal of tariffs on industrial goods from the EU. Simulation 2 is the removal of tariffs on all goods from the EU.Simulation 3 is the removal of tariffs on all goods from all countries. Simulation 4 is the removal of tariffs on all goods from all countries, plusmultilateral trade liberalization.

110
Scenario 3In this scenario, we extend the elimination of Tunisian tariffs on EU imports to all imports. Thiscauses an improvement in the global activity of the country by 0.2% relative to the base year.Furthermore, the total production of goods and services increases by 5.6% relative to the base year,which indicates an additional gain of 1.5 percentage points compared to the previous simulation.Total exports increase 32%, while imports grow by 22%, a significant increase relative to theprevious simulation. Lower tariffs on imports from the rest of the world increase the demand forimports and, hence, foreign exchange. The resulting depreciation makes exports more competitive.This reform induces a loss in customs income by around 93% relative to the base year.
At the sectoral level, this reform entails a drop in domestic production in most agriculturalactivities. This decrease is explained by the weak capacity of the Tunisian agricultural sector inresource reallocation. In other words, the agricultural land suitable for cultivation in Tunisia ischaracterized by an almost fixed distribution of productive capacity. Thus, if, for example, theproducer price of cereal products rises relative to that of vegetables, the reassignment of availableland from the cultivation of vegetables towards cereal production is limited, even impossible.Accordingly, adjustments in Tunisian agriculture in reaction to changes in relative prices are morethe result of changes in consumption levels rather than changes in production levels. The effect ofthis reform on poverty is to consolidate the observed tendencies in the preceding scenario. Thus,farmers’ incomes are improved due to higher prices for exports and lower costs for imported inputs.This mostly affects the prices of seeds and cattle feed.
Scenario 4Along with the import liberalization in Scenario 3, this last scenario simulates an increase in theprices of the main basic agricultural products as a result of a multilateral liberalization of trade inagricultural products. The analysis of the implications of agricultural trade liberalization for acountry must not be limited to the mere removal of tariffs and non-tariffs barriers imposed onimported products. Through trade, the trade balance situation in agricultural products for a smallcountry such as Tunisia is largely determined by world prices. The significant agriculturalprotectionism in rich exporting countries on basic agricultural products has depressed worldagricultural prices, which penalizes all farmers by shrinking the world market. Protection has alsoproduced much greater instability in world prices, which contributes to a vicious circle ofprotection. We simulate, here, an increase in the world prices of basic agricultural productsresulting from free world agricultural trade and the removal of all distortions that affect theproducts. The recorded average increase of 15% in the world prices of basic agricultural productsat the end of the multilateral reform in this simulation is a moderate increase given the extent ofthe distortions currently affecting world trade in agricultural products.
Total production in goods and services rises by 5.2% relative to the base year, a net reduction of0.4% compared to Scenario 3. Imports rise by 20.6% and exports increase by 30.8% relative to the
TABLE 6-14Impact of trade liberalization on the incidence of poverty by occupation
Poverty in Simulation
Type of household base year 1 2 3 4
(incidence of poverty, %)
Managers, professionals and the self-employed 3.9 4.0 4.0 4.0 4.1Wage-earners in non-agricultural sectors 9.7 9.6 9.6 9.5 9.2Retirees, the unemployed and “others” 3.9 4.2 4.3 4.3 4.9Farmers 9.5 9.3 9.3 9.2 9.0Wage-earners in the agricultural sector 7.4 7.2 7.1 7.0 6.3
Average 6.8 6.7 6.7 6.5 6.0
Source: Institut National de la Statistique and author calculations.
Note: Simulation 1 is the removal of tariffs on industrial goods from the EU. Simulation 2 is the removal of tariffs on all goods from the EU.Simulation 3 is the removal of tariffs on all goods from all countries. Simulation 4 is the removal of tariffs on all goods from all countries, plusmultilateral trade liberalization

111
base year. This reform enhances the competitiveness of domestic agricultural production, relative tothe base year, in relation to imports of three categories of agricultural products: fruits, olive oil andsugar, which witness a net increase in production. This also entails a rise in the consumption pricesof the main agricultural products, which, consequently, implies a reduction in the internal demandfor these products, such as cereals. Thus, the reduction in production on the one hand, and therelatively significant decrease in the consumption of the main food products on the other hand, leadto an increase in export levels as a net result of the rise in export prices. This situation was actuallyobserved for olive oil in Tunisia during the 2005 agricultural year, when the high level of exportprices led to a rise in consumption prices, which curbed local demand and, consequently, increasedexports. This scenario thus results in a favourable income gain for agricultural households becauseof the rise in world prices, while urban households witness a deterioration in their purchasing powerfollowing the rise in the consumer prices of most agricultural products.
Therefore, this scenario shows a reduction in poverty among farmers due to higher agriculturalprices and a reduction in poverty among agricultural and non-agricultural wage-earners due toincreased demand for labour and the increase in wages. The overall poverty rate declines from6.8% to 6.0%.
6.6 SummaryTunisia has carried out a number of reforms as a result of its structural adjustment programme, butthe level of agricultural protection remains one of the highest in the world. At the same time,Tunisia has a relatively good investment climate, which contributed to significant inflows of foreigndirect investment and a healthy growth rate through the 1990s.
Like many NENA13 countries, Tunisia is a net agricultural importer. Its main exports are olivesand dates, and the principle imports are wheat and maize. Multilateral liberalization is expected toraise agricultural prices. If all agricultural commodity prices rise proportionately, Tunisia will facedeclining terms of trade because it is a net agricultural importer. On the other hand, it wouldbenefit from domestic liberalization due to efficiency gains. The combined effect is likely to bepositive for Tunisia as a whole because most estimates show that efficiency gains are larger thanterms-of-trade effects.
However, the combination of global and domestic liberalization would probably reduceagricultural prices because the effect of the loss in high levels of protection (89% on average) wouldbe greater than the modest increase in world prices (5-20%) due to global liberalization.
Simulations using a CGE model linked to household survey data suggest that the removal ofindustrial tariffs on imports from the EU (which approximates the effect of the EMP agreement)would cause both imports and exports to expand significantly, although almost all the changewould be in non-agricultural trade. Real GDP would increase slightly (0.2%) because of theefficiency gains associated with the removal of distortions. Poverty would decline from 6.8% to6.7%; the largest improvements would occur among farmers and agricultural wage-earners.
The removal of all tariffs on imports from the EU (approximating an extended EMP agreement)would cause large increases in imports of meat, beverages and tobacco, fruit, dairy products andvegetable oil as import barriers on these goods are lifted. The effect on GDP and poverty is similarto that in the first simulation.
The elimination of tariffs on imports from all countries would increase the imports of almostall agricultural commodities, as well as stimulating agricultural exports to maintain the tradebalance. The reduction in poverty would be greater in this case than in the case of the first twosimulations: poverty would decline from 6.8% in the base scenario to 6.5%. Farmers andagricultural labourers would again account for most of the poverty reduction.
Finally, the elimination of all Tunisian tariffs, plus global trade liberalization (represented bya 15% increase in world agricultural prices), would not do much for the overall economy. This ispartly because, as a net agricultural importer, Tunisia would lose out from higher world agriculturalprices. Nonetheless, the agricultural sector would gain from the higher prices. The three mainagricultural exports (olive oil, other processed foods and fruit) would expand significantly in thisscenario. As a result, poverty would decline to the lowest level among the four scenarios: 6.0%among the overall population and 9.0% among farmers.
CHAPTER 6: AGRICULTURE, TRADE AND POVERTY IN TUNISIA

112
Overall, it appears that trade liberalization has only modest effects on the level of GDP, but ithas a substantial effect in reducing poverty. Furthermore, the combined effect of global anddomestic liberalization is more pro-poor than the effect of domestic liberalization alone.
We draw two general implications from the Tunisia case study. First, the impact on ruralpoverty of trade liberalization may be quite different from the impact one might assume based onsimple indicators. As a net importer of agricultural commodities, Tunisia may be expected toexperience terms-of-trade losses from higher world agricultural prices. Furthermore, becauseTunisia has significant agricultural import protection, we would expect the agricultural sector tolose from trade liberalization that would remove this protection. Yet, the simulations suggest thattrade liberalization reduces poverty among farmers and wage-earners in the agricultural sector.
Second, the positive outcome of these simulations is partly based on the ability of farmers toreplace activities that were once protected, such as wheat and livestock production, by activitiesinvolving export commodities such as olives, dates and citrus. The need to facilitate thereplacement of one set of activities by another highlights the importance of farmer training,marketing information systems and extension services, as well as farm-level investments and thepublic infrastructure necessary to expand the newly competitive crops.

113
Annex to Chapter 6Method for estimating the impact of trade liberalization on Tunisia
Background on Micro-Macro LinkagesThe most comprehensive way of modelling the overall impact of policy changes on the economyis through a CGE model, which incorporates many of the important general equilibriuminteractions in an economic system. To measure distributive impacts, CGE models often map factorincomes among different types of households. The models have been applied in the analysis ofpolicy changes in several developing countries. The change in the cost of living among segments ofa population is then used to assess the impact on income distribution. These studies provide anupper-bound measurement of the required increase in income for each group to purchase the samequantities of goods that they purchase in the base situation.
Decaluwé et al. (1999) have evaluated the relevance of different types of macroeconomicgeneral equilibrium modelling for measuring the impact of economic policy shocks on theincidence of poverty and on the distribution of income. Three approaches have been identified inthe literature and implemented using an archetypal economy, as follows:
• The first is based on a traditional form of the CGE model that specifies a large number ofhouseholds, thus allowing the capture of only inter-group income inequalities.
• The second uses survey data to estimate the distribution function and average variations bygroup, thereby allowing for estimates about the evolution of poverty.
• The third approach uses individual datasets directly in the general equilibrium modelaccording to the principles of microsimulation.
Studies have demonstrated the importance of intra-group information and therefore the relevanceof microsimulation exercises. Even if we disaggregate the population of households into a fewrepresentative groups, we will still not be able to obtain relevant results regarding the evolution oftotal inequality. Indeed, decomposable income indexes show that intra-group inequality oftencontributes more to total inequality measures than does inter-group inequality. Accordingly, themost promising direction consists in seeking true integration between the CGE model and theobserved heterogeneity of households as observed in a household survey.
There are two main ways to achieve consistency between a macroeconomic framework andmicroeconomic surveys, as follows:
• The first one, proposed by Cogneau and Robilliard (2000), has been labelled the “fullyintegrated micro-macro framework”. It is based on a standard CGE model whereinrepresentative households and workers are replaced by a full sample of households andworkers, whose behaviour is observed through household and labour force surveys. Theadvantage of this method is its ability to capture the impact of macroeconomic changes onworkers and households and, also, the feedback effects of microsimulation on themacroeconomic portion of the model. However, the method is very demanding incomputational resources and requires the construction of a relatively simple CGE model.
• The second approach is the “sequential micro-macro framework”. The macroeconomic part ofthe model is an extended CGE model that is supposed to describe the functioning of theeconomy under analysis. The link with the microsimulation model occurs through a vector ofprices, wages and aggregate employment. If one understands the change in the link variablesas resulting from a shock in the macroeconomic part of the model, one may modify themicroeconomic household database in a way that is consistent with the link variables. Theapproach combines a standard multisector CGE model with a microsimulation model thatdescribes real income generation behaviour among a representative sample of households.The microsimulation model will be used to generate changes in individual wages andemployment status in a manner that is consistent with the set of macroeconomic variables inthe macroeconomic or CGE model. When this is done, the full distribution of the realhousehold income corresponding to the shock or policy change initially stimulated in themacroeconomic model may be evaluated (Bourguignon, Robilliard and Robinson 2002).
CHAPTER 6: AGRICULTURE, TRADE AND POVERTY IN TUNISIA - ANNEX

114
In building a CGE microsimulation model to assess the impact on poverty of trade policy reformsand external shocks in Tunisia, we have chosen to adopt the first approach, the fully integratedmicromacro framework, which involves incorporating a representative sample of householdsdirectly into the CGE model.
Tunisian household budget and expenditure surveysThe microsimulation approach requires data on income and expenditure patterns amonghouseholds in a sample. In the case of Tunisia, the available quantitative data from householdbudget surveys are limited to the expenditure side. Quantitative information on income sources, aswell as on the level of savings (or debt), are not collected in Tunisian household budget surveys.However, important qualitative data allows an estimation of the different income sources. Webelieve that the mistakes linked to problems of estimation on the different income positions ofhouseholds are much less important than the mistakes relative to ignorance of the income effectsin the analysis of the evolution of poverty.
Seven national household expenditure surveys have been carried out: 1968, 1975, 1980, 1985,1990, 1995 and 2000. An eighth survey covering the year 2005 is under way. The informationgathered through direct observation of household consumption allows changes in living standardsand welfare among households to be measured.
The method of data collection consists of interviewing households during many visits. Thedirect observation of the expenditures of each sample household lasts four weeks. Nonetheless, forlarge expenditures that are made less frequently, such as the purchase of durable goods, theobservation period lasts one year; in this case, the month long enquiry is supplemented withretrospective accounts on the 11 months preceding the start of the survey. The part of the surveythat is devoted to food consumption relies on measuring the food intended for householdconsumption ration by ration and day by day during a week for each sample household.
The survey questionnaire on household budgets and expenditures consists of a mainquestionnaire aimed at recording collective household expenditures and a complementaryquestionnaire aimed at registering the individual expenditures of each household member with anincome.
For the part of the main questionnaire relative to expenditures, information is requested on theexpenditures each household member makes to satisfy his needs and the needs of those householdmembers in his charge, notably, the expenditure categories of a collective nature (e.g., food,housing, services). The main survey questionnaire is composed of four sections: the householdroster, the economic activities of members aged 15 years and over, the economic characteristics ofactive work force members, and information on regular household expenditures (INS 2002).
Estimation of the micromoduleAs explained above, every five years, the Institut National de la Statistique carries out a survey onhousehold budgets and consumption. The most recent survey was conducted in 2000 and covers asample of 12,018 households. Although the data from this survey were not available for this analysis,we were able to obtain raw data on approximately 400 households from the 1995 householdexpenditure survey. The exploration and manipulation of these data revealed many inconsistencies,which give us some reservations regarding the quality of the data. The sample of 400 households isconsidered representative of the whole sample of 10,415 households surveyed in 1995.
Table 6-15 provides details on the composition of the households according to the occupationof the head of household for the original sample and for the subsample used in this analysis. Thisindicates that the subsample is representative of the larger sample and, presumably, the populationas a whole.
We assume that the total revenue for each household is equal to the total expenditures; weignore savings and debt. Indeed, a homogeneous savings level for all households in the sample willeventually be determined when the SAM is balanced out. Once the total income of each householdis estimated, we move to the estimation of the different sources of income. The qualitativeinformation collected on the professional status of the household head through the Tunisianhousehold survey, as well as on the other household members, allow us to sketch out a table of the

115
35/ The year 1996 is the survey year that is most proximate to the 1995 household expenditure survey, for which a SAM isalready available.
income sources of each member and of the whole household. After constructing a table on theworking members of each household in the available sample, we estimate the income of eachhousehold member. For this purpose, we establish three main income sources: salaries, rents andtransfers. The main source of income in the majority of Tunisian households is salaries. Thus, basedon the results of the employment survey conducted annually by the Institut National de la Statistique,we estimate the income derived from the salaries received by all members of each household withreference to the salary grid for 1996 and 1997 (INS 1998), which shows each professional categoryand the main economic activities. For independent workers who do not earn salaries, we estimatea salary equivalent equal to the salary level for the same activity carried out by a salaried workerwith the same qualifications.
To simplify the estimation process, we assume that only poor households receive transfers,mostly in the form of government aid or transfers by other household members who work abroad(and who represent an important support for this category of households in Tunisia). Moreover,we suppose that poor households do not receive rents. These rents represent the income frominvested capital by capital owners (such as in land). For independent workers in a given economicactivity, two household categories may be distinguished: poor households (in cases where the totalincome only covers part of the salary equivalent that is inferior to the poverty line in Tunisia) andnon-poor households. For non-poor households exercising an independent work activity, theactivity income must exceed the poverty line in Tunisia.
Finally, it is important to specify that the salaries and rents received by each household aredifferentiated according to the economic activities carried out by the members of each householdwho work as wage-earners or as independent workers. Any amounts left over in the total incomeof each household after accounting for the salaries (or equivalent salaries) represents transfersamong poor households and rents among non-poor households.
The SAM for TunisiaIn order to reduce the inconsistencies between the SAM and the 1995 household survey data, wechose to build another SAM for the year 1996.35 This allows us to balance out the SAM using anentropy programme that makes the minimal adjustments necessary in the two datasets so that theyare consistent with each other. The data used to build the detailed 1996 SAM on Tunisia are drawnfrom various sources, including input-output tables, national accounts, the government budget andtrade statistics. The microeconomic SAM for 1996 was constructed in several steps.
In the first step, we construct a microeconomic SAM covering more activities and commoditiesthan the original input-output table established by the Institut National de la Statistique (19 activitiesand the corresponding commodities). The disaggregation of activities and commodities was carried
CHAPTER 6: AGRICULTURE, TRADE AND POVERTY IN TUNISIA - ANNEX
TABLE 6-15Representativeness of the sample by occupation of the head of household
Socio-professional Number of Number of Number of Total populationcategory of the households in the households in the households at thehousehold head whole sample subsample national level
Managers and professionals 2 853 27.4% 108 27.2% 490 100 28.8% 2 570 500 28.5%Other non-agriculturalactivities 2 955 28.4% 111 28.0% 490 300 28.9% 2 725 500 30.3%Farmers 1 349 13.0% 52 13.1% 200 700 11.8% 1 218 100 13.5%Agricultural wage-earners 882 8.4% 33 8.3% 130 800 7.7% 752 100 8.4%Retirees and theunemployed 2 376 22.8% 93 23.4% 387 500 22.8% 1 735 300 19.3%
Total 10 415 100.0% 397 100.0% 1 699 400 100.0% 9 001500 100.0%
Source: Author calculations based on data from the Institut National de la Statistique.
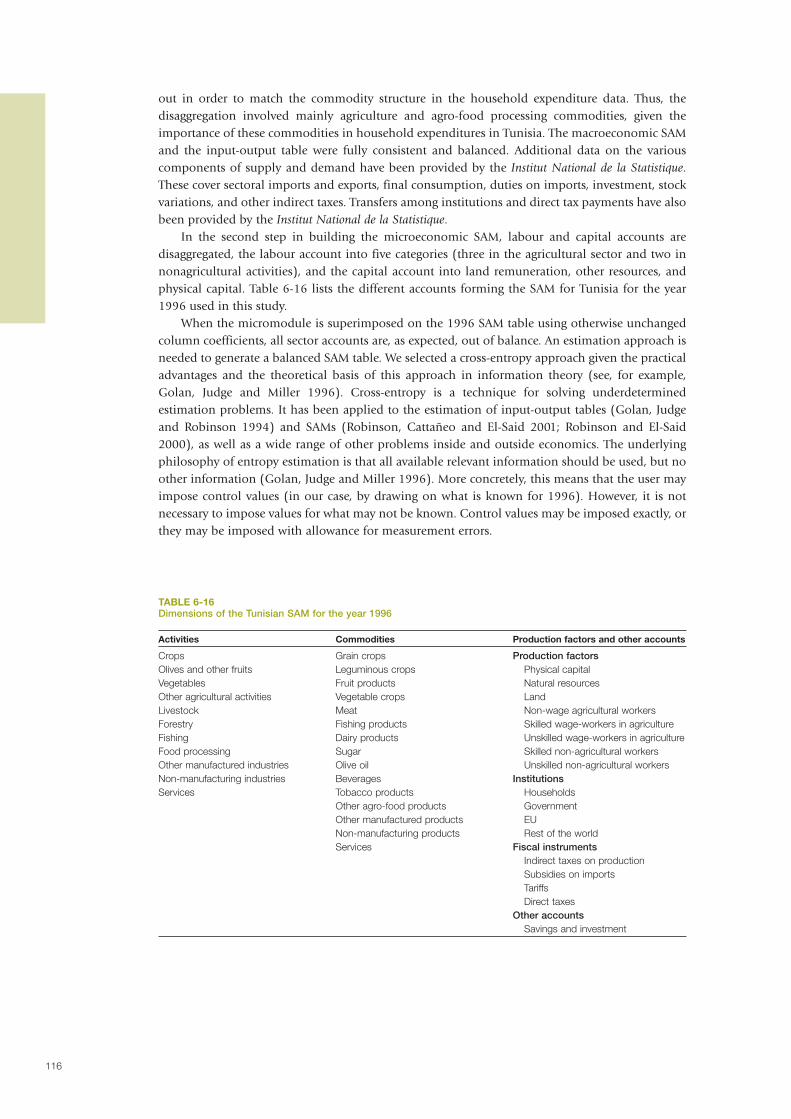
116
out in order to match the commodity structure in the household expenditure data. Thus, thedisaggregation involved mainly agriculture and agro-food processing commodities, given theimportance of these commodities in household expenditures in Tunisia. The macroeconomic SAMand the input-output table were fully consistent and balanced. Additional data on the variouscomponents of supply and demand have been provided by the Institut National de la Statistique.These cover sectoral imports and exports, final consumption, duties on imports, investment, stockvariations, and other indirect taxes. Transfers among institutions and direct tax payments have alsobeen provided by the Institut National de la Statistique.
In the second step in building the microeconomic SAM, labour and capital accounts aredisaggregated, the labour account into five categories (three in the agricultural sector and two innonagricultural activities), and the capital account into land remuneration, other resources, andphysical capital. Table 6-16 lists the different accounts forming the SAM for Tunisia for the year1996 used in this study.
When the micromodule is superimposed on the 1996 SAM table using otherwise unchangedcolumn coefficients, all sector accounts are, as expected, out of balance. An estimation approach isneeded to generate a balanced SAM table. We selected a cross-entropy approach given the practicaladvantages and the theoretical basis of this approach in information theory (see, for example,Golan, Judge and Miller 1996). Cross-entropy is a technique for solving underdeterminedestimation problems. It has been applied to the estimation of input-output tables (Golan, Judgeand Robinson 1994) and SAMs (Robinson, Cattañeo and El-Said 2001; Robinson and El-Said2000), as well as a wide range of other problems inside and outside economics. The underlyingphilosophy of entropy estimation is that all available relevant information should be used, but noother information (Golan, Judge and Miller 1996). More concretely, this means that the user mayimpose control values (in our case, by drawing on what is known for 1996). However, it is notnecessary to impose values for what may not be known. Control values may be imposed exactly, orthey may be imposed with allowance for measurement errors.
TABLE 6-16Dimensions of the Tunisian SAM for the year 1996
Activities Commodities Production factors and other accounts
Crops Grain crops Production factorsOlives and other fruits Leguminous crops Physical capitalVegetables Fruit products Natural resourcesOther agricultural activities Vegetable crops LandLivestock Meat Non-wage agricultural workersForestry Fishing products Skilled wage-workers in agricultureFishing Dairy products Unskilled wage-workers in agricultureFood processing Sugar Skilled non-agricultural workersOther manufactured industries Olive oil Unskilled non-agricultural workersNon-manufacturing industries Beverages InstitutionsServices Tobacco products Households
Other agro-food products GovernmentOther manufactured products EUNon-manufacturing products Rest of the worldServices Fiscal instruments
Indirect taxes on productionSubsidies on importsTariffsDirect taxes
Other accountsSavings and investment

117
In our case, the problem is to estimate a new micromodule with minimum entropy distancerelative to the previous micromodule by drawing on the information presented in the 1996 SAM,subject to the constraint that the row and column totals of the new SAM should be equal for allaccounts and that control values should be satisfied (exactly or by accounting for errors). Theentropy distance depends on the differences between the two tables in terms of column coefficientsand control values. Control values may be imposed exactly, or they may be imposed with allowancefor measurement errors.
CGE model structureThe CGE model used here for Tunisia is a standard neoclassical static model with imperfectsubstitution between domestic and foreign goods. Domestic prices are endogenous on eachmarket (goods and factors). They equalize supply (imports, production for the domestic market,supply factors) and demand (final demand of households, the government, investors and foreignpartners; intermediate demand of producers; factors demand) so as to obtain equilibrium. Theequilibrium is general in the sense that it concerns all markets simultaneously. For instance, adecrease in tariffs will affect the demand for imports of both final and intermediate goods. Thiswill, in turn, affect the supply of domestic goods and the demand for factors in each activity. Thiswill equally affect the price of goods and the income of households, which will, in turn, affecthousehold demand, and so on.
Supply is modelled using nested constant elasticity of substitution functions, which describethe substitution and complement relations among the various inputs. Producers are cost-minimizers, and constant return to scale is assumed. Output results from two composite goods(intermediate consumption and value added), which are combined in fixed proportions. Theintermediate aggregate is obtained by combining all products in fixed proportions. The valueadded is then decomposed into two substitutable parts: labour and capital. The labour market isfurther disaggregated into five categories, and capital into three categories (physical capital, reserveof natural resources, and land). Substitutions among labour categories are implemented through anested constant elasticity of substitution structure for two main activities: agricultural activities andnon-agricultural activities. For agricultural activities, the first level of constant elasticity ofsubstitution function describes the substitution between wage workers and non-wage workers,while the second level describes substitution between skilled and unskilled wage workers. For non-agricultural activities, substitution exists only between skilled and non-skilled wage workers.36
The labour market is modelled according to labour type. For non-wage agricultural workers(farmers), we assume that an economy-wide wage variable is free to vary to assure that the sum ofdemand from all activities equals the quantity supplied, which is fixed. Each activity pays an activity-specific wage that is the product of the economy-wide wage and an activity-specific wage (distortion)term. For the remaining four labour categories, we assume that there is unemployment and that thereal wage is fixed. This assumption is appropriate in the Tunisian case because there is considerableunemployment among all wage-worker categories. Compared to the modelling of non-wageworkers, the only change is that the economy-wide wage variable is fixed (or exogenized), while thesupply variable is flexed (or endogenized). Each activity is free to hire any desired quantity at thefixed activity-specific wage (which, implicitly, is indexed to the model numéraire).
Income from labour and physical capital accrues to households using fixed shares derived fromthe SAM once the micromodule is fully integrated, as well as all rents created by specific capitalfactors (natural resources and land). Total household demand is derived by maximizing the utilityfunction, subject to the constraints of the available income and consumer price vector. Householdutility is a positive function of the consumption of the various products and savings; incomeelasticity for each product is set to unity. Government demand and investment demand aredisaggregated into sectoral demands once the total value is determined according to fixedcoefficient functions.
36/ This static model is intended to capture the short- and medium-term allocative effects of various trade policies. However, itdoes not incorporate some of the expected dynamic effects of trade policies, notably, on productivity, since factors availability andaverage efficiency are fixed in this version of the model. This feature is ignored because, in the long run, household features haveto be changed, and the calibration of the model requires more than one household survey.
CHAPTER 6: AGRICULTURE, TRADE AND POVERTY IN TUNISIA - ANNEX

118
The model assumes imperfect substitution among goods originating in different geographicalareas. Import demand results from a constant elasticity of substitution aggregation function ofdomestic and imported goods. Export supply is symmetrically modelled as a constant elasticity oftransformation function. Producers decide to allocate their output to domestic or foreign marketsin response to relative prices. At the second stage, importers (exporters) choose the optimaldemand (supply) across regions as a function of relative import (export) prices and the degree ofsubstitution across regions. Substitution elasticity between domestic and imported products is setat 2.2, while it is set at 5.0 among imported products according to origin. The elasticity oftransformation between products intended for the domestic market and products for export is 5.0,while it is set at 8.0 among the different destinations for export products.37
Finally, several macroeconomic constraints are introduced into this model. First, the smallcountry assumption holds. Tunisia is unable to change world prices; thus, its import and exportprices are exogenous. Capital transfers are exogenous as well, implying that the trade balance isfixed so as to achieve balance of payments equilibrium. Second, the model imposes a fixed realgovernment deficit and fixed real public expenditures. Public receipts thus adjust endogenouslyin order to achieve the predetermined net government position by shifting the income tax ofhouseholds.38 Third, investment is determined by the availability of savings from households,government and abroad. Since government and foreign savings are exogenous in this model,changes in investment volumes reflect changes in household savings and changes in the price ofinvestment. Policy impacts are compared relative to the situation observed in the base year interms of macroeconomic aggregates, trade volumes, sectoral outputs, household welfare, andpoverty indicators.
37/ In the absence of trade elasticities estimated for Tunisia, we use trade elasticities from the empirical literature devoted to CGEmodels. For example, see Burniaux, Nicoletti and Oliveira-Martins (1992), Konan and Maskus (1997), or, more recently, Gallaway,McDaniel and Rivera (2000).
38/ This closure policy can be understood as a net transfer from households to government (or the reverse). With onerepresentative household, it is considered the most neutral way to assess trade reform. Other closures could be tested (byadjusting indirect taxes for instance), but this would risk introducing new distortions, thereby making it more difficult to isolateconceptually the impact of the trade policy on income distribution and poverty.

Agriculture, Trade and Poverty in Syria
7

120
7.1 IntroductionThe Syrian Arab Republic has approximately 17 million inhabitants, of which about half live inurban areas. Per capita GDP is US$831, above that of the poorest NENA countries (Djibouti,Somalia, the Sudan and Yemen), but below the others. The agricultural sector is relatively large,accounting for 23% of total GDP. This places Syria third after Somalia and the Sudan among theNENA13 countries under consideration.
The Syrian government adopted socialism in the late 1950s and kept control of majorindustries, though private services and retail trade were allowed. The economy has been adverselyaffected by various conflicts in the region, including the Arab-Israeli wars of 1967 and 1973 andthe Syrian intervention in Lebanon from 1976 until 2005. Limited economic reforms and a majorexpansion in oil exports stimulated economic growth in the early 1990s, but growth has beensluggish since then. Although international trade and the exchange rate have been partiallyliberalized, the Government still imposes significant controls on the economy, including pricecontrols, state monopolies in certain sectors, agricultural subsidies and a large number of state-owned enterprises. Overall, per capita GDP grew at 2.2% per year during the 1990s, animprovement over the performance during the 1980s, when it fell in real terms.
Like Jordan, Syria was adversely affected by the end of the United Nations Oil for Foodprogramme in Iraq and the subsequent war in Iraq, which disrupted trade flows. More recently,Syria has benefited from the conflict in Iraq and high oil prices.
7.2 Agricultural sector7.2.1 Agricultural productionWheat is the most important food crop in Syria. Unlike most NENA countries, Syria is self-sufficient in wheat. As discussed below, the self-sufficiency in wheat is the result of policies thatimpose high barriers on imports. Barley and maize are also grown, but domestic production is notsufficient to satisfy demand. Grain production is subject to weather-related fluctuations sincerainfall is unreliable. Syria also produces grapes, apples and olives in the highlands and citrus fruitsalong the coast. Horticultural production is often irrigated. About 23% of Syrian cropland isirrigated, much of this because of the Euphrates Dam built in the 1970s.
The main production units in Syrian agriculture are small and medium-sized farms, as theagrarian reform caused the practical disappearance of traditional large-scale landowners. Betweenthe two available agricultural censuses, conducted in 1981 and 1994, there was a 26% increase inthe total number of farm households, from 486,000 in 1981 to 614,000 in 1994 (Table 7-1). Thepercentage of farmers among whom the main occupation was agricultural and who owned landwas 71% of total farm households with land in 1994 compared to 64% in 1981. Furthermore, 57%of farmers without land stated that their main occupation was farming, compared to only 15% in1981. These changes show the growing numbers of farm households among which the mainoccupation is farming both with land and without land. This is the direct result of the segmentationof land and slow growth in the demand for labour in the non-agricultural sectors.
TABLE 7-1Characteristics of farm households in Syria
1981 1994census census
Total number of farm households (1) 485 691 613 657Farm households with land (2) 409 492 573 193Farm households without land (3) 76 199 40 464Farm households with land and main occupation is agriculture (4) 261 386 409 142Farm households without land and main occupation is agriculture (5) 11 224 22 860Percentage of farm households with land (2/1) 84 93Percentage of land owners for whom agriculture is the main occupation (4/2) 64 71Percentage of landless for whom agriculture is the main occupation (5/3) 15 56
Sources: 1981 census and 1994 census.

121
7.2.2 Agricultural trade patternsThe total exports of Syria were US$7.6 billion in 2002. Oil and fuel account for over half of thetotal value of exports, although it is estimated that existing oil reserves will be exhausted within 12 years at current extraction rates. As discussed in section 3.1.6, Syrian agricultural exports are aboutUS$1 billion; the main commodities are cotton, sheep, tomatoes and anise/fennel (Table 3-9). As agroup, fruit and vegetable exports earn over US$300 million per year. Syrian wheat exportsaveraged US$48 million in value per year over 2000-02.
The total imports in 2002 were US$5.9 The main agricultural imports are sugar, maize and tea(Table 3-9). Unlike most NENA countries, Syria has a modest surplus in agricultural trade,although this is partly due to the tight restrictions on food and agricultural imports. According tothe US Department of Agriculture, imports of processed foods, frozen foods, snack foods, meat,fruits, and vegetables are, in general, prohibited (USDA, 1999).
The principal trading partners of Syria are other Arab countries and the EU. The EU representsthe main market for Syrian exports, accounting for some 60% of exports. The EU is a particularlyimportant market for Syrian oil, but also accounts for a significant share of Syria’s manufacturedexports. The Arab countries are the second largest market for Syrian exports, accounting for slightlyover 20% of total exports. Exports to Arab countries are mainly concentrated in foodstuffs, notablygrain, fruits and vegetables.
7.3 Agricultural and trade policies7.3.1 Agricultural policySyrian agricultural policy is characterized by a high level of government intervention. Before 1987,the prices of many agricultural products, such as grain, fodder, industrial crops, potatoes, garlic andsome fruits, were determined by the Government. Since 1987, a gradual process of economicreform has been under way, and some regulations on production, prices and marketing have beenrelaxed. This process has intensified since 2002, when the Government introduced a package ofreforms aiming to reduce distortions and public intervention in the economy.
On the basis of these changes, the orientation of Syrian economic policy in general, and ofagricultural policy in particular, has focused on price deregulation, a reduction in publicintervention and a gradual reduction in subsidies. We analyse below the main components ofSyrian agricultural policy, focusing on recent reforms, as well as on obstacles that still affect theagricultural sector and farm incomes.
Land-use planningIn Syria, agricultural production is centrally planned by means of land-use plans, which vary fromregion to region. The land-use plans are prepared by the state based on its strategic goals and thetechnical characteristics of farms. The land-use plans often determine other aspects of Syrianagricultural policy, namely, price and credit policy. The state seeks to ensure the achievement of theobjectives assigned to the agricultural sector in the national economic development plan withouttaking into account farmer preferences. The discrepancy between government objectives and farmerobjectives has always been manifested in the flouting of the rules on land use. This situation hasmade it difficult for farmers to acquire the necessary inputs whenever their plans differ from thegovernment land-use plans. In addition, the situation results in weak performance by farms as aresult of the lack of credit and support for unapproved production.
Procurement by state monopoliesWheat, cotton, tobacco and sugar beets are considered strategic commodities. In order to stimulateproduction and control distribution, the state has a marketing monopoly over these products. Theprices of these commodities are fixed using a well-established procedure. First, the cost ofproduction is estimated jointly by the Ministry of Agriculture, the general trade union of farmers,the Ministry of the Economy, the Ministry of Trade, the Ministry of Industry and other institutions.Once the average cost has been estimated, a margin of benefits is fixed for each crop on the basisof the relative importance of the crop in the Syrian economy as measured by the importance ofeach product in the final consumption of households and the demand for these crops as industrial
CHAPTER 7: AGRICULTURE, TRADE AND POVERTY IN SYRIA

122
inputs. These continually revised prices are published each year before the beginning of theagricultural season. This price-fixing mechanism has led to increases in producer prices that farexceed the rise in consumer prices, typically fixed by the state for the same products. Oneconsequence of these policies is the accumulation of large stocks by state enterprises and largefinancial costs in the state budget.
Administered pricesAnother category of agricultural commodities is subject to administered prices, but without a statemonopoly on marketing. This is the case of barley, lentils, maize and sunflowers. Farmers have theoption of selling to state marketing boards at the official prices, but they can also sell on the privatemarket. Indeed, like procurement prices, these prices are fixed on the basis of a study jointlyconducted by representatives of the Government, farmers and processors. Prices are set accordingto the estimated average production cost, plus a profit margin that is smaller than that accorded forstrategic products. Thus, the proposed prices are considered as minimum guaranteed prices forfarmers so as to protect them from unusually low market prices.
Consumer price policyThis category of prices is also fixed by the state administration and is meant for consumptionproducts such as vegetables, fruits, milk, meat, eggs, rice and oil. These prices are considered assimple indicators that should not be applied in transactions between producers (and importers)and consumers, except for products that public institutions buy. These prices are also fixed by acommittee that is generally made up of the Ministry of the Economy and the Ministry of Trade, aswell as other departments involved in the sector.
This pricing policy has undergone significant reforms during recent years. Many products, notably,vegetables, have witnessed liberalization in prices and imports. Furthermore, state monopolies inthe importation of certain products have been relaxed, opening the door to private importers.However, pricing policies have not undergone changes relative to many other products, leading tohigh fiscal costs because of the gap between producer prices and (lower) export or retail prices.
Input policyAgricultural input policy is based on the principle that all necessary inputs for agriculturalproduction should be made available through the establishment of state monopolies in theproduction of inputs. However, the private sector participates in some marketing activities withoutauthorization from the state administration. There is a state monopoly in the importation anddistribution of chemical fertilizers. State trading enterprises import fertilizers on behalf of thecooperative agricultural bank, which distributes the fertilizers to farmers. Payment is made eitherin cash or by means of loans granted by the same institution on the basis of conditions fixed inadvance by the Ministry of Agriculture. In addition, there is a state monopoly in the production,importation and distribution of seeds. The private sector is authorized to market pesticides with theapproval of the Ministry of Agriculture and to import and distribute agricultural machinery.
The partial liberalization of the importation and distribution of pesticides and agriculturalequipment has helped increase the level of agricultural production in the country. However, thecontinued monopoly on the importation and distribution of fertilizers has had negative effects. Inaddition to long delays in fertilizer delivery and the rationing of fertilizer among farms, this policyhas led to additional costs, estimated at 30% of the farmgate price (Bakour 2004).
Recent Agricultural policy reformsIt is important to point out that the 1970s saw an increase in the use of public monopolies in themarketing of many agricultural products. This involved the purchase and distribution of theseproducts on local and foreign markets. These marketing monopolies were directed at variouscereals, the main fruits, and crops and harvests for industrial processing. Disciplinary and penalsanctions were applied against individuals who did not respect the monopoly regulations whetherthey were producers or traders.

123
However, the beginning of the 1980s witnessed the introduction of a reform in the marketingpolicy for agricultural products. This reform involved the following:
• the elimination of the system of compulsory importation of certain products by publicenterprises (wheat, barley, lentils, chickpeas, maize and others) and of the restriction ongrain purchases of the state trading enterprise from farmers who choose to sell;
• the preservation of the state monopoly in the exportation of strategic products, whilegranting concessions to the private sector to involve it in the exportation of cereals oncondition of a prior agreement with the Grain Board;
• encouragement for the private sector to participate in export operations in fruits andvegetables through greater freedom in the use of foreign currency receipts, exemptions fromthe tax on agricultural production and a reduction in the income tax;
• authorization for public enterprises to process agricultural products and to obtain goodsdirectly on the market at market prices without the obligation to pay official prices, whichare often higher than market prices; and
• authorization for agricultural enterprises to market any of their production that is not understate monopoly on local and foreign markets, according to the best interests of theenterprises.
Certainly, these changes represent a movement towards liberalization in the marketing ofagricultural products and in exportation. However, the results of these reforms have been modestfor various reasons. First, the state monopoly in distribution has been maintained for strategicproducts, primarily those for which the processing industries belong to the state. This covers mainlycotton, tobacco and sugar beets. Second, there is an absence of export mechanisms able to facilitatetrading relationships with foreign clients and foster new outlets. In addition, weaknesses in themarketing infrastructure and the high transaction costs in marketing have reduced the supplyresponse in agriculture.
Agricultural policy continues to be a subject of debate. Some are calling for the maintenanceof the state marketing system based on administered prices, while others are calling for a moreflexible system that responds to changes in supply and demand both in marketing and in fixingagricultural prices. In the latter case, public enterprises that process or export certain agriculturalproducts must obtain their goods directly on the market through contracts with producers orcooperatives, or with agricultural companies and wholesalers.
7.3.2 Trade policyForeign trade is subject to a significant intervention, particularly through import barriers such astariffs, quantitative restrictions and technical barriers on trade (non-tariff barriers). These importbarriers are discussed in detail below.
TariffsCurrent import tariffs range from 6% to 235%, and average 35%, including other duties andsurcharges. There are ten tariff bands. Statutory tariffs range from 0 to 200%. These aresupplemented by a unified duty that ranges from 6% to 35%, the applied surcharge increasing withthe level of the applicable tariff rate. The highest tariffs apply to the imports of certain types ofvehicles. Tariffs of 100% or more apply on imports of certain fruits, vegetables and processed foods,as well as on textiles, ceramics and glass products, all of which are produced locally. As discussedbelow, many of these products are also subject to quantitative restrictions on trade. Tariffs on goodsoriginating in GAFTA countries are duty free.
The average tariff, weighted by the composition of imports, is currently only 8%, which isrelatively low compared to the tariffs applied in other countries in the region before they joined theWTO or signed an EMP agreement. But this low average tariff rate is misleading as an indicator ofopenness for two reasons. First, because it is an import-weighted tariff at the mean, it gives lessweight to those commodities on which the tariffs rates are the highest. Second, it does not take intoaccount the pervasive system of quantitative restrictions, which raises effective protection (and thusthe implicit tax on exports) substantially.
CHAPTER 7: AGRICULTURE, TRADE AND POVERTY IN SYRIA

124
If account is taken of the tariff equivalent of quantitative restrictions, the overall weightedaverage rate of protection exceeds 25%, making Syria one of the least open countries to trade in theMENA region (World Bank 2004).39
Quantitative restrictionsA quantitative restriction is any measure that limits the volume of trade directly, rather thanthrough import taxes. Examples include quotas, licensing requirements and safeguard levies. InSyria, quantitative restrictions are principally implemented by the regulation of imports throughfour lists, as follows:
• The first list comprises all products forbidden for importation, for environmental, security,or sanitary reasons. Officials indicate that this list is similar to ones used in OECD countries.
• A second list encompasses all products forbidden for importation from non-GAFTA countriesbecause of their negative impact on Syrian industry. Products on this list all have an equivalentproduced in Syria. The list covers a large number of agricultural and industrial products: flowers,animal products, forestry products, vegetable oils, sugar-based products, quarrying products,plastic and rubber products, leather and leather products, wood products, paper products, silk,textiles and clothing, craft products, glass products, electrical machinery and materials, etc.
• The third list contains products that may only be imported by the public sector. This listincludes, notably, oil and oil-related products, alcohol and beer, arms, cotton, some cerealproducts, tobacco, pharmaceutical products, salt, black cement, fish, fruits, olive oil,veterinary medicines and phosphates.
• The fourth list contains products that were once imported only by particular public entitiesand that may now be imported by anyone, provided a commission is paid to the relevantpublic entities. This commission generally represents 3% to 5% of the import value beforetaxes. The most important products on this list are cars and transport machinery, steel andsteel products, wood, white cement, yarn for the textile industry, coffee, tea, rice, canned fishand meat, raw sugar, fertilizers, raw leather and paper.
Both public entities and private agents may theoretically import any products not included in thesefour lists. According to Syrian officials, there is thus no positive list of imports that are allowed inSyria. No mention was made by these Syrian officials of the existence of quotas, tariff quotas,calendar restrictions, or the need to comply with particular standards.
Measuring the impact of quantitative restrictions on prices is a difficult task. The mostcommon method is the price-gap approach, which compares the domestic price of imported goodswith the international price, after adjustment for tariffs, shipping costs, costs of domestictransportation and customs procedures, and the impact of import and export financing schemes(Chemingui and Dessus 2004). The remaining price differentials between domestic and worldprices thus measure the impact of quantitative restrictions on the domestic price of importablegoods. This approach does have limitations since it is difficult to obtain accurate information ondomestic and world prices at a sufficiently disaggregated level. In most cases, the estimated tariffequivalent of quantitative restrictions covers a set of products.40 In addition, it is impossibleformally to assign the origin of the estimated residual price gap to an existing import regulation;for instance, corruption or quality differences might also partially explain the price gap.
Given these qualifications, Table 7-2 presents estimates of the tariff equivalents of quantitativerestrictions for selected agricultural commodities. Across all product categories (agricultural andnonagricultural), tariff rates are positively correlated with the tariff equivalents of quantitativerestrictions, which suggests that they are both used to support the same objective. Chemingui andDessus (2004) estimate that, across all product categories, the weighted average tariff equivalent ofquantitative restrictions is 19%, compared to the weighted average tariff rate of 8%. Thus,quantitative restrictions probably represent the main source of trade protection in Syria.
39/ See Nashashibi (2002) for a comparison of trade openness among MENA countries.
40/ The calculations carried out by Chemingui and Dessus (2004) cover, on average, 60% of the products comprised within eachgroup of imported products (and 50% on a weighted average). By default, the authors assumed that the uncovered share ofimports in each group faces the same tariff equivalent as the share of imports covered by their estimates.

125
TABLE 7-2Tariff equivalents of quantitative restrictions and tariffs on agricultural products
Group of products Tariff equivalent Tariffs onof quantitative agriculture
restrictions products
(%) (%)
Fish products (SITC 03) 3.9 19.5Fruits and nuts (SITC 057) 27.4 54.0Other food, live animals, oils, fats and waxes (rest of SITC 0-4) 19.9 7.8Tobacco and beverages (SITC 1) 309.3 110.1
Source: Chemingui and Dessus (2004).
SITC = Standard International Trade Classification.
Technical barriers to tradeTwo other technical barriers to trade tend to raise the cost of international trade between Syria andthe rest of the world: (i) the use of a multiple exchange rate system in trade finance and (ii)cumbersome customs procedures and inefficient trade logistics.41
The import (and export) regime is complicated and rendered non-transparent because of themultiple exchange rates for private and government entities. The exchange rate system in Syria hasbeen tightly managed, with a total of 11 rates applied for different transactions. In the 1990s, manyof these rates were unified, most recently in 2002, when the three exchange rates used for thevaluation of imports were harmonized and, in 2004, with the unification of the rate used forbudget calculations with the rate applied to other public sector operations.
Until 2002, there were three exchange rates:• the official rate, determined by the Central Bank of Syria, valued at SYP 46.5 per US$1.00,
which was used by the public sector for imports;• a free market rate, approximately SYP 53 per US$1.00, which was determined by supply and
demand mainly on the Beirut foreign exchange market and which was used for bothcommercial and non-commercial purposes; and
• the so-called export proceeds rate, valued at SYP 51 per US$1.00, which was used to valueforeign exchange that exporters are required to surrender.
As a result, imports are generally underevaluated in domestic prices (hence, they are subsidized,and at different rates depending on the end-user), while exports are implicitly taxed by anoverevaluated exchange rate (again, at different rates depending on the exporting sector). Estimatescarried out by Chemingui and Dessus (2004) suggest that the average implicit subsidy on importsstemming from this system amounts to the equivalent of 2.7% of the value of imports. Similarly,the implicit tax on exports amounts to 8.9% of the total value of exports. These estimates are afunction of the difference between the exchange rate that applies to public and private sectorentities, as well as the magnitude of the foreign exchange surrender requirement. As this changes,so will the implicit import-export subsidy or taxes.
Customs procedures and regulations constrain trade through a lack of consistency, a manualsystem for processing customs data and the inadequate distribution of information on procedures andrequirements. One additional implication of the complex system of customs tariffs and duties and thenon-tariff regime is that enforcement requires complicated and burdensome procedures. Estimates byChemingui and Dessus (2004) suggest that the tax equivalent of the transaction costs related to theclearance of goods is around 15%.42 They also suggest that the implicit tax on exports due totransaction costs is around 15%. Moreover, the incidence of the system varies not only by sector, butalso by type of firm or product, depending on whether the producers or importers are public or private.
CHAPTER 7: AGRICULTURE, TRADE AND POVERTY IN SYRIA
41/ The term technical barrier to trade used here does not match perfectly the international definition. In particular, the multipleexchange rate system in place may also be considered a non-tariff measure because it affects directly the price of imports andexports. But, because it also entails additional transaction costs, one is equally justified in considering it a technical barrier to trade.
42/ This is consistent with the survey-based information in Zarrouk (2003), described earlier. Relative to other countries in theregion, Syria’s import procedures are considered among the more problematic and costly by international traders.

126
Recent trade policy reformA number of actions have been taken over the last few years to liberalize the trade regime. The factthat imports may be undertaken by the private sector has been a significant change, as has been thegradual unification of the various exchange rates that apply to private and public transactions. Theforeign exchange surrender requirement was further reduced to 10% in 2004. Traders in possessionof import licenses are now also allowed to import directly. (They were previously required to uselocal agents.) Furthermore, it is no longer necessary to finance imports using foreign exchangegenerated from exports. There has also been a reduction in the number of prohibited imports, andexplicit export taxes have been eliminated. Syria is gradually becoming integrated into the worldeconomy at the regional and multilateral levels.
7.3.3 Effect of policy on agricultural pricesThe pricing and commercialization policies applied in Syria, together with the trade policy, haveprotected Syrian farmers from the negative effects of volatility in world markets, particularly in thecase of cotton, sugar and wheat growers. Furthermore, government administrated pricingcommands a significant role in the rural economy because of its large-scale sequencing impact onresource allocations and farmer incomes down to the farm level (UNDP 2005c).
According to a recent study carried out by the Food and Agriculture Organization of the UnitedNations (FAO 2003b), if farm incomes were not supported by government purchasing at officialprices, farmers growing strategic crops, because of their high costs of production, would take lossesin a normal rainfall year, and, in the case of irrigated wheat and sugar beets, the losses would behigher. These losses would induce farmers to switch to other crops until only the lowest-costproducers remained in the market. The generous subsidies paid to producers and received byconsumers occur at the expense of the huge losses incurred by state-owned enterprises thatpurchase and process wheat, seed cotton and sugar beets.
It is important to note that the seven crops on which the Government continues to set producerprices and to consider strategic crops account for over half the total value of national cropproduction and occupy about three quarters of the 4.6 million ha that are under cultivation inSyria. Wheat and cotton are, by far, the most important of the strategic crops in terms of farmgatevalue and employment creation.
By comparing the equivalent import or export price at the farmgate, one may estimate themagnitude of support provided to farmers for strategic crops in Syria. This kind of analysis wascarried out by Westlake (2003) using 1999 data on six of the seven strategic crops. For sugar beets,the producer price in the late 1990s was almost three times the import parity, rendering beets muchmore protected than any other crop in the country. Soft wheat producer prices were 66% higherthan import parity. Cotton producer prices exceeded export parity by 31% as result of a steadydecline in international prices for cotton fibre from 1995 to 1999. For barley, official prices wereroughly equal to import parity, but well above export parity. In the case of lentils and chickpeas,official prices were below the estimated export parity price. The analysis showed also that, to theextent that farmers may switch among crops in response to relative profitability, government priceintervention has artificially stimulated the production of wheat, cotton and sugar beets at theexpense of barley, lentil and chickpea production (Table 7-3).
In 1999, sugar cane farmers and sugar consumers benefited in roughly equal amounts from thesubsidies on sugar. In the case of wheat, some 85% of the total price subsidies went to farmers. Asshown in Table 7-4, price subsidies for wheat, cotton and sugar beet farmers totaledSYP 20.7 billion, equivalent to 2.5% of GDP. These figures are calculated at the aggregate level,without reference to the size distribution of the holdings and the land tenure status of farmers.Little is known about the distribution of these gains among small-scale farmers and large-scalefarmers. In absolute terms, it is safe to say that large-scale wheat farmers capture a disproportionateshare of the subsidies because the subsidy benefits are proportional to wheat production. However,the percentage contribution of these subsidies to farm incomes among different farm groupsdepends on the importance of the subsidized crops within their incomes.

127
TABLE 7-3Comparison of official and parity producer prices
Import products Official Import parity price Official price as a % of the producer price at the farmgate import parity price
Soft wheat 10 800 6 497 166Barley 7 500 7 316 103Sugar beets 2 150 746 288
Export productsLentils 16 000 18 799 85Chickpeas 17 800 28 852 62Cotton 29 290 22 291 69
Source: Westlake (2003).
TABLE 7-4Government price intervention: costs and beneficiaries
Value of subsidies
(SYP billion) (% of GDP)
Wheat (1999)Public enterprise loss 26.29 3.24Subsidy to farmers 9.04 1.11Subsidy on standard flour 3.76 0.46
Cotton (1998/99)Public enterprise loss 6.42 0.79Subsidy to farmers 9.88 1.22Tax on domestic spinners 2.3 0.28
Sugar (1999)Public enterprise loss 3.72 0.46Subsidy to farmers 1.55 0.19Subsidy to consumers 1.63 0.2
TotalLosses 36.43 4.49Subsidy to farmers 20.47 2.52Subsidy to consumers 5.39 0.66Tax on domestic industry 2.3 0.28
Source: Westlake (2003).
Note: The official exchange rate on 30 June 1999 was SYP 41.85 per US$1.00, according to www.oanda.com.
7.3.4 Trade agreementsAt the regional level, in February 1997, Syria signed the agreement leading to GAFTA. In 1998 and1999, bilateral FTAs were signed with Lebanon and Jordan, and, in 2005, an FTA was signed withTunisia. In October 1997, Syria formally started negotiations on the association agreement with theEU. An agreement was reached in 2004, but has not yet been ratified by the European countriesand, so, has not entered into effect. At the multilateral level, in October 2001, Syria requestedaccession to WTO, but few advances have been achieved towards accession.
The FTA signed between Syria and the EU (which has not entered into effect) calls for areinforcement in the trade relationship between Syria and the EU. This will require significantreform in Syrian trade policy and in the application of instruments of protection in Syria. The mainprovisions of the Syria-EU association agreement relate to trade in agricultural products and maybe summarized in four sections. The first section relates to the EU imports of Syrian agriculturalproducts. Accordingly, annual tariff quotas have been set for Syrian exports of selected horticulturalproducts (Table 7-5).
CHAPTER 7: AGRICULTURE, TRADE AND POVERTY IN SYRIA

128
TABLE 7-5Proposed changes in EU quotas for Syrian exports
Commodity Season Initial quota Increase in quota
Potatoes 1 January to 30 April 25 000 t Annual increase of 1 000 t for two yearsPotatoes 1 June to 31 July 5 000 t No changeFresh tomatoes All year 15 000 t Annual increase of 3% for two yearsOranges 1 January to 31 May 25 000 t Annual increase of 3% for two yearsSmall citrus 1 November to 28 February 13 000 t Annual increase of 3% for two yearsLemons 1 October to 30 March 7 000 t Annual increase of 3% for two yearsFresh grapes 1 November to 31 July 3 000 t Annual increase of 3% for two yearsFresh apples All year 20 000 t No changeOlive oil All year 10 000 t Annual increase of 1 000 t for two years
Source: Draft EU-Syria EMP agreement.
For fresh tomatoes, a reduction of 60% applies to the most favoured nation duty for quantitiesabove the quota, although, for products where entry prices apply, this entry price is maintained. Forother products, at entry into force of the agreement, the ad valorem duty will be set at zero forunlimited quantities. A list of these products has been annexed to the agreement. For a certainnumber of other products, at entry into force of the agreement, the ad valorem duty will be set atzero under a tariff quota covering traditional trade. A list of these products has also been annexedto the agreement. Finally, for a number of products, at entry into force, the ad valorem duty will bereduced to a certain level. A list of these products has been annexed to the agreement.
The second section includes regulations on imports by Syria of agricultural productsoriginating in the EU. For these, Syria will dismantle its tariffs to reach a zero tariff sequentiallyaccording to the following schema: 0-5% at entry into force, 5-10% at year 4, 10-40% at year 7, 40-100% reduced to 40% at entry into force and a linear reduction to zero at year 12, above 100%reduced to 70% at entry into force and then a linear reduction to zero at year 12. Additionally,annual tariff quotas at zero duty have been set for European exports for the following productswithout entry price: oranges (1,500 t), small citrus (750 t) and fresh apples (2,500 t).
The third section concerns processed agricultural products. For these products, Syria will grantannual tariff preference quotas for the following categories: mineral water, soft drinks, spirits,cigarettes and homogenized tobacco. Within the quotas, the applied tariff will be reduced by 40%when the agreement comes into force.
Finally, regarding fish, Syrian tariffs will be dismantled over 12 years: 0-10% reductionsimmediately, 10-30% in five years, 30-80% in seven years, and all above 80% brought down to 80%at entry into force and dismantled over 12 years. On the other hand, all imports into the EU are tobe dismantled by the third year after entry into force, with the exception of tuna, on which anannual quota of 100 t will apply. (Currently, Syria does not export fish to the EU).
7.4 PovertyAccording to the United Nations Development Programme, 11.4% of the Syrian population isunable to meet their basic food and non-food needs. Furthermore, measured by the lower house-holdspecific expenditure poverty lines, poverty in Syria rises to 30.1%, representing almost 5.3million individuals. Measured according to the US$2-a-day international measure, 10.4% ofSyrians are poor (UNDP 2005c).
While poverty is generally more prevalent in rural Syria than in urban areas, the greatestdifference is geographical. As shown in Table 7-6, in the north-eastern region, both rural and urbanareas suffer from the greatest incidence, depth and severity of poverty, the southern urban regionhas very low levels of poverty, and the middle and coastal regions have intermediate levels ofpoverty. The same report shows that poverty decreased between 1996-97 and 2003-04 for Syria asa whole, but regional patterns differ. Poverty incidence declined rapidly in the middle and southern

129
regions, especially in rural areas. Poverty declined moderately in urban areas of the north-easternand coastal regions. However, poverty actually rose in rural parts of these regions. Over this period,inequality in Syria as a whole rose slightly: the Gini coefficient rose from 0.33 to 0.37. However, alarge increase in average per capita expenditure outweighed the effects of this increased disparity.
Results from the 2003-2004 surveys show that lack of education is the characteristic with thestrongest correlation to poverty in Syria. More than 18% of the poor population was illiterate, andpoverty was most widespread, deepest and most severe among these individuals. Poverty wasinversely correlated with educational attainment, so that even a moderate improvement ineducation could reduce the ranks of the poor. In urban areas, the poverty headcount ranged from11.7% among illiterate persons to only 1.5% among university graduates. The corresponding ratesin rural areas were 16.5% and 5% (UNDP 2005c).
The same study shows that the highest poverty rates were among the self-employed in marginaland unskilled activities or among non-wage workers. Agricultural and construction wereoverrepresented within poor groups. Moreover, the poor were more likely to work in the informalsector, which employed 48% of the poor. Unemployment rates correlated with poverty; the povertyincidence among the unemployed was higher than average in urban areas. Table 7-7 shows thatmore than 50% of the poor in rural areas are farmers, while only 38% of the non-poor in ruralareas are farmers.
CHAPTER 7: AGRICULTURE, TRADE AND POVERTY IN SYRIA
TABLE 7-6Poverty measures by region using the lower poverty line for 2003-04
Poverty measures Percentage share
P0 P1 P2 Poor Non-poor Overall
UrbanSouthern 5.8 1.23 0.45 10 21 19North-eastern 11.2 1.79 0.44 20 21 21Middle 9.0 1.64 0.46 5 7 7Coastal 9.3 1.95 0.6 3 4 4
RuralSouthern 10.7 2.03 0.64 10 11 11North-eastern 17.9 3.51 1.01 38 22 24Middle 11.1 1.81 0.49 9 9 9Coastal 9.7 1.92 0.57 4 5 5
All Syria 11.4 2.13 0.62 100 100 100
Source: UNDP (2005c).
TABLE 7-7Distribution of the population by location and poverty status
Agriculture Other activities Total
(%)
UrbanPoor 5.7 94.4 100.0Non-poor 5.2 94.8 100.0
Total 5.3 94.8 100.0
RuralPoor 50.4 49.6 100.0Non-poor 38.2 61.8 100.0
Total 40.0 60.0 100.0
All SyriaPoor 33.9 66.1 100.0Non-poor 21.5 78.5 100.0
Total 22.9 77.1 100.0
Source: UNDP (2005c).

130
Table 7-8 presents the main poverty indicators for heads of household working in agriculture.Only 9.3% of urban heads of household working in agriculture are poor, while 18% of agriculturalhouseholds in rural areas are poor. It is worth noting that 17% of agricultural households are poor,compared to 11% of all Syrian households.
7.5 Impact of wheat market liberalization on small farmers7.5.1 BackgroundThe recently adopted five-year plan (2006-10) gives high priority to meeting the challenge ofreducing the fiscal deficit by 7 percentage points of GDP over the period. The main strategy forachieving this objective is to reduce expenditure by phasing out subsidies and to increase revenueby adopting a value added consumption tax.
Phasing out subsidies would have a significant effect on the fiscal deficit. First, the cost ofagricultural and energy subsidies is large, about 18.9% of GDP. Second, unlike raising taxes, thismeasure can yield significant efficiency gains given the large deadweight loss associated with thispolicy. Third, the policy reform is an opportunity to make government subsidies more equitable,converting them to a powerful instrument for redistribution and poverty reduction. Fourth, theshort-term contractionary impact on the economy will be smaller, and the contribution to theadjustment of external accounts larger than other fiscal measures. Lastly, by pushing for greaterefficiency in resource allocation and protecting budgetary spending on education, health andinfrastructure, this reform improves the economy’s long-term growth and balance of paymentsprospects (World Bank 2006).
In this section, we examine the economic and redistributional effects of the removal of wheatsubsidies. For this purpose, we have developed a static CGE model linked to data from the Syrianhousehold expenditure survey. The model is used to assess the direct and indirect implications ofreducing the producer price of wheat to international levels and of increasing the consumer pricesof wheat products through a reduction in subsidies. The assessment will focus on the overalleconomic structure and on household consumption and welfare.
The value of wheat subsidies (including subsidies on wheat products such as bread) iscalculated as the difference in the value of the domestic consumption of these products at domesticprices and the opportunity costs of these products. For wheat products such as bread, theseopportunity costs are measured by the cost of production. For wheat, the reference price is theinternational price after adjusting for transport costs and distribution margins up to the mill. Thecost of agricultural subsidies estimated by the State Planning Council is shown in Table 7-9.
Net subsidies for agricultural and food products in 2003 amounted to 6.8% of GDP. If we addenergy subsidies (12.1% of GDP), total subsidies amounted to 18.9% of total GDP in 2003.Domestic wheat prices are about 25% higher than the international price. Consumption was 6.7 million t in 2005 and had been increasing at a high rate (17% in 2003).
7.5.2 MethodsThe model used in this study is a static CGE model based on the standard static CGE modeldeveloped by Lofgren, Harris and Robinson (2002). The Syrian standard CGE model explains allof the payments that are recorded in the SAM with which it is associated. The model is based on aSAM that was, in turn, based on the input-output table built by Chemingui and Fetini (2006) to
TABLE 7-8Poverty measures for households of which the head is working in agriculture
Poverty measure
P0 P1 P2 % of population
Urban 9.3 1.7 0.4 5.4Rural 18.0 3.5 1.1 40.6
All Syria 17.0 3.3 1.0 23.5
Source: UNDP (2005c).

131
43/ A more detailed analysis would involve disaggregating production factors to include land rents and agricultural wages amongthe income sources for each decile.
assess the effect of phasing out subsidies on energy products. The model includes ten households,each representing one decile of the Syrian population. This allows us to examine the impact ofalternative policies on different income groups in the country. A more detailed description of themodel is provided in the annex to this chapter.
The model is used to simulate three scenarios:• a reduction in the subsidies on wheat production and wheat consumption by 20%;• a reduction in the subsidies on wheat production and wheat consumption by 50%; and• the elimination of the subsidies on wheat production and wheat consumption.
The decrease in the wheat producer price and the increase in the consumer prices on wheatproducts have multiple effects on the economy and on households. The change would affectvirtually all households as consumers and some households as producers as well. The mostimmediate and publicly visible impact of the proposed reform of subsidies would be on the costof living for wheat-consuming households, which now face higher prices for wheat products suchas bread. In addition, the decline in the producer price of wheat would negatively affect the incomeof wheat-producing farmers. In addition to these two direct effects, there are indirect effectswhereby the new set of relative prices will induce a reallocation in resources; farmers wouldreallocate land and labour from wheat to competing crops, and consumers would substitute otherfoods for wheat products. Other households will be affected by the reallocation in consumerspending patterns and by the reallocation in factors of production.
We calculate the incremental effects on sectoral production and prices and the overall cost ofliving caused by the proposed reform in wheat prices and the prices of wheat derivates. We do thisby combining a SAM that shows the input structure for the production of all final goods and aconsumer expenditure survey that shows the amounts of each final good purchased by householdsdifferentiated along decile welfare groups. It is important to note that the current version of theSAM does not differentiate farmers from non-farmers; household categories are defined only bytheir level of per capita consumption. The income sources for each category of household iscomposed of labour income, capital income, remittances and other transfers.43
CHAPTER 7: AGRICULTURE, TRADE AND POVERTY IN SYRIA
TABLE 7-9Budget cost of food and agricultural subsidies in Syria
1995 1996 1997 1998 1999 2000 2001 2002 2003
(SYP millions per year)
Sugar subsidy 2.45 3.74 4.24 4.93 0.00 3.80 0.00 3.50 3.40Rice subsidy 0.00 0.22 0.56 1.14 0.00 0.33 0.00 0.32 0.07Wheat subsidy 0.00 0.00 4.52 4.33 1.90 2.24 9.73 8.43 7.97Wheat products subsidy 17.26 0.00 23.50 25.48 23.24 26.01 22.09 19.99 20.61Cotton subsidy 0.00 7.37 10.87 14.73 15.39 14.09 15.84 13.17 9.64
(%)
Wheat subsidies as a % of food and agricultural subsidies 88 0 64 59 62 61 67 63 69Wheat subsidies as a % of government expenditures 11 0 13 13 10 10 10 8 7
Wheat subsidies as a % of GDP 2 0 3 3 3 3 3 3 3
Source: State Planning Council.
Note: The wheat subsidy refers to the cost of supporting the producer price of wheat, while the wheat products subsidy is paid to millers tomaintain the consumer price of bread and other products at below-market levels. The official exchange rate was SYP 41 per US$1.00 over1995-2000, SYP 46 per US$1.00 in 2000, SYP 53 per US$1.00 in 2001, SYP 50 per US$1.00 in 2002 and SYP 44 per US$1.00 in 2003,based on the 30 June rates recorded in www.oanda.com.

132
44/ The impact on welfare (welfare loss) is a relative concept in that it measures what is needed in terms of money to keepexpenditure per group at the same level as the level before the increase in prices. A subsidy reduction by SYR 1 matters more forthe poorest than for the richest consumer and contributes to a higher welfare loss for the former than for the latter. In absoluteterms, the impact differs according to the amount of expenditure by different household groups in the wheat product and the otherproducts that are linked to it, so that those households consuming more of a subsidized product (and therefore allocated moresubsidies) will lose more if the prices for consumer goods are increased.
7.5.3 ResultsThe macroeconomic effects of the reduction or elimination of the wheat subsidies is relativelymodest, as shown in Table 7-10. Aggregate consumption, imports and exports change by less than1% even with the full elimination of the subsidies (simulation 3). The positive (albeit small) effectof the subsidy removal is due to the elimination of a policy distortion that creates an inefficiencyloss in the economy. The largest macroeconomic effect is on government savings, which increaseby 2.77 percentage points of GDP as a result of the elimination of the subsidies. In other words,government savings increase from 0.78% of GDP to 1.99% of GDP. Private savings declines by 3.65percentage points of GDP as a result of the subsidy removal.
Table 7-11 shows the impact of subsidy reduction or removal on the prices and output invarious sectors of the economy. Not surprisingly, the most affected sectors are the wheat and foodprocessing (including milling) sectors. The producer price of wheat declines by 4% with a 20%reduction in subsidies and by 16.5% with the complete elimination of the subsidies. The lowerproducer prices imply a decline in the profitability of wheat production and some substitutiontowards other crops. Because of the relatively inelastic supply of wheat, even complete eliminationof the subsidy causes a decrease in wheat production of less than 2%. Thus, farmers will be thedirect losers from this reform, at least at the short run.
The policy reforms would have mixed effects on the wheat milling industry. The sector benefitsfrom the lower price of wheat but, on the other hand, it loses subsidies for wheat processing and thevolume of wheat production (and thus processing) declines. Thus, the food processing sector, whichincludes wheat milling, faces better prices but a smaller volume (Table 7-11). The net effect on thesector appears to be slightly positive in that the price increase is greater than the volume decrease.The impact of these policy changes on output in other sectors is generally positive, because of theelimination of the distortion in the economy, but small, because the effects are indirect.
The magnitude of the welfare loss for the average consumer is not very high because the shareof wheat in household expenditures is low and because a relatively small share of households growwheat.44 Disaggregating the welfare losses resulting from the reduction in wheat subsidies showsthat the richest 10% of the population would gain the most from the reforms, and the top 50%would gain something, while the poorest 50% of households would lose (Table 7-12). Thisdifference reflects the original unequal distribution of benefits from subsidies among different
TABLE 7-10Impact of wheat subsidy removal on macroeconomic indicators
Indicators Base year 20% 50% Eliminationreduction reduction of wheat in wheat in wheat subsidiessubsidies subsidies
Value % change % change % change
Real absorption 1184.9 0.13 0.31 0.49Real household consumption 764.01 0.19 0.48 0.76
Total real exports 431.95 0.17 0.46 0.77
Total real imports 403.74 0.19 0.49 0.82% of GDP Pct. point Pct. point Pct. point
change change change
Investment 20.58 -0.02 -0.06 -0.10Private savings 25.32 -0.89 -2.25 -3.65Trade deficit -4.21 0.00 0.01 0.02Government saving -0.78 0.70 0.01 2.77Tariff revenue 1.52 0.00 1.74 0.02
Source: Simulations using a CGE model for Syria.

133
consumers and producers of these products and the similar distribution of income sources amongcategories. However, the effects are quite small; the welfare changes associated with full subsidyremoval are less than 1% for all groups except the richest 10% of households.
7.6 SummaryThe Syrian agricultural sector is characterized by a high degree of government intervention,including fixed prices, state marketing boards, state monopolies in the marketing of strategic crops,state monopolies in the distribution of fertilizer and high barriers to the importation of agriculturalcommodities and food products. Reforms to liberalize the agricultural sector have been introducedin recent years, but the sector remains one of the most highly regulated agricultural sectors in theNENA region.
On the one hand, agricultural policy towards the main strategic crops has been successful inachieving national self-sufficiency in wheat and rapid growth in the production of the country’smain agricultural export commodity, cotton. It has also prevented the development of largedisparities in the incomes of rural and urban households. On the other hand, the policy hasachieved these objectives at a high cost in terms of government budgetary resources and theefficiency of resources allocation within the agricultural sector. Subsidies in agriculture and energyhave also contributed to an unsustainable budget deficit. With the depletion of oil reserves over the
CHAPTER 7: AGRICULTURE, TRADE AND POVERTY IN SYRIA
TABLE 7-11Impact of wheat subsidy removal on prices and production
Producer price Output level
20% 50% Elimination 20% 50% Eliminationreduction reduction of wheat reduction reduction of wheatin wheat in wheat subsidies in wheat in wheat subsidiessubsidies subsidies subsidies subsidies
Wheat -4.045 -10.222 -16.505 -0.427 -1.136 -1.94Other agricultural production -0.435 -1.207 -2.165 0.059 0.139 0.21Mining -0.144 -0.421 -0.799 0.008 0.019 0.03Food processing 1.791 5.044 9.238 -1.747 -4.814 -8.56Paper, publishing and printing -0.283 -0.794 -1.446 0.076 0.19 0.31Non-metallic industries -0.365 -0.982 -1.709 0.199 0.502 0.81Chemical and textile activities -0.103 -0.315 -0.625 0.124 0.315 0.51Metallic industries -0.251 -0.692 -1.235 0.153 0.386 0.62Other manufacturing -0.236 -0.657 -1.186 0.135 0.344 0.56Electricity -0.477 -1.272 -2.191 0.165 0.415 0.67Water -0.143 -0.434 -0.854 0.160 0.401 0.64Other services -0.333 -0.904 -1.589 0.208 0.530 0.87
Source: Simulations using a CGE model for Syria.
TABLE 7-12Impact of wheat subsidy removal on welfare by income decile
Change in household welfare(equivalent variation as a % of income)
Decile 20% reduction 50% reduction Elimination ofin wheat in wheat wheatsubsidies subsidies subsidies
Poorest -0.06 -0.19 -0.422 -0.06 -0.22 -0.473 -0.02 -0.10 -0.264 -0.01 -0.08 -0.215 -0.02 -0.03 -0.126 0.04 0.03 -0.017 0.05 0.08 0.088 0.09 0.11 0.139 0.53 0.23 0.34
Richest 0.19 1.35 2.20
Source: Simulations using a CGE model for Syria.

134
coming 10-15 years, the Government will need to find alternative sources of economic growth andfiscal revenue. The latest five-year plan envisages the phasing out of subsidies and theimplementation of a value added tax.
Broad domestic liberalization of the agricultural sector would result in substitution away fromwheat, sugar beets and cotton and towards barley, lentils and chickpeas. Completion of the EMPagreement with the EU would expand exports of fruits, vegetables and olive oil if Syrian producerscan meet exacting quality and food safety requirements.
About two thirds of the agricultural subsidies are devoted to maintaining a high producerprice for wheat and low consumer prices for bread and other wheat products. By banning privateimportation of wheat and by not importing through the state marketing board, governmentpolicy keeps the domestic price of wheat 66% higher than the import parity price. Wheat is themost important staple food, as well as an important source of income for farmers; so, theGovernment is particularly sensitive to the impact of reducing or removing import protection andsubsidies for wheat.
Using a CGE model that simulates the effect of policy changes on households in ten incomecategories, we examine the effect of liberalizing wheat markets by removing import protection andeliminating subsidies. The macroeconomic effects are relatively modest, although governmentsavings increases by almost 3% of GDP. Complete liberalization reduces the producer price ofwheat by about 17%, and production by about 2%. The effects of subsidy removal on the welfareof Syrian households is regressive in the sense that high-income households gain, while lower-income households lose. The size of the effects, however, is quite small: less than 1% of the baseincomes for all, but the richest income group.
It is important that one keep in mind three factors in interpreting these results. First, theimpact on farmers (particularly wheat farmers) will be larger than the impact on the poorerdeciles because each decile includes both farmers and non-farmers, thus diluting the adverseimpact of the reforms on wheat farmers. If one third of the poorest decile are farmers andassuming there is no impact on nonfarmers, then the impact on poor wheat farmers would be adecline of 1.3% (0.42/0.33) in welfare.
Second, the distributional impact will vary among farmers. Farmers growing and selling largequantities of wheat will lose the most in absolute terms from the elimination of protection andsubsidies. Smaller farmers will lose less. The impact of the reforms in terms of percentage changesin real incomes depends on net sales of wheat as a percentage of household incomes. If net sales area large share of incomes, the negative effect will be large. More information on the share in incomesfrom wheat and other crops would be needed to explore the distributional impact among farmers.
Third, the impact of liberalization on small farmers and the poor depends partly oncomplementary policies. For example, if the wheat market reforms were implemented, along witha reduction in energy subsidies, the combined effect would be more pro-poor. The recent studycarried out by the World Bank (Chemingui and Fetini 2006) shows that, in the case of subsidies onenergy products, 80% of the people will be more well off; the maximum gain would accrue to thepoorest decile, which would obtain a net gain equivalent to 35% of the overall decile consumption.Only the two richest deciles would experience a net loss (equivalent to 2.5% and 5.5% of decileconsumption, respectively). Alternatively, the wheat subsidy reduction could be implemented inconjunction with a safety net programme that uses a portion of the fiscal savings for targetedprogrammes for the poor.
One aspect of agricultural policy that is more important in Syria (and Egypt) than in the othercountries under consideration is that the support for wheat farmers is provided in large partthrough direct subsidies from the Government rather than through the taxation of consumersthrough import tariffs. This increases the feasibility of a political solution whereby a portion of thesavings from reducing these subsidies could be used to compensate those who lose from thereforms. One possibility would be to use some of the fiscal savings to implement a direct income-support programme that would compensate wheat farmers for losses associated with the reforms.The compensation should be a fixed amount based on historical production or area and could bephased out over a number of years, giving wheat farmers the time and resources to developalternative income sources (see Olhan 2006 and section 9.2.7).

135
Annex to Chapter 7Design of a CGE model of the Syrian economy
The model used in this study is a static CGE model based on the standard static CGE modeldeveloped by Lofgren, Harris and Robinson (2002). The Syrian standard CGE model explains allof the payments that are recorded in the SAM with which it is associated. The model is based on aSAM that was, in turn, based on the input-output table built by Chemingui and Fetini (2006) toassess the effect of phasing out subsidies on energy products.
Regarding domestic supply, each producer (represented by an activity) is assumed to maximizeprofits, defined as the difference between revenue earned and the cost of factors and intermediateinputs. Profits are maximized subject to constraints that capture the production technology andoptional rigidities in factor employment. At the top level, the technology is specified by a constantelasticity of substitution function or, alternatively, a Leontief function of the quantities of valueadded and aggregate intermediate input. Value added is itself a constant elasticity of substitutionfunction of primary factors, whereas the aggregate intermediate input is a Leontief function ofdisaggregated intermediate inputs. Each activity produces one or more commodities according tofixed yield coefficients. As noted, a commodity may be produced by more than one activity.Revenue from the activity is defined by the level of the activity, yields and commodity prices at theproducer level. Factor incomes are distributed to domestic and foreign institutions in fixed sharesthat are defined by factor and activity.
In the CGE model, institutions are represented by households (deciles), enterprises, theGovernment and the rest of the world. The households (disaggregated as in the SAM) receiveincomes from the factors of production (directly or indirectly via the enterprises) and transfersfrom other institutions. More specifically, each household receives fixed shares of factor incomeflows (disaggregated by factor and source, either domestic activities or the rest of the world).Transfers from the rest of the world to households are fixed in foreign currency.
The households use their incomes to save, consume and make transfers to other institutions.In the current model, direct taxes and transfers to other institutions (both domestic and the rest ofthe world) are defined as fixed shares of household income, whereas the savings share is flexiblefor selected households. Household consumption at market prices (adjusted for taxes andsubsidies) is allocated across different commodities according to linear expenditure systemdemand functions derived from the maximization of a Stone-Geary utility function. Instead ofbeing paid directly to the households, factor incomes may be paid to one or more enterprises.
Enterprises may also receive transfers from other institutions. Enterprise incomes are allocatedto savings and transfers to other institutions. Enterprises do not consume. Apart from this, thepayments to and from enterprises are modelled in the same way as the payments to and fromhouseholds. The Government collects taxes and receives transfers from other institutions. In thecurrent model, all taxes are at fixed ad valorem rates. Transfers from the rest of the world areexogenous in foreign currency, whereas transfers from domestic institutions are fixed shares of thenet (post-tax and savings) incomes of these institutions. The Government uses this income tofinance its own consumption, commodity and activity subsidies, and transfers to other institutions.Government consumption is fixed in real (quantity) terms, whereas government transfers todomestic institutions (households and enterprises) are indexed to the consumer price index.Government savings (the difference between government income and spending) is a flexibleresidual. The final institution is the rest of the world.
Commodities pass through a chain, the first stage of which consists of the generation ofaggregated domestic output from the output of different activities for a given commodity. Theseoutputs are imperfectly fungible as a result of, for example, differences in timing, quality andlocation among different activities. A constant elasticity of substitution function is used as theaggregation function. The demand for the output of each activity is derived through the problemof minimizing the cost of supplying a given quantity of aggregated output, subject to this constantelasticity of substitution function. Activity-specific commodity prices serve to clear the implicitmarket for each disaggregated commodity. At the next stage, aggregated domestic output is
CHAPTER 7: AGRICULTURE, TRADE AND POVERTY IN SYRIA- ANNEX
136
allocated between exports and domestic sales on the assumption that suppliers maximize salesrevenue for any given aggregate output level, subject to imperfect transformability between exportsand domestic sales, expressed by a constant elasticity of transformation function.
On international markets, export demand is infinitely elastic at given world prices. The pricereceived by domestic suppliers for exports is expressed in domestic currency (to the border) andexport taxes (if any). The supply price for domestic sales is equal to the price paid because ofdomestic demand (from the supplier to satisfy demand) per unit of domestic sales. If thecommodity is not exported, total output is passed to the domestic market.
Domestic demand is made up of the sum of the demand deriving from householdconsumption, government consumption, investment and intermediate inputs. If the supply of acommodity destined for domestic use is made up of both imports and domestic output, then alldomestic market demand is a composite commodity made up of imports and domestic output, thedemand for which is derived on the assumption that those who account for domestic demandminimize their costs, subject to imperfect substitutability. Total market demand is directed towardsthe imports of commodities, the demand of which is not satisfied by domestic production, andtowards the domestic output of non-imported commodities. Demand prices are adjusted forcommodity taxes and subsidies. The derived demand for imported commodities is met throughinternational supplies that are infinitely elastic at given world prices. The import prices paidbecause of domestic demand also include import tariffs (at fixed ad valorem rates). Similarly, thederived demand for domestic output is met by domestic suppliers. Flexible prices balance betweenthe demand for and the supply of domestically marketed domestic output.
The SAM used here is based on the input-output table built by Chemingui and Fetini (2006)to assess the effect of phasing out subsidies on energy products. This input-output table isconverted to a SAM using additional information on income formation and transfers amongdifferent institutions. The activity structure of the SAM has been updated for this study by addingnew sectors and commodities (wheat and wheat derivatives) and by aggregating others (mainlyenergy products). The specification of the agricultural sectors has also been rendered consistentwith the need for meaningful mapping between input-output sectors and household expenditureitems so as to be able to measure the effects of subsidy reforms on household welfare. Thespecification of the input-output structure has been based on detailed microeconomic data at thesectoral level, but also at the enterprise level in some cases.

Agriculture, Trade and Poverty in Morocco
8

138
8.1 IntroductionThe Kingdom of Morocco has a population of approximately 30 million people, about half the sizeof Turkey or Egypt, but similar to Algeria or the Sudan. A little more than half (57%) of thepopulation lives in Casablanca, Rabat and other urban areas. It is a lower-middle-income country,with per capita GDP of about US$1,457, close to the average for the NENA13 countries underconsideration.
Since joining the WTO in 1995, Morocco has been liberalizing agricultural trade policies. Thestate monopoly on the importation of staple foods has been dismantled, except for the import ofcommon wheat flour. Quantitative import restrictions have been converted to tariffs, resulting inimport tariffs as high as 339%. The tariffs on agricultural imports average 33%. Consumer subsidiesare being maintained on common wheat flour and sugar. Variable import duties are used to stabilizeand support the farmgate price of wheat, barley, maize, rice and sorghum (WTO 2003b).
Morocco joined the WTO in January 1995 and signed the EMP agreement with the EU thefollowing year. The EMP agreement calls for the elimination of Moroccan industrial duties between2000 and 2012. In 2003, Morocco signed an FTA with the United States; this will be implementedover ten years.
In spite of these agreements, Morocco retains a relatively high tariff structure. The World Bankestimates that the simple average tariff rate is among the highest 1% among the world’s countries.Progress in reducing tariffs over 2000-04 has been about average compared with other countries inthe world (World Bank 2005d).
8.2 Agricultural sector8.2.1 Agricultural productionThe agricultural sector contributes 17% to GDP, provides 35% of total employment and accountsfor 7% of total exports. Morocco has more agricultural potential than many NENA countriesbecause of suitable soils and rainfall, combined with irrigation potential. Currently, agriculturesatisfies about one half to two thirds of Morocco’s grain requirements through cultivation of wheat,barley and maize in the rainfed areas. Wheat is the main agricultural import, followed by sugar andsoybean oil.
Because grains are grown under rainfed conditions, harvests and, thus, import requirementsvary sharply from one year to the next. In 2002, Morocco produced 5.0 million t of barley andwheat and imported about 3.9 million t, which represents a self-sufficiency ratio of about 56%. Thefollowing year, favourable rains increased wheat and barley output to 8.3 million t, causing importsto decline to 2.3 million t, representing 78% self-sufficiency. The Government has severalprogrammes to extend and upgrade irrigated areas so as to make agricultural supply less vulnerableto weather, in particular by strengthening a national programme to encourage local irrigation anduse water more efficiently (FAO 2004).
8.2.2 Agricultural trade patternsTotal exports were US$12 billion in 2002; agricultural exports were US$1.8 billion, or 15% of thetotal. Unlike for most other NENA countries, agricultural exports in Morocco are dominated byfruits and vegetables (Table 3-7). Citrus fruits, tomatoes, olives, potatoes and other horticulturalcrops are grown, often under irrigation, and exported to Europe. Exports are facilitated by the shortdistance across the Straits of Gibraltar to Spain. Fruit and vegetable exports account for about 80%of Moroccan agricultural exports.
Total imports were US$13 billion in 2002; agricultural imports accounted for US$2 billion. Asin many NENA countries, the largest agricultural import in Morocco is wheat. Over 2000-02,Morocco imported an average of US$531 million in wheat. Imported wheat competes withdomestically produced wheat, which accounts for 50-60% of consumption, depending on the year.Morocco also imports raw sugar, soybean oil and maize (Table 3-7). Maize is mainly supplied byimports; there is no sizeable domestic production. There is substantial domestic production ofbarley, but not at a sufficient level to supply adequately local needs.

139
8.3 Agricultural and trade policiesMoroccan agricultural policy has gone through three main phases. The first phase, fromindependence until the middle of the 1980s, was characterized by significant intervention by theGovernment in all activities and throughout the production process. The second phase, from themid-1980s until 1995, was related to the implementation of a structural adjustment programme,which reduced government intervention in the economy and encouraged the expansion of theprivate sector. The third phase, starting in 1995, has involved the consolidation of the statedisengagement from the agricultural sector and the liberalization of Moroccan agriculture. Thelatter policy, consolidated by the FTAs, constitutes, a priori, the choice adopted for the developmentof Moroccan agriculture, which is based on promotion of the role of the private sector and theabandonment of the import-substitution policy. These three phases of agricultural and tradepolicies are described in detail in the following sections.
8.3.1 Pre-adjustment periodSince independence, Moroccan agricultural policy has been conceived to achieve ambitious, butcontradictory objectives. In fact, on the one hand, the policy has aimed to exploit the comparativeadvantages of the Moroccan agricultural sector in exports, but it has also attempted to meet internaldemand through domestic production by encouraging import-substitution production.45
The agricultural policy of the mid-1960s is associated with the “policy of dams”, which, as asymbolic objective, aimed at the irrigation of a million hectares by 2000. It was a global, voluntary,but eminently selective policy. The state, which was behind the policy, promoted the constructionof dams through public investment, subsidies, elimination of taxes, loans, price policies,supervision and distribution. The public investment in the basic infrastructure was thereforemassive, and investment in water resource mobilization reached close to 30% of national publicinvestments during this period. The agricultural investment code, promulgated in 1969, regulatedthe use of irrigated lands and encouraged the modernization of farming and the intensification ofagricultural production. To help farmers come into line with the state policy in agriculture, anextensive system of subsidies and incentives was provided to foster modernization. Irrigation waterwas heavily subsidized.
Production pricing policy was selective. The state regulated the prices of certain basic productsfor the internal market, such as grains, milk and some industrial crops. However, there was noregulation of the prices of fruits (including citrus), vegetables, or olive oil products, which werepromoted as export crops. At the beginning of the 1970s, agricultural policy attempted to maintainincome levels among farmers through subsidies without raising consumer prices for agriculturalproducts. In some commodities, (sugar, oilseeds and milk), the Government supervised the entiresupply chain.
Two decades later, the results of these policies had not met expectations. Furthermore, the fiscalburden of the agricultural and consumer subsidies increased over time. While the world prices ofbasic products (grains, oil, meat and milk) decreased, producer prices in Morocco rose, andconsumer prices remained stable. These budgetary imbalances were the main cause of the crisis inMoroccan public finances in the middle of the 1980s and the subsequent adoption of a structuraladjustment plan under the supervision of the World Bank and the International Monetary Fund.
8.3.2 Structural adjustment periodIn the middle of the 1980s, Morocco undertook a programme of profound economic reform aimedat stabilizing the national economy and laying the groundwork for greater growth in the mediumand long term. As in many developing countries, the adjustment programme was adopted inMorocco to escape a situation of crisis and insolvency and to gain access to international credit. The
45/ This section is largely based on Akesbi (2002).
CHAPTER 8: AGRICULTURE, TRADE AND POVERTY IN MOROCCO

140
46/ The European Free Trade Association includes Iceland, Liechtenstein, Norway and Switzerland.
programme represented the response to the limitations in Moroccan economic policy, of which theagricultural component was one of the main pillars. The worsening fiscal deficits and mountingdebt were the main results of the costly and inefficient policies.
The structural adjustment programme aimed to reduce the budget deficit, establish a coherentpricing policy, move the real exchange rate closer to equilibrium and correct the country’s tradeimbalance. One of the main elements of this effort to reconstruct the national economy was theSectoral Adjustment Programme for Agriculture.
In the medium term, the objectives of this sectoral adjustment programme were to stimulatethe agricultural sector to raise economic growth, reduce the trade deficit and create employment.This was to be achieved by liberalizing agricultural markets and encouraging private investment.Within this framework, priority was given to increasing the production of agricultural products inwhich Morocco had a comparative advantage. The components of the programme included:
• adjusting and liberalizing producer prices and progressively eliminating subsidies to createa favourable environment for the participation of the private sector and the liberalization ofactivities;
• a rationalization in state intervention, progressive disengagement of the state from tradeactivities that could be adequately run by the private sector and the consolidation of thestate’s main role as a regulator; and
• an improvement in the efficiency of the policy of public expenditure and investment in linewith the objectives of development and the priorities in agricultural policy.
Specific policies included the concession of some state land to the private sector, the redefinitionof the role of public enterprises, the elimination of barriers to internal and foreign trade (namely,monopolies, quotas and marketing regulations), the elimination of subsidies for agriculturalinputs and consumption, and the reform of the agricultural credit system. Subsidies for irrigationwater and for agricultural equipment were maintained, as was the large public investment in waterresources.
Producer pricing controls on agricultural commodities were eliminated for hard wheat, barley,maize, rice, milk and cattle feed. Consumer pricing on dairy products and grains was liberalized.Only the prices of soft wheat flour, sugar and vegetable oil remained controlled and subsidized bythe state. Except for a few sensitive or strategic products (grains, sugar, oil, meat and dairyproducts), the marketing channels for most agricultural and food products were liberalized.Likewise, importation and exportation operations for agro-food products were liberalized exceptfor sensitive products.
8.3.3 Global integration periodThe adoption of a significant adjustment programme that included a sectoral programme ofagricultural adjustment was only the beginning of a much more thorough and ongoing adjustmentof the economy of the country. Starting in the mid-1990s, the Government signed a number oftrade agreements that committed Morocco to greater liberalization in trade, thus consolidating thereforms carried out under the structural adjustment programme.
In 1994, Morocco signed the GATT, with the different commitments incumbent on thedeveloping countries. A year later, like other southern Mediterranean countries, Morocco signed apartnership agreement with the EU that provided for the creation of a free trade area between thetwo partners over a period of 12 years. Trade liberalization through the adhesion of Morocco to freetrade areas was also manifest in GAFTA, implemented beginning in 2005. Morocco likewise signedFTAs with the countries of the Agadir initiative (Egypt, Jordan and Tunisia), the European FreeTrade Association,46 Turkey and the United States. Some of the more important trade agreementsare discussed in the next section.

47/ A complete list of the agricultural products is found in Annex I of the Rome Treaty and was updated after the signing ofthe Amsterdam Treaty in 1997. It comprises all land-based, breeding and fishing products, as well as the related primaryprocessed products.
141
8.4 Trade agreements8.4.1 GATT and WTOThe commitments of Morocco under the GATT and WTO are limited to market access. In fact,Morocco does not provide export subsidies, which are the focus of a commitment for reduction. Inaddition, the level of aggregate market support is well below the allowable level. Concerningmarket access, Morocco has changed all non-tariff barriers into tariffs. For products such as grains,sugar, milk, meat and oilseeds and their by-products, which were subject to non-tariff barriers, tariffequivalents have been set. The bound tariff rates for these products allow for high levels of importprotection. For products that were subject to tariff barriers alone, the bound rates have been set at60%. This product category covers all fresh or processed agricultural products except basic products.
In both cases, Morocco has committed itself to reduce progressively these tariff rates by 2.4percentage points per year over ten years. The products that are targeted currently for minimumaccess are mainly meat, milk and cereals. Because the bound tariff rates are quite high, the level ofprotection remains high. Because the tariff reductions over ten years are fairly small, the impact ofthe GATT and WTO on protection in Morocco has been quite modest.
8.4.2 The EMP agreement with the EUThe partnership agreement is based on the principle of reciprocity. It provides for the gradualelimination of tariffs on all industrial products. Agricultural products, as defined by the EU,47 are,for the moment, excluded from the EMP implementation agreement. However, the schedule fortariff elimination is not the same for all products. The agreement provides for the rapid dismantlingof the tariffs on products that are not produced domestically and on equipment. In contrast, itprovides for slower tariff reductions on goods that compete with domestic production.
The current context of the agricultural negotiations between Morocco and the EU raisesnumerous questions. Analysis of recent trends in Moroccan trade in agricultural products reveals adeterioration in the balance of trade between Morocco and the EU. The agricultural surplus thatMorocco had in the early 1990s has largely disappeared. This is due to stagnation in Moroccanagricultural exports towards the EU and increasing Moroccan agricultural imports from the EU.However, the shares of Morocco in the EU market have steadily declined, mainly because of theconstraints on market access, particularly the entry price system, quality standards and subsidies forprocessing agricultural products.
8.4.3 Morocco-United States Free Trade AgreementThe FTA between Morocco and the United States was established to enhance the economic and traderelations between the two countries. In terms of foreign trade, the United States is the fourth mostimportant trade partner of Morocco. On the Moroccan side, the agreement will help diversify the freetrade process, upgrade and increase the competitiveness of Moroccan enterprises and improve theenvironment of trade and economic exchanges with a view to attracting more foreign investment in thecountry. The US market is considered a potential outlet for Moroccan products, notably, for agriculturaland textile-clothing products. But, as with the European market, access to the US market is constrainedby quality norms as strict and rigorous as those applied at the entry into the European market.
In Morocco, there is a concern that opening the Moroccan market to subsidized US grain willundercut local grain production, thus increasing rural poverty and causing excessive migration tourban areas. During the FTA negotiations, the Moroccan side recommended that a specialframework be established for the grain sector before total liberalization, given the repercussions onthe living standards of grain producers, an important segment of the Moroccan population. On theAmerican side, the FTA must also include the agricultural component. For the US, an FTA is not apreferential agreement; meanwhile, the advantage of the agreement for Morocco resides in thestructural changes in Moroccan agriculture that will make it more competitive and exploit itscomparative advantages. But Moroccan negotiators are sceptical of the argument in light of thegenerous support given to farmers by US agricultural policy.
CHAPTER 8: AGRICULTURE, TRADE AND POVERTY IN MOROCCO

142
The EU and Morocco signed an additional agreement at the beginning of 2004 relative to tradein agricultural products. This agreement promotes the access of Moroccan products to the Europeanmarket and sets up high preferential quotas for European agricultural products on the Moroccanmarket depending on the level of production of these products in Morocco. Likewise, through theMorocco-US agreement, the United States will also benefit from the same treatment for its agriculturalproducts on the Moroccan market. Within the framework of this agreement, it is clear that the UnitedStates will profit from the level of agricultural trade on account of the privileges given to Europeanagricultural products, without bearing a corresponding financial cost for the development of theMoroccan economy as the EU did through the Middle East and Developing Africa Fund.
The FTA between Morocco and the United States was signed in June 2004 and came into forcein January 2006. In contrast to the gradual pace of implementation of the EMP agreement (over1995-2012), the pace of implementation for the Morocco-US FTA is quite rapid. Another contrastis that the EU agreement provides for financial assistance to help upgrade the Moroccan economyand legislation to take advantage of the new export opportunities, while the US agreement does notprovide for financial support.
8.5 PovertyBased on the 1998/99 household survey, poverty remains largely a rural phenomenon. Almost oneMoroccan in four is poor in rural areas compared to one in ten in urban areas. Although the ruralpopulation represents 46% of the total population, 66% of the poor live in rural areas. But povertyin urban areas is also rising. The share of the urban poor increased from 27% to 34% of the totalpoor over the 1990s, almost four times more rapidly than the rural-urban population shift. Bothin rural and urban areas, the poor generally lack education and live in large households with manychildren and few working members. The incidence of poverty is much higher among children thanit is among adults; 44% of children under age 15 are poor versus 16% of adults. Among the poor,64% are illiterate (compared to 53% among the non-poor). Poverty is heavily concentrated in thecentre and northwest regions (World Bank 2004).
At the national level, the distribution of the poor by sector of activity of the head of householdshows that most of the poor work in the agriculture sector (57%), followed by services (26%) andconstruction (13%). In urban areas, among 58% of the poor, the breadwinner is working inservices, while in rural areas, agriculture is the dominant source of income among 75% of the poor.
Because of the dynamics of urbanization in Morocco, the structural causes of urban and ruralpoverty are closely related. Poor rural households engaged in productive activities typically haveaccess to agricultural land, but their landholdings are small, rarely irrigated and often exhibit lowproductivity, especially in rainfed areas; moreover, due to lack of land titles and registration, theycannot obtain formal credit and invest in their property. They frequently try to find other sourcesof income, working in odd jobs and moving back and forth throughout the year between rural andurban areas. The urban poor face multiple deprivations such as lack of employment andinadequacy in access to land, housing and basic services.
8.6 Impact of trade liberalization on small farmers8.6.1 BackgroundIn Morocco, as in most developing countries, policymakers and researchers are concerned aboutthe possible impact of agricultural trade liberalization. First, there is the concern that tradeliberalization will adversely affect the rural poor, particularly small-scale farmers. Simulationstudies (as well as economic logic) suggest that multilateral trade liberalization will raise the priceof agricultural commodities, including wheat. Morocco would lose, on net, from an increase inwheat prices, but how would small farmers be affected? The answer partly depends on Moroccanwheat import policy, the liberalization of which could partly offset, nullify, or even reverse theeffect of higher world prices on domestic prices. Second, there is concern about the closed marketsof trading partners. For example, if Moroccan farmers switch out of wheat and into horticulturalcrops, will there be export opportunities for these products in the EU or in the United States?
The impact of agricultural reform on households has been difficult to address because the toolsused to examine the economy-wide impacts of reform in agriculture have traditionally only been

143
able to assess impacts on a relatively small number of household types (Abdelkhalek 2002).Accordingly, identifying the households that are net sellers (that would gain from higher prices)and those that are net buyers (that would gain from lower prices) has been difficult.
A recent study carried out by Ravallion and Lokshin (2004) is one of the few that useshousehold survey data to examine the distributional impact of trade liberalization in the NENAregion. The study focuses on the grain sector. Grain producers in Morocco are protected by tariffson imports as high as 100%. This policy encourages farmers to grow wheat even if the costs ofproduction exceed the costs of importing wheat. The high cost of production is partially absorbedby the Government, which implements a complicated system of subsidies to mills and consumers.This brings the consumer price of soft wheat down considerably, though it is still higher forconsumers than it would be if wheat could be imported without trade tariffs. A policy thateliminates the border tariffs for cereals without any reform in the agricultural sector in developedcountries would result in significantly lower producer prices for wheat and somewhat lowerconsumer prices for wheat products. This policy would benefit consumers, who would pay less fortheir flour and bread, but hurt producers, who would have to compete with lower-cost importedwheat. The study by Ravallion and Lokshin (2004) examines the likely distributional impacts ofremoving import barriers on grains in Morocco.
8.6.2 MethodsThe method used by Ravallion and Lokshin (2004) combines the results of a CGE model focusedon grain market reform and data from 5,117 sampled households in the 1998-99 Morocco livingstandards survey. In the first step, the CGE model is used to simulate the impact of theliberalization of the wheat import policy on prices in Morocco. In particular, four simulations wererun corresponding to cutting grain import tariffs by 10%, 30%, 50%, and 100%. The modelrepresents nine agricultural products and three non-agricultural categories. The simulated changesin prices embody both the direct effect of the policy and the indirect effects on the price of non-traded goods and on factor returns, including effects operating through the government budgetconstraint. In other words, the fiscal revenue lost by eliminating import tariffs is offset byadditional taxes elsewhere. The model is described in more detail in Doukkali (2003).
In the second step, the price changes from each of the four policy simulations are combinedwith data on the sources of income and the allocation of expenditures for each household in thesurvey. The impact of each policy simulation on each household is calculated using standardmethods of first-order welfare analysis taking account of all the induced price responses. Then, theresults are aggregated to calculate changes in the mean income and incidence of poverty. Technicaldetails of this methodology can be found in Ravallion and Lokshin (2004).
8.6.3 ResultsAccording to Ravallion and Lokshin (2004), the CGE model indicates that a 100% reduction inimport tariffs on grains (full liberalization) results in a 24% reduction in the producer price ofgrains and a 27% reduction in the consumer price of grain products. There are indirect effects onthe prices of other products, but these price changes are much smaller, generally less than 3%.
These price changes are then used to calculate the change in incomes of the households in thesurvey. Not surprisingly, urban households gain from the elimination of protection on grains sincethey are net consumers of grains. Furthermore, the urban poor gain more proportionately than dothe urban rich because food in general and grains in particular account for a larger share of theirbudgets. Overall, the urban poverty rate declines from 12.2% to 11.8% as a result of the completeimport liberalization of grain and grain products. This rather modest effect is due to the fact thatgrains and grain products account for only 6.6% of the expenditures of urban households.
In rural areas, the impact is more complex because some households are net consumers ofgrain products, and others are net producers. The household survey reveals that most of the ruralpoor (60%) are net consumers of grain products; so, they will benefit from the lower grain pricesthat result from reducing import tariffs. Somewhat surprisingly, this does not imply that the ruralpoor gain overall since the losses of the net producers is greater, on a per household basis, than thegains of the net consumers. Thus, the overall welfare impact is negative. The simulations suggest
CHAPTER 8: AGRICULTURE, TRADE AND POVERTY IN MOROCCO

144
that the full import liberalization of grains would increase rural poverty from 28.3% to 34.2%.Overall, the incidence of poverty in Morocco rises from 19.6% to 22.1%. With full elimination ofprotection, the average loss for the poorest quintile is about 10% of household income.
These results contradict the conventional wisdom that the rural poor are net consumers ofgrain and would thus benefit from lower prices. In fact, net producers are equally representedacross income categories in rural areas. In other words, there is a significant number of rural poorwho are net producers and would lose from the removal of grain import protection.
The authors note two limitations in the analysis. First, the CGE model upon which it is basedassumes that wage rates are fixed; so, the simulations do not incorporate the effect of labourdemand on wages and wage incomes. As farmers switch out of wheat and other grains and intoother crops, it is likely that the demand for unskilled labour would increase since grains tend to beless labour intensive than alternative crops. The benefits of this increase in labour demand wouldaccrue to the rural poor, offsetting the losses associated with price changes and possibly reversingthe overall welfare impact on the poor. Second, the CGE does not capture the dynamic gains fromtrade liberalization, defined as the gains associated with a higher rate of economic growth due toa higher rate of technology adoption and investment.
8.7 SummaryThe Kingdom of Morocco is a lower-middle-income country with a population of about 30 million, more than half of which lives in urban areas. The agricultural sector accounts for about16% of GDP. Like most other countries in the region, Morocco is a net agricultural importer, themain agricultural import of which is wheat. After Turkey, the agricultural exports of Morocco arethe second largest among the exporters of the NENA13 countries. Fruits and vegetables, whichtypically account for 20-30% of agricultural exports in NENA13 countries, represent almost threequarters of the agricultural exports of Morocco.
Since the mid-1980s, Morocco has carried out a series of economic reforms to allow the marketto play a larger role in production and consumption decisions, including price liberalization, areduced role for state enterprises and the promotion of private investment. Morocco has signed anEMP agreement with the EU whereby tariffs on manufactured goods will be reduced over time.Morocco has also signed an FTA with the US, which entails gradual reduction in both industrial andagricultural protection. Nonetheless, the level of agricultural protection remains relatively high.
A study by Ravallion and Lokshin (2004) used a CGE model to simulate the effect of grainimport liberalization and then used projected price changes to simulate the impact on householdsin a nationally representative survey. The CGE model suggests that the full liberalization of grainimports would reduce the producer price of grain by 24% and the consumer price of grain by 27%.This would reduce poverty in urban areas, where households benefit from lower-priced grain, butraise poverty in rural areas because of the losses among the net sellers of grain. The overallincidence of poverty in Morocco would rise from 20% to 22%. These results suggest that, althoughmany rural households are net buyers of grains, lower grain prices tend to increase the poverty rate.These results, however, do not take into account the effect of global trade liberalization, whichwould be expected to increase the world price of wheat and other grains.
This study highlights the importance of using detailed household survey data in simulating thedistributional impact of trade liberalization. A standard CGE model only gives results for a smallnumber of representative households, while the use of household survey data provides a muchricher view of the impact of trade liberalization (or other policy changes). The limited access tohousehold survey data in the NENA region is a major obstacle to understanding the impact ofalternative policies on poverty and income distribution.
These findings also demonstrate the contrasting effects of trade liberalization in different countries.In Morocco, higher grain prices appear to increase rural poverty; in Egypt, higher wheat prices seem tohave negligible effects on poverty; and, in Tunisia, trade liberalization and higher wheat prices reducerural poverty. Of course, it is possible that some of the differences in results may be due to differencesin the methods and assumptions. In any case, these results highlight the importance of rigorous andcomparable studies of the impact of trade liberalization in different countries. It would be risky to drawconclusions for one country based on results from similar countries.

Summary and Policy Implications
9

146
9.1 Summary9.1.1 IntroductionAlthough trade liberalization has reduced barriers to trade in numerous sectors, the agriculturalsector remains highly protected in many countries. Most countries use a variety of measures,including tariffs, tariff rate quotas and non-technical barriers, to protect their farmers from importcompetition. Some countries (particularly high-income countries) provide direct support tofarmers in the form of subsidized inputs and price supports. As a result, agriculture is one of themost distorted sectors in the world economy. Economic theory and most empirical studies suggestthat the benefits of trade liberalization exceed the costs, at least on aggregate. However,policymakers are reluctant to reduce support for their own farmers unless they are assured thatother countries will reciprocate.
These issues are of interest to most developing countries because of the dependence of the ruralpoor on agricultural income and because of the importance of food prices to the well-being of theurban poor. This concern is even greater in the NENA region because most of the countries in thisregion are dependent on food imports to meet consumption requirements. Furthermore, the highlevel of protection for farmers in the NENA region implies that full trade liberalization would havea larger impact in this region than elsewhere.
The objectives of this report are:• to examine current agricultural trade policies in the NENA region;• to evaluate the degree of agricultural liberalization likely to occur as part of various trade
agreements;• to analyse the impact of further trade liberalization on small farmers and other poor
households; and• to explore policy options for mitigating the negative effects of agricultural trade
liberalization.
The study focuses on 13 countries and territories that are traditional borrowers from IFAD: Algeria,Djibouti, Egypt, Jordan, Lebanon, Morocco, Somalia, the Sudan, Syria, Tunisia, Turkey, the WestBank and Gaza, and Yemen. We refer to these as the NENA13 countries.
9.1.2 Basic characteristicsIn addition to their cultural, religious and linguistic similarities, the NENA13 countries have otherclimatic and demographic similarities, as follows:
• Most of the NENA13 countries are semi-arid and have limited water and arable land percapita, making agricultural production highly dependent on rainfall. The exceptions areEgypt, where virtually all crop production is irrigated, and Turkey, which has relativelyabundant water and land resources.
• The overall population density of the region is low compared to other developing areas,though Lebanon and the West Bank and Gaza are quite densely populated.
• The region is also more urbanized than the average for developing countries, thoughSomalia, the Sudan and Yemen are exceptions to this pattern.
In terms of the economies of the countries in the region, we can identify the following patterns:• Nine of the 13 countries are lower-middle income countries according to the World Bank.
Lebanon is classified as a middle-income country, while Somalia, the Sudan and Yemen arelow-income countries.
• The economic performance of many of the NENA13 countries has been relatively weak; realper capita GDP growth was 1.3% per year during the 1990s. Per capita growth was negativeover the decade in four countries (Algeria, Djibouti, Somalia, and the West Bank and Gaza),and it surpassed 3% in only two countries (Lebanon and Tunisia). Performance was betterduring 2000-03, but this covers a period in which the global economy was emerging froma recession.

147
• The region has been subject to various conflicts, including the Arab-Israeli conflict, theSudanese civil war, the insurgency in Algeria (until recently), the lack of central governmentin Somalia and the Iraq War, which affected the economies of Jordan and Syria.
• The slow economic growth means there has been little expansion in formal sectoremployment, resulting in persistent problems of unemployment, particularly among youth.
Nonetheless, strong economic performance in Lebanon, Tunisia and (recently) the Sudan suggestthat these problems are not insurmountable.
9.1.3 Agricultural and trade patternsThe NENA13 countries also exhibit some common features with regard to agricultural tradepatterns:
• Agricultural exports represent a relatively small share of total exports, exceeding 10% onlyin the Sudan.
• Wheat is a staple food and important import for many of the NENA13 countries. Itrepresents more than 20% of agricultural imports in Algeria, Egypt, Morocco, the Sudan andTunisia.
• Most of the NENA13 countries are net food importers; the main exception is Turkey.• Some countries in the region have relatively high levels of protection for farmers: Egypt,
Morocco and Tunisia are among the 15 most protected economies, according to Bouet(2006b).
• The commodities that are the most protected in the region are wheat, sugar, dairy andlivestock products.
• The EU is the most important trading partner for most of the countries in the region.
The NENA countries have signed a series of multilateral, regional and bilateral trade agreements.The URAA imposes some commitments on member countries; some of the more importantcommitments are:
• to convert quantitative restrictions into tariffs or tariff rate quotas;• to bind tariff rates by setting a maximum rate for each tariff line;• to reduce bound tariff rates by an average of 36% and a minimum of 15% for each item;
and• to reduce trade-distorting measures of support for agriculture by 20%, on average.
Developing countries have been given more modest targets for tariff rate reductions and more timeto comply, while the LDCs are effectively exempted from meeting most commitments under theURAA. The direct impact of these commitments on the NENA13 countries has been modest.Somalia, Syria, and West Bank and Gaza are not WTO members. Djibouti, the Sudan and Yemen,as LDCs, are exempt from most URAA commitments. For the remaining seven countries, the boundrates are often far above the applied tariff rates, particularly for agricultural products. Thus,commitments to reduce the bound rate have had little effect on the actual level of agriculturalprotection.
As part of the EMP, the EU has signed EMAAs with five NENA countries, and three others arein the process of ratification. These EMAAs commit the parties to phasing out almost all tariffs onmanufactured goods, though the NENA countries have a longer period to comply. Although thereare plans to incorporate agriculture at a later date, there are no firm targets or schedules foragricultural liberalization.
In 2001, the EU launched the Everything But Arms Initiative, under which the LDCs have duty-free access to EU markets for almost all goods. Within the NENA region, Djibouti, Somalia, theSudan and Yemen can take advantage of the initiative’s provisions. Bananas, rice and sugar weretemporarily exempted; for these, duty-free access has been delayed until January 2006, July 2009and September 2009, respectively.
CHAPTER 9: SUMMARY AND POLICY IMPLICATIONS
148
48/ In most cases, agricultural imports are twice as large as agricultural exports. Furthermore, the simulations in Chapter 6suggest that trade liberalization would reduce net agricultural imports, but not eliminate the deficit. Syria is quite close to being anet agricultural exporter, but this is partly due to the high level of protection provided to wheat and other commodities.
Under the US-Middle East Free Trade Initiative, the United States has signed bilateral FTAswith Jordan and Morocco and intermediate agreements with four other NENA countries. Theeffect of the US-Jordan FTA will be small because Jordan’s level of protection is already low andbecause US-Jordan trade is small. The effect of the US-Morocco FTA will be larger becauseMoroccan trade barriers are higher. Of particular importance, Morocco’s wheat tariffs will bephased out over ten years.
The African Growth and Opportunity Act allows duty-free access to US markets for sub-SaharanAfrican countries that meet certain criteria in human rights, reducing corruption and fightingterrorism. Djibouti qualifies, but its exports to the US are negligible. The other sub-Saharan Africancountries in the NENA13 (Somalia, the Sudan and Yemen) do not qualify.
A number of bilateral and regional agreements within the NENA region have been signed, buttheir effectiveness has been limited by the structural similarities of the NENA economies and theexceptions for sensitive products.
Nonetheless, a number of NENA countries, most notably Egypt and Tunisia, have reduced tariffbarriers unilaterally in recent years. In other words, trade liberalization does occur outside thecontext of global, regional and bilateral trade agreements.
9.1.4 Impact of trade liberalizationThe evidence suggests that global trade liberalization, by reducing agricultural support policies inOECD countries and by reducing protection, will increase world agricultural prices. Wheatproduction is subsidized by the EU and the US, and numerous countries (including those in theNENA region) impose high tariffs. Studies indicate that trade liberalization would increase worldwheat prices by 5-12%. Rice is also subsidized by the EU and the US, while Japan, the Republic ofKorea and other countries severely limit imports. Global models suggest that trade liberalizationwould raise the world price by 3-35%. Sugar producers are subsidized and protected from importsin many countries, making it one of the most distorted agricultural markets. Partial equilibriummodels of trade liberalization suggest that sugar prices would rise by as much as 48%, while generalequilibrium models show increases of less than 5%. Likewise, removing distortions in world cottonmarkets would increase the world price by 2-13%. Dairy production in the EU, Japan, the UnitedStates and many developing countries is protected through a complex system of support prices,import barriers and market controls. One study has estimated that global trade liberalizationwould increase the price of non-fat dry milk by 13%.
Almost all the NENA13 countries are net agricultural importers; so, there is clearly some basisfor concern that these countries will lose as a result of global trade liberalization. Our analysisconfirms that the terms-of-trade effect of a 15% increase in all world agricultural prices on theNENA13 countries would be approximately US$1.2 billion, or 0.2% of regional GDP. The actualimpact of trade liberalization, however, is likely to be more positive for three reasons:
• First, the analysis above overstates the cost of higher world agricultural prices because itassumes no response on the part of producers and consumers in the region. A net importerthat is almost self-sufficient could actually benefit if the higher prices induce it to becomean exporter of one or more commodities (Anderson 2003). Although this is unlikely tooccur among the net agricultural importers in the NENA13 region because the gap betweenimports and exports is too large,48 the negative impact of higher agricultural prices would beameliorated as producers and consumers adjust to the new prices.
• Second, it assumes that the price increase is the same for all commodities. A net importercould gain if the increases in agricultural prices are not proportional across commodities.For example, Egypt could gain from global liberalization if the price of cotton (which itexports) increases more than the price of wheat (which it imports).

149
• Finally, the analysis estimates the terms-of-trade effect of trade liberalization, but it does notinclude the efficiency gains associated with reducing distortions in domestic agriculturalmarkets. Most studies of trade liberalization suggest that the efficiency effects are larger thanthe terms-of-trade effects.
Several dozen studies have been undertaken to examine the macroeconomic impact of varioustypes of trade liberalization in the NENA region. Most of these studies use CGE models to simulatethe effect of alternative trade policies. The results of these studies may be summarized as follows:
• Multilateral trade liberalization generally results in net gains to countries in the region, withreal GDP expansion of 1 to 3%.
• The benefits of trade liberalization to a country depend largely on the degree of domesticliberalization carried out by the country. Most of the gains from agricultural tradeliberalization are associated with domestic reform rather than changes in trade policy inother countries. This confirms the well-known concept in studies of trade liberalization:what you do determines what you get.
• The benefits of multilateral trade liberalization are generally greater than the benefits ofbilateral trade liberalization with the European Union or the United States.
• The benefits of multilateral trade liberalization are generally greater than the benefits ofregional trade agreements within NENA.
• Trade liberalization usually results in lower production and more imports of wheat, buthigher production and more exports of fruits and vegetables.
In contrast, only a few studies have examined the distributional impact of trade liberalization, suchas the effect on farmers or other poor groups in the NENA13 countries. One of the most thoroughstudies, by Ravallion and Lokshin (2004), suggests that the lower agricultural prices associated withremoving agricultural protection in Morocco has had a negative effect on poverty. In the followingsections, we summarize the results of our analysis of the distributional impact of tradeliberalization in Egypt, Syria and Tunisia. We also describe Moroccan agricultural trade and theRavallion and Lokshin results in more detail.
9.1.5 Agriculture, trade and poverty in EgyptUntil 1987, agricultural policy in Egypt was characterized by various forms of state intervention inproduction, marketing and trade. The policy of import-substitution industrialization meant thatthe agricultural sector was heavily taxed through low official prices and compulsory sales. At thesame time, some commodities were protected by import restrictions. During the late 1980s andthe 1990s, Egypt gradually liberalized agricultural markets and reduced the level of importprotection. Wheat markets remained distorted by a combination of import controls, fixedproducer prices, consumer subsidies on certain types of bread and government control over thechannels leading to the subsidized bread. In 2004, a series of significant tariff reductions wasimplemented, leading the World Bank to declare that Egypt had made more progress in tradeliberalization than almost any other country. Even so, the degree of protection is higher in Egyptthan in 40% of the countries of the world.
Full global trade liberalization would increase the prices of agricultural commodities by 5-15%.This would probably negatively affect the economy because Egypt is a net agricultural importer,though the exact effect depends on the price changes for each commodity. Given proportionalincreases for all agricultural commodities, Egypt would gain from higher rice and cotton prices, butlose from higher wheat and maize prices. Domestic trade reform would reduce the domestic pricesof imported commodities such as wheat, thus partly offsetting the effect of global tradeliberalization, as well as providing efficiency gains.
We analyse the data from the 1998 Egypt Integrated Household Survey to examine thedistributional effect of changes in agricultural prices. Changes in income for each household in thesample are estimated using hypothetical increases in agricultural prices and the composition of theincome and expenditures of the household. In the short to medium run, net sellers gain and netbuyers lose from higher prices.
CHAPTER 9: SUMMARY AND POLICY IMPLICATIONS

150
According to this analysis, higher wheat prices reduce poverty among wheat producers becausetwo thirds of these producers are net sellers of wheat. For example, a 40% increase in wheat pricesresults in a 3 percentage point decline in the poverty rate among wheat farmers. However, the effectof higher wheat prices on overall poverty is negligible because significant gains by the smallnumber of wheat farmers are offset by the small losses by the rest of the population.
The pattern for rice is quite similar. Higher rice prices reduce poverty among rice growersbecause over 90% of the growers are net sellers. For example, poverty declines 7 percentage pointsamong rice farmers if rice prices rise 40%. However, in the population as a whole, the effect ofhigher rice prices is neutral because the large gains among the small numbers of growers are offsetby the losses incurred by the majority of the population that are net buyers.
With regard to cotton, higher prices have a significant effect in reducing poverty among cottongrowers. Again, a 40% increase in cotton prices reduces poverty by 7 percentage points. Nonetheless,cotton farmers represent only 4% of the population in Egypt; so, the effect of even a 40% increasein cotton prices on national poverty is negligible (less than 1 percentage point).
Higher prices for fruits and vegetables reduce poverty among horticultural growers: a 40%increase in prices reduces poverty among growers by 5 percentage points. Looking at poverty inthe population as a whole, one sees that higher prices for fruits and vegetables increases overallpoverty by 1 percentage point because the losses of poor consumers slightly outweigh the gainsby poor farmers.
An increase in sugar cane prices has a strong effect on poverty among growers: a 40% increasein prices causes a 20 percentage point reduction in the poverty rate among sugar cane growers. Thislarge effect occurs because sugar cane growers get almost one third of their incomes from the crop,compared to the 7-22% return for the other crops discussed here. The effect on national poverty isnegligible, however, since barely 1% of the population is involved in sugar cane production.
Overall, the results show that price increases have positive effects on growers of the relevantcrops, but the overall effect of price increases on national poverty is generally negligible becauseonly a small share of the population grows each crop.
9.1.6 Agriculture, trade and poverty in TunisiaLike Egypt, Tunisia adopted a structural adjustment programme in the 1980s that reduced theintervention of the state in markets, including agricultural markets. Unlike Egypt, Tunisiamaintains high tariffs on many products, including agricultural commodities. At the same time,Tunisia has a relatively good investment climate, which contributed to significant inflows of foreigndirect investment and a healthy growth rate through the 1990s.
Tunisia’s main exports are olives and dates, while the principle imports are wheat and maize.Like many NENA13 countries, Tunisia is a net agricultural importer. Multilateral liberalization isexpected to raise agricultural prices. If all agricultural commodity prices rise proportionately,Tunisia would lose in terms of trade because it is a net importer. On the other hand, it would gainfrom domestic liberalization due to efficiency gains. The combined effect is likely to be positive forTunisia as a whole because most estimates show that efficiency gains are larger than terms-of-tradeeffects. However, the net effect on agricultural prices and, hence, farmers, would probably benegative because the effect of losing high levels of protection (89%, on average) would be greaterthan the modest increase in world prices (5-15%) due to global liberalization.
In order to study the distributional impact of trade liberalization in Tunisia, we use a CGEmodel linked to data on 400 representative households from a household expenditure survey. TheCGE simulates the effect of various policies on prices, wages and returns to other factors, while thehousehold survey data are used to simulate the effect of these price changes on incomedistribution. Four simulations are examined: the removal of tariffs on industrial imports from theEU, the removal of all tariffs on imports from the EU, the removal of all tariffs on imports fromany country and the removal of all Tunisian tariffs, combined with global trade liberalization,which is assumed to raise agricultural prices by 15%.
The removal of industrial tariffs on imports from the EU (which approximates the effect of theEMP agreement) causes both imports and exports to expand significantly, although almost all thechange occurs in non-agricultural trade. Real GDP increases slightly (0.2%) because of the
151
efficiency gains associated with removing distortions. Although food and agricultural productiondeclines, most of this takes place in processed foods. Crop production remains roughly constant,and grain production expands, presumably due to less expensive inputs. Poverty declines from6.8% to 6.7%; the largest improvements occur among farmers and agricultural wage-earners.
The removal of all tariffs on imports from the EU (approximating an extended EMP agreement)causes large increases in imports of meat, beverages and tobacco, fruit, dairy products, andvegetable oil as import barriers on these goods are lifted. The production of these same goodsdeclines more modestly in the face of import competition. The effect on GDP and poverty is similarto that in the first simulation.
The elimination of tariffs on imports from all countries increases the imports of almost allagricultural commodities and stimulates agricultural exports to maintain the trade balance. Thereduction in poverty is greater than that in the first two simulations: poverty declines from 6.8%in the base scenario to 6.5%. Again, farmers and agricultural labourers account for most of thepoverty reduction.
Finally, the elimination of all Tunisian tariffs, plus global trade liberalization (represented bya 15% increase in world agricultural prices), does not do much for the overall economy. This ispartly because, as a net agricultural importer, Tunisia loses from higher world agricultural prices.Nonetheless, its agricultural sector gains from the higher prices. The three main agricultural exports(olive oil, other processed foods and fruit) expand substantially in this scenario. As a result, povertydeclines to the lowest level among the four scenarios: 6.0% among the overall population and9.0% among farmers.
9.1.7 Agriculture, trade and poverty in SyriaThe agricultural sector in Syria is one of the most highly regulated in the NENA13 region. TheGovernment uses a variety of policy instruments to control production and marketing, includingadministered prices, state marketing boards, state monopolies in the marketing of strategic crops,state monopolies in the distribution of fertilizers, subsidies, and high tariff and non-tariff barrierson food and agricultural products. Reforms in recent years have only begun to dismantle some ofthese restrictions.
Although Syria has been successful in achieving wheat self-sufficiency and promoting cottonexports, these accomplishments have come at a high cost in terms of inefficiency and anunsustainable fiscal burden. The likely depletion of oil reserves over the coming 10-15 years isforcing the Government to reduce costs and find new sources of revenue.
The domestic liberalization of the agricultural sector would result in substitution away fromwheat, sugar beets and cotton and towards barley, lentils and chickpeas. The completion of theEMP agreement with the EU would expand exports of fruits, vegetables and olive oil if Syrianproducers can meet the high quality and food safety requirements.
About two thirds of agricultural subsidies are devoted to maintaining a high producer price forwheat and low consumer prices for bread and other wheat products. By banning the privateimportation of wheat and by limiting imports through the state marketing board, governmentpolicy keeps the domestic price of wheat 66% higher than the import parity price. Wheat is themost important staple food, as well as an important source of income for farmers; so, theGovernment is particularly sensitive to the impact of reducing or removing import protection andthe subsidies for wheat.
In this report, we use a CGE model to simulate the effect of trade policy options on householdsin ten income categories. In particular, we focus on the effects of liberalizing wheat markets. Themacroeconomic effects are relatively modest, although government savings increases by almost 3%of GDP. Complete liberalization reduces the producer price of wheat declines by about 17% andproduction by about 2%. The effects of subsidy removal on the welfare of Syrian households isregressive: high-income households gain, while lower-income households lose. The size of theeffects is quite small, however: less than 1% of base income for all but the richest income group.
These results need to be interpreted with three factors in mind. First, the impact on farmers(particularly wheat farmers) will be larger than the impact on the poorer deciles. This is becauseeach decile includes both farmers and non-farmers, thus diluting the adverse impact of the reforms
CHAPTER 9: SUMMARY AND POLICY IMPLICATIONS

152
on wheat farmers. Second, the distributional impact will vary among farmers; it will be the mostadverse among farmers for whom wheat sales are a large share of household income. The impactof lower wheat prices will be positive on urban households (particularly the poor) and ruralhouseholds that are net buyers of wheat. More information on the share of income from wheat andother crops would be needed to explore the distributional impact among farmers. Third, the impactof liberalization on small farmers and the poor depends partly on complementary policies. Forexample, a recent study suggests that, if the wheat market reform were implemented through areduction in energy subsidies, the combined effect would be more pro-poor than wheat subsidyremoval alone.
9.1.8 Agriculture, trade and poverty in MoroccoThe Kingdom of Morocco is a lower-middle-income country with a population of about 30 million, more than half of which in urban areas. The agricultural sector accounts for about 16% of GDP. Like most other countries in the region, Morocco is a net agricultural importer, andthe main agricultural import is wheat. After Turkey’, Morocco’s agricultural exports are the secondlargest among the exports of NENA13 countries. Fruits and vegetables, which typically account for20-30% of the agricultural exports of NENA13 countries, represent almost three quarters of theagricultural exports of Morocco.
Since the mid-1980s, Morocco has carried out a series of economic reforms to allow themarket to play a larger role in production and consumption decisions, including priceliberalization, a reduced role for state enterprises and the promotion of private investment.Morocco has signed an EMP agreement with the EU whereby tariffs on manufactured goods willbe reduced over time. Morocco also signed an FTA with the United States that entails gradualreduction in both industrial and agricultural protection. Nonetheless, the level of agriculturalprotection remains relatively high.
A study by Ravallion and Lokshin (2004) uses a CGE model to simulate the effect of grainimport liberalization and then projected price changes to simulate the impact on households in anationally representative survey. The CGE model suggests that the full liberalization of grainimports would reduce the producer price of grain by 24% and the consumer price of grain by 27%.This would reduce poverty in urban areas, where households benefit from lower-priced grain, butraise poverty in rural areas because of the losses among net sellers of grain. The overall incidenceof poverty in Morocco would rise from 20% to 22%. These results suggest that, although manyrural households are net buyers of grain, lower grain prices tend to increase the poverty rate.However, this does not take into account the effect of global trade liberalization, which is expectedto increase the world price of wheat and other grains.
9.2 Policy implicationsIn this section, we examine the implications of these findings on policies and programmes in theNENA13 countries. How can policymakers in these countries maximize the benefits of tradeliberalization and minimize the costs, particularly with regard to small farmers and the rural poorin general? We divide the discussion into four topics: global trade liberalization, regional andbilateral trade liberalization, domestic liberalization and complementary policies.
9.2.1 Policy on global trade liberalizationAs discussed in section 9.1, global trade liberalization will likely increase world agricultural pricesby 3-20%, imposing a terms-of-trade loss on 11 of the 13 countries under consideration (the Sudanand Turkey have small agricultural trade surpluses). The net food-importing countries have usedthe likely terms-of-trade loss associated with global trade liberalization to request specialconcessions in the form of reduced commitments to open their own borders. This position reflectsthe mercantilist perspective of trade negotiation, according to which import liberalization is asacrifice that must be incurred to open up markets in other countries.
However, it is difficult to understand this position in terms of economic welfare. The flaw in themercantilist logic is that it only takes into account the gains and losses of producers, ignoring theeffects of trade policy on consumers. As discussed above, economic studies on trade liberalization

153
suggest that most of the benefits to a country deriving from trade liberalization would result fromreforms within the country. Empirical studies of protection consistently demonstrate that the cost(in terms of higher prices to consumers) of saving each job in a protected sector is several timeslarger than the income earned through the job. Thus, the net food-importing countries appear to bedemanding the right to forgo the efficiency gains associated with domestic trade liberalization ascompensation for the terms-of-trade losses associated with reforms in other countries.
However, this analysis only takes into account the impact of trade liberalization on aggregateincome or GDP. Policymakers in the NENA13 countries are also interested in equityconsiderations, including the objective of reducing poverty and unemployment. The effect ofagricultural trade liberalization on poverty varies widely across countries in part because the effectof liberalization on agricultural prices is ambiguous. Global agricultural trade reform is likely toincrease world agricultural prices, but domestic trade liberalization will reduce domesticagricultural prices relative to the world price. The net effect of liberalization on domesticagricultural prices depends partly on the country’s trade patterns, the original level of protectionand the details of the liberalization. If the level of domestic protection is high (as in Morocco, Syriaand Tunisia), then full trade liberalization is likely to reduce domestic agricultural prices. If, on theother hand, domestic protection is modest (as in Egypt, Jordan and Lebanon), then full tradeliberalization may increase domestic agricultural prices.
Furthermore, the impact of changes in agricultural prices on poverty is ambiguous. Higheragricultural prices benefit farmers who can produce a marketed surplus, but they hurt the urbanpoor and rural net buyers. The analysis presented in this report suggests that higher agriculturalprices do benefit the poor on net, but the effect is quite small. Thus, the link between tradeliberalization and agricultural price changes is ambiguous, and the effect of agricultural pricechanges on poverty is weak. This suggests that trade policy is a poor instrument for addressingoverall poverty in the NENA13 region. Nonetheless, the impact of trade liberalization on certainagricultural producers may be substantial. Below, we discuss targeted programmes that may assistvulnerable households more effectively and more economically.
Thus far, we have assumed that adjustment to a new trade regime is costless. In fact, there aretransition costs associated with any policy change that affects relative prices. As resources arereallocated within the economy, there will be a period during which factors of production will beunderutilized. For example, as labour moves from formerly protected sectors to newly profitableones, costs will be associated with unemployment and retraining. These transition costs are realand constitute an argument for phasing in the trade reform and for providing training and creditto assist those sectors that are adversely affected. Because the transition costs are temporary, whilethe efficiency gains are permanent, it is unlikely that transition costs represent a valid argumentagainst implementing the trade reforms.
Of course, NENA13 countries should push aggressively for market access for the agriculturalcommodities that they export. Egypt, Jordan and Morocco have a strong interest in opening up theEU market for fruits and vegetables. This would include taking steps to ensure that sanitary andphytosanitary regulations regarding fruit and vegetable imports into the EU are based on scientificevidence and are not a reflection of protectionist sentiment. Likewise, Tunisia would benefit froma reduction in EU tariffs on olive oil imports, while Egypt and the Sudan would gain from reduceddomestic support by the United States and (to a lesser extent) the EU for their cotton growers.
In contrast, none of the NENA13 countries would gain from global trade liberalization(including reductions in domestic support) in the wheat market. Such reforms would increase theworld price of wheat by 4 to 20%, thus adversely affecting the terms of trade of importers in theregion. The effects of these higher prices on consumers could be offset in many countries byreducing import tariffs to retain the original domestic price.
9.2.2 Policy on regional trade liberalizationThe benefits of regional integration within the NENA region have been limited to date. There arethree explanations for this, two of which may be corrected, and one of which cannot. One reasonfor the limited benefits of regional trade agreements such as GAFTA is that these agreements tendto be fairly flexible, allowing numerous exceptions for sensitive goods, permitting protection to
CHAPTER 9: SUMMARY AND POLICY IMPLICATIONS

154
vary by season and granting countries the right to suspend tariff reductions under certaincircumstances. Since the costs of protection rise more than proportionately with the level ofprotection, allowing a relatively small number of exceptions can largely negate the gains from tradeliberalization. To generate significant gains for member countries, GAFTA and other regionalagreements will have to insist on a greater level of discipline on tariffs and non-tariff barriers. Oneapproach might be gradually to reduce the maximum level of tariff protection, thus constrainingthe highest tariffs first.
The second reason for the modest benefits associated with these trade agreements is thatregional trade is hampered by a variety of factors, in addition to trade policy. The infrastructurelinking the NENA countries is generally poor. Transportation services in the region arecharacterized by a lack of competition and high costs, and many of the countries suffer fromcumbersome customs procedures that raise the cost of trade. One study estimates that the delaysand uncertainties associated with customs clearance alone is equivalent to 10% of the cost of thegoods being traded (Dennis 2006a). Unfortunately, multiple and overlapping regional tradeagreements may actually contribute to these costs because tariff rates differ depending on thecountry of origin. These different rates give traders an incentive to misrepresent the origin ofimports, thus forcing customs officials to require additional documentation and further slowingthe process. Thus, measures to streamline customs procedures and introduce greater competitionin regional transportation services would enhance the benefits of regional trade agreements.
The third reason for the modest gains associated with regional trade agreements is thesimilarity in the economic structures of member countries. If all member countries import wheatand maize, export fruits and vegetables and have similar wage rates, then the gains from trade arelikely to be limited. There will still be some gains from trade even if two countries have identicalfactor endowments (labour, land, capital and other factors of production) because each countrycan specialize in different products so that both countries gain from economies of scale. However,the basic point is that the gains will be less than they would be for trade between countries withdifferent wage rates, different agroclimatic conditions and different types of skills. Trade modelstend to confirm that there would be benefits from economic integration among NENA countries,but the benefits are substantially smaller than the benefits associated with multilateral tradeliberalization or liberalization with developed countries.
9.2.3 Position with regard to bilateral liberalizationThe EU is in the process of signing EMAAs with six of the NENA13 countries and preparingagreements with three more.49 Although the EU is the largest trading partner for all of thesecountries, studies suggest that the impact of the agreements on welfare in the NENA countries ispositive, but rather small, typically less than 1%. The main reason for this is that the agriculturalsector is largely excluded from the agreements. Simulation studies confirm the economic intuitionthat the gains from the agreements would be much larger if the agreements included liberalizationin the agricultural sector. Since the broader Barcelona process envisages agricultural liberalizationat some later date, the six countries with association agreements should begin to explore thefeasibility of a second round of negotiations that would include agriculture. While recognizing thepolitical sensitivity of agricultural prices, leaders in the NENA countries should keep in mind thatmost of the benefits of an expanded association agreement will be related to the degree of domesticliberalization within their own countries. At the same time, the benefits will be larger if domesticliberalization is combined with a reduction in the trade barriers to agricultural imports in the EU,which is the rationale for insisting on reciprocity. Liberalization in EU tariff and non-tariff barrierson fruits, vegetables, olive oil and sugar would be particularly beneficial to the NENA countries. Itis quite possible, however, that the NENA countries will not be able to persuade the EU to exploreagricultural liberalization. In that case, the NENA countries would be advised to pursue the sameobjectives in the context of WTO multilateral trade negotiations.
49/ The six countries with EMAAs are Algeria (2005), Egypt (2004), Jordan (2002), Morocco (2000), Tunisia (1998) and Turkey (1998).Lebanon and West Bank and Gaza have interim association agreements, while Syria is a candidate for an association agreement.

155
The United States has signed FTAs with Jordan and Morocco and has interim Trade andInvestment Framework Agreements with four other NENA13 countries. The United States is arelatively minor trading partner with all of these countries; so, the NENA13 countries should notexpect large effects, positive or negative, as a result of increased trade with the United States. On theother hand, these agreements may facilitate foreign direct investment in the NENA countries in twoways. First, the agreements typically include measures to create a more favourable climate for privateinvestment, including the streamlining of bureaucratic procedures and greater transparency inregulations. Second, the agreements constitute a signal that the government is committed to greaterintegration in the global economy, which is in itself an encouraging sign for prospective investors.
9.2.4 Position with regard to unilateral liberalizationEconomic analysis suggests that, in general, unilaterally reducing import protection and domesticsupport for agriculture will increase aggregate output. Indeed, it is easy to demonstrate that thebenefits of lower domestic prices to consumers are greater than the losses to producers. Yet,policymakers, trade negotiators and many non-economists see reducing domestic protection as theprice a country must pay to gain access to markets in other countries. Is economic analysis flawed,perhaps based on simplifying assumptions that do not hold in the real world? Or is theconventional wisdom incorrect, biased by political pressures that give greater weight to the interestsof producers over consumers?
A common argument for protectionism in general is the infant industry argument, wherebyindustries learn to be competitive, while growing under the protection of trade barriers. Althoughthere is a large body of literature on this topic, it is not relevant in this context because the infantindustry argument is rarely invoked to defend agricultural protection.
In the case of agricultural protectionism, a more common argument is that, in developingcountries in general and in the NENA region in particular, poor farmers cannot compete with large-scale technologically advanced farmers in developed countries, particularly if the latter receiveproduction subsidies. Certainly, commercial farmers in developing countries are hurt by thesubsidies given to farmers in the EU, the United States and other countries, as well as the highbarriers to agricultural imports in many countries. But, in spite of these subsidies, Egypt is acompetitive exporter of cotton and rice; Morocco is able to export tomatoes to Europe; and Tunisiais a major exporter of olive oil. This suggests that NENA countries can compete in markets wherethey have comparative advantages. Small farmers in the NENA region can compete because theircosts for labour and land are lower and because they enjoy a climate that is more suitable for theproduction of some agricultural commodities, particularly during the European winter.
Another argument revolves around the concept that import barriers on agricultural productsreduce poverty among poor agricultural producers. However, the analysis presented in this reportsuggests that higher agricultural prices have mixed effects on the poor; for example:
• In Egypt, simulations reveal that higher agricultural prices generally reduce poverty amonggrowers, but that the effects on overall poverty are quite small.
• In Syria, the removal of wheat subsidies (lowering the producer price, but raising theconsumer price) adversely affects poor households.
• In Tunisia, removing import barriers reduces some agricultural prices, but also reducespoverty among farmers and agricultural labourers.
• In Morocco, Ravallion and Lokshin (2004) find that lower agricultural prices adversely affectthe poor.
There are several reasons for these small and mixed effects, as follows:• Higher agricultural prices benefit some poor households (farmers with net sales), but they
hurt other poor households (the urban poor and net buyers in rural areas).• The percentage of households that are net sellers of agricultural goods is relatively small
because, in most NENA13 countries, less than half the population is in farming, and asignificant share of farmers are net buyers.
CHAPTER 9: SUMMARY AND POLICY IMPLICATIONS

156
• Farmers who are net sellers tend to be richer than the average farmer; so, higher farmincomes do not always translate into lower poverty.
• Even those farmers who are both poor and net sellers rely on non-agricultural activities fora significant share of their incomes.
In other words, agricultural protection is a costly and imprecise tool with which to address theproblem of rural poverty. In the sections below, we discuss alternative policies that address ruralpoverty more directly.
Another argument for agricultural protection is that it serves as a useful bargaining chip ininternational negotiations, giving developing countries something to offer in exchange for greateraccess to markets in high-income countries. While there is some merit in this argument, it is notclear that developing countries see agricultural protection merely as a means to extract reciprocalliberalization among trade partners. The fact that the LDCs have been able to avoid almost all ofthe disciplines built into the URAA suggests that they view agricultural protection as an end, ratherthan a means.
Although political considerations may limit the ability of governments to implementunilateral trade liberalization, policymakers and trade negotiators should at least be aware that thebenefits exceed the costs. The example of Egypt’s trade reforms of 2004 indicate that there is somescope for trade reform outside the context of reciprocal trade agreements.
9.2.5 Complementary policies to facilitate adjustmentSeveral studies have indicated that the size of the gains from trade liberalization depend on theexistence of complementary policies and programmes. The gains are smallest (or the losses largest)when consumers and producers are limited in their ability to respond to new opportunities andnew prices. Studies of trade liberalization in Morocco and Tunisia show that, if factor markets areflexible, the benefits of trade liberalization are three to five times greater than when factor marketsare rigid (see Dennis 2006b). Flexible factor markets allow factors of production (such as land,labour and capital) to be reallocated from formerly protected sectors to newly profitable sectors.Examples of rigidities in NENA factor markets include:
• regulations limiting the use of temporary workers and expatriates;• the complicated bureaucratic procedures involved in dismissing workers;• large severance allowances;• delays in the application for and issuance of land and construction permits;• significant capital requirements in starting a new business; and• difficulties in closing a business.
While these bureaucratic problems are common in many countries, business climate surveyssuggest that they are more severe in the NENA countries than they are in most developingcountries. As described in Chapter 2, in a ranking among countries based on the ease of doingbusiness, only three NENA countries are in the top half (Jordan, Tunisia and Lebanon are rankedin the 45th to 49th percentile range), and several are in the bottom 15% (Egypt, Djibouti and theSudan) (IFC 2006).
Of course, these regulations apply mainly to the formal sector. In agriculture, flexibility is morelikely to be enhanced by effective agricultural services such as extension and market informationsystems that provide farmers with useful information about the agronomic and economic aspectsof shifting into new commodities. It is sometimes claimed that farmers are not able to substituteinto new crops because of agroclimatic limitations. This view is contradicted by numerous studiesshowing that farmers respond to incentives in the form of input and output prices, as well as newtechnology.
Another type of complementary policy that enhances the economic effect of tradeliberalization is trade facilitation. This category includes measures to reduce the transaction costsrelated to international trade, including excessive documentation requirements, authorizationsfrom multiple agencies, unclear or subjective criteria for the application of duties and delays anduncertainties related to customs clearance.

157
9.2.6 Complementary policies to support agricultureAs discussed above, global trade liberalization will raise world agricultural prices, but domestictrade reform will partially or completely offset this effect. For NENA13 countries with a high levelof agricultural protection, such as Morocco, Syria and Tunisia, the combined effect would probablybe a reduction in agricultural prices. Furthermore, the analysis presented in this report suggests thatlower agricultural prices tend to raise the incidence of poverty, although the net effect is smallbecause some poor households (such as urban consumers and net buyers in rural areas) gain.Policymakers may be interested in providing additional assistance to farmers both in the interestof alleviating poverty and as compensation to ensure political support for trade reform. Thisassistance may take the form of support for agricultural production or direct assistance to farm (orrural) households.
Under WTO rules, support for agricultural production is classified as amber box, blue box orgreen box. Amber box support includes various types of agricultural support prices and inputsubsidies. Some of the NENA13 countries are subject to disciplines under WTO commitments,while others are exempt either because they are LDCs or because they are not WTO members.50
However, as discussed above, these policies are costly ways to help farmers and are not efficient atproviding assistance to poor households.
Blue box support refers to agricultural support prices that are combined with policies to limitproduction through quotas or land set-asides. These are exempt from WTO restrictions based onthe idea that the production limits prevent the support prices from distorting agricultural trade.Although these are legal under the URAA, it is not advisable to implement blue box policies in theNENA region for three reasons. First, it is difficult to justify the direct and administrative costs ofsuch programmes in terms of the benefits to the overall economy, nor are the programmesparticularly effective as anti-poverty measures. Second, these programmes are difficult toadminister and monitor. The producer subsidy creates a strong incentive to evade productionlimits, creating a need for monitoring and enforcement, as well as the potential for corruption.Third, it is likely that blue box programmes will be limited under the Doha Round. Both theEuropean Union and the United States have proposed limiting blue box expenditures to 2-5% ofthe value of production. De Gorter et al. (2004) propose eliminating the blue box and countingthese programmes within the amber box.
Green box support for agriculture is exempt from WTO restrictions. It includes the followingtypes of programmes:
• agricultural research and extension;• pest and disease control;• inspection services;• marketing and promotion services;• marketing infrastructure;• public stockholding for food security;• natural disaster relief;• income insurance and safety-net programmes;• environmental protection programmes; and• regional assistance programmes.
Although most of these may be considered programmes that support agriculture, they are allowedunder WTO rules because, supposedly, they provide “no, or at most minimal trade distorting effectsor effects on production” (WTO 1994). In fact, some of these services may significantly facilitateagricultural production and exports. They are presumably exempted because they provide necessaryservices for the agricultural sector. In economic terms, they provide public goods, which, because
50/ Somalia, Syria, and the West Bank and Gaza are not WTO members. Djibouti, Somalia, the Sudan and Yemen are consideredLDCs. Algeria and Lebanon are WTO observers, which means that they intend to apply for membership within five years and willeventually be subject to WTO rules. Turkey has not declared amber box expenditures and is thus required to keep product-specificsubsidies below 10% of the value of each subsidized product and general agricultural subsidies below 10% of the value ofagricultural production. Jordan, Morocco and Tunisia have declared amber box expenditures and were obliged to cut them by13.3% over 1995-2005 (de Gorter et al 2004).
CHAPTER 9: SUMMARY AND POLICY IMPLICATIONS

158
of externalities or difficulty in charging users for the services, are undersupplied by the privatesector. One implication is that it is possible for well-designed government services in these areas togenerate benefits for the public that exceed the costs of the programme in value.
As discussed elsewhere above, domestic trade liberalization in the NENA13 countries is likely tostimulate diversification from grain production into alternative crops such as oilseeds and fruits andvegetables. As the process of diversification proceeds, the importance of these services will inevitablyrise. As farmers diversify into new crops, they will require more information about productionmethods and marketing opportunities. As they switch to perishable crops, disease and pest controlbecomes more important. As they attempt to supply increasingly quality-sensitive consumers inurban areas and in foreign markets, grading and inspection services become critical. Policymakersmay facilitate this process by promoting agricultural institutions that provide public services,particularly for small and vulnerable farmers. Funding is necessary because agricultural research andextension services cannot be effective if they are forced to recover costs by selling inputs. But greaterfunding is not sufficient: the institutions must be designed to provide incentives so that the servicesare demand driven, allowing them the flexibility to respond to changing demands.
9.2.7 Complementary policies to support farmersOne type of green box programme does not involve the provision of public goods: decoupledpayments to farmers. Payments are decoupled when they are not based on current production, but,rather, on some fixed criterion such as production or area planted in a base year. Over the last15 years, economists and policymakers have become increasingly interested in agricultural reformthat shifts from producer subsidies and import protection towards decoupled payments to farmers.The appeal of such a reform is that decoupled payments may provide equivalent support to farmersat a lower fiscal and economic cost. The fiscal cost is lower for a given level of farm income supportbecause the decoupled payments are direct income support, rather than indirect support throughagricultural prices. The economic cost is lower because decoupled payments do not distortagricultural production and trade and therefore do not influence farm decisions.
Decoupled payments to farmers have been tried in the European Union, Mexico and theUnited States, among other countries (see Baffes and de Gorter 2004). Below, we summarize thesethree experiences:
• In the 1985 US farm bill, the basis for payments was shifted from current production tocurrent area and historical yield. The 1996 farm bill, known as the Federal AgricultureImprovement and Reform Act, replaced traditional agricultural programmes with decoupledpayments under production flexibility contracts that were to be phased out over six years.The act was undermined by the US Congress, which provided supplemental farm aid in theform of emergency relief and loan deficiency payments almost every year.
• The EU has also moved towards decoupled payments to farmers. In 1992, the EU reformedthe common agricultural policy to reduce price supports and switch from current plantedarea to area in a base year. Over the 1990s, decoupled payments rose so that they accountedfor more than 20% of total producer support, while import protection was reduced. In2003, the EU decided to increase decoupled payments to account for three quarters of thesupport for crop production.
• Mexico introduced a decoupled payment programme in 1994 in preparation for the NorthAmerican Free Trade Agreement. The Procampo programme shifted Mexican agriculturalpolicy from support prices and input subsidies to a system of fixed payments based onhistorical area, thus compensating farmers for the reduction in import protection associatedwith the new agreement. The programme was made more progressive by setting a minimumone hectare payment even for farms below this size and by capping the maximum paymentallowed. As in the United States, the programme was partially undermined in 2002 by thereintroduction of price supports.

159
Perhaps most relevant to the NENA13 countries is the case of Turkey. In 2000, Turkey wasproviding US$6.4 billion in support for agriculture, of which US$1.4 billion was price support andinput subsidies, and US$5 billion was in the form of import protection. In 2001, Turkey launchedthe Agricultural Reform Implementation Programme with support from the World Bank. Theobjectives of the programme were to: (i) introduce direct income support payments, decoupledfrom production decisions; (ii) phase out agricultural price supports and input subsidies; and (iii)implement a system of direct income payments, decoupled from production levels. Theprogramme began with a pilot project to experiment with alternative methods of establishing aregistry of farms. Then, a massive farm registration programme was launched that eventuallyregistered 2.8 million farms. The direct income support payments were approximately US$90 per haper year up to 50 ha. Over 2001-04, the payments increased, while price supports and inputsubsidies were phased out, so that, by 2004, the payments accounted for over 70% of the total(Cakmak 2004; Olhan 2006).
The impact of the programme has been mixed, though the interpretation of trends has beencomplicated by an economic crisis in 2001 during which real GDP fell by 7.5%. Between 1999 and2003, the total area cultivated declined by 4%. The production of wheat, barley and maizeincreased by 5-6%, while cotton output expanded by 21%. The area under olive groves andorchards increased by 5% and 7%, respectively. On the other hand, the production of sugar beetand tobacco fell by one quarter and one half, respectively, in response to the elimination of pricesupports (Olhan 2006). Overall, agricultural value added per worker in agriculture rose 10%between 1998-99 and 2003 (Cakmak 2004).
In summary, decoupled payments to farmers represent a promising approach to reducing theeconomic distortions associated with agricultural price supports, import protection and inputsubsidies, while compensating farmers and minimizing any adverse impact on poverty. At the sametime, it should be recognized that most NENA countries use import protection to support farm pricesrather than as direct subsidies. In this situation, switching from import protection to a programme ofdecoupled payments implies both a loss in tariff revenue and significant new expenditure.
9.2.8 Complementary policies to assist the rural poorDecoupled payments are a political solution to the problem of phasing out costly programmesinvolving support prices, input subsidies and import protection and of compensating farmers fortheir loss. Although the incidence of poverty is generally higher among farmers than among thegeneral population, such programmes cannot be considered safety-net programmes because theydo not target poor households. Decoupled payments to farmers exclude poor non-farmers,including agricultural wage labourers, owners of microenterprises and the urban poor.Furthermore, among farmers, benefits are generally proportional to farm size; so, the benefits arelikely to be greater for richer farmers than for poor farmers.
If the objective is to assist poor and vulnerable households regardless of their occupation, adifferent type of programme should be considered. A wide variety of safety-net programmes havebeen established in developing countries with the explicit objective of reducing poverty or, at least,some of the negative effects of poverty. While a thorough review of alternative safety-net programmesis beyond the scope of this report, it is useful to describe briefly the main types of programmes.
Universal food subsidies reduce the cost of selected foods (usually basic staples) for the benefitof all consumers. The advantages include relatively simple administration (no targeting) and thefact that the relative benefits are greater for poor households because food (particularly basicstaples) are a larger share of the budgets of poor households. In the 1980s, Egypt, Jordan, Syria andTunisia offered universal food subsidies for goods such as bread, wheat flour, cooking oil and sugar.These programmes have become less popular in the last 15 years for several reasons: the high fiscalcost, the leakage of benefits to non-poor households and the low coverage among some groups ofpoor households, particularly in rural areas. One review of 15 food subsidy schemes has found thatonly three of them are progressive in the sense that the per-person benefits are greater among thepoor than among the non-poor (Coady, Grosh and Hodinott 2002).
CHAPTER 9: SUMMARY AND POLICY IMPLICATIONS

160
Targeted food subsidies make subsidized food available to selected households geographicallythrough low-price shops located in poor neighbourhoods or through some form of ration cardsthat entitle bearers to purchase food at subsidized prices. Egypt, Jordan and Tunisia have attemptedto introduce targeting into their food subsidy programmes (Coady 2004). In the experience inEgypt, however, corruption and political pressure led to a situation in which large numbers of non-poor households held ration cards. Efforts to narrow eligibility faced strong political opposition(Kherallah et al. 2000).
Labour-intensive public works programmes usually combine infrastructure development (such asroad building) with hiring policies to maximize the pro-poor impact. If designed well, they mayimprove community infrastructure and provide assistance to the poorest households with able-bodied members. If the wage rate is set appropriately (somewhat below the prevailing wage rate),the programme is self-targeting in that the more well off members of the community will not findit worthwhile to participate, while the poor will. One drawback of these programmes is the highcost of supervising the work relative to that in cash transfer programmes. In addition, theseprogrammes cannot assist those unable to work because of age or disability. Finally, there is a trade-off between the goal of providing quality public infrastructure, which often requires semi-skilledlabour, and the goal of serving the poorest members of the community, who do not have theseskills. One example of this is the World Bank-funded labour-intensive public works programmeknown as the Second Rural Employment Programme. This US$95 million programme focuses onnorth-west and north-central Algeria and emphasizes public works to maintain natural resourcesand reduce soil erosion (World Bank 2003b).
Conditional cash transfer programmes have generated considerable interest among researchersand policymakers in the last 10-15 years. These programmes provide cash grants to householdsthat comply with certain requirements, usually keeping children in school, attending health clinics,or receiving pre- and postnatal care. Like food-for-work programmes, conditional cash transfersserve a dual purpose: providing assistance to poor households and encouraging investments inhuman capital that reduce the chance of poverty being transmitted to the next generation. TheProgresa Programme was launched in Mexico in 1997 and phased in over three years, eventuallyreaching 2.6 million rural families. Eligibility is determined in two stages by first selecting poorvillages and then selecting poor families within these villages. Progresa is one of the more widelystudied conditional cash transfer programmes in part because the gradual expansion of theprogramme has been randomized by village, allowing quasi-experimental tests of the impact ofthe programme. Studies show that it has been successful in increasing school attendance, reducingthe incidence of child labour and improving child health (Skoufias 2005; Gertler 2004).Conditional cash transfer programmes have also been implemented in Bangladesh, Nicaraguaand Turkey, among other countries.
While this section provides only a brief glimpse of alternative safety-net programmes, itdemonstrates that there are a number of interesting and effective programmes for providingassistance to poor rural families in developing countries.


162
References
Abdelkhalek, Touhami. 2002. “The Impact of the Liberalisation of the Moroccan Grain Market Based on aRural Household Model”. Cahier de recherche, September, MIMAP/INSEA.
Adams, Richard, Jr. 2001. “Non-Farm Income, Inequality and Poverty in Rural Egypt and Jordan”. PolicyResearch Working Paper 2572, World Bank, Washington, DC.
Akesbi, N. 2002 “Développement et politiques agroalimentaires dans la région méditerranéenne”. NationalReport – Morocco. CIHEAM. Paris, France.
Aksoy, M. A., and J. C. Beghin (eds). 2004. Global Agricultural Trade and Developing Countries. Washington, DC:World Bank.
Anderson, K. 2003. “Trade Liberalization, Agriculture, and Poverty in Low-Income Countries”. WIDERDiscussion Paper 2003/25. World Institute for Development Economics Research United NationsUniversity, Helsinki.
Anderson, K., W. Martin and D. Van der Mensbrugghe. 2005. “Market and Welfare Implications of DohaReform Scenarios”. In Trade Reform and the Doha Agenda, eds, K. Anderson and W. Martin. Washington,DC: World Bank.
Armington, Paul S., 1969. “A Theory of Demand for Products Distinguished by Place of Production”. IMFStaff Papers 16, 159-76.
Astrup, C., and S. Dessus. 1998. “Trade Options for the Palestinian Economy: Some Orders of Magnitude”.Unpublished working paper, Middle East and North Africa Region, World Bank, Washington, DC.
Augier, P., and M. Gasiorek. 2001. “Trade Liberalization between the Southern Mediterranean and the EU:The Sectoral Impact”. Discussion Paper 79 (December), University of Sussex at Brighton, Brighton, UnitedKingdom.
Baffes, J., and H. de Gorter. 2004. “Experience with Decoupling Agricultural Support”. In Global AgriculturalTrade and Developing Countries, eds, M. A. Aksoy and J. C. Beghin. Washington, DC: World Bank.
Bailey, K. 2005. “Implications of European Policy Reforms on the U.S. Dairy Industry”. PennState Staff Paper375, http://dairyoutlook.aers.psu.edu/reports/Pub2005/staffpaper375.pdf.
Bakour, Yahya. 2004. “Reforming and Developing the Agricultural Sector and the Needs from Trade andEconomic Liberalization”. Paper presented at the conference organized by the Syrian Association ofEconomic Sciences, Damascus.
Bayar, A. H. 2000. “The Impacts of a New Round of Multilateral Trade Liberalization on the MENA Region: APreliminary Appraisal”. Economic Research Forum, Seventh Annual Conference, Amman, 26-29 October.
Bayar, A. H. with contributions from G. Ben-Ahmed, W. Coscia, and J. Dupierreux. 2000. “The impacts of anew round of multilateral trade liberalization on the MENA region”. Economic Research Forum’s SeventhAnnual Conference, Amman, October 26-29, 2000.
Bayar, A. H (ed.). 2001. “Fiscal Challenges of the Euro-Mediterranean Agreements”. ForumEuroMéditerranéen des Instituts Economiques and Economic Research Forum. http://www.femise.org/PDF/bayar_a_fisc_0105.pdf.
Beuchelt, T. 2005. “The Euro-Mediterranean Partnership and Agricultural Trade Liberalization”. Market Tradeand Institutions Division, International Food Policy Research Institute, Washington, DC.
Blayney, D. P., and M. Gehlhar. 2005. “U.S. Dairy at a New Crossroads in a Global Setting”. Amber Waves,November, Economic Research Service, US Department of Agriculture,http://www.ers.usda.gov/AmberWaves/November05/Features/USDairy.htm.
Bouet. A., Y. Decreux, L. Fontagne, S. Jean, and D. Laborde. 2004. “A Consistent Ad Valorem EquivalentMeasure of Applied Protection across the World: The MAcMap-HS6 Database”. CEPII Working Paper2004-22, Centre d’Etudes Prospectives et d’Informations Internationales, Paris.
Bouet, A. 2006a. “What Can the Poor Expect from Trade Liberalization: Opening the ’Black Box’ of TradeModeling”. Discussion Paper 93, Market Trade and Institutions Division, International Food PolicyResearch Institute, Washington, DC.
Bouet, A. 2006b. “Defining a Trade Strategy for South Mediterranean Countries”. Draft working paper,International Food Policy Research Institute, Washington, DC.

163
Bouet, A., S. Mevel and D. Orden. 2006. “More or Less Ambition in the Doha Round?: Winners and Losersfrom Trade Liberalization with a Development Perspective”. Paper presented at the conference of the Foodand Agriculture Organization of the United Nations, Rome, 2-3 February.
Bourguignon, F., C. Morrisson and A. B. Atkinson. 1991. “Empirical Studies of Earnings Mobility”. DELTAWorking Papers 91-14, DELTA, Ecole normale supérieure, Paris.
Bourguignon, F., A. S. Robilliard and S. Robinson. 2002. “Representative Versus Real Households in theMacroeconomic Modeling of Inequality”. Unpublished working paper, World Bank, Washington, DC.
Burniaux, J.-M., G. Nicoletti and J. Oliveira-Martins. 1992. “GREEN: A Global Model for Quantifying theCosts of Policies to Curb CO2 Emissions”. OECD Economic Studies, 19 (winter): 21-32, Organisation forEconomic Co-operation and Development, Paris.
Bunte, F. 2005. “Liberalising EU imports for fruits and vegetables”. Paper prepared for presentation at the 99th
seminar of the EAAE (European Association of Agricultural Economists), “The Future of Rural Europe in theGlobal Agri-Food System”, 23-27 August 2005, Copenhagen.
Cakmak, E. H. 2004. “Structural Change and Market Opening in Agriculture: Turkey towards EU Accession”.ERC Working Papers in Economics 04/10, Middle East Technical University, Ankara.
Central Bank of Tunisia. 2005. Annual Report 2004. Tunis: Central Bank of Tunisia.
Central Bureau of Statistics (CBS). 2005. Statistical Abstract. Damascus: Central Bureau of Statistics.
CEPII (Centre d’Etudes Prospectives et d’Informations Internationales). 2005. “MAcMap”. CEPII, Paris,http://www.cepii.fr/francgraph/bdd/macmap.htm.
Chaherli, N. 2002. “Agricultural Trade Liberalization: Main Issues for the MENA Region”. http://lnweb18.worldbank.org/mna/mena.nsf/Attachments/Chaherli/$File/Chaherli.pdf. (accessed December 2005).
Chemingui, M. A., and S. Dessus. 2001. “The Liberalization of Tunisian Agriculture and the European Union:A Prospective View”. In Towards Arab and Euro-Med Regional Integration, eds, S. Dessus, J. Devlin and R.Safadi. Paris: Development Centre, Organisation for Economic Co-operation and Development.
Chemingui, M. A., and C. Thabet. 2001. “Internal and External Reforms in Agricultural Policy in Tunisia andPoverty in Rural Area”. Paper presented for the Global Development Network Research MedalCompetition, http://www.gdnet.org/pdf/chemingui.pdf.
Chemingui, M. A., and S. Dessus. 2004. “Assessing Non-Tariff Barriers in Syria”. Unpublished working paper,World Bank, Washington, DC.
Chemingui, M. A., and C. Thabet. 2005. “Agricultural Trade Liberalization and Poverty in Rural Areas inTunisia: Micro-Simulation in a General Equilibrium Framework”. Paper presented at the Fourth Povertyand Economic Policy Research Network General Meeting, Colombo, Sri Lanka, 13-17 June.
Chemingui, M. A., and H. Fetini. 2006. “Considerations for Reforming Energy Price Subsidies in Syria: APolicy Note”. World Bank, Washington, DC.
Chemingui, M. A., and M. H. Lahouel. 2006. “Trade Policy”. In Tunisian Profile. Paris: Forum Euro-Méditerranéen des Instituts Economiques and the European Commission.
Chemingui, M. A., and M. A. Marouani. 2006. “The Economic and Regulatory Policy Implications forOverlapping Preferential Trade Agreements in the Arab Countries: The Case of Tunisia”. Economic ResearchForum for the Arab Countries, Iran and Turkey, and International Development Research Centre, Cairo.
Chemingui, M. A., and C. Thabet. 2006. “Agricultural Trade Liberalization and Poverty in Rural Areas inTunisia: Micro-Simulation in a General Equilibrium Framework”. Unpublished study in progress.
CIA (Central Intelligence Agency of the US). 2005. World Factbook,http://www.cia.gov/cia/publications/factbook/index.html (accessed December 2005).
CIE (Centre for International Economics). 2001. “Trade Distortions and Cotton Markets: Implications forAustralian Cotton Producers”. Report prepared for the Cotton Research and Development Corporation,Canberra.
Coady, D., M. Grosh and J. Hodinott. 2002. “Targeting Outcomes Redux”. Discussion Paper 144, FoodConsumption and Nutrition Division, International Food Policy Research Institute, Washington, DC.
Coady, D. 2004. “Designing and Evaluating Social Safety Nets: Theory, Evidence and Policy Conclusions”.Discussion Paper 172, Food Consumption and Nutrition Division, International Food Policy ResearchInstitute, Washington, DC.
REFERENCES

164
Cockburn, J., B. Decaluwé and B. Costi. 1998. “Les leçons du mariage entre modèles d’équilibre généralecalculable et la nouvelle théorie du commerce international: Application à la Tunisie”. Centre deRecherche en Economie et Finance Appliquée, Université Laval, Quebec.
Cockburn, J. 2001. “Trade Liberalization and Poverty in Nepal: A Computable General Equilibrium MicroSimulation Analysis”. CREFA Discussion Paper 01-18 (October), Centre de Recherche en Economie etFinance Appliquée, Université Laval, Quebec.
Cogneau, D., and A. S. Robilliard. 2000. “Income Distribution, Poverty and Growth in Madagascar:Microsimulations in a General Equilibrium Framework”. IFPRI Working Paper 61/2000, InternationalFood Policy Research Institute, Washington, DC.
Collier, P. 1999. “On the Economic Consequences of Civil War”. Oxford Economic Papers, 51 (1): 168-83.
Datt, G., D. Jolliffe and M. Sharma. 1998. “A Profile of Poverty in Egypt: 1997”. Discussion Paper 49, FoodConsumption and Nutrition Division, International Food Policy Research Institute, Washington, DC.
Decaluwé, B., A. Patry, L. Savard, and E. Thorbecke. 1999. “Poverty Analysis Within a General EquilibriumFramework”. Cahiers de recherche 9909, Université Laval - Département d’économique.
Dennis, A. 2006a. “The Impact of Regional Trade Agreements and Trade Facilitation in the Middle East andNorth Africa Region”. Policy Research Working Paper 3837, World Bank, Washington, DC.
Dennis, A. 2006b. “Trade Liberalization, Factor Market Flexibility, and Growth: The Case of Morocco andTunisia”. Policy Research Working Paper 3857, World Bank, Washington, DC.
DeRosa, D. A. 1997. “Agricultural Trade and Rural Development in the Middle East and North Africa: RecentDevelopments and Prospects”. Policy Research Working Paper 1732, World Bank, Washington, DC.
Dessus, S., and S. Suwa-Eisenmann. 2000. “Trade Integration with Europe and Labour Reallocation in theSouthern Mediterranean Countries: The Case of Egypt”. Séminaire Erudite, December.
Devarajan, S., and S. Robinson. 2002. “The Influence of Computable General Equilibrium Models on Policy”.TMD Discussion Paper 98, Trade and Macroeconomic Division, International Food Policy Research Institute,Washington, DC.
de Gorter, H., M. Ingco, and L. Ignacio. 2004. “Domestic support: Economics and policy instruments”. InAgriculture and the WTO: Creating a Trading System for Development, (eds.) M. Ingco and J. Nash. The WorldBank, Washington, DC.
Diaz-Bonilla, E., M. Thomas, S. Robinson, and A. Cattaneo. 2000. “Food Security and Trade Negotiations inthe World Trade Organization: A Cluster Analysis of Country Groups”. Discussion Paper 59, Trade andMacroeconomics Division, International Food Policy Research Institute, Washington, DC.
Doukkali, Rachid. 2003. “Etude des Effets de la Libéralisation des Céréales: Resultats des Simulations à l’Aided’un Modèle Equilibre Général Calculable”. Joint Report of the Ministry of Agriculture and World Bank,Washington, DC.
El-Laithy, H., M. Lokshin and A. Banerji. 2003. “Poverty and Economic Growth in Egypt, 1995-2000”. PolicyResearch Working Paper 3068, World Bank, Washington, DC.
El-Obeid, A., and J. C. Beghin. 2005. “Multilateral Trade and Agricultural Policy Reforms in Sugar Markets”.CARD Working Paper 04-WP 356, Food and Agricultural Policy Research Institute, Iowa State University,Ames, IA, http://www.card.iastate.edu/publications/DBS/PDFFiles/04wp356.pdf.
Ender, Gary. 2000. Accomplishments in Agricultural Policy Reform in Egypt, 1997-2001. Cambridge, MA: AbtAssociates Inc.
ERF (Economic Research Forum). 2000. “Intra-Regional Trade and the Greater Arab Free Trade Area”.http://www.erf.org.eg/economic_00/html/body_intra-regional.html.
Europa. 2003. “Generalised System of Preferences: User’s Guide to the European Union’s Scheme ofGeneralised Tariff Preferences, February 2003”.http://ec.europa.eu/comm/trade/issues/global/gsp/gspguide.htm.
Europa. 2005. “European Union Ministers Agree to Initiate Services and Investment Talks withMediterranean Countries”. Press release IP/05/1445, 21 November.
Europa. 2006. “Towards a Reform of the Internal Aspects of the Common Organization of the Market inBananas”. Consultation document, Impact Analysis Steering Group, Brussels, 3 April.
FAO (Food and Agriculture Organization of the United Nations). 2003a. “Report of the Food SecurityAssessment: West Bank and Gaza”. FAO, Rome.

165
FAO (Food and Agriculture Organization of the United Nations). 2003b. “Trade, Market Access and FoodSafety in the Near East Region”. http://www.fao.org/docrep/meeting/007/ad388e/ad388e00.htm.(accessed December 2005).
FAO (Food and Agriculture Organization of the United Nations). 2003c. “Financing Normal Levels ofCommercial Imports of Basic Foodstuffs in the Context of the Marrakech Decision on Least-Developedand Net Food-Importing Developing Countries”. FAO, Rome.
FAO (Food and Agriculture Organization of the United Nations). 2003d. “WTO Agreement on Agriculture:The Implementation Experience, Developing Country Case Studies”. FAO, Rome.
FAO (Food and Agriculture Organization of the United Nations). 2004. “Agricultural Development Policiesin the Near East: Situation, Issues, Institutional Requirements and Approaches”. TCAS Working Document57, Proceedings of the Joint FAO/NAPC Regional Workshop on Institution Building for AgriculturalPolicies in the Near East, Damascus, 6-7 December 2003.
FAO (Food and Agriculture Organization of the United Nations). 2005a. “FAOSTAT Agricultural Database”.http://apps.fao.org/.
FAO (Food and Agriculture Organization of the United Nations). 2005b. “Key Statistics of Food andAgriculture: External Trade”. http://www.fao.org/es/ess/toptrade/trade.asp?country=3&ryear=2004.
FAO (Food and Agriculture Organization of the United Nations). 2006. “Low-Income Food-Deficit Countries(LIFDC)”. http://www.fao.org/countryprofiles/lifdc.asp?lang=en. (accessed May 2006).
FAO (Food and Agriculture Organization of the United Nations) and WHO (World Health Organization).2003. “Diet, Nutrition and the Prevention of Chronic Diseases”. Report of a joint FAO and WHO ExpertConsultation.
FAPRI (Food and Agricultural Policy Research Institute). 2002. “The Doha Round of the World TradeOrganization: Appraising Further Liberalization of Agricultural Markets”. CARD Working Paper 02-WP317 (November), Food and Agricultural Policy Research Institute, Iowa State University, Ames, IA.
Farsakh, L. 2001. “Economic Viability of a Palestinian State in the West Bank and Gaza Strip: Is It Possiblewithout Territorial Integrity and Sovereignty?” MIT Electronic Journal of Middle East Studies, 1 (May).
Feraboli, O. 2004. “A Dynamic Multisectoral Analysis of Jordan’s Trade Liberalisation”. Paper presented at theInternational Conference on Policy Modelling, EcoMod, Paris, 30 June-2 July.
Foster, J., J. Greer and E. Thorbecke. 1984. “A Class of Decomposable Poverty Measures”. Econometrica, 52: 761-65.
Galal, A., and B. Hoekman (eds). 2003. Arab Economic Integration between Hope and Reality. Washington, DC:Brookings Institution Press.
Gallaway, M. P., C. A. McDaniel and S. A. Rivera. 2000. “Long-Run Industry-Level Estimates of U.S.Armington Elasticities”. Working Paper 2000-09a, US International Trade Commission, Washington, DC.
Garcia-Alvarez-Coque, J. M. 2002. “Agricultural Trade and the Barcelona Process: Is Full LiberalizationPossible?” European Review of Agricultural Economics, 29 (3): 399-422.
Garcia-Alvarez-Coque, J. M. 2003. “Trade and Agriculture: Perspective for the Association Agreement with theEuropean Union”. In Syrian Agriculture at the Crossroads, Agricultural Policy and Economic DevelopmentSeries 8, eds, C. Fiorillo and J. Vercuil. Rome: Food and Agriculture Organization of the United Nations.
Gertler, P. 2004. “Do Conditional Cash Transfers Improve Child Health?: Evidence from Progresa’s ControlRandomized Experiment”. American Economic Review, 94 (2): 336-41.
Golan, A., G. Judge and S. Robinson. 1994. “Recovering Information from Incomplete or PartialMultisectoral Economic Data”. Review of Economics and Statistics, 76: 541-49.
Golan, A., G. Judge and D. Miller. 1996. Maximum Entropy Econometrics: Robust Estimation with Limited Data.Chichester, United Kingdom: John Wiley & Sons.
Grethe, H. 2004. “Agricultural Trade Preferences between Turkey and the EU”. ENARPRI Seminar Paper 10,http://www.enarpri.org/Publications/SPNo10.pdf.
Hanrahan, C., and R. Schnepf. 2005. “WTO Doha Round: Agricultural Negotiating Proposals”. CRS Reportfor Congress, November 9, Congressional Research Service, Washington, DC.
Harrison, G. W., T. F. Rutherford and D. G. Tarr. 1993. “Piecemeal Trade Reform in the Partially LiberalizedEconomy of Turkey”. World Bank Economic Review, 7 (May): 191-217.
Harrison, G. W., T. F. Rutherford and D. G. Tarr. 1997. “Economic Implications for Turkey of a CustomsUnion with the European Union”. European Economic Review, 41(3-5): 861-70.
REFERENCES

166
HGCA (Home-Grown Cereals Authority). 2005. “World Wheat Trade-Import Perspective”. http://www.openi.co.uk/h050404.htm. Accessed June 13, 2006.
Hoekman, B., and D. E. Konan. 1998. “Deep Integration, Regionalism and Nondiscrimination”. WorkingPaper 199804, Department of Economics, University of Hawaii, Manoa, Hawaii.
Hoekman, B., and D. E. Konan. 2005. “Deepening Egypt-US Trade Integration: Economic Implication ofAlternative Options”. Paper presented at the Middle East Economic Association session of the Allied SocialSciences Association 2005 Annual Meeting, Philadelphia.
Hosoe, N. 2001. “A General Equilibrium Analysis of Jordan’s Trade Liberalization”. Journal of Policy Modeling,23 (6): 595-600.
ICAC (International Cotton Advisory Committee). 2002. “Production and Trade Policies Affecting theCotton Industry”. Report, July, Secretariat, International Cotton Advisory Committee, Washington, DC.
IEQ. 2003. “Impact du Démantèlement Tarifaire sur les Echanges Exterieurs”. Les Cahiers de l’IEQ, 17, Tunis.
IFAD (International Fund for Agricultural Development). 2003. Assessment of Rural Poverty: Near East andNorth Africa. Rome: IFAD.
IFC (International Finance Corporation). 2006. “Doing Business: Economic Ranking”.http://www.doingbusiness.org.
IMF (International Monetary Fund). 2004a. “Algeria: Selected Issues and Statistical Appendix”. IMF CountryReport 04/31, IMF, Washington, DC.
IMF (International Monetary Fund). 2004b. “Jordan: Selected Issues and Statistical Appendix”. IMF CountryReport 04/121, IMF, Washington, DC.
IMF (International Monetary Fund). 2005. Direction of Trade Statistics. Washington, DC: IMF.
Ingco, M., and J. D. Nash (eds). 2004. Agriculture and the WTO: Creating a Trading System for Development.Washington, DC: World Bank.
INS (Institut National de la Statistique). 1998. 1997 National Labour Survey. Tunis: Institut National de laStatistique.
INS (Institut National de la Statistique). 2000. Indicateurs statistiques sur la Tunisie. Tunis: Institut National dela Statistique.
INS (Institut National de la Statistique). 2002. Résultats de l’enquête sur le budget des ménages. Volume A,Enquête nationale sur le budget, la consommation et le niveau de vie des ménages, 2000. Tunis: Institut Nationalde la Statistique.
INS (Institut National de la Statistique). 2005. National Accounts 1990-2002. Tunis: Institut National de laStatistique.
Institute of Quantitative Studies. 2003. “Protection effective des activités économiques”. Evolution etperspectives (2003-2008), Institute of Quantitative Studies, Tunis.
Jeune Afrique. 2005. “Algerie”. http://www.jeuneafrique.com/pays/algerie/algerie.asp.
Khan, Q., and S. Chase. 2003. “Yemen and the Millennium Development Goals”. Middle East and NorthAfrica Working Paper 31, World Bank, Washington, DC.
Khasawneh, Nasser Ali. 2000. “The Arab Free Trade Zone: The Arab World’s Best Kept Secret”. http://www.globalcomment.com.
Kherallah, M., H. Lofgren, P. Gruhn and M. Reeder. 2000. “Wheat Policy Reform in Egypt: Adjustment ofLocal Markets and Options for Future Reforms”. Research Report 115, International Food Policy ResearchInstitute, Washington, DC.
Konan, D. E. and K. Maskus. 1997. “A Computable General Equilibrium Analysis of Egyptian TradeLiberalisation Scenarios”. In Regional Partners in Global Markets: Limits and Possibilities of the Euro-MedAgreements, eds, A. Galal. and B. Hoekman. London: Centre for Economic Policy Research; Cairo: EgyptianCentre for Economic Studies.
Konan, D. E. and K. E. Maskus. 2000. Bilateral Trade Patterns and Welfare: An Egypt-EU Preferential TradeAgreement. Working Paper No. 00-01. University of Hawaii at Manoa, Department of Economics.http://www.economics.hawaii.edu/research/workingpapers/001.pdf. Accessed February 28, 2006.
Langley, S., A. Somwaru and M. A. Normile. 2006. “Trade Liberalization in International Dairy Markets:Estimated Impacts”. Electronic report, Economic Research Service, US Department of Agriculture, http://www.ers.usda.gov/publications/ERR16/ERR16.pdf.

167
Lanjouw, P., and M. Ravallion. 1995. “Poverty and Household Size”. Economic Journal, 105 (433): 1415-34.
Lipton, M., and M. Ravallion. 1995. “Poverty and Policy”. In Handbook of Development Economics, Vol. 3, eds,J. Behrman and T. N. Srinivasan. Amsterdam: North-Holland.
Lofgren, H. 1999. “Trade Reform and the Poor in Morocco: A Rural-Urban General Equilibrium Analysis ofReduced Protection”. Discussion Paper 38, Trade and Macroeconomics Division, International FoodPolicy Research Institute, Washington, DC.
Lofgren, H., M. El-Said and S. Robinson. 1999. “Trade Liberalization and Complementary Domestic Policies:A Rural-Urban General Equilibrium Analysis of Morocco”. Discussion Paper 41, Trade andMacroeconomics Division, International Food Policy Research Institute, Washington, DC.
Lofgren, H., R. L. Harris and S. Robinson. 2002. “A Standard Computable General Equilibrium (CGE)Model in GAMS”. Microcomputers in Policy Research 5, International Food Policy Research Institute,Washington, DC.
Lorca, C. A., and J. Vicens. 2000. “The Impact of the Euro-Mediterranean Liberalization of Trade onAgricultural Trade”. September, Universidad Autonoma de Madrid, Forum Euro Méditerranéen desInstituts Economiques Research Programme.
Madcour, M., and A. M. Abou Zeid. 1996. “Egypt: Country Report to the FAO”. Paper presented at theInternational Technical Conference on Plant Genetic Resources, Leipzig, 17-23 June.
Malvarosa, L. 2002. “The Fish Trade of North African Mediterranean Countries: Intra-Regional Trade andImport-Export with the European Union”. FAO Fisheries Circular 978, Food and Agriculture Organizationof the United States, Rome.
MARH (Ministry of Agriculture, Environment and Water Resources). 2006. “Enquête sur les Structures desExploitations Agricoles 2004-2005”. Direction Générale des Etudes et du Développement Agricole,Ministry of Agriculture, Environment and Water Resources, Tunis.
McQueen, Matthew. 2002. “The EU’s Free Trade Agreements with Developing Countries: A Case of WishfulThinking?”. World Economy, 25 (9), 1369-85.
Mercenier, Jean, and Erinç Yeldan. 1997. “On Turkey’s Trade Policy: Is a Customs Union with EuropeEnough?” European Economic Review, 41 (3-5) (April): 871-80.
Ministry of Agriculture and Land Reclamation, Arab Republic of Egypt, http://www.agri.gov.eg/.
Minot, N., and L. Daniels. 2005. “Impact of Global Cotton Markets on Rural Poverty in Benin”. AgriculturalEconomics, 33 Supplement: 453-66.
Mitchell, D. O., and M. Mielke. 2004. “Wheat: The Global Market, Policies and Priorities”. In Global AgriculturalTrade and Developing Countries, eds, M. A. Aksoy and J. C. Beghin. Washington, DC: World Bank.
Muaz, S. 2004. “The Impact of Euro-Mediterranean Partnership on the Agricultural Sectors of Jordan,Palestine, Syria, Lebanon and Egypt: The Case of Horticultural Exports to EU Markets”. FEM21-03, ForumEuro-Méditerranéen des Instituts Economiques Research, Paris.
Nashashibi, K. 2002. “Fiscal Revenues in South Mediterranean Arab Countries: Vulnerabilities and GrowthPotential”. Working Paper No. 02/67. International Monetary Fund, Washington DC.
Obara, K., J. Dyck and J. Stout. 2005. “Dairy Policies in Japan”. Electronic Outlook Report, August, EconomicResearch Service, US Department of Agriculture, http://www.ers.usda.gov/publications/LDP/Aug05/ldpm13401/ldpm13401.pdf.
OECD (Organization for Economic Co-Operation and Development). 2005a. “Agricultural Policies in OECDCountries: Monitoring and Evaluation 2005, Highlights”. http://www.oecd.org/dataoecd/33/27/35016763.pdf.
OECD (Organization for Economic Cooperation and Development). 2005b. “Turkey: Summary of PolicyDevelopments”. http://www.oecd.org/dataoecd/45/18/35332147.pdf.
Olhan, E. 2006. “The Impact of the Reforms: Impoverished Turkish Agriculture”. Paper presented at the 96thEAAE Seminar, “Causes and Impacts of Agricultural Structures”. Tänikon, Switzerland, 10-11 January.
Oliva, M. 2000. “Estimation of Trade Protection in Middle East and North African Countries”. IMF WorkingPaper WP/00/27, International Monetary Fund, Washington, DC.
Oxfam. 2002. “Cultivating Poverty: The Impact of US Cotton Subsidies on Africa”. Briefing Paper 30, Oxfam,Washington, DC.
Pal, P., and S. Prakash. 2005. “The Dalian Mini Ministerial and the Road to Hong Kong: Uncertain Futurefor WTO”. http://www.ideaswebsite.org/news/aug2005/WTO_Dalian_HK.pdf.
REFERENCES

168
Panagariya, A. 2002. “EU Preferential Trade Arrangements and Developing Countries”. World Economies, 25 (10).
Peridy, N. 2005. Towards a New Trade Policy between the USA and Middle-East Countries: Estimating TradeResistance and Export Potential. Oxford: Blackwell Publishing.
Poonyth, D., and R. Sharma. 2003. “The Impact of the WTO Negotiations Modalities in the Area of DomesticSupport, Market Access and Export Competition on Developing Countries: Results from ATPSM”. Paperpresented at the international conference, Agricultural Policy Reform and the WTO, Capri, Italy, 25-26June.
Radwan, S., and J.-L. Reiffers. 2003. “The Impact of Agricultural Liberalization in the Context of the Euro-Mediterranean Partnership”. Report, November, Forum Euro-Méditerranéen des Instituts Economiques,http://www.femise.org/PDF/femise-agri-gb.pdf.
Rasmussen, W. 2004. “Arab Trade Agreement May Be Fatal for Lebanon’s Farmers”. Daily Star, Thursday, 16December. http://www.dailystar.com.lb/article.asp?edition_id=10&categ_id=3&article_id=11031.
Ravallion, M., and M. Lokshin. 2004. “Gainers and Losers from Trade Reform in Morocco”. Policy ResearchWorking Paper 3368, World Bank, Washington, DC, http://www.wds.worldbank.org/servlet/WDSContentServer/WDSP/IB/2004/08/25/000009486_20040825085439/ Rendered/PDF/377040wps3368.pdf.
Reefat, Amal. 1999. “New Trends in Egypt’s Trade Policy and Future Challenges”. Discussion Paper 36 (March),Egyptian Centre for Economic Studies, Cairo.
Robinson, S., and M. El-Said. 2000. “GAMS Code for Estimating a Social Accounting Matrix (SAM) UsingCross Entropy (CE) Methods”. Discussion Paper 64, Trade and Macroeconomics Division, InternationalFood Policy Research Institute, Washington, DC.
Robinson, S., A. Cattañeo and M. El-Said. 2001. “Updating and Estimating a Social Accounting Matrix UsingCross Entropy Methods”. Economic Systems Research, 13 (1): 47-64.
Roe, T., A. Dinar, Y. Tsur, and X. Diao. 2005. “Feedback Links between Economy-Wide and Farm-LevelPolicies: Application to Irrigation Water Management in Morocco”. Policy Research Working Paper 3550,World Bank, Washington, DC.
Rutherford, T. F., E. E. Rutström and D. G. Tarr. 1997. “Morocco’s Free Trade Agreement with the EU: AQuantitative Assessment”. Economic Modelling, 14 (2): 237-69. Rustram.
Schiff, M., and A. Valdes. 1992. The Plundering of Agriculture in Developing Countries. Washington, DC:World Bank.
Skoufias, E. 2005. PROGRESA and Its Impacts on the Welfare of Rural Households in Mexico. Research Report No.139. International Food Policy Research Institute. Washington, DC.
Shaw, I., and G. Love. 2001. “Impacts of Liberalizing World Trade in Dairy Products”. ABARE Research Report01.4. Australian Bureau of Agricultural and Resource Economics, Canberra.
Siam, G. M. 2002. “GATT and Egyptian Agriculture: Implication and Effects”. September, Egyptian Associationof Agricultural Economics and Centre for Agricultural Economic Studies, Faculty of Agriculture, CairoUniversity, Cairo.
Siam, G. M. 2005. “Impact of Agricultural Trade Liberalization between the EU and MediterraneanCountries”. Project Report, May, Centre for Agricultural Economic Studies, Faculty of Agriculture, CairoUniversity, Cairo.
Stanbury, W. T. 2002. “The Politics of Milk in Canada”. Fraser Institute Digital Publication, August, http://www.fraserinstitute.ca/admin/books/files/Milk.pdf.
Sumner, D. 2003. “A Quantitative Simulation Analysis of the Impacts of U.S. Cotton Subsidies on CottonPrices and Quantities”. Report submitted to the World Trade Organization panel convened for DS 267Brazil vs. U.S. cotton subsidies, September, Geneva.
Tokarick, Stephen. 2005. “Who Bears the Cost of Agricultural Support in OECD Countries?” The WorldEconomy, 28 (4): 573-593.
Turner, P. 2005. “America’s Role in the Emerging Global Dairy Markets”. Power Point presentation, http://www.agritrade.org/Plenary/DC/Presentations/Turner.ppt#259,1,Slide 1.
UNCTAD (United Nations Conference on Trade and Development). 2004a. The Least Developed CountriesReport 2004: Statistical Annex. Geneva: United Nations.
169
UNCTAD (United Nations Conference on Trade and Development). 2004b. Handbook of Statistics. Geneva:United Nations.
UNDP (United Nations Development Programme). 2004a. Palestinian Human Development Report 2004. NewYork: Oxford University Press.
UNDP (United Nations Development Programme). 2004b. Arab Human Development Report 2004: TowardFreedom in the Arab World. New York: Oxford University Press.
UNDP (United Nations Development Programme). 2005a. Human Development Indicators 2005. New York:Oxford University Press.
UNDP (United Nations Development Programme). 2005b. Egypt Human Development Report 2005: Choosingour Future: Towards a New Social Contract. UNDP and Institute for National Planning, Egypt.
UNDP (United Nations Development Programme). 2005c. “Poverty in Syria: 1996-2004. Diagnostics andPro-Poor Policy Considerations”. United Nations Development Programme, Geneva.
UNEP (United Nations Environmental Programme). 2005. “Effects of Trade Liberalization on Agriculture inLebanon: with Special Focus on Products Where Methyl Bromide Is Used”. United Nations DevelopmentProgramme, Geneva. http://www.unep.ch/etb/publications/Lebanon.pdf#search=%22lebanon%20agriculture%22.
USDA (US Department of Agriculture). 1999. “Product Specific Import Regulations Syria”. GAIN Report#SY9004. US Department of Agriculture. Washington, DC.
USDA (US Department of Agriculture). 2001. “The Road Ahead: Agricultural Policy Reform in the WTO,Summary Report”. AER 797, Market and Trade Economics Division, Economic Research Service, USDepartment of Agriculture, Washington, DC.
USDA (US Department of Agriculture). 2002. “Cotton and Wool Outlook”. CWS-05-02 (June), EconomicResearch Service, US Department of Agriculture, Washington, DC.
USDA (US Department of Agriculture). 2005a. “GAIN Report, Egypt: Grain and Feed Rice”. ForeignAgricultural Service, US Department of Agriculture, Washington, DC.
USDA (US Department of Agriculture). 2005b. “Production, Supply and Distribution: Raw Data Files”.Foreign Agricultural Service, US Department of Agriculture, http://www.fas.usda.gov/psd/complete_files/default.asp.
USDS (US Department of State). 2005. “Background Note: Egypt”. http://www.state.gov/r/pa/ei/bgn/5309.htm. (accessed January 2006).
USTR (US Trade Representative). 2006. U.S.-Middle East Free Trade Efforts. http://www.ustr.gov/Trade_Agreements/Regional/MEFTA/US_Middle_East_Free_Trade_Efforts.html.Accessed February 28, 2006.
Van Eeghen, Willem. 1995. “Poverty in the Middle East and North Africa”. August. Middle East and NorthAfrica Region, World Bank, Washington, DC.
Vocke, G., E. W. Allen and M. Ali. 2005. “Wheat Backgrounder”. Electronic Outlook Report, EconomicResearch Service, US Department of Agriculture, http://www.ers.usda.gov/publications/whs/dec05/whs05K01/whs05K01.pdf.
Wailes, E. 2004. “Rice: Global Trade, Protectionist Policies and the Impact of Trade Liberalization”. In GlobalAgricultural Trade and Developing Countries, eds, M. A. Aksoy and J. C. Beghin. Washington, DC: World Bank.
Westlake, M. 2003. “The Economics of Strategic Crops”. In Syrian Agriculture at the Crossroads, FAOAgricultural Policy and Economic Development Series 8, eds, C. Fiorillo and J. Vercuil. Rome: Food andAgriculture Organization of the United Nations.
World Bank. 2002a. “Arab Republic of Egypt, Poverty Reduction in Egypt: Diagnosis and Strategy”. Report24234-EG, World Bank, Washington, DC.
World Bank. 2002b. Development, Trade and the WTO: A Handbook. Washington, DC: World Bank.
World Bank. 2003a. Tunisia Poverty Update, Two volumes, Washington, DC: World Bank.
World Bank. 2003b. “World Bank Loan to Fight Poverty in Rural Algeria with Job Creation”. Press Release2003/314/MNA, World Bank, Washington, DC.
World Bank. 2004. “A Review of the Impact of the Reform of Agricultural Sector Subsidization”. World Bank,Washington, DC.
World Bank. 2005a. World Development Indicators. CD-ROM. Washington, DC: World Bank.
REFERENCES

170
World Bank. 2005b. “Country Assistance Strategy Progress Report for People’s Democratic Republic ofAlgeria”. CASPR 2004-06, Report 32956-DZ, International Finance Corporation, World Bank, http://www-wds.worldbank.org/external/default/WDSContentServer/IW3P/IB/2006/03/07/0001602016_20060307174540/Rendered/PDF/32956.pdf.
World Bank. 2005c. “Poverty in MENA”. World Bank Sector Brief, http://siteresources.worldbank.org/INTMNAREGTOPPOVRED/Resources/POVERTY-ENG2005AM.pdf.
World Bank. 2005d. Economic Development and Prospects: Oil Booms and Revenue Management. Washington,DC: World Bank.
World Bank. 2005e. “Economic Policy in MENA”. World Bank Sector Brief, http://siteresources.worldbank.org/INTMNAREGTOPECOPOL/Resources/ECONOMIC-POLICY-ENG2005AM.pdf.
World Bank. 2006. World Development Indicators. CD-ROM database, Washington, DC: World Bank.
WRI (World Resource Institute). 2005. “Earth Trends, Population, Health and Human Well Being: DataTables”. http://earthtrends.wri.org/pdf_library/data_tables/pop2_2003.pdf.
WTO (World Trade Organization). 1994. “Annex 2: Domestic support: The basis for exemption from thereduction commitments”. Agreement on Agriculture. WTO, Geneva.
WTO (World Trade Organization). 1998. “Turkey: Trade Policy Review”. Document WT/TPR/S/44, WorldTrade Organization, Geneva.
WTO (World Trade Organization). 2001a. “Proposal by Morocco”. Document G/AG/NG/W/105, World TradeOrganization, Geneva.
WTO (World Trade Organization). 2001b. “Comprehensive Proposal by the Arab Republic of Egypt to theWTO Negotiations on Agriculture”. Document G/AG/NG/W/107, World Trade Organization, Geneva.
WTO (World Trade Organization). 2002. “Overview of Development in the International TradingEnvironment”. http://www.wto.org/english/res_e/booksp_e/anrep_e/anrep02_chp3_e.pdf.
WTO (World Trade Organization). 2003a. “Trade Policy Review Turkey”. Report by the Secretariat, DocumentWT/TPR/S/125, World Trade Organization, Geneva.
WTO (World Trade Organization). 2003b. “Trade Policy Review Morocco”. Report by the Secretariat,Document WT/TPR/S/116, World Trade Organization, Geneva.
WTO (World Trade Organization). 2005a. “Members and Observers”. http://www.wto.org/english/thewto_e/whatis_e/tif_e/org6_e.htm. (accessed December 2005).
WTO (World Trade Organization). 2005b. “Tunisia Trade Policy Review”. Report by the Secretariat, WorldTrade Organization, Geneva.
WTO (World Trade Organization). 2005c. “Trade Policy Review Egypt”. Report by the Secretariat, DocumentWT/TPR/S/150, World Trade Organization, Geneva.
WTO (World Trade Organization). 2005d. “Understanding the WTO: Developing Countries”.http://www.wto.org/english/thewto_e/whatis_e/tif_e/understanding_e.pdf.
WTO (World Trade Organization). 2006a. “Uruguay Round Agreement: Decision on Measures Concerningthe Possible Negative Effects of the Reform Programme on Least-Developed and Net Food-ImportingDeveloping Countries”. http://www.wto.org/english/docs_e/legal_e/35-dag.pdf. (accessed March 2006).
WTO (World Trade Organization). 2006b. “Trade Policy Review Djibouti”. Report by the Secretariat,Document WT/TPR/S/159, World Trade Organization, Geneva.
Zarrouk, J. E. 1998. “Arab Free Trade Area: Potentialities and Effects”. Paper presented at the workshop,Benefiting from Globalization: Mediterranean Development Forum, Marrakech, 3-6 September.
Zarrouk, J. E., and F. Zallio. 2000. “Integrating Free Trade Agreements”. http://www.worldbank.org/mdf/mdf3/papers/global/Zarrouk.pdf.


Via del Serafico, 10700142 Rome, Italy Telephone: +39-06-54591Facsimile: +39-06-5043463E-mail: [email protected] www.ifad.org www.ruralpovertyportal.org
2033 K Street NWWashington, DC 20006-1002 USATelephone: +1-202-862-5600Facsimile: +1-202-467-4439E-mail: [email protected]/divs/mtid.htm