Embed Size (px)
Citation preview

University of Arkansas, Fayetteville University of Arkansas, Fayetteville
ScholarWorks@UARK ScholarWorks@UARK
Theses and Dissertations
12-2019
Nematode Populations as Affected by Residue and Water Nematode Populations as Affected by Residue and Water
Management in a Long-term Wheat-soybean Double Crop in Management in a Long-term Wheat-soybean Double Crop in
Eastern Arkansas Eastern Arkansas
Lucia Emperatriz Escalante Ortiz University of Arkansas, Fayetteville
Follow this and additional works at: https://scholarworks.uark.edu/etd
Part of the Agricultural Science Commons, Agronomy and Crop Sciences Commons, Bioresource and
Agricultural Engineering Commons, Plant Pathology Commons, Soil Science Commons, and the Water
Resource Management Commons
Citation Citation Escalante Ortiz, L. E. (2019). Nematode Populations as Affected by Residue and Water Management in a Long-term Wheat-soybean Double Crop in Eastern Arkansas. Theses and Dissertations Retrieved from https://scholarworks.uark.edu/etd/3467
This Thesis is brought to you for free and open access by ScholarWorks@UARK. It has been accepted for inclusion in Theses and Dissertations by an authorized administrator of ScholarWorks@UARK. For more information, please contact [email protected].

Nematode Populations as Affected by Residue and Water Management in a Long-term Wheat-
soybean Double Crop in Eastern Arkansas
A thesis submitted in partial fulfillment
of the requirement for the degree of
Master of Science in Crop, Soil, and Environmental Sciences
by
Lucia Emperatriz Escalante Ortiz
National University of Cajamarca
Bachelor in Agronomy, 2011
December 2019
University of Arkansas
This thesis is approved for recommendation of the Graduate Council.
Kristofor R. Brye, Ph.D
Thesis director
Lisa S. Wood, Ph.D Leandro Mozzoni, Ph.D
Committee Member Committee Member
Travis Faske, Ph.D
Committee Member

Abstract
Soybeans (Glycine max) are one of the major row crops in the United States, particularly
in Arkansas. Soybean cyst nematode (SCN, Heterodera glycines) and southern root-knot
nematode (RKN, Meloidogyne incognita) are two of the most damaging pests that cause major
economic losses in soybeans. Little is known concerning the effects of common and alternative
agronomic practices on nematodes in fields with nematode population densities below threshold
levels. Therefore, the objective of this study was to evaluate the effects of the combination of
tillage (conventional tillage and no-tillage), irrigation (irrigated and non-irrigated), wheat
(Triticum aestivum) residue burning (burned and no burned), and wheat residue level (high and
low) on the natural nematode population density and change over the growing season and
between years in a long-term, wheat-soybean rotation on a silt-loam soil in Arkansas. Nematodes
were measured in the top 10 cm in July, August, and October 2017 and 2018. The SCN egg
population density in the soil was numerically largest [P = 0.01; 2.9 nematodes (100 cm3)-1] in
the conventional tillage (CT)-no-burn combination under irrigated conditions and lowest [0.1
nematodes (100 cm3)-1] in the CT-no-burn combination under dryland production. The SCN J2
population densities [1.1 nematodes (100 cm3)-1] was 3.4 times greater (P < 0.01) under the CT-
burn than under the CT-no-burn and no-tillage (NT)-burn treatment combinations, which did not
differ and averaged 0.49 nematodes (100 cm3)-1. Spiral nematode (Helicotylenchus spp.)
population densities was 52.6 times greater (P < 0.01) under irrigated-CT [31.84 nematodes (100
cm3)-1] than under the irrigated-NT, dryland-CT, and dryland-NT treatment combinations in
2017, all of which had less than 0.6 nematodes (100 cm3)-1. Lesion nematode (Pratylenchus spp.)
population density was 5.6 times greater (P = 0.02) under the dryland-burn than under the
dryland-no-burn treatment combination, but was unaffected by burning under irrigated

conditions. The RKN had small populations in the soil and could not be formally statistically
analyzed. Traditional and alternative wheat-soybean management practices can influence
nematode populations and should be carefully considered to maximize soybean production and
profitability.

Acknowledgements
I would like to thank Dr. Brye for taking the risk of having me as his student. I could not
be more grateful for all the support, guidance, and patience with me during my journey in
graduate school. Dr. Brye has that passion for teaching and advising students that inspires and
motivates me to love science and academia.
I would like to thank to Drs. Lisa Wood, Leandro Mozzoni and Travis Faske for
serving on my committee and for providing valuable advice on my research. I also would like to
thank Dr. Edward E. Gbur and Kevin Thompson for assisting me with statistics throughout my
research.
I would like to thank my lab mates, Becky Anderson, Ryder Anderson, Niyi Omidire, and
Shelby Lebeau who provided me field or laboratory assistance.
I would like to thank my family for their unconditional support throughout my time at the
University of Arkansas. Also, I would like to thank my fiancé for his unconditional support.
I would like to thank Dr. Joe Gergerich for been my English tutor and helping me to
improve my English skills.
I would like to thank the Association the Andes of Cajamarca and Fulbright Peru for
making possible to achieve one of my dreams. Finally, I want to thank the Soybean Promotion
Board for partially funding this research.
Dedication
This thesis is dedicated to my family, the Fulbright Program, the Association the Andes of
Cajamarca, friends, and all the people who believe on me.

Table of Contents
Introduction ................................................................................................................................... 1
Literature Cited ............................................................................................................................ 4
Chapter 1 ....................................................................................................................................... 5
Nematodes................................................................................................................................... 6
General Definition and Population Densities ............................................................................. 6
Morphology and Growth Habits ................................................................................................. 6
Nematode Types ......................................................................................................................... 7
Factors that Affect Nematodes .................................................................................................... 9
Environmental Factors ............................................................................................................ 9
Soil Properties ....................................................................................................................... 10
Tillage Management Practices .............................................................................................. 11
Plants Affected by Nematodes .................................................................................................. 12
Soybean History and Diversity ................................................................................................. 13
Soybean Growth Stages and Maturity ...................................................................................... 14
Soybean Production .................................................................................................................. 14
Optimum Soybean Growing Conditions ............................................................................... 14
Global Production ..................................................................................................................... 15
Soybean Production in North America ..................................................................................... 16
Soybean Production in the United States .................................................................................. 16

Soybean Production in Arkansas .............................................................................................. 17
Non-weed Pests in Soybeans .................................................................................................... 18
Non-weed Pests in Soybeans around the World ....................................................................... 19
Non-weed Pests in Soybeans in Argentina ........................................................................... 19
Non-weed Pests in Soybeans in Brazil ................................................................................. 20
Non-weed Pests in Soybeans in Canada ............................................................................... 21
Non-weed Pests in Soybeans in China.................................................................................. 22
Non-weed Pests in Soybeans in India ................................................................................... 22
Plant-parasitic Nematodes in the US .................................................................................... 23
Plant-parasitic Nematodes in Soybeans .................................................................................... 24
Plant-parasitic Nematodes in Arkansas .................................................................................... 25
Economic Losses Caused by Nematodes .................................................................................. 26
Plant-parasitic Nematode Control ............................................................................................. 27
Research Studies on Nematodes ............................................................................................... 28
World Wide ............................................................................................................................... 28
United States ............................................................................................................................. 28
Tillage Effects ....................................................................................................................... 28
Crop Rotation and Cover Crops Effects ............................................................................... 30
Soil Moisture/Irrigation Effects ............................................................................................ 32
Nitrogen Fertilization Effects ............................................................................................... 33
Residue Burning Effects ....................................................................................................... 34

Relevant Research in Arkansas ................................................................................................. 36
Justification ............................................................................................................................... 37
Objective ................................................................................................................................... 37
Testable Hypotheses ................................................................................................................. 38
Literature Cited .......................................................................................................................... 39
Chapter 2 ..................................................................................................................................... 47
Nematode Population Densities as Affected by Residue and Water Management in a Long-
term Wheat-soybean Double-crop in Eastern Arkansas ......................................................... 47
Abstract ........................................................................................................................................ 48
Introduction ................................................................................................................................. 49
Materials and Methods .............................................................................................................. 52
Site Description ..................................................................................................................... 52
Treatments and Experimental Design ................................................................................... 53
Field Management ................................................................................................................ 54
Soil Sample Collection, Processing, and Analyses ............................................................... 55
Statistical Analyses ............................................................................................................... 57
Results and Discussion ............................................................................................................. 58
Initial Soil Properties ................................................................................................................ 58
Growing-season Nematode Population Densities ..................................................................... 61
Soybean Cyst Nematode ....................................................................................................... 62

Eggs....................................................................................................................................... 62
Juveniles ................................................................................................................................ 64
Lance Nematode ................................................................................................................... 66
Lesion Nematode .................................................................................................................. 67
Spiral Nematode .................................................................................................................... 68
Stunt Nematode ..................................................................................................................... 71
Total Nematode Concentration ............................................................................................. 74
Correlations Among Nematodes and Soybean Yield ............................................................... 76
Conclusions .................................................................................................................................. 80
Acknowledgements ..................................................................................................................... 81
Literature Cited ........................................................................................................................ 109
Conclusions ................................................................................................................................ 113
Appendices ................................................................................................................................. 115

List of Tables
Chapter 1
Table 1. Soybean harvested in USA in 2019. Adapted from National Statistics Service (2019) .46
Chapter 2
Table 1. Summary of typical management practices and their schedule (2017 and 2018) in the
wheat-soybean double-crop production system at the Lon Mann Cotton Branch Experiment
Station near Marianna, AR ............................................................................................................82
Table 2. Summary of the effects of irrigation (Irr), tillage (Till), residue burning (Burn), and
residue level (Res) treatments, and their interactions on initial soil properties in the top 10 cm in
May 2017 after 15 complete wheat-soybean cropping cycles on a silt-loam soil in eastern
Arkansas. Bolded values were considered significant at P < 0.05 ................................................83
Table 3. Extractable soil calcium (Ca), copper (Cu), and boron (B) content and soil organic
matter (SOM) concentration differences among irrigation (irrigated and dryland)-tillage
[conventional tillage (CT) and no-tillage (NT)]-burning (burn and no burn)-residue level (high
and low) treatment combinations after 15 cropping cycles in a long-term wheat-soybean, double-
crop production system on a silt-loam soil in eastern Arkansas ....................................................84
Table 4. Summary of the effects of year (Year), sample date within the growing season (Date),
irrigation (Irr), tillage (Till), residue burning (Burn), residue level (Res) treatments and their
interactions on soybean cyst nematode (SCN) eggs and Stage 2 juveniles (J2), lance, lesion,
spiral, and stunt nematode species, and total (Total) nematode population densities in the top 10
cm of soil in a long-term, wheat-soybean, double-crop production system on a silt-loam soil in
eastern Arkansas. Bolded values were considered significant at P < 0.05 ....................................85
Table 5. Spiral nematode concentration differences among irrigation-tillage [conventional tillage
(CT) and no-tillage (NT)]-residue burning-residue level treatment combinations in a long-term,
wheat-soybean, double-crop production system on a silt-loam soil in eastern Arkansas ..............87
Table 6. Stunt nematode concentration differences among year-irrigation-tillage [conventional
tillage (CT) and no-tillage (NT)]-residue burning treatment combinations in a long-term, wheat-
soybean, double-crop production system on a silt-loam soil in eastern Arkansas .........................88
Table 7. Stunt nematode concentration differences among year-irrigation-tillage [conventional
tillage (CT) and no-tillage (NT)]-residue level treatment combinations in a long-term, wheat-
soybean, double-crop production system on a silt-loam soil in eastern Arkansas .........................89
Table 8. Stunt nematode concentration differences among year-irrigation-residue burning-
residue level treatment combinations in a long-term, wheat-soybean, double-crop production
system on a silt-loam soil in eastern Arkansas ..............................................................................90

Table 9. Stunt nematode concentration differences among irrigation-tillage [conventional tillage
(CT) and no-tillage (NT)]-residue burning-residue level treatment combinations in a long-term,
wheat-soybean, double-crop production system on a silt-loam soil in eastern Arkansas ..............91
Table 10. Total nematode concentration differences among year-tillage [conventional tillage
(CT) and no-tillage (NT)]-residue burning-sampling date within the growing season treatment
combinations in a long-term, wheat-soybean, double-crop production system on a silt-loam soil
in eastern Arkansas. .......................................................................................................................92
Table 11. Summary of correlation coefficients (r) between nematode species and soybean yield
across 2017 and 2018 in a long-term, wheat-soybean, double-crop production system on a silt-
loam soil in eastern Arkansas ........................................................................................................93
Table 12. Summary of correlation coefficients (r) between nematode population densities and
soil properties from the top 10 cm across 2017 and 2018 in a long-term, wheat-soybean, double-
crop production system on a silt-loam soil in eastern Arkansas ....................................................94
Table 13. Summary of correlation coefficients(r) between nematode abundance and soil
properties from the top 10 cm across 2017 and 2018 in a long-term, wheat-soybean, double-crop
production system on a silt-loam soil in eastern Arkansas. ...........................................................95
Table 14. Summary of monthly soil and air temperature, total rainfall during the soybean-
growing season in 2017 and 2018 in a long-term, wheat-soybean, double-crop production system
on a silt-loam soil in eastern Arkansas and the 30-year mean monthly rainfall and air temperature
........................................................................................................................................................96
Table 15. Summary of soil moisture content during soybean-growing season in 2018 in a long-
term, wheat-soybean, double-crop production system on a silt-loam soil in eastern Arkansas ....97

List of Figures
Figure 1. Soil C:N ratio differences among irrigation (irrigated and dryland) and tillage
[conventional tillage (CT) and no-tillage (NT)], soil C: N ratio differences among tillage
[conventional tillage (CT) and no-tillage (NT)], burning (burn and no burn) and residue level
(high and low), and soil electrical conductivity (EC) differences among irrigation (irrigated and
dryland) and burning (burn and no burn) treatment combinations after 15 cropping cycles in a
long-term wheat-soybean, double-crop production system on a silt-loam soil in eastern Arkansas.
Different letters atop bars are different at 0.05 ........................................................................98
Figure 2. Extractable soil magnesium (Mg) and phosphorus (P) differences among irrigation
(irrigated and dryland) and burning (burn and no burn) and extractable soil iron (Fe) differences
among irrigation (irrigated and dryland)-tillage [conventional tillage (CT) and no-tillage (NT)]-
residue burning (burn and no burn) treatment combinations after 15 cropping cycles in a long-
term wheat-soybean, double-crop production system on a silt-loam soil in eastern Arkansas.
Different letters atop bars are different at 0.05 ........................................................................99
Figure 3. Soybean cyst nematode eggs concentration differences among irrigation (irrigated and
dryland)-tillage [conventional tillage (CT) and no-tillage (NT)]-residue burning (burn and no
burn) treatment combinations in a long-term, wheat-soybean, double-crop production system on
a silt-loam soil in eastern Arkansas. Different letters atop bars are different at 0.05. ..........100
Figure 4. Soybean cyst nematode juvenile concentration differences among tillage [conventional
tillage (CT) and no-tillage (NT)]-residue burning (burn and no burn) treatment combinations in a
long-term, wheat-soybean, double-crop production system on a silt-loam soil in eastern
Arkansas. Different letters atop bars are different at 0.05 .....................................................101
Figure 5. Soybean cyst nematode juvenile concentration differences among year (2017 and
2018)-irrigation (irrigated and dryland)-tillage [conventional tillage (CT) and no-tillage (NT)]
treatment combinations in a long-term, wheat-soybean, double-crop production system on a silt-
loam soil in eastern Arkansas. Different letters atop bars are different at 0.05. ...................102
Figure 6. Lance nematode concentration differences among irrigation (irrigated and dryland)-
tillage [conventional tillage (CT) and no-tillage (NT)] treatment combinations in a long-term,
wheat-soybean, double-crop production system on a silt-loam soil in eastern Arkansas. Different
letters atop bars are different at 0.05. ....................................................................................103
Figure 7. Lesion nematode concentration differences among irrigation (irrigated and dryland)-
residue burning (burn and no burn) treatment combinations in a long-term, wheat-soybean,
double-crop production system on a silt-loam soil in eastern Arkansas. Different letters atop bars
are different at 0.05. ..............................................................................................................104
Figure 8. Spiral nematode concentration differences among year (2017 and 2018)-irrigation
(irrigated and dryland)-tillage [conventional tillage (CT) and no-tillage (NT)] treatment
combinations in a long-term, wheat-soybean, double-crop production system on a silt-loam soil
in eastern Arkansas. Different letters atop bars are different at 0.05. ...................................105
Figure 9. Spiral nematode concentration differences among year (2017 and 2018)-irrigation
(irrigated and dryland)-residue level (high and low) treatment combinations in a long-term,
wheat-soybean, double-crop production system on a silt-loam soil in eastern Arkansas. Different
letters atop bars are different at 0.05. ....................................................................................106
Figure 10. Total nematode concentration differences among year (2017 and 2018)-irrigation
(irrigated and dryland) treatment combinations in a long-term, wheat-soybean, double-crop
production system on a silt-loam soil in eastern Arkansas. Different letters atop bars are different
at 0.05. ...................................................................................................................................107
Figure 11. Total nematode concentration differences among irrigation (irrigated and dryland)-
tillage [conventional tillage (CT) and no-tillage (NT)]-residue burning (burn and no burn)
treatment combinations in a long-term, wheat-soybean, double-crop production system on a silt-
loam soil in eastern Arkansas. Different letters atop bars are different at 0.05 ....................108

1
Introduction
2
Plant-parasitic nematodes are one of the most damaging pest of soybean production in the
United States, causing an average of 31% of yield losses from 2010 to 2014 (Allen et al., 2017).
Wrather and Koennig (2006) reported that Heterodera glycines (Soybean Cyst Nematode; SCN)
is the main yield-limiting pest of soybean production in the U.S., which in 2005 caused more
than $ 1 billion in yield losses. By growing SCN resistant cultivars, using crop rotation, reducing
tillage, and using nematicides yield losses can be reduced. However, there are limited soybean
cultivars with resistance to SCN (Niblack and Chen, 2004). The soybean cyst nematode
Meloidogyne incognita (root-knot nematode, RKN), and Rotylenchus reniformis (reniform
nematodes) are the most damaging for soybean production in Arkansas (Arkansas Soybean
Promotion Board, 2019). Crop rotation with non-host cultivars are considered the most effective
nematode control (Niblack and Chen, 2004). Moreover, tillage management practices such as
minimum tillage might minimize the nematodes infestation in the soil. For years, nematicides
have been used to control nematode infestation in crop production systems; however, many
nematicides have been banned because nematicides can harm the environment and human health
(Ferris et al., 2012). Several studies conducted in the U.S. have concentrated on the effects of
tillage, crop rotation, and water management on nematodes population in soybeans (Johnson et
al., 1994; Noel and Wax, 2003; Brye et al., 2018). However, there is a little information
regarding the effects of the combination of tillage, irrigation, burning, and residue level in a
long-term rotation of wheat-soybean on a silt loam soil in the U. S., specifically in Arkansas.
Also, a little previous research has shown whether or not residue burning, or non-burning affects
nematode populations in the USA. The aim of the research is to evaluate the combined long-term
effects of tillage practices (conventional tillage and no tillage), water management (irrigation and
non-irrigation), residue burning (burned and non-burned), and wheat residue level (high and low)

3
on parasitic nematode population density and reproduction in the top 10 cm after 15 years in a
wheat-soybean, double-crop production system on a silt-loam soil in eastern Arkansas.

4
Literature Cited
Allen, T. W., Bradley, C. A., Sisson, A. J., Byamukama, E., Chilvers, M. I., Coker, C. M.,
Collins, A. A., Damicone J. P., Dorrance, A. E., Dufault, N. S., Esker, P. D., Faske. T. R.,
Giesler, L. J., Grybauskas, A. P., Hershman, D. E., Hollier, C. A., Isakeit, T., Jardine, D. J.,
Kelly, H. M., Kemerait, R. C., Kleczewski, N. M., Koenning, S. R., Kurle, J. E., Malvick, D. K.,
Markell, S. G., Mehl, H. L., Mueller, D. S., Mueller, D. J., Mulrooney, R. P., Nelson, B. D.,
Newman, M. A., Osborne, L., Overstreet, C., Padgett, G. B., Phipps, P. M., Price, P. P., Sikora,
E. J., Smith, D. L., Spurlock, T. N., Tande, C. A., Tenuta, A. U., Wise, K. A., and Wrater, J. A.
2017. Soybean yield loss estimates due to diseases in the United States and Ontario, Canada,
from 2010 to 2014. Plant Health Progress 18:19-27.
Arkansas Soybean Promotion Board (ASPB). 2019. Controlling harmful effects of
nematodes [Online]. https://www.themiraclebean.com/controlling-the-harmful-effects-of-
nematodes-2/ (verified 25 Nov., 2019).
Brye, K. R., Quarta, M., Morrison, C., and Rothrock, C. 2018. Long-term effects of residue
and water management practices on plant parasitic nematode abundance and soybean root
infection. Applied Soil Ecology 124:275-283.
Ferris, H., Griffiths, B. S., Porazinsca, D. L., Powers, T. O., Wang, K., and Tenuta, M. 2012.
Reflections on plant and soil nematodes ecology: past, present, and future. Journal of
Nematology 44:115-126.
Johnson, A. B., Scott, H. D., and Riggs, R. D. 1994. Response of soybean in cyst nematode-
infested soils at three soil-water regimes. Journal of Nematology 26:329-335.
Niblack, T. L., and Chen, S. Y. 2004. Cropping systems Pp. 181-206 in D. P. Schmitt, R. D.
Riggs, and J. A. Wrather, eds. Biology and management of soybean cyst nematode. Marceline,
MO, USA: Schmitt and Associates of Marceline.
Noel, G. R., and Wax, L. M. 2003. Population dynamics of Heterodera glycines in
conservation tillage and no-tillage soybean/corn cropping systems. Journal of Nematology
35:104-109.
Wrather, J. A., and Koenning, S. R. 2006. Estimate of disease effects on soybean yields in
the United States 2003 to 2005. Journal of Nematology 38:173-180.

5
Chapter 1
Literature Review

6
Nematodes
General Definition and Population Densities
Nematodes are unsegmented, multicellular roundworms (Hartman et al., 2015) that have
limited mobility in the soil (Fujimoto, et al., 2010). Nematodes have soft bodies (Lambert and
Bekal, 2002), feed on a wide range of food sources, such as plants, fungal hyphae, algae,
bacteria, protozoa, and other nematodes (Khan, 2008), and can live in nearly all ecological
niches from the desert to the snowy mountains (Hartman et al., 2015 and Khan, 2008).
Nematodes can live in any climate that supports plant life (Bridge and Starr, 2007).
Consequently, soil and plant nematodes are the most abundant organisms living in the soil
(Hartman et al., 2015). More than 20,000 nematodes can be found in 250 cm3 soil sample, which
is equivalent to 7.5 billion nematodes in the top 15 to 20 cm of 1 ha of any soil type (Hartman et
al., 2015). However, only a few nematode species are capable of parasitizing plants (Khan,
2008).
Morphology and Growth Habits
The majority of plant-parasitic nematodes are microscopic; however, a few species, such
as the adult female and cyst phase of soybean [Glycine max) Merr.] cyst nematode (SCN;
Heterodera glycines) can be seen without the aid of a magnification (Hartman et al., 2015;
Bridge and Starr, 2007). The shape of juvenile and adult nematodes is flexible and cylindrical.
(Hartman et al., 2015). Females of cyst nematodes (Heterodera spp. and Globodera spp.), the
root-knot nematode (Meloidogyne spp.), false root-knot nematode (Nacobus spp.), and reniform
nematode (Rotylenchus spp.) have evolved to take on a swollen, sac-like shape (Hartman et al.,
2015). Nematode reproduction is sexual, and asexual (parthenogenic) (Bridge and Starr, 2007).

7
Some female nematode genera have the ability to lay more than 1,000 eggs, while other
nematode genera lay less than 50 eggs (Bridge and Starr, 2007). Reproduction ability depends of
the species and is influenced by the nematode’s surrounding environment and host (Hartman et
al., 2015).
The life cycle of most plant-parasitic nematodes consists of an egg, four juvenile (J)
stages, and finally, the adult and reproductive stage (Hartman et al., 2015; Bridge and Starr,
2007). In the majority of plant-parasitic nematode the J2 hatch from the egg (Hartman et al.,
2015). The duration of the nematode life cycle depends on the genera, but in general, ranges
from a few days to almost one year under favorable environmental conditions and plant hosts
(Bridge and Starr, 2007).
Nematodes can survive in the soil through different mechanisms of dormancy (diapause
and quiescence) (Karssen and Moens, 2006). The RKN J2 can survive in the soil for long periods
of time consuming their food reserves stored in their intestines (Karssen and Moens, 2006). The
eggs and juveniles of the genera globodera and heterodera survival in the soil is longer than the
Meloidogyne genera due to eggs in cysts remain viable in the soil for several years (Karssen and
Moens, 2006).
Nematode Types
Nematodes can be generally categorized as plant-parasitic or non-parasitic. Plant-
parasitic nematodes have to live on or very near living plant tissues to complete their life cycle
(Hartman et al., 2015). The parasitic behavior of nematodes in soybeans and other upland crop
plants varies among the different nematode species (Hartman et al., 2015). Among the plant-
parasitic nematodes, some are ectoparasitic, which is a parasite that live on the surface of their

8
host, while others are endoparasites that lives inside the host (Bridge and Starr, 2007).
Migratory ectoparasites live on the surface of plant tissues and feed by inserting their
stylet into plant cells. Migratory ectoparasites include many genera and species, but only a few
cause damages to crops (Bridge and Starr, 2007). Some species of nematodes that cause damage
to cultivated crops are: sting nematode (Belonolaimus longicaudatus), sheath nematode
(Hemicycliophora arenaria), dagger nematode (Xiphinema spp.), needle nematodes (Longidorus
spp., Paralongidorus spp.), and stubby root-knot nematodes (Trichodorus spp, Paratrichodorus
spp.) (Bridge and Starr, 2007). The stunt nematode (Tylenchorhynchus and Merlinius spp.) and
ring nematode (Criconemoides spp.); these nematodes cause yield losses in some crops (Bridge
and Starr, 2007). Some species of spiral (Helicotylenchus spp.) and reniform nematodes also feed
as ectoparasites. Migratory ectoparasites can feed on leaves, flowers, stems, and roots (Bridge
and Starr, 2007). Nematodes move passively in soil water, soil, contaminated plant tissues,
infected insect vectors, and on tools, vehicles, and machinery contaminated with nematode-
infected soil (Hartman et al., 2015). However, without other influences, nematodes movement on
their own in the soil is generally limited to within 1 m per year (Lambert and Bekal, 2002).
Migratory endoparasites usually migrate between the soil and roots (Bridge and Starr,
2007). Migratory endoparasites can completely penetrate into plant tissues and can continue
moving and feeding as they migrate in the plant tissues (Bridge and Starr, 2007). The genera
Pratylenchus, Radopholus, Hirschmanniela, Hoplolaimus, Scutellonema, Aphasmatylenchus,
Helicotylenchus, Ditylenchus, and Reniformis nematode are well-studied endoparasitic species
that harm crops (Bridge and Starr, 2007). Some ectoparasitic (Aphelenchoides, Ditylenchus
angustus and D. dispaci and others), in all stages, can infect stems, leaves, flowers, roots, corms,
bulbs, tubers, and seeds [e.g., peanut (Arachis hypogaea)] (Bridge and Starr, 2007).

9
Sedentary endoparasitic nematodes are nematodes whose immature female or juveniles
completely enter plant tissues, form a stable feeding spot, become immobile, and form galls or
cysts (Bridge and Starr, 2007). The main species of sedentary endoparasites are Achlysiella,
Globodera, Heterodera, Meloidogyne, Nacobbus, and Pundoctera spp. (Bridge and Starr, 2007).
Semi-endoparasitic nematodes are those whose immature females or juveniles partially
enter root tissues and leave half to two-thirds of their body outside the root tissue (Bridge and
Starr, 2007). Rotylenchus, Sphaeronema, Trophotylenchulus, and Tylenchulus spp are migratory
endoparasites that can behave as semi-endoparasites on plant roots (Bridge and Starr, 2007).
Factors that Affect Nematodes
Environmental Factors
Plant-parasitic nematodes are mostly aquatic and need free moisture to develop (Bridge
and Starr, 2007). Plant-parasitic nematodes live in moisture-containing spaces around soil
particles and in the moisture surrounding plant tissues (Bridge and Starr, 2007). Soybean cyst
nematode has better development at about -0.03 MPa to -0.04 MPa than at above -0.05 MPa in
the top 0.15 m (Heatherly et al., 1982). Soil moisture levels of 40 to 60% favors Meloidogyne
species activity (Karssen and Moens, 2006). Soil moisture enhances the potentially harmful
effects of plant-parasitic nematodes on crops (Koenning and Barker, 1995) because nematode
mobility increases as water flows in the soil pore space, which facilitates nematodes to reach
plant roots (Fujimoto et al., 2010). Also, soil moisture increases the nematode’s ability to locate,
penetrate, hatch, and mate (Koenning and Barker, 1995). Nematodes migrate along soil water
gradients. In dry soils, nematode migrate toward less negative potentials (more moisture), while
in waterlogged soils nematode migrate toward more negative potentials. Nematode movement in

10
waterlogged soils is restricted due to low O2 levels.
Temperature is a crucial factor for nematode development (Karssen and Moens, 2006).
Temperature influences the nematode distribution, survival, reproduction, and growth (Karssen
and Moens, 2006). The optimal soil temperature for plant-parasitic nematode development
ranges from 15 to 32oC (Moore, 1984). The SCN has a life cycle of around 24 days when the soil
temperature is 23oC. However, SCN life cycle can take 40 days with a soil temperature of 18oC.
Usually SCN development does not occur below 10oC or above 34oC (Moore, 1984). The lower
threshold soil temperature for normal SCN development is 14oC, and the upper is 38oC (Ross,
1964). Between 35 and 38oC soil temperatures, most adult nematodes are male (Tyler et al.,
1987).
Soil Properties
Soil texture and other soil properties, such as pore size and soil water-holding capacity
are important aspects that influence nematode impact on crops (Heatherly and Young, 1991).
Soil properties can positively or negatively influence egg development, hatch rate, survival,
migration, and infectivity of several nematode species (Heatherly and Young, 1991). In coarse-
textured soils with relatively large pore spaces (i.e., more than 60% sand content), nematodes
commonly cause crop problems (Heatherly and Young, 1991). Nematodes can also be a problem
in soils rich in organic matter with a moderate degree of soil particle aggregation between silt
and clay so that the pore space increases (Bridge and Starr, 2007). Greater numbers of SCN
females and eggs were reported in a sandy-loam than in silt-loam textured soils eight weeks after
the introduction of the same number of eggs and juveniles (Schmitt et al., 1987).
Soybean cyst nematode reproduction was reduced in fine- compared to coarse-textured

11
soils because nematode reproduction is low in soils with limited space for nematodes movement
(Koenning and Barker, 1995). Soil compaction and nematode infections often occur together and
reduce soybean crop yields because tillage causes soil compaction and increases nematode
infestation in the soil due to nematodes spread by machinery implements (Minton, 1986; Parker
et al., 1975). In general, nematode damage has been reported in almost all soil textures (Bridge
and Starr, 2007).
Tillage Management Practices
Tillage practices can have an effect on nematodes. Reduced tillage might reduce
nematode reproduction and distribution because nematodes can be transported on machinery
implements (Minton, 1986). It has been observed that soil disturbance caused an increase in the
SCN egg population due to that nematode inoculum is horizontally distributed in the field (Bao
et al., 2011). However, no tillage may increase the vertical nematode concentration in the soil
profile. In compacted soils, minimum tillage might limit soil volume available to roots and root
penetration, which resultant moisture stress can increase nematode crop injury (Minton, 1986).
Crop residues left on the soil surface have the potential to increase the nematode populations and
soil microorganisms due to the changes in soil moisture and temperature (Minton, 1986). Under
clean fallow practices, nematode population is usually reduced. (Minton, 1986). Low soil
temperatures can alter nematode growth in no tillage (NT) systems compared to conventional
tillage (CT) (i.e., residue free) systems because crop residues left in the soil in the NT systems
decrease soil temperature, thus decreasing nematode reproduction (Tyler et al., 1987).

12
Plants Affected by Nematodes
All crops are prone to be infected by at least one nematode species (Bridge and Starr,
2007). In the U.S. corn (Zea mays) production, the most frequently reported genera of nematode
are lance nematode (Hoplolaimus spp.), root-knot, and lesion nematode (Koenning et al., 1999).
Also, Simon et al (2018) reported that dagger, ring, lance, stunt, pin, stubby root, and spiral
nematode are associated with corn in Ohio. Soybean is susceptible to SCN, root-knot, lesion, and
reniform nematodes (Koenning et al., 1999). Wheat (Triticum aestivum) parasitic nematodes
include the cereal cyst nematode (Heterodera avenae), root-knot nematode, ring nematode
(Mesocriconema spp.), and lesion nematode (Koenning et al., 1999). In grain sorghum (Sorghum
bicolor) production, the most frequently reported nematodes are the sting, root-knot nematode,
and lesion nematode (Koenning et al., 1999). In sugarcane (Saccharum officinarum) production,
the sting nematode and root-knot nematode are considered to be the most damaging (Koenning et
al., 1999). In cotton (Gossypium hirsutum) production, the root-knot and the reniform nematode
are commonly related to cotton yield losses (Koenning et al., 1999). Peanut yield losses were
attributed to the peanut root-knot nematode (Meloidogyne arenaria) and other species of
Meloidogyne, (also sting is an important issue in GA). Root-knot nematode (Koenning et al.,
1999). In addition, tobacco (Nicotiana tabacum) is susceptible to the majority of the genera of
the root-knot nematode. The nematode genera that cause losses in alfalfa (Medicago sativa) are
the stem nematode (Dilylenchus dipsaci), root-knot, and lesion nematode (Koenning et al.,
1999). Nematode pests in rice (Oryza sativa) include Aphelenchoides, Ditylenchus, rice cyst
nematode (Heterodera Oryzae), Hirschmanniella, root-knot, and lesion nematode (Koenning et
al., 1999). The most damaging nematodes that have been documented are the cyst nematodes on
potatoes (Solanum tuberosum) in Europe (Bridge and Starr, 2007). The degree of crop damage,

13
mainly in annual crops, is related to the nematode population density (Bridge and Starr, 2007).
Nematodes can affect all plant tissues, but they are mainly root parasites (Bridge and Starr,
2007).
Soybean History and Diversity
Though nematodes can affect many plants, including upland and lowland crops,
nematodes are particularly influential in soybean growth. Soybean is a legume native to eastern
Asia (Piper and Morse, 1923) and northern China (Hartman et al., 2015). Soybean domestication
was likely to have occurred during the Shang Dynasty [i.e., 1500 to 1100 before common era
(BCE) or earlier]. However, soybean appeared as a domesticated plant during the Zhou Dynasty
(i.e., 1046 to 256 BC) (Hartman et al., 2015).
In the world, there are more than 100,000 accessions of Glycine max and no more than
10,000 accessions of Glycine soja (Hartman et al., 2015). G. max and G. soja have genotypic and
phenotypic differences (Joshi et al., 2013). Glycine max has 46,430 protein-coding genes
(Schmutz and Cannon, 2010). There are 425 protein-coding genes that are unique in G. max, but
are not available in G. soja. Twelve genes relate to seed growth, three relate to oil, and six relate
to protein concentration that are exclusive to G. max (Joshi et al., 2013). An unknown number of
accessions of G. max and G. soja are distributed in Japan, Russia, South Korea, Germany, India,
Indonesia, Australia, Brazil, China, and the United States (Hartman et al., 2015). The United
States Department of Agriculture’s (USDA) soybean collection at the University of Illinois in
Champaign-Urbana is one of the largest germplasm collections in the world (Hartman et al.,
2015). The large soybean germplasm diversity helps scientists to investigate for genetic
resistance to pests, pathogens, and weather stresses (Hartman et al., 2015).

14
Soybean Growth Stages and Maturity
Soybean plants have vegetative (V) and reproductive (R) growth stages. The vegetative
stages are emergence (VE), cotyledon (VC), first, second, and third nodes (V1, V2, and V3,
respectively) and the Nth number of nodes (VN). The reproductive stages are when blooming
begins (R1), complete flowering (R2), beginning of pod development (R3), complete pod
development (R4), beginning of seed development (R5), complete seed development (R6),
beginning of maturity (R7), and complete seed maturity (R8; Fehr et al., 1971).
In North America, a maturity group (MG) system is used to indicate the area of
adaptation for a cultivar. The MG ranges from 000 to X. Cultivars that mature ultra-early are
designated with MG 000 and are located in Canada, which has a short growing season, while
cultivars designated with MG X are adapted to tropical and subtropical regions, which have
longer growing seasons (Hartman, 2015).
Soybean Production
Optimum Soybean Growing Conditions
The environment plays an important role in soybean production. The optimum soil pH for
soybean is between 5.8 and 7.0 and 25 to 30oC is the ideal air temperature for soybean growth
(Hartman et al., 2015). Adequate soil preparation, depth of planting, and weed control can
improve plant growth. Cultivar election, planting date, row spacing, and adequate seed
distribution can alter soybean productivity (Hartman et al., 2015). Microbial associations with
fungi might benefit soybean growth and drought tolerance and optimize the uptake of
phosphorus (P) and other nutrients (Hartman et al., 2015). Soybean seeds should be inoculated
with the N-fixing bacteria Rhizobium japonicum if soybeans had not been planted in a field for

15
more than four years or if the field has been underwater (McWilliams et al., 1999). Soybean
seeds should be planted 2.5 to 3.8 cm deep , but not more than 5 cm deep because deep planting
can hinder soybean germination (McWilliams et al., 1999). Soybean seeds require a minimum
soil temperature of 12oC for germination. Soybean seeds also need 50% moisture seed content
(dry weight) to germinate. Adequate soil moisture is crucial for homogeneous germination
(Hartman et al., 2015).
Soybean plants have vegetative growth for some weeks prior to flowering, where
flowering lasts approximately 2 to 4 weeks, during which time soybean plants can withstand
short periods of soil moisture stress by delaying plant growth. Water supply of 0.9 cm per day
should be applied to keep optimum moisture in the soil, which is crucial during reproductive
stage (full blossom and pod-filling stage) (Hartman et al., 2015). In tropical regions, soybean
maturity is achieved in about five months, while maturity can be achieved in as little as three
months in temperate regions (Hartman et al., 2015).
Global Production
Soybean is an important crop around the world (Hartman el al., 2010). In 2013, soybeans
were grown in 70 countries, where the leading producers were: United States (31% of total
global production), Brazil (31%), Argentina (19%), China (5%), India (4%), Paraguay (3%), and
Canada (2%) (Hartman et al., 2015). In 2016, soybean production in the word was led by the
United States with 117.2 million megagrams (MMg) of soybeans harvested followed by Brazil
(96.3 million MMg), Argentina (58.8 million MMg), India (14.0 million MMg), China (12.0
million MMg), Paraguay (9.2 million MMg), Canada (5.8 million MMg), Ukraine (4.3 million
MMg), Bolivia (3.2 million MMg), and the Russian federation (3.1 million MMg) (FAO, 2019).

16
During the 2016-2017 soybean growing season, the average production in the world was 2.93
Mg ha-1. In the same year, Serbia had the largest average soybean production with 3.51 Mg ha-1
followed by the United States with 3.49 Mg ha-1, Brazil with 3.38 Mg ha-1, Turkey with 3.33 Mg
ha-1, Argentina with 3.17 Mg ha-1, Paraguay with 3.05 Mg ha-1, the European Union with 3.00
Mg ha-1, Canada with 2.96 Mg ha-1, Uruguay with 2.95 Mg ha-1, Ukraine with 2.31 Mg ha-1,
South Africa with 2.29 Mg ha-1, Zambia with 1.94 Mg/ha, Bolivia with 1.86 Mg ha-1, Mexico
with 1.85, China with 1.79 Mg ha-1, North Korea with 1.61 Mg ha-1, Japan with 1.59 Mg ha-1,
South Korea with 1.53 Mg ha-1, and India with 0.98 Mg ha-1 (FAO, 2019).
Soybean Production in North America
In North America, soybean was introduced by Samuel Bowen 250 years ago and, by the
1940s, soybean was widely grown (Hartman et al., 2015). Soybean has become one of the
principal North American crops due to soybean’s high yield capacity and easier harvest ability
compared to other crops (Hartman et al., 2015).
Soybean Production in the United States
Soybean has been an important crop in the United States (U.S) since the 1880s, when
initially soybean’s main use was for forage (Piper and Morse, 1923). Soybean production has
increased rapidly in the United States since the 1950s (Qiu and Chang, 2010). Soybean
production is grown in 22% of the approximately 137.6 million hectares of harvested cropland in
the United States, second only to corn (CAST 2009; Lubowski et al., 2002). The main areas for
soybean production in the US are the in the Midwest or Corn Belt, the Mid-South or Lower
Mississippi River Delta, and the southeast or Atlantic Coast (CAST, 2009). In 2013, the United

17
States was the first soybean-producing country with 30.7 million ha planted and 89.5 million
MMg harvested, which represented 31% of the total worldwide soybean production (Hartman et
al., 2015). Around 30 to 40% of the soybeans produced in the US are exported (CES, 2019).
According to the USDA, the total soybean-harvested area in 2019 in the US was 32.1 million ha,
which is 4.2 million acres less than the area harvested in 2018 (USDA NASS, 2019). Illinois,
Iowa, Minnesota, North Dakota, Indiana, Missouri, Nebraska, Kansas, South Dakota, Ohio,
Arkansas, are the top 11 soybean-producing states in the US respectively (Table 1; NASS, 2019).
In the US, tillage is a common management practice to prepare soil for soybean planting.
Conventional tillage means little to no residue is left on the soil after tillage and before planting
(CAST, 2009). Soils are typically first tilled with primary tillage implements, such as moldboard
plows, heavy disks, and chisel plows, and frequently more than once with a secondary tillage
implement, such as a tandem disk harrow or field cultivator. In 2002, around 17% of soybeans in
the United States were grown using a conventional tillage system (CAST, 2009). However,
reduced tillage systems have gained popularity, which use only the secondary tillage implements
(i.e., no moldboard or deep plowing), which tends to leave 15 to 30% of the soil covered with
plant residues after tillage (CAST, 2009). In Arkansas, Louisiana, Mississippi, and Texas,
soybean is commonly grown in rotation from year to year with rice (Koenning et al., 1999). In
the Lower Mississippi River Valley, soybean is also frequently grown as a double-crop system in
rotation with wheat over the winter months (i.e., November to May) (Brye et al., 2018).
Soybean Production in Arkansas
In 2019, Arkansas was the 11th largest soybean-producing state in the U.S. (USDA
NASS, 2019, Table 1) and the 45th globally (USDA NASS, 2019). Soybeans rank number one

18
out of the three major crop commodities (i.e., soybean, rice, and corn USDA NASS, 2019) and
are planted in 41 of the 75 counties in Arkansas (CES, 2019). In 2018, 83% of the 1,327,368
soybean hectares planted were irrigated and 17% of soybean production was non-irrigated
(USDA NASS, 2019). The average state soybean yield under irrigated systems is 3,618 and
2,448 kg ha -1 under non-irrigated systems, respectively (USDA NASS, 2019). In 2018, the
4,224,941 Mg harvested had a value of $1,49 billion (USDA NASS, 2019).
In Arkansas, most soybeans varieties are planted between April 25 to early June 30, but
in northern Arkansas soybean MG IV can be planted before April 1 and before April 15 in
northern Arkansas (Ashlock et al., 2019). Crop rotation increases soybean yields because the life
cycle of many diseases and pests is broken (Ashlock et al., 2019). In Arkansas, wheat is most
commonly grown in rotation with soybean. The common agronomic management practices for
the wheat-soybean, double-crop production systems consist of N fertilization of the wheat in the
spring of the year to optimize wheat grain yield followed by residue burning and conventional
tillage after wheat harvest with soybean grown under irrigation (Brye et al., 2018).
Non-weed Pests in Soybeans
Diseases and pests on soybean plants are vital due to the importance of the crop (Hartman
et al., 2015). Many soybean diseases were recognized more than 100 years ago, and others are
relatively new (Hartman et al., 2015). As soybean is being grow in new territories, new pests and
diseases will invariably appear (Hartman et al., 2015). Biotic and abiotic factors can cause
diseases in plants. With biotic factors, the disease is transmitted from an infected plant to a
healthy plant and the infection occurs when certain conditions are favorable (Hartman et al.,
2015). Diseases in plants can be attributed to bacterial, viral, fungal infections, nematodes, and

19
other parasitic plants (Hartman et al., 2015). More than 200 diseases can affect soybean growth
and seed production (Hartman et al., 2015). However, only about 35 diseases have a major
economic impact on soybean production (Hartman et al., 2015). Various soybean pathogens and
pests can stay in soybean plants wherever soybeans are planted (Hartman et al., 2015). All the
soybean plant parts are susceptible to diseases and pests, which can negatively affect soybean
plant quality and production quantity (Hartman et al., 2015). The type of pathogen, plant
development stage, severity of the disease on a single plant, and number of plants affected are
the major factors affecting the degree of pest-caused damage to a plant.
Non-weed Pests in Soybeans around the World
The most common diseases for soybean in Argentina, Brazil, and the US are brown spot
(Septoria glycines), soybean rust (Phakopsora meibomiae and P. packyrhizi), and SCN,
respectively (Hartman et al., 2015). In 2006, diseases caused the loss of approximately 59.9
MMg of soybean yield in the eight major soybean-producing countries, United States, Brazil,
Argentina, India, China, Paraguay, Canada, and Ukraine (FAO, 2019). Of the 213.1 MMg of
soybean yield produced in the eight leading countries, 28% of the yield was lost due to soybean
diseases (Hartman et al., 2015). It was estimated that 13.6 MMg of soybean yield was lost in
total in the US, Brazil, and Argentina combined (Hartman et al., 2015).
Non-weed Pests in Soybeans in Argentina
In Argentina, an estimated of 40 diseases affect soybeans in Argentina (Hartman et al.,
2015). Diseases such as downy mildew (Peronospora manshurica), frogeye leaf spot
(Cercospora sojina), soybean rust , target spot (Corynespora cassiicola), Phytophthora root rot

20
(Phytophthora sojae), stem rot (Phialophora gregata), fusarium root rot (Fusarium solani),
damping-off (Pythium ultimum Trow ), rhizoctonia root rot (Rhyzoctonia solani), Sclerotium
blight (Sclerotium rolfsii), charcoal rot (Macrophomina phaseolina), soybean mosaic virus
(SMV), and nematodes affect soybean production in Argentina (Hartman et al., 2015). SNC,
peanut root-knot (Meloidogne arenaria), and southern root-knot nematode (Meloidogyne
incognita) are the most important nematodes that affect soybean production in Argentina. Cyst
nematode caused problems in the 1990s, but, by the 2000s, soybean nematode populations
decreased (Hartman et al., 2015). Integrated pest management practices and crop rotations were
implemented to avoid pests and diseases. However, conservation tillage practices that are used to
protect soil from erosion, conserve water, and improve physical and chemical soil characteristics
can also harbor disease-causing pathogens over winter and promote negative disease effects in
the subsequent crop (Hartman et al., 2015). Using certified seeds that are pathogen-free can
decrease diseases on soybeans in Argentina (Hartman et al., 2015).
Non-weed Pests in Soybeans in Brazil
In 2013, Brazil planted 27.9 million ha of soybeans and harvested 81.7 MMg (Hartman et
al., 2015). The development of cultivars adapted to low latitudes helped Brazil to become one of
the worldwide leaders in soybean production (Hartman et al., 2015). Soybean rust, frogeye leaf
spot, and southern stem canker (Diaporthe phaseolorum) were important diseases before the
development of disease-resistant cultivars in Brazil (Hartman et al., 2015). In the-mid 1990s,
stem canker caused soybean yield losses up to 100% in Brazil (Hartman et al., 2015). Soybean
cyst nematode, lesion nematode (Pratylenchus spp.), reniform nematode, southern root-knot
nematode, and javanese root-knot nematode (Meloidogyne javanica) were the most injurious to

21
soybean production in Brazil (Hartman et al., 2015). Soybean cyst nematode was detected in the
early 1900s and, by 2015, SCN had affected 3 million ha of soybeans (Hartman et al., 2015).
Rotating soybeans with a non-host crop, particularly corn, and the use of genetically modified,
disease-resistant cultivars helped to control nematode damage to soybean crops in Brazil
(Hartman et al., 2015). However, the genetic variability of nematodes remains a problem
(Hartman et al., 2015). In Brazil, lesion nematode is a major problem, particularly in sandy soils,
and reniform nematode is a major problem in soybean-cotton (Gossypium hirsutum) rotations
(Hartman et al., 2015).
Non-weed Pests in Soybeans in Canada
In Canada, soybean has been cultivated since the 1900s (Hartman et al., 2015). In 2013,
1.83 million ha of soybeans were grown and 5.2 MMg of soybeans were harvested (Hartman,
2015). Approximately 40 diseases affect soybean plants in Canada (Hartman et al., 2015). In
Canada, SCN is the most important yield-limiting pest and causes major economic losses.
Sudden death syndrome (Fusarium virguliforme), Sclerotinia stem rot (Sclerotinia sclerotiorum
(Lib)), pod and stem blight [Diaporthe phaseolorum (Cke. & Ell.) Sacc. var. sojae], Phomopsis
seed decay (Phomopsis longicolla T.W. Hobbs), and Phytophthora root (Phytophthora sojae) are
other important diseases in Canada (Hartman et al., 2015).
The factors of disease occurrence are environmental conditions, susceptibility of the crop,
and tillage practices (Hartman et al., 2015). In Canada, minimum tillage has had increased root
diseases due to pathogens over-wintering in the crop residue left on the soil surface under
reduced tillage. In addition, shorter crop rotations have increased soybean disease incidence
(Hartman et al., 2015). Early cyst nematode detection and education are two activities that can

22
help control nematode infestation (Hartman et al., 2015).
Non-weed Pests in Soybeans in China
Soybean was cultivated in China hundreds of years ago (Hartman et al., 2015). In 2013,
6.6 million ha of soybeans were planted in China and 12.5 MMg of soybeans were harvested
(Hartman et al., 2015). More than 30 diseases affect soybeans in China (Hartman et al., 2015).
The most important diseases in China are bacterial blight (Pseudomonas syringae pathovar.
glycinea), bean pod mottle (BPMV; genus Comovirus), brown spot, brown stem rot, downy
mildew, frogeye leaf spot, Phytophthora root and stem, pod, and stem blight, rhyzoctonia root
rot, sclerotinia stem rot, SCN, soybean mosaic virus, and soybean rust (Hartman et al., 2015). In
China, eight different types of SCN have been reported. Soybean cyst nematode is a destructive
pest in China (Hartman et al., 2015). In China, since the 1970s, thousands of soybean accessions
have been studied for cyst nematode resistance (Hartman et al., 2015). The majority of resistant
cultivars have brown or black seeds (Hartman et al., 2015). Crop rotation, management of soil
fertility, and coating soybean seeds with a biocontrol (i.e., a fungus and/or bacteria) or
nematicide (Hartman et al., 2015).
Non-weed Pests in Soybeans in India
In 2013, India was the fourth largest soybean producer in the world. In the same year,
12.2 million ha of soybeans were planted and 11.9 MMg of soybeans were harvested. In the
early years of soybean cultivation in India, there were no disease problems (Hartman et al.,
2015). Approximately 35 diseases occur frequently in India (Hartman et al., 2015). Frogeye leaf
spot, soybean rust, Mycrothecium leaf spot (Myrothecium roridum), brown spot, Alternaria leaf
23
spot (Alternaria spp.) pods and stems anthracnose (Colletotrichum truncatum), cercospora leaf
blight (Cercospora kikuchii), rhizoctonia aerial blight (Rhizoctonia solani AG1-1A,), pod blight
(Alternaria, Myrothecium, Macrophomia phaseolina), purple seed stem (Cercospora kikuchii),
fusarium blight (Fusarium tracheiphilum), fusarium pod and collar rot (Fusarium spp.), target
leaf spot, choanephora leaf blight (Choanephora infundibulifera), phoma leaf blight (Phoma sp),
phyllosticta leaf spot (Phyllosticta sojicola), bacterial pustule (Xanthomonas phaseoli), yellow
mosaic disease (YMD), and nematodes are the principal soybean diseases in India (Hartman et
al., 2015). In India, nematodes have not been studied extensively yet, but a population between
300 to 500 root-knot and reniform nematodes can exist in 250 g of moist soil (Hartman et al.,
2015).
Plant-parasitic Nematodes in the US
In 2013, the US was the top soybean-producing country with 30.7 million ha of soybean
planted and 89.5 MMg of soybean grain harvested, which represented 31% of the total
worldwide soybean production (Hartman et al., 2015). Soybeans are grown in 37 states in the US
and diseases occur in all the areas where soybeans are produced (Hartman et al., 2015). In the Us
and Ontario an average of $ 60.66 USD per acre is estimated to be the soybean economic losses
caused by diseases (Allen et al., 2017) The annual average yield loss attributed to soybean
diseases is approximately 11% in the US (Hartman et al., 2015). An annual average of 11.2
MMT or 13% of the total soybean grain yield in the US were lost during the 2006 to 2009 period
from diseases (Hartman et al., 2015). The principal pest that affects soybean in the US is SCN,
which accounted for 30.9% of the total loss during the 2006 to 2009 period (Hartman et al.,
2015).

24
Soybean cyst nematode is the most important pest for soybean production in the US
(Hartman et al., 2015; Young, 1996). The first article written by S. Hori documented the SCN
damage to soybeans in Japan in 1915 (Davis and Tilka, 2000). However, in China, old Chinese
personal reports and other texts suggest that SCN has been a soybean pathogen since as early as
235 BCE (Davis and Tilka, 2000). The first report of SCN in the US was in 1954, in Hanover
County, North Carolina, an area known for importing bulb flowers from Japan (Hartman et al.,
2015 and Davis and Tilka, 2000). The rapid SCN spread to other soybean-growing states
suggests that SCN is native to many areas and parasitizes some weeds and legumes in the US
(Davis and Tilka, 2000). There are some reports that soybean seeds had been imported to the US
earlier than 1765. Lambert and Bekal (2002) mentioned that SCN may have been introduced to
the US in soil to obtain rhizobia (Bradyrhrizobium japonicum) imported from Asia and
distributed to soybean researchers.
Root-knot nematode is the second most detrimental nematode in soybean production
(Hartman et al., 2015). However, the importance of lance, lesion, reniform, and sting nematodes
have not been well-studied yet in the US (Hartman et Al., 2015). Moreover, lance nematode,
lesion nematode, Reniform, and Dagger nematode are major plant-parasitic nematodes to cause
crop losses (Koenning et al., 1999).
Plant-parasitic Nematodes in Soybeans
More than 100 nematode species have been related to soybean roots, but only a few of
them are economically important (Hartman et al., 2015). Plant-parasitic nematodes potentially
cause agronomic and economic losses in the wheat-soybean, double-crop production systems in
the Mid-Southern US (Brye et al., 2018). Farmlands infected with nematodes often have low

25
productivity and weed problems because palmer pigweed (Amaranthus palmery), redroot
pigweed (Amaranthus retroflexus), spiny pigweed (Amaranthus spinosus), sicklepod (Senna
obtusifolia), common lambsquartes (Chenopodium album), field bindweed (Convolvulus
arvensis), yellow nutsedge (Cyperus esculentus L), purple nutsedge,(Cyperus rotundus)
morning glory (Ipomoea purpurea), henbit (Lamium amplexicaule), nightshade (Solanum sp),
common ragweed (Ambrosia artemisiifolia), barnyard grass (Echinochloa crus-galli), and
goosegrass (Carex sp.) are suitable hosts for SCN. Nematode management is challenging to
manage due to the difficulty to target the nematodes with the pesticides to the soil (ASPB, 2019).
Soybean cyst nematode continues to be the main constraint on soybean production (Bao
et al., 2011). Infected soybean plants do not always present typical symptoms of nematode
infection, such as chlorosis and stunting, and some fields infested with nematodes may or may
not present foliar symptoms at all (Hartman et al., 2015). In Tennessee, on a Lexington silt loam
(fine-silty, mixed, active, thermic Ultic Hapludalfs) SCN caused soybean yield losses in the
absence of visual symptoms on above-ground plant material (Young, 1996).
Plant-parasitic Nematodes in Arkansas
Between 1978 and 1986, the most important parasitic nematodes in Arkansas were SCN,
stunt nematode, northern root lesion nematode, spiral nematode (Helicotilenchus
pseudurobustus), stunt nematode (Tylenchorhynchus ewingi), and American dagger nematode
(Xiphinema americanum) (Robbins et al., 1987). Moreover, smooth-headed lesion nematode
(Pratylenchus brachyurus), walnut root-lesion nematode (P. vulnus), corn root-lesion nematode
(P. zeae), stunt nematode (Tylenchorhynchus canalis and T. goffarti), rice stunt nematode (T.

26
martini), steiner’s spiral nematode (Helicotylenchus dihystera), yam nematode (Scutellonema
bradys), chamber’s dagger nematode (Xiphinema chambersi), rivesi dagger nematode (X.
rivesi),cobb’s lance nematode (Hoplolaimus galeatus), lance nematode (H. magnistylus), stubby
root nematode (Paratrichodorus minor and P. christiei), pin nematode (Paratylenchus projectus
and P. tenuicaudatus), ring nematode (Mesocriconema spp), and stunt nematode (Meiodorus
hollisi) are other soybean parasitic nematodes in Arkansas (Robbins et al., 1987). In 1979,
reniform nematode was first reported in Arkansas, specifically in a soybean field in Crawford
County (Robbins et al., 1987). In Arkansas, in 1979, nematode infestation in soybean was mainly
caused by SCN (77.7% of infestation), root-knot nematode (7.2% of infestation), lesion (56.0%
of infestation), stunt (33.8% of infestation), spiral (33.1% of infestation), dagger (20.9% of
infestation), stubby-root (15.1% of infestation), pin (8.6% of infestation), lance (2.2% of
infestation), ring (< 1%), and others (1.4% of infestation) (Robbin et al., 1987).
Kirkpatrick (2017) reported that in Arkansas 28%, of soil samples tested positive for the
Southern RKN and SCN nematode, 20% to lesion, and 2 % to reniform nematode. The SCN has
been a serious concern in Arkansas for the last 30 years; the Southern RKN and the reniform
nematode is a relatively new reported to cause soybean damage in the last 20 to 30 years
(Kirkpatrick, 2017). Soybean yield losses have been associated to the Southern RKN, but the
impacts of lesion and reniform nematode are still unknown (Kirkpatrick, 2017).
Economic Losses Caused by Nematodes
Nematodes cause yield losses in soybeans and other crops around the world. In the U.S., SCN
damage accounted for 30.9% of the total soybean yield losses during the 2006 to 2009 period
(Hartman et al., 2015). In the U.S., SCN causes more than $1 billion in crop damage every year

27
(Wrater and Koenning, 2006). The Southern root-knot nematode hinders the production of many
crops around the world (Allen et. al., 2017). In 1994, SCN caused soybean yield losses of 1 to
5% in Arkansas (Arkansas Soybean Promotion Board, 2019). More recently, in the 28 U.S.
soybean-producing states and Ontario, Canada, SCN alone caused more than 16, 803 thousand
Mg in yield losses from 2010 to 2014 (Allen et. al., 2017).
Plant-parasitic Nematode Control
The use of resistant cultivars, nematicides, and rotations with a non-host crop are the
main tactic used to control SCN (Bao et al., 2011). In the U.S. exists hundreds of soybean
cultivars that are resistant to more than one race of SCN, but there is not agronomically accepted
soybean cultivars for many races of SCN (Bridge and Starr, 2007). Moreover, no soybean
cultivar is resistant to root-knot nematode, reniform, and SCN when all together are present in
the soil (Thomas, 1994). However, there are moderately resistance to RKN in some MG 4
soybean cultivars (Delta Grow DG 4995 GLY, Delta Grow DG 4940, Pioneer P47T59R, and
Terral REV48A46) (Emerson et al, 2018). Nematicides are efficient control measures for
nematodes, but economic and environmental problems are of concern (Rich et al., 2004). Using a
combination of resistant cultivars and crop rotation is the most effective and universally
practiced strategy for managing soybean pests (CAST, 2009). It has been suggested that
soybeans should not be rotated with corn and cotton when the southern root-knot nematodes are
present because corn and cotton are suitable hosts for the southern root-knot nematode; however,
if a field is infested with SCN or reniform nematode, corn should be planted in rotation with
soybeans as corn is a non-host for SCN and reniform nematode. In addition, rice can be planted
in rotation with soybeans, which is a common crop rotation in Arkansas as flooded rice can be a

28
good management tool for southern root-knot nematode; however, SCN eggs can survive in cyst
even when flood is maintained during the cropping season in a rice field.
Research Studies on Nematodes
World Wide
In France, a 14-year-long study on a Luvisol soil (silt-loam texture) in which winter
wheat was planted each year concluded that conservation and organic agriculture increased the
total nematode population from 100 to 700%, but decreased the population of predaceous
nematodes (Henneron et al., 2015). Specifically, the total nematode population increased by a
factor of seven under long-term, no-tillage (NT) systems (Henneron et al., 2015). In Nigeria,
spiral nematode and root knot nematode juvenile populations were smaller under a corn rotation
with other crops and NT than under conventional tillage (CT) (Caveness, 1979).
United States
Tillage Effects
In the U.S., 25.1 million hectares were under NT systems in 2018 (USDA-NRCS, 2019).
In the U.S., little is known about the effects of tillage and cropping systems on different species
of nematodes (Cheng et al., 2018). However, many studies have reported the effects of tillage on
SCN (Bao et al., 2011). In Michigan on a Sisson sandy loam soil (fine, loamy, mixed,
semiactive, mesic Type, Hapludalfs), plant-parasitic nematode population density was
significantly lower in tilled compared to no-tilled treatments 157 days after planting in 2019
(Cheng et al., 2018). In the north-central U.S., inconsistent tillage effects were observed on SCN
population (Bao et al., 2011). Hershman and Bachi (1995) reported that on a wheat-soybean

29
double-crop study conducted from 1990 to 1992 in Kentucky on a Crider silt loam (fine-silty,
mixed, active, mesic Typic Paleudalfs), and on a Pembroke silt loam soil (fine-silty, mixed,
active, mesic Mollic Paleudalfs), SCN eggs population density was numerically larger under
minimum-tillage than NT at soybean planting, but the results were the opposite at harvesting in
1992. In South Carolina, the population densities of root knot nematode and stubby-root
nematode remained stable under minimum tillage and CT corn (i.e., mono-crop system) (Fortum
and Karlen, 1985). In Georgia, on a Marlboro sand (fine, kaolinitic, thermic Typic Paleudults),
lance nematode population densities were greater at 20 to 33 and 33 to 46 cm depths in sub-
soiled soybean than CT soybeans; however, the total number of plant-parasitic nematodes in sub-
soiled and CT systems were the same (Parker et al., 1975). In Tennessee, on a Lexington silt
loam soil SCN population densities in soybean was lower under NT compared to other tilled
systems, such as disked, chiseled, sub-soiled under rows, and sub-soiled between rows (Tyler et
al., 1983). Moreover, in Indiana, on a silt loam soil, densities of lesion nematode in soybean were
greater under CT than in under zero-tillage, which was attributed to the larger and robust
soybean roots under CT (Alby et al., 1983). In Georgia, on a sandy clay loam soil plant-parasitic
nematode population in a grain sorghum (Sorghum bicolor)-cereal rye (Secale cereale) rotation
were reduced with NT than CT (Stinner and Crossley, 1982).
Since the nematode life cycle is relatively short, nematode population densities and
degree of plant damage can vary throughout the soybean growing season. Baird and Bernard
(1984) studied nematode population and community dynamics in soybean-wheat cropping and
tillage regimes in Tennessee. The study concluded that in July SCN J2 population densities were
greater under CT, soybean single-crop system compared to CT wheat-soybean double crop, CT
after aerially seeded wheat, soybean NT after CT wheat, and soybean NT after aerially seeded

30
wheat (Baird and Bernard, 1984). In Iowa, on a Clarion-Nicollet-Webster loam soil (fine-loamy,
mixed, superactive, mesic Typic Hapludolls, fine-loamy, mixed, superactive, mesic Aquic
Hapludolls, and fine-loamy, mixed, superactive, mesic Typic Endoaquolls) with 40 to 50% sand,
plant-parasitic nematodes in a monoculture corn crop were more abundant in NT plots than in
spring- and autumn-tilled plots (Thomas, 1978). Pin nematode population increased during the
corn growing season under a variety of conventional and conservative tillage treatments
(Thomas, 1978). Plant parasitic nematodes formed aggregation under single-cropped soybean-
CT; however, plant parasitic nematodes did not form aggregation in all double-cropped systems
(Baird and Bernard, 1984). In Indiana, in a silt loam soil, the population of lesion nematode was
more uniformly spatially distributed in non-tilled than in tilled soybean plots (Alby et al., 1983).
In Georgia, on a Marlboro sand soil lance nematode population density in the top 20 cm was
greater under a monoculture soybean crop with no sub soiling than when sub-soiled was imposed
(Parker et al., 1975). In addition, the lance nematode population decreased with soil depth
(Parker et al., 1975). In South Carolina, sub-soiling and nematicides were effective control of
lance nematodes (Blackmon and Musen, 1974). Given the variation in nematode response to
tillage in these studies the effect of tillage practices varies greatly among nematode types and
soil types across the U.S.
Crop Rotation and Cover Crops Effects
Multi-crop rotations may increase or decrease nematode issues depending on the crop in
rotation (Minton, 1986). Farming resistant or susceptible soybean cultivars for 7-years under CT
or NT in rotation with corn on a Drummer silty clay loam with 6% SOM had no long-term
influence on SCN egg density (Noel and Wax, 2003). However, in non-tilled systems in rotation

31
with corn, the number of eggs produced was greater at harvest than at planting (Noel and Wax,
2003). In southern U.S a 6-year study on a Tifton loamy sand (fine-loamy, siliceous, thermic
Plinthic Kandiudults) with 0.5% soil organic matter (SOM) concluded that the population
densities of the southern root knot nematode and peanut root-knot nematode did not increase
over time under crop rotations of wheat, peanut (Arachis hypogaea), and cotton under minimum
tillage and sprinkler irrigation (Johnson et al., 2000). In a wheat-soybean double crop on a
Lexington silt loam soil in Tennessee under five CT systems (i.e., disking, chisel plowing,
moldboard plowing, between-row sub-soiling, and under-row sub-soiling) followed by disking
and/or section harrowing, using conventional to NT planting, where the cover crop (wheat) was
chemically killed, the SCN population was lower under non-tilled than under CT treatments
(Tyler et al., 1987). A 3-year corn-soybean rotation, the populations of SCN, stubby-root
nematode, and sting nematode increased over time under rip-plant corn (Minton et al., 1986). In
Illinois, a 5-year study on four different soils, Proctor silt loam (fine-silty, mixed,
superactive,mesic Typic Argiudolls), Cisne silt loam (fine, smectitic, mesic Mollic Albaqualfs)
(light-colored), Drummer clay loam (fine-silty, mixed, superactive, mesic Typic Endoaquolls),
and a clay loam soil (dark-colored), with rotations including corn, soybean, wheat, and a forage
crops alfalfa, red clover (Trifolium pratense), and Bomegras (bromus inermis), population
densities of spiral nematode and stylet-stunt nematode were greater in dark-colored than in light-
colored soils, while pin nematode population density was favored in the light-colored soils
(Ferris and Bernard, 1971). Dagger nematode population density was not affected by crop and
soil type, but the population densities of lesion nematode species were low in all the treatments
(Ferris and Bernard, 1971). Crop rotation can decrease nematode population when a non-
susceptible cultivar is planted in the crop rotation.

32
Soil Moisture/Irrigation Effects
Soil moisture content can affect nematode populations. In irrigated soils (i.e., large water
contents) in North Carolina, nematode population densities were lower than in non-irrigated soils
(i.e., low water contents; Koenning and Barker, 1995). The greater SCN population density
under no irrigation may be because of a more favorable soil water/oxygen content ratio
(Koenning and Barker, 1995). In irrigated sand, sandy loam, and muck soils, SCN damage
increased, and soybean yield decreased; however, SCN did not affect soybean yield in non-
irrigated, fine-textured soils (Koenning and Barker, 1995). In soybean, supplementary irrigation
cannot be applied with the purpose of controlling nematode populations or damage (Koenning
and Barker, 1995).
Soil moisture affects primarily soybean growth and yield potential. Likewise, soil matric
potential influences plant parasitic nematode’s capacity to hatch, to move in the soil, detect and
penetrate a host plant, and mate (Koenning and Barker, 1995). In dry conditions, soybean plants
respond to moisture by extending root biomass that may favor SCN reproduction (Heatherly et.
al., 1992). A study conducted in a greenhouse using either Dubbs silt loam (fine-silty, mixed,
active, thermic Typic Hapludalfs) or Sharkey clay (very fine-silty, montmorillonitic, nonacid
thermic Vertic Haplaquept) concluded that reproduction of SCN was greater at -20 to -40 than at
-60 to -80 kPa (Young and Heatherly, 1988). In a Vicksburg sandy loam (coarse-silty, mixed,
active, acid, thermic Typic Udifluvents), -30 to -40 kPa was the ideal soil matric potential range
for SCN reproduction (Heatherly et al., 1982). In another greenhouse study using a Dubbs silt-
loam soil, SCN population densities increased overtime (3 years) in the irrigated treatment that
maintain an optimum water potential (i.e., -30 kPa), but SCN population densities remained
stable and similar to the initial infestation in the soil that was irrigated at half the rate to maintain

33
an optimum water potential (i.e., dry soil) (Heatherly and Young, 1991). However, the SCN
population densities decreased over time in both the wet and dry clay-soil treatments (Heatherly
and Young, 1991). Root-knot nematode and sugar beet cyst nematode (Heterodera schachtii)
eggs hatched evenly at field capacity (-10 to -33 kPa) and permanent wilting point (-20 to –50
kPa); however, the hatched nematodes were not able to migrate in the soil at permanent wilting
point (Couch and Bloom, 1960; Wallace, 1955). Water distribution in the soil pores is an
important aspect for the movement of sugarbeet nematode juveniles (Wallace, 1958a, b).
Soybean cyst nematode J2 became inactive for a long period of time and survived in water up to
630 days; however, freezing did not kill nematodes immediately (Slack et al., 1972).
Nitrogen Fertilization Effects
Urea (46-0-0; N-P-K), has been investigated as a potential nematicide because
ammoniacal N is harmful to nematodes (Rodriguez-Kabana, 1986). A nematode population can
be effectively suppressed using mineral fertilizers containing ammoniacal N because
ammoniacal-based N fertilizers tend to be toxic to nematodes. (Rodriguez-Kabana, 1986). The
use of anhydrous ammonia reduced populations of tobacco stunt nematode (Tylenchorhynchus
claytoni), Steiner’s spiral (Helicotylenchus dihystera), and SCN more than the application of 150
kg N ha-1 as urea. However, applying urea above 350 kg N ha-1 can control many nematodes,
including root-knot nematode (Rodriguez-Kabana, 1986). Different C:N ratios of organic
fertilizers can also affect nematode populations, where greater N concentrations in the soil tend
to decrease the nematode population (Rodriguez-Kabana, 1986). Mojtahedi and Lownsbery
(1976) conducted an in-vitro study in which nematodes (ring nematode) were controlled with
fertilizer that generate NH3 (ammonia). Though urea has been shown to successfully control

34
nematode populations when applying more 300 kg N per kg soil (Huebner, et al. 1983;
Rodríguez-Kábana, 1986), large N fertilization rates can result in phytotoxicity (Huebner, 1983;
Rodríguez-Kábana, 1986). Different nematode species are affected by different fertilizer doses.
For instance, inhibited the population densities of lesion nematode and lance nematode, but did
not affect that of stunt nematode (Miller, 1976). The application of N-containing organic
fertilizers to the soil has also been shown to reduce nematode populations (Rodriguez-Kabana,
1986).
Residue Burning Effects
Little research exists on the effects of burning on nematodes in agricultural soils.
However, some studies have addressed the effects of burning on nematodes in forests and
prairies. Cerevkova et al. (2013) examined short-term effects of forest disturbances on soil
nematode communities in a spruce (Picea spp.) forest in Slovakia during June and October of
2006 to 2008 on a cambisol podzolic soil with pH of 4.0 at the 10-cm soil depth under annual
forest burning, in which a total of 46 species of nematodes were recorded after three years of the
annual burning. Of the 46 nematodes recorded, the majority were bacterial feeders and nine were
plant parasites (i.e., spiral, pin, reniform, and stubby root-knot nematode species) (Cerevkova et
al., 2013). The researchers reported that the total nematode population densities decreased by
34.5% and 50.6% in 2007 and 2008 compared to 2006, respectively; however, the diversity of
nematode species increased by 13% from the first to third year of the study, where burning was
imposed each year (Cerevkova et al. 2013). The abundance of bacterial-feeding nematodes
decreased by 53.9%, root-fungal feeders decreased by 44.6%, omnivores decreased by 68.4%,
and insect parasites decreased by 53.9% from 2006 to 2008, respectively (Cerevkova et al.,

35
2013). In contrast, the plant-parasitic nematode population increased by 70.3% from 2006 to
2007, but then decreased by 55.1% from 2007 to 2008 (Cerevkova et al., 2013). In addition, the
population densities of predator nematodes increased 71% from the first to the last year of the
field experiment (Cerevkova et al., 2013). The annual burning treatment in this forest affected
the nematode population according to the species and/or their feeding habits (Cerevkova et al.,
2013).
A study conducted in Iowa evaluated the effects of annual burning on nematodes from
1997 to 2004 in an oak (Quercus spp.) forest on a Tama soil series (fine-silty, mixed,
superactive, mesic Typic Argiudolls), in which long-term burning and non-burning treatments
were imposed (Fenster et al., 2004). Results of this study showed that nematode population
densities did not differ between the burn and no-burn treatments (Fenster et al., 2004).
Another study evaluated the effects of management practices on a nematode community
in a prairie on an Irwin silty-clay-loam soil series (fine, mixed mesic, Pachic Argiustoll), with
big bluestem (Andropogon gerardii), Indiangrass (Sorghastrum nutans), and switchgrass
(Panicum virgatum L.) as the prevalent vegetation, in which annually burning and non-burning
treatments were applied (Todd, 1996). Under the burn and no-burn treatments, spiral nematode
populations at the 20-cm soil depth were 137% greater under the annually burned compared to
the unburned treatment after nine years of management (Todd, 1996), which may be due to the
increase of forbs (Sambucus canadensis) and decrease of in C4 grasses (Aristida, Stipagrostis,
Paspalum, Panicinae genus, etc) under the no burn, unmowed and N fertilize plots (Gibson et.
al. 1993). In addition, pin nematode population densities under the burn treatment were 17 to
97% lower in the burn-mow compared to unburned-unmowed treatment combination (Todd,

36
1996). Based on results of these few studies evaluating the effects of burning on nematodes, it
appears that burning may positively or negatively influence nematode populations in the soil.
Relevant Research in Arkansas
There is a little research on nematodes as affected by agricultural practices in Arkansas.
In Fayetteville, Arkansas, susceptible soybean cultivar growth in a Captina silt-loam soil (fine-
silty, siliceous, active, mesic Typic Fragiudult) in a large pot experiment with three water
regimes (i.e., -30 kPa, -50 kPa, and no irrigation), SCN population increased under non-irrigated
conditions (Johnson et al., 1994). However, SCN had no impact on soybean growth under the
three irrigation systems (Johnson et al., 1994). In Arkansas, the largest population densities of
reniform nematode were observed in soils with 54 to 60% silt content (Monfort et al., 2008).
Brye et al. (2018) studied the effects of agricultural management practices in a wheat-soybean,
double-crop production system in eastern Arkansas on a Calloway silt-loam soil (fine-silty,
mixed, thermic, Glossaquic Fragiudalfs). The study was conducted during the 2016 soybean
growing season, 15 years after the long-term study began, in which the combined effects of
tillage (CT and NT), irrigation (Irrigated [I] and non-irrigated [NI]), residue level (high-[H] and
low-[L]), and burning (burned-[B] and non-burned-[NB]) treatments were applied to evaluate
nematode populations and long-term treatments effects. (Brye et al., 2018). Results of the study
showed that the SCN J2 population density was four times greater under the non-burned-
irrigated compared to the burned-non-irrigated treatment combination 70 days after planting
(Brye et al., 2018). Moreover, the stunt and total nematode populations were almost three times
greater under a burn-non-irrigated-NT than under a burn-non-irrigated-CT treatment
combination 34 and 70 days after planting, respectively (Brye et al., 2018). Lance nematode

37
populations were one time and three times greater under a burn-non-irrigated-NT than under a
burn-non-irrigated-CT treatment combination 34 and 70 days after planting, respectively (Brye et
al., 2018). The concentration of SCN eggs were eight times greater under no-burn-irrigated than
under the burn-non-irrigated treatment combination 34 days after planting (Brye et al., 2018).
Justification
Soybean is the most important commodity crop in the U.S., as soybeans are an essential
part of the diet of millions of people, cattle, and poultry, and source material for industry (i.e.,
oil). As the human population in the world increases, soybean production will likely also have to
increase to satisfy the demand for adequate food production. However, nematodes are one of the
main pest management constrains in soybean production in the U.S., particularly in Arkansas,
where the soybean industry provides many jobs and greatly contributes to the state economy.
However, there has been no research in Arkansas characterizing the long-term effects of the
combination of different tillage (conventional tillage and no tillage), water management
(irrigation and non-irrigation), and residue management (burned and non-burned) practices on
plant-parasitic nematodes in soybean. It is necessary to determine whether or not different
tillage, water management, and residue management systems negatively or positively influence
nematode populations.
Objective
The objective of this study was to evaluate the combined long-term effects of tillage
practice (conventional tillage and no tillage), water management (irrigation and non-irrigation),
residue burning (burned and non-burned), and wheat residue level (high and low) on plant-
parasitic nematode population densities and reproduction in the top 10 cm within the growing

38
season and between years soybean in a double-crop production system on a silt-loam soil in
eastern Arkansas.
Testable Hypotheses
For this research, there are several hypotheses related to the management practices in
soybean production in eastern Arkansas. One hypothesis is that greater nematode (root-not, SCN,
reniform, spiral, lance, stunt, dagger, lesion, ring, stubby-root) populations exist under
conventionally tilled plots because nematodes are typically transported on contaminated
equipment and plant parts, which may also increase nematode population. Also, due to that
tillage increases soil porosity temporarily. It is also hypothesized that nematode populations are
greater under irrigated conditions due to greater moisture levels, which nematodes require to
move, live, hatch, and reproduce. Additionally, it is hypothesized that nematode population
densities will be lower under the high- than the low-wheat-residue treatment due to the
decomposition of organic matter, which suppresses microorganisms in the soil. It is also
hypothesized that the nematode population will be greater in the non-burned compared to the
burned treatment because of greater soil moisture conditions.

39
Literature Cited
Alby, T., Ferris, J. M., and Ferris, V. R. 1983. Dispersion and distribution of Pratylenchus
scribneri and Hoplolaimus galeatus in soybean fields. Journal of Nematology 15:418-426.
Allen, T. W., Bradley, C. A., Sisson, A. J., Byamukama, E., Chilvers, M. I., Coker, C. M.,
Collins, A. A., Damicone J. P., Dorrance, A. E., Dufault, N. S., Esker, P. D., Faske. T. R.,
Giesler, L. J., Grybauskas, A. P., Hershman, D. E., Hollier, C. A., Isakeit, T., Jardine, D. J.,
Kelly, H. M., Kemerait, R. C., Kleczewski, N. M., Koenning, S. R., Kurle, J. E., Malvick, D. K.,
Markell, S. G., Mehl, H. L., Mueller, D. S., Mueller, D. J., Mulrooney, R. P., Nelson, B. D.,
Newman, M. A., Osborne, L., Overstreet, C., Padgett, G. B., Phipps, P. M., Price, P. P., Sikora,
E. J., Smith, D. L., Spurlock, T. N., Tande, C. A., Tenuta, A. U., Wise, K. A., and Wrater, J. A.
2017. Soybean yield loss estimates due to diseases in the United States and Ontario, Canada,
from 2010 to 2014. Plant Health Progress 18: 19-27.
Arkansas Soybean Promotion Board (ASPB). 2019. Controlling harmful effects of
nematodes [Online]. Available at: https://www.themiraclebean.com/controlling-the-harmful-
effects-of-nematodes-2/ (verified 25 Nov., 2019).
Ashlock, L., Klerk, R., Huitink G., Keisling, T., and Vories, E. Planting practices [Online].
Available at https://www.uaex.edu/publications/pdf/mp197/chapter7.pdf (verified 26 Nov.,
2019).
Baird, S. M., and Bernard, E. C. 1984. Nematode population and community dynamics in
Soybean-wheat cropping and tillage regimes. Journal of Nematology 16:379-386.
Bao, Y., Neher, D. A., and Chen, S. 2011. Effect of soil disturbance and biocides on
nematode communities and extracellular enzyme activity in soybean cyst nematode suppressive
soil. Nematology 13:687-699.
Blackmon, C. W., and Musen, H. L. 1974. Control of the columbia (lance) nematode
Hoplolaimus columbus on soybeans. Plant Diseases 58:641-645.
Bridge, J., and Starr, J. L. 2007. Plant nematodes of agricultural importance: A colour
handbook. Manson Publishing. London, UK.
Brye, K. R., Quarta, M., Morrison, C., and Rothrock, C. 2018. Long-term effects of residue
and water management practices on plant parasitic nematode abundance and soybean root
infection. Applied Soil Ecology 124:275-283.
Caveness, F. E. 1979. Nematode population under no-tillage management regime. Pp. 133-
145 in R. Lal, ed. Soil tillage and crop production. International Institute of Tropical Agriculture,
Ibadan, Nigeria.
40
Cheng, Z., Melakeberhan, H., Mennan, S., and Grewal, P. S. 2018 Relationship between
soybean cyst nematode, Heterodera glycines, and soil nematode communities under long-term
tillage and crop rotation systems. Nematropica 48:101-114.
Cerevkova, A., Renco, M., and Cagan, L. 2013. Short-term effects of forest disturbances on
soil nematode communities in European mountain spruce forests. Journal of Helminthology 87:
376-385.
Cooperation Extension Center (CES). 2019. Soybean production in Arkansas. [Online].
Available at https://www.uaex.edu/farm-ranch/crops-commercial-horticulture/soybean/ (verified
12 Nov., 2019).
Couch, H. B. and Bloom, J. R. 1960. Influence of soil moisture stress on the development of
the root knot nematode. Phytopathology 50:319-321.
Council for Agricultural Science and Technology (CAST). 2009. Sustainable of U. S.
soybean production: Conventional, transgenic, and organic production systems. Ames, Iowa.
Davis, E. L., and Tilka, G. L. 2000. Soybean cyst nematode disease. The Plant Health
Instructor [Online]. doi: 10.1094/PHI-I-2000-072501(verified 12 Sep., 2018).
Emerson, M. Brown, K. Faske, T.R., and Kirkpatrick T, L. 2018. Field performance of
several glyphosate-resistant maturity group 4 and 5 soybean cultivars in a root-knot nematode
infested field. Pp. 40-41 in J. Ross ed. University of Arkansas Research Studies 2016. University
of Arkansas Experiment Station. Fayetteville.
Fehr, W. R., Cavinnes, C. E., Burmood, D. T., and Pennington, J. S. 1971. Stage of
development descriptions for soybeans, Glycine max (L) Merrill. Crop Science 11:929-931.
Fenster, M., Ferrick, C., and Scott, M. 2004. Fall burning does not affect nematode density
or carbon and nitrogen levels in Iowa oak forest soils. Tillers 5:9-12.
Ferris, V. R., and Bernard, R. L 1971. Effect of soil type on population densities of
nematodes in soybean rotation fields. Journal of Nematology 3:123-128.
Fortum, B. A., and Karlen, D. L. 1985. Effects of tillage system and irrigation on population
densities of plant nematodes in field corn. Journal of Nematology 17:25-28.
Food and Agriculture Organization of the United Nations (FAO). 2019. Top 20 countries,
net production value of soybeans 2016 [Online]. Available at:
http://www.fao.org/faostat/en/#rankings/countries_by _commodity (verified 26 Nov., 2019).
Fujimoto, T., Hasegawa, S., Otobe, K., and Mizukubo. 2010. The effect of soil water flow
and soil properties on the motility of second-stage juveniles of the root-knot nematode
(Meloidogyne incognita). Soil Biology and Biochemistry 42:1065-1072.

41
Gibson, D. J., Seastedt, T. R., and Briggs, J. M. 1993. Management practices in tallgrass
prairie: large- and small-scale experimental effects on species composition. Journal of Aplied
Ecology 30:247-255.
Hartman, G. L., Rupe, J. C., Sikora, E. J., Domier, L. L., Davis, J. A., and Steffey, K. L.
2015. Compendium of soybean diseases and pests. The American Phytopathological Society. St.
Paul, Minnesota, U.S.
Heatherly, L. G., and Young, L. D. 1991. Soybean and soybean cyst nematode response to
soil water content in loam and clay soils. Crop Science 31:191-196.
Heatherly, L. G, Young, L D., Epps, J. M., and Hartwig, E. E. 1982. Effect of upper-profile
soil water potential on numbers of cysts of Heterodera glycines on soybeans. Crop Science
22:833-835.
Heatherly, L. G., Pringle, H. C., Sciumbato, G. L., Young, L. W., Ebelhar, M. W., Wesley,
R. A., and Tupper, G. R. 1992. Irrigation of soybean cultivars susceptible and resistant to
soybean cyst nematode. Crop Science 32:802-806.
Henneron, L. Bernard, L., Hedde, M., Pelosi, C., Villenave, C., Chenu, C., Bertrand, M.,
Cyril, G., and Blanchart, E. 2015. Fourteen years of evidence for positive effects of conservation
agriculture and organic farming on soil life. Agronomy for Sustainable Development 35:169-
181.
Hershman, D. E., and Bachi. P. R. 1995. Effect of wheat residue and tillage on Heterodera
glycines and yield of double crop soybean in Kentucky. Plant Disease 79:631-633.
Huebner, R. A., Rodríguez-Kábana, R., and Patterson, R. M. 1983. Hemicellulosic waste
and urea for control of plant parasitic nematodes. Effect on soil enzyme activities. Nematropica
13:37-54.
Johnson, A. W., Dowler, C. C., and Handoo, Z. A. 2000. Population dynamics of
Meloidogyne incognita, M. arenaria and other nematodes and crop yields in rotations of cotton,
peanut, and wheat under minimum tillage. Journal of Nematology 32:52-61.
Johnson, A. B., Scott, H. D., and Riggs, R. D. 1994. Response of soybean in cyst nematode-
infested soils at three soil-water regimes. Journal of Nematology 26:329-335.
Joshi, T., Valliyodan, B., Wu, J. H., Lee, S. H., Xu, D., and Nguyen, H.T. 2013. Genomic
differences between cultivated soybean, G. max and its wild relative G. soja. BMC. Genomics
[Online]. doi: 10.1186/1471-2164-14-S1-S5 (verified 26 Nov., 2018).
Karssen, G. and Moens, M. 2006. Root-knot nematode. In Perry, R. N and Moens, M. (eds),
Plant Nematology (pp. 60). Cambridge, MA: CABI.

42
Khan, M. R. 2008. Plant nematodes: methodology, morphology, systematics, biology and
ecology. Science Publishers, Enfield, NH, U.S.
Kirkpatrick, T. 2017 Incidence, population density, and distribution of soybean nematodes
in Arkansas. Pp. 72-74 in J. Ross ed. University of Arkansas Research Studies 2015. University
of Arkansas Experiment Station. Fayetteville.
Koenning, S. R., and Barker, K. R. 1995. Soybean photosynthesis and yields as influences
by Heterodera glycines, soil type, and irrigation. Journal of Nematology 27:51-62.
Koenning, S. R., Overstreet, C., Noling, J. W., Donald, P. A., Becker, J. O., and Fortnum,
B.A. 1999. Survey of crop losses in response to phytoparasitic nematode in the United States for
1994. Journal of Nematology 31:587-618.
Lambert, K., and Bekal, S. 2002. Introduction to plant-parasitic nematodes. The Plant Health
Instructor [Online]. doi: 10.1094/PHI-I-2002-1218-01 (verified 26 Nov., 2018).
Lubowski, R. N., Vesterby, M., Bucholtz, S., Baez, A., and Roberts, M. J. 2002. Major uses
of land in the United States. EIB-14. U.S. Department of Agriculture-Economic Research
Service, Washington, D.C.
McWilliams, D. A., Berglund, D. R, and Endres G. J. 1999. Soybean growth and
management: Quick Guide [Online]. Available at:
http://www.bivocational.org/AGRICULTURE/Soybeans/SoybeanGrowthQuickGuide.pdf
(verified 26 Nov., 2019).
Miller, P. M. 1976. Effects of some nitrogenous materials and wetting agents on survival in
soil of lesion, stylet, and lance nematodes. Phytopathology 66:789-800.
Minton, N. A. 1986. Impact of conservation tillage on nematode population. Journal of
Nematology 18:135-140.
Mojtahedi, H., and Lownsbery, B. F. 1976. The effects of ammonia-generating fertilizer on
Criconemoides Xenoplax in Pot Cultures. Journal of Nematology 8:306-309.
Monfort, W. S., Kirkpatrick, T. L., and Mauromoustakos, A. 2008. Spread of Rotylenchulus
reniformis in Arkansas cotton field over four-year period. Journal of Nematology 40:161-166.
Moore, W. F. 1984. Soybean cyst nematode. Soybean industry resource committee,
Mississippi State University, Starkville, MS.
Natural Resource Conservation Service (NRCS), 2018. Web Soil Survey [Online]. Available
at: http//websoilsurvey.nrcs.usda.gov/app/WebSoilSurvey.aspx. (Verified 26 Nov., 2019).

43
Noel, G. R., and Wax, L. M. 2003. Population dynamics of Heterodera glycines in
conservation tillage and no-tillage soybean/corn cropping systems. Journal of Nematology
35:104-109.
Parker, M. B., Minton, N. A., Brooks, O. L., and Perry, C. E. 1975. Soybean yields and
lance nematode population as affected by subsoiling, fertility, and nematicide treatments.
Agronomy Journal 67:663-666.
Piper, C. V., and Morse. W. J. 1923. The soybean. New York: McGraw-Hill.
Qiu, L., and Chang, R. 2010. The origin and history of soybean Pp. 169-630 in G. Singh, ed.
The soybean botany, production and uses. Massachusetts: CABI.
Rich, J. R., Dunn, R. A., and Noling, J. W. 2004. Nematicides: past and present uses. Pp.
1179-1220 in Z. Chen., S. Chen, and Dick, eds. Nematology Advances and perspectives.
Wallingford, UK: CABI International.
Robbins, R. T., Riggs, R. D., and Von Steen, D. 1987. Results of annual phytoparasitic
nematode surveys of Arkansas soybean field, 1978-1986. Annals of Applied Nematology 1:50-
55.
Rodríguez-Kábana, R. 1986. Organic and inorganic nitrogen amendments to soil as
nematode suppressants. Journal of Nematology 18:129-135.
Roos, J. P. 1964. Effect of soil temperature on development of Heterodera glycines in
soybean roots. Phytopathology 54:1228-1231.
Schmutz, J., and Cannon, S. 2010. Genome sequence of the paleopolyploid soybean. Nature
463: 178-183.
Schmitt, D. P., Ferris, H., and Barker, K. R. 1987. Response of soybean to Heterodera
glycines Races 1 and 2 in different soil types. Journal of Nematology 19:240-250.
Simon, A. C. M., Lopez-Nicora H.D., Niblack, T. L., Dayton, A. E., Tomashefski, D., and
Paul P. A. 2018. Cropping practices and soil properties associated with plant-parasitic nematodes
in corn fields in Ohio. Plant Disease 102:2519-2530.
Slack, D. A., Riggs, R. D., and Hamblen, M. L. 1972. The effect of temperature and
moisture on the survival of Heterodera glycines in the absence of a host. Journal of Nematology
4:263-266.
Stinner, B. R., and Crossley, D. A. 1982. Nematodes in no-tillage agroecosystems. Pp. 14-28
in D. W. Freckman, ed. Nematodes in soil ecosystems. Austin: University of Texas Press, TX.

44
Thomas, S. H. 1978. Population densities of nematodes under seven tillage regimes. Journal
of Nematology 10:24-27.
Todd, T. C., 1996. Effects of management practices on nematode community structure in
tallgrass prairie. Applied Soil Ecology 3:235-246.
Tyler, D. D., Overton, J. R., and Chambers, A. Y. 1983. Tillage effects on soil properties,
diseases, cyst nematodes, and soybean yields. Journal of Soil and Water Conservation 38:374-
376.
Tyler, D. D., Chambers, A. Y., and Young L. D. 1987. No- tillage effects on population
dynamics of soybean cyst nematode. Agronomy Journal 79:799-802.
United States Department of Agriculture (USDA), National Resource Conservation Service
(NRCS). 2019. Conservation practices that save: crop residue management save energy, save
money [Online]. Available at:
http://www.nrcs.usda.gov/wps/portal/nrcs/detalfull/national/energy/conservation/?cid=nrcs143_0
23637 (verified 26 Nov., 2019).
United States Department of Agriculture (USDA), National Agricultural Statistics Service
(NASS). 2019. USDA reports soybean, corn acreage down [Online]. Available at:
http://www.nass.usda.gov/Newsroom/2018/06-29-2018.php (verified 26 Nov., 2019).
United States Department of Agriculture (USDA), National Agricultural Statistics Service
(NASS). 2019. Principal area planted – States and United States: 2017-2019 [Online]. Available
at:https://downloads.usda.library.cornell.edu/usdaesmis/files/j098zb09z/0k225n39n/jw827p632/a
crg0619.pdf (verified 12 Oct., 2019).
United States Department of Agriculture (USDA), National Agricultural Statistics Service
(NASS). 2019. State agriculture overview, Arkansas [Online]. Available at:
https://www.nass.usda.gov/Quick_Stats/Ag_Overview/stateOverview.php?state=ARKANSAS
(verified 26 Nov., 2019).
Wallace, H. R. 1955. The influence of soil moisture on the emergence of larvae from cysts
of the beet eelworm, Heterodera schachtii. Annals. Applied Biology 43:477-484.
Wallace, H. R. 1958a. Movement of eelworms. I. The influence of pore size and moisture
content of the soil on the migration of larvae of the eelworm, Heterodera schachtii Schmidt.
Annals. Applied Biology 46:74-85.
Wallace, H. R. 1958b. Movement of eelworms. II. A comparative study of the movement in
the soil eelworm, Heterodera schachtii Schmidt and of Ditylenchus dipsaci (Kuhn) Filipjev.
Annals. Applied Biology 46:86-94.
Wrather, J. A., and Koenning, S. R. 2006. Estimate of disease effects on soybean yields in
the United States 2003 to 2005. Journal of Nematology 38:173-180.

45
Young, L. D. 1996. Yield loss in soybean caused by Heterodera glycines. Journal of
Nematology 28:604-607.
Young, L. D., and Heatherly, L. G. 1988. Soybean cyst nematode effects on soybean growth
at controlled water potentials. Crop Science 28:543-545.

46
Table 1. Soybean harvested in USA in 2019. Adapted from National Statistics Service
(2019)
\
Rank State Area (ha)
1 Illinois 4,143,981
2 Iowa 3,654,311
3 Minnesota 2,764,003
4 North Dakota 2,367,411
5 Indiana 2,136,740
6 Missouri 2,116,506
7 Nebraska 2,003,194
8 Kansas 1,881,788
9 South Dakota 1,764,429
10 Ohio 1,879,976
11 Arkansas 1,193,822

47
Chapter 2
Nematode Population Densities as Affected by Residue and Water Management in a Long-
term Wheat-soybean Double-crop in Eastern Arkansas

48
Abstract
Soybeans (Glycine max) are one of the major row crops in the United States, particularly
in Arkansas. The soybean cyst nematode (SCN Heterodera glycines) is one of the most
damaging pests that can cause major economic losses in soybeans. Little is known concerning
the effects of tillage (conventional tillage and no tillage), water management (irrigation and non-
irrigation), residue burning (burned and non-burned), and wheat residue level (high and low) on
nematodes. Therefore, the objective of this study was to evaluate the effects of the combination
of these agronomic practices on natural nematode population densities and change over the
growing season in a long-term wheat (Triticum aestivum)-soybean rotation on a silt-loam soil in
Arkansas. Nematodes were measured in the top 10 cm in July, August, and October 2017 and
2018. Soybean cyst nematode egg concentration was 17.9 times greater (P < 0.05) at the end of
the growing season in October than earlier in growing season in July and August. The SCN J2
population densities was 3.4 times greater (P < 0.01) under the conventional tillage (CT)-burn
than under the CT no-burn and no-tillage (NT)-burn treatment combinations. In contrast to under
CT, SCN J2 population density was 3.8 times greater under the NT-no-burn than under the NT-
burn treatment combinations. The SCN J2 population densities in 2017 was 8.6 times larger (P =
0.03) among the irrigated-CT, irrigated-NT, and dryland-CT than under the dryland-NT
combination. However, in 2018, SCN J2 population density was 6.0 times greater in the
irrigated-CT than in the dryland-CT treatment combination, but also did not differ from that
under irrigated-CT-irrigated-NT, and dryland-CT in 2017.Traditional and alternative wheat-
soybean management practices can influence the nematode populations and should be carefully
considered to maximize profitability in a soybean crop.

49
Introduction
Plant-parasitic nematodes infect and damage a variety of crops (Bridge and Starr, 2007),
including soybean (Glycine max L.; Koenning et al., 1999). Different nematode species, such as
soybean cyst nematode, (SCN, Heterodera glycines), southern root-knot nematode (RKN,
Meloidogyne incognita), reniform nematodes (Rotylenchus spp), lance nematode (Hoplolaimus
sp.), Pratylenchus sp. (lesion nematode), and dagger nematode (Xiphinema sp), cause soybean
yield losses and are economically important in soybean production in the United States (U.S.;
Koenning et al., 1999; Hartman et al., 2015). However, SCN is reported to be the main yield-
limiting nematode for soybean production in the U.S. (Wrater and Koenning, 2006; Hartman et
al., 2015; Allen et al., 2017). Allen et al. (2017) reported that SCN alone caused an average yield
loss of 31%, which was greater than other pests in soybean production in the U.S. and Ontario,
Canada in 2011.
Arkansas is the eleventh largest soybean-producing state in the U.S. (USDA NASS,
2019), in which the U.S. is historically the largest soybean-producing country in the world. In
Arkansas in 2017, 84.2% of the 1.4 million ha of soybeans planted were irrigated and 15.8% of
soybean production was non-irrigated (USDA NASS, 2017). Soybeans are often grown in a
double-crop rotation with wheat (Triticum aestivum) in the Lower Mississippi River Valley
(Brye et al., 2018). The common agronomic management practices for the wheat-soybean,
double-crop production system consists of N fertilization of the wheat in the spring to optimize
wheat grain production followed by residue burning and conventional tillage after wheat harvest
with the subsequent soybean crop grown under furrow irrigation (Brye et al., 2018).
Numerous nematodes species have been identify that negatively affect soybean
production in the Lower Mississippi River Valley, which is an important area for soybean

50
production in Arkansas (Heatherly and Young, 1991). In Arkansas, RKN is the main constraint
on soybean production, while SCN has been a soybean production problem for many years, and
reniform nematode is a relatively new species that has been causing soybean damage in the last
20 to 30 years (Kirkpatrick et al., 2014). Around 30 years ago, SCN was the most prevalent
nematode in Arkansas, but more recently, RKN has surpassed SCN infestation in soybean fields
(Kirkpatrick and Sullivan, 2016). In Arkansas, of soybean fields surveyed, RKN has been
reported to infest 36%, lesion nematode 27%, SCN 15%, reniform nematode 2%, and other
nematode species 20% (Kirkpatrick and Sullivan, 2016). Allen et al. (2017) reported that in
Arkansas the southern RKN caused an estimated yield loss of 176,629 Mg in 2015 alone. In
Arkansas, nematode infestation is expanding at a rate of 0.9 to 1.2 m per year (ASPB, 2019) and,
in many cases, without showing visual symptoms of infestation (Young, 1996), while other
visual symptoms of nematode infestation are easily confused with nutrient deficiencies
(Kirkpatrick et al., 2014).
Management strategies for RKN, SCN, lesion, reniform, and other nematodes species
consist of an integrated approach that utilizes resistant cultivars, crop rotation, and the use of
nematicides (Kirkpatrick et al., 2014). The use of resistant soybean cultivars is the most
economical and effective strategy to manage nematode infestation (Kirkpatrick et al., 2014).
However, there is no resistant soybean cultivars for many races of SCN (Bridge and Starr, 2007).
Crop rotation can be an effective management practice when selecting the right resistant or non-
host soybean cultivar to be used in the cropping sequences. For example, if the SCN is in the
field, then corn, rice, peanuts can be grown in rotation because none of these crops are host for
SCN. However, if the southern root-knot nematode is the problem, peanuts or cotton should not
be planted (Kirkpatrick et al., 2014). Alternatively, nematicides, specifically seed-applied

51
nematicides have been available since 2006, but the use of seed-applied nematicides is best used
when nematode population densities are low or when matched with host-plant resistance at
greater population densities (Emerson et al., 2018).
However, changing from a monoculture to a crop rotation and/or conversion from
traditional to alternative soil and crop management practices can create an ecosystem disturbance
that requires some time for the ecosystem, including nematodes and other soil microorganisms,
to adjust to a new, stable equilibrium (Brye et al., 2018)
Several studies conducted in the U.S. have investigated on the effects of tillage, crop rotation,
and water management on nematode populations in soybean. Baird and Bernard (1984) studied
nematode population and community dynamics in soybean-wheat cropping and tillage regimes in
Tennessee and concluded that in July SCN J2 population densities were greater under
conventional tillage (CT), soybean single-crop system compared to CT wheat-soybean double
crop, CT after aerially seeded wheat, soybean no-tillage (NT) after CT wheat, and soybean NT
after aerially seeded wheat (Baird and Bernard, 1984). In irrigated soils (i.e., large water
contents) in North Carolina, nematode population densities were lower than in non-irrigated soils
(i.e., low water contents; Koenning and Barker, 1995). Brye et al. (2018) reported that in eastern
Arkansas on a Calloway silt-loam soil (fine-silty, mixed, thermic, Glossaquic Fragiudalfs) the
SCN J2 population density was four times greater under the non-burned-irrigated compared to
the burned-non-irrigated treatment combination 70 days after planting (Brye et al., 2018).
Moreover, the stunt and total nematode populations were almost three times greater under a
burn-non-irrigated-NT than under a burn-non-irrigated-CT treatment combination 34 and 70
days after planting, respectively (Brye et al., 2018). However, there is a little information
regarding the effects of the combination of tillage, irrigation, residue burning, residue level, and

52
their interactions on plant-parasitic nematodes in a double-crop, wheat-soybean rotation in the
U.S., specifically in Arkansas. Therefore, the objective of this study was to evaluate the
combined long-term effects of tillage practice [conventional tillage (CT) and no tillage (NT)],
water management (irrigation and non-irrigation), residue burning (burned and non-burned), and
wheat residue level (high and low) on plant-parasitic nematode population densities and
reproduction in the top 10 cm within the growing season and between years in soybean grown in
a double-crop production system with wheat on a silt-loam soil in eastern Arkansas. It was
hypothesis is that greater nematode (i.e., RKN, SCN, reniform, spiral, lance, stunt, dagger,
lesion, ring, and stubby-root) populations exist under CT, irrigated, high-residue-level, and non-
burned treatments compared to NT, dryland, low-residue-level, and burned treatments,
respectively.
Materials and Methods
Site Description
Experiments were conducted in spring 2017 at the University of Arkansas, Division of
Agriculture Lon Mann Cotton Branch Experiment Station near Marianna, AR, which resides in
Major Land Resource Area 134, the Southern Mississippi Valley Loess (N34O, 44’, 2.26”, W 99
O, 45’, 51.56”) (Brye et al., 2013). The study area is located on a Calloway silt-loam (fine, mixed,
thermic, Glossaquic Fragiudalfs; USDA-NRCS, 2019) soil with 16% sand, 73% silt, and 11%
clay in the top 10 cm (Brye et al., 2006) where the top 10 cm encompasses the majority of the A
horizon. The study site had been cropped to a wheat-soybean rotation since fall 2001, before
which a conventionally tilled soybean monoculture had been the cropping practice for the
previous six years (Cordell et al., 2007).

53
The climate in the region is warm and wet (Brye et al., 2018) and is classified as Humid
Subtropical, or Cfa, according to the Koppen-Geiger climate classification system (Arnfield,
2019). The 30-year (i.e., 1981-2010) average monthly air temperature is 16.6oC, with the largest
average maximum air temperature of 32.9oC in July, and the lowest average minimum air
temperature of -0.6oC in January (NOAA, 2019). The 30-year average annual precipitation is
128.4 cm (NOAA, 2019).
Treatments and Experimental Design
Beginning in spring 2002, field treatments, including wheat residue levels (high and low,
achieved with differential N fertilization), residue burning and non-burning, and tillage
[conventional tillage (CT) and no tillage (NT)], were established and soybeans were grown under
furrow-irrigated conditions until 2005 (Brye et al., 2018). The residue level, burning, and tillage
treatments were arranged in a split-strip-plot, randomized complete block (RCB) design with
three replications for a total of 48, 6-m-long by 3-m-wide field plots, where tillage was stripped
across burn treatments and the residue-level treatment was a split within tillage-burn treatment
combinations (Brye et al., 2018). In 2005, the study area was split in half, where half of the area
remained furrow-irrigated, while the other half was converted to dryland soybean production
(i.e., non-irrigated) (Brye et al., 2018). Out of necessity, irrigation treatment blocks were
superimposed on the burn treatment blocks, thus the irrigation and burn treatments cannot be
simultaneously analyzed in the original RCB design. As a result, for the purposes of this study,
following Amuri et al. (2010), a completely random design was assumed for the field treatments,
as the addition of the irrigation treatment created 16 residue-level-burn-tillage-water-
management treatment combinations that were replicated three times (Amuri et al., 2010).

54
Field Management
Beginning in November 2001, and for every fall thereafter generally between late
October and mid-November, wheat was drill-seeded with a 19-cm row spacing at a rate of 168
kg seed ha-1 (Norman et al., 2016; Brye et al., 2018). Beginning in March 2002, and for every
spring thereafter, wheat was fertilized with a split application of N as urea (46% N), with the first
application commonly occurring in early to mid-March and the split application commonly
occurring in early to mid-April (Norman et al., 2016; Brye et al., 2018). Between 2002 and 2004,
all plots were fertilized with 101 kg N ha-1 at the first application time. In the second application
time, 101 kg N ha-1 were applied to 24 plots to create the high-residue-level treatment (Amuri et
al., 2010; Brye et al., 2018). Between Spring 2005 and Spring 2018, a rate of 56 kg N ha -1 were
applied at both times, for a total N application of 112 kg ha-1, to create a high-residue-level
treatment in the same 24 plots each year, while no N fertilizer was applied to the other half of the
plots to maintain the low-residue-level treatment (Norman et al., 2016; Brye et al., 2018). To
demonstrate that different residue levels were attained and substantiate the residue-level
treatment, residue levels were measured in all 48 plots after wheat harvest each year, following
mowing wheat stubble to a height of approximately 10 cm, by cutting all surface stubble to the
soil surface and collecting all surface residue from with a 0.25-m2 metal frame from a
representative area within each plot (Brye et al., 2018).
After residue sampling, propane flaming was used to manually burn 24 plots, while the
other 24 plots were left unburned. Following imposition of the burn treatment, 24 plots were
prepared by CT, which consisted of three passes with a tandem disk to a 5- to 10-cm depth
followed by three passes with field cultivator to disperse soil clods and soften the seed bed,
whereas the other 24 plots were left without tillage (i.e., NT) prior to soybean planting. From
55
2002 to 2013, a glyphosate-resistant, maturity group 4 to 5 soybean variety was planted (Brye et
al., 2018). In 2017, Go Soy 4912LL, a Liberty-Link, maturity group 4.9, somewhat resistant to
the SCN and moderately resistant to the southern RKN soybean cultivar was planted (Go Soy,
2019). In 2018, P 5414 LLS, a Liberty-Link, maturity group 5.4, susceptible to the SCN and
moderately resistant to the southern RKN soybean cultivar was planted (Progeny, 2019). In
2017, soybeans were drill-seeded with a 19-cm row spacing on 2 June. In 2018, soybeans were
drill-seeded with a 19-cm row spacing on 9 June and replanted on 27 June due to initially low
soil moisture and poor stand establishment. The total study area was treated with Liberty-Link
herbicide program at least twice after soybean planting in 2017 and 2018 to control weeds, such
as pig weed (Amaranthus palmeri) and rye grass (Lolium perernne). The irrigated half of the
study area was watered as-needed approximately three to four times each year for the summer
soybean crop only. In general, soybeans were harvested with a plot combine between early
October and mid-November each year (Table 1), but specifically on 13 October, 2017 and on 30
October, 2018.
Soil Sample Collection, Processing, and Analyses
In May 2017 and 2018, prior to soybean planting, one soil sample per plot was manually
collected using a 4.8-cm-diameter stainless steel core chamber and a slide hammer from the top
10 cm. In addition to encompassing most of the organic matter concentration and A horizon, the
top 10 cm is also the typical zone of greater microorganism activity. Soil samples were oven-
dried at 70oC for 48 hours and weighed for bulk density determination, then crushed and sieved
through a 2-mm mesh screen for chemical analyses. Soil pH and electrical conductivity (EC)
were determined potentiometrically on a 1:2 soil mass to distilled water volume paste.

56
Subsamples were extracted with Mehlich-3 extraction solution in a 1:10 soil mass: extractant
volume ratio (Tucker, 1992) and analyzed for extractable soil nutrients concentrations (i.e., P, K,
Ca, Mg, S, Na, Fe, Mn, Zn, and Cu) by inductively coupled, argon-plasma spectrometry (CIROS
CCD model, Spectro Analytical Instruments, MA). Total carbon (TC) and nitrogen (TN)
concentrations were determined by high temperature combustion (Vario MAX Total C and N
Analyzer, Elementar Americas Inc., Mt. Laurel, NJ). Using measured TC and TN concentrations,
the soil C:N ratio was calculated. Soil organic matter (SOM) concentrations was determined by
weight-loss-on-ignition after 2 hours at 360oC. Soil contents (kg ha-1) were calculated from
measured concentrations (g kg-1) and measured bulk densities in the top 10 cm of each plot.
In both years, soil samples were collected from the top 10 cm approximately 1 and 2
months after soybean planting and near soybean harvest (i.e., on 7 July, 15 August, and 12
October 2017 and on 9 July, 10 August, and 15 October 2018). Ten soil samples were manually
collected with a 2-cm diameter push probe from within the planted soybean row in a criss-cross
pattern within each plot and combined for one sample per plot (Brye et al., 2018). Soil samples
were kept in the dark and at room temperature until being sent within three days to the Arkansas
Nematode Diagnostic Laboratory located in Hope, AR for nematode population density analysis
(Brye et al, 2018). The abundance of 10 different genera of plant-parasitic nematodes (i.e.,
soybean cyst nematode second-stage juveniles [J2], dagger, reniforn [Rotylenchulus spp.] lance
[Hoplolaimus spp.], lesion, spiral, ring [Criconemella spp.], stubby-root, stunt, and root-knot
nematode), and SCN eggs were determined for each soil sample.
Similar to procedures described by Monfort et al. (2008) and Brye et al. (2018),
nematodes were extracted from a 100 cm3 of fresh soil using a semi-automatic elutriator (Byrd et
al., 1976) and SCN cyst collected on 60-mesh sieves followed by centrifugal flotation (Jenkins,

57
1964). Nematode identification and counting were conducted under 40 to 60x magnification with
a stereoscope. Cysts of SCN that were trapped on the 60-mesh sieves of the elutriator were
collected and crushed in a glass-tissue homogenizer to free eggs that were subsequently counted
at 40x magnification (Barker, 1985). Of the 10 nematode genera that were quantified, the total
number of plant-parasitic nematodes and the number of plant-parasitic nematode genera present
per plot were also calculated for statistical analyses.
Statistical Analyses
An analysis of variance (ANOVA) was performed separately using PROC GLIMMIX in SAS
(version 9.4, SAS Institute, Inc., Cary, NC) to determine the effects of tillage (CT and NT),
irrigation (irrigated and non-irrigated), burning (burn and no burn), residue level (high and low),
and their interactions on early season soil chemical and physical properties in the top 10 cm
before soybean planting. Means were separated by least significant difference (LSD) and a
significance level (α) of 0.05 level. A separate ANOVA was conducted using PROC GLIMMIX
in SAS to evaluate the effects of residue level, burning, tillage, irrigation, date (July, August,
October) year (2017 and 2018), and their interactions on plant-parasitic nematode population
densities in the top 10 cm. If a plot had none of a particular nematode species, then the analyzed
dataset retained a zero for that plot-species combination. Means were separated by least
significant difference (LSD) and a significance level (α) of 0.05 level. Linear correlations using
Minitab (Version 16. Inc., State College, PA) were performed between soybean grain yield and
each nematode species. A separate linear correlation was conducted between soil properties and
nematode population densities were conducted in Minitab. Means were separated by LSD and a
significance level (α) of 0.05 level.

58
Results and Discussion
Initial Soil Properties
Soil physical and chemical properties contribute to soil fertility and plant growth, hence
also contribute to soil microorganism growth and behavior. Therefore, it was necessary to
establish how various soil physical and chemical properties differed among field treatment
combinations prior to the two consecutive growing seasons of nematode assessment. As was
expected, after 16 complete cropping cycles in the wheat-soybean, double-crop rotation, nearly
all measured soil properties in the top 10 cm were affected by the imposed residue and water
management practices (Table 2). Soil pH, bulk density (BD), and extractable soil K, S, and Na
contents differed (P < 0.05) among irrigation treatments (Table 2). Averaged across tillage,
burning, and residue level, soil pH and extractable soil S and Na contents were greater under
long-term irrigated (6.7 and 24.5 and 33.1 kg ha-1, respectively) than under long-term dryland
conditions (6.1 and 19.8 and 22.8 kg ha-1, respectively). However, soil BD and extractable soil K
content were greater under dryland (1.3 g cm-3 and 109 kg ha-1, respectively) than under irrigated
conditions (1.2 g cm-3 and 73.0 kg ha-1, respectively).
Soil pH and extractable soil Mg, Na, Fe, and Mn contents in the top 10 cm also differed
(P < 0.05) among tillage treatments (Table 2). Averaged across irrigation, burning, and
extractable soil Mg, Na, and Mn contents were greater under long-term CT (6.5 and 405, 29.4,
and 255 kg ha-1, respectively) than under long-term NT (6.2 and 347, 25.6, and 234 kg ha-1,
respectively). Soil pH and extractable soil Na, Mn, and Zn contents in the top 10 cm also differed
(P < 0.05) among burn treatments (Table 2). Averaged across irrigation, tillage, and residue
level, soil pH and extractable soil Mn and Zn contents were greater under long-term no-burn (6.5
and 266 and 3.4 kg ha-1, respectively) than under long-term burning (6.2 and 225 and 2.6 kg ha-1,

59
respectively), while extractable soil Na content was greater under the burn (29.9 kg ha-1) than
under the no-burn (25.2 kg ha-1) treatment. Averaged across irrigation, tillage, and burning,
extractable soil P content was greater (P = 0.01; Table 2) under the long-term low-residue (40.9
kg ha-1) than under the long-term high-residue level (36.1 kg ha-1) treatment. Norman et al.
(2016) reported that in the same plots of this study between 2001 and 2014, extractable soil P
contents increased under dryland systems until 9 years after the beginning of the new
management, but extractable soil P decreased under irrigated conditions. Greater aboveground
residue production clearly removed more P from the soil.
Though the total C and N concentrations in the top 10 cm were unaffected by any field
treatments (Table 2) after 15 complete cropping cycles and averaged 0.11% and 1.21%,
respectively, across the entire study area, the soil C:N ratio in the top 10 cm differed among
irrigation-tillage (P = 0.01) and tillage-burning-residue level (P = 0.02) treatment combinations
(Table 2). Averaged across burning and residue level, the soil C: N ratio was greater under the
irrigated-CT (11.5) than in the other three treatment combinations, which did not differ and
averaged 10.9 (Figure 1). In addition, averaged across irrigation, the soil C: N ratio was greater
under CT-burn-high-residue-level (11.3) than under the NT-no-burn-low-residue-level (10.7),
while all six other treatment combinations were intermediate and not differ (Figure 1).
Soil EC and extractable soil Mg and P contents in the top 10 cm differed (P < 0.05)
among irrigation-burn treatment combinations (Table 2). Averaged across tillage and residue
level, soil EC (Figure 1) and extractable soil Mg content (Figure 2) were greater under the
irrigated-burn (0.3 dS m-1 and 439 kg Mg ha-1, respectively) than in the dryland-burn and -no
burn treatment combinations, which did not differ and averaged 0.2 dS m-1 and 352 kg Mg ha-1,
respectively, while soil EC in the irrigated-no-burn treatment combination (0.2 dS m-1) was

60
lower than that in the irrigated-burn, but greater than that in the dryland treatments (Figure 1). In
contrast, extractable soil P content was greater in the dryland-no-burn (44.9 kg ha-1) than that in
the other three irrigation-burn treatment combinations, which did not differ and averaged 36.6 kg
ha-1 (Figure 2).
Extractable soil Fe content in the top 10 cm differed (P = 0.03) among irrigation-tillage-
burn treatment combinations (Table 2). Averaged across residue level, extractable soil Fe content
was greater under the dryland-CT-no burn (403 kg ha-1) than under all irrigation-tillage-burn
treatment combinations (Figure 2). Extractable soil Fe content under the other three dryland
treatment combinations did not differ (Figure 2). Extractable soil Fe content was also greater in
the irrigated-CT-burn (328 kg ha-1) than in the other three irrigated treatment combinations
(Figure 2).
Extractable soil Ca, Cu, and B contents and SOM concentration in the top 10 cm differed
among irrigation-tillage-burning-residue-level treatment combination (P < 0.05; Table 3).
Extractable soil Ca content was greater in the dryland-CT-no-burn-high- and low-residue-level
(1938 and 1942 kg ha-1, respectively) than in the irrigated-NT-no-burn-high-residue-level (1257
kg ha-1) treatment combination, while extractable soil Ca content under the other irrigation-
tillage-burning-residue level treatment combinations were intermediate (Table 3).
Extractable soil Cu content was greater under the dryland-NT-burn-high-residue-level
(2.1 kg ha-1) compared to the irrigated-CT-no burn-high- residue-level and irrigated-NT-burn-
high-residue-level treatment combinations, which did not differ and averaged 1.2 kg ha-1, while
extractable soil Cu contents for all other irrigation-tillage-burning-residue-level treatment
combinations were intermediate (Table 3). Extractable soil B content was greater in the irrigated-
CT-no-burn-high-residue-level (1.4 kg ha-1) than in the dryland-CT-burn-low- and the dryland-

61
NT-burn-high- and -low-residue-level treatment combinations, which did not differ and averaged
0.6 kg ha-1 (Table 3). Soil organic matter concentration results were variable and inconsistent,
but SOM concentration was numerically largest under long-term dryland-NT-no-burn
management, which did not differ between residue-level treatments, and numerically lowest
under the dryland-NT-burn-high- and irrigated-NT-burn-low-residue-level treatment
combinations, which also did not differ (Table 3). Residue level did not affect soil pH, EC, BD,
extractable soil K, Mg, S, Na, Fe, Mn, and Zn contents, or TC and TN concentrations (Table 3).
Growing-season Nematode Population Densities
Various nematode species and total nematode population densities in the soil were
affected by one or several treatments within and/or across two growing seasons after 15 (2017)
and 16 years (2015) of complete cropping cycles under a wheat-soybean, double-crop production
system on a silt-loam soil in eastern Arkansas (Table 4). Treatment effects on individual
nematode properties and nematode species will be presented. However, some nematode species
had small populations in the soil and could not be formally statistically analyzed. One possible
explanation for small nematode population densities in the soil could be that nematodes were
distributed deeper than 10 cm in soil profile. Another reason that nematodes, such as the RKN
and reniform nematode, may have not been present in the soil may have been due to the long-
term effects at the study area that might have modified the soil environment for RKN survival
and reproduction. The RKN, stubby root, and ring nematodes were present in less than 13% of
the field plots across both years and no dagger or reniform nematodes were present in the top 10
cm during the three in-season sample dates in 2017 and 2018.

62
Soybean Cyst Nematode
Eggs
As a historically significant soybean pest throughout the U.S. and particularly in
Arkansas, SCN was present in 16% and 18% of the plots as eggs and stage 2 juveniles (J2), but
neither were present at a concentration that was expected to negatively affect soybean growth or
yield. The maximum concentration of SCN J2s were 153 nematodes (100 cm3)-1 soil under the
CT-burn-low residue-level-dryland treatment combination in 2017, which did not exceed the
threshold level [500 nematodes (100 cm3)-1] for expected negative effects on soybean production
in Arkansas (Kirkpatrick et al., 2014). However, 77 and 83% of the 48 field plots had no
detectable SCN J2 concentration at any time during the soybean growing season in 2017 and
2018, respectively. Soybean cyst nematode egg population densities in the top 10 cm of soil
differed among the three in-season sampling dates (P < 0.05 Table 4) and, averaged across
sampling dates and years, differed among irrigation-tillage-burn treatment combinations (P =
0.01; Table 4). Averaged over all four field treatments and years, SCN egg concentration was
17.9 times greater at harvest than at planting and mid-season, which did not differ. This result
was not surprising given that the life cycle of the nematodes begins as the host plant starts to
grow because nematodes use plants as source of food, which permit the nematode to grow,
develop, and reproduce, thus increasing their population from the beginning to the end of the
soybean growing season. In contrast to the results of this study, Brye et al. (2018) reported that
SCN egg population densities in the top 10 cm of a Calloway silt-loam did not increase overtime
during the soybean growing season under the no burn-irrigated compared to the burn-irrigated
treatment combination.

63
Averaged over sample time within a growing season and year, SCN egg population
densities in the soil was numerically largest [2.9 nematodes (100 cm3)-1] in the CT-no-burn
combination under irrigated conditions and lowest [0.1 nematodes (100 cm3)-1] in the CT-no-
burn combination under dryland soybean production (Figure 3). Soybean cyst nematode egg
population density was at least 10.7 times greater in the CT-no-burn-irrigated than in the NT-no-
burn-irrigated and CT-no-burn, NT-burn, and NT-no-burn treatment combinations under dryland
production, which did not differ (Figure 3). However, SCN egg concentration in the CT-no-burn-
irrigated was also similar to that in the CT- and NT-burn-irrigated and CT-burn-dryland
treatment combinations (Figure 3). Under dryland production, SCN egg population density was
unaffected by tillage or burn field treatments (Figure 3). Furthermore, under the dryland soybean
production, SCN egg population density was unaffected by tillage or burn treatments (Figure 3).
The greater concentration of SCN eggs under CT in irrigated conditions may have resulted from
nematode spread along the field as a result of tillage operations, as the tillage treatment was
imposed as a continuous strip across the study area, which was facilitated by periodic water flow
from furrow irrigation. These results are consistent with a soybean study conducted in Tennessee
on a Lexington silt loam (fine-silty, mixed, active, thermic Ultic Hapludalfs) where it was
reported that the SCN population density was lower under NT compared to other tilled systems,
such as disked, chiseled, sub-soiled under rows, and sub-soiled between rows (Tyler et al., 1983).
Moreover, Hershman and Bachi (1995) reported that, in a wheat-soybean, double-crop study
conducted from 1990 to 1992 in Kentucky on a Crider silt loam (fine-silty, mixed, active, mesic
Typic Paleudalfs) and on a Pembroke silt loam soil (fine-silty, mixed, active, mesic Mollic
Paleudalfs), SCN egg population density was numerically larger under minimum-tillage than no-
tillage at soybean planting, but the results were the opposite at harvest in 1992. Bao et al. (2011)

64
also reported that in the same area of this study, SCN eggs population densities was greater
under the continued CT soils compared to the NT soils because soil disturbance decreased fungi
species that parasite SCN J2s.
One possible reason for greater SCN eggs under irrigation may have been due to greater
soil moisture content under irrigated than dryland production (Table 15), which may have
provided a more conducive environment for SCN survival, migration, feeding, development, and
reproduction. In contrast to the results of this study, Koenning and Barker (1995) reported
greater SCN egg and J2 population densities under dryland than irrigated soybean production in
six different soils (Cecil sandy clay, Cecil sandy clay loam, Fuquay sand, Muck, Norfolk sandy
loam, and Portsmouth loamy sand) in North Carolina.
Juveniles
Soybean cyst nematode J2 population densities differed among tillage-burn (P < 0.01;
Table 4) and year-irrigation-tillage (P = 0.03; Table 4) treatment combinations. Averaged across
residue levels, irrigation, sample dates within the growing season, and years, SCN J2 population
density [1.1 nematodes (100 cm3)-1] was 3.4 times greater under the CT-burn than under the CT
no-burn and NT-burn treatment combinations, which did not differ and averaged 0.49 nematodes
(100 cm3)-1 (Figure 4). In contrast to under CT, SCN J2 population density was 3.8 times greater
under the NT-no-burn than under the NT-burn treatment combinations (Figure 4).
Residue burning effects on nematodes have been rarely been studied in the field, which
makes this field study unique. Burning in combination with CT affects the amount of crop
residue left on the soil surface, leading also to changes in soil organic matter and soil moisture
content. One plausible explanation for greater SCN J2 population densities under the CT-burn

65
than under the CT-no burn combination may be due to the numerically lower SOM concentration
in the CT-burn combination (Table 5), which could have resulted in less organic substrate for
biological control agents or soil-suppressant organisms that prey on parasite nematodes. In
addition, Norman et al. (2016) reported that in the same plots of this study, SOM content
decreased at a rate of -0.02 kg m-2 yr-1 under burned treatment and increased at a rate of 0.02 kg
m-2 yr-1 under no- burn treatment. However, the greater SCN J2 population density under the
NT-no burn than under the NT-burn treatment combination could be because of greater soil
moisture content (Table 15).
Averaged across residue levels, burn, and sample date within the growing season, SCN J2
population in 2017 was 8.6 times larger among the irrigated-CT, irrigated-NT, and dryland-CT
combinations, which did not differ and averaged 1.8 nematodes (100 cm3)-1, than under the
dryland-NT combination (Figure 5). However, in 2018, SCN J2 population density was 6.0 times
larger in the irrigated-CT than in the dryland-CT treatment combination, but also did not differ
from that under irrigated-CT, irrigated-NT, and dryland-CT in 2017 (Figure 5). Furthermore,
SCN J2 was unaffected by tillage under irrigated conditions in 2017 and 2018 and under dryland
production in 2017 (Figure 5). Treatment effects on SCN J2 population densities differed
between years, where SCN J2 population density was generally greater in 2017 than in 2018.
The greater SCN J2 population densities in 2017 may be explained because the 2017 growing
season was cooler (soil temperature 26.5oC at 50 cm deep) with more rainfall (89.5 cm)
compared to the 2018 growing season, which was slightly warmer (soil temperature 27.4oC at 50
cm deep) and somewhat dryer (61.67 cm), respectively (Table 13). The SCN J2 population
densities may have been more affected by soil moisture than soil temperature due to the soil

66
temperature variation, 15 to 32oC (Moore, 1984), being within the optimal range for nematode
development.
Various studies on the influence of cropping practices on nematodes soil abundance
(Brye et al., 2018; Bao et al., 2011; Heatherly et al., 1992; Baird and Bernard, 1984) have
reported variability in the presence and population density of SCN J2 among different cropping
practices. Results of this field study also showed that different irrigation, tillage, residue level,
and residue burning combinations resulted in different SCN J2 population densities, indicating
the potentially complex response nematodes have to agricultural management.
Lance Nematode
Lance nematode was present in 22% of the samples analyzed in 2017 and 2018. Lance
nematode population densities differed among irrigation-tillage treatment combinations ( =
0.03; Table 4). Averaged over burn, residue level, sample date within the growing season, and
year, lance nematode population density was 5.0 and 17.4 times greater under dryland production
[1.7 nematodes (100 cm3)-1], which was unaffected by tillage treatment, than under the irrigated-
CT and irrigated-NT treatment combinations, respectively (Figure 6). Lance nematode
population density under the irrigated-CT was also 3.5 times greater than that under the irrigated-
NT treatment combination (Figure 6).
Hartman et al. (2015) and Koenning et al. (1999) reported that the lance nematode can
causes soybean yield losses in the U.S. In addition, Robbins et al. (1987) reported that lance
nematode has infested soybean fields in Arkansas in the past. After 16 and 17 years of
continuous and consistent management, results showed that lance nematode population densities
in the top 10 cm were favored by dryland production conditions, which differed from the original

67
hypothesis that nematode abundance, in general, would be greater under irrigated conditions. In
the same plots as used in this study, Brye et al. (2018) reported that lance nematode was greater
under the burn-non-irrigated-NT than under the burn-non-irrigated-CT treatment combination
after 15 years of consistent management.
Lesion Nematode
Lesion nematode was present in 11% of the soil samples analyzed in 2017 and 2018.
Lesion nematode population densities differed between tillage treatments (P = 0.02; Table 4) and
among irrigation-burn treatment combinations (P = 0.02; Table 4). Averaged across burn,
residue level, irrigation, sample date within growing seasons, and year, lesion nematode
population density was 2.5 times greater under NT [0.3 nematodes (100 cm3)-1] than under CT
[0.12 nematodes (100 cm3)-1]. Kirkpatrick et al. (2014) reported that lesion nematode causes
soybean yield loses in the Arkansas, However, Hartman et al. (2015) reported that lesion
nematode has not been well-studied yet in the U.S. Lesion is an endoparasitic nematode, thus
total concentration of lesion could have been greater, but we did not measure nematode on plant
tissues. One possible explanation may be due to the NT might have caused greater vertical
distribution in the soil rather than horizontal distribution as caused by CT management. In
contrast to this study, in Indiana on a silt-loam soil, densities of lesion nematode in a soybean
crop were greater under CT than in under zero-tillage, which was attributed to the larger and
more robust soybean roots under CT (Alby et al., 1983). However, in the same soil, the
population of lesion nematode was more uniformly spatially distributed in non-tilled than in
tilled soybean plots (Alby et al., 1983). Averaged across tillage, residue level, sample date within
growing seasons, and year, lesion nematode population density was 5.6 times greater under the

68
dryland-burn than under the dryland-no-burn treatment combination but was unaffected by
burning under irrigated conditions (Figure 7). The dryland-burning treatment combined might
have played a role in decreasing SOM (Table 2) and soil-suppressive microorganisms in the soil,
resulting in less efficient biological control and increasing the population of the lesion nematode.
Lesion nematode population density under irrigated conditions was also similar to both burning
and non-burning under dryland production (Figure 7). Kirkpatrick (2017) reported that the lesion
nematode tested positive in 20% of soybean fields grow in Arkansas in 2015. For this reason,
management practices should be considered to keep the lesion nematode below the threshold
damage-causing level and to avoid spreading the lesion nematode into more farmland area.
Spiral Nematode
Spiral nematode was present in 38% of the soil samples analyzed in 2017 and 2018.
Spiral nematode population densities differed among year-irrigation-tillage (P < 0.01; Table 4),
year-irrigation-residue level (P < 0.05; Table 4), and irrigation-tillage-burn-residue level (P =
0.02; Table 4). Similar to the effect on SCN J2, averaged across burn, residue level, and sample
date within the growing season, spiral nematode was 52.6 times greater under irrigated-CT
[31.84 nematodes (100 cm3)-1] than under the irrigated-NT, dryland-CT, and dryland-NT
treatment combinations in 2017, all of which averaged had less than 0.6 nematodes (100 cm3)-1
(Figure 8). However, spiral nematode population density was similar among the irrigated-CT,
irrigated-NT, and dryland-CT treatment combinations in 2018, which also was similar to that in
the irrigated-CT treatment combination in 2017, and was at least 8.1 times greater than under the
dryland-NT treatment combination in 2018 (Figure 8). Allen et al. (2017) reported that spiral
nematode caused soybean yield losses in the southern U.S. from 2010 to 2014. Likewise,

69
irrigation in combination with CT treatment may have caused greater spiral nematode population
densities in the soil during the soybean growing season, while irrigated-NT and dryland-tillage
treatment combinations did not provide a favorable soil environment for nematode survival and
reproduction in 2017. In contrast, spiral nematode appears to have been affected by the same
environmental conditions (Table 13) as the SCN J2 in 2018.
Averaged across tillage, burn, and sample date within the growing season, spiral
nematode population density was unaffected by residue level under irrigated conditions in 2017
and was at least 20.7 times greater than under the high- and low-residue-level-dryland treatment
combinations, in which that under the high-residue level was 7.2 times greater than under the
low-residue level (Figure 9). Similar to 2017, spiral nematode population density was unaffected
by residue level under irrigated conditions in 2018 and was similar to that under irrigated
conditions in 2017. Spiral nematode population density in 2018 under the dryland-high-residue-
level was also similar to that under irrigated conditions in 2017 and 2018. Spiral nematode
population density was also 5.7 times greater under the irrigated-high- than under the dryland-
low-residue-level treatment combination in 2018 (Figure 9). The dryland-low-residue-level
treatment combination in 2017 had the lowest spiral nematode population densities among all
other irrigation-residue-level treatment combinations (Figure 9). Similar to the previous
nematode species, the irrigation (irrigated and dryland) treatment appeared to have a major
influence on nematode population densities in the soil. The lowest spiral nematode population
densities in the soil under dryland-low residue level in 2017 may have been due to lower soil
moisture contents in the dryland compared to the irrigated soybean production (Table 15) which
may have hindered spiral nematode development. To the best of our knowledge, no previous

70
studies have attempted to determine the effects of agricultural practices on spiral nematode
population densities.
Averaged across sample date within the growing season and year, spiral nematode
population density was numerically largest [24.6 nematodes (100 cm3)-1] under the irrigation-
CT-no-burn-low-residue-level and smallest under the dryland-NT-no-burn-low-residue-level
[0.11 nematodes (100 cm3)-1] treatment combinations (Table 5). Under irrigated conditions,
spiral nematode population density was lowest under the irrigated-NT-no-burn-high-residue-
level [0.8 nematodes (100 cm3)-1] than under all seven other irrigation-tillage-burn-residue-level
treatment combinations, which did not differ and were also similar to that under the dryland-CT-
burn-high-residue-level treatment combination (Table 5). However, under dryland conditions,
spiral nematode population density did not exceed 1.5 nematodes (100 cm3)-1 in all seven tillage-
burn-residue-level treatment combinations, except for in the dryland-CT-burn-high-residue-level
treatment combination (Table 5). The numerically larger spiral nematode population densities in
the soil occurred under the irrigated-CT-no burn-high and –low-residue level compared to the
dryland-NT-no burn- low-residue-level. Results suggested once again that irrigation favors
nematode development in the soil and dryland does not. In addition, results support that CT
favors nematode spread compared to NT and the no-burn-low-residue treatment combination did
not have a consistent effect on spiral nematode. In contrast to the effects of burning in this study,
a study in a prairie on an Irwin silty-clay-loam soil (fine, mixed, superactive, mesic Pachic
Argiustolls) with big bluestem (Andropogon gerardii), Indian grass (Sorghastrum nutans), and
switchgrass (Panum virgatum) as the prevalent vegetation, in which annual burning and non-
burning treatments were applied, reported that spiral nematode populations at the 20-cm soil

71
depth were 137% greater under the annually burned compared to the unburned treatment after
nine years of management (Todd, 1996).
Stunt Nematode
Stunt nematode was present in 68% of soil samples analyzed in 2017 and 2018.
Compared to the other individual nematode species, stunt nematode population density was
affected by numerous complex treatment interactions. Stunt nematode population densities
differed among year-irrigation-tillage-burn (P = 0.02), year-irrigation-tillage-residue level (P =
0.01), year-irrigation-burn-residue level (P < 0.01), and irrigation-tillage-burn-residue level (P <
0.01) treatment combinations (Table 4). Averaged across residue level and sample date within
the growing season, stunt nematode population density was numerically greatest in the irrigated-
NT-burn treatment combination in 2017 and smallest in the irrigated-NT-no-burn treatment
combination in 2018 (Table 6). Stunt nematode population density was at least seven times
larger in 2017 under the irrigated- and dryland-NT-burn treatment combinations, which did not
differ, than all irrigation-tillage-burn treatment combinations in 2018 and the irrigated- and
dryland-CT-no-burn treatment combinations in 2017 (Table 6). With the exception of the tillage-
burn combinations under irrigated conditions in 2018, stunt nematode population density was
numerically greater under burning than non-burning in all other irrigation-tillage-burn treatment
combinations in 2017 and 2018 (Table 6).
Handoo et al. (2014) reported that stunt nematode is known to cause damage to several
crops. The largest stunt nematode population densities under the irrigated-NT-burn treatment
combination in 2017 may have been influenced by greater soil moisture (Table 13), vertical
nematode distribution in the soil as a result of no soil disturbance (NT), and lower concentrations

72
of soil suppressants because of the lower organic matter as a result of burning (Table 15).
However, the lowest stunt nematode population density may have been because, under the
irrigated-NT-no burn treatment combination, soil-suppressant microorganisms had effective
control over the stunt nematode.
Averaged across burn and sample date within the growing season, stunt nematode
population density was numerically greatest in the dryland-NT-high-residue-level treatment
combination in 2017 and smallest in the irrigated-NT-low-residue-level treatment combination in
2018 (Table 7). Results were generally variable and inconsistent. Residue level did not affect
stunt nematode population densities within the irrigated-CT and dryland-NT combinations in
2017 or within irrigated- and dryland-CT combinations in 2018. In contrast, stunt nematode
population density was greater in the high- than in the low-residue level within the dryland-CT
combination in 2017 and within the irrigated-NT combinations in 2018, while stunt nematode
population density was greater in the low- than in the high-residue level in the irrigated-NT
combination in 2017 and the dryland-NT combination in 2018 (Table 7). One plausible
explanation for the greatest nematode population density under the dryland-NT-high-residue-
level treatment combination in 2017 and smallest population densities in the irrigated-NT-low-
residue-level treatment combination in 2018 may have been because of more favorable weather
conditions in 2017 during the soybean growing season (Table 14). In contrast to the hypothesis,
dryland favored stunt nematode population densities in combination with NT-high residue level,
which may be explained by the vertical distribution of the nematode in the soil caused by the NT.
Averaged across tillage and sample date within the growing season, stunt nematode
population density was numerically greatest in the dryland-burn-high-residue-level treatment
combination in 2017 and smallest in the irrigated-no-burn-high-residue-level treatment
73
combination in 2017 (Table 8). Results were also generally variable and inconsistent. Similar to
previously, residue level did not affect stunt nematode population densities in six of the eight
year-irrigation-burn combinations, while stunt nematode population density was greater in the
low- than in the high-residue level in the irrigated-no-burn combination in 2017 and in the
dryland-no-burn combination in 2018 (Table 8). Results suggest that the effect of burning
favored stunt nematode population densities in 2017, indicating that the burn treatment may have
decreased the population densities of biological control organisms that preyed on or parasitized
stunt nematodes. In addition, the warmer and moist weather conditions in 2017 compared to the
weather in 2018 may have favored stunt nematode population densities (Table 14).
Similar to the effect on spiral nematode, averaged across sample date within the growing
season and year, stunt nematode population densities also differed among field treatment
combinations only, without differences over time. Stunt nematode population density was
numerically greatest in the dryland-NT-burn-high-residue-level treatment combination and
smallest in the irrigated-NT-no-burn-low-residue-level treatment combination (Table 9). Results
were also generally variable and inconsistent. Stunt nematode population density was unaffected
by residue level in five of the eight irrigation-tillage-burn treatment combinations, while stunt
nematode population density was greater under the low- than the high-residue level in the
irrigated-CT-no-burn and dryland-NT-no-burn treatment combinations, but was greater under the
high- than under the low-residue level in the dryland-CT-no-burn treatment combination (Table
9). Stunt nematode population density was numerically larger in 2017 compared to the 2018,
which suggested that stunt nematode population was favored by cooler temperatures and more
rainfall rather than the warmer and dryer weather conditions as was reported for the SCN J2 and
spiral nematode (Table 14). One previous study conducted in the same plots as used for the

74
current research reported that stunt nematode populations were almost three times greater under
the burn-non-irrigated-NT than under the burn-non-irrigated-CT treatment combination 34 and
70 days after planting, respectively (Brye et al., 2018). Since field treatment effects on stunt
nematode population densities were inconsistent, thus further research is needed to determine the
effects of irrigation-tillage-burning treatment combinations on various nematode species, include
stunt nematode.
Total Nematode Concentration
Summing across all individual nematodes evaluated, total nematode population densities
differed among year-irrigation (P = 0.03), irrigation-tillage-burn (P = 0.02), and year-tillage-
burn-date (P = 0.04) treatment combinations (Table 4). Averaged across tillage, burn, residue
level, and sample date within the growing season, within each year separately, total nematode
population densities were unaffected by irrigation treatment, but was 2.3 times greater under
dryland production in 2017 than under dryland production in 2018, while that under irrigated
conditions was intermediate and did not differ across both years, averaging 119.5 nematodes
(100 cm3)-1 (Figure 10). A possible explanation for the greater total nematode population
densities under dryland in 2017 than under the same treatment in 2018 may have been related to
weather differences, where the 2017 growing season was cooler and more rainfall than that in
2018, which was slightly warmer and drier (Table 14).
Similar to the effect on SCN eggs, averaged across residue level, sample date within the
growing season, and year, total nematode population densities numerically greatest in the
irrigated-NT-burn and smallest in the irrigated-NT-no-burn treatment combination (Figure 9).
Total nematode population densities were 1.9 times greater under the CT-burn, CT-no burn, and

75
NT-burn, which did not differ and averaged 141.5 nematodes (100 cm3)-1 than under the NT-no
burn treatment combination under irrigated conditions, while that under the NT-burn was 1.6
times greater than under the CT-no burn treatment combination under dryland soybean
production (Figure 9). In addition, total nematode population densities were unaffected by
residue burning under both irrigation treatments under CT and under dryland production under
NT (Figure 9). The greater total nematode abundance under irrigated-NT-burn compared to the
irrigated-NT-no-burn treatment combination supports the idea that the burn treatment has a
negative effect on soil-suppressive microorganisms. A study in France, a 14-year-long study on a
silt-loam-textured Luvisol in which winter wheat was planted each year concluded that the total
nematode population increased by a factor of seven under long-term NT systems (Henneron et
al., 2015).
Averaged across irrigation and residue level, total nematode population densities were
numerically greatest in the NT-burn combination early in the growing in July in 2017 and
smallest in the NT-burn combination early in the growing season in July in 2018 (Table 10).
Total nematode population densities were greater in July and August in the NT-burn
combination in 2017, which did not differ and averaged 408.1 nematodes (100 cm3)-1, than in all
other year-tillage-burn-sample date combinations (Table 10). Total nematode population
densities in the soil decreased from July to October under CT in both residue burning treatments
and under NT in the burn treatment in 2017 (Table 10). However, similar to SCN eggs, total
nematode population densities increased from July to October under the same treatment
combinations in 2018 (Table 10). Similar to previous nematode species, the greater total
nematode population densities in 2017 may be explained by the different weather conditions
between 2017 and 2018 (Table 14). The total nematode increment from the beginning to the end

76
of the growing season in 2018 was likely due to food availability. However, the decreased total
nematode population densities from July to October in 2017 was likely due to less favorable soil
environmental conditions (i.e., soil moisture and temperature) for reproduction and survival.
Correlations Among Nematodes and Soybean Yield
After 16 (2017) and 17 years (2018) of complete cropping cycles in a wheat-soybean,
double-crop production system under several agronomic practices of water management and
residue level, soybean grain yield ranged from a minimum of 1609 kg ha-1 in irrigated-NT-burn-
high residue level treatment combination to a maximum of 3397 kg ha-1 in dryland-CT-burn-high
residue level what treatment combination in 2017. In 2018, soybean grain yield ranged from a
minimum of 1565 kg ha-1 in dryland-NT-no burn-high residue level treatment combination to a
maximum of 3293 kg ha-1 in irrigated-CT-burn-low residue level treatment combination.
Averaged across all field treatments, the mean soybean yield was 2765 and 2581 kg ha-1 in 2017
and 2018, respectively. These results are consistent with the long-term study conducted in the
same plots and under the same management as the current study, which showed that soybean
yield started to decrease 9 years after crop management conversion under irrigated soybean
production, but soybean yields slightly increased under dryland production by 11 years after
management practice conversion (Norman et al., 2016). In addition, a recent study conducted in
the same plots as the current study reported that soybean yield was numerically greater under
burn-dryland-high-residue-level compared to the burn-dryland-low-residue-level treatment
combination (Brye et al., 2018).
Since crop yield variability is known to be affected by soil physical and chemical
properties, plant pests, and diseases, it was expected that soybean yield variations were related to

77
at least some nematode properties. However, combined across years, nematode species (i.e.,
SCN eggs and J2, lance, lesion, spiral, stunt, and total population densities and number of
species) from early in the growing season (July), mid-season (August), or end of the season
(October) were generally unrelated with soybean yield, with two exceptions (Table 11). Soybean
yield was moderately negatively correlated (r = -0.36; P = 0.05; Table 11) with mid-season spiral
nematode population densities indicating that the increase in spiral nematode population
densities resulted in a decrease in soybean yield. In addition, soybean yield was weakly
positively correlated (r = 0.26; P = 0.03; Table 11) with Stunt nematode population densities.
The lack of correlation among nematode species at any of the three points in the growing season
and soybean yield was likely due to the overall low nematode population densities throughout
the entire study area in 2017 and 2018. Furthermore, no nematode assessed in this study reached
above the critical threshold levels for soybean production in Arkansas to warrant concern that
nematodes were a management problem in the study area (Kirkpatrick et al., 2014).
In contrast to the few correlations between soybean yield and nematode properties,
numerous significant correlations existed between nematode species and early season soil
properties in the top 10 cm. Soybean cyst nematode egg population density in August and
October was negatively correlated with soil Ca (r = -0.92;) and total soil C (r = -0.37),
respectively (Table 12). However, SCN egg population density in October was positively
correlated with soil P (r = 0.42), Fe (r = 0.44), and Zn (r = 0.94; Table 12). Soybean cyst J2
population density in July was negatively correlated with soil pH (r = -0.66) and that from
October was positively correlated with soil P (r = 0.51; Table 12). Lance nematode population
density in July was negatively correlated with clay content (r = -0.74), while that from August
was negatively correlated with soil pH (r = -0.87) and that from October was negatively

78
correlated with sand content (r = -0.35) and soil Na (r = -0.36; Table 12). However, lance
nematode population density in July was positively correlated with silt content (r = 0.60), while
that from August was positively correlated with soil BD (r = 0.72), soil Ca (r = 0.73), and SOM
(r = 0.72) and that from October was positively correlated with soil K (r = 0.36) and soil Ca (r =
0.42; Table 12). Lesion nematode population density in August was negatively correlated with
silt content (r = -0.95), soil S (r = -0.98), and soil Mn (r = -0.96), while that from October was
negatively correlated with soil K (r = -0.45) and soil Cu (r = -0.48; Table 12). However, lesion
nematode population density in July was positively correlated with soil Zn (r = 0.85), while that
from August was positively correlated with soil Ca (r = 0.98) and that from October was
positively correlated with total C (r = 0.72) and SOM (r = 0.467; Table 12). Spiral nematode
population density in October was negatively correlated with soil S (r = -0.31), soil Zn (r = -
0.49), and the C:N ratio (r = -0.35; Table 13). However, spiral nematode population density in
July was positively correlated with silt content (r = 0.35) and soil Zn (r = 0.41), while that from
August was positively correlated with soil Ca (r = 0.36), soil S (r = 0.45), and soil Na (r = 0.41)
and that from October was positively correlated with soil pH (r = 0.35; Table 13). Stunt
nematode population density in July was negatively correlated with silt content (r = -0.34), soil
pH (r = -0.40), soil Mg (r = -0.26), and SOM (r = -0.27), while that from August was also
negatively correlated with silt content (r = -0.40), soil pH (r = -0.31), and soil Mn (r = -0.29) and
that from October was also negatively correlated with soil Mn (r = -0.30; Table 13). However,
stunt nematode population density in July was positively correlated with soil S (r = 0.43), soil Fe
(r = 0.37), and soil Cu (r = 0.29), while that from August was positively correlated with soil EC
(r = 0.26) and also soil S (r = 0.31; Table 13). Total nematode population density in July was
negatively correlated with silt content (r = -0.28), soil pH (r = -0.27), and SOM (r = -0.24), while

79
that from August was also negatively correlated with silt content (r = -0.32), soil pH (r = -0.23),
soil Mn (r = -0.27), and SOM (r = -0.23) and that from October was negatively correlated with
soil EC (r = -0.26), soil P (r = -0.25), soil S (r = -0.31), soil Fe (r = -0.28), and soil Zn (r = -0.47;
Table 13). However, total nematode population density in July was positively correlated with
soil EC (r = 0.28), soil S (r = 0.38), and soil Fe (r = 0.40), while that from August was also
positively correlated with soil EC (r = 0.32), soil S (r = 0.34), and soil Fe (r = 0.27) and that
from October was positively correlated with soil Ca (r = 0.21) and soil Mg (r = 0.39; Table 13).
Total nematode species present in the top 10 cm in July was negatively correlated with the soil
C:N ratio (r = -0.24), while that from August was also negatively correlated with soil BD (r = -
0.22), soil K (r = -0.23), and soil Ca (r = -0.28) and that from October was negatively correlated
with soil EC (r = -0.32), soil P (r = -0.25), soil S (r = -0.22), soil Mn (r = -0.23), and soil Zn (r =
-0.35; Table 13). However, total nematode species present in the top 10 cm in July was
positively correlated with soil pH (r = 0.22), soil EC (r = 0.31), soil Na (r = 0.32), and soil B (r =
0.28), while that from August was also positively correlated with soil EC (r = 0.28) and soil P (r
= 0.22; Table 13).

80
Conclusions
Through assessing the natural nematode population densities in the soil on a wheat-
soybean double-crop, this research has provided valuable understanding into the complexity of
the effects of water and residue management on plant-parasitic nematodes. The objective of this
investigation was to evaluate the combined long-term effects of tillage practice (conventional
tillage and no-tillage), water management (irrigation and non-irrigation), residue burning (burned
and non-burned), and wheat residue level (high and low) on the natural nematode population
densities and reproduction in the top 10 cm within the growing season and between years
soybean in a double-crop production system on a silt-loam soil in eastern Arkansas.
Wheat-soybean crop management affected nematode populations. The majority of nematodes
studied were affected by at least one treatment or the interaction of two or more. Similar to what
was hypothesized, nematodes population was generally greater under irrigation, CT, burn
compared to dryland, NT, and nom-burn treatment, respectively. However, different treatment
combinations did not have the same effect in all nematode species. Nematode management has
to be tailored to species and agricultural practices for the best results.

81
Acknowledgements
The author would like to thank the Arkansas Soybean Promotion Board for partially
financing this study. Ryder Anderson, Rebeca Anderson, Niyi Omidire, and Shelby Lebeau for
providing field and laboratory assistance and the University of Arkansas System Division of
Agriculture for supporting this research are gratefully acknowledged. The Andes Association of
Cajamarca and Fulbright Peru for financing my master studies.

82
Table 1. Summary of typical management practices and their schedule (2017 and 2018) in the
wheat-soybean double-crop production system at the Lon Mann Cotton Branch Experiment
Station near Marianna, AR
Agronomic activity Approximate timing of activity
Wheat planting Early November
Nitrogen fertilization of wheat First application Early March
Split application Early April
Wheat harvest Early June
Residue burning Early June
Conventional tillage Early June
Soybean first planting Early June
Soybean second planting Early June
Irrigation Soybean harvest Late October
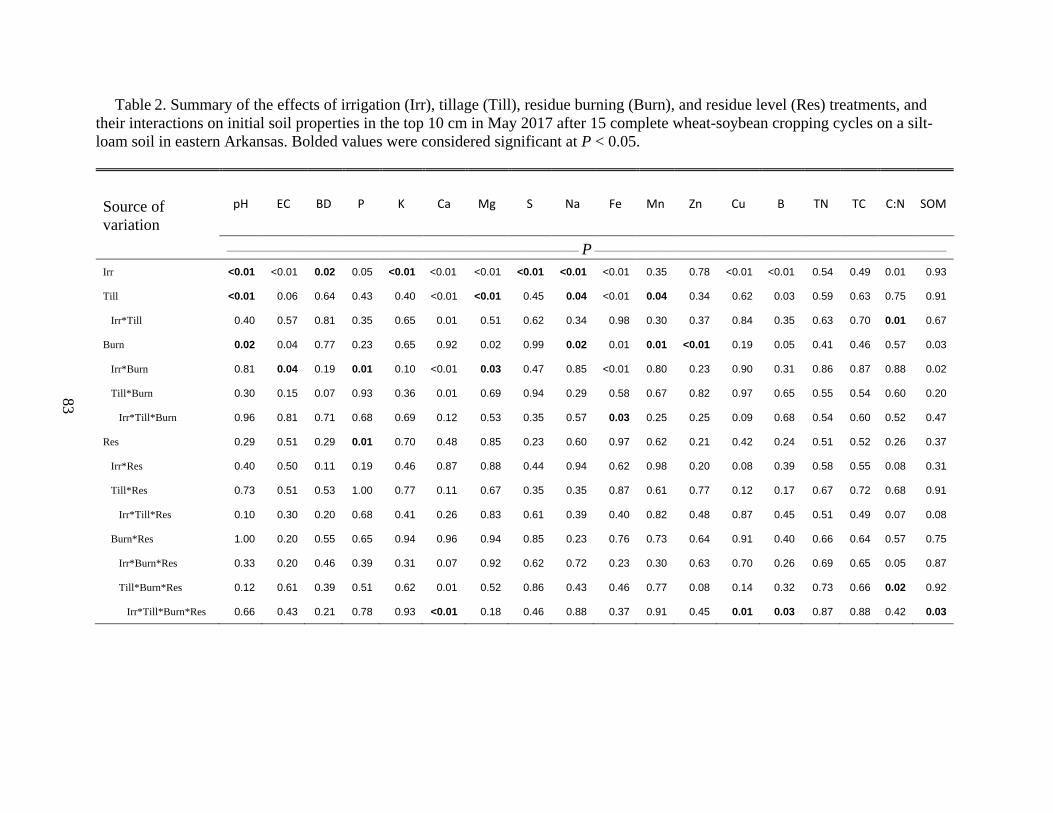
83
Table 2. Summary of the effects of irrigation (Irr), tillage (Till), residue burning (Burn), and residue level (Res) treatments, and
their interactions on initial soil properties in the top 10 cm in May 2017 after 15 complete wheat-soybean cropping cycles on a silt-
loam soil in eastern Arkansas. Bolded values were considered significant at P < 0.05.
Source of
variation
pH EC BD P K Ca Mg S Na Fe Mn Zn Cu B TN TC C:N SOM
__________________________________________________________________________________________________________ P __________________________________________________________________________________________________________
Irr <0.01 <0.01 0.02 0.05 <0.01 <0.01 <0.01 <0.01 <0.01 <0.01 0.35 0.78 <0.01 <0.01 0.54 0.49 0.01 0.93
Till <0.01 0.06 0.64 0.43 0.40 <0.01 <0.01 0.45 0.04 <0.01 0.04 0.34 0.62 0.03 0.59 0.63 0.75 0.91
Irr*Till 0.40 0.57 0.81 0.35 0.65 0.01 0.51 0.62 0.34 0.98 0.30 0.37 0.84 0.35 0.63 0.70 0.01 0.67
Burn 0.02 0.04 0.77 0.23 0.65 0.92 0.02 0.99 0.02 0.01 0.01 <0.01 0.19 0.05 0.41 0.46 0.57 0.03
Irr*Burn 0.81 0.04 0.19 0.01 0.10 <0.01 0.03 0.47 0.85 <0.01 0.80 0.23 0.90 0.31 0.86 0.87 0.88 0.02
Till*Burn 0.30 0.15 0.07 0.93 0.36 0.01 0.69 0.94 0.29 0.58 0.67 0.82 0.97 0.65 0.55 0.54 0.60 0.20
Irr*Till*Burn 0.96 0.81 0.71 0.68 0.69 0.12 0.53 0.35 0.57 0.03 0.25 0.25 0.09 0.68 0.54 0.60 0.52 0.47
Res 0.29 0.51 0.29 0.01 0.70 0.48 0.85 0.23 0.60 0.97 0.62 0.21 0.42 0.24 0.51 0.52 0.26 0.37
Irr*Res 0.40 0.50 0.11 0.19 0.46 0.87 0.88 0.44 0.94 0.62 0.98 0.20 0.08 0.39 0.58 0.55 0.08 0.31
Till*Res 0.73 0.51 0.53 1.00 0.77 0.11 0.67 0.35 0.35 0.87 0.61 0.77 0.12 0.17 0.67 0.72 0.68 0.91
Irr*Till*Res 0.10 0.30 0.20 0.68 0.41 0.26 0.83 0.61 0.39 0.40 0.82 0.48 0.87 0.45 0.51 0.49 0.07 0.08
Burn*Res 1.00 0.20 0.55 0.65 0.94 0.96 0.94 0.85 0.23 0.76 0.73 0.64 0.91 0.40 0.66 0.64 0.57 0.75
Irr*Burn*Res 0.33 0.20 0.46 0.39 0.31 0.07 0.92 0.62 0.72 0.23 0.30 0.63 0.70 0.26 0.69 0.65 0.05 0.87
Till*Burn*Res 0.12 0.61 0.39 0.51 0.62 0.01 0.52 0.86 0.43 0.46 0.77 0.08 0.14 0.32 0.73 0.66 0.02 0.92
Irr*Till*Burn*Res 0.66 0.43 0.21 0.78 0.93 <0.01 0.18 0.46 0.88 0.37 0.91 0.45 0.01 0.03 0.87 0.88 0.42 0.03

84
Table 3. Extractable soil calcium (Ca), copper (Cu), and boron (B) content and soil organic
matter (SOM) concentration differences among irrigation (irrigated and dryland)-tillage
[conventional tillage (CT) and no-tillage (NT)]-burning (burn and no burn)-residue level (high
and low) treatment combinations after 15 cropping cycles in a long-term wheat-soybean, double-
crop production system on a silt-loam soil in eastern Arkansas.
Irrigation Tillage Burning Residue
level
Ca Cu B SOM
(kg ha-1) (kg ha-1) (kg ha-1) (%)
Irrigated CT Burn High 1727 ca 1.5 bc a 1.3 ab a 2.3 abcd a
Low 1805 b 1.5 bc 1.3 ab 2.5 a
No burn High 1572 de 1.2 c 1.4 a 2.4 abcd
Low 1463 fg 1.8 ab 1.3 ab 2.1 abcd
NT Burn High 1699 c 1.2 c 1.3 ab 2.5 abc
Low 1603 d 1.6 abc 1.2 b 1.9 cd
No burn High 1257 h 1.8 ab 1.3 ab 2.4 abc
Low 1404 g 1.5 bc 1.3 ab 2.3 abcd
Dryland CT Burn High 1601 d 1.6 abc 0.9 c 2.3 abcd
Low 1599 d 1.7 abc 0.6 e 2 bcd
No burn High 1938 a 1.9 ab 0.8 cde 2.5 ab
Low 1942 a 1.9 ab 0.8 cd 2.5 abc
NT Burn High 1512 ef 2.1 a 0.6 e 1.9 d
Low 1564 de 1.7 abc 0.6 de 2.3 abcd
No burn High 1848 b 1.9 ab 0.7 cde 2.6 a
Low 1811 b 1.8 ab 0.7 cde 2.6 a
a Means followed by different letters in the same column are different at P 0.05.

85
Table 4. Summary of the effects of year (Year), sample date within the growing season
(Date), irrigation (Irr), tillage (Till), residue burning (Burn), residue level (Res) treatments and
their interactions on soybean cyst nematode (SCN) eggs and stage 2 juveniles (J2), lance, lesion,
spiral, and stunt nematode species, and total (Total) nematode population densities in the top 10
cm of soil in a long-term, wheat-soybean, double-crop production system on a silt-loam soil in
eastern Arkansas. Bolded values were considered significant at P < 0.05.
Source of variation SCN
eggs SCN Lance Lesion Spiral Stunt Total
________________________________________ P ___________________________________________
Year 0.57 <0.01 0.05 0.99 <0.01 <0.01 <0.01
Irr 0.1 <0.01 <0.01 0.72 <0.01 0.05 0.85
Year*Irr 0.11 0.97 0.06 0.79 0.03 0.13 0.03
Till 0.21 0.18 0.48 0.02 <0.01 0.62 0.65
Year*Till 0.2 0.21 0.66 0.68 0.54 0.1 0.19
Irr*Till 0.57 0.31 0.03 0.91 0.35 0.04 0.06
Year*Irr*Till 0.31 0.03 0.34 0.25 <0.01 0.45 0.88
Burn 0.48 0.88 0.96 0.06 0.07 <0.01 <0.01
Year*Burn 0.25 0.52 0.33 0.09 0.89 <0.01 <0.01
Irr*Burn 0.2 0.1 0.22 0.02 0.35 0.45 0.14
Year*Irr*Burn 0.31 0.99 0.83 0.15 0.21 0 0.2
Till*Burn 0.84 <0.01 0.95 0.4 0.81 0.1 0.08
Year*Till*Burn 0.05 0.6 0.72 0.66 0.71 0.98 0.24
Irr*Till*Burn 0.01 0.22 0.7 0.82 0.18 0.21 0.02
Year*Irr*Till*Burn 0.7 0.31 0.32 0.23 0.39 0.02 0.64
Res 0.26 0.55 0.28 0.39 0.18 0.83 0.36
Year*Res 0.07 0.08 0.5 0.13 0.94 0.25 0.82
Irr*Res 0.64 0.16 0.61 0.85 0.09 0.56 0.59
Year*Irr*Res 0.54 0.13 0.24 0.56 <0.05 0 0.08
Till*Res 0.32 0.89 0.33 0.57 0.71 0.18 0.28
Year*Till*Res 0.21 0.54 0.66 0.3 0.48 0.44 0.99
Irr*Till*Res 0.51 0.71 0.39 0.78 0.79 0 0.47
Year*Irr*Till*Res 0.99 0.17 0.71 0.46 0.68 0.01 0.63
Burn*Res 0.51 0.57 0.76 0.13 0.36 0.03 0.19
Year*Burn*Res 0.26 0.65 0.93 0.44 0.11 0.78 0.38
Irr*Burn*Res 0.39 0.1 0.77 0.41 0.16 0.41 0.98
Year*Irr*Burn*Res 0.4 0.74 0.53 0.81 0.07 <0.01 0.14
Till*Burn*Res 0.87 0.82 0.14 0.66 0.77 0.15 0.98
Year*Till*Burn*Res 0.15 0.63 0.18 0.99 0.29 0.87 0.8
Irr*Till*Burn*Res 0.44 0.31 0.4 0.96 0.02 <0.01 0.68
Year*Irr*Till*Burn*Res 0.4 0.55 0.83 0.7 0.05 0.05 0.06
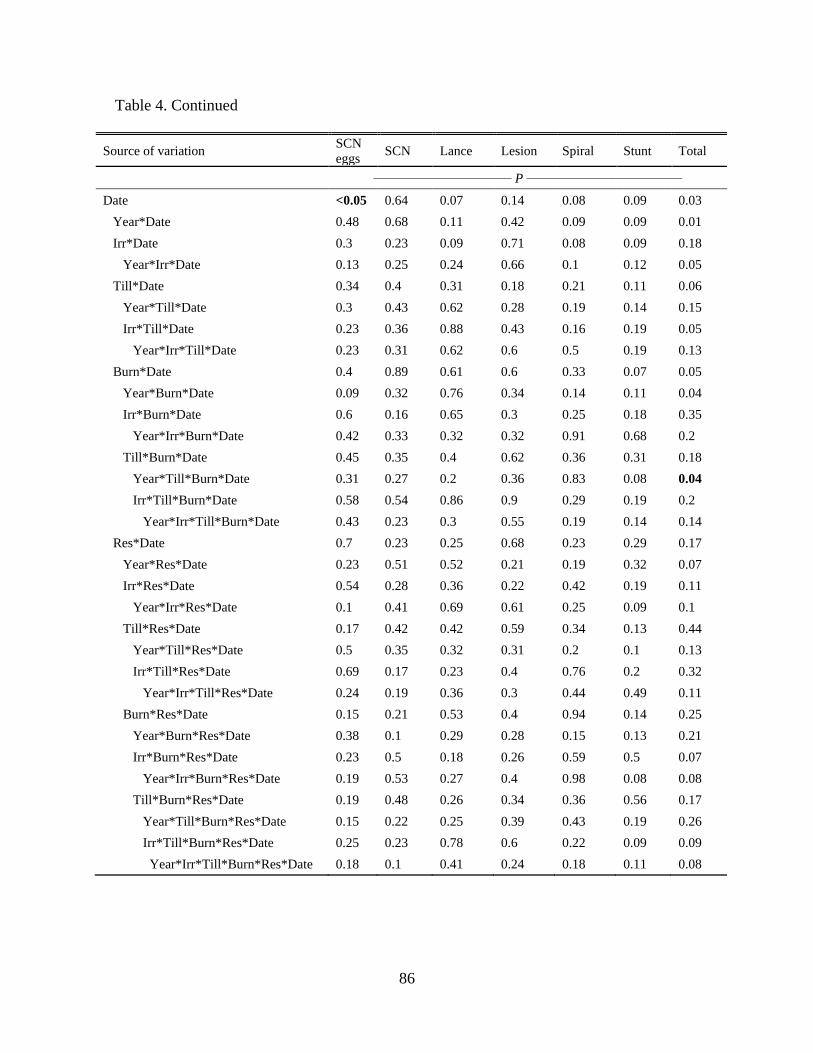
86
Table 4. Continued
Source of variation SCN
eggs SCN Lance Lesion Spiral Stunt Total
________________________________ P ____________________________________
Date <0.05 0.64 0.07 0.14 0.08 0.09 0.03
Year*Date 0.48 0.68 0.11 0.42 0.09 0.09 0.01
Irr*Date 0.3 0.23 0.09 0.71 0.08 0.09 0.18
Year*Irr*Date 0.13 0.25 0.24 0.66 0.1 0.12 0.05
Till*Date 0.34 0.4 0.31 0.18 0.21 0.11 0.06
Year*Till*Date 0.3 0.43 0.62 0.28 0.19 0.14 0.15
Irr*Till*Date 0.23 0.36 0.88 0.43 0.16 0.19 0.05
Year*Irr*Till*Date 0.23 0.31 0.62 0.6 0.5 0.19 0.13
Burn*Date 0.4 0.89 0.61 0.6 0.33 0.07 0.05
Year*Burn*Date 0.09 0.32 0.76 0.34 0.14 0.11 0.04
Irr*Burn*Date 0.6 0.16 0.65 0.3 0.25 0.18 0.35
Year*Irr*Burn*Date 0.42 0.33 0.32 0.32 0.91 0.68 0.2
Till*Burn*Date 0.45 0.35 0.4 0.62 0.36 0.31 0.18
Year*Till*Burn*Date 0.31 0.27 0.2 0.36 0.83 0.08 0.04
Irr*Till*Burn*Date 0.58 0.54 0.86 0.9 0.29 0.19 0.2
Year*Irr*Till*Burn*Date 0.43 0.23 0.3 0.55 0.19 0.14 0.14
Res*Date 0.7 0.23 0.25 0.68 0.23 0.29 0.17
Year*Res*Date 0.23 0.51 0.52 0.21 0.19 0.32 0.07
Irr*Res*Date 0.54 0.28 0.36 0.22 0.42 0.19 0.11
Year*Irr*Res*Date 0.1 0.41 0.69 0.61 0.25 0.09 0.1
Till*Res*Date 0.17 0.42 0.42 0.59 0.34 0.13 0.44
Year*Till*Res*Date 0.5 0.35 0.32 0.31 0.2 0.1 0.13
Irr*Till*Res*Date 0.69 0.17 0.23 0.4 0.76 0.2 0.32
Year*Irr*Till*Res*Date 0.24 0.19 0.36 0.3 0.44 0.49 0.11
Burn*Res*Date 0.15 0.21 0.53 0.4 0.94 0.14 0.25
Year*Burn*Res*Date 0.38 0.1 0.29 0.28 0.15 0.13 0.21
Irr*Burn*Res*Date 0.23 0.5 0.18 0.26 0.59 0.5 0.07
Year*Irr*Burn*Res*Date 0.19 0.53 0.27 0.4 0.98 0.08 0.08
Till*Burn*Res*Date 0.19 0.48 0.26 0.34 0.36 0.56 0.17
Year*Till*Burn*Res*Date 0.15 0.22 0.25 0.39 0.43 0.19 0.26
Irr*Till*Burn*Res*Date 0.25 0.23 0.78 0.6 0.22 0.09 0.09
Year*Irr*Till*Burn*Res*Date 0.18 0.1 0.41 0.24 0.18 0.11 0.08

87
Table 5. Spiral nematode concentration differences among irrigation-tillage [conventional
tillage (CT) and no-tillage (NT)]-residue burning-residue level treatment combinations in a long-
term, wheat-soybean, double-crop production system on a silt-loam soil in eastern Arkansas.
Irrigation Tillage Burning Residue level Nematode concentration [Number
(100 cm3)-1]
Irrigated CT Burn High 15.4 aba
Low 21.1 a No burn High 23 a Low 24.6 a NT Burn High 14.5 ab Low 2.3 abcde No burn High 0.8 def Low 6.0 abcd
Dryland CT Burn High 7.0 abc Low 1.5 cde No burn High 0.8 cdef Low 0.3 ef NT Burn High 0.9 cdef Low 0.6 ef No burn High 1.3 cde
Low 0.1 f a Means followed by different letters in the same column are different at P 0.05.

88
Table 6. Stunt nematode concentration differences among year-irrigation-tillage [conventional
tillage (CT) and no-tillage (NT)]-residue burning treatment combinations in a long-term, wheat-
soybean, double-crop production system on a silt-loam soil in eastern Arkansas.
Year Irrigation Tillage Burning Nematode concentration
[Number (100 cm3)-1]
2017 Irrigated CT Burn 100.6 aba No burn 17.4 cde NT Burn 233.3 a No burn 5.9 e Dryland CT Burn 123.9 ab No burn 28.4 cd NT Burn 209.6 a No burn 100.3 ab
2018 Irrigated CT Burn 21.7 cd No burn 31.8 cd NT Burn 15.4 de No burn 18.5 cde Dryland CT Burn 27.0 cd No burn 20.6 cd NT Burn 46.3 bc
No burn 12.6 de a Means followed by different letters in the same column are different at P 0.05.

89
Table 7. Stunt nematode concentration differences among year-irrigation-tillage [conventional
tillage (CT) and no-tillage (NT)]-residue level treatment combinations in a long-term, wheat-
soybean, double-crop production system on a silt-loam soil in eastern Arkansas.
Year Irrigation Tillage Residue level Nematode concentration [Number
(100 cm3)-1]
2017 Irrigated CT High 29.9 defga Low 58.6 abcd NT High 19.9 efgh Low 69.1 abcd Dryland CT High 102.3 abc Low 34.4 defg NT High 156.0 a Low 134.8 ab
2018 Irrigated CT High 25.0 defg Low 27.7 defg NT High 40.6 cdef Low 7.0 h Dryland CT High 35.1 def Low 15.7 1fgh NT High 11.6 hg
Low 50.3 bcde a Means followed by different letters in the same column are different at P 0.05.
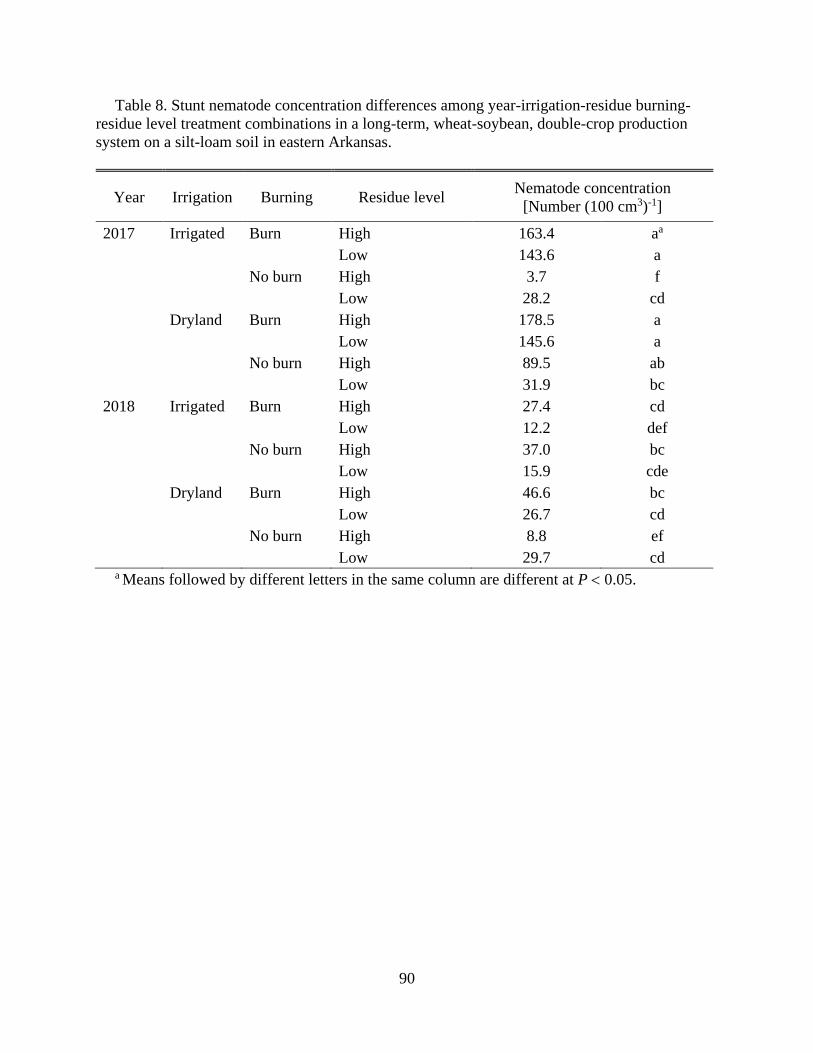
90
Table 8. Stunt nematode concentration differences among year-irrigation-residue burning-
residue level treatment combinations in a long-term, wheat-soybean, double-crop production
system on a silt-loam soil in eastern Arkansas.
Year Irrigation Burning Residue level Nematode concentration
[Number (100 cm3)-1]
2017 Irrigated Burn High 163.4 aa Low 143.6 a No burn High 3.7 f Low 28.2 cd Dryland Burn High 178.5 a Low 145.6 a No burn High 89.5 ab Low 31.9 bc
2018 Irrigated Burn High 27.4 cd Low 12.2 def No burn High 37.0 bc Low 15.9 cde Dryland Burn High 46.6 bc Low 26.7 cd No burn High 8.8 ef
Low 29.7 cd a Means followed by different letters in the same column are different at P 0.05.

91
Table 9. Stunt nematode concentration differences among irrigation-tillage [conventional
tillage (CT) and no-tillage (NT)]-residue burning-residue level treatment combinations in a long-
term, wheat-soybean, double-crop production system on a silt-loam soil in eastern Arkansas.
Irrigation Tillage Burning Residue level Nematode concentration
[Number (100 cm3)-1]
Irrigated CT Burn High 63.6 aba
Low 34.4 bc No burn High 11.8 d Low 47.1 b NT Burn High 70.5 ab Low 51.0 ab No burn High 11.8 d Low 9.5 d
Dryland CT Burn High 63.9 ab Low 52.1 ab No burn High 56.3 ab Low 10.4 d NT Burn High 130.4 a Low 74.5 ab No burn High 13.9 cd
Low 91.0 ab a Means followed by different letters in the same column are different at P 0.05.

92
Table 10. Total nematode concentration differences among year-tillage [conventional tillage
(CT) and no-tillage (NT)]-residue burning-sampling date within the growing season treatment
combinations in a long-term, wheat-soybean, double-crop production system on a silt-loam soil
in eastern Arkansas.
Year Tillage Burning Sample date Nematode concentration
[Number (100 cm3)-1]
2017 CT Burn July 233.8 ba August 176.8 bcd October 152.5 cde No burn July 211.5 bc August 81.l ghijk October 72.0 hijkl NT Burn July 413.6 a August 402.6 a October 126.8 def No burn July 115.4 ef August 84.5 ghij October 93.7 fghi
2018 CT Burn July 57.9 jklm August 49.5 lm October 248.6 b No burn July 86.5 fghi August 50.8 lm October 227.0 b NT Burn July 45.4 m August 56.9 klm October 259.6 b No burn July 95.6 fgh August 64.4 ijklm
October 110.6 efg a Means followed by different letters in the same column are different at P 0.05.

93
Table 11. Summary of correlation coefficients (r) between nematode species and soybean
yield across 2017 and 2018 in a long-term, wheat-soybean, double-crop production system on a
silt-loam soil in eastern Arkansas.
Nematode Property July August October
__________________________________________ r ________________________________________
SCN eggs 0.55 -0.82 0.27
SCN J2 0.33 0.02 0.31
Lance 0.42 0.60 -0.15
Lesion -0.09 -0.66 0.28
Spiral -0.35 -0.36* 0.16
Stunt 0.18 0.26* -0.22
Total 0.14 0.17 -0.05
Species 0.08 0.04 -0.04 * P ≤ 0.05

94
Table 12. Summary of correlation coefficients (r) between nematode population densities and soil properties from the top 10 cm
across 2017 and 2018 in a long-term, wheat-soybean, double-crop production system on a silt-loam soil in eastern Arkansas.
Soil
property
SCN eggs SCN J2 Lance Lesion
July August October July August October July August October July August October
________________________________________________________________ r ______________________________________________________________________
Sand -0.48 0.2 -0.06 0.11 0.15 -0.25 0.11 -0.6 -0.35* 0.18 -0.65 0.04
Silt 0.34 0.69 -0.22 -0.4 -0.26 0.23 0.6** -0.29 0.16 -0.14 -0.95* 0.35
Clay 0.28 -0.69 0.21 0.22 0.07 0 -0.74*** 0.58 0.12 -0.12 0.94 -0.28
pH -0.06 0.56 -0.27 -0.66 -0.16 -0.23 -0.12 -0.87* 0.09 0.17 -0.86 0.23
EC -0.54 -0.14 0.21 0.12 -0.41 -0.03 -0.23 -0.12 0.08 0.37 -0.33 -0.08
BD 0.15 -0.73 -0.33 0.05 0.03 -0.17 -0.43 0.72* 0.01 . 0.82 -0.38
P -0.16 0.53 0.42* -0.17 -0.23 0.51* -0.17 0.17 0.21 0.19 -0.39 0.19
K -0.01 -0.34 0.01 -0.11 0.03 0.1 0.15 0.53 0.36* -0.74 0.7 -0.45*
Ca -0.81 -0.92* -0.11 -0.16 0.38 0.09 -0.23 0.73* 0.42* 0.1 0.97* 0.19
Mg -0.4 -0.83 -0.17 -0.41 0.3 -0.03 -0.26 0.05 0.05 -0.11 0.92 0.21
S -0.3 0.48 0.28 0.24 -0.38 0.22 -0.27 0.15 -0.16 0.13 -0.98* -0.06
Na -0.37 -0.15 0.15 -0.15 -0.2 -0.14 -0.27 -0.23 -0.36* 0.27 -0.22 -0.27
Fe -0.02 -0.45 0.44* -0.15 0.33 0.37 -0.06 0.63 -0.1 -0.11 0.5 -0.34
Mn 0.61 0.52 -0.33 -0.3 -0.22 0.05 -0.35 0.14 0.2 0.04 -0.96* 0.19
Zn -0.05 0.94* 0.2 -0.06 -0.43 0.14 -0.14 -0.07 0.29 0.85** -0.82 0.13
Cu 0.57 0.58 0.02 -0.23 -0.14 0.22 -0.14 0.34 0.14 -0.33 0.65 -0.48*
B -0.22 0.15 -0.05 0.16 -0.47 -0.08 -0.14 -0.47 -0.19 0.67 -0.32 -0.3
Total C -0.21 -0.3 -0.37* 0.33 -0.08 -0.14 0.44 0.34 0.31 0.34 -0.87 0.72***
C:N -0.13 0.42 -0.1 0.46 -0.35 -0.04 -0.05 -0.11 0.31 0.56 -0.38 0.02
SOM -0.21 -0.54 -0.27 0.25 0.09 0.05 0.39 0.72* 0.3 0.34 -0.82 0.67*
* P ≤ 0.05; ** P < 0.01; *** P < 0.001

95
Table 13. Summary of correlation coefficients (r) between nematode population densities and soil properties from the top 10 cm
across 2017 and 2018 in a long-term, wheat-soybean, double-crop production system on a silt-loam soil in eastern Arkansas.
Soil
property
Spiral Stunt Total nematode Species
July August October July August October July August October July August October
___________________________________________________________________ r _______________________________________________________________________
Sand -0.15 -0.24 0.16 0.11 0.15 0 0.06 0.09 -0.01 0.08 0.01 0.05
Silt 0.35* -0.14 -0.09 -0.34 -0.40*** -0.15 -0.23* -0.32** -0.16 0.01 0.08 -0.16
Clay -0.13 0.27 -0.06 0.17 0.18 0.13 0.12 0.17 0.12 -0.07 -0.07 0.08
pH 0.23 0.04 0.35* -0.4 -0.31** -0.12 -0.27** -0.23* 0.07 0.22* 0.11 -0.19
EC 0.26 0.34 -0.21 0.19 0.26 0.15 0.28** 0.32** -0.26* 0.31 0.28** -0.32**
BD -0.29 -0.25 0.17 0.06 0.01 0.09 -0.02 -0.06 0.17 -0.09 -0.22* 0.03
P 0.16 0.2 -0.18 0.13 0.15 -0.16 0.21 0.2 -0.25* 0.2 0.22* -0.25*
K -0.25 -0.08 -0.14 0.11 -0.06 -0.01 0.08 -0.1 0.09 -0.08 -0.23* 0.1
Ca -0.06 0.36* 0.14 -0.09 -0.09 0.01 -0.05 -0.07 0.21* 0 -0.28** -0.03
Mg -0.12 0.34 0.54*** -0.26* -0.16 -0.05 -0.16 -0.1 0.39*** 0.15 -0.12 0.03
S 0.23 0.45* -0.31* 0.43*** 0.31** 0.11 0.38*** 0.34** -0.31* 0.2 0.28 -0.22*
Na 0.22 0.41* 0.17 0.14 0.04 0.15 0.18 0.08 -0.13 0.32 0.03 -0.17
Fe 0 0.34 -0.19 0.37 0.22 -0.13 0.40*** 0.27* -0.28* 0.19 0.08 -0.19
Mn 0.31 -0.16 -0.01 -0.19 -0.29* -0.30* -0.13 -0.27* -0.22 0.05 0.05 -0.23*
Zn 0.41* -0.05 -0.49*** 0.1 0.01 -0.08 0.18 0.05 -0.47*** 0.17 0.26 -0.35**
Cu -0.16 -0.32 0.04 0.29* 0.02 -0.16 0.22 -0.02 -0.03 -0.08 0 0.04
B 0.31 0.24 -0.18 -0.1 0.06 0.2 -0.01 0.12 -0.12 0.28** 0.26 -0.06
Total C -0.1 0.13 -0.11 -0.31 -0.15 0 -0.14 -0.14 -0.1 -0.13 -0.09 -0.12
C:N 0.28 -0.08 -0.35* -0.16 -0.02 0.03 -0.16 -0.11 0.02 -0.24* -0.11 0.2
SOM 0.07 0.18 -0.17 -0.27* -0.3 -0.07 -0.24* -0.23* -0.01 -0.15 -0.12 -0.03
* P ≤ 0.05; ** P < 0.01; *** P < 0.001

96
Table 14. Summary of monthly soil and air temperature, total rainfall during the soybean-growing season in 2017 and 2018 in a
long-term, wheat-soybean, double-crop production system on a silt-loam soil in eastern Arkansas and the 30-year mean monthly
rainfall and air temperature.
Year Month
Soil
max
(oC)
Soil
min
(oC)
Soil
mean
(oC)
Air
Max
(oC)
Air
Min
(oC)
Air
mean
(oC)
30-year
mean
air (oC)
%
diff
Precipitation
(cm)
Precipitation
(cm)
30-
year
mean
(cm) % diff
2017
May 26.7 19.7 23.2 27.0 15.5 21.3 21.3 -0.1 17.27 17.3 58.8 -70.6
June 31.7 24.1 27.9 30.2 19.8 25.0 25.7 -2.8 17.3 34.6 68.8 -49.7
July 34.5 27.9 31.2 32.5 21.9 27.2 27.2 0.1 14.63 49.2 78.3 -37.2
August 32.4 26.3 29.4 30.2 20.9 25.6 26.6 -3.9 17.93 67.1 85.0 -21.0
September 29.3 23.2 26.3 28.7 17.6 23.2 22.8 1.5 15.54 82.7 91.4 -9.6
October 23.2 18.7 21.0 24.5 11.6 18.1 16.8 7.5 6.83 89.5 101.9 -12.2
6-month
period 29.6 23.3 26.5 28.9 17.9 23.4 23.4 0.4 89.5 340.34 484.2 -29.7
2018
May 29.9 21.7 25.8 31.6 19.0 25.3 21.3 18.8 3.61 3.6 58.8 -93.9
June 33.9 25.9 29.9 32.9 21.4 27.1 25.7 5.6 7.77 11.4 68.8 -83.5
July 35.9 28.6 32.2 33.7 22.4 28.1 27.2 3.3 4.27 15.7 78.3 -80.0
August 32.4 25.7 29.0 31.5 20.7 26.1 26.6 -1.8 11.33 27.0 85.0 -68.3
September 29.8 24.2 27.0 29.2 19.7 24.5 22.8 7.1 22.6 49.6 91.4 -45.8
October 23.0 18.0 20.5 23.4 12.5 18.0 16.8 6.7 12.09 61.7 101.9 -39.5
6-month
period 30.8 24.0 27.4 30.4 19.3 24.8 23.4 6.6 61.67 168.87 484.2 -65.1
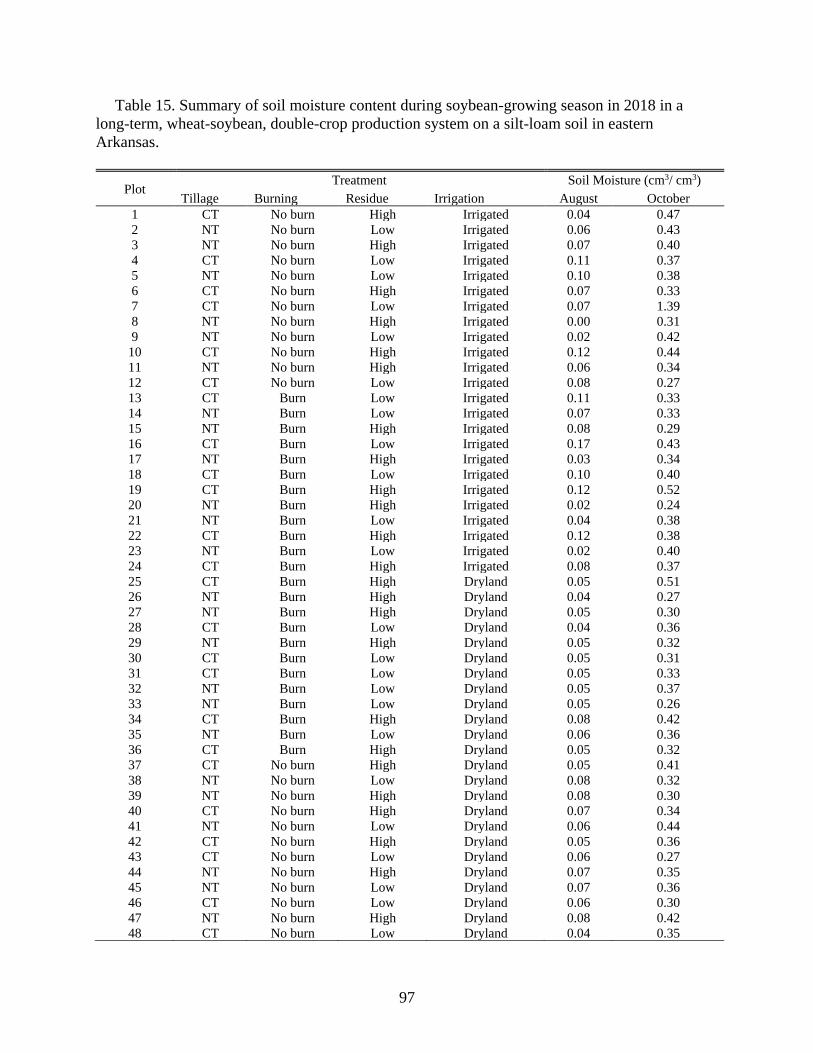
97
Table 15. Summary of soil moisture content during soybean-growing season in 2018 in a
long-term, wheat-soybean, double-crop production system on a silt-loam soil in eastern
Arkansas.
Plot Treatment Soil Moisture (cm3/ cm3)
Tillage Burning Residue Irrigation August October
1 CT No burn High Irrigated 0.04 0.47
2 NT No burn Low Irrigated 0.06 0.43
3 NT No burn High Irrigated 0.07 0.40
4 CT No burn Low Irrigated 0.11 0.37
5 NT No burn Low Irrigated 0.10 0.38
6 CT No burn High Irrigated 0.07 0.33
7 CT No burn Low Irrigated 0.07 1.39
8 NT No burn High Irrigated 0.00 0.31
9 NT No burn Low Irrigated 0.02 0.42
10 CT No burn High Irrigated 0.12 0.44
11 NT No burn High Irrigated 0.06 0.34
12 CT No burn Low Irrigated 0.08 0.27
13 CT Burn Low Irrigated 0.11 0.33
14 NT Burn Low Irrigated 0.07 0.33
15 NT Burn High Irrigated 0.08 0.29
16 CT Burn Low Irrigated 0.17 0.43
17 NT Burn High Irrigated 0.03 0.34
18 CT Burn Low Irrigated 0.10 0.40
19 CT Burn High Irrigated 0.12 0.52
20 NT Burn High Irrigated 0.02 0.24
21 NT Burn Low Irrigated 0.04 0.38
22 CT Burn High Irrigated 0.12 0.38
23 NT Burn Low Irrigated 0.02 0.40
24 CT Burn High Irrigated 0.08 0.37
25 CT Burn High Dryland 0.05 0.51
26 NT Burn High Dryland 0.04 0.27
27 NT Burn High Dryland 0.05 0.30
28 CT Burn Low Dryland 0.04 0.36
29 NT Burn High Dryland 0.05 0.32
30 CT Burn Low Dryland 0.05 0.31
31 CT Burn Low Dryland 0.05 0.33
32 NT Burn Low Dryland 0.05 0.37
33 NT Burn Low Dryland 0.05 0.26
34 CT Burn High Dryland 0.08 0.42
35 NT Burn Low Dryland 0.06 0.36
36 CT Burn High Dryland 0.05 0.32
37 CT No burn High Dryland 0.05 0.41
38 NT No burn Low Dryland 0.08 0.32
39 NT No burn High Dryland 0.08 0.30
40 CT No burn High Dryland 0.07 0.34
41 NT No burn Low Dryland 0.06 0.44
42 CT No burn High Dryland 0.05 0.36
43 CT No burn Low Dryland 0.06 0.27
44 NT No burn High Dryland 0.07 0.35
45 NT No burn Low Dryland 0.07 0.36
46 CT No burn Low Dryland 0.06 0.30
47 NT No burn High Dryland 0.08 0.42
48 CT No burn Low Dryland 0.04 0.35

98
Figure 1. Soil C:N ratio differences among irrigation (irrigated and dryland) and tillage
[conventional tillage (CT) and no-tillage (NT)], soil C: N ratio differences among tillage
[conventional tillage (CT) and no-tillage (NT)], burning (burn and no burn) and residue level
(high and low), and soil electrical conductivity (EC) differences among irrigation (irrigated and
dryland) and burning (burn and no burn) treatment combinations after 15 cropping cycles in a
long-term wheat-soybean, double-crop production system on a silt-loam soil in eastern Arkansas.
Different letters atop bars are different at 0.05.

99
Figure 2. Extractable soil magnesium (Mg) and phosphorus (P) differences among irrigation
(irrigated and dryland) and burning (burn and no burn) and extractable soil iron (Fe) differences
among irrigation (irrigated and dryland)-tillage [conventional tillage (CT) and no-tillage (NT)]-
residue burning (burn and no burn) treatment combinations after 15 cropping cycles in a long-
term wheat-soybean, double-crop production system on a silt-loam soil in eastern Arkansas.
Different letters atop bars are different at 0.05.

100
Figure 3. Soybean cyst nematode eggs concentration differences among irrigation (irrigated
and dryland)-tillage [conventional tillage (CT) and no-tillage (NT)]-residue burning (burn and no
burn) treatment combinations in a long-term, wheat-soybean, double-crop production system on
a silt-loam soil in eastern Arkansas. Different letters atop bars are different at 0.05.

101
Figure 4. Soybean cyst nematode juvenile concentration differences among tillage
[conventional tillage (CT) and no-tillage (NT)]-residue burning (burn and no burn) treatment
combinations in a long-term, wheat-soybean, double-crop production system on a silt-loam soil
in eastern Arkansas. Different letters atop bars are different at 0.05.

102
Figure 5. Soybean cyst nematode juvenile concentration differences among year (2017 and
2018)-irrigation (irrigated and dryland)-tillage [conventional tillage (CT) and no-tillage (NT)]
treatment combinations in a long-term, wheat-soybean, double-crop production system on a silt-
loam soil in eastern Arkansas. Different letters atop bars are different at 0.05.

103
Figure 6. Lance nematode concentration differences among irrigation (irrigated and dryland)-
tillage [conventional tillage (CT) and no-tillage (NT)] treatment combinations in a long-term,
wheat-soybean, double-crop production system on a silt-loam soil in eastern Arkansas. Different
letters atop bars are different at 0.05.

104
Figure 7. Lesion nematode concentration differences among irrigation (irrigated and dryland)-
residue burning (burn and no burn) treatment combinations in a long-term, wheat-soybean,
double-crop production system on a silt-loam soil in eastern Arkansas. Different letters atop bars
are different at 0.05.
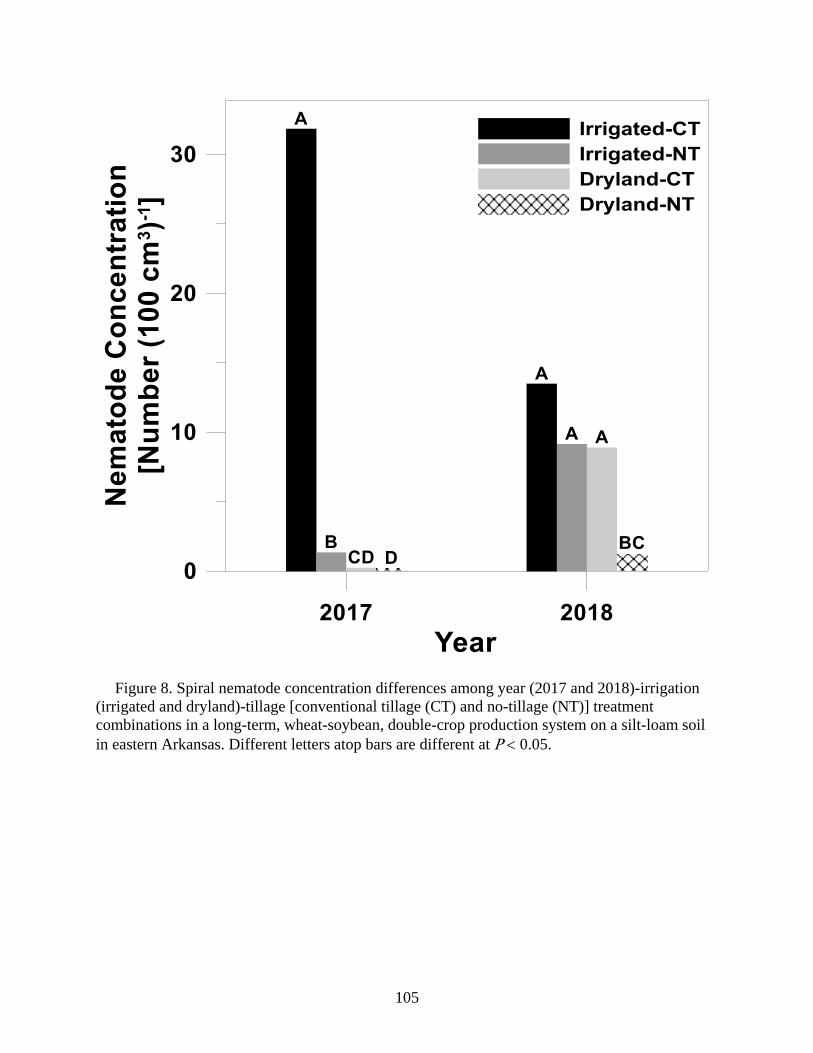
105
Figure 8. Spiral nematode concentration differences among year (2017 and 2018)-irrigation
(irrigated and dryland)-tillage [conventional tillage (CT) and no-tillage (NT)] treatment
combinations in a long-term, wheat-soybean, double-crop production system on a silt-loam soil
in eastern Arkansas. Different letters atop bars are different at 0.05.

106
Figure 9. Spiral nematode concentration differences among year (2017 and 2018)-irrigation
(irrigated and dryland)-residue level (high and low) treatment combinations in a long-term,
wheat-soybean, double-crop production system on a silt-loam soil in eastern Arkansas. Different
letters atop bars are different at 0.05.

107
Figure 10. Total nematode concentration differences among year (2017 and 2018)-irrigation
(irrigated and dryland) treatment combinations in a long-term, wheat-soybean, double-crop
production system on a silt-loam soil in eastern Arkansas. Different letters atop bars are different
at 0.05.

108
Figure 11. Total nematode concentration differences among irrigation (irrigated and dryland)-
tillage [conventional tillage (CT) and no-tillage (NT)]-residue burning (burn and no burn)
treatment combinations in a long-term, wheat-soybean, double-crop production system on a silt-
loam soil in eastern Arkansas. Different letters atop bars are different at 0.05.
109
Literature Cited
Alby, T., Ferris, J. M., and Ferris, V. R. 1983. Dispersion and distribution of Pratylenchus
scribneri and Hoplolaimus galeatus in soybean fields. Journal of Nematology 15:418-426.
Allen T. W., C.A. Bradley, J.P. Damicone, N.S. Dufault, T.R. Faske, C.A. Hollier, T.
Isakeit, R.C. Kemerait, N.M. Kleczewski, R.J. Kratochvil, H.L Mehl, J.D. Mueller, C.
Overstreet, P.P. Price, E.J. Sikora, T.N. Spurlock, L. Thiessen, W.J. Wiebold, and Young. H.
2017. Southern United States soybean disease loss estimate for 2016. Pp. 3-8 in Proc. Southern
Soybean Disease Workers, 44th Annual Meeting, Pensacola, FL.
Amuri, N., Brye, K. R., Gbur, E. E., Oliver, D., and Kelley, J. 2010. Weed population as
affected by residue management in a wheat-soybean double-crop production system. Weed
Science 58:234-243.
Arkansas Soybean Promotion Board (ASPB). 2019. Controlling harmful effects of
nematodes [Online]. Available at: https://www.themiraclebean.com/controlling-the-harmful-
effects-of-nematodes-2/ (verified 25 Nov., 2019).
Arnfield, J. A. 2019. Koppen Climate Classification. Encyclopedia Britannica Encyclopedia
Brtiannica [Online]. Available at: http//www.britannica.com/science/Koppen-climate-
classification (verified 26 Nov., 2019).
Baird, S. M., and Bernard, E. C. 1984. Nematode population and community dynamics in
Soybean-wheat cropping and tillage regimes. Journal of Nematology 16:379-386.
Bao, Y., Neher, D. A., and Chen, S. 2011. Effect of soil disturbance and biocides on
nematode communities and extracellular enzyme activity in soybean cyst nematode suppressive
soil. Nematology 13:687-699.
Barker, K. R. 1985. Nematode extraction and bioassays. Pp. 19-35 in K. Barker, C. Carter,
and J. Sasser, eds. An advanced treatise on Meloidogyne: Volume II, Methodology: Raleigh, NC,
U.S: North Carolina State University Graphics.
Bridge, J., and Starr, J. L. 2007. Plant Nematodes of Agricultural Importance: A colour
handbook. Manson Publishing. London, UK.
Brye, K. R., Cordell, L. M., Longer, D. E., and. Gbur, E. E. 2006. Residue management
practice effects on soil surface properties in a young wheat–soybean double crop system. Journal
of Sustainable Agriculture. 29:121-150.
Brye, K. R., Mersiovsky, E., Hernandez, L., and Ward, L. 2013. Soils of Arkansas. Arkansas
Agricultural Experimental Extension, University of Arkansas System Division of Agriculture,
Fayetteville, AR. 136 p.

110
Brye, K. R., Quarta, M., Morrison, C., and Rothrock, C. 2018. Long-term effects of residue
and water management practices on plant parasitic nematode abundance and soybean root
infection. Applied Soil Ecology 124:275-283.
Byrd, D., Barker, K. R., Ferris, H., Nusbaum, J. C., Griffin, W. E., Small, R. H., and Stone,
C. A. 1976. Two semi-automatic elutriators for extracting nematodes and certain fungi from soil.
Journal of Nematoly. 8 206-212.
Cordell, M., Brye, K. R., Longer, D. E, and Gbur, E. E. 2007. Residue management practice
effects on soybean establishment and growth in a young wheat-soybean double cropping system.
Journal of Sustainable Agriculture 29:97-120.
Emerson, M. Brown, K. Faske, T. R., and Kirkpatrick T. L. 2018. Field performance of
several glyphosate-resistant maturity group 4 and 5 soybean cultivars in a root-knot nematode
infested field. Pp. 40-41 in J. Ross ed. University of Arkansas Research Studies 2016. University
of Arkansas Experiment Station. Fayetteville.
Go Soy. 2019. [Online]. Available at:
https://www.gostrattonseed.com/assets/uploads/2018/03/20180309135920-84509-gosoy-pocket-
folder-inserts-2018-proofpdf.pdf (verified 25 Nov., 2019).
Handoo, Z. A., Palomares-Rius, J. E., Cantalapiedra-Navarrete, C., Liébanas, G., Subbotin,
S. A., Castillo, P.2014. Integrative taxonomy of the stunt nematodes of the genera Bitylenchus
and Tylenchorhynchus (Nematoda, Telotylenchidae) with description of two new species and a
molecular phylogeny. Zoological Jurnal of the Linnean Society 172:231-264.
Hartman, G. L., Rupe, J. C., Sikora, E. J., Domier, L. L., Davis, J. A., and Steffey, K. L.
2015. Compendium of soybean diseases and pests. The American Phytopathological Society. St.
Paul, Minnesota, U.S.
Heatherly, L. G., and Young, L. D. 1991. Soybean and soybean cyst nematode response to
soil water content in loam and clay soils. Crop Science 31:191-196.
Henneron, L. Bernard, L., Hedde, M., Pelosi, C., Villenave, C., Chenu, C., Bertrand, M.,
Cyril, G., and Blanchart, E. 2015. Fourteen years of evidence for positive effects of conservation
agriculture and organic farming on soil life. Agronomy for Sustainable Development 35:169-
181.
Hershman, D. E., and Bachi. P. R. 1995. Effect of wheat residue and tillage on Heterodera
glycines and yield of double crop soybean in Kentucky. Plant Disease: 79: 631-633.
Jenkins, W. R. 1964. A rapid centrifugal-flotation technique for separating nematodes from
soil. Plant Disease Reporter 48:692.

111
Kirkpatrick, T., T. Faske, T., and Robbins. B. 2014. Nematode management in Arkansas
Soybean Production Handbook, MP197. University of Arkansas Cooperative Extension Service
[Online]. Available at: https://www.uaex.edu/publications/pdf/mp197/chapter10.pdf. (verified 12
Aug., 2019).
Kirkpatrick, T. and Sullivan, K. 2016. Incidence, population density, and distribution of
soybean nematodes in Arkansas. Pp. 47-49 in J. Ross ed. University of Arkansas Research
Studies 2016. University of Arkansas Experiment Station. Fayetteville.
Kirkpatrick, T. 2017. Incidence, population density, and distribution of soybean nematodes
in Arkansas. Pp. 72-73 in J. Ross ed. University of Arkansas Research Studies 2015, 637.
University of Arkansas Experiment Station. Fayetteville.
Koenning, S. R., and Barker, K. R. 1995. Soybean photosynthesis and yields as influences
by Heterodera glycines, soil type, and irrigation. Journal of Nematology 27:51-62.
Koenning, S. R., Overstreet, C., Noling, J. W., Donald, P. A., Becker, J. O., and Fortnum,
B.A. 1999. Survey of crop losses in response to phytoparasitic nematode in the United States for
1994. Journal of Nematology 31:587-618.
Koenning, S. R., and Barker, K. R. 1995. Soybean photosynthesis and yields as influences
by Heterodera glycines, soil type, and irrigation. Journal of Nematology 27:51-62.
Monfort, W. S., Kirkpatrick, T. L., and Mauromoustakos, A. 2008. Spread of Rotylenchulus
reniformis in Arkansas cotton field over four-year period. Journal of Nematology 40:161-166.
Moore, W. F. 1984. Soybean cyst nematode. Soybean industry resource committee,
Mississippi State University, Starkville, MS.
National Oceanic and Atmospheric Administration (NOAA). 2019. Data tools: 1981-2010
Normals, Arkansas [Online]. https://www.ncdc.noaa.gov/data-access/land-based-station-
data/land-based-datasets/climate-normals/1981-2010-normals-data (verified 26 Nov., 2019).
Norman, C. R., Brye, K. R., Gbur, E. E., Chen, P., and Rupe, J. 2016. Long-term
management effects on soil properties and yields in a wheat-soybean, double-crop system in
eastern Arkansas. Soil Science 181:1-12.
Progeny. 2019. [Online]. Available at: https://progenyag.com/wp-
content/uploads/2018/10/5414LLS.pdf (verified 25 Nov., 2019).
Robbins, R. T., Riggs, R. D., and Von Steen, D. 1987. Results of annual phytoparasitic
nematode surveys of Arkansas soybean field, 1978-1986. Annals of Applied Nematology 1:50-
55.

112
Tucker, M. R. 1992. Determination of phosphorous by Mehlich 3 extraction. Pp. 6-8
in S. Donohue, ed. Soil and media diagnostic procedures for the southern region of the United
States. Virginia Agricultural Experimental Station on Bulletin 374, Blacksburg, VA: Scientific
Research.
Tyler, D. D., Overton, J. R., and Chambers, A. Y. 1983. Tillage effects on soil properties,
diseases, cyst nematodes, and soybean yields. Journal of Soil and Water Conservation 38:374-
376.
United States Department of Agriculture (USDA), National Agricultural Statistics Service
(NASS).2017 State agriculture overview, Arkansas [Online]. Available at:
https://www.nass.usda.gov/Quick_Stats/Ag_Overview/stateOverview.php?state=ARKANSAS.
(verified 26 Nov. 2019).
United States Department of Agriculture (USDA), National Agricultural Statistics Service
(NASS). 2019. Principal Area Planted – States and United States:2017-2019 [Online]. Available
at:
https://downloads.usda.library.cornell.edu/usdaesmis/files/j098zb09z/0k225n39n/jw827p632/acr
g0619.pdf. (verified 12 Oct., 2019).
Wrather, J. A., and Koenning, S. R. 2006. Estimate of disease effects on soybean yields in
the United States 2003 to 2005. Journal of Nematology 38:173-180.
Young, L. D. 1996. Yield loss in soybean caused by Heterodera glycines. Journal of
Nematology 28:604-607.

113
Conclusions

114
Through assessing the natural nematode population densities in the soil on a wheat-
soybean double-crop, this research has provided valuable understanding into the complexity of
the effects of water and residue management on plant-parasitic nematodes. The objective of this
investigation was to evaluate the combined long-term effects of tillage practice (conventional
tillage and no-tillage), water management (irrigation and non-irrigation), residue burning (burned
and non-burned), and wheat residue level (high and low) on the natural nematode population
densities and reproduction in the top 10 cm within the growing season and between years
soybean in a double-crop production system on a silt-loam soil in eastern Arkansas.
Wheat-soybean crop management affected nematode populations. The majority of nematodes
studied were affected by at least one treatment or the interaction of two or more. Similar to what
was hypothesized, nematodes population was generally greater under irrigation, CT, burn
compared to dryland, NT, and nom-burn treatment, respectively. However, different treatment
combinations did not have the same effect in all nematode species. Nematode management has
to be tailored to species and agricultural practices for the best results.

115
Appendices
Appendix A: Example of SAS program for evaluating the effects of tillage, irrigation, residue
level, burning, date within growing season, and year on plant parasitic nematodes.
Title 'CBES Nematode Study 2017 2018';
options ls = 132 ps = 68;
data soil;
infile 'nematode_data_sas.csv' firstobs = 2 delimiter = "," truncover LRECL = 600;
input Plot $ Year $ Till $ Burn $ Res $ Irr $ Date $ Block SCNJ2 SCNEggs Lance Lesion Spiral
Stunt Rootknot Dagger Ring Stubbyroot Reniform Total Species;
run;
ods rtf file = 'SCNJ2.rtf' style = journal bodytitle;
proc glimmix data = soil maxopt=100 pconv=1.0E7;
class Year Block Irr Till Burn Res Date;
model SCNJ2= Year | Irr | Till | Burn | Res | Date / ddfm = kr dist = poisson link = log;
random block (Year) Irr*Block (Year) Irr*Till*Burn*Res*Block (Year);
ods exclude FitStatistics InterHistory OptInfo;
lsmeans Year*Irr*Till Till*Burn / lines ilink;
run;
ods rtf close;

116
Appendix B: Example of SAS program for evaluating the effects of tillage, irrigation, residue
level and burning on soil physical and chemical properties.
Title '2017 SOIL PROPERTIES';
options ls = 132 ps = 68;
data soil;
infile 'SOIL PROPERTIES 2017_NEW.csv' firstobs = 2 delimiter = "," truncover LRECL =
600;
input plot till $ burn $ Res $ Irr $ pH EC bd Phos K Ca Mg S Na Fe Mn Zn Cu B
TN TC CN SOM;
run;
ods rtf file = 'CN.RTF' style = journal bodytitle;
proc print data = soil;
run;_
quit;
proc glimmix data = soil maxopt=100 pconv=1.0E7;
class Irr till burn Res ;
model CN = Irr | till | burn | Res / ddfm = kr link = log;
ods exclude FitStatistics InterHistory OptInfo;
lsmeans Irr*till Irr*burn*Res till*burn*Res / lines ilink;
run;
ods rtf close;