Embed Size (px)
Citation preview

Nematic liquid crystal alignment on chemical patterns
BRAMBLE, J. P., EVANS, S. D., HENDERSON, J. R., ANQUETIL, C., CLEAVER, D. J. and SMITH, N. J.
Available from Sheffield Hallam University Research Archive (SHURA) at:
http://shura.shu.ac.uk/899/
This document is the author deposited version. You are advised to consult the publisher's version if you wish to cite from it.
Published version
BRAMBLE, J. P., EVANS, S. D., HENDERSON, J. R., ANQUETIL, C., CLEAVER, D. J. and SMITH, N. J. (2007). Nematic liquid crystal alignment on chemical patterns. Liquid Crystals, 34 (9), 1059-1069.
Repository use policy
Copyright © and Moral Rights for the papers on this site are retained by the individual authors and/or other copyright owners. Users may download and/or print one copy of any article(s) in SHURA to facilitate their private study or for non-commercial research. You may not engage in further distribution of the material or use it for any profit-making activities or any commercial gain.
Sheffield Hallam University Research Archivehttp://shura.shu.ac.uk

Nematic Liquid Crystal Alignment on Chemical Patterns
J.P. Bramble, S.D. Evans,∗ and J.R. Henderson
Molecular and Nanoscale Physics, School of Physics and Astronomy,
The University of Leeds, Woodhouse Lane, Leeds, LS2 9JT
C. Anquetil and D.J. Cleaver
Materials Modelling Group, Sheffield Hallam University,
City Campus, Howard Street, Sheffield, S1 1WB
N.J. Smith
Sharp Laboratories of Europe Ltd. Edmund Halley Road,
Oxford Science Park, Oxford, OX4 4GB
(Dated: July 30, 2007)
Abstract
Patterned Self-Assembled Monolayers (SAMs) promoting both homeotropic and planar degener-
ate alignment of 6CB and 9CB in their nematic phase, were created using microcontact printing of
functionalised organothiols on gold films. The effects of a range of different pattern geometries and
sizes were investigated, including stripes, circles and checkerboards. Evanescent Wave Ellipsometry
was used to study the orientation of the liquid crystal (LC) on these patterned surfaces during the
isotropic-nematic phase transition. Pretransitional growth of a homeotropic layer was observed
on 1 µm homeotropic aligning stripes, followed by a homeotropic mono-domain state prior to the
bulk phase transition. Accompanying Monte-Carlo simulations of LCs aligned on nano-patterned
surfaces were also performed. These simulations also showed the presence of the homeotropic
mono-domain state prior to the transition.
∗Electronic address: [email protected]
1

I. INTRODUCTION
Techniques for patterning substrates on the micron-scale are now routine in surface sci-
ence. Some of these methods can readily be used to produce features on the nano-scale.
However, almost nothing is known experimentally about LC anchoring on patterned sub-
strates when the pattern scale falls below the wavelength of light. In contrast, analogous
computer simulation studies, based on simplified molecular models, are most suited to the
nano-scale. From such simulations (as presented below) it is evident that LC anchoring due
to nano-scale patterning is remarkably similar, qualitatively, to experimental observations
at a scale expanded by three orders of magnitude. Simulation and experiment approach
the interesting technological scale of 100 nm features, from opposite directions. The future
should see this gap closed rapidly, such that the extent to which anchoring phenomena at
this scale can be directly interpreted in terms of molecular interactions is likely to become
a major issue. In this initial study we explore what can already be observed on the length
scales most appropriate to the complimentary techniques of experiment and simulation.
Chemical patterning of surfaces for Liquid Crystal (LC) alignment also promises to de-
liver a number of significant advantages for device technology over existing non-patterned
surfaces. Such advantages include improved optical performance and wider viewing angles
[1, 2] and novel devices such as Graded Refractive Index (GRIN) micro-lenses [3, 4]. Current
methods used to pattern surfaces for LC alignment are photoalignment [3–5], micro-rubbing
[6], scratching with AFM tips [7] and patterned self-assembled monolayers of silanes [8, 9] or
alkanethiols on gold [10, 11]. The use of micro-patterning is potentially attractive because
the azimuthal and the polar orientation of the LC can be controlled accurately [3, 12].
The behaviour of confined nematic LCs is of fundamental importance for display and
switching device applications. Close proximity to a confining substrate clearly breaks the
symmetry of the fluid on molecular length-scales, inducing phenomena such as positional
layering and modified orientational ordering [13]. In LCs, at a continuum level, these effects
are described in terms of anchoring [14], in which the substrate is taken to promote one or
more preferred bulk director orientation (e.g. planar, tilted or homeotropic). The strength
of this substrate-induced orientational pinning is then characterised by two parameters,
the polar and azimuthal anchoring coefficients. However, the links between this anchoring
description and the many contributing microscopic interfacial interactions are still rather
2

poorly understood.
Whereas conventional uniaxial alignment is sufficient for some applications, more sophis-
ticated, patterned alignment is needed to improve the optical performance of devices, for
instance with respect to the viewing angle. Patterned LC alignment raises various questions,
such as “Can tilt be induced and controlled using patterning?”; and “Can patterning give
independent control over the two anchoring coefficients?” Kumar et al. [15] showed that
substrate morphology at sub-µm scales is of great importance in determining LC alignment.
Specifically, they concluded that anisotropy in surface morphology of a substrate on a submi-
cron length scale can play a defining role in determining the resulting anchoring behaviour.
Scharf [9] has demonstrated that nanoscale chemical patterning using silanes on silicon can
be used to control the azimuthal and polar orientation of the LC E7.
Some displays being developed for the hand-held device market require two optically-
distinct stable states. The ZBD (Zenithal Bistable Device)[16, 17] achieves this by using
a blazed grating which has stable “continuous” and “defect” states. In recent years, much
attention has been given to bistable switching in LC devices due to its potential to achieve
high display resolution with significantly decreased power consumption. Kim et al.[18–20]
presented a general approach to establishing in-plane alignment bistability by exploiting the
orientational frustration induced by a checkerboard pattern. Lee et al. [21] subsequently
demonstrated a continuous variation in LC pretilt using a checkerboard pattern comprising
regions with orthogonally etched grooves. Bechtold and Oliveira [22] experimentally inves-
tigated the equilibrium configuration of the director for a submicron patterned substrate,
creating alternating homeotropic and random planar stripes by selectively irradiating a SAM
with deep UV. James et al. [23, 24] also studied striped patterns in their modelling of an
LCOS (Liquid Crystal on Silicon) device, where the patterning was achieved using high-
resolution linear electrodes with rewritable input voltages.
In this study substrates are chemically micropatterned using microcontact printing of
organothiols on gold. In sections II and III we use this approach to study nematic LC an-
choring on a variety of pattern geometries. In Section IV we present computer simulation
methods which allow one to relate experimentally observed behaviour to idealised inter-
molecular potentials. In section V Evanescent Wave Ellipsometry (EWE) is used to study
the SAM/LC interface. It has been shown previously that the Brewster angle can be used
to deduce the anchoring orientation of nematic LCs on SAMs of different functional groups
3
and chain lengths [25, 26]. In this study the same technique is applied to patterned systems
and compared with simulations of generic models.
II. EXPERIMENTAL: NEMATIC LIQUID CRYSTAL ALIGNMENT ON PAT-
TERNED SELF-ASSEMBLED MONOLAYERS
Patterned surfaces have been prepared using microcontact printing of functionalised
organothiols on thin gold films. Glass slides were cleaned rigorously with detergent, MilliQ
water (Millipore, Billerica, USA), methanol, piranha etch (30% Hydrogen Peroxide, 70% Sul-
phuric Acid) and finally MilliQ water. The substrates were dried in nitrogen and mounted
in an thermal evaporator (Edwards Auto 306). A 3 nm adhesion layer of Cr was deposited,
followed by the deposition of a 25 nm Au film. This thickness is sufficient to create a gold
film which is continuous but optically transparent. Hence, it is suitable for polarising mi-
croscopy studies. The substrates were rotated during evaporation to ensure there was no
anisotropy in the formation of gold grains, which could lead to non-degenerate azimuthal
anchoring [27]. Polydimethylsiloxane (PDMS)(Dow Corning Corp.) was prepared for mi-
crocontact printing as described by Kumar and Whitesides [28]. The PDMS was well mixed
and degassed under vacuum. A silicon wafer, etched with a series of micron sized features
was used as a master for the formation of the PDMS stamps. The wafer was silanised, to aid
stamp removal, by immersion in a 1% solution of perfluorodecyltriethoxysilane (Fluorochem
Ltd.) in DCM for 1 hour. For circular structures, masters were made using negative tone
photoresist SU8 2010 (Micro Chem Corp.) on glass substrates. These masters were silanised
with the same silane via vapour phase deposition. The PDMS material was poured onto the
master in a mould and cured at 60◦C for 10 hours. After curing, the PDMS was removed
and cut into small stamps. A 7 mM ethanolic solution of HS− (CH2)17 − (CF2)9 − CF3
was prepared. The printing surface of the stamp was inked with this solution for a few
minutes and then carefully dried with nitrogen. The stamp was then placed onto the gold
surface for 2 minutes. The gold surfaces were then immersed in a 3 mM ethanolic solution
of 11-mercaptoundecanoic acid, HS− (CH2)10 − COOH (Sigma-Aldrich), for 12 hours. This
back fills the non-printed regions to produce a two component patterned surface. The CF3
terminated SAMs give homeotropic alignment of the LC nCB where 6 ≤ n ≤ 9, and the
COOH terminated SAMs give planar degenerate alignment of the LC nCB where 5 ≤ n ≤ 9
4
[25, 26]. Liquid crystal cells were formed with a homeotropic aligning top surface using
CF3 terminated SAMs on gold. Cell gaps were maintained with two 23 µm thick stripes of
polyethylene terephthalate (PET) film (Goodfellow, UK). The samples were heated above
the nematic-isotropic transition temperature of the LC investigated and a small amount of
LC (Kingston Chemicals, UK) was placed on the patterned surface before the upper surface
was placed on top. The samples were then slowly cooled (0.1 ◦C/min) into the nematic
phase.
For EWE studies, two equilateral high index glass (Tih53) prisms (Galvoptics, UK) were
cleaned in isopropanol and dried with nitrogen. A 20 nm film of Au was evaporated onto the
bases of the prisms. The prisms were then printed with 1 µm stripes of CF3/COOH. Prism
A was printed so that the stripes ran parallel to the plane of incidence and Prism B was
printed so that the stripes ran perpendicular to the plane of incidence, as depicted in figure
1. Gold slides were prepared with a CF3 terminated SAM as detailed above and used as a
lower surface together with PET spacers to form a cell gap of 23 µm. The cells were then
filled with 6CB in the isotropic phase. The temperature of the cell was maintained with
an accuracy of 0.05◦C with a PID controlled Peltier heater and held for 5 minutes before
each reading was taken. Heating and cooling data were taken to check for hysteresis and to
ensure reliability. A Jobin Yvon UVISEL ellipsometer was used for all EWE measurements.
The angular resolution is 0.01◦ for this system. The wavelength was set to 633 nm to be
consistent with previous experiments [25, 26] and the phase modulated ellipsometer was
operated in mode III (A = +45◦, M = -45◦) [29, 30].
[INSERT FIGURE 1 HERE]
III. POLARISING MICROSCOPY
Polarising microscopy was used to study the alignment of LCs on patterned surfaces. The
alignment of 9CB on non-patterned COOH terminated SAMs is planar degenerate, as seen
in figure 2(a), but if confined to a stripe geometry, the director of the LC is forced to lie
parallel to the stripes. figure 2(b) shows a polarising microscopy image of the LC alignment
on a single 10 µm stripe of a COOH terminated SAM surrounded by a CF3 terminated SAM.
The sample is rotated 45◦ relative to the polarisers so that transmission is maximised. A
single polariser was used to show that the alignment was parallel rather than perpendicular
5
to the stripe. The disclination lines seen running across the stripes, are identified as domain
walls between different splay domains. The domain wall forms into an approximate ring,
which runs around the planar stripe [8].
Figure 2(c) shows an example of the alignment of 9CB on alternating 2µm stripes, over a
large printed area. Again the alignment of 9CB on COOH terminated regions is planar and
consistently oriented along the direction of the stripes. In the regions where the alignment
on both surfaces is homeotropic we can see that there is some transmission of light. This is
due to a small variation in the midplane zenithal tilt angle θ. The variation in midplane tilt
is expected from elastic models of the director configuration in patterned systems [31, 32].
These results demonstrate that patterning surfaces on a relatively large scale can induce an
azimuthal orientation to otherwise planar degenerate aligning surfaces. This is in agreement
with previous results of LC alignment on surfaces patterned with homeotropic and planar
stripes [8]. It is also consistent with recent analytical results where the azimuthal anchoring
energy is low for COOH terminated SAMs [32].
[INSERT FIGURE 2 HERE]
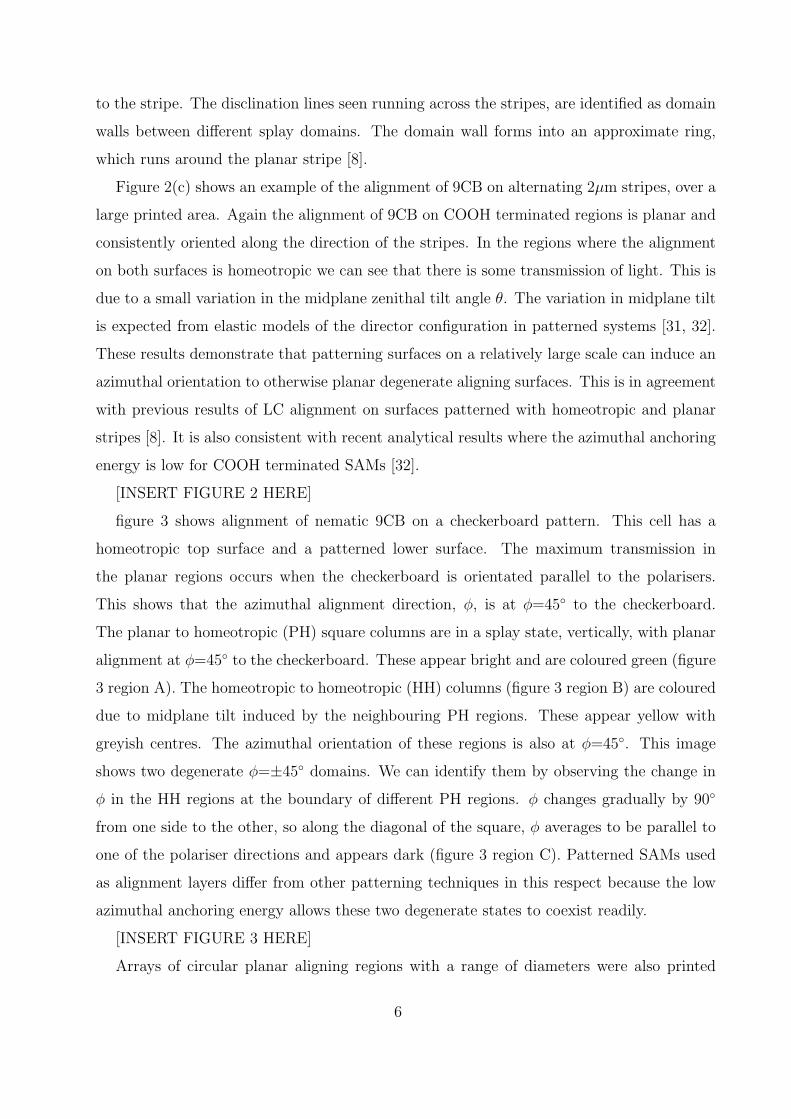
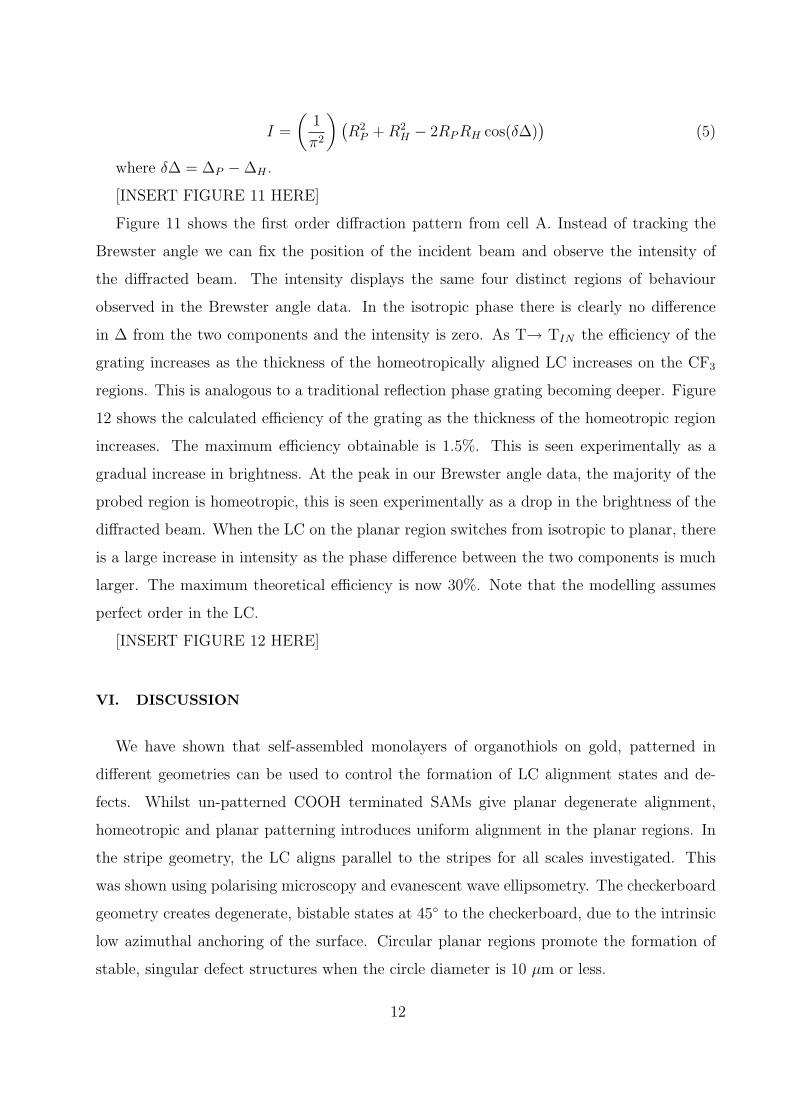
figure 3 shows alignment of nematic 9CB on a checkerboard pattern. This cell has a
homeotropic top surface and a patterned lower surface. The maximum transmission in
the planar regions occurs when the checkerboard is orientated parallel to the polarisers.
This shows that the azimuthal alignment direction, φ, is at φ=45◦ to the checkerboard.
The planar to homeotropic (PH) square columns are in a splay state, vertically, with planar
alignment at φ=45◦ to the checkerboard. These appear bright and are coloured green (figure
3 region A). The homeotropic to homeotropic (HH) columns (figure 3 region B) are coloured
due to midplane tilt induced by the neighbouring PH regions. These appear yellow with
greyish centres. The azimuthal orientation of these regions is also at φ=45◦. This image
shows two degenerate φ=±45◦ domains. We can identify them by observing the change in
φ in the HH regions at the boundary of different PH regions. φ changes gradually by 90◦
from one side to the other, so along the diagonal of the square, φ averages to be parallel to
one of the polariser directions and appears dark (figure 3 region C). Patterned SAMs used
as alignment layers differ from other patterning techniques in this respect because the low
azimuthal anchoring energy allows these two degenerate states to coexist readily.
[INSERT FIGURE 3 HERE]
Arrays of circular planar aligning regions with a range of diameters were also printed
6

using the approach described above. When the diameter of the circles was 20 µm the
ordered fluid associated with each circle generally contained nematic threads (figure 4 a),
similar to the alignment seen in non-patterned samples [11]. As the size of the circles was
reduced to 10 µm, the alignment within the circles became symmetrical, with a regular
defect structure being seen in virtually all circles (figure 4 b). The defects are identified as
S=+1 defects. From the analysis of images of a large number of defects, the ratio of uniform
to non-uniform defects can be assessed. Non-uniform defects are identified as circles which
contain disordered nematic thread like textures. For 20 µm diameter circles, 39% of the
defects were uniform. This increased to 87% uniform defects for 10 µm diameter circles.
Surface patterning thus provides a route to controlling the size and position of these defects,
which could be useful for their study [11, 33].
[INSERT FIGURE 4 HERE]
IV. MONTE CARLO SIMULATIONS
To complement the experimental work on the micron scale described in the previous
section, we have also undertaken a molecular simulation study of liquid crystal anchoring
at nanoscale patterned substrates. In this, we have performed a series of Monte Carlo
simulations of rod-shaped particles confined in slab geometry between two planar walls.
Inter-particle interactions have been modelled through the Hard Gaussian Overlap (HGO)
potential [34]. Here, the dependence of the interaction potential νHGO on ui and uj, the
orientations of particles i and j, and rij, the inter-particle unit vector is
νHGO =
0 if rij ≥ σ(rij, ui, uj)
∞ if rij < σ(rij, ui, uj)
where σ(rij, ui, uj), the contact distance, is given by
σ(rij, ui, uj) = σ0
[1− χ
2
[(rij · ui + rij · uj)
2
1 + χ(ui · uj)
+(rij · ui − rij.uj)
2
1− χ(ui · uj)
]]−1/2
. (1)
7

The parameter χ is set by the particle length to breadth ratio κ= σend/σside via
χ =κ2 − 1
κ2 + 1. (2)
Particle-substrate interactions have been modelled using the hard needle-wall potential
(HNW) [35]. In this, the particles do not interact directly with the surfaces. Rather the
surface interaction is achieved by considering a hard axial needle of length σ0ks placed at
the centre of each particle (see figure 5). This gives an interaction
νHNW =
0 if |zi − z0| ≥ σw(ui)
∞ if |zi − z0| < σw(ui)
where z0 represents the location of a substrate and
σw(ui) =1
2σ0ks cos(θi). (3)
Here, ks is the dimensionless needle length and θi = arccos(ui,z) is the angle between the
substrate normal and the particle’s orientation vector, which also corresponds to the zenithal
Euler angle. For small ks, the homeotropic arrangement has been shown to be stable, whereas
planar anchoring is favoured for long ks [35]. Furthermore, despite its simplicity, the HNW
potential has been found to exhibit qualitatively identical behaviour to that obtained using
more complex particle-substrate potentials [36]. Here, by imposing variation in ks across
one wall, we investigate the effects of molecular-scale substrate patterning.
[INSERT FIGURE 5 HERE]
All simulations were performed using N=864 HGO particles with a length to breadth ra-
tio κ=3. The substrates were separated by a distance Lz = 4κσ0 and located at z0=±Lz/2.
The simulation box lengths in the other directions were determined, for each imposed value
of the dimensionless number density ρ∗, by the relationship Lx=Ly=√
Nσ30/(ρ
∗Lz). Typ-
ical run lengths at each state point were 0.5×10⁶ Monte Carlo(MC) sweeps (where one
sweep represents one attempted move per particle) of equilibration followed by a production
run of 0.5×10⁶ MC sweeps. Each system studied was compressed from the isotropic phase
(ρ∗=0.24) into the nematic (ρ∗ ≥ 0.3) density range by increasing the number density by
∆ρ∗=0.01 after each production run. Analysis was performed by dividing stored system
configurations into 100 equidistant constant-z slices and performing averages of relevant ob-
servables in each slice. This yielded profiles of quantities such as ρ∗(z) from which structural
8
changes could be assessed. Orientational order profiles were also measured, particularly
Qzz(z) =1
N(z)
N(z)∑i=1
(3
2u2
i,z −1
2
)(4)
which measures variation across the confined films of orientational order measured with
respect to the substrate normal. Here N(z) is the instantaneous occupancy of the relevant
slice. For patterned systems, we have also further subdivided the system to assess lateral
inhomogeneities induced by the patterning.
To characterise the behaviour of our simulated systems we show, in Fig 6, the surface
normal order induced in non-patterned or symmetric systems. These data correspond
to the central region of the symmetric systems, Qzz values being averaged over the
middle 50 layers of our systems. For ks = κ = 3, negative mid-film Qzz values are
observed for ρ∗ ≥ 0.3, corresponding to planar anchoring. Conversely, for ks = 0, positive
Qzz values are seen at high density, indicating homeotropic alignment. The onset of
orientational order in the homeotropically anchored system is delayed to higher ρ∗ values
due to the higher degree of particle adsorption achieved by homeotropically aligned systems.
[INSERT FIGURE 6 HERE]
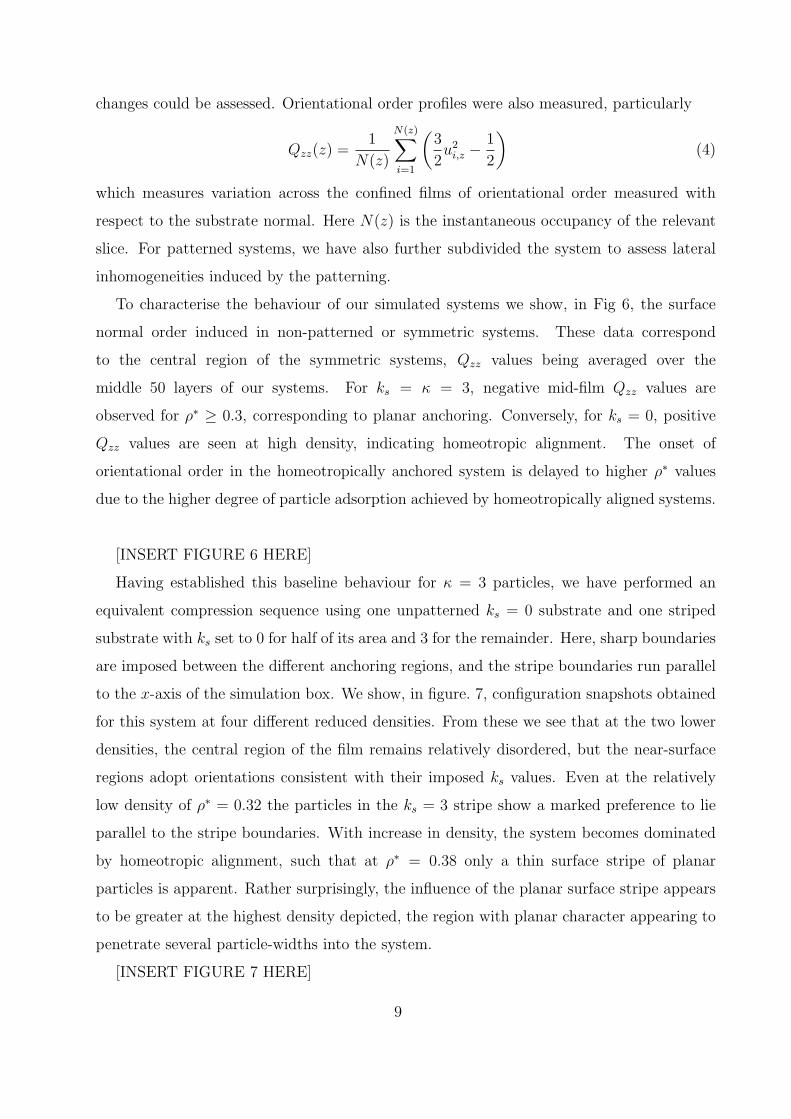
Having established this baseline behaviour for κ = 3 particles, we have performed an
equivalent compression sequence using one unpatterned ks = 0 substrate and one striped
substrate with ks set to 0 for half of its area and 3 for the remainder. Here, sharp boundaries
are imposed between the different anchoring regions, and the stripe boundaries run parallel
to the x-axis of the simulation box. We show, in figure. 7, configuration snapshots obtained
for this system at four different reduced densities. From these we see that at the two lower
densities, the central region of the film remains relatively disordered, but the near-surface
regions adopt orientations consistent with their imposed ks values. Even at the relatively
low density of ρ∗ = 0.32 the particles in the ks = 3 stripe show a marked preference to lie
parallel to the stripe boundaries. With increase in density, the system becomes dominated
by homeotropic alignment, such that at ρ∗ = 0.38 only a thin surface stripe of planar
particles is apparent. Rather surprisingly, the influence of the planar surface stripe appears
to be greater at the highest density depicted, the region with planar character appearing to
penetrate several particle-widths into the system.
[INSERT FIGURE 7 HERE]
9
In order to assess this interpretation more rigorously, we have calculated density and order
parameter profiles for this system. Thus we present, in figure 8 and 9, profiles corresponding
to the two distinct y-ranges defined by the imposed stripe pattern. In figure 8, which
shows these data for particles confined between two homeotropic substrate regions, the
profiles obtained for ρ∗ ≤ 0.39 are indistinguishable from the equivalent data obtained from
simulations with two unpatterned homeotropic substrates. A qualitative difference is seen on
moving to ρ∗ = 0.4, however, since here the value attained in the central section of the Qzz
profile decreases with increase in density for the patterned system, whereas (recall Fig. 6) Qzz
increases monotonically with density for symmetric systems with homogeneous alignment.
The modified orientational behaviour at high density in this region can be explained by
reference to the associated behaviour observed in the second region of the striped substrate
system. Here, increase in density leads to increasingly linear behaviour in the Qzz(z) profile
linking the opposing planar and homogeneous substrates. This increased linearity, associated
with the adoption of uniform director bend in systems with high orientational order, was
noted in a previous investigation by one of the authors of hybrid aligned LC films [35]. We
also note, from figure 7, that, away from the immediate vicinity of the patterned substrate,
the director and density profiles exhibited by this system vary continuously with y rather
than being strictly divided according to the regimes indicated in figure 8 and 9.
[INSERT FIGURE 8 HERE]
[INSERT FIGURE 9 HERE]
V. EVANESCENT WAVE ELLIPSOMETRY
Data in figure 10 show the change in the Brewster angle as a function of temperature
through the nematic-isotropic transition. The diameter of the incident beam was of the
order 1 - 2 mm, significantly greater than the stripe widths, thus the signal at the detector
represents an average over both planar and homeotropic aligning regions. Interestingly, the
simulation results in figure 7 explain how the change in the anchoring at the patterned
surfaces corresponds to the observed change in the Brewster angle, despite the fact that the
simulated system has a periodicity three orders of magnitude smaller.
As the temperature decreases from the isotropic phase, on the right of figure 10, the
increasing Brewster angle indicates the pretransitional growth of a homeotropic film at
10
the surface [25, 26]. The decrease in temperature corresponds to increasing density in the
simulations, figure 7. This film cannot form on the COOH regions so must form on the CF3
regions (figure 7(b)). The average film thickness increases logarithmically as temperature
decreases towards the bulk phase transition, indicating complete orientational wetting at the
patterned surface [25]. The LC on the COOH region should still be isotropic at this point,
because planar anchoring does not wet a COOH isotropic surface [25] but the thickness of this
region decreases close to the bulk transition due to the encroachment of the homeotropically
aligned film from the opposite surface. The peak in the curve indicates that homeotropic
anchoring, in the probed region, dominates as T→ TIN (figure 7(c)), this is the homeotropic
mono-domain. Beyond this peak the curve then falls, as LC on the COOH region switches
from isotropic to planar alignment. The probed region is now a more complex LC structure,
consisting of homeotropic and planar aligned regions (figure 7(d)). The Brewster angle
continues to increase at lower temperatures due to the increasing nematic order parameter,
in both the homeotropic and planar regions. The final values of the Brewster angle for
the two cells are different due to the different alignments of the stripes with respect to the
incident light. This is also consistent with our finding that the planar alignment at the
surface is oriented along the stripes and not orthogonal to them.
[INSERT FIGURE 10 HERE]
Traditional liquid crystal phase gratings employ micropatterned electrodes to create LC
structures which have an alternating pattern of non-switched homeotropic and switched
HAN LC states [37]. These devices are used in transmission mode and the optical phase
shift of the LC above the switchable components is proportional to the voltage applied. In
the EWE experiment the SAM micropatterned surface creates a LC phase grating due to
the difference in the phase of the reflected light from each component, so we can use the
intensity of the diffracted beam to verify the anchoring orientation as the temperature is
varied through the isotropic-nematic transition. A one dimensional optical model was used
to model ellipsometry measurements of the Prism/Au/LC interface. The model is based on
a modified Berreman 4x4 matrix method [38–42].
It can be shown that for a binary phase grating with equal stripe width, the first order
intensity, I, is dependant on the reflection coefficients R, and ellipsometric phase difference
∆ between the two components, labelled P and H, [43].
11
I =
(1
π2
) (R2
P + R2H − 2RP RH cos(δ∆)
)(5)
where δ∆ = ∆P −∆H .
[INSERT FIGURE 11 HERE]
Figure 11 shows the first order diffraction pattern from cell A. Instead of tracking the
Brewster angle we can fix the position of the incident beam and observe the intensity of
the diffracted beam. The intensity displays the same four distinct regions of behaviour
observed in the Brewster angle data. In the isotropic phase there is clearly no difference
in ∆ from the two components and the intensity is zero. As T→ TIN the efficiency of the
grating increases as the thickness of the homeotropically aligned LC increases on the CF3
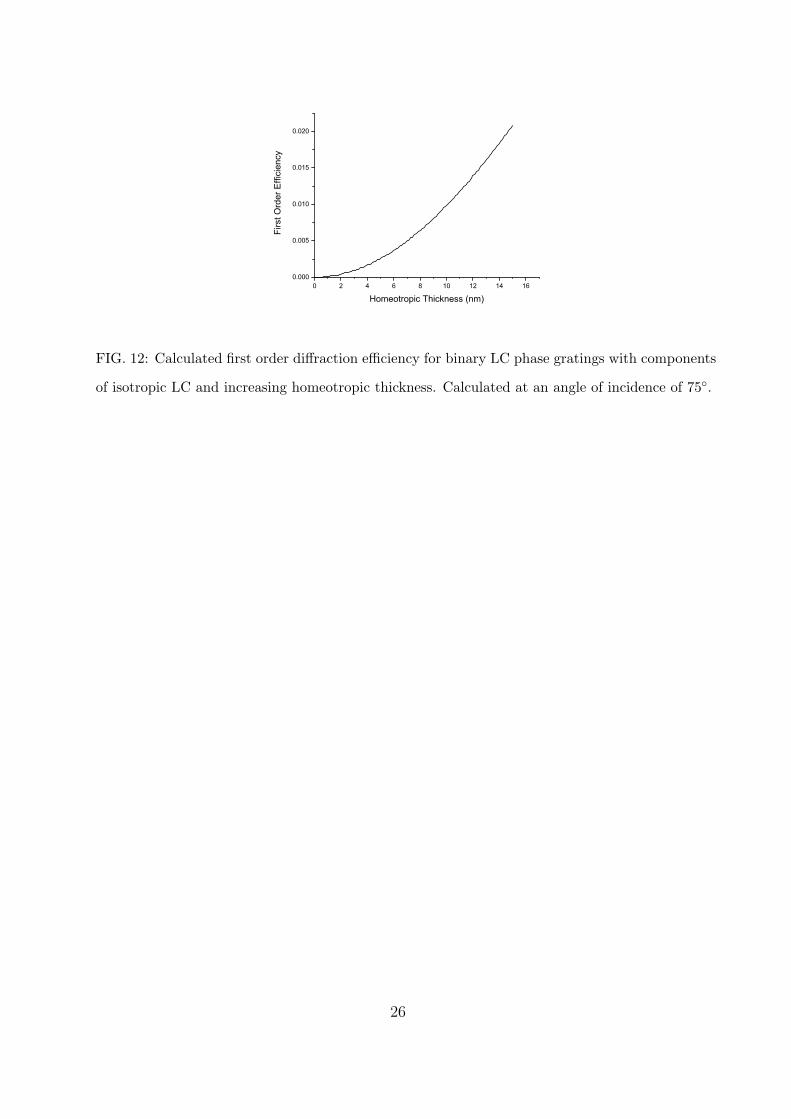
regions. This is analogous to a traditional reflection phase grating becoming deeper. Figure
12 shows the calculated efficiency of the grating as the thickness of the homeotropic region
increases. The maximum efficiency obtainable is 1.5%. This is seen experimentally as a
gradual increase in brightness. At the peak in our Brewster angle data, the majority of the
probed region is homeotropic, this is seen experimentally as a drop in the brightness of the
diffracted beam. When the LC on the planar region switches from isotropic to planar, there
is a large increase in intensity as the phase difference between the two components is much
larger. The maximum theoretical efficiency is now 30%. Note that the modelling assumes
perfect order in the LC.
[INSERT FIGURE 12 HERE]
VI. DISCUSSION
We have shown that self-assembled monolayers of organothiols on gold, patterned in
different geometries can be used to control the formation of LC alignment states and de-
fects. Whilst un-patterned COOH terminated SAMs give planar degenerate alignment,
homeotropic and planar patterning introduces uniform alignment in the planar regions. In
the stripe geometry, the LC aligns parallel to the stripes for all scales investigated. This
was shown using polarising microscopy and evanescent wave ellipsometry. The checkerboard
geometry creates degenerate, bistable states at 45◦ to the checkerboard, due to the intrinsic
low azimuthal anchoring of the surface. Circular planar regions promote the formation of
stable, singular defect structures when the circle diameter is 10 µm or less.
12

Evanescent Wave Ellipsometry has been used to study the N-I transition of nCB on
patterned SAMs for the first time. Building on previous results we see that nCB LCs can wet
homeotropically aligning regions of a surface but not adjacent planar aligning regions. This
is seen on patterned systems as small as 1 µm length scales. A homeotropic mono-domain is
observed on patterned systems prior to the bulk phase transition, however, which causes the
efficiency of the LC phase grating to fall to zero. Despite the significantly different length-
scales involved, the qualitative behaviour seen in MC simulations of generic molecular models
confined using a striped interface is entirely consistent with the experimental observations.
Preliminary EWE experiments on broader stripes of width 10µm show no homeotropic
monodomain around the transition. This suggests that the qualitative behaviour shown by
the MC simulations for molecular-scale patternings continues up to a patterning length-scale
of between 1 and 10µm.
LC phase gratings have the potential to be of general interest as they offer routes to several
different behaviours while remaining a low cost printing technique. The phase gratings are
also switchable if an electric field is applied between the gold films. Further work is now
being undertaken to both examine these affects and investigate the behaviours achievable
from more sophisticated patterning arrangements.
Acknowledgments
This work was supported by the Engineering and Physical Research Council, Grant
Nos. GR/S59826/01 and GR/S59833/01, and the British Council’s Treaty of Windsor
programme. JPB acknowledges Sharp Laboratories of Europe. Ltd. for the provision of
a CASE award.
[1] J. Chen, P. Bos, D. Bryant, D. Johnson, S. Jamal, and J. Kelly, Appl. Phys. Lett. 67, 1990
(1995).
[2] M. Schadt, H. Seiberle, and A. Schuster, Nature 381, 212 (1996).
[3] N. Smith, P. Gass, M. Tillin, C. Raptis, and D. Burbridge, Sharp Technical Journal 24, 5
(2005).
[4] N. Smith, P. Gass, J. Bramble, M. Tillin, and B. Musgrave, Patent No. GB2411735 (2005).
13

[5] M. O’Neill and S. Kelly, J. Phys. D: Appl. Phys. 33, R67 (2000).
[6] S. Varghese, Advanced Materials 16, 1600 (2004).
[7] J.-H. Kim, M. Yoneya, and H. Yokoyama, Nature 420, 159 (2002).
[8] B.-W. Lee and N. Clark, Science 291, 2576 (2001).
[9] T. Scharf, S. Park, C. Padeste, H. Schift, N. Basturk, and J. Grupp, Mol. Cryst. Liq. Cryst.
55, 1619 (2005).
[10] R. Drawhorn and N. Abbott, Journal of Physical Chemistry 99, 16511 (1995).
[11] Y. Cheng, D. Batchelder, S. Evans, J. Henderson, J. Lydon, and S. Ogier, Liquid Crystals 27,
1267 (2000).
[12] T. Wilderbeek, F. van der Meer, K. Feldman, D. Broer, and C. Bastiannsen, Advanced Ma-
terials 14, 655 (2002).
[13] R. Horne, J. Israelachvili, and E. Perez, J. Physique 42, 39 (1981).
[14] B. Jerome, Reports on Progress in Physics 54, 391 (1991).
[15] S. Kumar, J. Kim, and Y. Shi, Phys. Rev. E 94, 077803 (2005).
[16] G. Bryan-Brown, C. Brown, and J. Jones, U.S Patent No. 6,249,332 (2001).
[17] J. Jones, S. Beldon, E. Wood, P. Brett, M. Francis, and M. Goulding, SID Symposium Digest
of Technical Papers 34, 954 (2003).
[18] J. Kim, M. Yoneya, J. Yamamoto, and H. Yokoyama, Appl. Phys. Lett. 78, 3055 (2001).
[19] M. Yoneya, J. Kim, and H. Yokoyama, Appl. Phys. Lett. 80, 374 (2002).
[20] J. Kim, M. Yoneya, and H. Yokoyama, Appl. Phys. Lett. 83 (2003).
[21] F. Lee, B. Zhang, and P. Sheng, Appl. Phys. Lett. 85, 5556 (2004).
[22] I. Bechtold and E. Oliveira, Liquid Crystals 32, 343 (2005).
[23] R. James, F. Fernandez, and S. Day, Mol. Cryst. Liq. Cryst. 422, 209 (2004).
[24] R. James, M. Gardner, F. Fernandez, and S. Day, Mol. Cryst. Liq. Cryst. 450, 105 (2006).
[25] B. Alkhairalla, H. Allinson, N. Boden, S. Evans, and J. Henderson, Phys. Rev. E 59, 3033
(1999).
[26] B. Alkhairalla, N. Boden, E. Cheadle, S. Evans, J. Henderson, H. Fukushima, S. Miyashita,
H. Schonherr, G. Vancso, R. Colorado jr, et al., Europhysics Letters 59, 410 (2002).
[27] V. Gupta and N. Abbott, Langmuir 12, 2587 (1996).
[28] A. Kumar and G. Whitesides, Appl. Phys. Lett. 63, 2002 (1993).
[29] R. Azzam and N. Bashara, Ellipsometry and Polarised Light (North-Holland, Amsterdam,
14

1977).
[30] O. Acher and E. Bigan, Rev. Sci. Instrum. 60, 65 (1989).
[31] G. Barbero, T. Beica, A. Alexe-Ionescu, and R. Moldovan, J. Phys. II 2, 2011 (1992).
[32] T. Atherton and J. Sambles, Phys. Rev. E 74, 022701 (2006).
[33] C. Satiro and F. Moraesa, Eur. Phys. J. E 20, 173 (2006).
[34] P. Padilla and E. Velasco, J. Chem. Phys. 106, 10299 (1997).
[35] D. Cleaver and P. Teixeira, Chem. Phys. Letts. 338, 1 (2001).
[36] F. Barmes and D. Cleaver, Phys. Rev. E 69, 061705 (2004).
[37] C. Brown, E. E. Kriezis, and S. Elston, Journal of Applied Physics 91, 3495 (2002).
[38] D. Berreman, J. Opt. Soc. Am 62, 502 (1972).
[39] H. Wohler, M. Fritsch, G. Haas, and D. Mlynsk, J. Opt. Soc. Am. A 5, 1554 (1988).
[40] P. Yeh, Optical Waves in Layered Media (Wiley, New York, 1988).
[41] H. Wohler, M. Fritsch, G. Haas, and D. Mlynsk, J. Opt. Soc. Am. A 8, 536 (1991).
[42] M. Schubert, Phys.Rev.B 53, 4265 (1996).
[43] M. Margelevicius, V. Grigaliunas, H. Pranevicius, and J. Margelevicius, Applied Mathematical
Modelling 27, 1035 (2003).
15

FIG. 1: Orientation of printing directions for evanescent wave studies
16

(a) (b)
(c)
FIG. 2: Polarising Microscopy images of nematic 9CB aligned on a) a non-patterned COOH
terminated SAM, b) a single stripe 10 µm wide of COOH terminated SAM surrounded by a
homeotropic aligning CF3 terminated SAM and c) 2 µm stripes of COOH and CF3 terminated
SAMS. In the patterned samples the alignment of the planar regions is parallel to the stripe
direction.
17
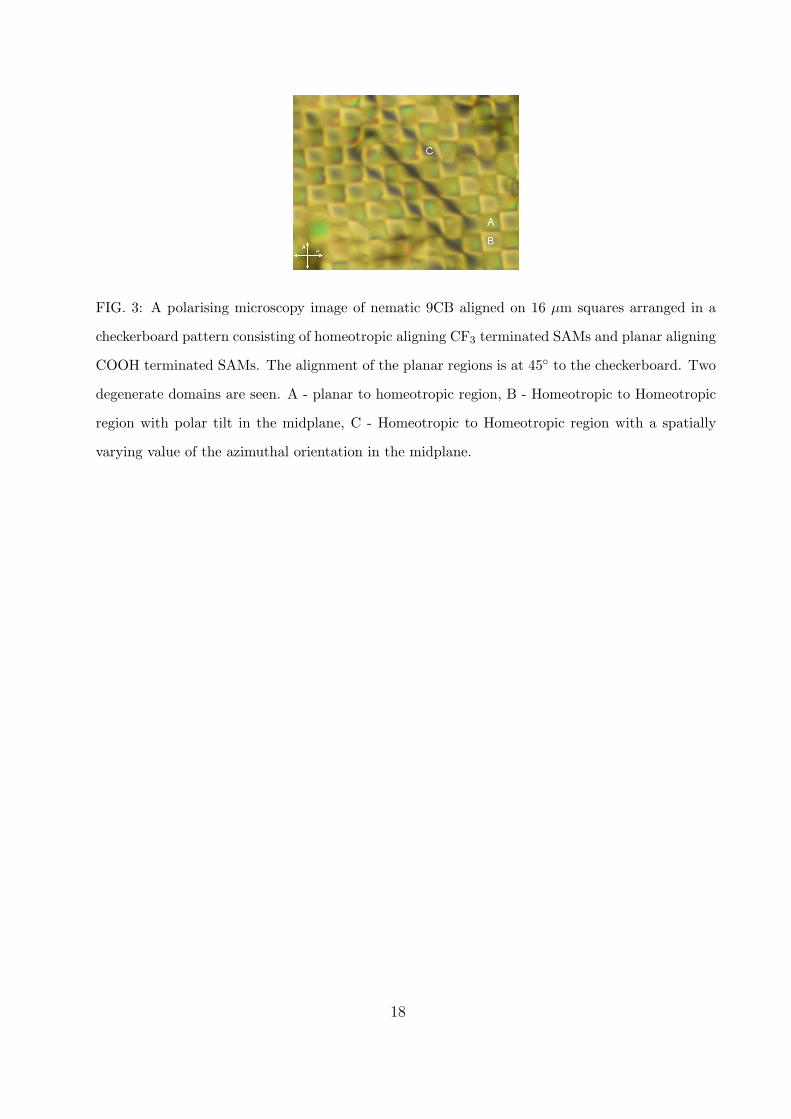
FIG. 3: A polarising microscopy image of nematic 9CB aligned on 16 µm squares arranged in a
checkerboard pattern consisting of homeotropic aligning CF3 terminated SAMs and planar aligning
COOH terminated SAMs. The alignment of the planar regions is at 45◦ to the checkerboard. Two
degenerate domains are seen. A - planar to homeotropic region, B - Homeotropic to Homeotropic
region with polar tilt in the midplane, C - Homeotropic to Homeotropic region with a spatially
varying value of the azimuthal orientation in the midplane.
18

(a) (b)
FIG. 4: Polarising microscopy images of nematic 9CB aligned on circles of planar aligning COOH
terminated SAMs surrounded by homeotropic aligning CF3 SAMs. a) 20 µm circles. b) 10 µm
circles. LC S=+1 defects form in the circles and are more stable as the diameter is reduced to 10
µm.
19
FIG. 5: Schematic representation of the geometry used for the hard needle−wall (HNW)
particle−substrate interaction [35].
20

FIG. 6: Nematic order parameter measured with respect to the substrate normal, Qzz, for sym-
metric systems. Here, data values were averaged over the central 50% of the film width
21

(a)ρ∗ = 0.24 (b)ρ∗ = 0.32 (c)ρ∗ = 0.38 (d)ρ∗ = 0.40
FIG. 7: Configuration snapshots from MC simulations of striped systems at four reduced densities.
Particle colour is used to denote orientation (blue = along z, green = along x, red = along y
.
22
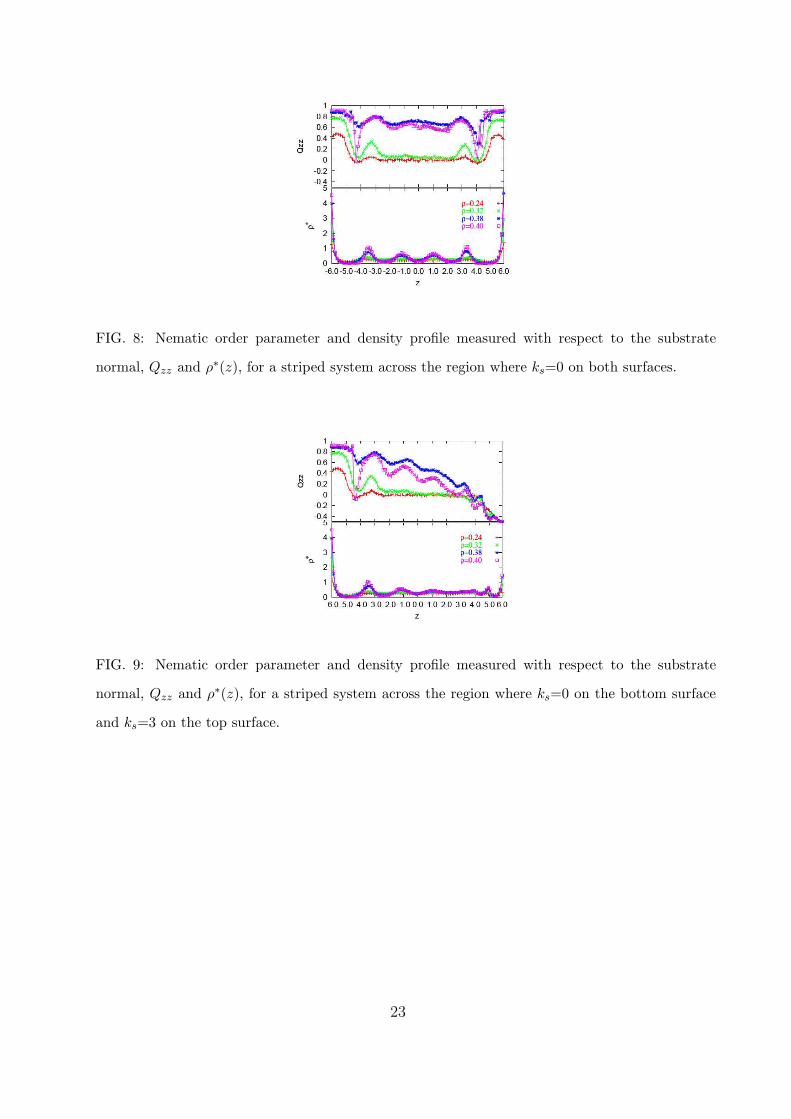
FIG. 8: Nematic order parameter and density profile measured with respect to the substrate
normal, Qzz and ρ∗(z), for a striped system across the region where ks=0 on both surfaces.
FIG. 9: Nematic order parameter and density profile measured with respect to the substrate
normal, Qzz and ρ∗(z), for a striped system across the region where ks=0 on the bottom surface
and ks=3 on the top surface.
23

-4 -2 0 2 4 6 8
0
2
4
6
8
10 Cooling Heating
bb*
T-TIN(K)
(a)
-4 -2 0 2 4 6 8
0
2
4
6
8
10 Cooling Heating
bb*
T-TIN(K)
(b)
FIG. 10: Evanescent Wave Ellipsometry Data for LC/Patterned SAM interface. a) Prism A. b)
Prism B. See 1
24

FIG. 11: First order diffraction pattern from cell A.
25
0 2 4 6 8 10 12 14 160.000
0.005
0.010
0.015
0.020
Firs
t Ord
er E
ffici
ency
Homeotropic Thickness (nm)
FIG. 12: Calculated first order diffraction efficiency for binary LC phase gratings with components
of isotropic LC and increasing homeotropic thickness. Calculated at an angle of incidence of 75◦.
26