Embed Size (px)
DESCRIPTION
Nelson Housing Needs
Citation preview

Report 1HOUSING NEEDS UPDATE
OCTOBER 2014
CITY OF NELSON


EXECUTIVE SUMMARY
––––––––––––––––––––––––––––––––––––––––––––––––––––––––
AN UPDATED HOUSING STRATEGY
This report is one of two reports produced from the 2014 Nelson Affordable Housing study, focusses on “need and demand” for affordable housing in Nelson. It contains:
• A descripEon of a wide range of factors that influence the housing market;
• An idenEficaEon of groups who are least able to access suitable, affordable housing; and,
• A commentary on gaps and issues in the market and non-‐market sectors.
CitySpaces research was conducted between May and September 2014, involving a review of previously completed research, and both in-‐person and telephone interviews. ParEcipants were generous with their Eme and provided many helpful insights.
GROUPS EXPERIENCING GREATEST CHALLENGE IN NELSON’S HOUSING MARKET
Our research idenEfied six groups that have the greatest challenges in finding suitable and affordable housing in Nelson:
At-‐Risk Youth and Young Adults. Many low-‐income youth and young adults in Nelson are experiencing difficulEes with housing affordability. Key to this issue is low-‐income levels due, in part, from low availability of entry level jobs, and the low wages that accompany those that are available. Young adults under the age of 24 have the lowest median incomes in Nelson compared to other age groups. Youth aged 16-‐24 who are at risk of becoming homeless have been able to find shelter at Cicada Place. However, gaps sEll exist in the system for youth who are ready to leave Cicada Place as there are few affordable housing opEons available.
City of Nelson -‐ Affordable Housing Needs Assessment Update -‐ Final Report | October 2014 i

Persons with DisabiliGes. The wait list for suitable housing for persons with disabiliEes has increased since the 2010 Affordable Housing Strategy. This wait list has increased despite the construcEon of a dedicated 33-‐unit building (Anderson Gardens) for low-‐income seniors and people with disabiliEes. Community consultaEon further supports the wait list numbers.
Low-‐income Seniors and Seniors in Rural Areas of Nelson. The demand for affordable housing for seniors has significantly increased over the past 8 years and the number of seniors in Nelson is projected to grow over the coming decade. Median incomes for seniors appear to be quite healthy in Nelson compared to other household groups, and seniors appear to be quite financially healthy in Nelson compared to household groups, and seniors are more likely to accumulate wealth over Eme. That said, seniors earning a fixed income (i.e. pension) are challenged to afford the average market rental prices in Nelson.
The community has reported that seniors living in rural areas in Nelson are experiencing difficulEes with managing their rural properEes, and are also challenged with transportaEon. As a result, seniors living in rural areas are increasingly looking to downsize into smaller units in the urban areas of Nelson. Condominium developments have the potenEal to fill the market gap for seniors who are downsizing. However, this will not apply to all seniors, and a segment of the senior populaEon who cannot afford to purchase will need access to rental suites that are safe, accessible and affordable. Some seniors in rental suites will be able to apply for the SAFER rent subsidy, but will sEll need suitable and appropriate housing to meet their needs.
Low-‐income Families. The City of Nelson has experienced a decrease in the demand for affordable housing for low-‐income families. However, community observaEons indicate that the number of families and children living in poverty in the City is increasing, and affordability calculaEons support these observaEons. Although there is a rent supplement program for low-‐income families (RAP), there are limited family-‐friendly rental opEons that are secure and in good condiEon, and 3-‐bedroom rental units are rare.
In 2010, the Housing Needs Assessment idenEfied a need to assist low to moderate income families in their aaainment of homeownership. Since then, a privately operated Rent-‐To-‐Own program has been introduced into Nelson, and at the Eme of this study had 97 qualified applicants. The largest barrier to achieving housing for these families in the Rent-‐To-‐Own program is the lack of availability of homes with enough bedrooms to accommodate families. QualitaEve research has indicated that duplexes, fourplexes, and town homes would best fill this gap.
Persons with Mental Health and AddicGons Issues. Community observaEons reported a prevalence of persons with mental health and addicEons issues in Nelson. StaEsEcs provided by Stepping Stones for Success supports this observaEon, illustraEng that a high proporEon of individuals who use their services have mental health and addicEons issues (increased from 36% to 52%
ii City of Nelson -‐ Affordable Housing Needs Assessment Update -‐ Final Report | October 2014

between 2006 to 2013). Further, police records also indicate an increase in calls related to mental health issues (20% to 30% year-‐to-‐date). Insufficient housing exists for individuals who both reside in Nelson on a permanent basis for those who travel to Nelson for addicEons treatment at the local hospital. The community idenEfied a shortage of supporEve housing for persons with mental health and addicEons, and a need for detox beds.
People who are Homeless or At-‐Risk of Homelessness. Stepping Stones for Success has recorded an increase in the average length of stay for visitors, from 9.5 days in 2010 to 16 days in 2013. Local food banks (the SalvaEon Army and Our Daily Bread) have also seen an increase in visits over the past decade, with 1-‐in-‐5 visitors being children. These indicators, along with the informaEon provided in the recent Homeless Report Card, and the increasing number of visible homeless (i.e. homeless camp in Railtown), indicates that there is likely a need for more supplements and housing supports for homeless individuals. This need could be much greater than is immediately apparent as hidden homeless are hard to reach and account for.
MAIN HOUSING GAPS
Ten main housing gaps cross over the private and non-‐market housing sectors:
1. Affordable bachelor or one bedroom units that are suitable for singles
2. Independent affordable housing for youth (22+);
3. Youth safe beds or safe home programs for ages 11 -‐ 15;
4. Permanent affordable housing that is accessible and adequate for persons with disabiliEes;
5. Accessible rental and ownership opEons for seniors in the urban areas of Nelson;
6. Affordable family-‐friendly rental units;
7. Lower cost homeownership (small lots, ground-‐oriented mulE-‐units);
8. Dedicated detox beds, possibly in conjuncEon with an addicEons treatment facility;
9. Scaaered site rent supplement programs for persons with mental health issues, and appropriate discharge planning from hospitals/detainment; and,
10. Matching households with rent subsidy programs.
OTHER CONSIDERATIONS
Quality and CondiGon of Rental Housing. Poor housing condiEons were reported in both 2010 and 2014. The updated OCP has a policy in support of Standards of Maintenance Bylaw; however, a regulatory Bylaw has not yet been wriaen. There are community concerns that upgrading older buildings in
City of Nelson -‐ Affordable Housing Needs Assessment Update -‐ Final Report | October 2014 iii

poor condiEon can result in rental increases, evicEons, and a net loss of affordable housing.
Pressure on the Rental Market. The rental market has experienced a very low vacancy rate for several years, but has been alleviated (to a small degree) silng at 2.6%. SEll, the rental market is considered balanced/healthy at a 3% vacancy rate. As such, Nelson’s rental market is experiencing pressure, which coincides with demand and increasing rental prices.
Employment Challenges and Occurrences of Poverty. As of 2010, Nelson sEll had not fully experienced the impact of the recent economic recession. Since 2010, there have been limited job opportuniEes, along with job losses, and the community has indicated that a lack of large employers in the Nelson area along with a conEnual increase in populaEon is causing increased compeEEon for already limited employment resources. The informal economy that has been built on marijuana producEon could also be at stake considering recent regulaEon changes. Although the exact future implicaEons of the regulatory changes are unknown, there is concern in the community that small-‐scale operaEons could destabilize in the future and households could lose their financial independence.
NELSON AFFORDABLE HOUSING STRATEGY
The second report of this study is the updated Nelson Affordable Housing Strategy. The Strategy document responds to the housing needs and gaps idenEfied in this report, outlining potenEal soluEons and acEon items to facilitate change. It also includes examples of housing success stories that deal with similar challenges in comparable communiEes.
iv City of Nelson -‐ Affordable Housing Needs Assessment Update -‐ Final Report | October 2014

TABLE OF CONTENTS
––––––––––––––––––––––––––––––––––––––––––––––––––––––––
INTRODUCTION 1
..................................................................................Project Overview 1
........................................What is an Affordable Housing Strategy? 1
......................................................................The Housing Continuum 2
DEMOGRAPHIC PROFILE 3
......................................................................Demographics Overview 3
................................................................................Population Change 3
..............................................................................................Age Profile 4
...................................................................................Household Types 5
MARKET HOUSING 7
...................................................................Market Housing Overview 7
....................................................................Dwellings and Properties 7
...............................................................................Housing Conditions 9
...................................................................................Housing Tenure 10
.............................................................Residential Building Activity 11
........................................Purpose-‐Built Rental Housing, and Fires 12
........................................................................................Rental Prices 13
....................................................................................Rental Vacancy 15
.....................................................................................Housing Prices 16
...............................................................................Cost of Borrowing 18
THE AFFORDABILITY CONTEXT 19
........................................................................Defining Affordability 19
...........Household Income and Rental Affordability Calculations 19
....................................Homeownership Affordability Calculations 23
.................................................Job types, Wages and Affordability 27
..............................................................................Income Assistance 28
City of Nelson -‐ Affordable Housing Needs Assessment Update -‐ Final Report | October 2014 v

.............................................................................Core Housing Need 29
..................................................................................................Seniors 29
NON-‐MARKET HOUSING 31
........................................................Non-‐Market Housing Overview 31
.............................................................Non-‐Market Housing Supply 31
..............................................................Rent Supplement Programs 33
............................................................Affordable Housing Wait List 34
.....................................................................................Youth Services 36
.............................................Rise in Mental Health and Addictions 37
.............................................................Prevalence of Homelessness 38
HOUSING NEEDS AND GAPS 41
..............................................Affordable Housing Needs in Nelson 41
.......................................................At-‐Risk Youth and Young Adults 41
....................................................................Persons with Disabilities 42
.........Low-‐Income Seniors and Seniors in Rural Areas of Nelson 42
..........................................................................Low-‐Income Families 43
......................Persons with Mental Health and Addictions Issues 44
...............People who are Homeless or At-‐Risk of Homelessness 44
.........................................................................Other Considerations 46
.......................................Quality and Condition of Rental Housing 46
.........................................................Pressure on the Rental Market 46
..................Employment Challenges and Occurrences of Poverty 47
APPENDICES 49
.................................................Appendix A: List of Key Informants 49
..............................Appendix B: List of Key Terms and Definitions 50
...............................................................Appendix C: List of Sources 52
vi City of Nelson -‐ Affordable Housing Needs Assessment Update -‐ Final Report | October 2014

INTRODUCTION
––––––––––––––––––––––––––––––––––––––––––––––––––––––––
PROJECT OVERVIEW
The City of Nelson developed their first Affordable Housing Strategy in 2010, engaging CitySpaces ConsulEng to carry out the research and wriEng of the report, which can be accessed on the City’s website (hap://www.nelson.ca/assets/City~Services/Pubs~and~Reports/Development~Services/2_HousingStrategy.pdf).
Nelson has evolved over the last 4 to 5 years, and undergone several changes regarding housing stock, housing programs, and economic condiEons. In addiEon, new staEsEcs were released including StaEsEcs Canada’s Census and NaEonal Household Survey (2011). In response to these changes, the City of Nelson iniEated an update of their 2010 Affordable Housing Strategy, engaging CitySpaces ConsulEng to idenEfy aspects of housing that have changed, improved, worsened, or stayed the same. The purpose of this study is to idenEfy these changes, as well as idenEfy new and emerging housing needs in Nelson.
WHAT IS AN AFFORDABLE HOUSING STRATEGY?
An Affordable Housing Strategy idenEfies the current and emerging housing needs of a community by examining the housing gaps and issues. It also idenEfies strategic soluEons to meet the community’s unique needs.
This Housing Needs Report Update is the first of two deliverables to be prepared for this project.
• Report #1 -‐ Housing Needs Report Update: This baseline report examines relevant housing data including current housing mix, housing tenure, rental prices, housing sales prices, household income, housing vacancy rates, and affordability analysis. This report also includes a summary of the insights, observaEons and comments obtained from consultaEon with key informants, outlining their housing concerns.
• Report #2 -‐ Affordable Housing Strategy Report Update: The second and final report reflects on the data research and community input,
City of Nelson -‐ Affordable Housing Needs Assessment Update -‐ Final Report | October 2014 1
Above: City of Nelson, BC

summarizing the housing gaps and issues in the City. This report outlines strategies to address housing issues.
The strategic acEons idenEfied in 2010 will be re-‐evaluated against the new and emerging housing needs in the community, and updated to reflect any changes to the housing situaEon over the past 4 to 5 years in Nelson. These Strategies can be found in the Companion Report: Affordable Housing Strategy.
THE HOUSING CONTINUUM
Housing needs and issues are evaluated against the “Housing ConEnuum”. The housing conEnuum is a visual concept that illustrates both market and non-‐market housing. Non-‐market housing refers to housing below market rents or prices, ranging from emergency shelters through various forms of supporEve to rent-‐geared to income (RGI) rentals and housing co-‐operaEves. Moving across the conEnuum to the right is market rental and homeownership housing.
Figure 1: The Affordable Housing Continuum
The mix of market and non-‐market housing varies depending on community, as every community has a unique socio-‐economic make-‐up as well as community-‐specific needs. Residents should have the opportunity to move across the housing conEnuum to find shelter that is most appropriate and best suited to their needs and circumstances, and that meets a sufficient standard of adequacy, suitability, and affordability.
2 City of Nelson -‐ Affordable Housing Needs Assessment Update -‐ Final Report | October 2014
EMERGENCYSHELTER
Homeless Shelters
Safe Houses
TRANSITIONAL SUPPORTIVE
ASSISTED LIVING
Subsidized Rental Housing
with Funded Support Group
Homes
SOCIAL HOUSING
INDEPENDENT LIVING
Subsidized Rental Housing,
Families/Seniors/ Disabled
RENTAL ASSISTANCE PROVIDED IN PRIVATE
MARKET
Rental Assistance
Program (RAP)
Rent Supplements
Grant Aided Family/
Workforce
AFFORDABLE RENTAL
Small Lots/Units
Secondary Suites/Dwellings
Coach/Laneway Housing
Manufactured Homes
Co-operative Housing
LOWER COSTHOME
OWNERSHIP
Rental Housing
at Market Prices
MARKET RENTAL
NON-MARKET MARKET
TYP
ES
FOR
MS
LEVEL OF GOVERNMENT FINANCIAL ASSISTANCEHIGH LOW
Detached Homes
Seasonal Homes
MODERATE & HIGHER COST
HOME OWNERSHIP

DEMOGRAPHIC PROFILE
––––––––––––––––––––––––––––––––––––––––––––––––––––––––
“There are an increasing number of young people and families in need of housing”
– Key Informant Interview, 2014
DEMOGRAPHICS OVERVIEW
Demographics are a key indicator of housing needs in a community as they can help to idenEfy if there is enough residenEal land base to accommodate future populaEon growth. This secEon summarizes Nelson’s populaEon changes of the past and esEmates for the future, and includes household characterisEcs such as family configuraEon and age.
The City of Nelson is situated on Kootenay Lake, within the Selkirk Mountains in the Central Kootenay region. The 2011 Census is the most recent Census data available for this report, and is accompanied by data collected in the voluntary NaEonal Household Survey (NHS), which replaced the previous mandatory long-‐form census quesEonnaire in 2011. Due to the unreliable nature of voluntary return, NHS survey data may not be comparable to Census data. AddiEonal data limitaEons not associated with the NHS are idenEfied throughout this report.
POPULATION CHANGE
In 2011, the City of Nelson had 10,230 residents. Between 2006 and 2011, the City of Nelson experienced a populaEon growth of 10.5% (or 2.1% growth per year), while the surrounding Local Health Area experienced a 7.5% growth. Using BC StaEsEcs’ projected growth rate for the Local Health Area surrounding the City, CitySpaces esEmates that by 2021 there will be approximately 11,150 individuals residing in Nelson. For the coming decades, the projected growth rate for Nelson’s Local Health Area can be idenEfied as low to moderate.
City of Nelson -‐ Affordable Housing Needs Assessment Update -‐ Final Report | October 2014 3
Above: Mountain Lake Seniors Community/Complex Care (front); Mount St. Francis (back)

Figure 2: Nelson and RDCK Future Population Estimates
0
17,500
35,000
52,500
70,000
2001 2006 2011 2016 2021 2026 2031 2036
Nelson RDCK
Source: BC StaJsJcs, P.E.O.P.L.E BriJsh Columbia-‐Level PopulaJon ProjecJons, April 2013
AGE PROFILE
Housing demand can be affected by demographic changes related to age since housing needs ouen change as a result of transiEoning from one stage of life to another.
From 2001 to 2006, a populaEon decrease occurred in all age categories except those aged 45-‐64, and 85 and over (see Figure 3). The 2006 decrease in populaEon in all other age categories is a general trend observed throughout the region during the same Eme period.
In 2011, Census data shows that the City of Nelson reversed several earlier trends, and experienced an increase in populaEon for all age categories, especially in the 15-‐24 and 45-‐64 age brackets (which increased by 670 and 400 individuals, respecEvely). The substanEal increase in the 15-‐24 age group indicates that young adults and young families are returning to Nelson. In 2006, the City, Community Futures, and other economic organizaEons combined efforts to aggressively promote Nelson as a great place to work and raise a family. The post-‐2006 increase in young and working age adults could be a result of these efforts.
4 City of Nelson -‐ Affordable Housing Needs Assessment Update -‐ Final Report | October 2014
Above: Historic housing in Nelson

Figure 3: Population Distribution by Age Groups
0
750
1,500
2,250
3,000
0-‐14 15-‐24 25-‐44 45-‐64 65-‐84 85+
200120062011
Source: StaJsJcs Canada, Census 2001, 2006, 2011
The populaEon projecEons also suggest that residents over the age of 65 will increasingly comprise of a large porEon of the overall populaEon in the City (see Figure 4), a trend that is partly reflecEve of the baby boomer generaEon reaching reErement age.
Figure 4: Age Projections in Nelson
Source: BC StaJsJcs, P.E.O.P.L.E BriJsh Columbia-‐Level PopulaJon ProjecJons (April 2013)
HOUSEHOLD TYPES
Nelson has fewer couples with and without children compared to the rest of BC, and the City is home to substanEally more one-‐person households on average than the rest of the Province. Single-‐person households make up 37% of Nelson’s household types, while the comparaEve number for BC is 28%.
0%
25%
50%
75%
100%
2011 2016 2021 2026 2031 2036
0-‐14 15-‐24 25-‐44 45-‐64 65-‐84 85+
City of Nelson -‐ Affordable Housing Needs Assessment Update -‐ Final Report | October 2014 5
An increase in youth, young adults and families allocates demand for housing suitable to their needs, including affordable studio and one-‐bedroom rental housing for low-‐income single young adults, and rental units, such as townhouses, that offer 2 or 3 bedrooms for families.

Lone parent households are just slightly more common in Nelson, making up 10% of the populaEon, compared to 8% for the province.
Figure 5: Households by Type
Source: BC StaJsJcs, Building Permits by Community, 2013
In 2011, Nelson had an average of 2.2 persons per household, which has remained constant over the past decade. In the 2011 Census, Other Family Households are defined as: one-‐census family households with addiEonal persons and/or mulEple-‐census family households, with or without addiEonal persons. Couple households are inclusive of both married and common law status.
6 City of Nelson -‐ Affordable Housing Needs Assessment Update -‐ Final Report | October 2014
0%
25%
50%
75%
100%
City of Nelson British Columbia
Couples with Children Couples without ChildrenLone Parent Other Family One person Two or more persons
MARKET HOUSING
––––––––––––––––––––––––––––––––––––––––––––––––––––––––
MARKET HOUSING OVERVIEW
This secEon outlines the key factors that describe and influence affordability of market housing in Nelson -‐ demographic change, employment rates, housing prices, the cost of borrowing and, for new housing, the costs of construcEon. The data is presented for Nelson and the Regional District of Central Kootenay (RDCK) where possible, and compared to 2010 staEsEcs where available.
DWELLINGS AND PROPERTIES
Nelson’s housing stock is comprised of a mix of structures, with the predominant form being ground-‐oriented. According to the 2011 Census, 54% of the structural building types in Nelson were single-‐detached houses; 25% apartments under 5 storeys; 10% duplexes; 5% semi-‐detached houses; 4% row houses; and, 2% mobile homes.
Figure 6: Nelson Housing Mix
Source: StaJsJcs Canada, Census 2011
2%4%
5%
10%
25%54%
Single-‐Detached Apartments < 5 Storeys DuplexesSemi-‐Detached Rowhomes Mobile Homes
City of Nelson -‐ Affordable Housing Needs Assessment Update -‐ Final Report | October 2014 7
Above: The Graine, Nelson
Above: Radio Seven (Radio Avenue, Nelson)

Between 2006 and 2011, building types in Nelson that have increased as a proporEon of the total housing stock include: apartments buildings under 5 storeys (+3%); semi-‐detached (+2%); and, row houses and duplexes (both +1%). The amount of moveable homes within Nelson has not changed, remaining at 2%. The increase in the proporEon of mulE-‐unit dwellings decreases the overall proporEon of single-‐detached dwellings from 59% (in 2006) to 54% in 2011. Nelson does not have any apartment buildings over 5 storeys.
Figure 7: Nelson Housing Mix Change Between 2006 to 2011
Source: StaJsJcs Canada, Census 2006, 2011
In Nelson, the most common residents of single detached dwellings are between the ages of 45 and 64, with the second most common residents being individuals aged 0-‐19, most of which are likely children living with their parents (see Figure 8). Some of these children are likely living with parents between the ages of 30-‐44 who comprise of the third largest group of individuals living in single detached homes.
Residents aged 20-‐29 are just as likely to be living in mulE-‐family housing as they are to be living in a single detached dwelling, although a significant porEon of this age group also inhabits a combinaEon of duplexes and semi-‐detached. Residents of duplexes and semi-‐detached housing in Nelson are more commonly found to be between the ages of 0-‐44, than in any other age groups.
Because there are far fewer individuals who make up the 65-‐79 age group, they inhabit far fewer single-‐detached homes overall. Individuals 80+ are generally evenly split between living in single detached homes and apartments.
8 City of Nelson -‐ Affordable Housing Needs Assessment Update -‐ Final Report | October 2014
Multi-‐unit housing, such as low-‐rise apartments, fourplexes and duplexes, have gained a higher proportion of the housing stock since the last housing assessment in Nelson.
0%
15%
30%
45%
60%
Single-‐detached
Semi-‐detached
Rowhome
Duplex
Apartment, < 5
storeys
Mobile homes
20062011

Figure 8: Nelson Housing Mix Change by Age of Resident, 2011
Source: StaJsJcs Canada, Census -‐ Focus on Geography Series 2011
Table 1: Residents by Age and Dwelling Type for the City of Nelson, 2011
Source: StaJsJcs Canada, Census -‐ Focus on Geography Series 2011
HOUSING CONDITIONS
Census data from 2011 show that almost half (49%) of Nelson’s housing stock was built before 1960, with 24% built between the years 1961 and 1980. These figures indicate that approximately 73% of the total housing stock is more than 35 years, with at least half of that stock being older than 55 years old. While just under 13% of the total housing stock in Nelson was idenEfied by the NaEonal Household Survey as needing major repairs (the provincial average is approximately 8%), there were 385 new, private dwellings (just over 8%)
City of Nelson -‐ Affordable Housing Needs Assessment Update -‐ Final Report | October 2014 9
0
600
1,200
1,800
2,400
3,000
0-‐19 20-‐29 30-‐44 45-‐64 65-‐79 80+
Single Detached Moveable Semi DetachedRow Duplex Apartment (under 5 storeys)
Age Single-‐detached house
Movable dwelling
Semi-‐detached house
Row House / Townhouse
Duplex Apartment less than five storeys
Total -‐ Structural type of dwelling
0-‐19
20-‐29
30-‐44
45-‐64
65-‐79
80+
1,485 25 140 115 230 235 2,230
600 20 80 35 160 305 1,200
1,305 30 130 90 280 335 2,170
1,945 65 130 110 215 480 2,945
615 20 15 35 40 205 930
225 10 10 10 20 200 465

constructed between the years of 2006 and 2011. When compared to the provincial average, the housing stock in Nelson is substanEally older and in need of more repair.
Figure 9: Age of Housing, Nelson and BC, 2011
Source: StaJsJcs Canada, NaJonal Household Survey 2011
ObservaEons from the community revealed that there are occurrences of substandard rental housing in Nelson. Poor condiEons were characterized as including mold, bed bugs, no heaEng, faulty plumbing, and overcrowding. Equally of concern in the community is the potenEal for “reno-‐vicEons”, whereby older housing stock in need of major repair is improved and, as a result, rent prices increase and become unaffordable for low-‐income tenants.
The community reported a lack of incenEves for landlords to upkeep their rental properEes. Further, key informants suggested that renters have limited alternaEves to living in housing of poor condiEons, as ouen the lower quality stock is rented at or near the same price as higher quality rental stock, due to demand.
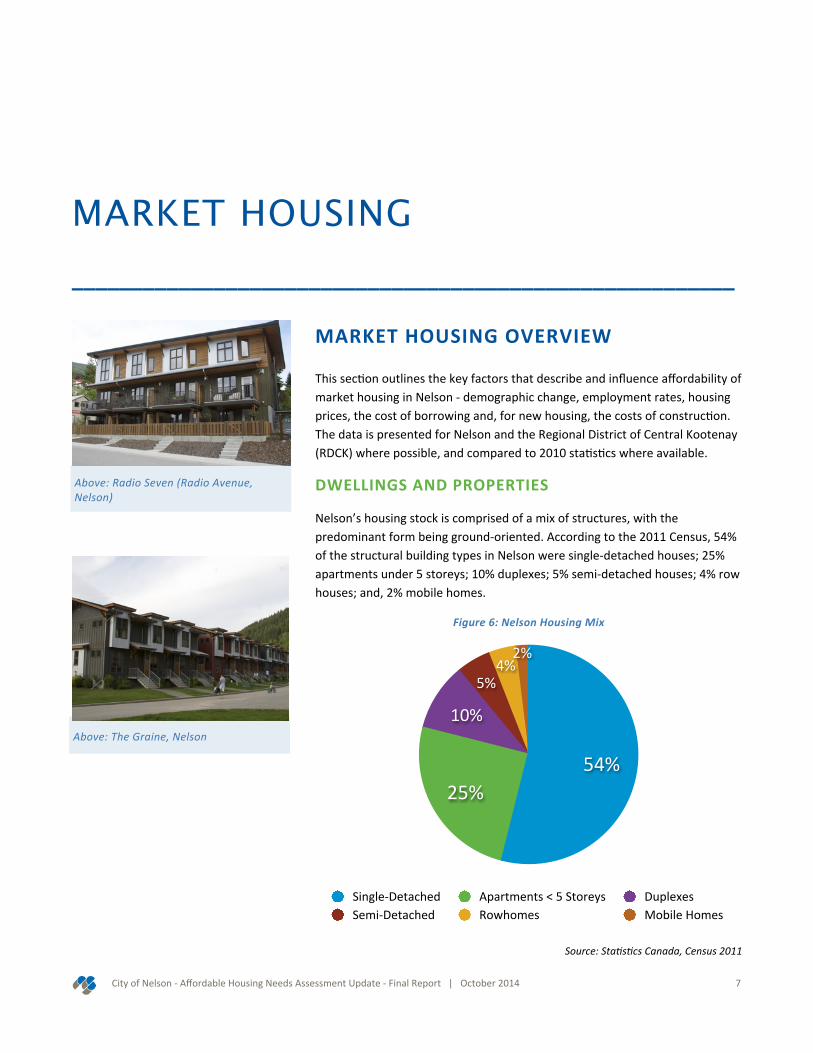
HOUSING TENURE
Nelson is a city of mixed tenure: 63% owners and 37% renters. Despite the increase in overall dwelling counts in Nelson (4160 in 2006, and 4630 in 2011) the percentage of renters to owners has remained constant. As of 2011, there is a higher percentage of renters in Nelson when compared to the rest of BriEsh Columbia (provincially, 30% of residents are renters).
10 City of Nelson -‐ Affordable Housing Needs Assessment Update -‐ Final Report | October 2014
0%
25%
50%
75%
100%
Nelson British Columbia
1960 or before 1961 -‐ 1980 1981 -‐ 1990 1991 -‐ 20002001 -‐ 2005 2006 -‐ 2011
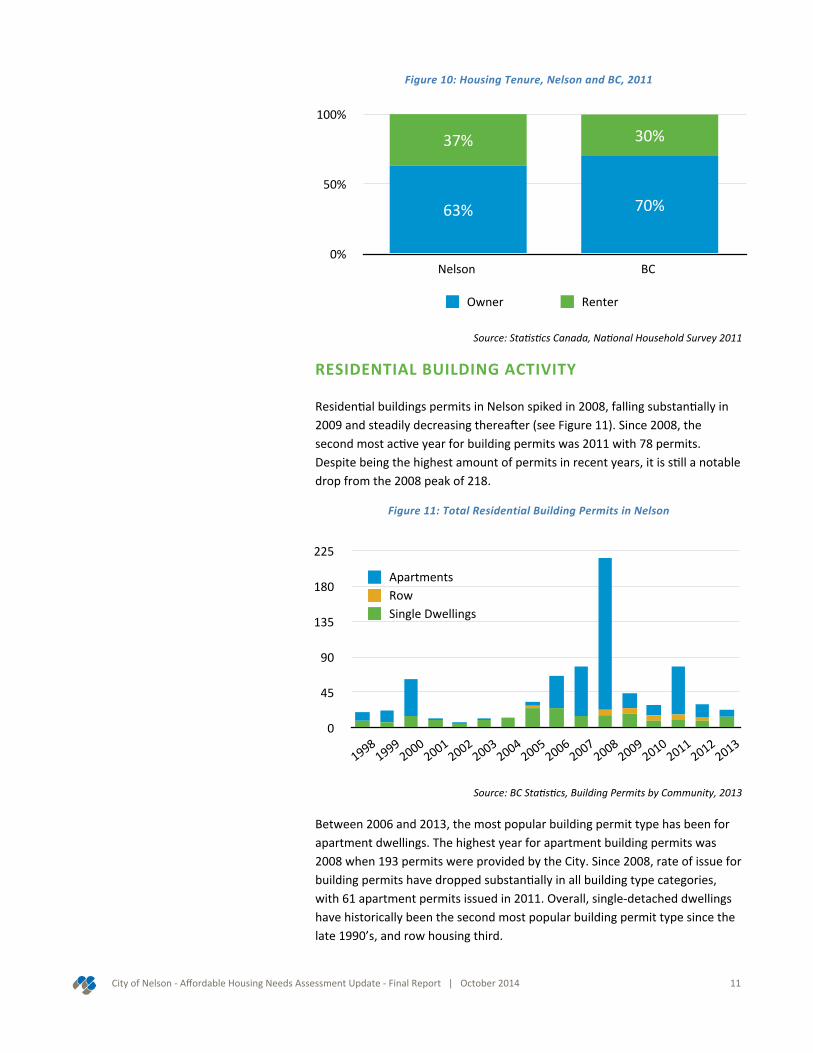
Figure 10: Housing Tenure, Nelson and BC, 2011
Source: StaJsJcs Canada, NaJonal Household Survey 2011
RESIDENTIAL BUILDING ACTIVITY
ResidenEal buildings permits in Nelson spiked in 2008, falling substanEally in 2009 and steadily decreasing thereauer (see Figure 11). Since 2008, the second most acEve year for building permits was 2011 with 78 permits. Despite being the highest amount of permits in recent years, it is sEll a notable drop from the 2008 peak of 218.
Figure 11: Total Residential Building Permits in Nelson
Source: BC StaJsJcs, Building Permits by Community, 2013
Between 2006 and 2013, the most popular building permit type has been for apartment dwellings. The highest year for apartment building permits was 2008 when 193 permits were provided by the City. Since 2008, rate of issue for building permits have dropped substanEally in all building type categories, with 61 apartment permits issued in 2011. Overall, single-‐detached dwellings have historically been the second most popular building permit type since the late 1990’s, and row housing third.
City of Nelson -‐ Affordable Housing Needs Assessment Update -‐ Final Report | October 2014 11
0%
50%
100%
Nelson BC
30%37%
70%63%
Owner Renter
0
45
90
135
180
225
1998199
9200
0200
1200
2200
3200
4200
5200
6200
7200
8200
9201
0201
1201
2201
3
Single Dwellings Row Apartments

PURPOSE-‐BUILT RENTAL HOUSING, AND FIRES
The Canada Mortgage and Housing CorporaEon (CMHC) collects and publishes semi-‐annual data (one report in the spring and one in the fall) for municipaliEes throughout the province. While these staEsEcs are someEmes criEcized as lagging behind the market, CMHC’s methodology has been consistent over many years.
Figure 12: Rental Housing Stock by Number of Bedrooms in Nelson
Source: CMHC, Market Rental Reports, Spring 2014
In Nelson, the total number of rental units have been inconsistently reported by CMHC over the past five to seven years, and the only recently available data is from 2013 and 2014. The Spring 2014 report idenEfied one and two-‐bedroom units as making up the largest share of the rental market, at 49% and 14% respecEvely. Three bedroom rental units were the least common, with only 10 units reported in the spring of 2014 (see Figure 12).
The CMHC 2014 Spring Market Rental Report shows that over the course of 1 year (from 2013 to 2014), the City of Nelson experienced a net loss of total rental units, from 518 to 509. Some of these unit loses may be the result of the Kerr Fire, which destroyed 32 units and displaced 75 residents, many of whom were reportedly low-‐income households. It is important to note that the Kerr building was not dedicated as non-‐market housing; however, was an older building with relaEvely affordable rents and a home to a number of low-‐income residents.
Social service agencies and local non-‐profit groups assisted residents in the immediate auermath, including housing some residents at local hotels for the short-‐term. The Kerr Apartment fire was a loss of affordable market rental units in Nelson, and is unaccounted for in the reported rental housing stock.
12 City of Nelson -‐ Affordable Housing Needs Assessment Update -‐ Final Report | October 2014
2%
49%35%
14%Bachelor1 Bedroom2 Bedroom3+ Bedroom
Above: Kerr Apartments burnt down in 2011, resulting in a loss of 32 affordable market rental units in Nelson. (Photo Credit: The Nelson Post)
Above: Today, the site of the old Kerr Apartments remains vacant and fenced

Today, the site of the Kerr Apartments remains vacant and fenced. It is a prime vacant site in Nelson located in the downtown and close to transit, services, ameniEes, Selkirk College (downtown campus), and Ward Street Place, which is a rental site operated by Nelson CARES Society comprised of SRO’s and three bedroom apartment housing.
Figure 13: Total Number of Rental Units in Nelson
0
75
150
225
300
Bachelor 1 Bedroom 2 Bedroom 3+ Bedroom
20132014
Source: CMHC, Market Rental Reports, Spring 2014
RENTAL PRICES
Rental lisEngs were captured in 2 ways: first, obtaining the average market rents from Canada Mortgage and Housing CorporaEon (CMHC) rental reports; second, obtaining a rental ‘snapshot’ from local rental lisEngs.
As per CMHC’s data, since 2009 the average monthly rents in Nelson have increased for all apartment suite types (bachelor, one bedroom, and two bedroom units). The recorded increases were all less than $100 per month. Added over the course of a year, renters would experience an increase of over $550 more per year for a bachelor unit, $840 more per year for a one-‐bedroom unit, and nearly $1,000 more per year for a two-‐bedroom unit. Data was unavailable for 3+ bedroom units in 2013.
City of Nelson -‐ Affordable Housing Needs Assessment Update -‐ Final Report | October 2014 13
“I came to Nelson in 2006 before retirement, and was able to afford a rental for about $405/month. I left Nelson to work in 2008, returning to Nelson in 2013; when I returned the suite I previously rented was $620 per month.”
-‐ Shared experience by a Key
Informant interview (2014)
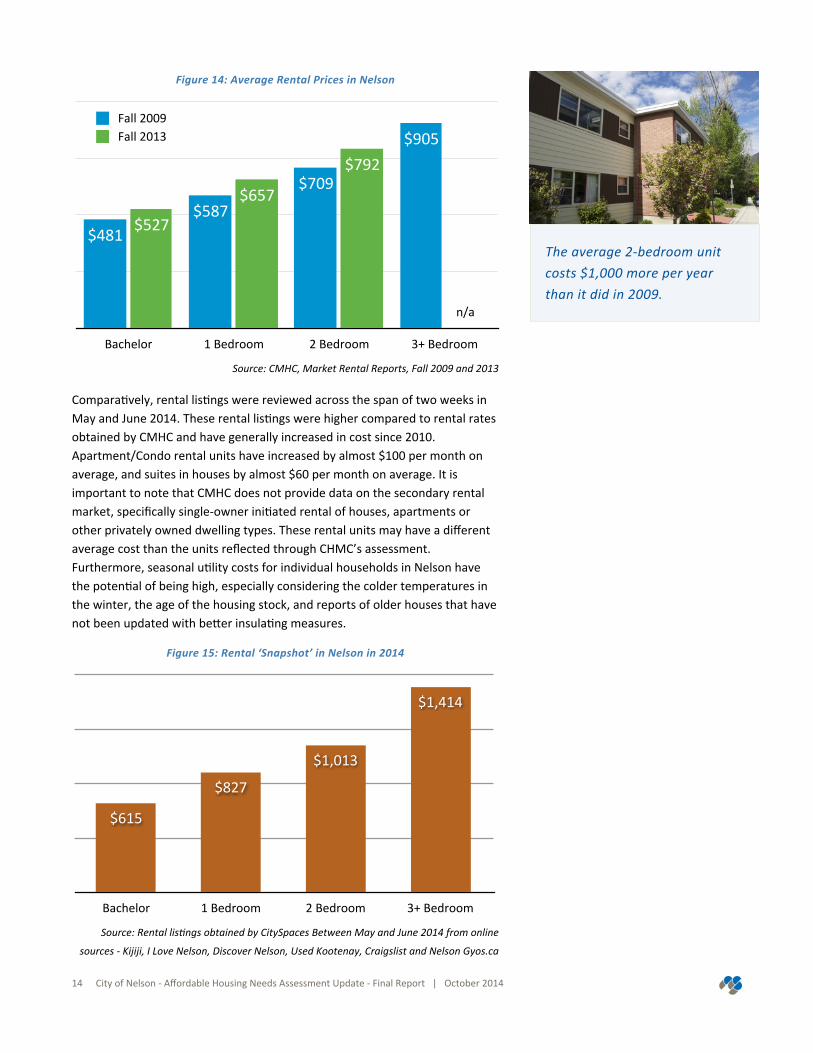
Figure 14: Average Rental Prices in Nelson
Bachelor 1 Bedroom 2 Bedroom 3+ Bedroom
$792
$657
$527
$905
$709
$587$481
Fall 2009Fall 2013
Source: CMHC, Market Rental Reports, Fall 2009 and 2013
ComparaEvely, rental lisEngs were reviewed across the span of two weeks in May and June 2014. These rental lisEngs were higher compared to rental rates obtained by CMHC and have generally increased in cost since 2010. Apartment/Condo rental units have increased by almost $100 per month on average, and suites in houses by almost $60 per month on average. It is important to note that CMHC does not provide data on the secondary rental market, specifically single-‐owner iniEated rental of houses, apartments or other privately owned dwelling types. These rental units may have a different average cost than the units reflected through CHMC’s assessment. Furthermore, seasonal uElity costs for individual households in Nelson have the potenEal of being high, especially considering the colder temperatures in the winter, the age of the housing stock, and reports of older houses that have not been updated with beaer insulaEng measures.
Figure 15: Rental ‘Snapshot’ in Nelson in 2014
Bachelor 1 Bedroom 2 Bedroom 3+ Bedroom
$1,414
$1,013
$827
$615
Source: Rental lisJngs obtained by CitySpaces Between May and June 2014 from online
sources -‐ Kijiji, I Love Nelson, Discover Nelson, Used Kootenay, Craigslist and Nelson Gyos.ca
14 City of Nelson -‐ Affordable Housing Needs Assessment Update -‐ Final Report | October 2014
The average 2-‐bedroom unit costs $1,000 more per year than it did in 2009.
n/a

Figure 16: Rental Snapshot in Nelson from 2010 to 2014
Apt/Condo Suite in House Duplex House/Cottage
$1,303
$1,125
$915$901
$1,242
$0
$857$807
20102014
Duplex
Source: Rental lisJngs obtained by CitySpaces Between May and June, 2014 from online
sources -‐ Kijiji, I Love Nelson, Discover Nelson, Used Kootenay, Craigslist and Nelson Gyos.ca
RENTAL VACANCY
Typically, the rental market experiences pressure when vacancy rates are less than 3%. In 2009, vacancy rates hovered below 1.5%. Since then, the vacancy rates have increased, releasing some of the pressure on the rental market, and increasing the availability of rental units to renters. During the months of April 2014, the vacancy rate for a bachelor unit was 4.3%, 2.3% for one-‐bedroom units, and 2.4% for two-‐bedroom units.
Figure 17: Vacancy Trends in Nelson
2008 2009 2013 2014
0.8%1.1%
2.3%2.6%
Total Vacancy for all Rentals
Source: CMHC, Market Rental Reports, Spring 2009 and 2014
City of Nelson -‐ Affordable Housing Needs Assessment Update -‐ Final Report | October 2014 15
While the rental ‘snapshot’ is inherently limited, it does indicate that rental prices may, on average, be increasing in recent months. One bedroom units cost 22% more on average compared to rental listings reported by CMHC.
n/a
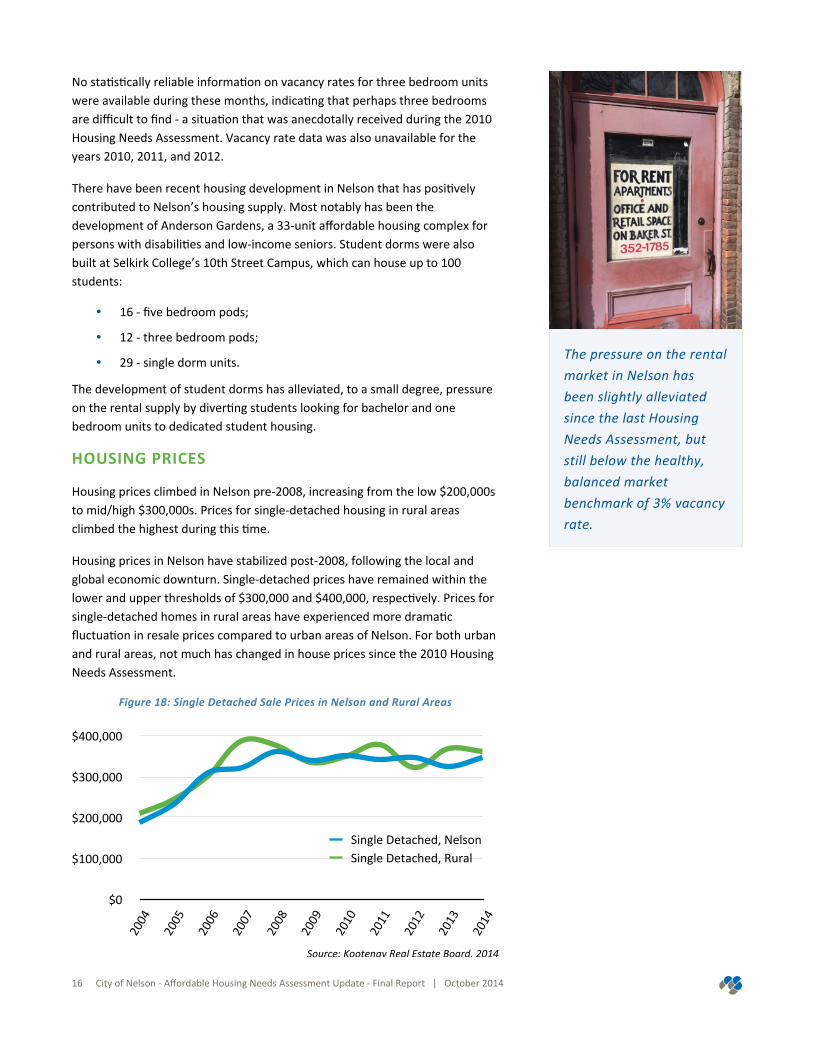
No staEsEcally reliable informaEon on vacancy rates for three bedroom units were available during these months, indicaEng that perhaps three bedrooms are difficult to find -‐ a situaEon that was anecdotally received during the 2010 Housing Needs Assessment. Vacancy rate data was also unavailable for the years 2010, 2011, and 2012.
There have been recent housing development in Nelson that has posiEvely contributed to Nelson’s housing supply. Most notably has been the development of Anderson Gardens, a 33-‐unit affordable housing complex for persons with disabiliEes and low-‐income seniors. Student dorms were also built at Selkirk College’s 10th Street Campus, which can house up to 100 students:
• 16 -‐ five bedroom pods;
• 12 -‐ three bedroom pods;
• 29 -‐ single dorm units.
The development of student dorms has alleviated, to a small degree, pressure on the rental supply by diverEng students looking for bachelor and one bedroom units to dedicated student housing.
HOUSING PRICES
Housing prices climbed in Nelson pre-‐2008, increasing from the low $200,000s to mid/high $300,000s. Prices for single-‐detached housing in rural areas climbed the highest during this Eme.
Housing prices in Nelson have stabilized post-‐2008, following the local and global economic downturn. Single-‐detached prices have remained within the lower and upper thresholds of $300,000 and $400,000, respecEvely. Prices for single-‐detached homes in rural areas have experienced more dramaEc fluctuaEon in resale prices compared to urban areas of Nelson. For both urban and rural areas, not much has changed in house prices since the 2010 Housing Needs Assessment.
Figure 18: Single Detached Sale Prices in Nelson and Rural Areas
$0
$100,000
$200,000
$300,000
$400,000
2004
2005
2006
2007
2008
2009
2010
2011
2012
2013
2014
Single Detached, Nelson Single Detached, Rural
Source: Kootenay Real Estate Board, 2014
16 City of Nelson -‐ Affordable Housing Needs Assessment Update -‐ Final Report | October 2014
The pressure on the rental market in Nelson has been slightly alleviated since the last Housing Needs Assessment, but still below the healthy, balanced market benchmark of 3% vacancy rate.

The most stable resale prices in Nelson are single-‐detached homes, which achieved an average resale price of approximately $360,000 in 2008 and have not fallen below $325,000 (2013) since then. Duplexes have varied in price over the last 10 years in comparison to other housing types, decreasing significantly in 2009 but recovered quickly and, in 2014, achieved a higher resale price ($364,600) than all other building types, houses included.
Significant variaEons in yearly average resale value were seen in both duplexes and townhouses, which is likely due in part to the smaller percentage of stock of both building types within the City, and the greater impact of each individual sale on the yearly average. Despite increasing the amount of condominiums or apartments as a percentage of the Nelson housing stock, the average resale price of this building type conEnues to climb steadily.
Figure 19: Average Sale Prices by Housing Type
Source: Kootenay Real Estate Board, 2014
City of Nelson -‐ Affordable Housing Needs Assessment Update -‐ Final Report | October 2014 17
Interest rates are a typical indicator for cost of borrowing. However, amortization rates have recently changed from a maximum of 35 years, down to 30 years, and again down to 25 years. This impacts a household’s ability to borrow, as demonstrated in the housing affordability calculations found later in this report
$0
$100,000
$200,000
$300,000
$400,000
2004 2005 2006 2007 2008 2009 2010 2011 2012 2013 2014
Single detached, Nelson Condo / Apartment, Nelson Townhome, Nelson Duplex, Nelson

COST OF BORROWING
The cost of borrowing in the past few years has been some of the lowest rates in recent history. The most popular term for borrowing is a 5-‐year fixed rate. The average mortgage rate in 2013 was 4.00% -‐ a new historic low, which has aaracted new potenEal home-‐buyers into the homeownership market. In 2014, interest rates reached 3.79%.
Figure 20: Bank of Canada Mortgage Rates
0%
5%
10%
15%
20%
1978 1983 1988 1993 1998 2003 2008 2013
Mortgage Rate
Source: Bank of Canada, 2013
18 City of Nelson -‐ Affordable Housing Needs Assessment Update -‐ Final Report | October 2014

THE AFFORDABILITY CONTEXT
––––––––––––––––––––––––––––––––––––––––––––––––––––––––
DEFINING AFFORDABILITY
Affordability is the relaEonship between household median income, and the esEmated income available for either purchasing a home, or renEng a place to live. Using CMHC’s standards, housing is considered unaffordable if a household spends 30% or more of its gross income on shelter costs. Households spending greater than 50% of their gross income on shelter fall below the housing standard of affordability, and are considered to be in core housing need.
For renters, shelter costs includes rent and any payments for electricity, water, and other municipal services. For owners, shelter costs include mortgage payments (principal and interest), property taxes, condominium/strata fees (if any), and payments for electricity, water, and other municipal services.
HOUSEHOLD INCOME AND RENTAL AFFORDABILITY CALCULATIONS
Household income, when compared to rental and purchase prices, is ouen used to determine what households can afford to rent or purchase in a community. The median income data used is based on taxfiler-‐reported income sources (obtained from StaEsEcs Canada), and is considered to be a more accurate reflecEon of income levels compared to other sources. Median income means that half the populaEon are making more than the median income, and half the populaEon are making below the median income.
Between the 2009 and 2011 taxfiler-‐reports, the median income levels in Nelson have remained constant.
City of Nelson -‐ Affordable Housing Needs Assessment Update -‐ Final Report | October 2014 19
Housing is considered unaffordable if a household spends greater than 30% towards shelter costs

Table 2: Households by Median Income in Nelson, 2009 and 2011 Comparison
Household Type
20092009 20112011
Household Type% of
HouseholdsMedian Income
% of Households
Median Income
Couple Families 48% $73,100 48% $72,180
Single Parent Families 10% $30,300 9% $32,310
Single Individuals 42% $23,300 43% $23,480
Source: StaJsJcs Canada, Taxfiler Reported Custom TabulaJon Family Tables, 2009/2011
The next series of tables illustrates household median income levels by age groups and household types, and the amount of rent they can afford at 30% of their gross income.
The first table is rental affordability for couple households. This group has relaEvely high median income levels compared to single parents and single individuals. Couples under the age of 24 have the lowest median income levels compared to older adults, and have less income available towards rent and other shelter costs ($789 per month). Middle-‐aged couples earning the median income (45 to 54 years old) have 3 Emes the amount of spending power as couples under the age of 24, and can afford higher rental prices ($2,372 per month). By far, couples as a whole have the most choice in the Nelson rental market compared to other household types.
Table 3: Rental Affordability by Age for Couple Households in Nelson
Age Median Annual Income
Income Available Monthly
Available for Rent @ 30%
0 to 24 $31,570 $2,631 $789
25 to 34 $56,930 $4,744 $1,423
35 to 44 $70,080 $5,840 $1,752
45 to 54 $94,890 $7,908 $2,372
55 to 64 $83,350 $6,946 $2,084
65+ $47,930 $3,994 $1,198
All Couples $64,125 $5,344 $1,603
Source: CitySpaces ConsulJng CalculaJons referencing StaJsJcs Canada, Taxfiler Reported Custom TabulaJon Family Tables, 2009/2011
Single parent households have much lower median income levels compared to couple households, and for most age groups earn half as much as couples earn. They have less income available towards housing -‐ $431 per month for a
20 City of Nelson -‐ Affordable Housing Needs Assessment Update -‐ Final Report | October 2014
Low-‐income single parents are challenged to afford average rental market prices while remaining within the “30% affordability threshold”, which can reduce their ability to afford other living costs such as transportation, groceries, after-‐school programs for kids, or recreational activities

young single parent under the age of 24, and $748 per month for a single parent between the age of 25 to 44. That said, rental units can range in price, depending on housing condiEons and number of bedrooms. The most challenged households would be those who earn less than the median income in the respecEve age groups (low-‐income).
Table 4: Rental Affordability by Age for Single Parent Households in Nelson
Age Median Annual Income
Income Available Monthly
Available for Rent @ 30%
0 to 24 $17,220 $1,435 $431
25 to 34 $22,600 $1,883 $565
35 to 44 $29,900 $2,492 $748
45 to 54 $38,220 $3,185 $956
55 to 64 $51,280 $4,273 $1,282
65+ $55,390 $4,616 $1,385
All Single Parents $35,768 $2,981 $894
Source: CitySpaces ConsulJng CalculaJons referencing StaJsJcs Canada, Taxfiler Reported Custom TabulaJon Family Tables, 2009/2011
The next table illustrates rental affordability for single person households. In Nelson, single people have the lowest median income compared to couples and single parents, and have the least choice in the rental market. At 30% of their incomes, single persons earning the median income or more could afford $577 per month towards housing. For young adults under the age of 24, they can afford $316 per month.
Table 5: Rental Affordability by Age for Single Person Households in Nelson
Age Median Annual Income
Income Available Monthly
Available for Rent @ 30%
0 to 24 $12,650 $1,054 $316
25 to 34 $23,070 $1,923 $577
35 to 44 $24,530 $2,044 $613
45 to 54 $24,930 $2,078 $623
55 to 64 $27,530 $2,294 $688
65+ $25,770 $2,148 $644
All Single Persons $23,080 $1,923 $577
Source: CitySpaces ConsulJng CalculaJons referencing StaJsJcs Canada, Taxfiler Reported Custom TabulaJon Family Tables, 2009/2011
City of Nelson -‐ Affordable Housing Needs Assessment Update -‐ Final Report | October 2014 21
Single people living on their own in Nelson have the lowest median income and the least choice in the rental market compared to couples and single parents

The affordability calculaEons for households by type and age have been compared against the average rental prices in Nelson (CMHC reported rental prices). Couple households earning the median income can afford the average rental price for bachelor, one bedroom, two bedroom, and three bedroom units. Couples under the age of 24 or over the age of 65 would be challenged to afford the average price of a three bedroom unit. Low-‐income families earning less than the median income would also be challenged with affording the average rental prices.
Single parents would likely require a two or three bedroom unit in order to accommodate their children, and meet the NaEonal Occupancy Standards of Canada (NOS). Single parents earning the median income under the age of 44 would be challenged to afford a two or three bedroom unit.
Except for singles under the age of 24, single person households earning the median income or more can afford the average rental price of a bachelor unit. Older adults (55 to 64) can afford more, most likely because their income potenEal has improved, and can afford the average price of a one bedroom unit.
Figure 21: Summary of Rental Affordability by Age + Median Income Levels
Source: CitySpaces ConsulJng CalculaJons referencing StaJsJcs Canada, Taxfiler Reported Custom TabulaJon Family Tables, 2009/2011
22 City of Nelson -‐ Affordable Housing Needs Assessment Update -‐ Final Report | October 2014
$0
$500
$1,000
$1,500
$2,000
$2,500
0-‐24 25-‐34 35-‐44 45-‐54 55-‐64 65+
Couples Single Parents Single Individuals
3+ Bdrm $9052 Bdrm $7921 Bdrm $657Bachelor $527
Across all household types (couples, single parents, and single individuals), youth and young adults earn the lowest median income and experience the greatest challenge with affording the average rental prices in Nelson

HOMEOWNERSHIP AFFORDABILITY CALCULATIONS
Households pursuing homeownership, rather than rental, will require a mortgage, and must be qualified by a banking insEtuEon or a mortgage broker to obtain one. Basic home purchasing assumpEons are made in order to determine the maximum purchase price and the maximum amount that households can borrow. For this report, assumpEons were based on 2014 rates, including:
• Gross Debt Service (GDS) RaEo at 32% (enEre monthly debt, such as car loans and credit card payments, including the potenEal monthly mortgage payment, should be no more than 32% of gross monthly income);
• 5-‐Year Fixed Rate (semi-‐annual) at 3.79%; and,
• Monthly maintenance fees at $200, property taxes at $250, and uEliEes/heaEng at $100 (esEmates based on a scan of recent sales lisEngs in Nelson).
Homeownership affordability can be esEmated based on the assumpEons made about a households ability to obtain a mortgage, and using the median household income. The first table demonstrates the maximum purchase price that a couple household earning the median income can afford with a 10% downpayment. The ability to purchase a home varies in age, with the highest purchasing power falling in the 45 to 54 age group earning the median income, who can afford a home worth up to $427,521. Those households earning greater than the median income can afford more, as well as households that have saved large down-‐payments. Couples under the age of 24 earning the median income are priced out of the market, with the excepEon of manufactured homes which in rural areas of Nelson are within their price range.
Table 6: Homeownership Affordability by Age for Couple Households in Nelson
Age Available at GDS
Less Fees + UGliGes
Maximum Mortgage
Purchase Price w/ 10% Down
0 to 24 $842 $292 $56,706 $63,007
25 to 34 $1,518 $968 $188,097 $208,997
35 to 44 $1,869 $1,319 $256,228 $284,698
45 to 54 $2,530 $1,980 $384,769 $427,521
55 to 64 $2,223 $1,673 $324,980 $361,089
65+ $1,278 $728 $141,468 $157,187
All Couple Households $1,710 $1,160 $225,375 $250,416
Source: CitySpaces ConsulJng CalculaJons referencing StaJsJcs Canada, Taxfiler Reported Custom TabulaJon Family Tables, 2009/2011
City of Nelson -‐ Affordable Housing Needs Assessment Update -‐ Final Report | October 2014 23

Single parents earning the median income have a lesser ability to buy a home compared to couple households. Single parents under the age of 34 are priced-‐out of the market, and likely most single parents between the ages of 35 to 44 are priced out as well. Single parents over the age of 55 have higher incomes and more purchasing power, and may have adult children at this stage in their lives, and could be able to afford a home worth up to $176,472.
Table 7: Homeownership Affordability for Single Parent Households in Nelson
Age Available at GDS
Less Fees + UGliGes
Maximum Mortgage
Purchase Price w/ 10% Down
0 to 24 $459 -‐$90.8 -‐$17,641 -‐$19,602
25 to 34 $603 $52.67 $10,233 $11,369
35 to 44 $797 $247.33 $48,054 $53,393
45 to 54 $1,019 $469.2 $91,160 $101,289
55 to 64 $1,367 $817.47 $158,824 $176,472
65+ $1,477 $927.07 $180,118 $200,132
All Single Parent Households $954 $403.82 $78,458 $87,176
Source: CitySpaces ConsulJng CalculaJons referencing StaJsJcs Canada, Taxfiler Reported Custom TabulaJon Family Tables, 2009/2011
Single individuals earning the median income levels in Nelson are completely priced out of the homeownership market. There may be occurrences where singles earn much more than the median income and, with substanEal savings, could possibly find a way to buy. But more realisEcally, single people living on their own are more likely to rent than own their homes.
Table 8: Homeownership Affordability for Single Person Households in Nelson
Age Available at GDS
Less Fees + UGliGes
Maximum Mortgage
Purchase Price w/ 10% Down
0 to 24 $337 -‐$213 -‐$41,319 -‐$45,910
25 to 34 $615 $65 $12,668 $14,075
35 to 44 $654 $104 $20,232 $22,480
45 to 54 $665 $115 $22,304 $24,783
55 to 64 $734 $184 $35,775 $39,750
65+ $687 $137 $26,656 $29,618
All Single Persons $615 $65 $12,719 $14,133
Source: CitySpaces ConsulJng CalculaJons referencing StaJsJcs Canada, Taxfiler Reported Custom TabulaJon Family Tables, 2009/2011
24 City of Nelson -‐ Affordable Housing Needs Assessment Update -‐ Final Report | October 2014
Price margins between townhouses and condo / apartments is small in Nelson. Due to a greater supply of condos, and the larger spaces townhouses can afford, it is likely that condo sales would absorbed at a slower rate compared to townhouses.

Figure 22: Summary of Homeownership Affordability by Age + Median Income Levels
Source: CitySpaces ConsulJng CalculaJons referencing StaJsJcs Canada, Taxfiler Reported Custom TabulaJon Family Tables, 2009/2011
Price can serve as a proxy or indicator of demand and, should the prices of condos and townhouses in Nelson remain constant over Eme, may suggest that there is more demand for townhouses over condos. Otherwise, as seen in other markets in BC, townhouses are more expensive than condos, even if the number of bedrooms are the same. However, price is not the only indicator of consumer preference. The length of Eme for lisEngs to be on the market can also demonstrate demand, as well as consumer surveys.
The rental and homeownership affordability has been compared to calculaEons completed in the 2010 Housing Needs Assessment. In general, incomes have remained the same, while rental prices have increased slightly (between $50 to $100 per month, increasing with each addiEonal bedroom). Rental affordability has not changed substanEally -‐ slightly less affordable to rent for couple families earning the median income, and slightly more affordable to rent for single parents earning the median income.
The major change in the past 5 years is the ability to obtain a mortgage and enter into homeownership. In 2009, the maximum purchase price for a couple family earning the median income was $373,000 (with a 10% down payment). Today, the maximum purchase price for a couple family earning the median income is $250,416. Since 2009, purchasing power for couples families in Nelson has dropped more than $100,000.
City of Nelson -‐ Affordable Housing Needs Assessment Update -‐ Final Report | October 2014 25
-‐$50,000
$50,000
$150,000
$250,000
$350,000
$450,000
0-‐24 25-‐34 35-‐44 45-‐54 55-‐64 65+
Couples Single Parents Single Persons
Condo/Apt $285,700
Urban single-‐detached $347,800Rural single-‐detached $361,000
Townhouse $289,400
Urban manufactured home $82,900
Rural manufactured home $41,100

Table 9: Summary of Household Ability to Afford Housing in Nelson, 2009 to 2011 Comparison
Household Type
20092009 20112011
Household Type Income
Available for Rent (30%)
Max Purchase Price (10%
Downpayment)
Income Available for Rent (30%)
Max Purchase Price (10%
Downpayment)
Couple Families $1,830 $373,000 $1,603 $250,416
Single Parent Families
$770 $125,000 $894 $87,176
Single Individuals $580 $81,000 $577 $14,133
Source: CitySpaces ConsulJng CalculaJons referencing StaJsJcs Canada, Taxfiler Reported Custom TabulaJon Family Tables, 2009/2011
The key contribuEng factor leading to less ability for households to afford homeownership in Nelson is not the median incomes nor the housing prices, but rather the hidden costs of homeownership and eligibility to obtain a mortgage through CMHC’s lending rules. Primarily, it has been the change in amorEzaEon period from 35 years (as was the case in 2009), down to 25 years.
• Among lenders, amorEzaEon periods of 35 years were becoming an acceptable Emeline rather than the convenEonal 25 years, thereby reducing the monthly cost for purchasers. Lenders offering mortgages with 35-‐year amorEzaEon period could only obtain CMHC insurance with a loan to value of less than 80%, meaning that the borrower must make a 20% downpayment. If the loan to value is greater than 80%, the amorEzaEon period can be no longer than 35 years.
• The federal government recently Eghtened rules on mortgage and lending, and now the longest government insured mortgage period is 25 years. The rules were implemented to ensure long term stability in the housing and mortgage market, as well as to protect households from gelng financially overextended.
• Aspiring homeowners cannot borrow as much as they once did. The changing amorEzaEon period means that a mortgage must be paid within a shorter period of Eme compared to previously, resulEng in a higher monthly mortgage cost. For example, a $500,000 mortgage would have an approximate $1,200 monthly mortgage payment at a 35 year amorEzaEon period, but approximately $1,700 per month with a 25 year amorEzaEon period. This difference can reduce the housing opEons available to aspiring homeowners because they cannot afford (on a monthly basis) as much as they were once able to.
An interview with a local developer revealed that, in their business, 5% of purchases have fallen through due to a households inability to obtain financing. Their price points are under $300,000 -‐ mostly at the $250,000 mark. They are able to achieve these sale prices by building smaller units (around 800 square feet for a townhouse), while maintaining construcEon
26 City of Nelson -‐ Affordable Housing Needs Assessment Update -‐ Final Report | October 2014
Recent changes to CMHC lending rules include reducing amortization periods from 35 years down to 25 years. Low to modest income households that were once eligible to obtain a mortgage in Nelson with a 35 year lending term would no longer be able to obtain a loan with a 25 year lending term today. As a result, less households are able to enter into homeownership in Nelson, unless they have a substantial downpayment.

quality. Generally, it is more challenging for households to purchase a home today than in 2010. They earn roughly the same income, but can borrow less money.
JOB TYPES, WAGES AND AFFORDABILITY
EvaluaEng median income levels is a standard approach to understanding affordability amongst household types and age. Another perspecEve is to understand how much a household can afford to rent based on the type of job they have, and the potenEal earning from those jobs.
Minimum wage has increased since the 2010 Housing Needs Assessment, resulEng in households working in low-‐paying retail and service sector jobs being able to afford more towards housing costs. However, not all jobs have seen an increase in their median wages. Median wages for some occupaEons have experienced a decrease, including secondary school teachers. This may be partly due to younger professionals in an earlier stage of their career moving into the Nelson workforce, and obtaining a salary that that commensurates with experience.
Table 10: Affordability by Occupation + Wage in Nelson
RepresentaGve Wages
20102010 20142014
RepresentaGve Wages Median
WageIncome
Available for Rent (30%)
Median Wage
Income Available for Rent (30%)
BC Minimum Wage $8.00 $336 $10.25 $431
Food and Beverage $9.82 $412 $10.25 $431
Hotel Front Desk Clerks $12.13 $509 $12.50 $525
Retail Sales Clerks $13.29 $558 $12.50 $525
Early Childhood Educators $15.69 $659 $16.00 $672
Nurse Aides $18.29 $768 $20.95 $880
Office Clerks $19.75 $830 $17.50 $735
Truck Drivers $23.06 $969 $22.50 $945
Secondary School Teachers $38.82 $1,630 $34.23 $1,438
Source: Calculated by CitySpaces, assuming full Jme employment at 35 hours / week working
48 weeks per year, referencing Labour Market InformaJon, Employment and Social
Development -‐ Government of Canada 2010/2014
City of Nelson -‐ Affordable Housing Needs Assessment Update -‐ Final Report | October 2014 27

Minimum wage has increased since Nelson’s 2010 Housing Needs Assessment, from $8 per hour to $10.25 per hour. Households earning the minimum wage can afford approximately $100 more per month than they did in 2010. Given that rent has increased between $50 to $100 per month in Nelson over the same Eme period indicates that minimum wage and rental prices have risen with inflaEon and in tandem. Regardless, individuals earning the minimum wage are challenged to afford the average rental unit in Nelson.
INCOME ASSISTANCE
Not everyone parEcipates in the labour force for a variety of reasons, such as being unemployed or unable to work due to a medical condiEon. In these cases, they can receive income assistance from the government.
Income assistance, as measured by BC StaEsEcs, only includes a subset of those receiving Income Assistance under the BC Employment and Assistance program. Included are those on Temporary Assistance (i.e. those expected to work but currently on leave as a result of a medical condiEon), being temporarily excused, or having persistent mulEple barriers. Excluded are those on conEnuous assistance (persons with disabiliEes), and children in the home of a relaEve, and OAS/Seniors. A recipient is defined in as 'each person living in a family or living alone that is receiving basic Income Assistance'. Data does not include Aboriginal people living on reserve.
Overall, percentages of persons receiving income assistance in Nelson has tended to increase and decrease in unison with the rate of BC. However, an excepEon to this trend occurred in 2011 when individuals receiving income assistance increased in Nelson, but decreased overall in BC. Key informants from this study suggested that Nelson experienced a delayed response to the economic downturn, and residents did not experience the full effect of the economic downturn unEl 2011. The spike in income assistance during this Eme is indicaEve to those observaEons. Fortunately, recent trends show that income assistance is decreasing in Nelson as of 2012. Overall, the percentage of individuals receiving income assistance in Nelson remains on average 1.2% higher than the Provincial average.
Figure 23: Adult Population (ages 19 to 64) Receiving Basic Income Assistance
0%
1%
2%
3%
4%
2005 2006 2007 2008 2009 2010 2011 2012
Nelson (LHA)BC
Source: BC Stats, 2012
28 City of Nelson -‐ Affordable Housing Needs Assessment Update -‐ Final Report | October 2014
Minimum wage and rental prices in Nelson have risen with inflation.

Table 10 provides data on the percentage of individuals receiving income assistance within either the Local Health Area (for Nelson) or within the Province (BC). As of 2013, this data is no longer being produced by BC StaEsEcs.
Table 10: Adult Population (ages 19 to 64) Receiving Basic Income Assistance in December of Each Year
2005 2006 2007 2008 2009 2010 2011 2012
Nelson (LHA)
BC
2.6% 2.6% 2.4% 2.9% 3.4% 3.3% 3.4% 2.7%
1.5% 1.4% 1.4% 1.6% 2.1% 2.0% 1.9% 1.7%
Source: BC Stats, 2012
CORE HOUSING NEED
Core Housing Need means a household lives in housing that falls below at least one of the adequacy, affordability or suitability standards and would have to spend 30% or more of its total before-‐tax income to pay the median rent.
A report prepared by the BC Non-‐Profit Housing AssociaEon (BCNPHA) in 2012 projected core housing need for the Regional District of Central Kootenay. This report idenEfied two methods of calculaEng core need projecEons: constant tenure and shiuing tenure. Constant tenure indicates that a similar tenure split between owners and renters will remain at 2006 levels, while a shiuing tenure assumes that the proporEon of renters will increase, a trend that has been occurring throughout the past decade in the Central Kootenay Region.
Based on the constant and shiuing tenure models, BCNPHA has projected that the Central Kootenay Region’s core housing need will increase between 16% and 26% over the next 25 years. Taking a proporEon of the BCNPHA projecEons based on populaEon share, it is esEmated that 336 renters in Nelson are currently in core housing need and that number is esEmated to grow to 360 by 2021. For owners, 467 households are esEmated to be in core housing need presently, and 504 esEmated for 2021.
SENIORSThe Canada Mortgage and Housing CorporaEon (CMHC) publishes a yearly Seniors’ Housing Report that provides informaEon on seniors’ housing provincially and regionally. Within the report, the Central Kootenay region is reported as part of a consolidaEon of data called ‘Other BC’ -‐ an area which is inclusive of all of the Kootenays and North-‐Central BC. Other regions assessed by CMHC include the Lower Mainland, Vancouver Island and Central Coast, and the Okanagan-‐Thompson-‐Shuswap.
According to staEsEcs collected by CMHC, the seniors’ rental market had an overall vacancy for independent living suites falling to 10.9% from 11.4% the previous year. Of the regions assessed, the “Other BC” area reported the
City of Nelson -‐ Affordable Housing Needs Assessment Update -‐ Final Report | October 2014 29

lowest vacancy rates for all bedroom types in independent living suites at 6.1%. This area also had the lowest vacancy rate for independent living in all regions in 2013 (8.0%). CMHC notes that these figures result from having relaEvely few independent living units in the “Other BC” region. Although average rent for these spaces increased from 2013 to 2014 across all regions, “Other BC” remained the most inexpensive region in which to rent independent care faciliEes at $2,131 per month the Vancouver Coastal region had the highest rent at $3,975 per month, while the provincial average was $2,811.
The “Other BC” region also had the lowest vacancy rate for seniors heavy care spaces at 0.5%. Heavy care spaces are defined by CMHC as being both for-‐profit and non-‐profit living arrangements where the resident pays addiEonal funds for more than 1.5 hours of care per day.
30 City of Nelson -‐ Affordable Housing Needs Assessment Update -‐ Final Report | October 2014

NON-MARKET HOUSING
––––––––––––––––––––––––––––––––––––––––––––––––––––––––
NON-‐MARKET HOUSING OVERVIEW
Affordable, non-‐market housing refers to housing below market rents or prices, ranging from emergency shelters through various forms of supporEve to rent-‐geared to income (RGI) rentals and housing co-‐operaEves. The lower rents are maintained as a result of ongoing government subsidy, or created through collecEon of rents and donaEons on a not-‐for-‐profit business model.
NON-‐MARKET HOUSING SUPPLY
BC Housing is the central Provincial agency that supports and funds efforts to meet the housing needs of BC’s most vulnerable residents through the provision of affordable housing. The staEsEcs in this secEon were collected in March 31st, 2014 and summarize the number of units for emergency, supporEve and independent housing for Nelson; and, emergency and supporEve housing along with rent supplement informaEon for Nelson and select communiEes in the Central Kootenay region.
Figure 24: BC Housing Units by Type in Nelson
Source: BC Housing, 2014
City of Nelson -‐ Affordable Housing Needs Assessment Update -‐ Final Report | October 2014 31
SupporEve Housing Emergency Housing Independent Living
48%
7%
44%
Above: Nelson Kiwanis Village

Nelson contains the highest amount of units subsidized by BC Housing overall in the Central Kootenays (336 units). Of these units, almost half are independent living (48%), while just slightly less are supporEve (44%), and the remainder are emergency units (7%). The only other urban area in the Central Kootenays to have more housing units of any one type than Nelson is Trail, which has 155 supporEve housing units compared to Nelson’s 149.
Although Nelson has the most non-‐market housing units in the Central Kootenay region, other communiEes have types of non-‐market housing that Nelson does not. For example, Castlegar, Salmo, Kaslo, Creston, and Nakusp all have at least 1 safe house unit/bed for women and children fleeing domesEc violence. Nelson and Trail, however, are the only communiEes with transiEonal units for women fleeing domesEc violence. Trail also has six units of second stage housing for women and children fleeing domesEc violence. Nelson and other communiEes in the region have zero.
Figure 25: Nelson Non-‐Market Housing Inventory, by Type
Source: BC Housing, 2014*Note: The above graph does not include recipients of the Rental Assistance Program (RAP), Shelter Aid for Elderly Renters (SAFER), or Homeless Rent Supplements.
In any municipality or region, there are someEmes affordable housing opEons available through sources other than BC Housing. These housing opEons either do not have a partnership with BC Housing (some privately operated affordable housing opEons are organized in such a way) or are not members of the Housing Registry and manage their own applicaEons. As a result, these housing opEons do not appear within the staEsEcs kept by BC Housing.
It is important to note that although BC Housing operates a wait list for individuals interested in acquiring a non-‐market housing unit, there are a variety of reasons why these and other wait lists are not good indicators of housing need. For example, applicants may remain on this wait list without
32 City of Nelson -‐ Affordable Housing Needs Assessment Update -‐ Final Report | October 2014
Above: Anderson Gardens, a home for persons with disabilities and low-‐income seniors in Nelson
84
7851
56178
Women + Children TransiEon House Shelter -‐ HomelessHomeless Housed Frail SeniorsSpecial Needs FamilyIndependent Seniors
There are still some misconceptions surrounding persons with disabilities, especially amongst seniors. There are many seniors who do not feel comfortable living under the same roof as persons with disabilities -‐ in fear of danger or incompatibility. There is a need to educate seniors, and the community at-‐large, about the benefits and opportunities to house persons with disabilities, as well as how to create inclusive neighbourhoods and buildings in Nelson that welcome a range of individuals and groups

acquiring a unit for long periods of Eme: applicants someEmes request a specific property but no available units meet their needed or desired specificaEons; an applicant’s contact details someEmes change with no update provided to BC Housing, making it challenging or impossible to contact the applicant when a unit is available; and, applicants occasionally undergo a change of circumstances whereby they require a type of unit that is different to what they iniEally requested, causing them to have to shiu to the boaom of another wait list. All these factors can enlarge or reduce a wait list such that it does not accurately reflect the needs of the community it is serving.
RENT SUPPLEMENT PROGRAMS
While waiEng for a unit with BC Housing, applicants may be eligible for assistance through the Rental Assistance Program (RAP) or for the Shelter Aid for Elderly Renters (SAFER). Individuals are eligible for SAFER if they are 60 years or older and paying more than 30% of their gross monthly income on housing. RAP is available to low-‐income families with at least one dependent child, who were employed during the last year, and have a gross household income of $35,000 or less.
Rent supplements are received by individuals throughout the Central Kootenay region, although Nelson is home to the greatest amount of households receiving supplements in all categories. In Nelson, 61 individuals receive SAFER and 74 families are supplemented with funds from RAP. This shows an increase from the last housing needs update when (in 2010) there were 43 RAP and 42 SAFER recipients in Nelson.
Figure 26: Rent Supplements in Nelson + Select Communities
Source: BC Housing, 2014
City of Nelson -‐ Affordable Housing Needs Assessment Update -‐ Final Report | October 2014 33
0
30
60
90
120
150
Nelson
Castlgar Salm
o Frui
tvale Trail
Kaslo
Creston
Nakusp
New Den
ver
Shelter Aid for Elderly Residents (SAFER)Rental Assistance Program (RAP) Homeless Rent Supplement
Nelson has the most non-‐market housing units and most rent supplement recipients in the region, and the only community in the Central Kootenays to have individuals receiving the Homeless Rent Supplement from BC Housing

In 2014, Castlegar, Trail and Creston have nearly half as many individuals receiving rent supplements compared to Nelson. Although New Denver has zero affordable housing units, it does have 2 individuals receiving the SAFER rent subsidy and 1 family receiving the RAP rent subsidy.
In addiEon, Nelson has 10 individuals receiving a BC Housing Homeless Rent Supplement. This program connects people who are homeless to housing, income assistance, and community-‐based support services. No other communiEes in the Central Kootenays have individuals receiving Homeless Rent Supplements.
The community reported that there are likely more people in Nelson who are eligible for rent supplement programs but are unaware of the programs or their eligibility. The community reported that the scaaered rent supplement approach works well, but has not been widely applied in Nelson.
AFFORDABLE HOUSING WAIT LIST
The City of Nelson has the highest wait list for affordable housing units in the Central Kootenay region with 48 applicants (61% of all applicants). The next highest is 14 applicants in Castlegar, and 7 applicants in Creston. Trail has 6 applicants, and Salmo and Kaslo both have 2 applicants. There are no applicants on the affordable housing wait list in Fruitvale, Nakusp, or New Denver.
The largest share of applicants on the wait list in Nelson are persons with disabiliEes (28), and seniors (17). This is reflecEve of the region where 70% of all applicants are either seniors or persons with a disability. The BC Housing wait list does not take into account private wait lists that may be recorded by individual non-‐profit housing providers and housing managers, such as Anderson Gardens which verbally shared a wait list of 50 individuals at any given Eme (for persons with disabiliEes and seniors).
The affordable housing wait list has changed over the past 8 years, moving from a predominately high volume of applicants for affordable family housing, to a major decrease in family housing applicants. The demand for affordable housing for persons with disabiliEes and seniors has significantly increased. The decrease in demand for affordable family housing may be a result from low-‐income families obtaining the RAP supplement, which has nearly doubled since 2010.
34 City of Nelson -‐ Affordable Housing Needs Assessment Update -‐ Final Report | October 2014
Affordable housing wait lists have decreased for family units, and increased for seniors and persons with disabilities

Table 11: Affordable Housing Wait List in Nelson + Select Communities
Community Family DisabiliGes Senior Wheelchair Modified Singles
Total by
Com-‐munity
Nelson 4 20 17 3 4 48
Castlegar 5 4 4 -‐ 1 14
Salmo -‐ -‐ 1 1 -‐ 2
Fruitvale -‐ -‐ -‐ -‐ -‐ 0
Trail 3 1 1 1 -‐ 6
Kaslo -‐ 1 1 -‐ -‐ 2
Creston 1 2 4 -‐ -‐ 7
Nakusp -‐ -‐ -‐ -‐ -‐ 0
New Denver -‐ -‐ -‐ -‐ -‐ 0
Total by Type 13 28 28 5 5 79
Source: BC Housing, 2014
Figure 27: Changes in Affordable Housing Wait List in Nelson + Select Communities, Over Time
0
5
10
15
20
25
2006 2007 2008 2009 2010 2014
Family PWD Seniors Wheelchair modifiedSingles
Source: BC Housing, 2014
City of Nelson -‐ Affordable Housing Needs Assessment Update -‐ Final Report | October 2014 35
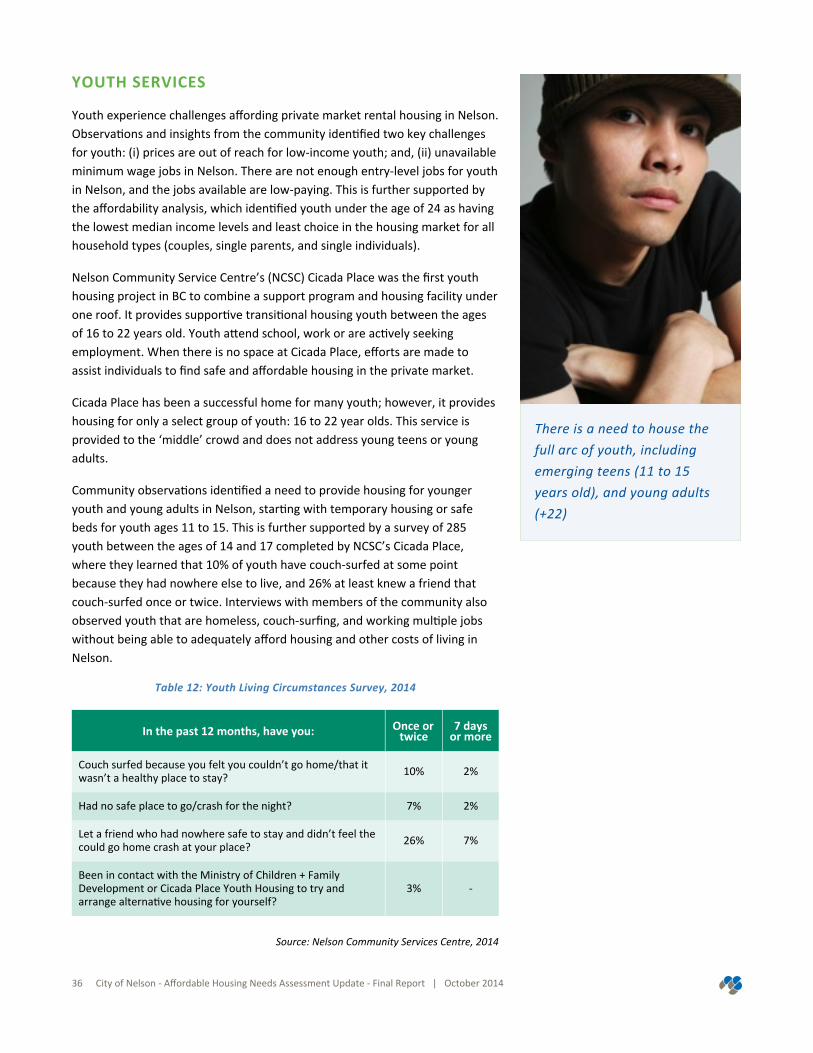
YOUTH SERVICES
Youth experience challenges affording private market rental housing in Nelson. ObservaEons and insights from the community idenEfied two key challenges for youth: (i) prices are out of reach for low-‐income youth; and, (ii) unavailable minimum wage jobs in Nelson. There are not enough entry-‐level jobs for youth in Nelson, and the jobs available are low-‐paying. This is further supported by the affordability analysis, which idenEfied youth under the age of 24 as having the lowest median income levels and least choice in the housing market for all household types (couples, single parents, and single individuals).
Nelson Community Service Centre’s (NCSC) Cicada Place was the first youth housing project in BC to combine a support program and housing facility under one roof. It provides supporEve transiEonal housing youth between the ages of 16 to 22 years old. Youth aaend school, work or are acEvely seeking employment. When there is no space at Cicada Place, efforts are made to assist individuals to find safe and affordable housing in the private market.
Cicada Place has been a successful home for many youth; however, it provides housing for only a select group of youth: 16 to 22 year olds. This service is provided to the ‘middle’ crowd and does not address young teens or young adults.
Community observaEons idenEfied a need to provide housing for younger youth and young adults in Nelson, starEng with temporary housing or safe beds for youth ages 11 to 15. This is further supported by a survey of 285 youth between the ages of 14 and 17 completed by NCSC’s Cicada Place, where they learned that 10% of youth have couch-‐surfed at some point because they had nowhere else to live, and 26% at least knew a friend that couch-‐surfed once or twice. Interviews with members of the community also observed youth that are homeless, couch-‐surfing, and working mulEple jobs without being able to adequately afford housing and other costs of living in Nelson.
Table 12: Youth Living Circumstances Survey, 2014
In the past 12 months, have you: Once or twice
7 days or more
Couch surfed because you felt you couldn’t go home/that it wasn’t a healthy place to stay? 10% 2%
Had no safe place to go/crash for the night? 7% 2%
Let a friend who had nowhere safe to stay and didn’t feel the could go home crash at your place? 26% 7%
Been in contact with the Ministry of Children + Family Development or Cicada Place Youth Housing to try and arrange alternaeve housing for yourself?
3% -‐
Source: Nelson Community Services Centre, 2014
36 City of Nelson -‐ Affordable Housing Needs Assessment Update -‐ Final Report | October 2014
There is a need to house the full arc of youth, including emerging teens (11 to 15 years old), and young adults (+22)

The community reported a need to provide affordable housing for youth who are ready to leave Cicada Place (over the age of 22). Youth are extending their stay at Cicada Place because there is no suitable or affordable place to move auerwards. For youth unable to find housing once they turn 19, they can access temporary rental supplements through NCSC’s Homelessness Outreach Program. When an affordable market rental unit does come available, youth may experience age discriminaEon and stereotyping as high-‐risk tenants. These challenges have led to a growing wait list for Cicada Place: young adults can’t leave, and young youth can’t get in.
RISE IN MENTAL HEALTH AND ADDICTIONS
Community observaEons and insights reported an increasing prevalence of persons with mental health and addicEons issues in Nelson. This is further supported by the staEsEcs compiled by Stepping Stones for Success (Emergency Shelter operated by Nelson CARES Society), in which the total number of clients have been consistent over the last three years, but clients with mental health and addicEons has steadily increased from 36% in 2006 to 52% in 2013.
The shelter staEsEc trends indicates that the proporEon of clients with mental health and addiEons is on the rise, or that the diagnoses and dialogue around mental health and addicEons has improved.
Further aaributed to this issue, the Nelson Police Department are increasingly responding to calls related to persons with mental health issues. In Nelson, typically 17 to 20% of police calls are for mental health cases, which is a 20 to 30% increase in call loads year to date.
Figure 28: Stepping Stones Shelter Statistics
Source: Nelson CARES Society, 2014
City of Nelson -‐ Affordable Housing Needs Assessment Update -‐ Final Report | October 2014 37
“17 to 20% of all police calls in Nelson are related to mental health issues...”
-‐ Nelson Police Department, 2014
2006 2007 2008 2009 2010 2011 2012 2013
249 235 225304
245 207 201 202
36% 36%
51%47%
42%
57%
49%52%
Mental Health + AddicEons Clients Trend: rise in mental health + addicEonsTotal Stays Trend: decrease in shelter users

Community observaEons and insights have indicated that Nelson does not have adequate supporEve housing with onsite services for persons with mental health issues. Currently, persons experiencing mental health and addicEons issues are ouen responded to by outreach workers or police, taken to hospital, and discharged without a proper plan in place -‐ including a housing plan. The community reported a need for permanent affordable supporEve housing for persons with mental health issues or, at the very least, affordable market rental housing (through rent supplements) with adequate outreach support and cooperaEon from landlords.
The community also reported on the ‘drug culture’ in Nelson, including persons involved in recreaEonal drug use, others with substance abuse dependencies. It was reported that individuals from elsewhere in the region travel to Nelson to receive addicEons treatment at the hospital, but do not have adequate housing available while they receive treatment. The community has reported a need for an AddicEons Treatment Facility to provide beaer treatment of persons experiencing addicEons, including supporEve housing for persons accessing drug treatment (e.g. detox beds).
PREVALENCE OF HOMELESSNESS
At the Eme of this study, 10 individuals in Nelson were receiving a Homeless Rent Supplement from the Provincial Government. Given the recent Homeless Report Card and visible homeless issues in Nelson, there is likely a need for more supplements and housing supports.
One of the indicators of those at-‐risk of homelessness are the staEsEcs kept by social service providers. As illustrated in the depicEon of mental health and addicEon prevalence figure, Stepping Stones for Success has experienced a slight decrease in number of individuals staying at their shelter: from 414 stays in 2011 to 355 stays in 2014. The average length of stay, however, has been increasing: from 9.5 days to 16 days in 2013 (the maximum length of stay is 30 days). The increase in length of stay at the shelter is an indicaEon that it may be increasingly challenging finding affordable and suitable housing for clients who are ready to leave the shelter.
Figure 29: Average Length of Stay at Stepping Stones Emergency Shelter
2011 2012 2013
16
129.5
Days
Source: Nelson Homeless Report Card, Nelson CARES Society, 2014
38 City of Nelson -‐ Affordable Housing Needs Assessment Update -‐ Final Report | October 2014
Above: Ward Street Place, Nelson

The number of food bank visits and meals served at Our Daily Bread have also been on the rise, with approximately 35% of users being seniors. Our Daily Bread is a hot lunch program offered by the Kootenay ChrisEan Fellowship five days a week to anyone who comes through their door. The Nelson Food Cupboard, located in the United Church on Silica Street, offers a food bank in a barrier free environment.
There was a substanEal increase in the number of meals served by Our Daily Bread in 2009, likely in response to economic hardships experienced by households following the economic recession. A 2011 drop in meals served was accompanied by a significant increase in SalvaEon Army Food Bank visits.
Since 2011, both the SalvaEon Army Food Bank and Our Daily Bread have seen steady increases in the use of their services. In fact, the number of food bank visits have steadily increased over the past decade, with 1 in 5 served being children (2013). The steady rise in food bank users is an indicaEon of the overall rise of cost of living in Nelson, whereby households are short-‐changed to meet their basic household expenses such as housing and groceries. Ouen, low-‐income families will sacrifice nutriEon and food in order to pay fixed costs such as their rent and credit (debt) payments.
AddiEonal food banks exist in Nelson; one is run by the Anglican Church and the other by the Women’s Centre.
Figure 30: Nelson Food Bank Visits and Meals Served at Our Daily Bread
0
5,000
10,000
15,000
20,000
25,000
2004 2009 2011 2012 2013
Food Bank Visits Meals Served by Our Daily Bread
Source: Nelson Affordable Housing Needs Assessment 2010, and Nelson Homeless Report Card, Nelson CARES Society, 2014
City of Nelson -‐ Affordable Housing Needs Assessment Update -‐ Final Report | October 2014 39
Food bank visits in Nelson have increased by 42% since the 2010 Housing Needs Assessment

Social service providers have observed an increase in number of homeless individuals in Nelson, and are now using the full amount of vouchers for homeless persons whereas, a few years ago, they had a surplus.
Key informants from this study indicated that the quaint and aaracEve reputaEon of Nelson has lead to more ‘hidden homelessness’, where homeless individuals do not feel comfortable being visible on the street or who are encouraged to hide. Because of this, homeless individuals have been known to choose to rest or sleep in unsafe community spaces such as dark alleys.
The visibility of homeless in Nelson has been increasingly evident, including this Spring when the largest tent city ever erected in the Nelson area was dismantled. Five people were evicted from the homeless camp in ‘Railtown’, however, as many as 30 to 40 people have been known to inhabit the property at any given Eme over the last 8 years. QualitaEve sources have indicated that up to 100 persons at a Eme have used ‘Railtown’ as a home base and, as of August 2014, all occupants previously living in this encampment had been displaced. Reportedly, a number of camp tenants were on income assistance, or working minimum wage jobs, and had challenges affording housing. There have been reports that some homeless have since relocated their tent and belongings elsewhere, while others have lost their possessions following the clean-‐up.
Community observaEons have reported that Nelson is a desEnaEon for a transient populaEon, specifically young people who are unemployed and without financial assets. Ouen they are aaracted to the local culture, some come for fesEvals, or return from fruit picking. Many pass through, but some also stay. Regardless of why they’ve come to Nelson or how long they plan to stay, all of them require accommodaEon and, at the very least, places pressure on the rental housing market and community support services.
40 City of Nelson -‐ Affordable Housing Needs Assessment Update -‐ Final Report | October 2014
Above: A Nelson Homeless Camp, locally known as ‘Railtown’, is dismantled in mid-‐July, 2014. Local media covered the story and interviewed those challenged to find permanent, affordable housing in Nelson (Photo Credit: Nelson Star)

HOUSING NEEDS AND GAPS
––––––––––––––––––––––––––––––––––––––––––––––––––––––––
AFFORDABLE HOUSING NEEDS IN NELSON
This secEon of the report draws on the staEsEcal measures from this report, together with community observaEons and insights, non-‐market housing providers, social service providers, faith-‐based organizaEons and others who are familiar with the housing challenges in Nelson. Six groups have been idenEfied as having varying housing affordability, adequacy and suitability needs in Nelson:
• At-‐risk youth and young adults;
• Persons with disabiliEes (developmental or physical);
• Low-‐income seniors and seniors living in rural areas of Nelson;
• Low-‐income families;
• Persons with mental health and addicEon issues; and,
• People who are homelessness or at-‐risk of becoming homeless.
AT-‐RISK YOUTH AND YOUNG ADULTS
There is a strong and compelling argument indicaEng that at-‐risk youth and young adults are in need of affordable housing in Nelson. StaEsEcally, Nelson experienced a significant increase in the number of young people under the age of 24 from the last census (35% increase, or an addiEonal 670 youth between the ages of 15 and 24 -‐ refer to Figure 3). These emerging young adults are likely looking for rental as their form of accommodaEon.
Young adults under the age of 24 earn the lowest median income levels for all household types (couples, single parents, and single individuals), and have the least choice in the housing market. Single young adults earning the median income could not afford the average rental price for a one-‐bedroom or bachelor unit in Nelson, and would have to spend greater than 30% of their income towards housing. AlternaEvely, they could find a roommate (or two), or remain living with their parents, if that is an opEon. Unfortunately, living at
City of Nelson -‐ Affordable Housing Needs Assessment Update -‐ Final Report | October 2014 41
Above: Duplex in Nelson

home or with roommates is not an opEon for all youth. For some youth, for example, experiencing mental health issues and/or have a fragile/non-‐existent relaEonship with caregivers, being able to live independently is their only opEon.
Young single parents under the age of 24 also have a very low median income, which can afford them $431 per month towards shelter costs. They would require at least a two-‐bedroom rental unit to accommodate themselves and their child/children, the going-‐rate of which is $792 per month on average in Nelson. For these single parents, they ouen will rent a cheaper rental unit compared to the average unit (if available), in exchange for lower quality and condiEon in order to save costs. Otherwise, they are likely paying more money towards housing, resulEng in short-‐changing themselves for other living costs such as groceries and childcare.
Young single parents are eligible for rental assistance under BC Housing program because they have a dependent. Youth who live on their own do not have such programs available to them, and are in most need of finding affordable rental housing -‐ either bachelor or one-‐bedroom unit.
Further, wait list informaEon and conversaEons with the community idenEfied a need to house youth in the young teen years (11 to 15) and youth ready to leave Cicada Place (+22 years of age).
PERSONS WITH DISABILITIES
The wait list for affordable housing dedicated to persons with disabiliEes has seen a major increase since the 2010 Housing Needs Assessment. Over half of the new Anderson Gardens units (completed in 2013) are occupied by persons with disabiliEes, with the reminder of residents are low-‐income seniors. The wait list for that complex is over 50 applicants -‐ half of which are persons with disabiliEes.
In addiEon, conversaEons with key informants in the community have further idenEfied a need to reproduce a complex such as Anderson Gardens as the need for this type of building -‐ independent, accessible, and in good condiEon -‐ is in demand in Nelson for persons with disabiliEes.
LOW-‐INCOME SENIORS AND SENIORS IN RURAL AREAS OF NELSON
The number of seniors in Nelson is projected to grow over the coming decade. There are indicators that low-‐income seniors are challenged to afford housing in Nelson -‐ including food bank usage (1 in 10 users are seniors). However, median income levels suggest that seniors (over the age of 65+) are in a beaer posiEon to afford rental housing compared to other age groups, and are most likely to have accumulated wealth over Eme.
That said, adults who have struggled for a large porEon of their lives would likely not have the same advantage as their senior cohorts when it comes to
42 City of Nelson -‐ Affordable Housing Needs Assessment Update -‐ Final Report | October 2014
HOUSING GAP:
Permanent affordable housing that is accessible and
adequate housing for persons with disabilities
HOUSING GAP:
Independent affordable housing for youth (22+) leaving Cicada Place
HOUSING GAP:
Youth safe beds or safe home program for youth ages 11 to 15
HOUSING GAP:
Affordable bachelor or one-‐bedroom units suitable for singles

reErement years. Some of these seniors sEll require to work and earn an income, others receive income assistance such as pension and disability. These ‘fixed-‐income’ earners are low-‐income earners, and are challenged to afford the average market rental prices in Nelson.
Further, the community reported that seniors living in rural areas of Nelson are looking to downsize from their large homes and into something smaller with less maintenance. Key informants have reported that seniors are challenged to maintain their large homes; and although their mortgages are paid for, property taxes and home repairs can be costly. TransportaEon in rural areas is also a challenge for seniors.
Seniors in rural areas have reported that their return on investment for their rural properEes is not as substanEal as they expected. As a result, they have less funds available for their reErement years, which also limits the housing type and price point they can afford should they choose to sell their current home. Further to this challenge is a limited availability of housing suitable to seniors looking to downsize. Apartments tend to be walk-‐ups (less accessible), and are not dedicated to seniors, so lifestyle clashes with young people and other household arrangements proves challenging.
Proposed condominium development projects have the potenEal to work for seniors looking to downsize, especially for those who own a single-‐detached home, as their equity would likely allow them to afford the average price of a condo. However, those seniors earning the median income or less, and who are on fixed-‐incomes, would not be able to afford purchasing a condo in Nelson. They would require rental units that are safe, accessible, and affordable. Low-‐income senior renters could obtain a SAFER rent subsidy to make rents in the private market more affordable, but would sEll require suitable and appropriate housing to meet their needs.
LOW-‐INCOME FAMILIES
According to the BC Housing Wait List Registry, Nelson has experienced a significant decrease in the demand for affordable rental housing for low-‐income families. However, community observaEons and insights indicate that the number of low-‐income families and children living in poverty is increasing in Nelson, and there is a need to house low-‐income families.
This is further supported by the affordability calculaEons, which suggest that low-‐income families (both couples and single parents) are challenged to afford the average rental prices in Nelson. There could be an opportunity to match these low-‐income families with rent supplements, or more permanent affordable housing dedicated to families where and when made available. The gap in Nelson is the limited opEons for ‘family-‐friendly’ rental; homes that are affordable without compromising on the quality and condiEon of housing. The low availability of 3+ bedroom rental units in Nelson, which comprise merely 2% of Nelson’s rental stock, lend addiEonal weight to this argument.
City of Nelson -‐ Affordable Housing Needs Assessment Update -‐ Final Report | October 2014 43
HOUSING GAP:
Accessible rental and ownership options for seniors in the urban areas of Nelson
HOUSING GAP:
Lower cost homeownership (small lots, ground-‐oriented
multi-‐unit)

The 2010 Housing Needs Assessment report idenEfied a need to assist low to moderate income families enter into homeownership. This need was also heard from the community during this study. However, since 2010, a privately operated Rent-‐to-‐Own program has been introduced through the private market. At the Eme of this study, there were 97 qualified applicants ready for a property to become available for the program. The largest barrier is matching a suitable property to meet household needs, primarily for families. It was suggested that duplexes, fourplexes and townhouses were ideal forms for families uElizing the Rent-‐to-‐Own program.
PERSONS WITH MENTAL HEALTH AND ADDICTIONS ISSUES
The number of persons with mental health and addicEons issues is on the rise in Nelson. A higher proporEon of shelter users idenEfy with either a mental health or addicEon issue (or both), and nearly a quarter of all police calls are related to mental health. Nelson is home to a variety of social services as well as addicEons treatment at the hospital, and serves people from around the region who need access to these services. Overall, housing is missing from the conEnuum of care.
There is a demonstrated need to provide low-‐barrier suitable and affordable housing to persons with mental health and addicEons issues in Nelson. For housing persons with addicEons and those receiving addicEons treatment, there is an opportunity to explore the development of an AddicEons Treatment Facility -‐ one that has dedicated detox beds and onsite supports, housing or otherwise, for temporary stays. At the very least, a feasibility study for an AddicEons Treatment Facility would be required before moving forward on this consideraEon.
Further, there is a need to provide affordable and suitable housing for persons with mental health issues in the community, possibly in the exisEng private market rental stock (rather than dedicated buildings). This could be achieved through rent supplement programs, engagement and educaEon with landlords, outreach support workers (ACT Teams), and social service provider support. Across Canada, scaaered site rent supplements for persons with mental health has been increasingly common in terms of implemenEng the ‘Housing First’ model in small and rural communiEes, as achieving dedicated buildings is difficult outside of major centres.
PEOPLE WHO ARE HOMELESS OR AT-‐RISK OF HOMELESSNESS
There are several indicators that demonstrate that homelessness in Nelson is on the rise: social service providers maximizing homeless rent supplements, the recent shuffling of residents occupying informal sealements/camps, and the increase in length of stay at the Stepping Stones for Success Emergency Shelter. Those at-‐risk of homelessness are already outlined in this report: residents being potenEally displaced due to fires or evicEons (e.g. Kerr
44 City of Nelson -‐ Affordable Housing Needs Assessment Update -‐ Final Report | October 2014
HOUSING GAP:
Scattered site rent supplement program
for persons with mental health issues, and
appropriate discharge planning from
hospitals/detainment
HOUSING GAP:
Dedicated detox beds, possibly in conjunction with an addictions treatment facility
HOUSING GAP:
Matching households with rent subsidy
programs
HOUSING GAP:
Affordable ‘family-‐friendly’ rental units
(3+ bedrooms)

Apartment Fire), and low-‐income households paying more than 30% of their gross income towards housing costs. These low-‐income households are youth, seniors, and families, as well as persons living with mental health and addicEons issues.
There is an opportunity to connect with people who are homeless or households at-‐risk of homelessness with rental assistance programs: seniors with SAFER, and families with RAP. For single individuals who are not eligible for such programs, the matching of units becomes increasingly important. There is an opportunity to implement ‘Housing First’ model for these residents, through the site scaaered model of housing. Advocacy and provincial funding is required to implement this approach.
In summary, 10 housing gaps have been idenEfied for the City of Nelson, as illustrated in the table below.
Table 13: Summary of Housing Gaps
Housing Gap Sub-‐PopulaGon Group
Affordable bachelor or one-‐bedroom units suitable for singles
Single individuals living on their own (youth, adults, seniors)
Independent affordable housing for youth (22+) Young Adults
Youth safe beds or safe home program for youth ages 11 to 15 Young Adults
Permanent affordable housing that is accessible and adequate housing for persons with disabiliees Persons with disabiliees
Accessible rental and ownership opeons for seniors in the urban areas of Nelson Seniors
Affordable ‘family-‐friendly’ rental units Low-‐income families
Lower cost homeownership (small lots, ground-‐oriented mule-‐unit)
Low to moderate-‐income families
Dedicated detox beds, possibly in conjunceon with an addiceons treatment facility Mental health and addiceons
Scakered site rent supplement program for persons with mental health issues, and appropriate discharge planning from hospitals/detainment
Mental health and addiceons
Matching households with rent subsidy programs Homeless
City of Nelson -‐ Affordable Housing Needs Assessment Update -‐ Final Report | October 2014 45

OTHER CONSIDERATIONS
Further to the housing needs and gaps, this study idenEfied other underlying factors contribuEng to the housing situaEon in Nelson, including the condiEon of the rental housing stock, potenEal pressures on the rental market, as well as challenges to the economy, employment, and poverty.
QUALITY AND CONDITION OF RENTAL HOUSING
Reports of poor condiEon in the rental stock was noted in 2010, and again in 2014. Part of the reason could be related to the long period of low vacancy rates in Nelson, which were below 2% prior to 2012, and hovering at 2.6% today. The demand for private market rental has outmatched the supply and, when this happens, the market alone regulate good housing condiEons. There has not been any enacted bylaws (e.g. Standards of Maintenance Bylaw) or landlord incenEve programs to encourage major repairs. Lastly, rental housing in poor condiEons also tend to be more affordable, so there is concern in the Nelson community that upgrading affordable market rental stock could, to some degree, unintenEonally result in a net loss of affordable market rental units.
As a result, the issues related to rental housing condiEons remain the same: mold, inadequate insulaEon, no heaEng, faulty wiring and plumbing, poorly secured locks, and overcrowding. Substandard housing can have serious negaEve effects on tenants, the most notable affect being health. Poor condiEons such as overcrowding, dampness, and cold weather/poor insulaEon can all lead to physical illnesses. For children, seniors, and persons with compromised immune systems, living in poor rental condiEons is unsafe.
PRESSURE ON THE RENTAL MARKET
The rental vacancy rate has alleviated since 2010 (now 2.6%), but is sEll less than a healthy, balanced market vacancy rate of 3%. Considering populaEon growth trends in Nelson (parEcularly among youth, young adults, and seniors -‐ all more likely to rent), the future market could experience a decrease in vacancy rates should addiEonal units not be developed in Nelson.
Further, trends in affordable housing programs are leaning towards offering rental subsidies for households to use towards private market rental units, rather than developing and managing new dedicated affordable housing buildings. With the ‘slowing down’ of affordable housing development projects occurring throughout the province, and the increase in rent subsidy programs, Nelson may observe an increased demand for private market rental units for households that would have otherwise (a decade or so ago) been housed in dedicated affordable housing. There are benefits to integraEng low-‐income households in the private market rental, such as creaEng inclusive and mixed-‐income neighbourhoods, but also lends to an increase in rental market demand.
46 City of Nelson -‐ Affordable Housing Needs Assessment Update -‐ Final Report | October 2014
HOUSING CHALLENGE:
Upgrading rental housing in poor
conditions
HOUSING CHALLENGE:
Maintaining a reasonable rental vacancy rate (~3%)

In the coming years, the City should pay close aaenEon to rental vacancy rates, rental wait lists, and populaEon growth amongst youth, young adults, and seniors. Also important to consider is not to over-‐build, as high vacancy rates can be detrimental on property owners, and can have an opposite affect on affordability once vacancy rates return to normal (i.e. increase rents to compensate for lost revenue).
EMPLOYMENT CHALLENGES AND OCCURRENCES OF POVERTY
Nearly every key informant interview from this study underscored the relaEonship between economic challenges in Nelson and the challenges to affordable housing.
At the Eme of the 2010 report, the Nelson community had not yet felt the full effects of the economic recession. Since then, the challenges have increasingly becoming apparent. There are limited job opportuniEes for residents living in Nelson, including job losses, which limits their income potenEal and ability to afford housing. The community has also indicated that there is not a large employer in Nelson, yet the populaEon conEnues to grow. This has increased the labour force parEcipaEon, but has not increased the total number of jobs. The compeEEve job market in Nelson makes it challenging to secure employment, especially for young adults.
Community observaEons and insights revealed that in 2010, low-‐income households were working up to 2 or 3 minimum-‐wage paying jobs at a Eme in order to afford the cost of living. Today, observaEons suggest that this has increased to 3 to 4 jobs in some cases. Further, the community is concerned that the rates of poverty is increasing for individuals, families, and children.
Lastly, community insights idenEfied the informal economies of Nelson could be in jeopardy. Specifically, marijuana growing. There are households in both urban and rural areas of Nelson that grow marijuana to supplement their income, and to offset their overall cost of living including the cost of housing. However, recent regulaEon changes could potenEally aaract large-‐scale marijuana growing operaEons to Nelson, which could be an economic generaEng opportunity and potenEally bring-‐in ‘large employer(s)’ for the community. However, the small-‐scale operaEons could be compromised and, as a result, reduce household’s income and directly impact their ability to afford housing. A major community concern is that Nelson could experience a wave of households that, at one point were financially independent and secure because of their marijuana related income, potenEally in need of affordable housing and other social services in the future. There is a need to prepare for this potenEal economic challenge in Nelson.
City of Nelson -‐ Affordable Housing Needs Assessment Update -‐ Final Report | October 2014 47
HOUSING CHALLENGE:
Limited employment opportunities, and limited
good-‐paying jobs

48 City of Nelson -‐ Affordable Housing Needs Assessment Update -‐ Final Report | October 2014

APPENDICES
––––––––––––––––––––––––––––––––––––––––––––––––––––––––
APPENDIX A: LIST OF KEY INFORMANTS
PreparaEon of this report was made possible by the parEcipaEon of the following list of key informants:
• City of Nelson Housing Commiaee
• Cicada Place (Joyce Dahms-‐Whiffen and outreach workers)
• CMHA Kootenays/Anderson Gardens (Qadesh Markowski)
• Nelson Community Services Centre (Rona Park)
• Nelson CARES Society (Jenny Robinson)
• Community First Health Co-‐op (Joan Reichardt)
• Nelson Commiaee on Homelessness (KaEe Tabor and Anne Harvey)
• Stepping Stones for Success Emergency Shelter (Klee Hunter)
• Links Housing Co-‐op (Sharmaine Gray)
• Nelson Police Department (Chief Wayne Holland)
• Nelson Realty/West Kootenay Landlord Society (Trevor Jenkinson)
• AIDS Network Kootenay Outreach + Support Society (Cheryl Dowden)
• Kootenay ChrisEan Fellowship/Our Daily Bread (Pastor Jim Reimer)
• Selkirk College (Mike McGaw)
• Habitat for Humanity (Kathy Fair)
• Women’s Centre (Elena Banfield)
• Columbia Basin Trust (Liz Gillis)
• Learning in ReErement (Judy Biggins, Joel Guay, Alannah Haynes, Roger Oliver)
• West Creek Developments Inc (Pat Davis)
• Primary Choice Homes -‐ Rent-‐to-‐Own (Jessica Curran)
City of Nelson -‐ Affordable Housing Needs Assessment Update -‐ Final Report | October 2014 49

APPENDIX B: LIST OF KEY TERMS AND DEFINITIONS
ADEQUATE HOUSING: means dwellings reported by residents as not requiring any major repairs.
AFFORDABLE HOUSING: means a safe, secure, accessible living environment that allows people to live within their income level, and maintain quality of life. Affordable housing may take a number of forms that exist along a conEnuum -‐ from emergency shelters, to transiEonal housing, to mass-‐market rental (also known as subsidized or social housing), to formal and informal rental, and home ownership. According to Canada Mortgage and Housing CorporaEon, for housing to be affordable, a household should not spend more than 30% of gross income on shelter costs.
CORE HOUSING NEED: means a household living in a housing that falls below at least one of the adequacy, affordability or suitability standards and it would have to spend 30 percent or more of its total before-‐tax income to pay the median rent of alternaEve local housing that is acceptable.
DETACHED HOME: As per CMHC, a free-‐standing home for one family, not aaached to a house on either side.
DUPLEX: As per CMHC, a duplex is a building containing two single-‐family homes, located one above the other.
GROSS DEBT SERVICE RATIO: means the raEo that measures the percentage of gross annual income required to cover annual payments associated with housing and all other debt obligaEons, such as payments on car loans, credit cards, personal loans, etc. (CMHC, Debt Service Formula, 2014).
HOMELESSNESS: is the situaEon of an individual or family without stable, permanent, appropriate housing, or the immediate prospect, means and ability of acquiring it.
HOUSING CONTINUUM: is a visual concept used to describe and categorize different types of housing, from non-‐market to market housing. Housing conEnuums are developed to assist with planning and program development and are usually tailored to the community or region in quesEon. On the non-‐market end of the conEnuum are emergency services and transiEonal housing, which ouen require the most public funding, moving towards supporEve and social housing opEons in the middle of the conEnuum and then towards independent housing opEons on the right, where housing is typically provided by the private market.
HOUSING OCCUPANCY STANDARDS: means housing must have enough bedrooms for the size and make up of a household. This means a home needs to have enough bedrooms for each cohabiEng adult couple, each adult 18 years or older, each child under 18 years old (two children of the same gender can share a room; two children under five years old of opposite genders can share a room).
50 City of Nelson -‐ Affordable Housing Needs Assessment Update -‐ Final Report | October 2014

MARKET RENTAL HOUSING: means the private rental market that provides the majority of rental housing affordable to households with low to moderate incomes. This can include purpose-‐built rental housing as well as housing supplied through the secondary rental market such as basement suites, rented condominium units, or other investor-‐owned houses/units.
NON-‐MARKET HOUSING: means affordable housing that is owned or subsidized by government, a non-‐profit society, or a housing cooperaEve; whereby rent or mortgage payments are not solely market driven.
RENTAL ASSISTANCE PROGRAM (RAP): is operated by BC Housing, providing eligible low-‐income working families with cash assistance to help with their monthly rent payments. To qualify, families myst have a gross household income of $35,000 or less, have at least one dependent child, and have been employed at some point over the last year.
ROW HOUSE: As per CMHC, also called a townhouse, a row house is one unit of several similar single-‐family homes, side-‐by-‐side, joined by common walls.
SCATTERED SITE: is a “Housing First” approach to help low-‐income individuals access a self-‐contained rental unit (i.e. private apartment or secondary suite) and receive a rent subsidy to off-‐set the costs. Rather than offering housing in dedicated buildings to a targeted populaEon, this approach results in placing low-‐income individuals throughout the community. For situaEons where the tenant has mental health issues, offering a rent subsidy plus support can be applied. An example is the At Home/Chez Soi program in Vancouver, where 200 scaaered site units were offered for persons living with severe mental illness.
SEMI-‐DETACHED HOME: As per CMHC, this is a home for one family, aaached to another building on one side.
SHELTER AID FOR ELDERLY RESIDENTS (SAFER): is operated by BC Housing, and helps make rents affordable for BC seniors with low to moderate incomes by providing monthly cash payments to subsidize rents for eligible BC residents who are age 60 or over, and who pay rent for their homes. Seniors who own their homes are not eligible.
SUITABLE HOUSING: means housing that has enough bedrooms for the size and make-‐up of resident households, according to NaEonal Occupancy Standard (NOS) requirements.
City of Nelson -‐ Affordable Housing Needs Assessment Update -‐ Final Report | October 2014 51

APPENDIX C: LIST OF SOURCES
• BC Housing, Research and Corporate Planning Department. Housing Registry -‐ Nelson and Central Kootenays. 2014
• BC Non-‐Profit Housing AssociaEon. ProjecJons of Rental Housing Demand and Core Housing Need (CVRD to 2036). 2012
• BC Stats. Building Permits by Community. 2013
• BC Stats. P.E.O.P.L.E PopulaJon and Household ProjecJons. 2013
• Canada Mortgage and Housing CorporaEon. Housing in Canada Online (HICO). 2006
• Canada Mortgage and Housing CorporaEon. Rental Market Reports. 2011, 2013
• CitySpaces ConsulEng. Nelson Affordable Housing Needs Assessment -‐ Report #1. 2010
• Government of Canada. Labour Market InformaJon, Employment and Social Development. 2010/2014
• Kootenay Real Estate Board. Monthly StaJsJcs Package. 2014
• Nelson CARES Society. Nelson Homeless Report Card. 2014
• Nelson CARES Society. Stepping Stones for Success Shelter StaJsJcs. 2014
• Nelson Post. Fire at the Kerr Apartments -‐ ArJcle. 2011
• Nelson Star. Advocates Decry Camp EvicJon -‐ ArJcle. 2014
• StaEsEcs Canada. Income StaJsJcs, Annual EsJmates for Census, Families and Individuals. 2011
• StaEsEcs Canada. NaJonal Household Survey. 2011
• StaEsEcs Canada. PopulaJon Census. 2011
• Various Rental LisEngs: Kijiji
• , I Love Nelson, Discover Nelson, Used Kootenay, Craigslist and Nelson Gyos.ca
52 City of Nelson -‐ Affordable Housing Needs Assessment Update -‐ Final Report | October 2014


Suite 585, 1111 West Has/ngs Street, Vancouver BC V6E 2J3 | 604.687.2281
5th Floor, 844 Courtney Street, Victoria BC V8W 1C4 | 250.383.0304
Suite 300, 160 Quarry Park Boulevard SE, Calgary AB T2C 3G3 | 403.336.2468
www.cityspaces.ca