Embed Size (px)
Citation preview

1
PLAINVIEW
Nektar Therapeutics (NKTR) NKTR-214: Pegging the Value at Zero
October 2018
Since mid-2017, Nektar’s stock price has tripled based on the view that its flagship clinical-stage drug NKTR-214 is a
promising treatment for cancer, particularly in combination with checkpoint inhibitors. NKTR-214 is a pegylated form of
recombinant IL-2, a naturally occurring cytokine that was first discovered in 1976 and approved for treating cancer in
1992. By binding with the IL2Rβγ receptor, IL-2 stimulates proliferation of cytotoxic lymphocytes, which then attack
cancer cells. However, IL-2 has a short half-life and also binds with the IL2Rαβγ receptor, which is thought to induce
proliferation of immunosuppressive Treg cells. Nektar hypothesized that IL-2 could be improved by adding polyethylene
glycol molecules to it (pegylating it) to extend the half-life and block interaction with IL2Rαβγ.
Unfortunately, the anticipated benefits did not materialize and pegylation has proved to be a drag on efficacy. NKTR-
214 doesn’t actually prevent proliferation of Treg cells as evidenced by the 18-25x increases in peripheral Tregs reported
in Nektar’s ASCO 2017 presentation. Extended half-life has ironically become a problem for NKTR-214: conventional
high-dose IL-2 is dosed in increments over a multi-day period and can be stopped at any time, while NKTR-214 dosing is
front-loaded and irreversible. This raised the safety bar significantly, and limited NKTR-214 dosing to a fraction of
conventional IL-2. Nektar’s own study also showed that pegylation severely hinders NKTR-214’s ability to bind with the
target IL2Rβγ receptors: for 76% of NKTR-214’s life, it is inert. The clinical dose of NKTR-214 yields only 7-20% of the
active AUC (drug exposure) of a standard cycle of IL-2, and Nektar’s most recent data points to the bottom end of that
range (7-11%).
NKTR-214’s pharmacological profile is even weaker than the total active AUC would suggest because the AUC is
predominantly driven by NKTR-214’s long half-life rather than potency: NKTR-214 does very little for a very long time.
The peak active concentration of NKTR-214 is only 2% of the peak concentration of IL-2, and pegylation continues to
hamper NKTR-214’s target receptor binding even during its active state. Using NKTR-214 to treat cancer is akin to trying
to cook a steak by heating it 4° F for 1,000 minutes instead of 400° F for 10 minutes– it never generates enough effect to
overwhelm and kill the malignant cells.
This was confirmed by Nektar’s EXCEL trial, during which NKTR-214 monotherapy posted a 0% ORR (0/28); particularly
troubling considering that IL-2 has historically yielded a 15-29% response rate among RCC and melanoma patients. IL-2’s
therapeutic effect can be measured by change in lymphocytes, and past studies have shown that it takes a 200-300%
increase in peripheral lymphocytes for IL-2 to induce a response in cancer patients. In Nektar’s PIVOT trial, NKTR-214
has induced a 33-50% increase in peripheral lymphocytes—missing the efficacy benchmark by a wide margin.
Nevertheless, Nektar’s stock has soared based on preliminary SITC 2017 results for NKTR-214 + nivolumab combination
therapy. Investors believe that NKTR-214 could have synergistic effects with checkpoint inhibitors and become a new
universal cancer treatment. We disagree—the thesis and clinical data are nearly identical to the now-disproven IDO
inhibitor story, and the notion that a failed monotherapy will add statistically significant value as part of a combination
therapy has never worked in practice. In cancer research, the total efficacy of combination therapy is less than the sum
of the parts, not more. This is especially true for IL-2 which—despite showing indisputable efficacy as monotherapy—
failed to show benefit in any of the three controlled trials where it was tested as part of a combination therapy.
Nektar’s stock plunged after ASCO 2018, where Nektar reported declining response rates in its RCC and melanoma
treatment groups. Even more alarming was Nektar’s decision to only disclose response rates for 31% (87/283) of dosed
patients at ASCO 2018— an unprecedented level of data opacity and a stark contrast to the 95% (36/38) disclosed at
SITC 2017. This was followed by guidance on the Q2 2018 earnings call to only expect data for an additional 10 patients
at SITC 2018. First rule of biotechnology investing: if a company withholds data from investors, that data is always bad.
Nektar’s promises may sound sweet, but reality will prove to be very bitter.

2
PLAINVIEW
Legal Disclaimer
As of the publication date of this report, Plainview LLC and its affiliates (collectively "Plainview"), others that contributed
research to this report and others that we have shared our research with (collectively, the “Authors”) have short positions
in and may own option interests on the stock of Nektar Therapeutics (“Nektar”), and stand to realize gains in the event
that the price of the stock decreases. Following publication of the report, the Authors may transact in the securities of the
company covered herein. All content in this report represent the opinions of Plainview. The Authors have obtained all
information herein from sources they believe to be accurate and reliable. However, such information is presented “as is,”
without warranty of any kind – whether express or implied. The Authors make no representation, express or implied, as
to the accuracy, timeliness, or completeness of any such information or with regard to the results obtained from its use.
All expressions of opinion are subject to change without notice, and the Authors do not undertake to update or
supplement this report or any information contained herein.
This document is for informational purposes only and it is not intended as an official confirmation of any transaction. All
market prices, data and other information are not warranted as to completeness or accuracy and are subject to change
without notice. The information included in this document is based upon selected public market data and reflects
prevailing conditions and the Authors’ views as of this date, all of which are accordingly subject to change. The Authors’
opinions and estimates constitute a best efforts judgment and should be regarded as indicative, preliminary and for
illustrative purposes only.
Any investment involves substantial risks, including, but not limited to, pricing volatility, inadequate liquidity, and the
potential complete loss of principal. This report’s estimated fundamental value only represents a best efforts estimate of
the potential fundamental valuation of a specific security, and is not expressed as, or implied as, assessments of the
quality of a security, a summary of past performance, or an actionable investment strategy for an investor.
This document does not in any way constitute an offer or solicitation of an offer to buy or sell any investment, security, or
commodity discussed herein or of any of the affiliates of the Authors. Also, this document does not in any way constitute
an offer or solicitation of an offer to buy or sell any security in any jurisdiction in which such an offer would be unlawful
under the securities laws of such jurisdiction. To the best of the Authors’ abilities and beliefs, all information contained
herein is accurate and reliable. The Authors reserve the rights for their affiliates, officers, and employees to hold cash or
derivative positions in any company discussed in this document at any time. As of the original publication date of this
document, investors should assume that the Authors are short shares of Nektar and stand to potentially realize gains in
the event that the market valuation of the company’s common equity is lower than prior to the original publication date.
These affiliates, officers, and individuals shall have no obligation to inform any investor or viewer of this report about
their historical, current, and future trading activities. In addition, the Authors may benefit from any change in the
valuation of any other companies, securities, or commodities discussed in this document.
The information contained in this document may include, or incorporate by reference, forward-looking statements, which
would include any statements that are not statements of historical fact. Any or all of the Authors’ forward-looking
assumptions, expectations, projections, intentions or beliefs about future events may turn out to be wrong. These
forward-looking statements can be affected by inaccurate assumptions or by known or unknown risks, uncertainties and
other factors, most of which are beyond the Authors’ control. Investors should conduct independent due diligence, with
assistance from professional financial, legal and tax experts, on all securities, companies, and commodities discussed in
this document and develop a stand-alone judgment of the relevant markets prior to making any investment decision.

3
PLAINVIEW
Table of Contents Introduction ............................................................................................................................................................................ 5
IL-2 Works, NKTR-214 Does Not ............................................................................................................................................. 5
Lymphocyte Change Misses Efficacy Bar by a Mile ................................................................................................................ 8
NKTR-214 Does Very Little for a Very Long Time .................................................................................................................. 10
NKTR-214 is Dosed at 1.2% of IL-2 .................................................................................................................................... 10
NKTR-214 is Inert for 76% of Total AUC ............................................................................................................................ 11
NKTR-214-AC’s AUC is 7-20% of IL-2 AUC ......................................................................................................................... 11
Nektar’s Preclinical Model Shows PEG Polymers Reduce NKTR-214-AC’s Target Receptor Occupancy AUC by 73%
compared to IL-2 ............................................................................................................................................................... 12
Why Doesn’t Nektar Increase the Dose? .......................................................................................................................... 13
NKTR-214 Doesn’t Actually Block Treg Proliferation ............................................................................................................ 14
Nektar’s CD8+ Claims are Brazenly Misleading ..................................................................................................................... 15
TIL CD8+ Data Presentation Creates Misleading Appearance of Efficacy ......................................................................... 16
What Happened to the Average-Skewing Patient? .......................................................................................................... 16
TIL CD8+ Cell Counts Are Imprecise & Heterogeneous ..................................................................................................... 17
Fold-Change is Right-Skewed & Distorted by Low Initial Values ...................................................................................... 17
ASCO 2018 Data Shows Change in TIL CD8+ in Patients Given NKTR-214 + Nivolumab Not Statistically Significant ....... 18
Change in Ki67+ Does Not Translate to Change in CD8+ Cell Count .................................................................................. 19
Peripheral CD8+ Counts Nowhere to Be Found ................................................................................................................ 21
Bull Thesis & Clinical Results are Identical to Epacadostat ................................................................................................... 21
Epacadostat Does Nothing ................................................................................................................................................ 22
Failed IDO Inhibitor Class Achieved Comparable Phase 2 ORRs ....................................................................................... 22
Phase 2 Results Never Translate to Phase 3 ..................................................................................................................... 24
Nektar’s ASCO 2018 Response Rates Will Not Improve ....................................................................................................... 25
Responses Come Quickly or Don’t Come At All ................................................................................................................ 27
Unprecedented Data Opacity ........................................................................................................................................... 28
Concluding Thoughts: How Nektar Made IL-2 Ineffective .................................................................................................... 30
Appendix 1: AUC Calculations ............................................................................................................................................... 31
NKTR-214-AC AUC: Hurwitz et al 2017 ............................................................................................................................. 31
NKTR-214-AC AUC: Bentebibel et al 2017 ........................................................................................................................ 31
Konrad et al 1990 Calculation #1 (73.6 ng*hr/mL per kg) ................................................................................................ 33
Konrad et al 1990 Calculation #2 (108.1 ng*hr/mL per kg) .............................................................................................. 34
Appendix 2: Further AUC Discussion .................................................................................................................................... 34
Dissecting Nektar’s AUC Claim .......................................................................................................................................... 34

4
PLAINVIEW
Subsequent Mouse Data Supports Our AUC Calculation .................................................................................................. 35
AUC Sanity Check .............................................................................................................................................................. 36
Appendix 3: Cross-Trial Comparison of CD8+ Impact ............................................................................................................ 36
5
PLAINVIEW
Introduction
Nektar Therapeutics is a biotechnology company whose principal asset is NKTR-214, a pegylated version of the cytokine
IL-2. The “peg” in pegylated stands for polyethylene glycol, and pegylation refers to the addition of one or more PEG
polymers to a drug. Adding these PEG polymers makes it more difficult for the body to naturally clear the drug, thus
extending the length of time during which a patient is exposed to the drug. Pegylation can also block or reduce the
frequency of certain interactions.
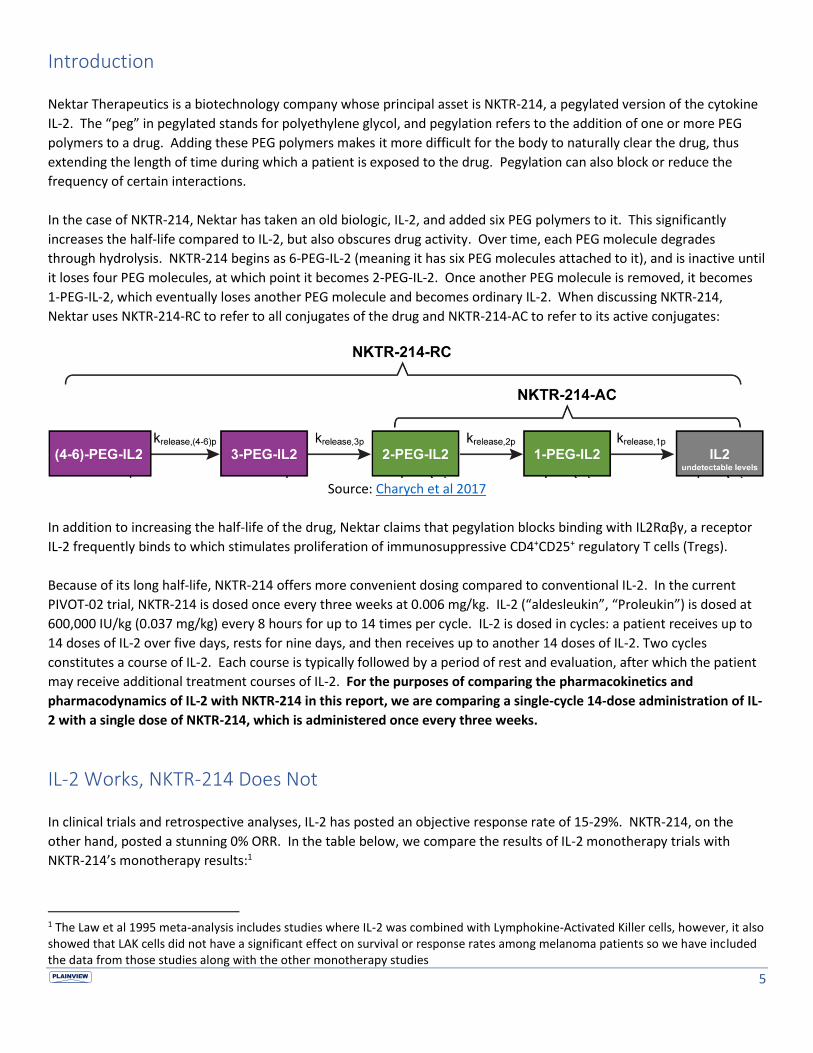
In the case of NKTR-214, Nektar has taken an old biologic, IL-2, and added six PEG polymers to it. This significantly
increases the half-life compared to IL-2, but also obscures drug activity. Over time, each PEG molecule degrades
through hydrolysis. NKTR-214 begins as 6-PEG-IL-2 (meaning it has six PEG molecules attached to it), and is inactive until
it loses four PEG molecules, at which point it becomes 2-PEG-IL-2. Once another PEG molecule is removed, it becomes
1-PEG-IL-2, which eventually loses another PEG molecule and becomes ordinary IL-2. When discussing NKTR-214,
Nektar uses NKTR-214-RC to refer to all conjugates of the drug and NKTR-214-AC to refer to its active conjugates:
Source: Charych et al 2017
In addition to increasing the half-life of the drug, Nektar claims that pegylation blocks binding with IL2Rαβγ, a receptor
IL-2 frequently binds to which stimulates proliferation of immunosuppressive CD4+CD25+ regulatory T cells (Tregs).
Because of its long half-life, NKTR-214 offers more convenient dosing compared to conventional IL-2. In the current
PIVOT-02 trial, NKTR-214 is dosed once every three weeks at 0.006 mg/kg. IL-2 (“aldesleukin”, “Proleukin”) is dosed at
600,000 IU/kg (0.037 mg/kg) every 8 hours for up to 14 times per cycle. IL-2 is dosed in cycles: a patient receives up to
14 doses of IL-2 over five days, rests for nine days, and then receives up to another 14 doses of IL-2. Two cycles
constitutes a course of IL-2. Each course is typically followed by a period of rest and evaluation, after which the patient
may receive additional treatment courses of IL-2. For the purposes of comparing the pharmacokinetics and
pharmacodynamics of IL-2 with NKTR-214 in this report, we are comparing a single-cycle 14-dose administration of IL-
2 with a single dose of NKTR-214, which is administered once every three weeks.
IL-2 Works, NKTR-214 Does Not
In clinical trials and retrospective analyses, IL-2 has posted an objective response rate of 15-29%. NKTR-214, on the
other hand, posted a stunning 0% ORR. In the table below, we compare the results of IL-2 monotherapy trials with
NKTR-214’s monotherapy results:1
1 The Law et al 1995 meta-analysis includes studies where IL-2 was combined with Lymphokine-Activated Killer cells, however, it also showed that LAK cells did not have a significant effect on survival or response rates among melanoma patients so we have included the data from those studies along with the other monotherapy studies

6
PLAINVIEW
In Nektar’s Phase 1 EXCEL trial, none of the patients responded. Nine of the patients never even recorded stable
disease—their best response was “progressive disease.”
NKTR-214 is not the first attempt at pegylating IL-2—the first paper on pegylating IL-2 was published in 1987 with
human data published in 1991. In 1995, investigators published a trial comparing a cycle of high-dose IL-2 followed by
weekly outpatient pegylated IL-2 maintenance therapy against two cycles of high-dose IL-2 in order to determine
whether or not pegylated IL-2 offered any benefit to patients. The authors found that HD IL-2 monotherapy
outperformed HD IL-2 + PEG-IL-2 in both RCC and melanoma (Yang et al 1995):
It is also worth noting that the baseline performance status in this trial (ECOG) was meaningfully higher in the IL-2
monotherapy group, suggesting that the results are particularly poor for PEG-IL-2 since baseline ECOG status is
correlated with lower response rates and shorter survival:
IL-2 vs. NKTR-214
N Dose PR CR ORR
IL-2 Monotherapy - RCC
Fyfe et al 1995 255 0.037 to 0.044 mg/kg 8% 7% 15%
Klapper et al 1998 259 0.044 mg/kg 12% 9% 20%
Rosenberg et al 1994 149 0.044 mg/kg 13% 7% 20%
McDermott et al 2010 120 0.037 mg/kg 23% 6% 29%
Yang et al 2011 155 0.044 mg/kg 14% 7% 21%
McDermott et al 2005 95 0.037 mg/kg 15% 8% 23%
IL-2 Monotherapy - Melanoma
Rosenberg et al 1994 134 0.044 mg/kg 10% 7% 17%
Atkins et al 1999 270 0.037 to 0.044 mg/kg 10% 6% 16%
Law et al 1995 - Meta-analysis 1,291 Varied 10% 6% 16%
NKTR-214 Monotherapy
RCC 15 0.003 to 0.012 mg/kg 0% 0% 0%
Metastatic Melanoma 7 0.003 to 0.009 mg/kg 0% 0% 0%
Bladder Cancer 1 0.003 mg/kg 0% 0% 0%
Colorectal Cancer 1 0.006 mg/kg 0% 0% 0%
Breast Cancer 2 0.006 mg/kg 0% 0% 0%
Leiomyosarcoma 1 0.006 mg/kg 0% 0% 0%
Chondrosarcoma 1 0.006 mg/kg 0% 0% 0%
IL-2 vs. PEG-IL-2 Response Rates (Yang et al 1995)
Renal Cell Carcinoma Melanoma
HD IL-2 Monotherapy 19% 15%
HD IL-2 + PEG-IL-2 17% 11%
Baseline Performance Status (ECOG) by Treatment Arm
ECOG Arm A (IL-2 Monotherapy) Arm B (IL-2 + PEG-IL-2)
0 68% (41/60) 86% (55/64)
1 23% (14/60) 14% (9/64)
2 8% (5/60) 0% (0/64)

7
PLAINVIEW
While the phrase “turning cold tumors hot” may be new, the idea of combining IL-2 with checkpoint inhibitors is not. A
Phase 1/2 study (Maker et al 2005) tested whether or not combining high-dose IL-2 with the CTLA-4 antibody
ipilimumab (then owned by Medarex and known as MDX-010) could produce any synergistic effects in metastatic
melanoma patients.
The Maker trial enrolled 36 patients, who were dosed at 0.1, 0.3, 1.0, and 3 mg/kg of ipilimumab. 24/36 patients
received 3 mg/kg of ipilimumab, with the remainder split evenly among the other dose groups. All patients received
720,000 IU/kg of IL-2 every eight hours up to 15 times (20% higher than the prescribing label dose of 600,000 IU/kg).
The ipilimumab and IL-2 cycles were each administered once every three weeks. A treatment course consisted of three
doses of ipilimumab and two cycles of IL-2, with each patient receiving up to three treatment courses.
The IL-2/ipilimumab combination produced a 22% ORR (8/36), with a 5/24 (21%) response rate among the patients
receiving 3 mg/kg of ipilimumab. In a prior trial testing an identical dose of ipilimumab in metastatic melanoma patients
(Phan et al 2003), investigators found that ipilimumab produced a response rate of 21% (3/14). In another ipilimumab
study (Attia et al 2005), investigators saw a 12.5% ORR. Phan 2003 and Attia 2005 both combined ipilimumab with
glycoprotein 100 (gp100) vaccines; however, it was later shown through the Phase 3 study Hodi et al 2010 that gp100
vaccines add no benefit to ipilimumab treatment. IL-2 in metastatic melanoma has been shown to yield a 16-17%
response rate (see table). The investigators concluded that there was no synergistic effect based on seeing similar
response rates for ipilimumab (13-21%) and IL-2 alone (~15%):
There is not evidence to support a synergistic effect of CTLA-4 blockade plus IL- 2 administration, because the
22% objective response rate is that expected from the sum of these two agents administered alone.
Like PEG-IL-2, combining IL-2 with checkpoint inhibitors was shelved.
NKTR-214’s 0% ORR makes it very hard to believe that NKTR-214 will work as part of a combination therapy. For
combination therapies in oncology, 2+2=3, not 2+2=5—the total effect is nearly always less than the sum of the parts.
We are unaware of any oncology drug that reported a 0% ORR as a monotherapy and then went on to achieve success
as part of a combination therapy, but there are many therapies with meaningful monotherapy ORR rates that have
failed to add value as part of a combination therapy. This is particularly true for IL-2: despite showing indisputable
efficacy as a monotherapy, IL-2 has failed in all three of its combination therapy trials:
Will NKTR-214 succeed where IL-2 failed after failing where IL-2 succeeded? We don’t think so—and there is little
mystery behind NKTR-214’s dismal performance.
IL-2 Combination Therapy Trial Results
Treatment Arms N Median OS (months)
Trial Indication Arm A Arm B Arm A Arm B Arm A Arm B p-value
Hauschild et al 2001 Melanoma Dacarbazine + IFN-a Dacarbazine + IFN-a + IL-2 144 137 11.0 11.0 0.52
Keilholz et al 2005 MelanomaDacarbazine + Cisplatin
+ IFN-a
Dacarbazine + Cisplatin +
IFN-a + IL-2180 183 9.0 9.0 0.31
Procopio et al 2013 RCC Sorafenib Sorafenib + IL-2 62 66 33.0 38.0 0.67

8
PLAINVIEW
Lymphocyte Change Misses Efficacy Bar by a Mile
The intended mechanism of action of NKTR-214 is the same as IL-2: induce a sufficient increase in lymphocytes to trigger
a successful clinical response. As we show in this section, researchers have established that an IL-2 treatment requires a
200-300% increase in lymphocytes in order to elicit a response. In its most recent PIVOT trial data, NKTR-214 has
induced a 33-50% increase in lymphocytes—missing the bar for efficacy by a wide margin and explaining why the
monotherapy data was so poor. Below is a comparison of change in lymphocytes for NKTR-214 vs. a high-dose IL-2 trial
(Ahmadzadeh & Rosenberg 2006):
Sources: Nektar ASCO 2017 Presentation & Ahmadzadeh & Rosenberg 2006
In the PIVOT trial, NKTR-214 saw a peripheral increase of approximately 50% at peak with a sustained increase of ~33%
at 22 days. In contrast, the patients in Ahmadzadeh & Rosenberg 2006 saw a peak increase of approximately 233% with
a sustained increase of around 100%. We also note that none of the patients in Ahmadzadeh & Rosenberg 2006 (n=8)
were responders; it takes even higher changes in lymphocyte counts to induce a response. Phan et al 2001 showed that
responders recorded an average 305% increase in lymphocytes while non-responders recorded an average 262% peak
increase in lymphocytes: both higher than the average seen in Ahmadzadeh & Rosenberg 2006 and much higher than
NKTR-214:
NKTR-214 IL-2(720K IU/kg, median 9 doses)
Lym
ph
ocy
tes
(ALC
K/μ
L)

9
PLAINVIEW
Another trial, Lissoni et al 1994, found that responders saw an average 217% increase in lymphocytes after three weeks
of treatment, compared to Nektar’s reported ~33% increase at three weeks:
0%
50%
100%
150%
200%
250%
300%
350%
IL-2 Responders IL-2 Non-Responders NKTR-214 (PIVOT)
Peak Change in Lymphocytes: IL-2 vs. NKTR-214
Lymphocytes (mean, k cells/uL)
Baseline Peak Increase
IL-2 Responders 1.5 5.9 305%
IL-2 Non-Responders 1.4 4.9 262%
NKTR-214 (PIVOT) 1.5 2.3 50%
0%
50%
100%
150%
200%
250%
IL-2: Complete/PartialResponse
IL-2: Stable Disease IL-2: Progression NKTR-214 (PIVOT)
Avg
. C
ha
nge
in
Lym
ph
ocy
tes
fro
m B
ase
lin
e (%
)
Change in Lymphocytes @ 3 Weeks: IL-2 vs. NKTR-214

10
PLAINVIEW
NKTR-214 Does Very Little for a Very Long Time
The limited impact of NKTR-214 is easy to explain—NKTR-214 is too weak to work, with a pharmacokinetic profile
yielding only 7-20% of the active AUC of a standard cycle of IL-2 due to 1) lower maximum tolerated dose and 2)
pegylation interfering with NKTR-214 drug activity.
This low cumulative AUC is even worse than it seems: it is spread out over a much longer time compared to IL-2, and the
peak concentration (Cmax) of active NKTR-214 is only 2% of the peak concentration of IL-2. NKTR-214 does very little for
a very long time. On top of that, Nektar’s own preclinical data shows that even during its active AUC, NKTR-214-AC
yields 73% lower target-receptor occupation time compared to what an equivalent AUC of IL-2 would yield.
NKTR-214 is Dosed at 1.2% of IL-2
The FDA-approved label for IL-2 recommends a dose of 600,000 IU/kg (0.037 mg/kg), administered every 8 hours up to
14 times, with the schedule repeating after nine days of rest. To calculate the overall dose, we multiply 0.037*14 =
0.518 mg/kg, which tells us that the recommended dose of IL-2 per cycle is 0.518 mg/kg:
NKTR-214 is being dosed at 0.006 mg/kg every three weeks in the ongoing PIVOT-02 trial. For simplicity, we will ignore
the fact that a three-week period would actually encompass two cycles of IL-2, and we compare a single administration
of NKTR-214 with a single cycle of IL-2. Dividing out the total dose of IL-2 by the total dose of NKTR-214, we see that
NKTR-214 is dosed at 0.006/0.518 = 1.2% of the dose of IL-2 in practice.
Lymphocytes Avg. Increase in Lymphocytes @ 3 Weeks
Baseline CR/PR Stable Disease Progression Overall
IL-21,2 1.19 2.57 1.00 0.43 1.16
Change from baseline (%) 217% 84% 36% 98%
NKTR-214 (PIVOT)2 1.50 NA NA NA 0.50
Change from baseline (%) NA NA NA 33%
Notes:
1 IL-2 administered as 6mm IU 5x per week for six weeks (standard IL-2 is 600K IU/kg 3x/day
for up to 14 doses per cycle)
2 Lymphocytes measured as k cells/uL
Proleukin/aldesleukin is recombinant IL-2 IL-2 is dosed at 0.037 mg/kg every 8 hours for up to 14 doses per cycle, which comes out to 14*0.037 = 0.518 mg/kg per patient per cycle
NKTR-214 is administered at 0.006 mg/kg once every 3 weeks–slightly longer than the time between initiating IL-2 cycles (2 weeks)

11
PLAINVIEW
NKTR-214 is Inert for 76% of Total AUC
As a reminder, NKTR-214 has two different states: NKTR-214-RC, which encompasses all conjugates, and NKTR-214-AC,
which only includes the active conjugates (2-PEG-IL2, 1-PEG-IL2, and IL-2). The time that NKTR-214 has 3-6 PEG
polymers attached (and is thus inactive) represents the majority of the AUC: as we see from comparing the total AUC
(NKTR-214-RC) with the active AUC (NKTR-214-AC) in Nektar’s Hurwitz et al 2017 poster, NKTR-214 is inert for
approximately 76% of the AUC in humans:
In the last row of the table, we show that NKTR-214-AC is only 24% of NKTR-214-RC—meaning that NKTR-214 is only
active during 24% of its time in humans. For the purposes of gauging clinical effect, NKTR-214-AC’s AUC is the only AUC
that matters.
NKTR-214-AC’s AUC is 7-20% of IL-2 AUC
Konrad et al 1990 analyzed the PK/PD profile of IL-2 in humans, and showed that the AUC for a standard cycle of IL-2 (14
doses of 0.037 mg/kg over a five-day period) ranges from 73.6 to 108.1 ng*hr/mL * weight (kg). Nektar provided two
different sources for AUC for NKTR-214. In February 2017, Nektar published Hurwitz et al 2017 at ASCO GU 2017 (n=9).
In November 2017, Nektar published Bentebibel et al 2017 (n=15).
Comparing the AUCs, we find that, at the clinical dose, NKTR-214-AC yields only 7-20% of the AUC of IL-2 (see below
table). We provide step-by-step calculations for both the Konrad 1990 IL-2 AUC range and the NKTR-214 AUCs in the
Appendix to this report.
We place more weight on the more recent and higher-n Bentebibel 2017 range (7-11%).
Bentebibel et al 2017 Hurwitz et al 2017
NKTR-214-AC AUC 7.8 ng*h/mL per kg 15.0 ng*h/mL per kg
IL-2 AUC @ 73.6 ng*hr/mL*kg 73.6 ng*hr/mL per kg 73.6 ng*hr/mL per kg
IL-2 AUC @ 108.1 ng*hr/mL*kg 108.1 ng*hr/mL per kg 108.1 ng*hr/mL per kg
NKTR-214-AC AUC / IL-2 AUC 7.2% to 10.5% 13.8% to 20.4%
12
PLAINVIEW
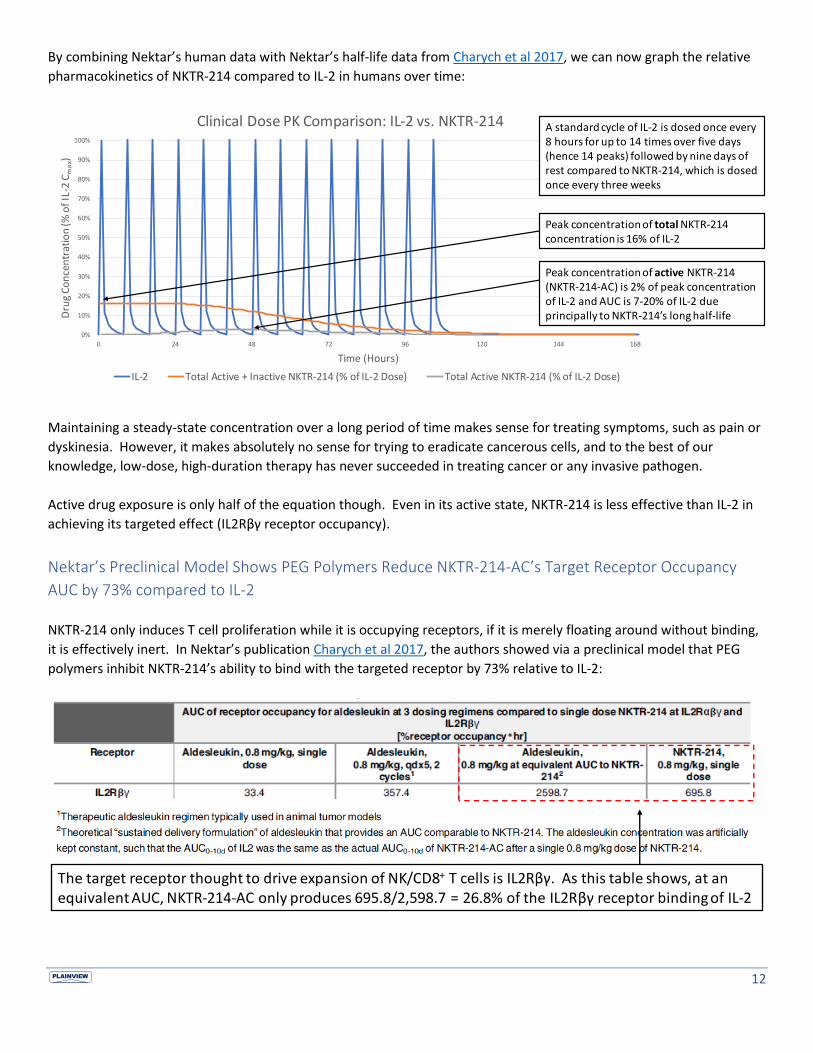
By combining Nektar’s human data with Nektar’s half-life data from Charych et al 2017, we can now graph the relative
pharmacokinetics of NKTR-214 compared to IL-2 in humans over time:
Maintaining a steady-state concentration over a long period of time makes sense for treating symptoms, such as pain or
dyskinesia. However, it makes absolutely no sense for trying to eradicate cancerous cells, and to the best of our
knowledge, low-dose, high-duration therapy has never succeeded in treating cancer or any invasive pathogen.
Active drug exposure is only half of the equation though. Even in its active state, NKTR-214 is less effective than IL-2 in
achieving its targeted effect (IL2Rβγ receptor occupancy).
Nektar’s Preclinical Model Shows PEG Polymers Reduce NKTR-214-AC’s Target Receptor Occupancy
AUC by 73% compared to IL-2
NKTR-214 only induces T cell proliferation while it is occupying receptors, if it is merely floating around without binding,
it is effectively inert. In Nektar’s publication Charych et al 2017, the authors showed via a preclinical model that PEG
polymers inhibit NKTR-214’s ability to bind with the targeted receptor by 73% relative to IL-2:
0%
10%
20%
30%
40%
50%
60%
70%
80%
90%
100%
0 24 48 72 96 120 144 168
Dru
g C
on
cen
trat
ion
(% o
f IL
-2 C
ma
x)
Time (Hours)
Clinical Dose PK Comparison: IL-2 vs. NKTR-214
IL-2 Total Active + Inactive NKTR-214 (% of IL-2 Dose) Total Active NKTR-214 (% of IL-2 Dose)
Peak concentration of active NKTR-214 (NKTR-214-AC) is 2% of peak concentration of IL-2 and AUC is 7-20% of IL-2 due principally to NKTR-214’s long half-life
Peak concentration of total NKTR-214 concentration is 16% of IL-2
A standard cycle of IL-2 is dosed once every 8 hours for up to 14 times over five days (hence 14 peaks) followed by nine days of rest compared to NKTR-214, which is dosed once every three weeks
The target receptor thought to drive expansion of NK/CD8+ T cells is IL2Rβγ. As this table shows, at an equivalent AUC, NKTR-214-AC only produces 695.8/2,598.7 = 26.8% of the IL2Rβγ receptor binding of IL-2

13
PLAINVIEW
This means that an equivalent AUC to IL-2, NKTR-214-AC occupies the targeted receptor, IL2Rβγ, for 695.8/2,598.7 =
26.8% of the time that IL-2 occupies the same receptor. This is not surprising: if 3 to 6 attached PEG polymers
completely inhibit NKTR-214’s mechanism of action, it is reasonable that 1 to 2 attached PEG polymers continue to
interfere with receptor binding.
Relative target receptor occupancy approximates the relationship in terms of change in cytotoxic T cells for patients on
NKTR-214 compared to IL-2. Putting the numbers together, we can now calculate relative target receptor occupancy for
the clinical dose of NKTR-214 compared to prescribing label dose of IL-2 as:
[Active AUC of NKTR-214/Active AUC of IL-2] * [Target Receptor Occupancy of NKTR-214/Target Receptor Occupancy of
IL-2] = Relative Potency of NKTR-214 Dose Compared to IL-2 Dose
7.2% * 26.8% = 1.9%
20.4% * 26.8% = 5.5%
By layering relative target receptor occupancy on top the PK comparison shown earlier, we can visualize the therapeutic
effect of NKTR-214 compared to IL-2:
We caveat the above receptor binding portrayal since it relies on preclinical receptor occupancy data that could be
different in humans, but we find it highly likely that pegylation plays an adverse (and significant) role against NKTR-214-
AC’s binding ability: the only question is what the magnitude is.
Why Doesn’t Nektar Increase the Dose?
IL-2 is known to cause serious adverse events including vascular leak, which can potentially lead to death. Cytokines like
IL-2 increase local vascular permeability in order to allow immune cells to pass through the vascular wall so they can
reach the target site. Normally, cytokines are produced locally to act locally, and any vascular leak would be limited and
not present a systemic problem. However, when patients are treated with high doses of foreign IL-2, the effect is not
local and can be extreme and potentially fatal.
With a normal course of IL-2, vascular leak is mostly controllable because the dosing is split into 14 administrations and
can be stopped at any time if needed. IL-2 also clears the body quickly, improving the margin of safety for patients.
With NKTR-214, the entire dose is frontloaded, long-acting, and irreversible—so if serious adverse events arise, nothing

14
PLAINVIEW
can be done to reduce drug exposure. As a result, the safety bar for NKTR-214 is significantly higher than it is for IL-2
and the maximum tolerated dose is much lower.
Nektar tried to administer NKTR-214 at higher doses, but saw symptoms of vascular leak in the single patient treated at
0.012 mg/kg (hypotension and syncope) and also saw adverse events in patients dosed at 0.009 mg/kg. Nektar decided
to move forward with 0.006 mg/kg. For what it’s worth, we do not believe that increasing the dose 25-50% would have
been enough to make NKTR-214 work anyways.
NKTR-214 Doesn’t Actually Block Treg Proliferation
IL-2 binds to two receptors: IL2Rαβγ and IL2Rβγ. The IL2Rβγ receptor is thought to drive expansion of cytotoxic T cells
(such as CD8+), which is desirable for treating cancer. The IL2Rαβγ receptor is thought to drive expansion of
immunosuppressant regulatory T cells (Treg cells). These cells downregulate the immune response, which would be
counterproductive for cancer patients. Nektar claims that NKTR-214 blocks the proliferation of Treg cells by specifically
targeting the IL2Rαβγ receptor. As we show, while the intent was there, Nektar’s strategy does not appear to actually
work.
Roche is also developing two IL-2 variants for treating cancer: FAP-IL2v and CEA-IL2v. Before taking CEA-IL2v to the
clinic, Roche conducted preclinical studies assessing the drug’s potency compared with conventional IL-2. Roche found
through a STAT5 phosphorylation assay study (Klein et al 2017), IL-2 induces maximum proliferation of Treg cells at <1%
of the dose of IL-2 required to induce any change in CD8+ T cells:
This means that to reduce Treg expansion, a drug must be >99% specific to the IL2Rβγ receptor. In Charych et al 2017,
Nektar claims NKTR-214 is 85% specific to IL2Rβγ (695.8/(118.2+695.8) = 85%):
Source: Charych et al 2017

15
PLAINVIEW
As a result, NKTR-214 does not actually stop Treg proliferation. Patients on NKTR-214 saw an average 18 to 25-fold
increase in peripheral Treg cells. We can compare Nektar’s results with Roche’s CEA-IL2v drug, which does prevent Treg
proliferation and saw a 1.2-fold increase in peripheral Tregs (NKTR-214 on left, CEA-IL2v on right):
Sources: Nektar ASCO 2017 Presentation & Brummelen et al 2017
Roche’s CEA-IL2v and FAP-IL2v block the proliferation of Treg cells in a much more elegant way compared to NKTR-214.
Nektar simply temporarily covers up the α-receptor with PEG polymers, while Roche’s drugs have the α-receptor
completely abolished. Additionally, Roche attached the resulting IL-2 variant to an antibody (CEA = cergutuzumab and
FAP = fibroblast activation protein α). By binding the mutant IL-2 to antibodies targeting cancer cells, Roche’s drugs’
effect is localized at the target site rather than systemic, which allowed Roche to safely dose its drugs at much higher
levels compared to IL-2 (the MTD for FAP-IL2v was reached at 20 mg), whereas NKTR-214 was forced to accept a very
low MTD (0.006 mg/kg). Even if NKTR-214 did not have the dose and pegylation problems that have made it nearly
inert, we believe it would be dominated CEA/FAP-IL2v.
Taking a step back, the low ceiling on Treg response makes sense in the context of historical IL-2 data. It is well-known
that high-dose IL-2 yields significantly higher response rates compared to low-dose IL-2 despite the fact that IL-2
preferentially binds to IL2Rαβγ; the FDA label for aldesleukin specifically mentions “lack of efficacy” for low-dose Il-2 for
treating cancer. If there were no such ceiling on Treg proliferation, Tregs would expand at a faster rate with dose
increases than cytotoxic T cells and a dose-dependent cancer response to IL-2 would not make sense.
Nektar’s CD8+ Claims are Brazenly Misleading
Nektar frequently cites a 30-fold average change in tumor-infiltrating lymphocyte (TIL) CD8+, which is distorted by a
single outlier patient who purportedly recorded an extreme change in TIL CD8+ but saw no clinical benefit. NKTR-214’s
disappointing change in peripheral lymphocytes makes it highly unlikely that NKTR-214 actually has a meaningful effect
on TIL CD8+: knowing that NKTR-214 induces a 33-50% change in peripheral lymphocytes, a 3,000% (30-fold) change in
tumor-infiltrating CD8+ does not seem reasonable at all.
This is corroborated by Nektar’s initial CD8+ data for NKTR-214 monotherapy, as presented at SITC 2016:
Tumor biopsies were conducted in 9 patients, and 6 of those patients’ tumors revealed an up to 10-fold increase
from baseline in CD8+ T cells and NK cells in the tumor microenvironment.
NKTR-214 CEA-IL2v

16
PLAINVIEW
If six out of nine patients saw an increase in CD8+ T cells and NK cells, this means that three out of nine patients saw a
decline— a rate that is much closer to placebo than an effective drug.
TIL CD8+ Data Presentation Creates Misleading Appearance of Efficacy
Nektar ran a 28-patient Phase 1 EXCEL trial, during which Nektar evaluated the change in tumor-infiltrating CD8+ T cells.
None of the patients actually saw a 30-fold change in TIL CD8+: one single patient saw a ~300x increase, and this skewed
the average. The reported average barely exceeded the standard error and was not even close to statistical significance;
tell-tale signs of data driven by variation rather than efficacy. Here is how Nektar transformed mediocre data into an
impressive-looking average:
Sources: ASCO GU 2017 Poster (Hurwitz et al), SITC 2016 Poster (Diab et al), & ESMO 2017 Poster (Diab et al)
What Happened to the Average-Skewing Patient?
The patient who saw the most dramatic increase (from close to zero to 2,500 CD8+ cells/mm2) is interesting because that
is an incredible result—2,500 CD8+ cells/mm2 is an exceptionally high-density CD8+ cell count. The CT scan tells a
different story however; see below and judge for yourself. Nektar claims that the tumor shrank by 1%. In our opinion,
the tumor appears to have grown:
Source: ASCO 2017 Poster (Bernatchez et al)

17
PLAINVIEW
The complete lack of response betrays the reported CD8+ value, and we conclude that this CD8+ count is far more likely a
result of poor data collection or variance than efficacy.
TIL CD8+ Cell Counts Are Imprecise & Heterogeneous
The test used to determine cell counts, immunohistochemistry (IHC) staining, is not precise and involves sampling within
a sample, which has the potential to massively skew results for each tissue sample. During IHC staining, a lab assistant
stains a sample and then looks at each cell within the sample, and manually counts how many CD8+ T cells, CD4+ T cells,
etc. he/she sees. The lab assistant is typically not counting each measure within the entire sample but a sample within
the sample and then extrapolating that for the entire sample. Predictably, this can lead to wildly variable
measurements.
There is also high variance in CD8+ T cell counts because of heterogeneity between tumor samples. Obeid et al 2017
found that the coefficient of variance for CD8+ counts in tumor samples was 77%, with CV going as high as 200% in some
samples. Below is the graphic representation of the variance in CD8+ counts in tumor samples from the same patient:
Source: Obeid et al 2017
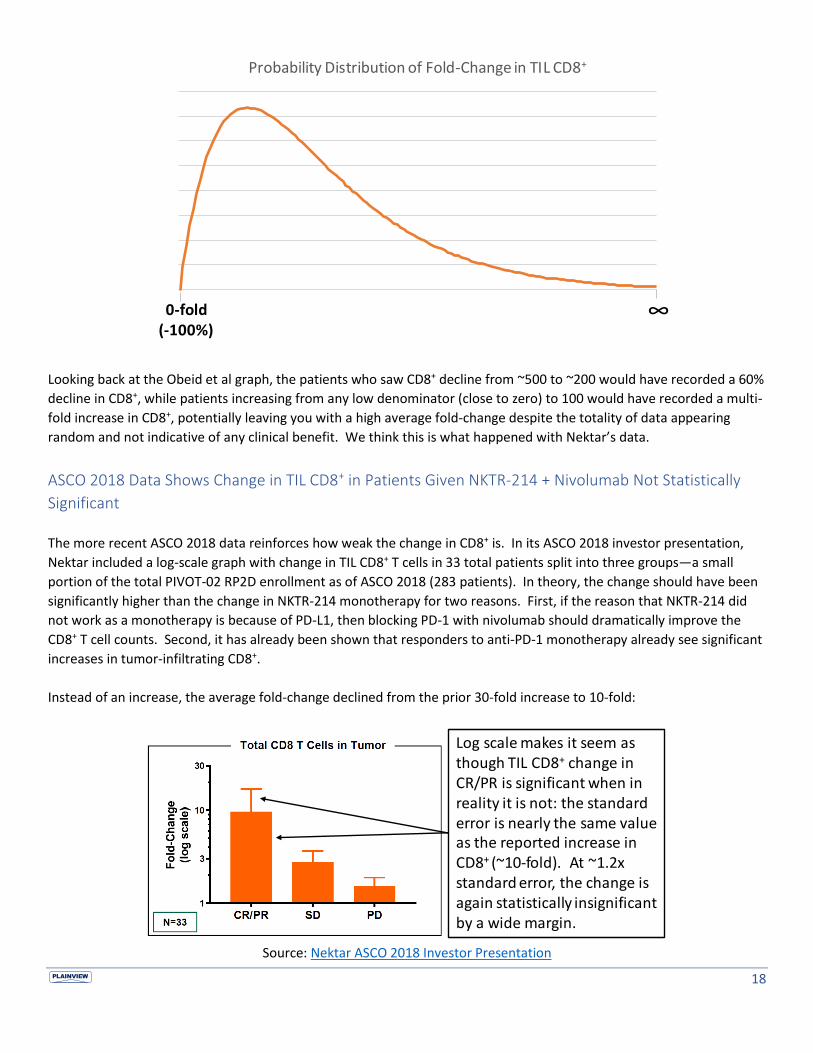
Fold-Change is Right-Skewed & Distorted by Low Initial Values
Fold-change measurements for any variable are right-skewed because there is a firm lower bound at zero (which would
represent a -100% change from baseline) and there is no upper bound:
18
PLAINVIEW
Looking back at the Obeid et al graph, the patients who saw CD8+ decline from ~500 to ~200 would have recorded a 60%
decline in CD8+, while patients increasing from any low denominator (close to zero) to 100 would have recorded a multi-
fold increase in CD8+, potentially leaving you with a high average fold-change despite the totality of data appearing
random and not indicative of any clinical benefit. We think this is what happened with Nektar’s data.
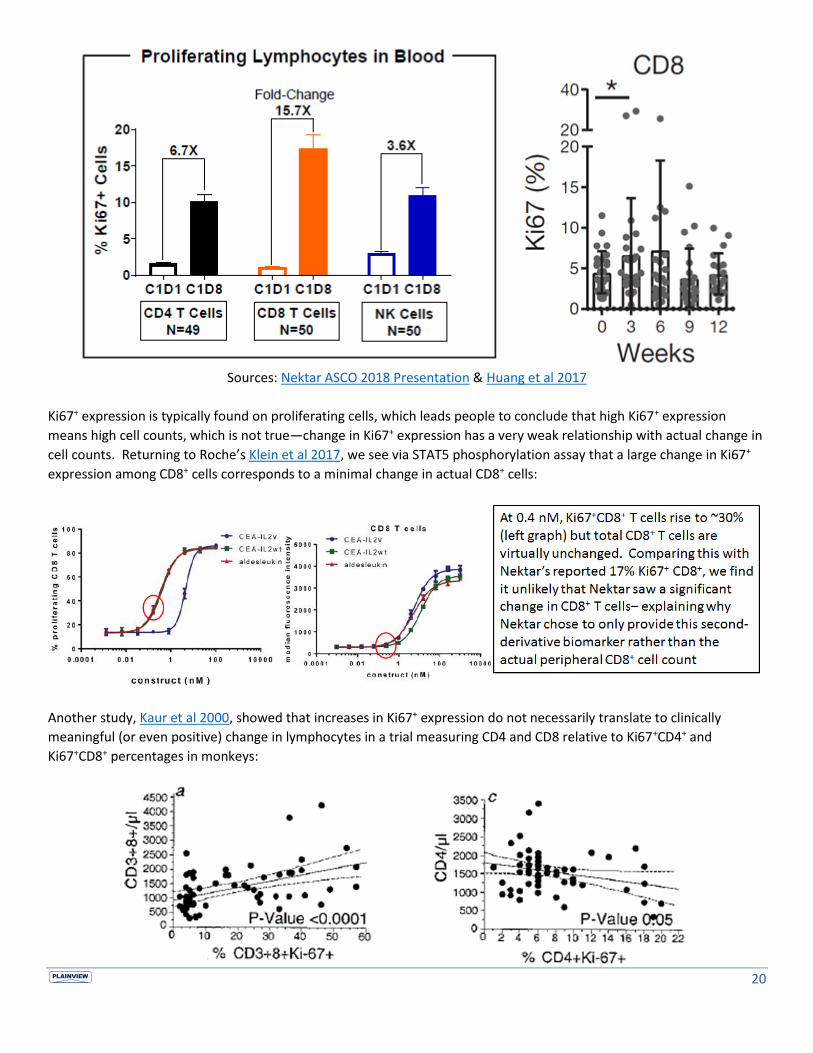
ASCO 2018 Data Shows Change in TIL CD8+ in Patients Given NKTR-214 + Nivolumab Not Statistically
Significant
The more recent ASCO 2018 data reinforces how weak the change in CD8+ is. In its ASCO 2018 investor presentation,
Nektar included a log-scale graph with change in TIL CD8+ T cells in 33 total patients split into three groups—a small
portion of the total PIVOT-02 RP2D enrollment as of ASCO 2018 (283 patients). In theory, the change should have been
significantly higher than the change in NKTR-214 monotherapy for two reasons. First, if the reason that NKTR-214 did
not work as a monotherapy is because of PD-L1, then blocking PD-1 with nivolumab should dramatically improve the
CD8+ T cell counts. Second, it has already been shown that responders to anti-PD-1 monotherapy already see significant
increases in tumor-infiltrating CD8+.
Instead of an increase, the average fold-change declined from the prior 30-fold increase to 10-fold:
Source: Nektar ASCO 2018 Investor Presentation
Probability Distribution of Fold-Change in TIL CD8+
0-fold (-100%)
∞
Log scale makes it seem as though TIL CD8+ change in CR/PR is significant when in reality it is not: the standard error is nearly the same value as the reported increase in CD8+ (~10-fold). At ~1.2x standard error, the change is again statistically insignificant by a wide margin.

19
PLAINVIEW
Like its 30-fold increase predecessor, this 10-fold change in responders is also outlier-driven. The high standard error
gives it away, and a little bit of searching turns up the culprit: Nektar previously reported in a SITC 2017 abstract
discussing preliminary PIVOT-02 results that “[i]n tumor tissue, there was an up to 450‐fold increase in tumor‐
infiltrating CD8+ T cells from baseline.” Curiously, this 450-fold appears to have been toned down sometime between
SITC 2017 and ASCO 2018, since even in a scenario where only one of the 33 patients included in the analysis is allocated
to each of the SD and PD groups, 450/31 = 14.5 average fold-change in TIL CD8+ for PR/CR patients. Allocating more
patients to the SD/PD groups would further increase the average for the CR/PR group. Median and patient-stratified
data are nowhere to be found. We believe the extremely limited disclosure from Nektar is driven by a lack of efficacy,
and that the intratumoral change in CD8+ seen in patients treated with NKTR-214 is not meaningful due to its weak
effect profile.
The lack of significant effect in combination with nivolumab should be especially concerning to investors because, as
Tumeh et al 2014 showed, PD-1 monotherapy drives significant increases in tumor-infiltrating CD8+ T cells in responders:
Change in Ki67+ Does Not Translate to Change in CD8+ Cell Count
Nektar also frequently cites a modest increase in Ki67+CD8+ T cells as proof that NKTR-214 works. Ki67+CD8+ T cells
increased to approximately 17% in PIVOT trial patients (NKTR-214 + nivolumab) compared to ~7% in patients on
pembrolizumab monotherapy:
20
PLAINVIEW
Sources: Nektar ASCO 2018 Presentation & Huang et al 2017
Ki67+ expression is typically found on proliferating cells, which leads people to conclude that high Ki67+ expression
means high cell counts, which is not true—change in Ki67+ expression has a very weak relationship with actual change in
cell counts. Returning to Roche’s Klein et al 2017, we see via STAT5 phosphorylation assay that a large change in Ki67+
expression among CD8+ cells corresponds to a minimal change in actual CD8+ cells:
Another study, Kaur et al 2000, showed that increases in Ki67+ expression do not necessarily translate to clinically
meaningful (or even positive) change in lymphocytes in a trial measuring CD4 and CD8 relative to Ki67+CD4+ and
Ki67+CD8+ percentages in monkeys:
21
PLAINVIEW
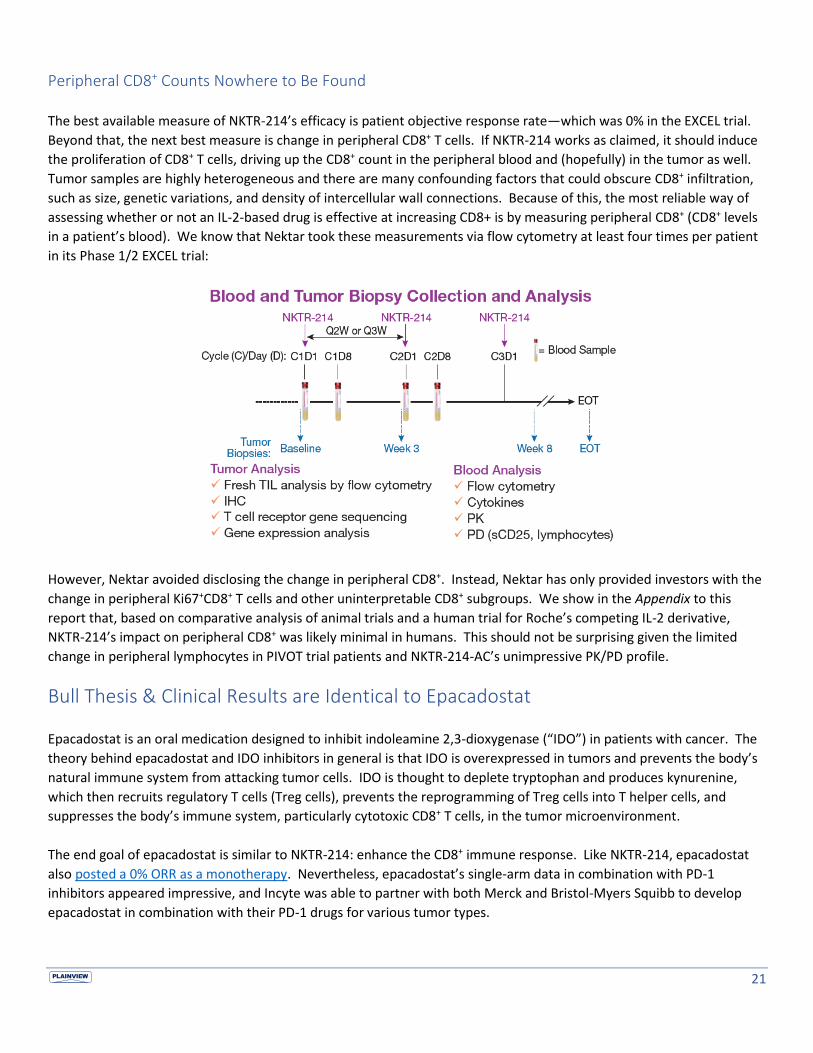
Peripheral CD8+ Counts Nowhere to Be Found
The best available measure of NKTR-214’s efficacy is patient objective response rate—which was 0% in the EXCEL trial.
Beyond that, the next best measure is change in peripheral CD8+ T cells. If NKTR-214 works as claimed, it should induce
the proliferation of CD8+ T cells, driving up the CD8+ count in the peripheral blood and (hopefully) in the tumor as well.
Tumor samples are highly heterogeneous and there are many confounding factors that could obscure CD8+ infiltration,
such as size, genetic variations, and density of intercellular wall connections. Because of this, the most reliable way of
assessing whether or not an IL-2-based drug is effective at increasing CD8+ is by measuring peripheral CD8+ (CD8+ levels
in a patient’s blood). We know that Nektar took these measurements via flow cytometry at least four times per patient
in its Phase 1/2 EXCEL trial:
However, Nektar avoided disclosing the change in peripheral CD8+. Instead, Nektar has only provided investors with the
change in peripheral Ki67+CD8+ T cells and other uninterpretable CD8+ subgroups. We show in the Appendix to this
report that, based on comparative analysis of animal trials and a human trial for Roche’s competing IL-2 derivative,
NKTR-214’s impact on peripheral CD8+ was likely minimal in humans. This should not be surprising given the limited
change in peripheral lymphocytes in PIVOT trial patients and NKTR-214-AC’s unimpressive PK/PD profile.
Bull Thesis & Clinical Results are Identical to Epacadostat
Epacadostat is an oral medication designed to inhibit indoleamine 2,3-dioxygenase (“IDO”) in patients with cancer. The
theory behind epacadostat and IDO inhibitors in general is that IDO is overexpressed in tumors and prevents the body’s
natural immune system from attacking tumor cells. IDO is thought to deplete tryptophan and produces kynurenine,
which then recruits regulatory T cells (Treg cells), prevents the reprogramming of Treg cells into T helper cells, and
suppresses the body’s immune system, particularly cytotoxic CD8+ T cells, in the tumor microenvironment.
The end goal of epacadostat is similar to NKTR-214: enhance the CD8+ immune response. Like NKTR-214, epacadostat
also posted a 0% ORR as a monotherapy. Nevertheless, epacadostat’s single-arm data in combination with PD-1
inhibitors appeared impressive, and Incyte was able to partner with both Merck and Bristol-Myers Squibb to develop
epacadostat in combination with their PD-1 drugs for various tumor types.

22
PLAINVIEW
Incyte rallied as high as $150 and at its peak, investors valued epacadostat as high as $15bn—not much higher than the
current implied value of NKTR-214.
Epacadostat Does Nothing
Incyte cratered back to $64/share after announcing that the melanoma trial had been halted due to futility on April 6,
2018. In the Phase 3 ECHO-301/KEYNOTE-252 trial, epacadostat combined with pembrolizumab produced a hazard ratio
of 1.00 for PFS (p=0.517) and a hazard ratio of 1.13 for OS (p=0.807) compared to pembrolizumab monotherapy:
These results were unsalvageable even with extensive data mining, with no significant differences between placebo and
epacadostat in any of the 20 subgroups:
Source: Incyte ASCO 2018 Presentation
The results of the ECHO-301 trial leave no doubt that epacadostat confers no benefit to cancer patients. The once-hot
IDO inhibitor class of drugs has now been thoroughly discredited: BMS has halted its trials with its IDO inhibitor BMS-
986205, Pfizer has returned rights to the IDO inhibitor EOS200271 to iTeos Therapeutics, and Roche has completely
terminated its IDO inhibitor development agreement with NewLink Genetics.
Failed IDO Inhibitor Class Achieved Comparable Phase 2 ORRs
Epacadostat’s failure is illustrative of what investors can expect from NKTR-214 because the narrative for why NKTR-214
works is nearly identical to the now-disproven epacadostat bull thesis:
1) NKTR-214/epacadostat must work, because otherwise there is no explanation for why PD-L1- patients
responded to that drug combined with a PD-1 drug

23
PLAINVIEW
2) NKTR-214/epacadostat must work because the ORRs seen in its Phase 2 combination therapy trials are
higher than Phase 3 ORRs for PD-1 monotherapy in the same indication
However, a comparison of the RCC & melanoma results for NKTR-214 with epacadostat and IDO inhibitor indoximod
shows how unremarkable Nektar’s results are:
The response rates are all within the same range, no matter how you cut the patient populations. See below for a
detailed table of the study results and the sources:
Notes & Sources:
1 NKTR-214 + nivolumab ORRs based on ASCO 2018 abstract & ASCO 2018 presentation
NA NA NANA NA NA0%
10%
20%
30%
40%
50%
60%
70%
80%
90%
1L Melanoma 1L RCC 1L MelanomaPD-L1+
1L Melanoma PD-L1-
1L RCCPD-L1+
1L RCCPD-L1-
OR
R
Comparing Phase 2 Results: NKTR-214 on Par with Failed IDO Inhibitors
NKTR-214 + Nivolumab Epacadostat + Pembrolizumab Epacadostat + Nivolumab Indoximod + Pembrolizumab
Combination Therapy Results in Melanoma & RCC
NKTR-214 + Nivolumab1 IDO Inhibitor + PD-1 Antibody
Stage 1 + Stage 2 All Patients2 Epa + Nivo3 Epa + Pem4 Indoximod + Pem6
All Patients
1L Melanoma 50% (14/28) 47% (15/32) 65% (26/40) 55% (29/53) 56% (39/70)7
1L RCC 46% (12/26) 52% (15/29) NA 47% (9/19)5 NA
PD-L1+
1L Melanoma NA 62% (8/13) 75% (9/12) 52% (17/33) 77% (17/22)7
1L RCC NA 57% (4/7) NA 50% (1/2)5 NA
PD-L1-
1L Melanoma NA 42% (5/12) 56% (9/16) 14% (1/7) 42% (8/19)7
1L RCC NA 54% (7/13) NA 60% (3/5)5 NA

24
PLAINVIEW
2 “All Patients” includes patients from dose escalation who were not included in Stage 1
3 Epacadostat + nivolumab ORRs based on ASCO 2018 abstract
4 Epacadostat + pembrolizumab melanoma ORRs from ESMO 2017, RCC ORRs from ASCO 2017
5 Epacadostat + pembrolizumab RCC data was 1L-2L while NKTR-214 + nivolumab data was all 1L
6 Indoximod + pembrolizumab ORRs based on ASCO 2018 poster
7 28/70 indoximod + pembrolizumab melanoma patients were 2L+ vs 1L for all NKTR-214 + nivolumab patients
Phase 2 Results Never Translate to Phase 3
Many Nektar bulls are comparing the NKTR-214 Phase 2 ORRs with precedent ORRs for pembrolizumab and nivolumab.
The “Phase 2 vs. Phase 3” comparison is borrowed from epacadostat; Incyte encouraged investors to make comparisons
between its Phase 2 epacadostat combination therapy results and Phase 3 results PD-1 inhibitor monotherapy. This
comparison is fundamentally flawed because in oncology, Phase 3 ORRs are nearly always worse than Phase 2 ORRs
for two primary reasons:
1) Phase 2 trials (including Nektar’s PIVOT-02 trial) typically rely on investigator assessments as opposed to the
blinded independent central review used in Phase 3 trials. There is inter- and intra-observer variability in
evaluating tumors (see Erasmus et al 2003, Oxnard et al 2011, and numerous other studies), and investigators
are naturally biased towards overstating response rates; they interact directly with the patients and want to be
able to tell sick patients that they are getting better. A blinded independent central review has no such bias.
Zhang et al 2017 compiled 28 trials with 17,466 patients, and on average, the investigator-assessed ORR was
25% higher (median 17% higher) than the blinded independent central review ORR (including both experimental
and control groups)
2) Phase 3 trials have much higher patient populations, and baseline characteristics are generally worse compared
to Phase 2 trials. There is less incentive to cherry-pick patients since Phase 3 trials are blinded and controlled.
The result of these differences is that the ORRs of Phase 3 trials are lower than Phase 2 trials. Zia et al 2005 compared
43 Phase 3 trials with 49 Phase 2 trials, and found that the ORR in Phase 3 trials was lower than preceding Phase 2 in
81% of cases with a mean difference of 12.9% (meaning that a Phase 2 ORR of 40% would translate to a Phase 3 ORR of
27.1%). In the case of epacadostat + pembrolizumab for the treatment of 1L melanoma, the decline was even worse,
with ORR moving from 55% in Phase 2 to 34% in Phase 3:
E+P Phase 2 E+P Phase 3

25
PLAINVIEW
Source: Incyte ASCO 2018 Presentation
Prior to this, Incyte spun the same story as Nektar: the Phase 2 results looked great compared to precedent Phase 3
results. Below is a comparison taken from an Incyte presentation that appeared to show epacadostat + pembrolizumab
would be superior to pembrolizumab monotherapy:
This did not pan out in Incyte’s Phase 3 trial, and we believe it will not pan out for NKTR-214 either.
Nektar’s ASCO 2018 Response Rates Will Not Improve
Nektar’s stock plunged 42% after ASCO 2018 for two primary reasons:
1) Nektar reported a decline in ORR in Stage 2 melanoma and RCC patients compared to prior dose escalation data
presented at SITC 2017. For 1L melanoma, the SITC 2017 ORR was 64% (7/11) and for 1L RCC, the SITC ORR was
6/13 (46%). At ASCO 2018, excluding the Stage 1 patients (which were primarily from the SITC 2017 cohort), the
Stage 2 ORR for 1L melanoma was 20% (3/15) and the Stage 2 ORR for 1L RCC was 33% (5/15)
2) Nektar only disclosed ORRs for 31% (87/283) patients enrolled in the trial—a sharp decline from the 95% (36/38)
ORR disclosure at SITC 2017. First rule of biotechnology investing: if a company withholds available data, that
data is virtually always bad
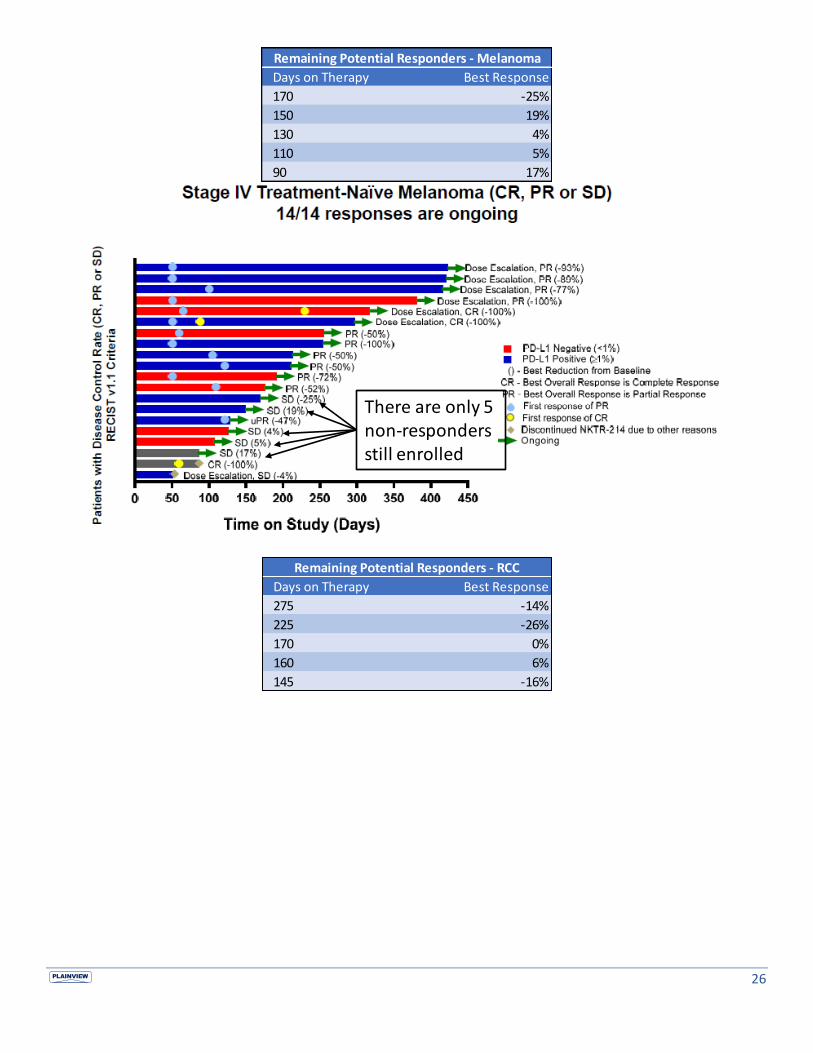
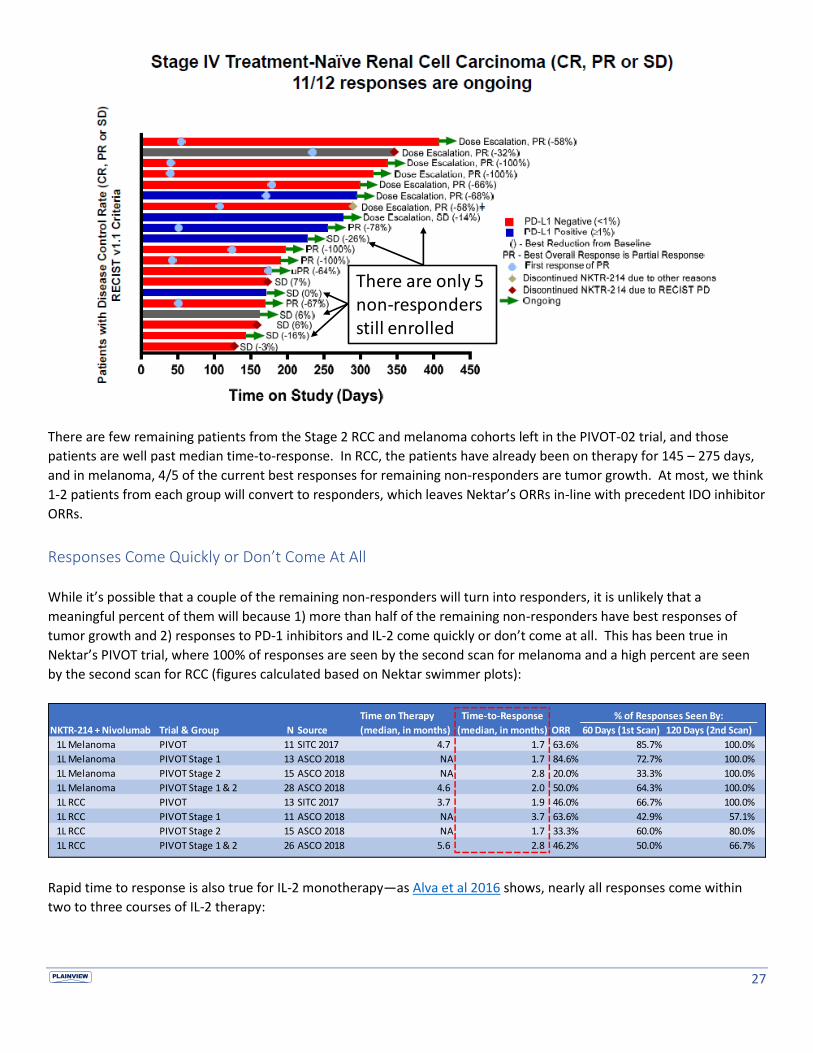
Nektar attempted to stem the bleed by telling investors that the decline in ORRs occurred because the data was not
mature, implying that it would improve materially five months later at SITC 2018. This is highly unlikely. A patient-
stratified chart in Nektar’s June 6, 2018 Jefferies presentation revealed that there are only a handful of RCC/melanoma
non-responders still enrolled in PIVOT-02 as of ASCO 2018 (five in RCC and five in melanoma), and they were all already
well-past median time-to-response (minimum of 3 months on therapy for melanoma and nearly 5 months for RCC):
26
PLAINVIEW
Remaining Potential Responders - Melanoma
Days on Therapy Best Response
170 -25%
150 19%
130 4%
110 5%
90 17%
There are only 5 non-responders still enrolled
Remaining Potential Responders - RCC
Days on Therapy Best Response
275 -14%
225 -26%
170 0%
160 6%
145 -16%
27
PLAINVIEW
There are few remaining patients from the Stage 2 RCC and melanoma cohorts left in the PIVOT-02 trial, and those
patients are well past median time-to-response. In RCC, the patients have already been on therapy for 145 – 275 days,
and in melanoma, 4/5 of the current best responses for remaining non-responders are tumor growth. At most, we think
1-2 patients from each group will convert to responders, which leaves Nektar’s ORRs in-line with precedent IDO inhibitor
ORRs.
Responses Come Quickly or Don’t Come At All
While it’s possible that a couple of the remaining non-responders will turn into responders, it is unlikely that a
meaningful percent of them will because 1) more than half of the remaining non-responders have best responses of
tumor growth and 2) responses to PD-1 inhibitors and IL-2 come quickly or don’t come at all. This has been true in
Nektar’s PIVOT trial, where 100% of responses are seen by the second scan for melanoma and a high percent are seen
by the second scan for RCC (figures calculated based on Nektar swimmer plots):
Rapid time to response is also true for IL-2 monotherapy—as Alva et al 2016 shows, nearly all responses come within
two to three courses of IL-2 therapy:
There are only 5 non-responders still enrolled
Time on Therapy Time-to-Response % of Responses Seen By:
NKTR-214 + Nivolumab Trial & Group N Source (median, in months) (median, in months) ORR 60 Days (1st Scan) 120 Days (2nd Scan)
1L Melanoma PIVOT 11 SITC 2017 4.7 1.7 63.6% 85.7% 100.0%
1L Melanoma PIVOT Stage 1 13 ASCO 2018 NA 1.7 84.6% 72.7% 100.0%
1L Melanoma PIVOT Stage 2 15 ASCO 2018 NA 2.8 20.0% 33.3% 100.0%
1L Melanoma PIVOT Stage 1 & 2 28 ASCO 2018 4.6 2.0 50.0% 64.3% 100.0%
1L RCC PIVOT 13 SITC 2017 3.7 1.9 46.0% 66.7% 100.0%
1L RCC PIVOT Stage 1 11 ASCO 2018 NA 3.7 63.6% 42.9% 57.1%
1L RCC PIVOT Stage 2 15 ASCO 2018 NA 1.7 33.3% 60.0% 80.0%
1L RCC PIVOT Stage 1 & 2 26 ASCO 2018 5.6 2.8 46.2% 50.0% 66.7%

28
PLAINVIEW
Unprecedented Data Opacity
As of ASCO 2018, Nektar has only provided ORRs for 31% (87/283) of the patients dosed in the PIVOT-02 trial. At SITC
2017, Nektar provided ORRs for 95% (36/38) of dosed patients. Incyte was called out last year for censoring a handful of
patients; we have never seen data opacity at Nektar’s level from a multi-billion dollar biotechnology company. We
believe the ASCO 2018 data censoring was an effort to hide poor data from investors.
We know that there were 283 safety-evaluable (ie dosed) patients in the PIVOT-02 trial as of May 7, 2018 based on a
disclosure in Nektar’s ASCO 2018 press release, which means that all 283 of those patients had been administered NKTR-
214 + nivolumab. We also know that 162 patients were safety-evaluable as of February 7, 2018 based on an ASCO
abstract, meaning that most of the 283 patients had likely received at least one post-baseline scan by Nektar’s final data
cut-off for ASCO 2018 (May 29, 2018). If you assume a flat distribution of patient additions between February 7 and
May 7 2018 and that initial post-baseline scans took place 8 weeks after administration, then the cut-off for patients
with at least one scan would be April 3, 2018, and there would have been 237 patients enrolled by then:
May 29 – April 3 = 55 days
May 7 – February 7 = 89 days
55/89 * (283 – 162) + 162 = 237 patients
In total, Nektar has provided data on 87 total patients, 37 of which were stale patients from dose escalation who were
enrolled at SITC 2017. If you look at how many post-SITC patients Nektar has disclosed results for as a percent of total
patients added, the number is even more alarming: (87 – 37) / (283 – 38) = 50/245, or 20% of new patients.
We summarize Nektar’s disclosures below:
% of Total Responses Produced During Each IL-2 Course
Course
First Second Third Fourth Fifth
Melanoma (n=170)
CR+PR 41.7% 29.2% 29.2% 0.0% 0.0%
RCC (n=192)
CR+PR 31.0% 58.6% 6.9% 0.0% 3.4%
29
PLAINVIEW
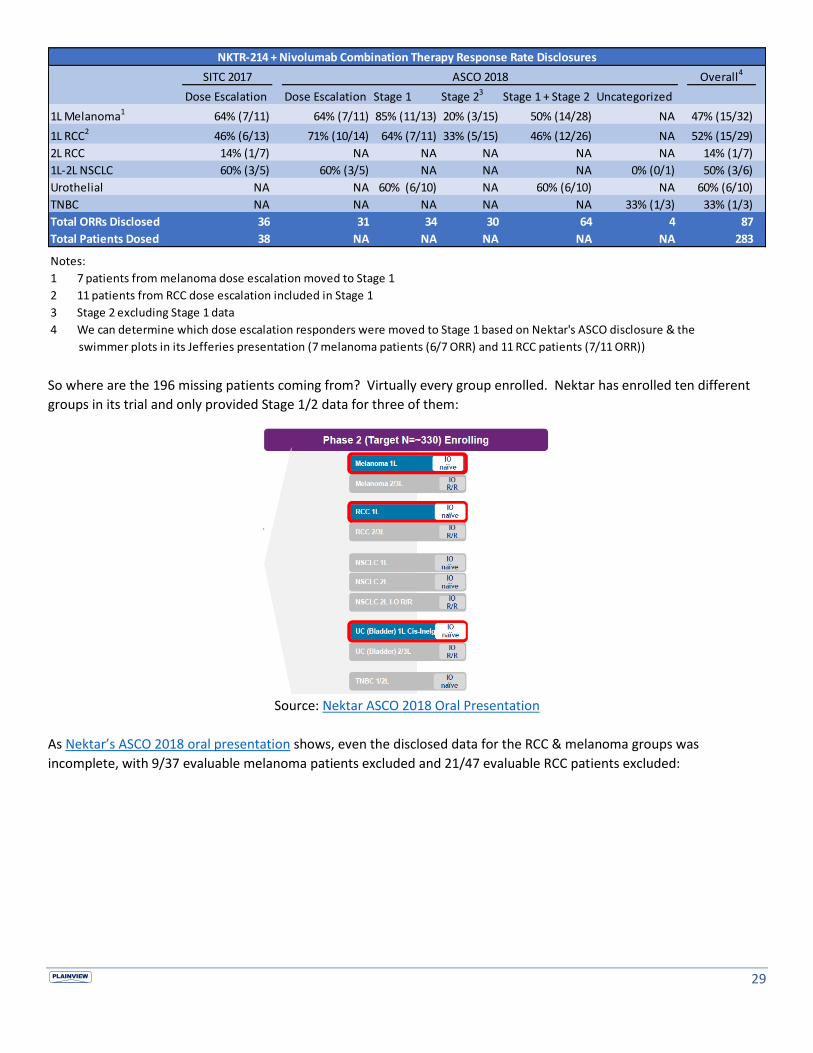
So where are the 196 missing patients coming from? Virtually every group enrolled. Nektar has enrolled ten different
groups in its trial and only provided Stage 1/2 data for three of them:
Source: Nektar ASCO 2018 Oral Presentation
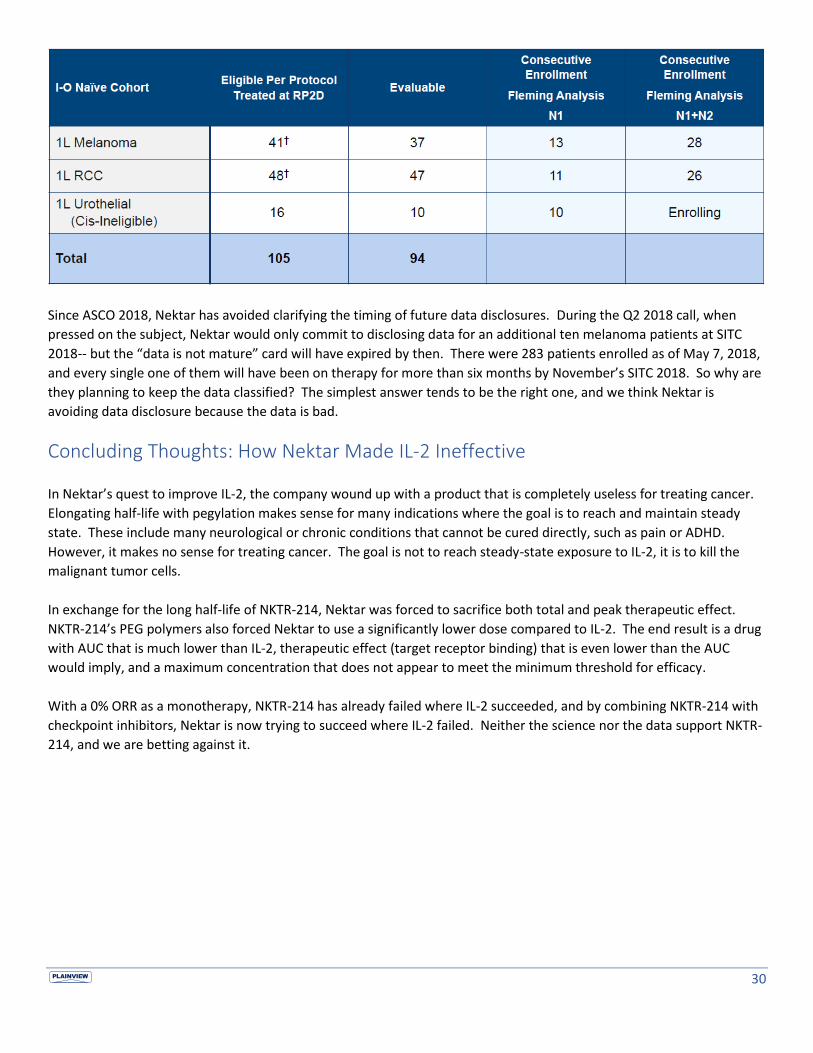
As Nektar’s ASCO 2018 oral presentation shows, even the disclosed data for the RCC & melanoma groups was
incomplete, with 9/37 evaluable melanoma patients excluded and 21/47 evaluable RCC patients excluded:
NKTR-214 + Nivolumab Combination Therapy Response Rate Disclosures
SITC 2017 ASCO 2018 Overall4
Dose Escalation Dose Escalation Stage 1 Stage 23 Stage 1 + Stage 2 Uncategorized
1L Melanoma1 64% (7/11) 64% (7/11) 85% (11/13) 20% (3/15) 50% (14/28) NA 47% (15/32)
1L RCC2 46% (6/13) 71% (10/14) 64% (7/11) 33% (5/15) 46% (12/26) NA 52% (15/29)
2L RCC 14% (1/7) NA NA NA NA NA 14% (1/7)
1L-2L NSCLC 60% (3/5) 60% (3/5) NA NA NA 0% (0/1) 50% (3/6)
Urothelial NA NA 60% (6/10) NA 60% (6/10) NA 60% (6/10)
TNBC NA NA NA NA NA 33% (1/3) 33% (1/3)
Total ORRs Disclosed 36 31 34 30 64 4 87
Total Patients Dosed 38 NA NA NA NA NA 283
Notes:
1 7 patients from melanoma dose escalation moved to Stage 1
2 11 patients from RCC dose escalation included in Stage 1
3 Stage 2 excluding Stage 1 data
4 We can determine which dose escalation responders were moved to Stage 1 based on Nektar's ASCO disclosure & the
swimmer plots in its Jefferies presentation (7 melanoma patients (6/7 ORR) and 11 RCC patients (7/11 ORR))
30
PLAINVIEW
Since ASCO 2018, Nektar has avoided clarifying the timing of future data disclosures. During the Q2 2018 call, when
pressed on the subject, Nektar would only commit to disclosing data for an additional ten melanoma patients at SITC
2018-- but the “data is not mature” card will have expired by then. There were 283 patients enrolled as of May 7, 2018,
and every single one of them will have been on therapy for more than six months by November’s SITC 2018. So why are
they planning to keep the data classified? The simplest answer tends to be the right one, and we think Nektar is
avoiding data disclosure because the data is bad.
Concluding Thoughts: How Nektar Made IL-2 Ineffective
In Nektar’s quest to improve IL-2, the company wound up with a product that is completely useless for treating cancer.
Elongating half-life with pegylation makes sense for many indications where the goal is to reach and maintain steady
state. These include many neurological or chronic conditions that cannot be cured directly, such as pain or ADHD.
However, it makes no sense for treating cancer. The goal is not to reach steady-state exposure to IL-2, it is to kill the
malignant tumor cells.
In exchange for the long half-life of NKTR-214, Nektar was forced to sacrifice both total and peak therapeutic effect.
NKTR-214’s PEG polymers also forced Nektar to use a significantly lower dose compared to IL-2. The end result is a drug
with AUC that is much lower than IL-2, therapeutic effect (target receptor binding) that is even lower than the AUC
would imply, and a maximum concentration that does not appear to meet the minimum threshold for efficacy.
With a 0% ORR as a monotherapy, NKTR-214 has already failed where IL-2 succeeded, and by combining NKTR-214 with
checkpoint inhibitors, Nektar is now trying to succeed where IL-2 failed. Neither the science nor the data support NKTR-
214, and we are betting against it.

31
PLAINVIEW
Appendix 1: AUC Calculations
NKTR-214-AC AUC: Hurwitz et al 2017
Hurwitz et al 2017 provided a graph displaying AUC by dose (see below):
We can determine the dose per kg by dividing the total doses provided on the graph by the clinical dose per kg (0.006
mg/kg). A patient being dosed at 0.5 mg would weigh 0.5/0.006 = 83.3 kg and a patient being dosed at 0.75 mg would
weigh 0.75/0.006 = 125 kg. We can then convert the AUCs into AUC per kg of patient weight; since AUC is linear to dose,
AUC per kg of patient weight is also linear to patient weight. Based on the graph above and the clinical dose of 0.006
mg/kg, the dose per kg of patient weight is approximately 15.0 ng*hr/mL per kg:
Comparing the Hurwitz AUC (15 ng*hr/mL per kg) with the AUC for IL-2 (74 – 108 ng*hr/mL per kg) puts NKTR-214’s AUC
between 14-20% of the AUC of IL-2 (15/108 = 14%, 15/74 = 20%)
NKTR-214-AC AUC: Bentebibel et al 2017
Subsequent to Hurwitz et al 2017, Nektar published a PK graph in Bentebibel et al 2017. We use this graph to reassess
the AUC of NKTR-214-AC:
0.5 mg 0.75 mg
NKTR-214-AC AUC (ng*h/mL) 1,200 1,950
Patient Weight (total dose/(dose per kg) 83.3 kg 125 kg
NKTR-214-AC AUC/weight (ng*hr/mL per kg) 14.4 15.6
32
PLAINVIEW
Source: Bentebibel et al 2017
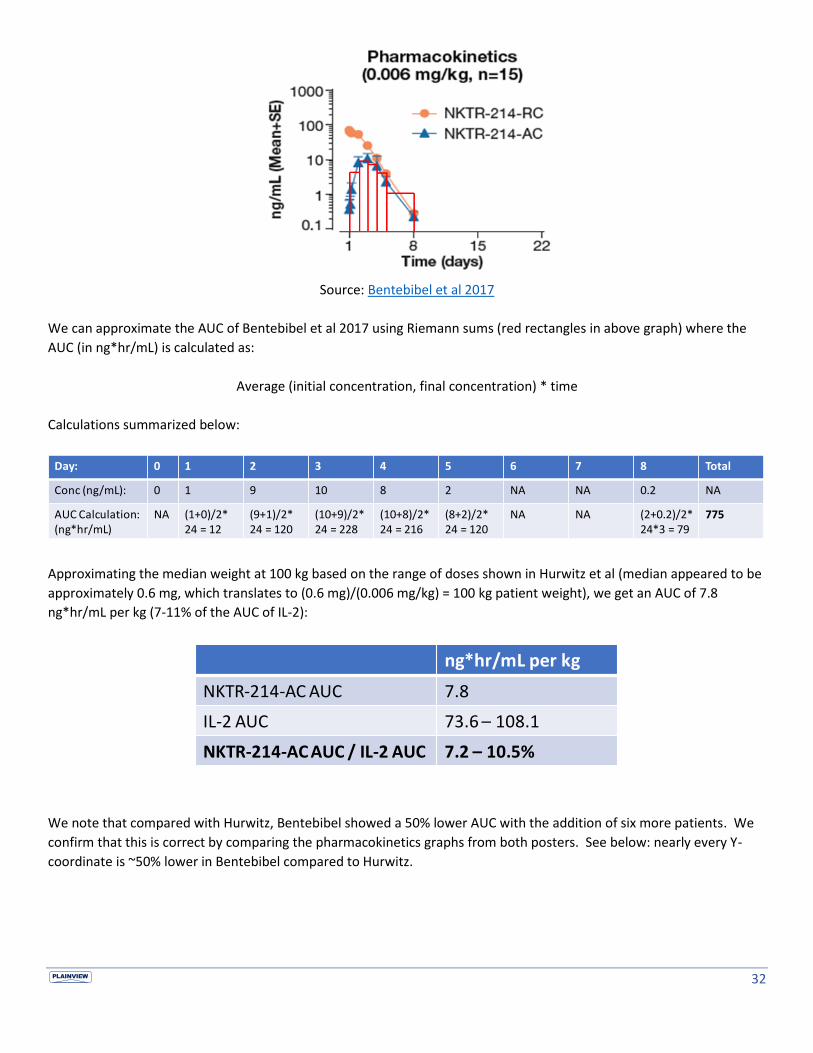
We can approximate the AUC of Bentebibel et al 2017 using Riemann sums (red rectangles in above graph) where the
AUC (in ng*hr/mL) is calculated as:
Average (initial concentration, final concentration) * time
Calculations summarized below:
Approximating the median weight at 100 kg based on the range of doses shown in Hurwitz et al (median appeared to be
approximately 0.6 mg, which translates to (0.6 mg)/(0.006 mg/kg) = 100 kg patient weight), we get an AUC of 7.8
ng*hr/mL per kg (7-11% of the AUC of IL-2):
We note that compared with Hurwitz, Bentebibel showed a 50% lower AUC with the addition of six more patients. We
confirm that this is correct by comparing the pharmacokinetics graphs from both posters. See below: nearly every Y-
coordinate is ~50% lower in Bentebibel compared to Hurwitz.
Day: 0 1 2 3 4 5 6 7 8 Total
Conc (ng/mL): 0 1 9 10 8 2 NA NA 0.2 NA
AUC Calculation:(ng*hr/mL)
NA (1+0)/2* 24 = 12
(9+1)/2* 24 = 120
(10+9)/2*24 = 228
(10+8)/2*24 = 216
(8+2)/2* 24 = 120
NA NA (2+0.2)/2*24*3 = 79
775
ng*hr/mL per kg
NKTR-214-AC AUC 7.8
IL-2 AUC 73.6 – 108.1
NKTR-214-AC AUC / IL-2 AUC 7.2 – 10.5%
33
PLAINVIEW
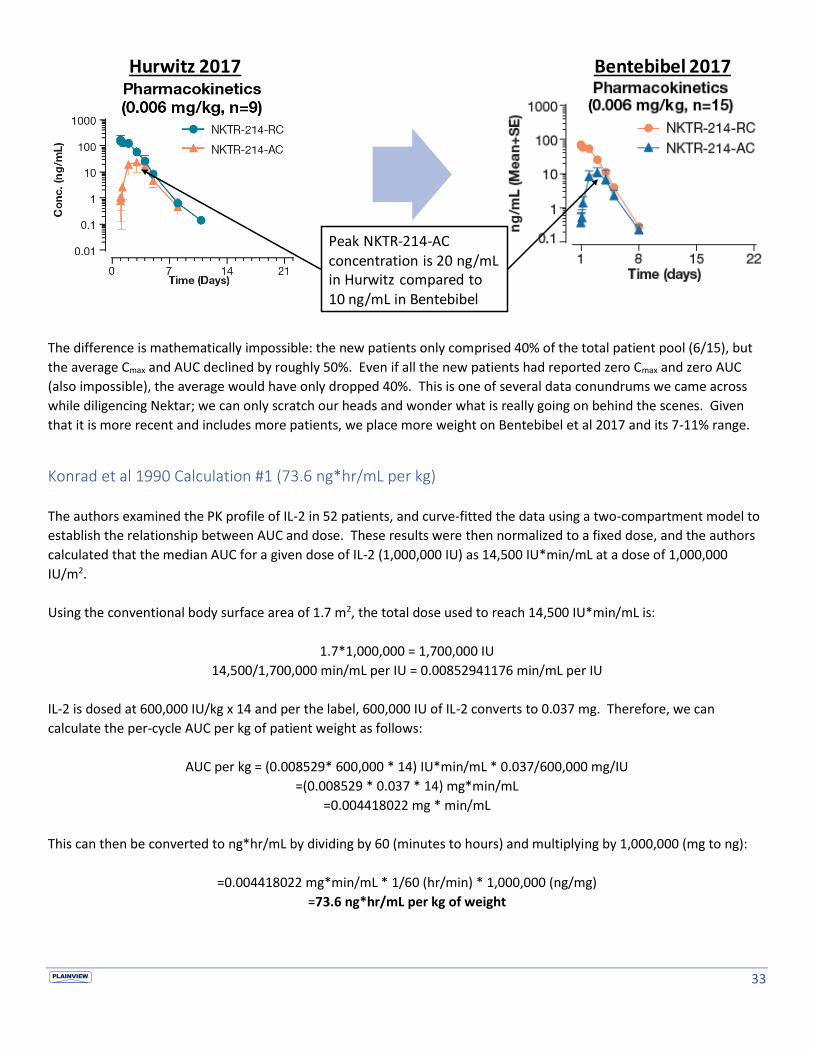
The difference is mathematically impossible: the new patients only comprised 40% of the total patient pool (6/15), but
the average Cmax and AUC declined by roughly 50%. Even if all the new patients had reported zero Cmax and zero AUC
(also impossible), the average would have only dropped 40%. This is one of several data conundrums we came across
while diligencing Nektar; we can only scratch our heads and wonder what is really going on behind the scenes. Given
that it is more recent and includes more patients, we place more weight on Bentebibel et al 2017 and its 7-11% range.
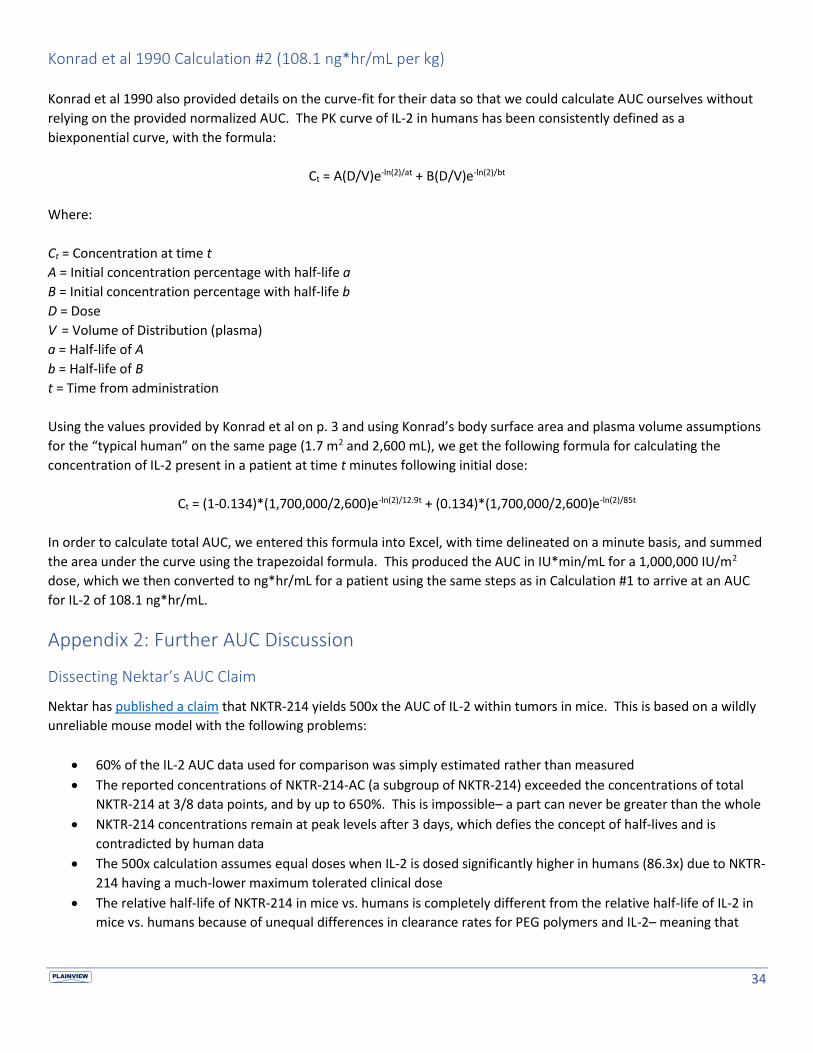
Konrad et al 1990 Calculation #1 (73.6 ng*hr/mL per kg)
The authors examined the PK profile of IL-2 in 52 patients, and curve-fitted the data using a two-compartment model to
establish the relationship between AUC and dose. These results were then normalized to a fixed dose, and the authors
calculated that the median AUC for a given dose of IL-2 (1,000,000 IU) as 14,500 IU*min/mL at a dose of 1,000,000
IU/m2.
Using the conventional body surface area of 1.7 m2, the total dose used to reach 14,500 IU*min/mL is:
1.7*1,000,000 = 1,700,000 IU
14,500/1,700,000 min/mL per IU = 0.00852941176 min/mL per IU
IL-2 is dosed at 600,000 IU/kg x 14 and per the label, 600,000 IU of IL-2 converts to 0.037 mg. Therefore, we can
calculate the per-cycle AUC per kg of patient weight as follows:
AUC per kg = (0.008529* 600,000 * 14) IU*min/mL * 0.037/600,000 mg/IU
=(0.008529 * 0.037 * 14) mg*min/mL
=0.004418022 mg * min/mL
This can then be converted to ng*hr/mL by dividing by 60 (minutes to hours) and multiplying by 1,000,000 (mg to ng):
=0.004418022 mg*min/mL * 1/60 (hr/min) * 1,000,000 (ng/mg)
=73.6 ng*hr/mL per kg of weight
Peak NKTR-214-AC concentration is 20 ng/mL in Hurwitz compared to 10 ng/mL in Bentebibel
Bentebibel 2017Hurwitz 2017
34
PLAINVIEW
Konrad et al 1990 Calculation #2 (108.1 ng*hr/mL per kg)
Konrad et al 1990 also provided details on the curve-fit for their data so that we could calculate AUC ourselves without
relying on the provided normalized AUC. The PK curve of IL-2 in humans has been consistently defined as a
biexponential curve, with the formula:
Ct = A(D/V)e-ln(2)/at + B(D/V)e-ln(2)/bt
Where:
Ct = Concentration at time t
A = Initial concentration percentage with half-life a
B = Initial concentration percentage with half-life b
D = Dose
V = Volume of Distribution (plasma)
a = Half-life of A
b = Half-life of B
t = Time from administration
Using the values provided by Konrad et al on p. 3 and using Konrad’s body surface area and plasma volume assumptions
for the “typical human” on the same page (1.7 m2 and 2,600 mL), we get the following formula for calculating the
concentration of IL-2 present in a patient at time t minutes following initial dose:
Ct = (1-0.134)*(1,700,000/2,600)e-ln(2)/12.9t + (0.134)*(1,700,000/2,600)e-ln(2)/85t
In order to calculate total AUC, we entered this formula into Excel, with time delineated on a minute basis, and summed
the area under the curve using the trapezoidal formula. This produced the AUC in IU*min/mL for a 1,000,000 IU/m2
dose, which we then converted to ng*hr/mL for a patient using the same steps as in Calculation #1 to arrive at an AUC
for IL-2 of 108.1 ng*hr/mL.
Appendix 2: Further AUC Discussion
Dissecting Nektar’s AUC Claim
Nektar has published a claim that NKTR-214 yields 500x the AUC of IL-2 within tumors in mice. This is based on a wildly
unreliable mouse model with the following problems:
• 60% of the IL-2 AUC data used for comparison was simply estimated rather than measured
• The reported concentrations of NKTR-214-AC (a subgroup of NKTR-214) exceeded the concentrations of total
NKTR-214 at 3/8 data points, and by up to 650%. This is impossible– a part can never be greater than the whole
• NKTR-214 concentrations remain at peak levels after 3 days, which defies the concept of half-lives and is
contradicted by human data
• The 500x calculation assumes equal doses when IL-2 is dosed significantly higher in humans (86.3x) due to NKTR-
214 having a much-lower maximum tolerated clinical dose
• The relative half-life of NKTR-214 in mice vs. humans is completely different from the relative half-life of IL-2 in
mice vs. humans because of unequal differences in clearance rates for PEG polymers and IL-2– meaning that
35
PLAINVIEW
even if Nektar’s data had been reliable, the AUC relationship between NKTR-214 & IL-2 in mice does not
translate to humans at all
Sources: SITC 2017 Poster (Bentebibel et al) & Charych et al 2016
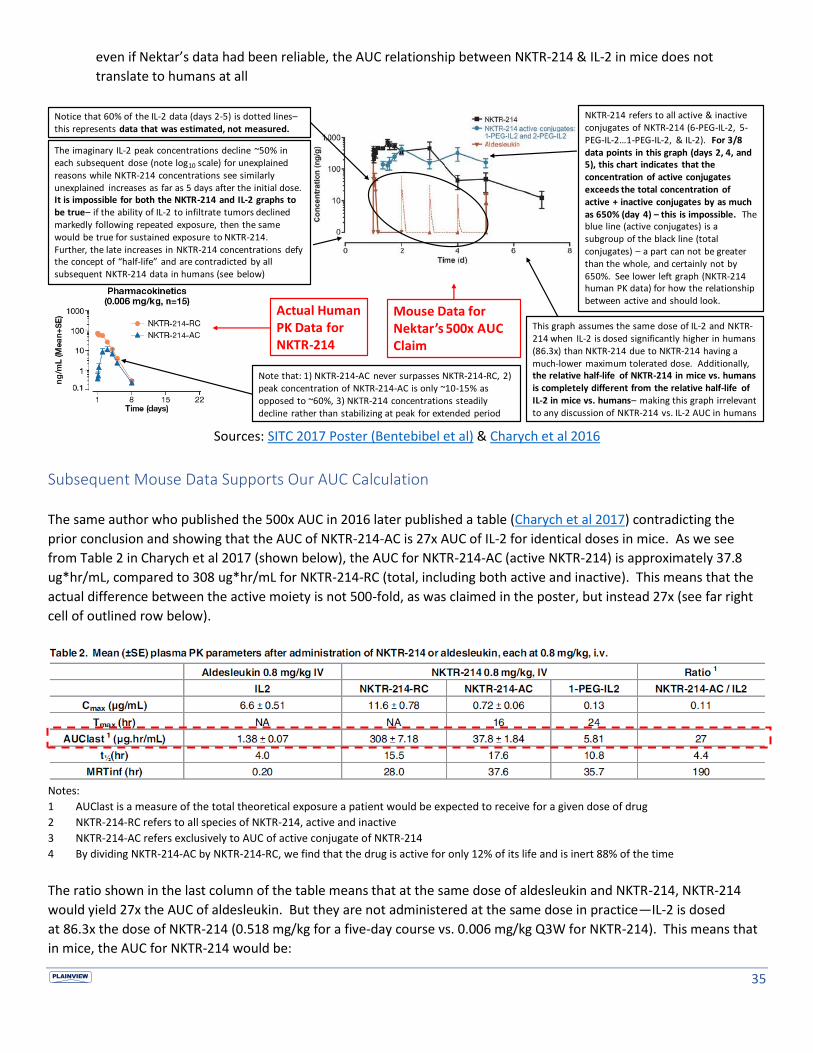
Subsequent Mouse Data Supports Our AUC Calculation
The same author who published the 500x AUC in 2016 later published a table (Charych et al 2017) contradicting the
prior conclusion and showing that the AUC of NKTR-214-AC is 27x AUC of IL-2 for identical doses in mice. As we see
from Table 2 in Charych et al 2017 (shown below), the AUC for NKTR-214-AC (active NKTR-214) is approximately 37.8
ug*hr/mL, compared to 308 ug*hr/mL for NKTR-214-RC (total, including both active and inactive). This means that the
actual difference between the active moiety is not 500-fold, as was claimed in the poster, but instead 27x (see far right
cell of outlined row below).
Notes:
1 AUClast is a measure of the total theoretical exposure a patient would be expected to receive for a given dose of drug
2 NKTR-214-RC refers to all species of NKTR-214, active and inactive
3 NKTR-214-AC refers exclusively to AUC of active conjugate of NKTR-214
4 By dividing NKTR-214-AC by NKTR-214-RC, we find that the drug is active for only 12% of its life and is inert 88% of the time
The ratio shown in the last column of the table means that at the same dose of aldesleukin and NKTR-214, NKTR-214
would yield 27x the AUC of aldesleukin. But they are not administered at the same dose in practice—IL-2 is dosed
at 86.3x the dose of NKTR-214 (0.518 mg/kg for a five-day course vs. 0.006 mg/kg Q3W for NKTR-214). This means that
in mice, the AUC for NKTR-214 would be:
NKTR-214 refers to all active & inactive conjugates of NKTR-214 (6-PEG-IL-2, 5-PEG-IL-2…1-PEG-IL-2, & IL-2). For 3/8 data points in this graph (days 2, 4, and 5), this chart indicates that the concentration of active conjugates exceeds the total concentration of active + inactive conjugates by as much as 650% (day 4) – this is impossible. The blue line (active conjugates) is a subgroup of the black line (total conjugates) – a part can not be greater than the whole, and certainly not by 650%. See lower left graph (NKTR-214 human PK data) for how the relationship between active and should look.
The imaginary IL-2 peak concentrations decline ~50% in each subsequent dose (note log10 scale) for unexplained reasons while NKTR-214 concentrations see similarly unexplained increases as far as 5 days after the initial dose. It is impossible for both the NKTR-214 and IL-2 graphs to be true– if the ability of IL-2 to infiltrate tumors declined markedly following repeated exposure, then the same would be true for sustained exposure to NKTR-214. Further, the late increases in NKTR-214 concentrations defy the concept of “half-life” and are contradicted by all subsequent NKTR-214 data in humans (see below)
Notice that 60% of the IL-2 data (days 2-5) is dotted lines–this represents data that was estimated, not measured.
This graph assumes the same dose of IL-2 and NKTR-214 when IL-2 is dosed significantly higher in humans (86.3x) than NKTR-214 due to NKTR-214 having a much-lower maximum tolerated dose. Additionally, the relative half-life of NKTR-214 in mice vs. humans is completely different from the relative half-life of IL-2 in mice vs. humans– making this graph irrelevant to any discussion of NKTR-214 vs. IL-2 AUC in humans
Mouse Data for Nektar’s500x AUC Claim
Actual Human PK Data for NKTR-214
Note that: 1) NKTR-214-AC never surpasses NKTR-214-RC, 2) peak concentration of NKTR-214-AC is only ~10-15% as opposed to ~60%, 3) NKTR-214 concentrations steadily decline rather than stabilizing at peak for extended period

36
PLAINVIEW
37.8/1.38 * 0.006/0.518 = 31.7% of the AUC for IL-2
This is higher than our 7-20% calculation for humans, but in the same ball park. The mice data does not translate
directly to humans because mice have different relative clearance rates for the two drugs and we also believe that the
data provided by Nektar is wrong—Cmax has a dramatic effect on AUC and should be nearly identical for the two drugs
when administered at the same dose instead of nearly double for NKTR-214 compared to IL-2 (6.6 ug/mL vs 11.6 ug/mL,
see Cmax line of the table above). However, even with these deficiencies, this data still affirms that the AUC for NKTR-
214-AC is significantly lower than a cycle of IL-2.
AUC Sanity Check
We can quickly estimate the difference in AUC between IL-2 and NKTR-214 by looking at the difference in dosing and
half-life.
We know from Hurwitz et al 2017 that NKTR-214 is inert for 76% of the AUC in humans, meaning that NKTR-214-AC is
24% of total AUC. We also know that NKTR-214 half-life is approximately 20 hours (consistent with Charych et al
preclinical data).
We know that IL-2 is dosed at 86.3x NKTR-214’s MTD, and we know from Konrad 1990 that the IL-2 half-life can be
modeled as a biphasic two-compartment model, with 12.9 min half-life in the first compartment (87% of initial dose)
and 85 minutes half-life in the second compartment (13% of initial dose)
Putting these together, napkin math yields 15% AUC for NKTR-214-AC vs. IL-2:
NKTR-214-AC AUC / IL-2 AUC = (86.3*1/0.24)/((12.9*0.87+85*0.13)/(20*60))
= 15.0%
This is not exact due to approximation of half-lives but confirms that the AUC calculated based on clinical data is in the
correct range.
Appendix 3: Cross-Trial Comparison of CD8+ Impact
Roche’s IL-2 variants CEA-IL2v and FAP-IL2v have a similar intended mechanism of action to NKTR-214 invoked through a
simpler and more elegant method: IL2Rα binding is completely abolished rather than temporarily blocked, preventing
the drugs from binding with the IL2Rαβγ receptor but allowing them to bind with the IL2Rβγ receptor. Comparing
murine data for CEA-IL2v with NKTR-214 suggests that NKTR-214 yields a minimal increase in peripheral CD8+ in
humans– far below the multi-fold increase required to yield effect.
Roche and Nektar both published study results for their respective drugs showing changes in peripheral CD8+ in mice
(see below):

37
PLAINVIEW
The AACR poster McNamara et al 2017 showed approximately 140% increase in peripheral CD8+ following NKTR-214
(~250 cells/uL in control group vs. ~600 cells/uL in NKTR-214 group) at a dose of 0.8 mg/kg (133.3x the clinical dose of
0.006 mg/kg). Roche’s CEA-IL2v data showed a 2,233% increase in peripheral CD8+ (~300 cells/uL in control group vs.
~7,000 cells/uL in CEA-IL2v group) at a dose of 1 mg/kg ((2.7-13.3x dose for 80 kg adult, MTD not yet established). The
magnitude of difference in impact between the two drugs (140% vs. 2,233%) despite the fact that NKTR-214 was dosed
at a significantly higher level relative to the human dose than CEA-IL2v (133.3x human dose vs. 2.7-13.3x human dose)
further confirms that NKTR-214 is weak.
Roche has also published human data for CEA-IL2v. CEA-IL2v produced a 144% increase in median peripheral CD8+
counts in humans dosed at 30 mg (n=11, 340 CD8+ cells/uL pre-treatment and 831 CD8+ cells/uL post-treatment). This
was at ~37.5% of the murine dose (assuming 80 kg weight) and the relative peripheral CD8+ increase (144%) was
approximately 6% of the increase seen in mice. A subsequent Roche abstract confirmed a median 2.3-fold increase
(130%) in peripheral CD8+ in humans. Applying this relationship to NKTR-214’s murine data and adjusting for the fact
that NKTR-214 was dosed at 133.3x human dose in mice while CEA-IL2v was dosed at ~2-14x human dose, we get a
negligible increase in peripheral CD8+ in humans given NKTR-214, thus solving the mystery of why Nektar did not
disclose change in peripheral CD8+.


![Phase 1b: Preliminary clinical activity and immune ... · Phase 1b: Preliminary clinical activity and immune activation for NKTR-262 [TLR 7/8 agonist] plus bempegaldesleukin (NKTR-214)](https://img.dokumen.tips/doc/110x75/5e2b12f484810b1f5f0a10e6/phase-1b-preliminary-clinical-activity-and-immune-phase-1b-preliminary-clinical.jpg)