Embed Size (px)
Citation preview
11
International Journal Of A
rchitecture and Urban D
evelopment
Neighborhood Environment Quality Improvement with Community Participation
Approach and Quantitative Strategic Planning Matrix (QSPM) Technique
(Case s tudy: Cyrus Neighborhood, Tehran, Iran)
1Mos tafa Tavana, 2*Mina Sufi Neyes tani1M.A.inUrbanPlanning,UniversityofTehran,Tehran,Iran.
2M.A.inUrbanPlanning,FacultyofCivil,ArchitectureandArt,DepartmentofUrbanPlanning,ScienceandResearchBranch,IslamicAzadUniversity,Tehran,Iran.
Recieved 19.07.2016 ; Accepted 11.12.2017
ABSTRACT: One of the mos t significant concerns of urban planners, at metropolitan cities, especially in old and worn out textures, is the reduction of the quality of life and the environment, so they are always seeking for a way to improve these qualities.Low level of available services and amenities, besides physical and social disorders, have caused numerous problems and have totally become as important factors of unsus tainability in such a metropolitan area. In this article, we aimed to identify those effective factors which contribute to environmental quality of neighborhoods, such as Cyrus in the city of Tehran, which have experienced urban decayed. A research method that was employed in this paper is descriptive – analytical. Data were obtained from ques tionnaires dis tributed to a randomly selected sample of 384 respondents also the interview technique was applied to gather data from residents. After that ques tionnaire was developed using the identified external and internal factors, and determined s trategies adminis tered to 30 experts in the field of urban planning. Further, experts participated in the formal group discussion in order to weight SWOT factors and prioritize the identified s trategies, respectively. The results of this s tudy sugges t that according to the perspective of residents, experts reflected in the s trategic analysis plan by using the SWOT, Internal and External (Matrix IE) and QSPM matrix; one of the key factors and the mos t preferred s trategy to improve environmental quality in Cyrus is considering social factors such as maintaining local and original residents, increasing safety/security, keeping identity of neighborhoods and creating open spaces and decent leisure places.
Keywords: Quality of Life, Environmental Quality, Neighborhood Satisfaction, Participation, QuantitativeStrategicPlanningMatrix(QSPM)
INTRODUCTIONQuality of environment has been considered as one of the important dimensions of ideal urban planning. In the recent decades, this concept is taken away from imagination and become more scientific due to functional and practical aspects have been considered from different point of views. Quality of life and related concepts such as the quality of the environment (natural and built environment), quality of housing, social security, health, urban good governance and other concepts taken from the source of the sociologis t and urban geographers
*Corresponding Author Email: mina.neyes[email protected]
International Journal of Architecture and Urban Development Vol. 8, No.1 , Winter 2018
that as it is called sus tainable development. These concepts in quantitative and qualitative aspects of life are manifes ted in the both forms of subjective and objective. Recently, the quality of life s tudies has drawn the attention of environmental designers, urban planners, and policy makers, due to its usefulness in assessing the overall life satisfaction of citizens, and monitoring public policies. Even though, the importance of the neighborhood environment remains the mos t fundamental base of life. People spend the majority of their lives in the neighborhood that has a direct effect on their
12
In
tern
atio
nal J
ourn
al o
f A
rchi
tect
ure
and
Urb
an D
evel
opm
ent
Vol.8
, N
o.1
Win
ter 2
018
economic and social life. Consequently, satisfaction with the neighborhood features is one of the imperative indicators of the neighborhood quality, which affects residents’ quality of life. (Sedaghatnia et al., 2013)During the pas t decades, the his toric core of Tehran reflects a decaying socio-spatial quality. This phenomenon in urban s tudies has been discussed as an urban issue. As this form of development does not consider the needs of the population, suffer from several problems that we can refer to lack of infras tructure facilities, chaotic, disorganized and unbalanced in urban performance, unplanned buildings, decreasing services per capita, insufficient convenience to urban different services, environmental pollution, unprincipled urban land uses and totally decreases of quality of life´s local communities and consequently residential satisfaction.Urban renewal policies involving a resident-based approach have been largely debated (Fraser & Lepofsky, 2004; Meegan & Mitchell, 2001), and community participation in local planning has been applied as a method to increase residential quality. The community’s experience can be a fundamental s tarting point in the process of creating sustainable environments, which can be more responsive to the needs and preferences of residents (Romice, 2000).As a consequence, neighborhood improvement should be based on the analysis of how residents use and experience their residential environment, and what makes them satisfied (Aiello et all., 2010).Strategic planning is one of the pillars of redevelopment and improvement programs. Proper unders tanding and precise use of s trategic planning and ins truments to develop s trategic planning makes possible access to redevelopment and improvement programs. So, in this article, efforts have been made to improve the quality of the environment for Cyrus neighborhood - in the pas t was one of the five neighborhoods forming the old Tehran- by using proper and minute instruments of objectives. The objectives of the article are:Identify factors affecting the quality of the environment in the neighborhood;Assessment of the external and internal environments of Cyrus Neighborhood Developing s trategies for the improving the quality of the environment in Cyrus neighborhood.The remainder of the article is s tructured as follows. Firs t, it reviews the literature on the concept of environment quality and neighborhood satisfaction and related concepts aimed to identify effective factors which contribute to improved quality of neighborhoods which have experienced the urban decayed and disorder, then presents the current situation of the Cyrus neighborhood from a s trategic management perspective and prioritizes appropriate s trategic recommendations using SWOT and QSPM analysis to make this neighborhood more developed. Data for determining the internal and external environment of the neighborhood were collected using ques tionnaires dis tributed to a randomly selected sample of 384 respondents, a 5 point Likert scale was used to measure the level of the various components of neighborhood satisfaction. This ranges from; 1) very dissatisfied, 2) dissatisfied, 3) neutral,
4) satisfied, and 5)very satisfied. After that ques tionnaire was developed using the identified external and internal factors, and determined s trategies adminis tered to 30 experts in the field of urban planning. Further, experts participated in the formal group discussion in order to weight SWOT factors and prioritize the identified s trategies, respectively. Finally, the process of formulating s trategic planning is presented to this neighborhood and the proposed s trategies were presented in the order of priority.
Literature Review The current economic crisis has renewed attention to the effects of urban decay on neighborhood satisfaction and quality of life. Home foreclosures, unemployment, and population decline threaten quality of life in major metropolitan areas. Scholarship has long noted how physical disorder, abandoned properties, vacant lots, and perceptions of crime are among the s tronges t predictors of one’s sense of satisfaction with the place (Dassopoulos et al.,2012, Woldoff, 2002; Ross & Mirowsky, 1999; Skogan, 1990).Yet research also sugges ts that social connections built through relationships to neighbors have a s trong impact on individuals’ satisfaction with their neighborhoods (Dassopoulos et al., 2012, Parkes et al., 2002; Lee et al., 1991). As urban and city planners s truggle to find the bes t way to spend scarce resources in mitigating the effects of urban decline, it is important to disaggregate what factors are mos t important to residents’ sense of happiness (Dassopoulos et al., 2012).Jeffres & Dobos, (1995) refer to quality of life in the broader social environment, environmental quality of life. Moller (2001) & Veenhoven, (1996) focused their s tudy on Environmental quality of life domains include satisfaction with housing, schools, health services, safety and security, roads and transport (Wes taway, 2006). In general, urban environmental quality can be defined as an urban planning process with attention to social, economic, cultural, physical and emotional indices in both mental and visible forms (Ge & Hokao, 2006; Profect & Power, 1992; Lashkari & Khalaj, 2010)Environmental quality of life, sometimes equated with service provision (Møller & Jackson, 1997, Wes taway, 2009) and cus tomer satisfaction with these services (Social Surveys, 2000), refers to the perceived and experienced quality of life in the broader social, physical and economic environment in the geographic space within which people live (Jeffres & Dobos, 1995; Rogerson, 1996, Wes taway, 2009). Environmental quality of life includes personal assessments of satisfaction with one’s house or dwelling place, schools, health services, safety and security, roads, transport, pollution levels, shopping facilities, cos t of living, and jobs or employment opportunities (Cutter, 1982; Jeffres & Dobos, 1995; Rogerson, 1996; Møller & Jackson, 1997; Social Surveys, 2000; Wes taway & Gumede, 2001; Møller, 2001, 2005; Sirgy & Cornwell, 2002; NG, 2005; Wes taway, 2006; Wes taway , 2009).Other indicators of environmental quality of life are satisfaction with social aspects such as friendly and cooperative neighbors,
13
International Journal Of A
rchitecture and Urban D
evelopment
good recreational facilities, and sense of privacy at home; physical aspects such as upkeep of homes, landscaping, crowding and noise level, and nearness of neighborhood facilities; and economic aspects such as property prices, neighborhood improvements and the cos t of living in the community (Rogerson, 1996; Wee, 2000; Møller, 2001; Parkes et al., 2002; Sirgy & Cornwell, 2002, Wes taway,2009)The ques tion of which of these aspects are mos t important for neighborhoods satisfaction is difficult to answer, because s tudies vary greatly in the range of variables they cover and their sample population (Wes taway, 2009).Neighborhood as the mos t basic urban unit is a social context within which individuals draw satisfaction and live. Furthermore, researchers believed that neighborhood satisfaction is a mediator of individual well-being and a s tarting point in unders tanding quality of life. They also indicated that, there are many factors in relation to neighborhood environment that contribute to residents‟ satisfaction which could be defined in terms of physical and social features (Sirgy & Cornwell, 2002). On the other hand, neighborhood satisfaction measures the difference between residents‟ actual and desired neighborhood’s circums tances. In fact, residents usually make their judgments about neighborhood conditions based on their needs and aspirations (Sirgy & Cornwell, 2002).While modern cities offer residents, many ways to connect with others and build community, neighborhoods remain among the mos t common settings where residents forge the attachments to people and place that create a s trong sense of quality of life. Strong, cohesive neighborhoods provide friendships, social capital, s timulate community involvement, and provide access to community resources that contribute to resident satisfaction and quality of life. Residents who report high neighborhood satisfaction have higher overall life satisfaction, mental health, and well-being (Adams 1992; Sirgy and Cornwell 2002, Dassopoulos et al.2012). Low neighborhood satisfaction is implicated in residents’ desire to move, which can disrupt neighborhood s tability and cohesion (Bolan 1997; Oh 2003, Dassopoulos et al.2012). Also Permentier surveys effect of neighborhood satisfaction and perceived reputation on intentions to leave a neighborhood (Permentier et al., 2009).The issue of public participation has received a great attention both in theoretical and practical aspects. Mos t of scholars note the citizen’s effectiveness in urban decision-makings, with the purpose of enabling them to manage the local affairs and make urban services to be optimized, and have considered the role of participation in sus tainable urban development, realization of democracy, civil society, and the other relevant as really critical. In order to reach the sus tainability and comprehensive development as well as to make the policies effective, many communities are trying to improve the sense of dynamic and active participation among their citizens (Shiehbeiki, et al., 2014). In the next section, some s tudies are reviewed in order to identify effective factors which contribute to neighborhood satisfaction and improved quality of neighborhoods.
Studies on Neighborhood Satisfaction and Neighborhood Environment QualityMany s tudies have shown that satisfaction with neighborhood features affect residents' quality of life (life satisfaction). An involvement of community in urban neighborhoods is an essential ingredient of sus tainable housing which affects their quality of life (Choguill, 2007). A s tudy in Malaysia has shown that residential neighborhood satisfaction is an important indicator of housing quality and condition which affects individuals' quality of life. It determines the way they respond to their residential neighborhood and environment (Abdul Ghani, 2008).Fried (1984) found that feelings about neighborhoods are the second mos t important factor, after feelings about family, in explaining people’s overall life satisfaction. Adams (1992) also found that neighborhood satisfaction had a positive relation to the quality of life and self-efficacy.Neighborhood quality, has been defined as the degree of excellence or goodness found in terms of four dimensions; 1) the physical environment, 2) access to various activity nodes, 3) local services and facilities, and 4) the neighborhood’s sociocultural setting (Connerly & Marans 1988, Chapman & Lombard, 2006).Studies on neighborhood satisfaction serve various purposes, including description or indication of the quality of life and other social phenomena like residential satisfaction, residential mobility and sense of belonging and present housing conditions (Amerigo & Aragones, 1990; Fang, 2006). They are also used in assessing residents‟ well-being and livability of environments (Hur & Morrow-Jones, 2008; Leby & Hashim, 2010) and can serve as feedback to planners and adminis trators to meet the needs of residents and for residents to make appropriate housing choices (Basolo & Strong, 2002) and as a measure of success or failure of mass housing (Gruber & Shelton, 1987; Djerbani & Al-Abed, 2000) and urban revitalization projects (Fang, 2006). Indeed, s tudies on neighborhood satisfaction have generally shown that the level of residents‟ satisfaction with their neighborhoods has far reaching implications not only for their health and well-being but also on their mobility decisions and willingness to contribute to improvements in the neighborhood as explained by Hur & Morrow-Jones (2008).Lovejoy et al, (2010) summarized empirical studies since 1980 that looked at built environmental factors which were associated with neighborhood satisfaction. The built environment factors in these s tudies were: proximity to businesses, shopping and work, public transit, availability of parking, recreational facilities, s treet lighting, view of nature or greenery, open space, blight or vandalism, traffic congestion, density, and public housing. In their s tudy on characteristics associated with higher level of neighborhood satisfaction among residents in traditional and suburban neighborhoods in northern California region of the US. Therefore, neighborhood satisfaction is generally understood to mean the assessment of the extent to which neighborhood environments are meeting the needs, expectations and aspirations of residents.They find that neighborhood satisfaction is higher among the
14
In
tern
atio
nal J
ourn
al o
f A
rchi
tect
ure
and
Urb
an D
evel
opm
ent
Vol.8
, N
o.1
Win
ter 2
018
traditional neighborhood residents, even after controlling for socio demographics and other characteris tics. Differences in the characteris tics associated with satisfaction in each group include the perception of liveliness and diversity, contributing significantly only among the segment of the sample living in traditional neighborhoods, and the perception of economic homogeneity, contributing significantly only among the suburban segment. Features such as parking, yards, and school quality do not emerge as important predictors of satisfaction for either group. The mos t important features for neighborhood satisfaction among both groups are the attractive appearance and perceived safety of neighborhoods, sugges ting that any innovative neighborhood designs are mos t likely to succeed in attracting residents if able to fos ter these qualities. Oktay & Marans (2010) the results from a survey of the adult population in the his toric core of the city of Famagusta analyzed in order to unders tand their overall evaluation of the quality of urban life and the degree of satisfaction with their neighborhood which reflects a decaying socio-spatial quality. In addition, the role neighborhood attributes (Urban/environmental attributes such as accessibility, attractiveness of the place; Social attributes appropriateness as a place to live, availability of things to do, appropriateness as a place to raise children; Physical attributes:, cleanliness, noise level and traffic intensity), the use and evaluation of the cultural and recreational activities, and safety might play on the overall satisfaction ques tioned.This s tudy aimed to identify key indicators affecting the residents' perception of overall quality of urban life in the Walled City of Famagus ta, the his toric core of the city, which reflects a decaying socio-spatial quality. They firs t present a brief overview of the research methodology and then analyze the results from a household survey carried out in the Walled City, in order to provide a sheer unders tanding of people's feelings about their neighborhood environment and the overall urban quality of life in case of implementation of a possible regeneration scheme for the area. The research contributes some empirical evidence to verify the claimed benefits and shortcomings in terms of effects of neighborhood satisfaction, sense of community, a sense of belonging, neighborhood attributes, use/evaluation of cultural and recreational opportunities and safety on the overall quality of urban life of the residents, as well as to identify the predictors of the neighborhood satisfaction (Oktay & Marans, 2010).Salleh & Badarulzaman ,(2011) advanced that previous research findings on resident satisfaction has provided a basis for measuring housing satisfaction which includes; Dwelling units satisfaction, Neighborhood quality satisfaction, Management services satisfaction as provided by the developers or land owner, satisfaction with the facilities and amenities within the building s tructure and its surroundings.Salleh (2008) examines two influencing factors of quality of life to include satisfaction towards housing and the surroundings; and the findings reveal neighborhood factors as the most significant on housing satisfaction. The factors contributing to a low level of satisfaction were related to neighborhood facilities
and surrounding areas; which are poor public transportation, lack of children’s playground, multi-purpose hall, parking areas, safety and facilities for the disabled. Ramdane & Abdullah, 2000 (cited in Salleh & Badarulzaman, 2011) discovers three factors affecting satisfaction towards housing; dwelling units, neighborhood and community service factors. Neighborhood factors recorded high significance regarding housing satisfaction variables.Taeeb Rashid (2013) examines the perception of residential environmental satisfaction, of old (Malkendi) and new (Bakhtiari nwe) neighborhood in Slemani city, Kurdis tan-Iraq. Through a household survey, 200 respondents were randomly sampled in each of the two neighborhoods. Spear man rank correlation technique was used to tes t the relationship that exis ts between some neighborhood choice factors and level of satisfaction of residents. Findings showed that the respondents’ choice of neighborhood with respect to safety, provision of facilities/services and social environment was significantly related to their level of neighborhood satisfaction. This sugges ts that the quality of physical and social environment to a certain level fulfills the intentions of residents in choosing to live in the neighborhoods, but the new neighborhood tended to perform better. There is a need for policy makers and planners to revitalize the infras tructures, especially road networks and building s tructures in the old neighborhood to ensure that residents’ welfare and satisfaction are adequately met.Iran has recently paid special attention to evaluate urban environmental quality by using various indicators. In a main s tudy after reviewing traditional methods, a model has been presented for evaluation of urban environmental quality (Bahrainy & Tabibian, 1998). On the other hand, quantitative and qualitative characteris tics of Tehran’s environmental quality (safety and security, well- being and health, equipment and amenities, social environment, housing, transport and energy) were evaluated as an average with a score of 53.3% in a similar s tudy that was conducted in 1996 (Tabibian & Faryadi, 2002). After that, Tehran's urban environmental quality (dis tribution of services, social environment, urban utilities and services, housing, safety and security, transportation) has been evaluated again by reforming and optimization previous indicators (Seifollahi & Faryadi, 2011).In summary, the extant literature has concentrated on physical, social, environmental attributes of the environment that effect on neighborhood satisfaction and environmental quality, examining social environment, urban utilities and services, housing, safety and security, transportation and etc. at the dwelling, neighborhood and community scale, often with conflicting findings. So, this article is going to make a difference with previous s tudies by identifying effective factors which contribute to improved quality of neighborhoods which have experienced the urban decayed and disorder, from the viewpoint of residents and experts in the field of urban planning by using SWOT and QSPM analysis.
The Technique of Quantitative Strategic PlanningMatrix (QSPM) determines the relative attractiveness of
15
International Journal Of A
rchitecture and Urban D
evelopment
s trategies. For this purpose, major external opportunities and threats, and internal s trengths and weaknesses are written down in the right-side column of the strategic planning matrix. The information is obtained directly from the internal and external factor evaluation matrixes. A weight or coefficient is assigned to the external and internal factors which play an important role in the sys tem’s success (Aus tin & Hapkins, 2004). The coefficients are right like the coefficients of the internal and external factor evaluation matrixes. In the next s tep, the matrixes of the second phase are compared to each other, and the s trategies the sys tem is to adopt and implement are determined. These s trategies are written down in the top row of the s trategic planning matrix. Then, attractiveness scores are determined. These are numerical values which indicate attractiveness of each s trategy within a set of s trategies. In order to determine the attractiveness score, those internal and external factors having an important role in the sys tem’s success are s tudied. Then, a ques tion is raised about each of them: does this factor have any important role in the process of choosing or adopting the s trategies?If so, then the s trategies should be compared to each other with respect to the key factor. In particular, the attractiveness scores should be determined for each of the s trategies so that the importance of a s trategy relative to the other ones can be determined (with respect to the factor in ques tion). The attractiveness score is as follows; 1) without attractiveness, 2) somewhat attractive, 3) having reasonable attractiveness, 4) very attractive. If the answer to the ques tion above is no, it indicates that the factor does not have any important role (in terms of the s trategy’s success) in the process of choosing the s trategies, and so should not be assigned an attractiveness score.Finally,the sum of the attractiveness scores is calculated. The goal of summing the attractiveness scores is to obtain the product of the coefficient (second phase) multiplied by the attractiveness scores (the fourth phase). The sum of the attractiveness scores indicates the relative attractiveness of each of the s trategies, which is obtained only through considering the effect of the relevant external and internal factors. The higher the attractiveness scores are, the more attractive the s trategy in ques tion will be (of course, with respect to the factors considered). The tremendous difference between the sums of the attractiveness scores in each set of s trategies indicates a s trategy to be more desirable than the other one (Shiehbeiki et al., 2014).In the next sections, we describe the s tudy area, and then explain the methodology employed to assess the environmental quality of neighborhoods.
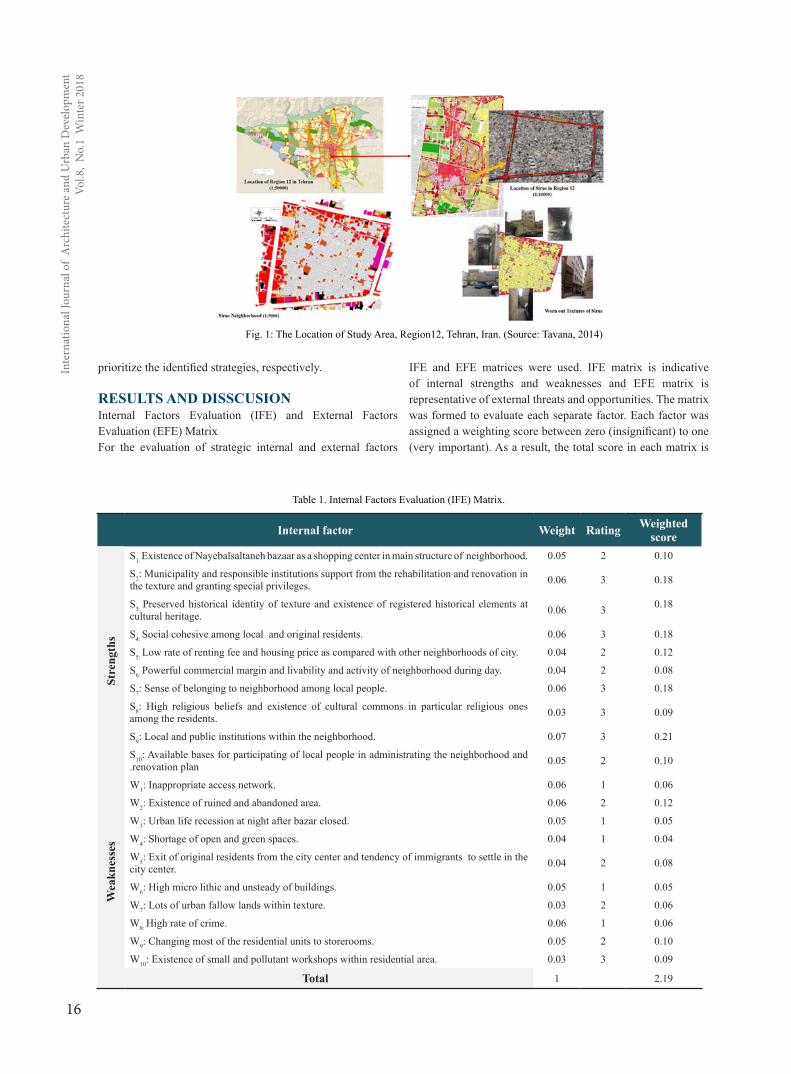
Study AreaThe firs t s tep in the analysis is recognizing the characteris tics of the s tudy area. Cyrus neighborhood, which was named Chalemeydan in the pas t was one of the five neighborhoods forming the old Tehran. Cyrus neighborhood in the urban divisions of Tehran is at dis trict No. 17 of Region No. 12 with an area of about 40 hectares. It is bordered with 15 Khordad
Street in the north, Ray in the eas t, Molavi in the south and Mos tafa Khomeini in the wes t of its limits. In three corners related to it, there are important cross sections such as Qiyam square, Molavi intersection and Cyrus Intersection. With the es tablishment of over crossing bridge over Ray Street and broadening this pivot, the fourth corner has a disordered situation. Following the des truction of neighboring units, this s treet has found a destructive and ruined form. The shape of this urban block is irregular trapezoid whose highest side along with 15 Khordad Street has 710 meters of length and its shortes t side has a 500 meters long. The two neighboring sides of Molavi and Cyrus have s tretched 650 and 700 meters accordingly (Tehran Municipality, 2007; Akbarpour Saraskanroud, 2011).The declining trend of neighborhood over the pas t decades has led to exit of the original residents from the city center and tendency of immigrants and low income people to settle in it that predispose physical and social problems in the neighborhood. Worn out and decayed texture, inappropriate access network alongside ruined, abandoned spaces and vacant lots and the inappropriate construction with the texture are the most important physical characteristics of the neighborhood. Socially, settlement of immigrants and low income people, high rate of social problems, crime and insecurity in neighborhoods with low level of social capital are the main problems in the neighborhood.
MATERIALS AND METHODSAccording to the goal of this article neighborhood environmental quality improvement, research method that was employed in this paper is descriptive – analytical. Data were obtained from ques tionnaires dis tributed to a randomly selected sample of 384 respondents-Cochran method for determining the sample size is used- also the interview technique was applied to gather data from residents -with emphasis on the opportunities provided for citizen participation- of the Cyrus neighborhood. Ques tionnaires have been completed by two trained people. To avoid bias resulting from ques tionnaire design, the ques tions were cons tructed in such a way that they were direct, simple and familiar to the respondents. Nevertheless, some explanations by the interviewers were expected to clarify certain points so that certain level of consis tency could be achieved in the interview.The ques tionnaire was divided into 4 parts: physical, social, environmental and functional. However, the instruments were prepared based on the previous neighborhood satisfaction s tudies and documents related to the powers and limits of city, regional and national macro plans, improvement plans of the neighborhood with little adjus tment to suit the purpose of the research. A 5 point Likert scale was used to measure the level of the various components of neighborhood satisfaction. This ranges from; 1) very dissatisfied, 2) dissatisfied, 3) neutral, 4) satisfied, and 5) very satisfied. After that ques tionnaire was developed using the identified external and internal factors, and determined s trategies adminis tered to 30 experts in the field of urban planning. Further, experts participated in the formal group discussion in order to weight SWOT factors and
16
In
tern
atio
nal J
ourn
al o
f A
rchi
tect
ure
and
Urb
an D
evel
opm
ent
Vol.8
, N
o.1
Win
ter 2
018
prioritize the identified s trategies, respectively.
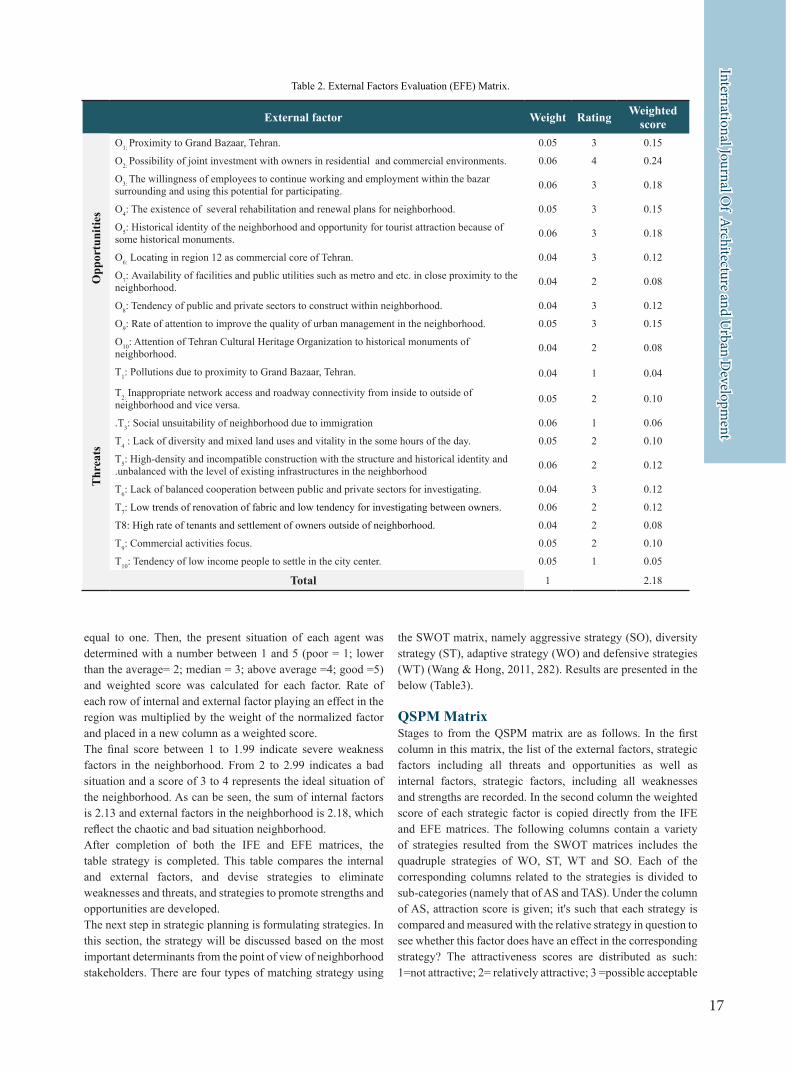
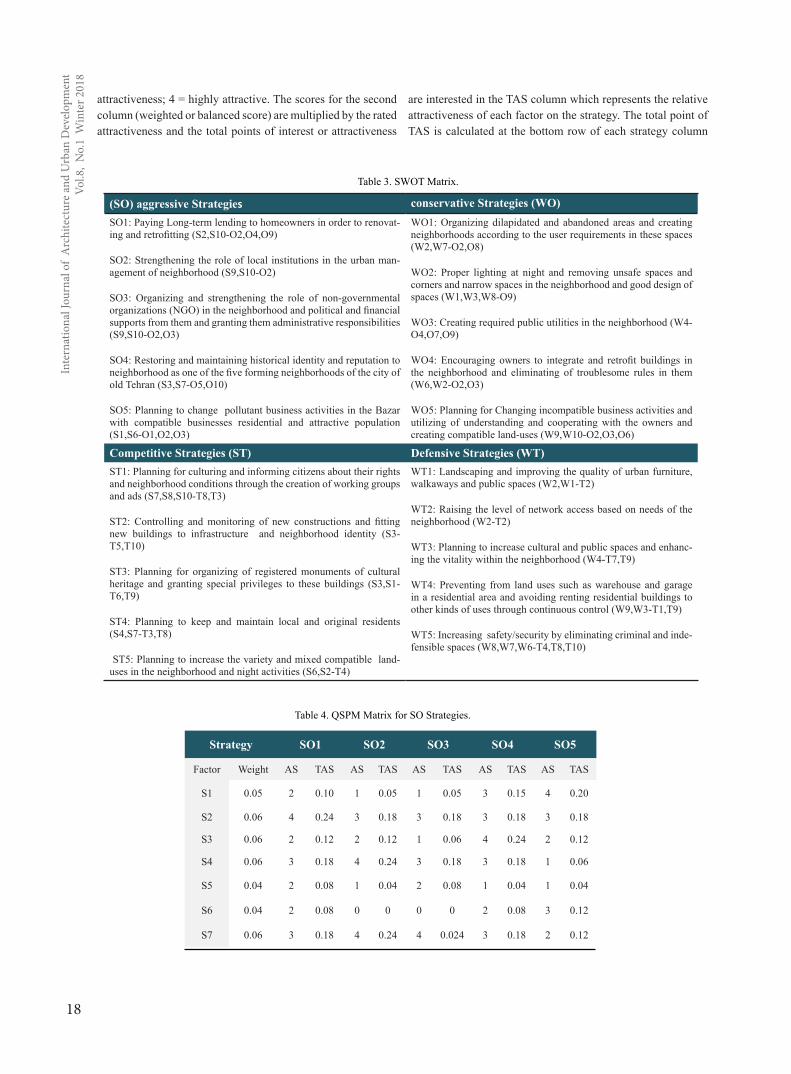
RESULTS AND DISSCUSIONInternal Factors Evaluation (IFE) and External Factors Evaluation (EFE) Matrix For the evaluation of s trategic internal and external factors
IFE and EFE matrices were used. IFE matrix is indicative of internal strengths and weaknesses and EFE matrix is representative of external threats and opportunities. The matrix was formed to evaluate each separate factor. Each factor was assigned a weighting score between zero (insignificant) to one (very important). As a result, the total score in each matrix is
Fig. 1: The Location of Study Area, Region12, Tehran, Iran. (Source: Tavana, 2014)
Internal factor Weight Rating Weightedscore
Stre
ngth
s
S1: Exis tence of Nayebalsaltaneh bazaar as a shopping center in main s tructure of neighborhood. 0.05 2 0.10
S2: Municipality and responsible ins titutions support from the rehabilitation and renovation in the texture and granting special privileges. 0.06 3 0.18
S3: Preserved his torical identity of texture and exis tence of regis tered his torical elements at cultural heritage. 0.06 3 0.18
S4: Social cohesive among local and original residents. 0.06 3 0.18
S5: Low rate of renting fee and housing price as compared with other neighborhoods of city. 0.04 2 0.12
S6: Powerful commercial margin and livability and activity of neighborhood during day. 0.04 2 0.08
S7: Sense of belonging to neighborhood among local people. 0.06 3 0.18
S8: High religious beliefs and exis tence of cultural commons in particular religious ones among the residents. 0.03 3 0.09
S9: Local and public institutions within the neighborhood. 0.07 3 0.21
S10: Available bases for participating of local people in adminis trating the neighborhood and.renovation plan 0.05 2 0.10
Wea
knes
ses
W1: Inappropriate access network. 0.06 1 0.06
W2: Existence of ruined and abandoned area. 0.06 2 0.12
W3: Urban life recession at night after bazar closed. 0.05 1 0.05
W4: Shortage of open and green spaces. 0.04 1 0.04
W5: Exit of original residents from the city center and tendency of immigrants to settle in the city center. 0.04 2 0.08
W6: High micro lithic and unsteady of buildings. 0.05 1 0.05
W7: Lots of urban fallow lands within texture. 0.03 2 0.06
W8: High rate of crime. 0.06 1 0.06
W9: Changing mos t of the residential units to s torerooms. 0.05 2 0.10
W10: Exis tence of small and pollutant workshops within residential area. 0.03 3 0.09
Total 1 2.19
Table 1. Internal Factors Evaluation (IFE) Matrix.
17
International Journal Of A
rchitecture and Urban D
evelopment
equal to one. Then, the present situation of each agent was determined with a number between 1 and 5 (poor = 1; lower than the average= 2; median = 3; above average =4; good =5) and weighted score was calculated for each factor. Rate of each row of internal and external factor playing an effect in the region was multiplied by the weight of the normalized factor and placed in a new column as a weighted score. The final score between 1 to 1.99 indicate severe weakness factors in the neighborhood. From 2 to 2.99 indicates a bad situation and a score of 3 to 4 represents the ideal situation of the neighborhood. As can be seen, the sum of internal factors is 2.13 and external factors in the neighborhood is 2.18, which reflect the chaotic and bad situation neighborhood.After completion of both the IFE and EFE matrices, the table s trategy is completed. This table compares the internal and external factors, and devise s trategies to eliminate weaknesses and threats, and s trategies to promote strengths and opportunities are developed. The next s tep in s trategic planning is formulating s trategies. In this section, the s trategy will be discussed based on the most important determinants from the point of view of neighborhood s takeholders. There are four types of matching s trategy using
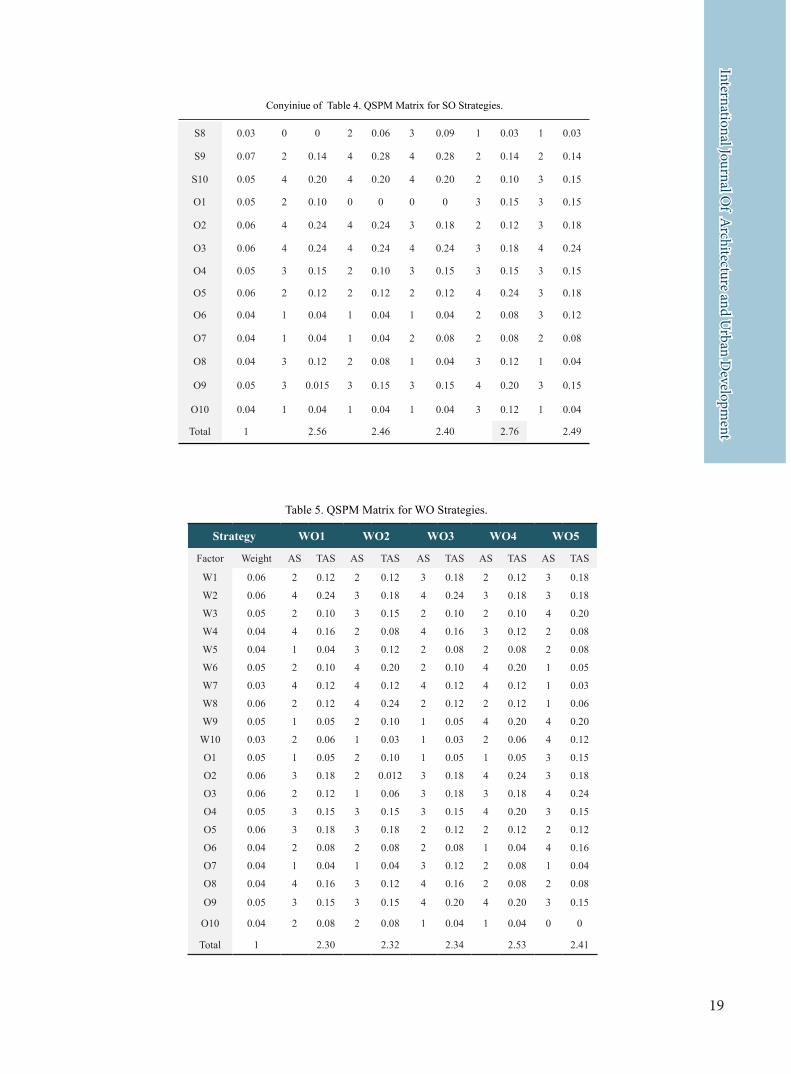
the SWOT matrix, namely aggressive s trategy (SO), diversity s trategy (ST), adaptive strategy (WO) and defensive s trategies (WT) (Wang & Hong, 2011, 282). Results are presented in the below (Table3).
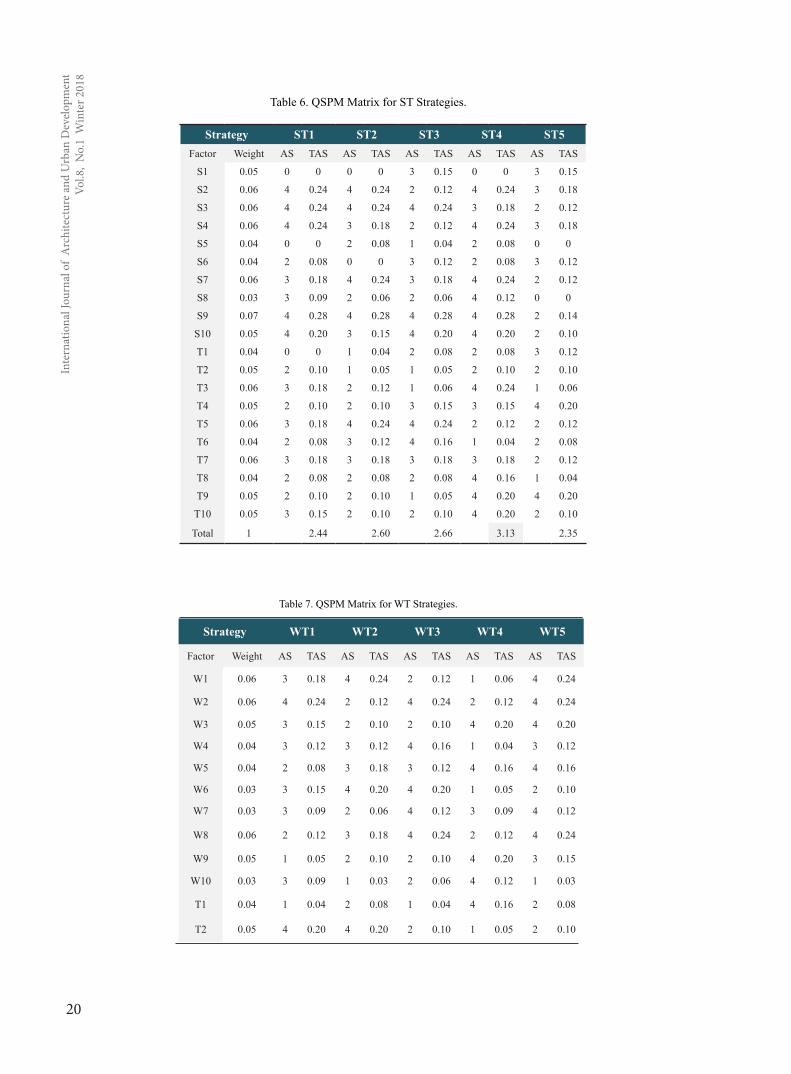
QSPM Matrix Stages to from the QSPM matrix are as follows. In the firs t column in this matrix, the lis t of the external factors, s trategic factors including all threats and opportunities as well as internal factors, s trategic factors, including all weaknesses and s trengths are recorded. In the second column the weighted score of each strategic factor is copied directly from the IFE and EFE matrices. The following columns contain a variety of s trategies resulted from the SWOT matrices includes the quadruple s trategies of WO, ST, WT and SO. Each of the corresponding columns related to the s trategies is divided to sub-categories (namely that of AS and TAS). Under the column of AS, attraction score is given; it's such that each s trategy is compared and measured with the relative s trategy in ques tion to see whether this factor does have an effect in the corresponding s trategy? The attractiveness scores are dis tributed as such: 1=not attractive; 2= relatively attractive; 3 =possible acceptable
External factor Weight Rating Weightedscore
Opp
ortu
nitie
s
O1: Proximity to Grand Bazaar, Tehran. 0.05 3 0.15
O2: Possibility of joint inves tment with owners in residential and commercial environments. 0.06 4 0.24
O3: The willingness of employees to continue working and employment within the bazar surrounding and using this potential for participating. 0.06 3 0.18
O4: The exis tence of several rehabilitation and renewal plans for neighborhood. 0.05 3 0.15
O5: His torical identity of the neighborhood and opportunity for touris t attraction because of some his torical monuments. 0.06 3 0.18
O6: Locating in region 12 as commercial core of Tehran. 0.04 3 0.12
O7: Availability of facilities and public utilities such as metro and etc. in close proximity to the neighborhood. 0.04 2 0.08
O8: Tendency of public and private sectors to construct within neighborhood. 0.04 3 0.12
O9: Rate of attention to improve the quality of urban management in the neighborhood. 0.05 3 0.15
O10: Attention of Tehran Cultural Heritage Organization to his torical monuments of neighborhood. 0.04 2 0.08
Thr
eats
T1: Pollutions due to proximity to Grand Bazaar, Tehran. 0.04 1 0.04
T2: Inappropriate network access and roadway connectivity from inside to outside of neighborhood and vice versa. 0.05 2 0.10
.T3: Social unsuitability of neighborhood due to immigration 0.06 1 0.06
T4 : Lack of diversity and mixed land uses and vitality in the some hours of the day. 0.05 2 0.10
T5: High-density and incompatible cons truction with the s tructure and his torical identity and.unbalanced with the level of exis ting infras tructures in the neighborhood 0.06 2 0.12
T6: Lack of balanced cooperation between public and private sectors for inves tigating. 0.04 3 0.12
T7: Low trends of renovation of fabric and low tendency for inves tigating between owners. 0.06 2 0.12
T8: High rate of tenants and settlement of owners outside of neighborhood. 0.04 2 0.08
T9: Commercial activities focus. 0.05 2 0.10
T10: Tendency of low income people to settle in the city center. 0.05 1 0.05
Total 1 2.18
Table 2. External Factors Evaluation (EFE) Matrix.
18
In
tern
atio
nal J
ourn
al o
f A
rchi
tect
ure
and
Urb
an D
evel
opm
ent
Vol.8
, N
o.1
Win
ter 2
018
attractiveness; 4 = highly attractive. The scores for the second column (weighted or balanced score) are multiplied by the rated attractiveness and the total points of interes t or attractiveness
are interes ted in the TAS column which represents the relative attractiveness of each factor on the s trategy. The total point of TAS is calculated at the bottom row of each s trategy column
(SO) aggressive Strategies conservative Strategies (WO)SO1: Paying Long-term lending to homeowners in order to renovat-ing and retrofitting (S2,S10-O2,O4,O9)
SO2: Strengthening the role of local ins titutions in the urban man-agement of neighborhood (S9,S10-O2)
SO3: Organizing and s trengthening the role of non-governmental organizations (NGO) in the neighborhood and political and financial supports from them and granting them adminis trative responsibilities (S9,S10-O2,O3)
SO4: Res toring and maintaining historical identity and reputation to neighborhood as one of the five forming neighborhoods of the city of old Tehran (S3,S7-O5,O10)
SO5: Planning to change pollutant business activities in the Bazar with compatible businesses residential and attractive population (S1,S6-O1,O2,O3)
WO1: Organizing dilapidated and abandoned areas and creating neighborhoods according to the user requirements in these spaces (W2,W7-O2,O8)
WO2: Proper lighting at night and removing unsafe spaces and corners and narrow spaces in the neighborhood and good design of spaces (W1,W3,W8-O9)
WO3: Creating required public utilities in the neighborhood (W4-O4,O7,O9)
WO4: Encouraging owners to integrate and retrofit buildings in the neighborhood and eliminating of troublesome rules in them (W6,W2-O2,O3)
WO5: Planning for Changing incompatible business activities and utilizing of unders tanding and cooperating with the owners and creating compatible land-uses (W9,W10-O2,O3,O6)
Competitive Strategies (ST) Defensive Strategies (WT)ST1: Planning for culturing and informing citizens about their rights and neighborhood conditions through the creation of working groups and ads (S7,S8,S10-T8,T3)
ST2: Controlling and monitoring of new cons tructions and fitting new buildings to infras tructure and neighborhood identity (S3-T5,T10)
ST3: Planning for organizing of regis tered monuments of cultural heritage and granting special privileges to these buildings (S3,S1-T6,T9)
ST4: Planning to keep and maintain local and original residents (S4,S7-T3,T8)
ST5: Planning to increase the variety and mixed compatible land-uses in the neighborhood and night activities (S6,S2-T4)
WT1: Landscaping and improving the quality of urban furniture, walkaways and public spaces (W2,W1-T2)
WT2: Raising the level of network access based on needs of the neighborhood (W2-T2)
WT3: Planning to increase cultural and public spaces and enhanc-ing the vitality within the neighborhood (W4-T7,T9)
WT4: Preventing from land uses such as warehouse and garage in a residential area and avoiding renting residential buildings to other kinds of uses through continuous control (W9,W3-T1,T9)
WT5: Increasing safety/security by eliminating criminal and inde-fensible spaces (W8,W7,W6-T4,T8,T10)
Table 3. SWOT Matrix.
Strategy SO1 SO2 SO3 SO4 SO5
Factor Weight AS TAS AS TAS AS TAS AS TAS AS TAS
S1 0.05 2 0.10 1 0.05 1 0.05 3 0.15 4 0.20
S2 0.06 4 0.24 3 0.18 3 0.18 3 0.18 3 0.18
S3 0.06 2 0.12 2 0.12 1 0.06 4 0.24 2 0.12
S4 0.06 3 0.18 4 0.24 3 0.18 3 0.18 1 0.06
S5 0.04 2 0.08 1 0.04 2 0.08 1 0.04 1 0.04
S6 0.04 2 0.08 0 0 0 0 2 0.08 3 0.12
S7 0.06 3 0.18 4 0.24 4 0.024 3 0.18 2 0.12
Table 4. QSPM Matrix for SO Strategies.
19
International Journal Of A
rchitecture and Urban D
evelopment
S8 0.03 0 0 2 0.06 3 0.09 1 0.03 1 0.03
S9 0.07 2 0.14 4 0.28 4 0.28 2 0.14 2 0.14
S10 0.05 4 0.20 4 0.20 4 0.20 2 0.10 3 0.15
O1 0.05 2 0.10 0 0 0 0 3 0.15 3 0.15
O2 0.06 4 0.24 4 0.24 3 0.18 2 0.12 3 0.18
O3 0.06 4 0.24 4 0.24 4 0.24 3 0.18 4 0.24
O4 0.05 3 0.15 2 0.10 3 0.15 3 0.15 3 0.15
O5 0.06 2 0.12 2 0.12 2 0.12 4 0.24 3 0.18
O6 0.04 1 0.04 1 0.04 1 0.04 2 0.08 3 0.12
O7 0.04 1 0.04 1 0.04 2 0.08 2 0.08 2 0.08
O8 0.04 3 0.12 2 0.08 1 0.04 3 0.12 1 0.04
O9 0.05 3 0.015 3 0.15 3 0.15 4 0.20 3 0.15
O10 0.04 1 0.04 1 0.04 1 0.04 3 0.12 1 0.04
Total 1 2.56 2.46 2.40 2.76 2.49
Strategy WO1 WO2 WO3 WO4 WO5
Factor Weight AS TAS AS TAS AS TAS AS TAS AS TAS
W1 0.06 2 0.12 2 0.12 3 0.18 2 0.12 3 0.18
W2 0.06 4 0.24 3 0.18 4 0.24 3 0.18 3 0.18
W3 0.05 2 0.10 3 0.15 2 0.10 2 0.10 4 0.20
W4 0.04 4 0.16 2 0.08 4 0.16 3 0.12 2 0.08
W5 0.04 1 0.04 3 0.12 2 0.08 2 0.08 2 0.08
W6 0.05 2 0.10 4 0.20 2 0.10 4 0.20 1 0.05
W7 0.03 4 0.12 4 0.12 4 0.12 4 0.12 1 0.03
W8 0.06 2 0.12 4 0.24 2 0.12 2 0.12 1 0.06
W9 0.05 1 0.05 2 0.10 1 0.05 4 0.20 4 0.20
W10 0.03 2 0.06 1 0.03 1 0.03 2 0.06 4 0.12
O1 0.05 1 0.05 2 0.10 1 0.05 1 0.05 3 0.15
O2 0.06 3 0.18 2 0.012 3 0.18 4 0.24 3 0.18
O3 0.06 2 0.12 1 0.06 3 0.18 3 0.18 4 0.24
O4 0.05 3 0.15 3 0.15 3 0.15 4 0.20 3 0.15
O5 0.06 3 0.18 3 0.18 2 0.12 2 0.12 2 0.12
O6 0.04 2 0.08 2 0.08 2 0.08 1 0.04 4 0.16
O7 0.04 1 0.04 1 0.04 3 0.12 2 0.08 1 0.04
O8 0.04 4 0.16 3 0.12 4 0.16 2 0.08 2 0.08
O9 0.05 3 0.15 3 0.15 4 0.20 4 0.20 3 0.15
O10 0.04 2 0.08 2 0.08 1 0.04 1 0.04 0 0
Total 1 2.30 2.32 2.34 2.53 2.41
Table 5. QSPM Matrix for WO Strategies.
Conyiniue of Table 4. QSPM Matrix for SO Strategies.
20
In
tern
atio
nal J
ourn
al o
f A
rchi
tect
ure
and
Urb
an D
evel
opm
ent
Vol.8
, N
o.1
Win
ter 2
018
Strategy WT1 WT2 WT3 WT4 WT5
Factor Weight AS TAS AS TAS AS TAS AS TAS AS TAS
W1 0.06 3 0.18 4 0.24 2 0.12 1 0.06 4 0.24
W2 0.06 4 0.24 2 0.12 4 0.24 2 0.12 4 0.24
W3 0.05 3 0.15 2 0.10 2 0.10 4 0.20 4 0.20
W4 0.04 3 0.12 3 0.12 4 0.16 1 0.04 3 0.12
W5 0.04 2 0.08 3 0.18 3 0.12 4 0.16 4 0.16
W6 0.03 3 0.15 4 0.20 4 0.20 1 0.05 2 0.10
W7 0.03 3 0.09 2 0.06 4 0.12 3 0.09 4 0.12
W8 0.06 2 0.12 3 0.18 4 0.24 2 0.12 4 0.24
W9 0.05 1 0.05 2 0.10 2 0.10 4 0.20 3 0.15
W10 0.03 3 0.09 1 0.03 2 0.06 4 0.12 1 0.03
T1 0.04 1 0.04 2 0.08 1 0.04 4 0.16 2 0.08
T2 0.05 4 0.20 4 0.20 2 0.10 1 0.05 2 0.10
Strategy ST1 ST2 ST3 ST4 ST5 Factor Weight AS TAS AS TAS AS TAS AS TAS AS TAS
S1 0.05 0 0 0 0 3 0.15 0 0 3 0.15
S2 0.06 4 0.24 4 0.24 2 0.12 4 0.24 3 0.18
S3 0.06 4 0.24 4 0.24 4 0.24 3 0.18 2 0.12
S4 0.06 4 0.24 3 0.18 2 0.12 4 0.24 3 0.18
S5 0.04 0 0 2 0.08 1 0.04 2 0.08 0 0
S6 0.04 2 0.08 0 0 3 0.12 2 0.08 3 0.12
S7 0.06 3 0.18 4 0.24 3 0.18 4 0.24 2 0.12
S8 0.03 3 0.09 2 0.06 2 0.06 4 0.12 0 0
S9 0.07 4 0.28 4 0.28 4 0.28 4 0.28 2 0.14
S10 0.05 4 0.20 3 0.15 4 0.20 4 0.20 2 0.10
T1 0.04 0 0 1 0.04 2 0.08 2 0.08 3 0.12
T2 0.05 2 0.10 1 0.05 1 0.05 2 0.10 2 0.10
T3 0.06 3 0.18 2 0.12 1 0.06 4 0.24 1 0.06
T4 0.05 2 0.10 2 0.10 3 0.15 3 0.15 4 0.20
T5 0.06 3 0.18 4 0.24 4 0.24 2 0.12 2 0.12
T6 0.04 2 0.08 3 0.12 4 0.16 1 0.04 2 0.08
T7 0.06 3 0.18 3 0.18 3 0.18 3 0.18 2 0.12
T8 0.04 2 0.08 2 0.08 2 0.08 4 0.16 1 0.04
T9 0.05 2 0.10 2 0.10 1 0.05 4 0.20 4 0.20
T10 0.05 3 0.15 2 0.10 2 0.10 4 0.20 2 0.10
Total 1 2.44 2.60 2.66 3.13 2.35
Table 7. QSPM Matrix for WT Strategies.
Table 6. QSPM Matrix for ST Strategies.
21
International Journal Of A
rchitecture and Urban D
evelopment
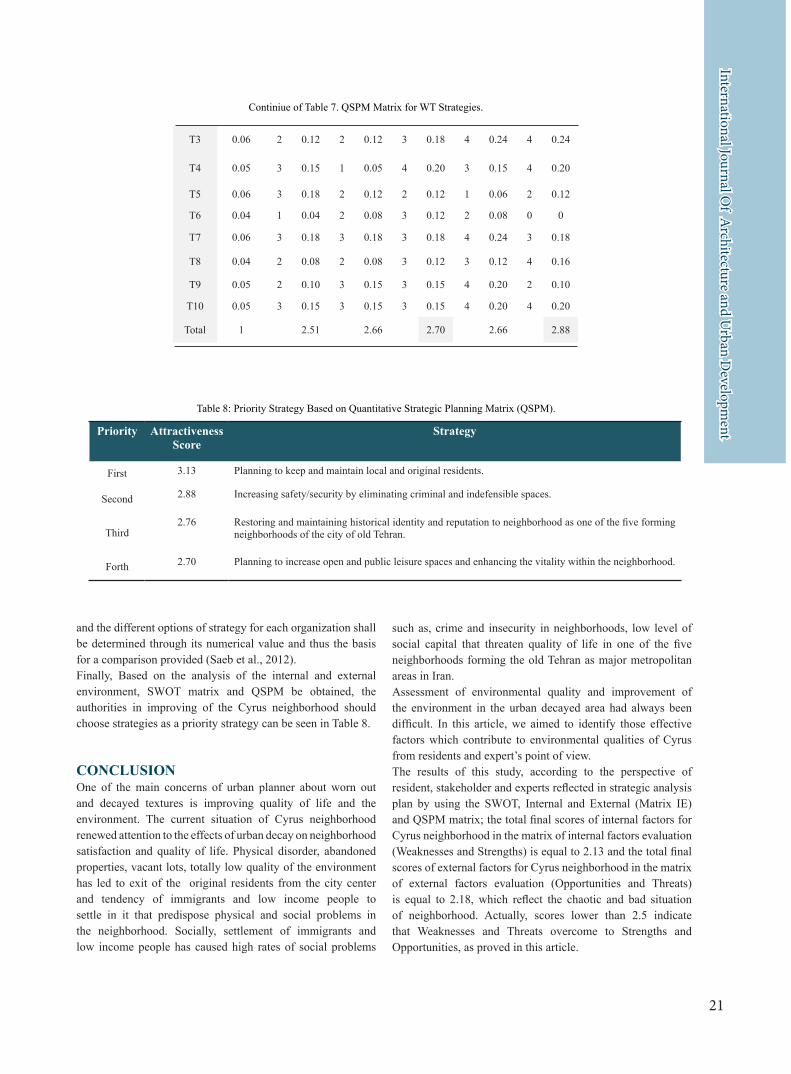
and the different options of s trategy for each organization shall be determined through its numerical value and thus the basis for a comparison provided (Saeb et al., 2012).Finally, Based on the analysis of the internal and external environment, SWOT matrix and QSPM be obtained, the authorities in improving of the Cyrus neighborhood should choose s trategies as a priority s trategy can be seen in Table 8.
CONCLUSIONOne of the main concerns of urban planner about worn out and decayed textures is improving quality of life and the environment. The current situation of Cyrus neighborhood renewed attention to the effects of urban decay on neighborhood satisfaction and quality of life. Physical disorder, abandoned properties, vacant lots, totally low quality of the environment has led to exit of the original residents from the city center and tendency of immigrants and low income people to settle in it that predispose physical and social problems in the neighborhood. Socially, settlement of immigrants and low income people has caused high rates of social problems
such as, crime and insecurity in neighborhoods, low level of social capital that threaten quality of life in one of the five neighborhoods forming the old Tehran as major metropolitan areas in Iran.Assessment of environmental quality and improvement of the environment in the urban decayed area had always been difficult. In this article, we aimed to identify those effective factors which contribute to environmental qualities of Cyrus from residents and expert’s point of view.The results of this s tudy, according to the perspective of resident, stakeholder and experts reflected in s trategic analysis plan by using the SWOT, Internal and External (Matrix IE) and QSPM matrix; the total final scores of internal factors for Cyrus neighborhood in the matrix of internal factors evaluation (Weaknesses and Strengths) is equal to 2.13 and the total final scores of external factors for Cyrus neighborhood in the matrix of external factors evaluation (Opportunities and Threats) is equal to 2.18, which reflect the chaotic and bad situation of neighborhood. Actually, scores lower than 2.5 indicate that Weaknesses and Threats overcome to Strengths and Opportunities, as proved in this article.
Priority AttractivenessScore
Strategy
Firs t 3.13 Planning to keep and maintain local and original residents.
Second 2.88 Increasing safety/security by eliminating criminal and indefensible spaces.
Third2.76 Res toring and maintaining his torical identity and reputation to neighborhood as one of the five forming
neighborhoods of the city of old Tehran.
Forth 2.70 Planning to increase open and public leisure spaces and enhancing the vitality within the neighborhood.
T3 0.06 2 0.12 2 0.12 3 0.18 4 0.24 4 0.24
T4 0.05 3 0.15 1 0.05 4 0.20 3 0.15 4 0.20
T5 0.06 3 0.18 2 0.12 2 0.12 1 0.06 2 0.12
T6 0.04 1 0.04 2 0.08 3 0.12 2 0.08 0 0
T7 0.06 3 0.18 3 0.18 3 0.18 4 0.24 3 0.18
T8 0.04 2 0.08 2 0.08 3 0.12 3 0.12 4 0.16
T9 0.05 2 0.10 3 0.15 3 0.15 4 0.20 2 0.10
T10 0.05 3 0.15 3 0.15 3 0.15 4 0.20 4 0.20
Total 1 2.51 2.66 2.70 2.66 2.88
Table 8: Priority Strategy Based on Quantitative Strategic Planning Matrix (QSPM).
Continiue of Table 7. QSPM Matrix for WT Strategies.
22
In
tern
atio
nal J
ourn
al o
f A
rchi
tect
ure
and
Urb
an D
evel
opm
ent
Vol.8
, N
o.1
Win
ter 2
018
In the following, four types of matching s trategy using the SWOT matrix, namely aggressive s trategy (SO), diversity s trategy (ST), adaptive s trategy (WO) and defensive s trategies (WT) are presented. Then, to set priorities for implementing these s trategies, the data were entered into the matrix QSPM.The analysis of findings indicates that strategy ST4 (Planning to keep and maintain local and original residents) with a score of 3.13 is the mos t significant s trategy from the point of view of residents and experts. This sugges ts that residents of Cyrus think the main reason of mos t of problems in their neighborhood is related to exit of the original residents from the city center and tendency of immigrants and low income people to settle in it. As a result, demolishing of social cohesion is one of the key factors that play a role in the high rate of social problem and crimes. Strategy WT5 (Increasing safety/security by eliminating criminal and indefensible spaces) with a score of 2.88 located in the second priority. Actually, this reveals that the security and safety are other important environmental factors that mus t be improved. The third priority with a score of 2.70 among the proposed s trategies is SO4 (Res toring and maintaining his torical identity and reputation to neighborhood as one of the five forming neighborhoods of the city of old Tehran) with a score of 2.76. In fact, raising the social s tatus and res toring the identity and reputation of the neighborhood is one of the mos t important demands of the residents that these days have been quite disappeared and caused the neighborhood become worn out with high rate of social problems which provide a suitable home to settle low-income individuals and immigrants. The fourth priority s trategies belongs to WT3 (Planning to increase openness and public leisure spaces and enhancing the vitality within the neighborhood). It means a shortage of leisure and cultural spaces is one of the main problems that play a role in reducing the level of quality of life and vitality. Therefore, the residents have considered leisure spaces in the neighborhood as another important factor.Finally and in general, it can be said that, contrary to initial assumptions, regarding to improving the quality of Cyrus neighborhood environment, the results of the evaluation showed that social factors are more important than the physical factors from the point of view of residents, experts and s takeholders, therefore priority to improve the quality of neighborhood should be more concerned with social aspects such as maintaining social s tructure, increasing security/safety and res toring social s tatus of the neighborhood. Also, it cannot deny that physical factors play a significant role in achieving these purposes.
REFERENCESAbdul Ghani, S. (2008). Neighborhood factors in private low-cost housing in Malaysia. Habitat International, 32(4), 485–497.Adams, R. (1992). Is happiness a home in the suburbs? The influence of urban versus suburban neighborhoods on psychological health, Journal of Community Psychology, 20 (4), 353-372.
Aiello, A., Ardone, R., & Scopelliti, M. (2010). Neighborhood planning improvement: Physical attributes, cognitive and affective evaluation and activities in two neighborhoods in Rome. EvaluationandProgramPlanning, 33 (3), 264-275.Akbarpour Saraskanroud, M., Pourahmad, A. & Abedini, A. (2011). Proper Strategies for the Improvement and Renovation of the Worn Out Textures of Cyrus District in Tehran Using SWOT Technique. Geography and Environmental Planning, 40 (4), 65-88.Amerigo, M., & Aragones, J. (1990). Residential satisfaction in council housing.JournalofEnvironmentalPsychology, 10 (4), 313-325.Aus tin, M. J., & Hopkins, K. (Eds.). (2004). Supervision ascollaboration in the human services: Building a learningculture. Sage.Bahrainy, S. H. & Tabibian, M. (1998). A model for evaluation of urban environmental quality. Journal of Environmentals tudies, 24 (21 & 22), 41-56.Basolo, V., & Strong, D. 2002. Unders tanding the neighborhood: From residents' perceptions and needs to action. HousingPolicyDebate, 13, 83-105.Bolan, M. (1997). The mobility experience and neighborhood attachment. Demography,34 (2), 225-237.Chapman, D., & Lombard, D. (2006). Determinants of neighborhood satisfaction in fee based gated and non-gated communities. UrbanAffairsReview, 41(6), 769-799.Choguill, C. L. (2007). Developing sustainable neighborhoods. HabitatInternational,32, 41-48.Connerly, Ch. E., & Marans, R.W. (1988). Neighborhoodquality:Adescriptionandanalysisofindicators.In Handbook of housing and the built environment in the United States, edited by E. Huttman and W. van Vliet. New York: Greenwood.Cutter, S., (1982). Residential satisfaction and the suburban homeowners. UrbanGeography,3, 315–27.Dassopoulos, A., Batson Chris tie, D., Futrell, R., & Brents, B. G. (2012). Neighborhood Connections, Physical Disorder and Neighborhood Satisfaction in Las Vegas. Urban AffairsReview,48, 571–600.Djerbani, R., & Al-Abed, A. (2000). Satisfaction level with neighborhood in lowincome public housing in Yemen. PropertyManagement, 18(4), 230–242.Fang, Y. (2006). Residential Satisfaction, Moving Intention and Moving Behaviors: A Study of Redeveloped Neighborhoods in Inner-City Beijing. HousingStudies, 21(5), 671–694.Fraser, J., & Lepofsky, J. (2004). The uses of knowledge in neighborhood revitalization. Community DevelopmentJournal, 39(1), 4–12.Fried, M. (1984). The s tructure and significance of community satisfaction.Population and Environment: Behavioral andSocialIssues, 7 (2), 61-86.Ge, J. & Hokao, K. (2006). Research on residential lifes tyles in Japanese cities from the viewpoints of residential preferences, residential choice and residential satisfaction.LandscapeandUrbanPlanning,78 (3), 165–178.Gruber, J. & Shelton, G. 1987. Assessment of neighborhood satisfaction by residents of three housing types. Social
23
International Journal Of A
rchitecture and Urban D
evelopment
IndicatorsResearch,19 (3), 303–315. Hur, M., & Morrow-Jones, H. (2008). Factors that influence residents' satisfaction with neighborhoods. Environment and Behavior, 40 (5), 619-635.Hur, M., & Morrow-Jones, H. (2008). Factors that influence residents' satisfaction with neighborhoods. Environment and Behavior, 40 (5), 619-635. Jeffres, LW. & Dobos, J. (1995). Separating people’s satisfaction with life and public perceptions of the quality of life in the environment. SocialIndicatorsResearch,34, 181–211. Lashkari, E. & Khalaj, M. (2010). Urban Environment Quality Improvement Planning, Case Study: Moft Abad Neighbourhood, Tehran, Iran. International Journal of Social, Behavioral, Educational, Economic, Business and IndustrialEngineering, 4 (6).Leby, J. L., & Hashim, A. H. (2010). Liveability dimensions and attributes: Their relative importance in the eyes of neighborhood residents. Journalofconstructionindevelopingcountries, 15 (1), 67-91.Lee, B. A., Campbell, K. E., & Miller, O. (1991). Racial Differences in Urban Neighboring. Sociological Forum. 6 (3):525–550.Lovejoy, K., Handy, S. & Mokhtarian, P. (2010). Neighborhoodsatisfaction in suburban versus traditional environments: An evaluationof contributingcharacteristics in eightCalifornianeighborhoods.Landscape and Urban Planning. Meegan, R., & Mitchell, A. (2001). It’s not community round here, it’s neighborhood: neighborhood change and cohesion in urban regeneration policies.UrbanStudies, 38 (12), 2167–2194. Møller, V. & Jackson, A. (1997).Perceptions of service delivery and happiness. DevelopmentSouthernAfrica, 14: 169–84.Møller, V., (2005). Resilient or resigned? Criminal victimization and quality of life in South Africa. SocialIndicatorsResearch, 72, 263–317.Møller,V, 2001. Monitoring quality of life in cities: the Durban case. DevelopmentSouthernAfrica, 18, 217–38.NG, SL. (2005). Subjective residential environment and its implications for quality of life among university students in Hong Kong. SocialIndicatorsResearch, 71, 467–89.Oh, J.H. (2003). Social bonds and the migration intentions of elderly and urban residents: the mediating effect of residential satisfaction. PopulationResearchandPolicyReview. 22, 127–146.Oktay, D., Marans, R. W. (2011).NeighborhoodSatisfactionamong Diverse Groups of Inhabitants: Findings fromFamagusta Area Study. ENHR Conference 2011, 5-8 July, Toulouse.Parkes A., Kearns, A., & Atkinson, R. (2002). The determinants ofneighborhooddissatisfaction. CNR Paper 1.Parkes, A., Kearns, A. & Atkinson, R. (2002). What makes people dissatisfied with their neighborhoods? UrbanStudies, 39 (13), 2413 – 2438. Permentier, M., Van Ham, M., & Bolt, G. (2009). Neighborhood reputation and the intention to leave the neighborhood. EnvironmentandPlanning,41, 2162 – 2180.
Profect, M., & Power, G. (1992). Planning for urban quality. London Sustainable Development Chinese Journal ofPopulation,ResourcesandEnvironment, 4 (1).Rogerson, C.M., (1996). Urban poverty and the informal economy in South Africa’s economic heartland. Environment andUrbanization, 8, 167–81.Romice, O. (2000). New developments in and reflections on, the use of visual literacy and environmental evaluation for the participation of community groups in design. GeoJournal, 51, 311–319.Ross C., & Mirowsky J. (1999). Disorder and Decay: The Concept and Measurement of Perceived Neighborhood Disorder. UrbanAffairsReview.34, 412–432.Saeb K, Rezai Sh, & Jafari Hajati R. (2012). An investigation into eco-tourism potential of the Alamut region of Iran using SWOT Analysis Model.EcologiaBalkanica, 4 (1):9-20.Salleh, A.G. (2008). neighborhood factors in private low-cost housing in Malaysia.HabitatInternational, 32 (4), 485-497.Salleh, A.G., & Badarulzaman, N. (2011). Quality of lifeof residents in urban neighborhoods of Penang, Malaysia.Proceedings of the International Conference on SustainableArchitectureandUrbanDevelopment, Vol. IV, Amman, Jordan, pp.131-138.Sedaghatnia S, Lamit H, Ghahramanpouri A, Mohamad SB. (2013) An Evaluation of Residents Quality of Life through Neighborhood Satisfaction in Malaysia. Environ Manage Sustainable Dev, 2:114.Seifollahi, M., & Faryadi, Sh. (2011). Evaluating the Quality of Tehran’s Urban Environment Based on Sus tainability Indicators. Int.J.Environ.Res., 5 (2),545-554.Shiehbeiki, Sh., Abbaspour, M., Monavari, S. M., Arjmandi, R., & Lahijanian, A. (2014). Public Participation Role in Sus tainable Urban Management by Quantitative Strategic Planning Matrix (QSPM). Int. J. Environ. Res., 8 (4),1309-1314.Sirgy, M., & Cornwell, T. (2002). How Neighborhood Features Affect Quality of Life. SocialIndicatorsResearch, 59 (1), 79-114.Skogan, WG. (1990). Disorder and decline: Crime and thespiralofdecay inAmericanneighborhoods.New York: Free Press.Social Surveys. (2000). JohannesburgMetropolitan Councilattitudinalsurvey. Survey for the GJMC, Johannesburg.Tabibian, M. & Faryadi, S. (2002). Evaluating Tehran’s environment quality. Journal of Environmental studies, 27 (28), 1-12.Taeeb Rashid, S., Ngah, Ib. & Enyinnaya Eluwa, S.. (2013). Neighborhood Choice Factors And Residents Satisfaction In Old And New Neighbourhoods Of Slemani City, Kurdis tan-Iraq. JournalofEnvironmentandEarthScience, 3 (2).Tavana, M. (2014). Measuring the Relationship betweenSocialDisordersandEnvironmentalFactorsintheSprawlandCentralTextureofTehran(CaseStudy:CyrusandShadabad). M.A. Dissertation in Urban Planning, University of Tehran, Tehran, Iran.Tehran Municipality, (2007). OfficeofDeputyforCoordination
24
In
tern
atio
nal J
ourn
al o
f A
rchi
tect
ure
and
Urb
an D
evel
opm
ent
Vol.8
, N
o.1
Win
ter 2
018
andPlanning,IntroductiontoCityTehran. Center for Studies and Planning of Tehran.Veenhoven, R. (1996). Developmentsinsatisfactionresearch.SocialIndicatorsResearch,37, 1–46.Wang, K.J. & Hong, W.C. (2011). Competitive advantage analysis and s trategy formulation of airport city development-the case of Taiwan. TransportPolicy, 18, 276-288. Wee, HL. (2000). Quality of life assessment: is quality ofplace an appropriate proxy? In Proceedings of the Second Conference on Quality of Life in Cities, 21s t Century QOL (ICQOLC), Singapore, Volume 1.Wes taway, M. S. (2009). Aspects of environmental quality
of life that affect neighborhood satisfaction in disadvantaged and advantaged Johannesburg communities. DevelopmentSouthern Africa, 26, 447-458.Wes taway, M.S. (2006). A longitudinal inves tigation of satisfaction with personal and environmental quality of life in an informal South African housing settlement, Doornkop, Soweto.HabitatInternational, 30, 175–189.Wes taway, MS & Gumede, T. (2001). Satisfaction with personal and environmental quality of life: a black South African informal settlement perspective.Curationis, 24, 28–34. Woldoff, R. A. (2002). Effects of Local Stressors on Neighborhood Attachment. SocialForces.81 (1), 87–116.