Embed Size (px)
Citation preview

CS 229 Project
Needle Tumor Puncture Detection Using a Force and Position SensorJoey Greer and Nathan Usevitch
(Dated: 11 December 2015)
Preforming a tumor ablation procedure involves precisely positioning an ablation probe ina tumor. Limited sensing accuracy and variations in tissue properties require that surgeonsoften identify when they have correctly positioned the probe through their sense of touch.In this paper, supervised learning is used to detect the point at which a needle has entereda tumor using a combination of force and position data. A classifier is developed that usesforce data to detect a puncture event, and a Bayesian network that incorporates a positionestimate to distinguish between puncture events that may occur because of tissue variations,and puncture events that indicate the target has been reached.
I. INTRODUCTION
Tumor ablation is a minimally invasive technique totreat cancer. It involves guiding the tip of an electricprobe to the tumor to be treated and running a currentthrough the probe once the tip of the probe has beenpositioned in the tumor. The electric current destroysthe cancerous tissue through heat. Often times it is diffi-cult for the clinician to know that he or she has success-fully reached the tumor, even with the aid of intraopera-tive imaging such as ultrasound or computed tomography(CT). When this happens, the clinician falls back on hisor her sense of touch to know that they have success-fully reached their target, since often times the tumor isstiffer than the surrounding, non-cancerous tissue. Thisproject applies machine learning to the problem of detect-ing when the ablation probe has successfully been placedinside a tumor, using a combination of position data ob-tained from imaging, as well as force data gathered froman instrumented needle. Enabling an instrumented nee-dle to autonomously detect tumor penetration would en-able robotically steered needles to be used in procedureswhere puncture detection had previously necessitated ahuman operator. In addition, this classifier could be usedas a tool by physicians to more confidently identify whenthey have reached a tumor. Ideally, the classifier makingthis prediction would be able to classify tumors in ma-terials of a variety of properties, as material propertiesof human tissue can vary between people and based onlocation in the body.
II. PRIOR WORK
Analyzing the forces of needle insertion has been atopic of interest in the medical robotics community foraround a decade. Previous work has focused on mechan-ics modeling and prediction5,7, which analyze the forcesof needle insertion in terms of tissue friction, tissue stiff-ness, and transient events such as membrane puncture,which is of particular interest in this work. Recently,Elayaperumal et al.1 designed a custom needle sensor tomeasure forces at the needle tip and play these forcesback via haptic actuators to the clinician. Finally, Go-nenc et al.2 recently used a custom force sensor to detectvein puncture for retinal surgery in the eye, but relied onheuristic to perform the detection, rather than machinelearning techniques.
FIG. 1. Expeirmental setup. The needle steering device, (a) isused to insert the needle, shown in (d), at a constant insertionvelocity. Two tissue phantoms were used: a cow liver on top ofa layer of EcoFlex 00-30 silicone rubber (simulating canceroustissue), shown in (c), and a block of Polyvinyl Chloride on topof silicone rubber, which was used for collection of trainingdata. (d) Shows a zoomed in picture of the ATI IndustrialAutomation Nano 17 Force Sensor attached to the base of theneedle used for data collection in this paper.)
In this work, we are using time series data as one inputmodality for classification. Times series offer a unique setof challenges for classification and several approaches ex-ist to using this data, which is covered well in a surveyby Keogh et al.3. Popular methods include using HiddenMarkov Models for time series segmentation, where thelatent variables correspond to segment labels4 and timeseries transforms such as the Discrete Fourier Transform
CS 229 Project 2
and various forms of the Wavelet Transform to reducethe dimensionality of the time series for classification.In this work, we use a sliding window approach, where awindow of force values, centered around the point in timeto be classified are transformed by a featurization func-tion φ(· · · ) (section III) and used for classification. Thismethod was chosen due to it simplicity and effectivenesson our data.
III. EXPERIMENTAL SETUP AND DATA
Data was collected using a custom needle insertiondevice (Figure 1(a)) with an insertion stage poweredby a DC motor. A straight needle, used to simulatean ablation probe, was mounted on the insertion stageand an ATI Industrial Automation Nano 17 force sen-sor (Figure 1(d)) and Asenscion technologies electromag-netic tracker were mounted at the base of the needle.Two data modalities were collected over the course of aninsertion: axial force magnitude, f(t) and estimated dis-tance between target and needle, d(t). The goal of thiswork is to develop an algorithm that can detect punctureevents in near real-time using force and distance data byestimating
P(ρ(t) = 1 | φ
(~f(t−W ), . . . , ~f(t+W )
), d(t)
)using supervised learning. ρ(t) = 1 corresponds to theevent that a puncture occurred at time t, and ρ(t) = 0corresponds to no puncture at time t. φ : R2W+1 → Rncorresponds to a featurization of a window of force data(section IV).
Two types of tissue phantoms were used. The first wasfor testing purposes and consisted of a cow liver, on topof a silicone membrane, which was resting on a slab ofgelatin (Figure 1(c)). The silicone membrane and slab ofgelatin were used to simulate a tumor to be punctured.Another tissue phantom was used for training data col-lection, and consisted of a slab of homogeneous gelatintissue on top of a silicone membrane, which was on top ofanother slab of gelatin tissue of different stiffness. Again,the silicone membrane and second slab of gelatin tissuewere used to simulate a tumor to be punctured. The sec-ond tissue phantom was used to collect training data dueto its greater re-usability, which allowed for more datacollection.
Before each test, the needle steering apparatus was re-oriented to provide a different insertion angle and con-trolled to insert the needle into the tumor phantom ata constant velocity between 2 mm/s and 6 mm/s. Thetraining set used in this project contains 100 differentpuncture events in which angle of insertion as well asinsertion velocity were varied between tests. A typicalforce-distance time series collected from a single inser-tion through the liver and into a silicone membrane isshown in figure 2.
IV. FORCE TIME SERIES CLASSIFICATION
From each time series collected in these experimentsseveral windows of force data were extracted to form a
−20 −10 0 10 20 300
0.5
1
1.5
2
2.5
Distance to Target (mm)
For
ce M
agni
tude
(N
) Force Magnitude, f(d)
FIG. 2. A typical force and position time series collected froma single insertion through the cow liver and silicone layer. Afirst puncture type event occurs when the needle puncturedthe liver capsule. The tumor puncture occurs at a distancepast the estimated distance to target because the membranedeflects before the needle punctures through the membrane.
training data set. The windows centered on the punc-ture along with N other random intervals were selectedas training data for the classifier. Parameters to con-sider when designing the force classifier were feature type,classifier type, training data weighting (to address classimbalance), and window size. To guide these decisions,10-fold cross validation was used.
Several parameters were analyzed to design the forceclassifier. Two types of features were considered for aparticular window of force values: raw force values thatwere normalized (so as to make the classifier able to gen-eralize) and combinations of different slope values (firsthalf slope, second half slope, first quarter slope, last quar-ter slope). In addition two types of classifiers were con-sidered: logistic regression and regularized logistic regres-sion (a lasso penalty was used and the penalty parameter,λ, was chosen using cross validation.) (Note that Sup-port Vector machines were not considered because weneeded a probability of puncture output for the purposesof the combined classifier explained in section V.) Fi-nally, the effect of adding in quadratic combinations offeatures were considered. The results of different com-binations of these options are shown in figure IV, withspecificity and sensitivity as the error metrics in ordermanage effects of class imbalance. The best results wereobtained using raw (normalized) force values combinedwith quadratic combinations of these values, and a regu-larized logistic regression classifier. Once these parame-ters were chosen, we considered the effect of window sizefor force data. Again, 10-Fold cross validation was usedto guide our decision process (figure 4). Based on thisexperiment, a window size of 7 time steps was selected.
V. POSITION DATA
Intuitively, we expect d(t), the estimated distance be-tween the needle tip and target to be near zero whenpuncture occurs. Due to position noise, elasticity inthe target, and mechanical movement, d(t) is not a reli-

CS 229 Project 3
5 10 15 20 25
0.8
0.9
1r=0, l=0, q=0
sensitivity
specificity
5 10 15 20 25
0.8
0.9
1r=0, l=0, q=1
5 10 15 20 25
0.8
0.9
1r=0, l=1, q=0
5 10 15 20 25
0.8
0.9
1r=0, l=1, q=1
5 10 15 20 25
0.8
0.9
1r=1, l=0, q=0
5 10 15 20 25
0.8
0.9
1r=1, l=0, q=1
5 10 15 20 25
0.8
0.9
1r=1, l=1, q=0
5 10 15 20 25
0.8
0.9
1r=1, l=1, q=1
FIG. 3. In this plot, the effect of different combinations of features and classifiers were considered on classifier performanceusing 10-Fold cross validation on our data. Each plot contains a label r = a, l = b, q = c where a, b, c ∈ {0, 1}. r = 0 correspondsto using slope ratio features and r = 1 corresponds to raw force values on a window centered around the point to be classified.l = 0, 1 correspond to using non-regularized and regularized logistic regression, respectively. Finally, q = 0, 1 correspond toadding quadratic combinations of features (either slope ratios or raw force values depending on the value of r), respectively.The x-axis of these plots correspond to the weighting used on positive examples to address class imbalance (i.e. an x-axis valueof 5 corresponds to positive examples being weighted by 5 times over negative examples in the classifier objective function.)Based on these plots, raw force values were used, with regularized logistic regression and quadratic features.
0 10 20 30 40 50 600
0.05
0.25
Window Size
Error RateFalse Negative RateFalse Positive Rate
Cro
ssVV
alid
ated
VErr
or
FIG. 4. The effect of changing window size on performanceof logistic regression classifier using raw force features. Errorrates are obtained by 10 fold cross validation. A window sizeof 7 is selected.
able indicator by itself, however it is useful for classifica-tion. There are two ways to include this data for clas-sification. The simplest way is to include d(t) alongside
φ(~f(t−W ), . . . , ~f(t+W )
)and train a discriminative
classifier to model
P(ρ | φ
(~f(t−W ), . . . , ~f(t+W )
), d(t)
)directly. However, as stated before, we know moreabout the relationship between d(t) and ρ(t). Namely,we expect d(t) to be near zero when puncture oc-
curs. Therefore, we seek to encode this relation-ship between d(t) into our classifier. To do this, wemodel the conditional structure of the random variables
ρ(t), φ(~f(t−W ), . . . , ~f(t+W )
), d(t) as a Bayesian net-
work (figure 6). Assuming the structure between punc-ture, force, and distance given by the Bayesian network,we can write the joint probability of these variables as
P(ρ(t) = 1, φ(· · · ), d(t)
)=
P(d(t) | ρ(t) = 1
)P(ρ(t) = 1 | φ(· · · )
)Given, that we are interested in the quantity
P(ρ(t) | φ
(~f(t−W ), . . . , ~f(t+W )
), d(t)
), we would
like to compute this quantity in terms of the two con-ditional distributions we are training, P (d(t) | ρ(t)) and
P(ρ(t) | φ
(~f(t−W ), . . . , ~f(t+W )
)). Using Bayes
Rule and the conditional independence assumptions ofthe Bayesian network structure in figure 6 we arrive atthe following formula
P(ρ(t) | d(t), φ(· · · )
)= (1)
P(d(t) | ρ(t)
)P(ρ | φ(· · · )
)∑
ρ(t)∈{0,1}
P(d(t) | ρ(t)
)P(ρ(t) | φ(· · · )
)The log likelihood of the joint probability of puncture,distance, and force takes the following form, which is the

CS 229 Project 4
−40 −20 0 20 400
0.1
0.2
Punctures
Samples
Fit Probability
−40 −20 0 20 400
0.005
0.01
0.015
Distance to Target (mm)
Non Punctures
FIG. 5. Experimentally obtained probability distributions ofdistance given puncture, and distance given no puncture. AGaussian distribution was fit to the distribution of distancegiven puncture, and a uniform distribution was used to ap-proximate the distance to the target if there was no puncture.Note that the mean of the probability given puncture is pastzero because of the elasticity of the membrane.
FIG. 6. Bayesian network structure governing the
joint probability of(ρ(t), d(t), φ
(~f(t−W ), . . . , ~f(t+W )
)).
p(ρ(t) | φ
(~f(t−W ), . . . , ~f(t+W )
))is calculated using
a discriminative classifier such as logistic regression.P (d(t) | ρ(t) = 1) is modeled as a normal distribution withmean µ and variance σ2. This encodes our knowledge anduncertainty about the relationship between puncture and dis-tance.
sum over training examples 1, . . . ,M
l(θ, µ, σ) =
M∑i=1
log(P(ρ(i), d(i), φ(i);µ, σ, θ
))=
M∑i=1
log(P(ρ(i), d(i), φ(i);µ, σ, θ
))=
M∑i=1
log(P(d(i) | ρ(i);µ, σ
))︸ ︷︷ ︸
only depends on µ,σ
+
M∑i=1
log(P(ρ(i) | φ(i); θ
))︸ ︷︷ ︸
only depends on θ
where θ are the parameters that govern the classifier
P(ρ(t) | φ
(~f(t−W ), . . . , ~f(t+W )
)). This shows that
in order to fit parameters θ̂, µ̂, σ̂ that maximize the jointlikelihood of our data, we can separately train the forceclassifier and Gaussian parameters. The force classifierwas discussed in section IV and the maximum likelihoodmean and standard deviation governing the distance dis-tribution are found to correspond to the sample mean andvariance of distances corresponding to puncture events inthe training data set, as shown in figure 5 and given by:
(µ̂, σ̂) = argmaxµ,σ
l(θ, µ, σ)
Mpos =
M∑i=1
1{y(i) = 1}
µ̂ =
∑Mi=1 1{y(i) = 1}d(i)
Mpos
σ̂2 =
∑Mi=1 1{y(i) = 1}(d(i) − µ̂)2
Mpos
Finally, to make a prediction using this Bayesian networkstructure, and optimized parameters, equation 1 is used.
Note that, in this work, we chose to maximize thejoint probability, P (ρ(t), φ(· · · ), d(t)), due to the sim-plistic objective function decomposition that allows usto separately maximize the force and distance proba-bility distributions. Another option is to directly max-imize the conditional probability we are interested in,P (ρ(t) | φ(· · · ), d(t)). This trade off is discussed infurther detail by Roos et al.6 in the general context ofBayesian networks.
VI. PERFORMANCE OF COMBINED CLASSIFIER
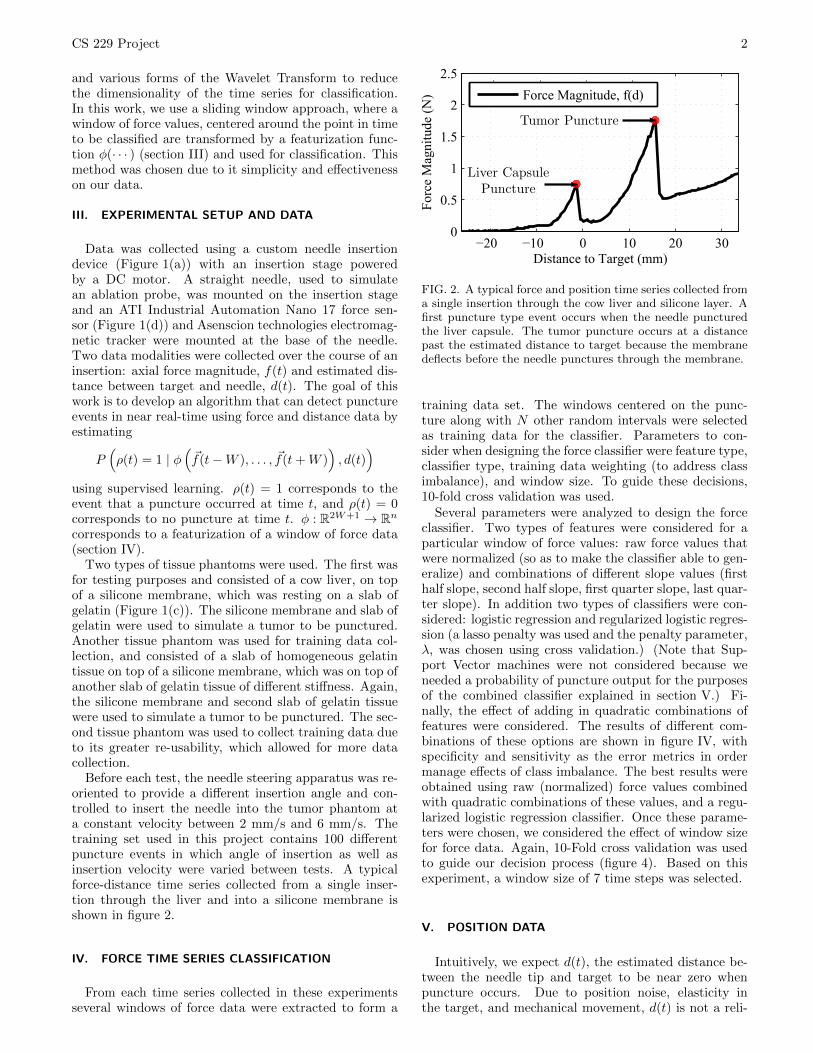
To qualitatively test the performance of the force clas-sifier on the measured data, both the classifier that usesforce only, and the classifier that incorporates force anddistance were used on the liver data. For this test, amoving window was run across all of the data, with theprobability of puncture being calculated for each point.Figure 7 shows the time series along with the probabilityof puncture as computed by the force only classifier andforce/position classifier. The force only classifier is ac-curate at classifying nearly all peaks as puncture events,even the peaks that occur before the actual puncture.The use of the classifier that includes the position esti-mate prevents peaks away from the puncture from beingclassified as the puncture event. The position data en-abled the algorithm to discriminate between a genericpuncture event, and a puncture event that signals whenthe needle has reached the target region.
VII. CONCLUSION
A regularized logistic regression classifier is developedto detect a puncture event using normalized values fromthe force time series as features. Despite using trainingdata obtained from a gelatin phantom, the classifier was
CS 229 Project 5
FIG. 7. Results of classification on liver data when using only the force classifier (green), and when using the combined forceand position classifier (red). The combined classifier is able to prune false positives based on position.
able to detect puncture-type events during testing in cowliver. Inclusion of data giving a position estimate througha Bayesian network allowed the classifier to distinguishbetween puncture type events that occurred as the nee-dle passed through liver tissue, and the puncture of thetarget. This Bayesian network proved an effective way tocombine two different modalities of data. This classifiercould give physicians an extra tool in identifying when aneedle has reached a target during an operation such asa tumor ablation procedure. In addition, this classifiercould enable robotically steered needles to perform pro-cedures in which some sort of force information is neededto identify when a target area has been reached, whichpreviously was only possible with a human surgeon.
VIII. BIBLIOGRAPHY
1S. Elayaperumal, J. H. Bae, B. Daniel, and M. Cutkosky. Detec-tion of membrane puncture with haptic feedback using a tip-force
sensing needle. In Intelligent Robots and Systems (IROS 2014),2014 IEEE/RSJ International Conference on, Sept 2014.
2B. Gonenc, S. Member, N. Tran, C. N. Riviere, S. Member,P. Gehlbach, R. H. Taylor, I. Iordachita, and S. Member. Force-Based Puncture Detection and Active Position Holding for As-sisted Retinal Vein Cannulation *. 2015.
3E. Keogh and S. Chu. Segmenting Time Series : A Survey andNovel Approach.
4S. Kim. Segmental Hidden Markov Models with Random Effectsfor Waveform Modeling. 1:1–27, 2000.
5A. M. Okamura, C. Simone, and M. D. O’Leary. Force mod-eling for needle insertion into soft tissue. IEEE transactionson bio-medical engineering, 51, 2004. ISSN 0018-9294. doi:10.1109/TBME.2004.831542.
6T. Roos, H. Wettig, P. Grnwald, P. Myllymki, and H. Tirri. Ondiscriminative bayesian network classifiers and logistic regression.Machine Learning, 59(3):267–296, 2005.
7T. Washio and K. Chinzei. Needle force sensor, robust and sen-sitive detection of the instant of needle puncture. 3217, 2004.doi:10.1007/978-3-540-30136-3˙15.


![Needle and Biopsy Robots: a Review - Springer · 2021. 3. 4. · ] Needle insertion medical robot for tumor surgery Computer vision 2 DOF for needle guide, 2 DOF for tumor manipulation](https://img.dokumen.tips/doc/110x75/614374de6b2ee0265c020eb6/needle-and-biopsy-robots-a-review-springer-2021-3-4-needle-insertion-medical.jpg)