Embed Size (px)
Citation preview

TECHNISCHE UNIVERSITÄT MÜNCHEN
Max-Planck-Institute für Biochemie
Abteilung für Moleculare Strukturbiologie
Needle in a haystack:
Protein complex purification from Thermoplasma acidophilum
with a phage display library
Ágnes Hubert
Vollständiger Abdruck der Fakultät für Chemie der Teschnischen Universität München zur
Erlagung des akademischen Grades eines Doktors der Naturwissenschaften (Dr. rer. nat.)
genehmigten Dissertation.
Vorsitzender: Univ. - Prof. Dr. J. Buchner
Prüfer der Dissertation:
1. Hon. - Prof. Dr. W. Baumeister
2. Univ. - Prof. Dr. S. Weinkauf
Die Dissertation wurde am 10.01.2013 bei der Technischen Universität München eingereicht
und durch die Fakultät für Chemie am 22.04.2013 angenommen.

„A tudomány nem képes megoldani a természet végső rejtélyeit. Azért nem képes, mert mi is a
természet részei vagyunk, s ezzel részei vagyunk annak a rejtélynek is, amelyet megoldunk.“
“Science cannot solve the ultimate mystery of nature. And that is because, in the last analysis, we
ourselves are a part of the mystery that we are trying to solve.”
Max Planck (1858-1947)

Table of contents
1
TABLE OF CONTENTS
Table of contents ...................................................................................................................... 1
Zusammenfassung .................................................................................................................... 5
Abstract .................................................................................................................................... 9
1. INTRODUCTION .............................................................................................................. 12
1.1 Thermoplasma acidophilum as a model organism ............................................... 12
1.2 Protein complexes................................................................................................... 13
1.2.1 Protein complexes and their structure determination .................................... 13
1.2.2 Purification strategies of protein complexes ................................................. 15
1.3 Phage display technology ....................................................................................... 17
1.3.1 Overview ....................................................................................................... 17
1.3.2 Bacteriophages and their role in phage display technology .......................... 18
1.3.3 Phagemid vectors .......................................................................................... 20
1.3.4 Theory of phage displaying ........................................................................... 21
1.3.5 Phage display libraries and their applications ............................................... 23
2. AIM OF THE STUDY ......................................................................................................... 27
3. MATERIALS AND METHODS ........................................................................................... 28
3.1 Applied materials ................................................................................................... 28
3.1.1 Chemicals ...................................................................................................... 28
3.1.2 Kits ................................................................................................................ 30
3.1.3 Standards ....................................................................................................... 30
3.1.4 Dyes and staining solutions ........................................................................... 31
3.1.5 Antibodies ..................................................................................................... 31
3.1.6 Bacterial strains ............................................................................................. 31
3.1.7 Enzymes ........................................................................................................ 32
3.1.8 Plasmids and phagemids ............................................................................... 33
3.1.9 Primers .......................................................................................................... 33
3.1.10 Media ............................................................................................................. 33
3.1.11 Buffers and stock solutions ........................................................................... 37
3.1.12 Antibiotic stock solutions .............................................................................. 41
3.1.13 Chromogenic substrate solutions .................................................................. 41
3.1.14 Chromatography columns ............................................................................. 41
3.1.15 Laboratory equipment ................................................................................... 42
Table of contents
2
3.2 Methods ........................................................................................................................ 44
3.2.1 Creation of the scFv-library ........................................................................... 44
3.2.2 Affinity selection of scFv-displaying phages on plastic-immobilized
antigen ............................................................................................................ 44
3.2.3 Affinity selection of scFv-displaying phages on nitrocellulose-
immobilized antigen ....................................................................................... 44
3.2.4 Molecular biology methods ........................................................................... 44
3.2.4.1 Preparation of chemically competent E. coli ........................................ 44
3.2.4.2 Heat shock transformation of chemically competent E. coli ................ 45
3.2.4.3 Amplification and isolation of plasmid DNA from E. coli ................... 45
3.2.4.4 Agarose gel electrophoresis .................................................................. 45
3.2.4.5 DNA extraction from agarose gel ......................................................... 46
3.2.4.6 Restriction digestion of DNA ................................................................ 46
3.2.4.7 Clean-up procedure of digested DNA ................................................... 47
3.2.4.8 DNA-ligation assay ............................................................................... 47
3.2.4.9 Plasmid maintenance and amplification ................................................ 48
3.2.4.10 DNA sequencing ................................................................................. 48
3.2.4.11 Determination of DNA concentration ................................................. 48
3.2.5 Cultivation of E. coli for heterologous protein expression and
preparation of cell extracts ........................................................................... 48
3.2.5.1 Expression of T. acidophilum structural genes .................................... 48
3.2.5.2 Expression of mouse scFvs .................................................................. 49
3.2.5.3 Whole cell extract preparation ............................................................. 49
3.2.5.4 Periplasmic extract preparation ............................................................ 50
3.2.6 Cultivation and cell extract preparation of Thermoplasma acidophilum ....... 50
3.2.6.1 Growth and harvest of T. acidophilum ................................................ 50
3.2.6.2 Preparation of T. acidophilum cytosolic extract ................................... 50
3.2.6.3 Long-term storage of T. acidophilum ................................................... 51
3.2.7 Protein purification ......................................................................................... 51
3.2.7.1 Ni-affinity chromatography of recombinant His-tagged proteins ....... 51
3.2.7.2 Size exclusion chromatpgraphy ........................................................... 52
3.2.7.3 Hydroxy-apatite chromatography........................................................ 53
3.2.8 Protein analysis ............................................................................................... 54
3.2.8.1 Polyacrylamid gel electrophoresis (PAGE)......................................... 54
3.2.8.2 Determination of protein concentration .............................................. 55
3.2.8.3 Mass spectrometry ............................................................................... 56
3.2.8.4 Electron microscopy ........................................................................... 56
3.2.9 Immunology methods .................................................................................... 57
3.2.9.1 Monoclonal ELISA assay ..................................................................... 57
3.2.9.2 Western-blot assay................................................................................ 58
Table of contents
3
4. RESULTS AND DISCUSSION .............................................................................................................. 60
4.1 Creation of the scFv-library ................................................................................. 60
4.2 Selection of scFv-library against complex antigen mixtures ............................ 60
4.2.1 ScFv selection using the OH-apatite separated Sup12-HMWF of
T. acidophilum ............................................................................................... 61
4.2.1.1 Phage selection against the OH-apatite separated Sup12-HMWF ....... 61
4.2.1.2 Affinity purification of protein complexes using
agarose bead-immobilized scFv-displaying phages ............................ 63
4.2.1.3 Affinity purification of protein complexes using
surface-immobilized scFvs ................................................................... 64
4.2.1.4 Purification of protein complexes using a
two-step chromatography method ........................................................ 72
4.2.2 Superose 12-enriched high molecular weight protein fraction
(Sup12-HMWF) of T. acidophilum cytosolic extract as target mixture ......... 79
4.2.2.1 Phage selection and screening against Sup12-HMWF ......................... 79
4.2.2.2 Phage selection against low abundant complexes combined with
de-selections against abundant complexes ........................................... 81
4.3 Protein complex purification with scFvs selected against recombinant
T. acidophilum proteins ......................................................................................... 85
4.3.1 Phage selection against recombinant targets ................................................. 85
4.3.1.1 Phage selection against Ta0316, Ta1194, Ta1315 and Ta1435-38 ...... 85
4.3.1.2 Phage selection against Ta1488 .......................................................... 87
4.3.1.3 Phage selection against Ta0328 ........................................................... 92
4.3.2 A novel biopanning method: Isolation of phages from nitrocellulose
membrane-bound proteins with the help of Western-blot technique ........... 100
4.3.2.1 Isolation of target specific phages from nitrocellulose membrane ..... 100
4.3.2.2 Selection of nitrocellulose-isolated phages on plastic-immobilized
antigen ................................................................................................ 102
4.3.2.3 Direct screening of nitrocellulose-isolated phages ............................. 102
4.3.2.4 Purification of scFv-captured 2-oxo acid dehydrogenase complex
from T. acidophilum ........................................................................... 104
4.4 Protein purification with scFvs selected for small archaeal
modifier proteins (SAMPs) ................................................................................ 107
4.4.1 Phage selection against Ta0895 .................................................................... 107
5. CONCLUSIONS AND PERSPECTIVES ............................................................................ 112
6. ABBREVIATIONS ........................................................................................................... 118
7. SUPPLEMENTARY DATA .............................................................................................. 121
Table of contents
4
7.1 Creation of the scFv library .................................................................................. 121
7.1.1 Immunization of mice and harvest of spleens .............................................. 121
7.1.2 Construction of the scFv repertoire in a phagemid vector ........................... 121
7.1.3 Sequence analysis/alignment of scFv clones obtained after the library
construction .................................................................................................. 128
7.2 Affinity selection of scFv-displaying phages on plastic-immobilized antigens ... 129
7.3 Establishment of monoclonal cell lines for ELISA-assay ..................................... 133
7.3.1 Establishment of TG1 cell lines and growth of monoclonal phages ............. 133
7.3.2 Establishment of HB2151 cell lines and expression of E-tagged scFvs ....... 133
7.4 Construction of a modified pET28 (pET28(SfiI)) ................................................. 134
7.5 ELISA-assays of monoclonal phages ................................................................... 135
7.6 SDS-PAGE analysis of proteins ........................................................................... 136
7.7 Western-blot assays .............................................................................................. 137
7.8 Amino acid sequences of scFvs used for protein purification ............................. 138
7.9 Recombinant proteins applied for scFv-selections .............................................. 142
8. REFERENCES................................................................................................................ 143
9. ACKNOWLEDGEMENTS ............................................................................................... 149
Zusammenfassung
5
ZUSAMMENFASSUNG
Thermoplasma acidophilum ist ein thermoazidophiles Archaeon der Euryarchaeota, das bei
59°C und pH 2 wächst. Es stellt einen attraktiven Modellorganismus für die visuelle
Proteomik dar, deren Ziel es ist, mithilfe von Kryo-Elektronenmikroskopie und
Mustererkennungsverfahren, eine umfassende zelluläre Kartierung makromolekularer
Komplexe zu erreichen. T. acidophilum weist einen vielfältigen Bestand an Proteinkomplexen
auf, in dem Gruppierungen zu finden sind, die wie vereinfachte Variationen ihrer
eukaryontischen Pendants aussehen und die in Faltung, Abbau und Umsatz von Proteinen
involviert sind. Viele dieser sehr großen Proteinkomplexe sind strukturell charakterisiert, es
lassen sich jedoch viele hypothetische und partiell charakterisierte Komplexe finden, deren
molekulare Architektur und biochemische Funktion noch nicht erforscht wurde.
Um einen Einblick in die molekulare Architektur von Proteinkomplexen zu bekommen, ist die
Isolierung intakter Strukturen unabdingbar. Obwohl heutzutage eine große Anzahl an
Proteinaufreinigungstechniken zur Verfügung steht, existiert aufgrund jeweils bestimmter
Nachteile keine universell einsetzbare Methode, die es erlaubte, alle möglichen Komplexe
intakt und in aktivem Zustand zu erhalten. Niedrige Expressionsraten von nativem /
rekombinantem Protein, Aggregation, Dissoziation oder Entfaltung können aufgrund
unzureichender Mengen an nativ gefaltetem Protein strukturelle Untersuchungen ebenfalls
begrenzen. Falls genetische Werkzeuge nicht zur Verfügung stehen, kann eine
antikörperbasierende Methode zur Aufreinigung entwickelt werden, die eine schnelle und
präzise Isolierung von Zielproteinen direkt aus ihrer nativen Umgebung möglich macht und
eine ausreichende Menge an Protein für die EM-Analyse liefert. Desweiteren verlangt die
Einzelpartikel-Elektronenmikroskopie, im Gegensatz zur Röntgenstrukturanalyse, nicht die
Züchtung von Proteinkristallen als Voraussetzung für die Strukturanalyse, was die benötigte
Zeit zur Probenvorbereitung drastisch senkt.
Im Zuge der vorliegenden Untersuchungen wurde eine scFv-basierte Phagen-Display-
Bibliothek entwickelt, mit dem Ziel Proteinkomplexe aus T. acidophilum mit spezifischen
Antikörpern schonend aufzureinigen. Während die antikörperbasierte Phagen-Display-
Technologie ursprünglich für einzelne Zielantigene entwickelt wurde, war es in unserem Fall

Zusammenfassung
6
nötig, sie auf eine komplexe Proteinmischung von mindestens dreihundert Proteinen
anzupassen. Als Ausgangspunkt erstellten wir die Phagen-Display-Bibliothek, indem wir
Mäuse mit hochmolekularen Proteinfraktionen (Sup12-HMWF) aus T. acidophilum
immunisierten und scFvs aus Milz Gesamt-mRNA konstruierten.
Um die Antigenvielfalt zu verringern, wurde die Phagenselektion zunächst gegen
unterschiedliche K2HPO4-KH2PO4-Elutionsfraktionen von Hydroxylapatit-getrennten Sup12-
HMWF durchgeführt. Nach der Identifizierung spezifisch bindender Phagen versuchten wir
die Aufreinigung von Proteinkomplexen mithilfe von auf Agarosekügelchen immobilisierten
Phagen. Dieses Konzept war jedoch aufgrund der strukturellen Limitation der filamentösen
Phagenpartikel nicht erfolgreich. Wir haben die Strategie daher in Richtung eines
antikörperbasierenden Pull-down Assays in Lösung geändert. Da sich die Expression von
löslichen E-Tag-markierten scFvs infolge der zeitaufwendigen Lokalisationsbestimmung
(Zytosol, Periplasma und/oder Medium) nicht als sinnvoll erwies, entwickelten wir einen
modifizierten pET28-Vektor (pET28-SfiI), um die Expression von scFvs mit einem C-
terminalen 6-His-Tag zu ermöglichen. Der Pull-down von Proteinkomplexen mithilfe von auf
Agarose immobilisierten His-Tag-markierten scFvs resultierte in der erfolgreichen
Aufreinigung des molekularen Chaperonins Thermosom (Ta0980 und Ta1276), es konnten
jedoch infolge der rauhen Elutionsbedingungen keine intakten Partikel erhalten werden. Um
Dissoziation und mögliche Denaturierung der Proteinkomplexe zu vermeiden, die aufgrund
der Antikörper-Antigen-Interaktion während der Elution vorkommen können, wurden die
Komplexe im nächsten Pull-down Assay mithilfe von Ni-Affinitätschromatographie
aufgereinigt, der eine Größenausschlusschromatographie folgte. Dieser neue
Aufreinigungsansatz ermöglichte es uns, strukturell intaktes Thermosom (Ta0980 and
Ta1276) und 20S-Proteasom-Partikel (Ta0612 and Ta1288) zu erhalten, sowie ein Protein, bei
dem es sich wahrscheinlich um Peroxiredoxin (Ta0152) handelt, dessen Komplex wir jedoch
nicht durch EM visualisieren konnten.
Im nächsten Versuch setzten wir die ursprüngliche Antigenlösung (Sup12-HMWF) ein, was
zu einer sehr viel größeren Zahl bindender Phagen führte als bei Selektion gegen höher
aufgereinigte Hydroxylapatitfraktionen. Um die Effizienz der Phagenselektivität noch feiner
abzustimmen, wurde ein Deselektions-Schritt gegen häufig vorkommende Proteinkomplexe
(Thermosom, Proteasom) in das Biopanning-Protokoll eingeführt, und die Wirksamkeit dieses
Zusammenfassung
7
Archiv-Reinigungsschritts mithilfe eines vergleichenden ELISA-Assays verfolgt. Von 373
getesteten Klonen wurden 217 spezifisch bindende identifiziert, von denen 62 (30%)
potentiell neue Zielantigene zu erkennen schienen. Trotz der erfolgreichen Klonierung konnte
allerdings keiner dieser scFv-Klone in phagenfreier Form sequenziert und exprimiert werden,
was auf die Anreicherung einer ungewöhnlichen Form von scFv hindeutet.
Im nächsten Phagenselektionsversuch wechselten wir zu individuellen rekombinanten
Proteinen, von denen angenommen wurde, dass sie mutmaßliche Bausteine möglicher
Proteinkomplexe einer Größe von über 300 kDa darstellen. Die Biopanning-Assays wurden in
verschiedenen Variationen durchgeführt (wechselnder Typ und Menge Sup12-HMWF-
selektierter Phagen, Anzahl der Selektionszyklen, Inkubations/Waschbedingungen und
Reinheit des Zielantigens). Unter Benutzung der gut funktionierenden Zwei-Schritt-
Chromatographie gelang es uns, das mutmaßliche intermediäre Filament Ta1488
aufzureinigen. Die Aminosäuresequenz sagt vorher, dass Ta1488 einen multimeren Komplex
bildet, allerdings konnte dies durch die EM-Analyse der aufgereinigten Fraktionen nicht
nachgewiesen werden. Wir haben ebenfalls Antikörper gegen das archaeelle Homolog des
fixABCX-Komplexes gefunden. Diese Antikörper konnten jedoch keine verwertbaren
Mengen des vermeintlichen Komplexes einfangen. Stattdessen wurde aus dem Zellextrakt ein
Formiat-Dehydrogenase-Homolog (Ta0425) zusammen mit einem Protein der kleinen
Untereinheit (Ta0424) angereichert, der etwa einem Molekulargewicht von 450-500 kDa
entspricht. Die Fähigkeit, einen Komplex auszubilden, wurde durch EM-Analyse bestätigt. Da
die meisten der nativen und rekombinanten Zielproteine niedrige Expressionsraten aufwiesen
und/oder sehr empfindlich gegenüber den Aufreinigungsbedingungen waren, wurden die
Phagen im nächsten Versuch mit einer neuartigen Selektionstechnik, durch Nitrozellulose-
immobilisiertes Antigen, isoliert, um diese Hürden zu überwinden. Die Durchführbarkeit
dieser Methode wurde durch die Aufreinigung des 5 MDa großen 2-Oxo-Säure-
Dehydrogenase-Multienzymkomplexes bestätigt, der erfolgreich von nitrozellulose-
gebundenen antigen-isolierten scFv eingefangen werden konnte.
Zuletzt haben wir eine Archiv-Selektion gegen den SAMP-Kandidaten Ta0895 durchgeführt,
mit dem Ziel, SAMP-markierte Proteine / Proteinkomplexe durch einen Pull-down-Assay
einzufangen. Die Phagenselektion ergab eine bedeutende Anzahl an Phagen, die sowohl unter
Zusammenfassung
8
ELISA- als auch unter Western Blot-Bedingungen rekombinantes Ta0895 spezifisch
erkannten. Dies deutet auf eine erfolgreiche Anreicherung von SAMP-spezifischen Phagen
hin.
Alles in allem diente dieses Projekt der Entdeckung von strukturell unbekannten
mutmaßlichen Proteinkomplexen, die mit spezifischen Antikörpern detektiert und isoliert
werden können, sowie der Bereitstellung einer geeigneten Aufreinigungsprozedur für
Einzelpartikel-EM-Untersuchungen. Das Projekt umfasste auch die Ausarbeitung der
Selektionstechniken und ihrer Screening-Systeme, sowie darüberhinaus die Entwicklung einer
schonenden, antikörperbasierten Aufreinigungsstrategie, die dazu geeignet ist,
hochmolekulare Proteinkomplexe für die strukturelle Untersuchung zu isolieren. Im
Gegensatz zu anderen Antikörper-Archiven, bei denen der Antikörper-Satz gegen ein einziges
Ziel-Antigen gerichtet ist, liefert das in dieser Arbeit erzeugte scFv-Archiv eine vielfältige
Zusammenstellung von Antikörpern, und ermöglicht die Selektion spezifischer
Bindungsparter für eine Reihe von Zielproteinen aus der hochmolekularen Proteinfraktion
von T. acidophilum.
Zusammengefasst kann unsere archivbasierte Phagen-Display Strategie für die
Proteinkomplexaufreinigung als Plattform für Untersuchungen in der visuellen Proteomik
dienen, deren Ziel es ist, ein Template-Archiv für die Erstellung eines zellulären Atlases
anzulegen.
Abstract
9
ABSTRACT
Thermoplasma acidophilum is a thermoacidophilic archaeon that thrives at 59°C and pH 2
and belongs to the Euryarchaeota lineage. It has become an attractive model organism for
visual proteomics approaches, which aims to provide a comprehensive cellular atlas of
macromolecular complexes with the aid of cryo-electron tomography and pattern recognition
procedures. T. acidophilum exhibits a colourful protein complex inventory, amongst which
there are assemblies that look like simple variations of their eukaryotic counterparts and many
of them are involved in protein folding, degradation and turnover. Most of these large protein
complexes are structurally characterized, however, there are still many hypothetical and
partially characterized assemblies whose molecular architecture and biochemical function is
not yet explored.
To get an insight into the molecular architecture of protein complexes the isolation of intact
structures is indispensable. Although a vast number of protein purification techniques are
available, there is no universal method which would be effective to keep all the complexes in
their intact and active state suitable for biochemical and structural analyses. One of the gentle
and rapid purification methods is the antibody-based affinity purification, which allows the
isolation of target complexes directly from their native environment, and serves sufficient
amount of them for EM-analysis. Furthermore, in contrast to X-ray crystallography, single
particle EM does not require the growth of protein crystals prior to the structural analysis,
which radically reduces the time needed for sample preparation.
In this study, a scFv-based phage display library was developed, aiming the gentle
purification of protein complexes from T. acidophilum with specific antibodies. While the
antibody-based phage display technology was developed originally for single target antigens,
we had to adapt it to a complex protein mixture containing at least 300 proteins. As a starting
point, we created the phage display library by immunizing mice with the high molecular
weight protein fractions (Sup12-HMWF) of T. acidophilum and constructing scFvs from the
spleen total mRNA. To lessen antigen diversity, the phage selection and screening was first
carried out against different K2HPO4-KH2PO4 elution fractions of OH-apatite separated
Sup12-HMWF. After identifying positive binders we attempted the purification of protein
Abstract
10
complexes with agarose bead immobilized phages, which conception failed due to the
structural limitation of filamentous phage particles. Therefore, we had to change the strategy
to a soluble antibody-based pull-down assay. Since the expression of soluble E-tagged scFvs
did not prove to be reasonable as it required too much time and labor to monitor the location
(cytosol, periplasm and/or medium) of soluble proteins, we developed a modified pET28
vector (pET28-SfiI) to allow expression of scFvs with a C-terminal 6 Histidine fusion tag. The
pull-down of protein complexes using the agarose-immobilized His-tagged scFvs resulted in
the successful purification of the molecular chaperonin thermosome (Ta0980 and Ta1276),
however, no intact particles could be obtained due to harsh elution conditions. To avoid
dissociation and possible denaturation of protein complexes caused by antibody-antigen
interaction abolishing eluents/agents, in the next pull-down approach complexes were purified
by Ni-affinity chromatography followed by size exclusion chromatography. With the new
purification approach we were able to isolate structurally intact thermosome (Ta0980 and
Ta1276) and 20S proteasome particles (Ta0612 and Ta1288) and the probable peroxiredoxin
(Ta0152), however, in the latter case the complex could not be visualized by EM.
As a next attempt, we applied the original antigen mixture (Sup12-HMWF), which resulted in
many more phage binders than the selection against the further purified OH-apatite fraction.
To further fine tune the efficiency of phage selection, de-selections against abundant protein
complexes (thermosome, proteasome) were introduced in the biopanning, which was
monitored with a comparative ELISA-assay to visualize the efficiency of library clean-up.
Out of 373 tested clones 217 positive binders were identified, of which 62 (30%) appeared to
recognize potential new target antigens. However, in spite of the successful cloning, none of
the de-selected scFv clones could be sequenced and expressed in a phage-free form,
indicating the enrichment of an unusual scFv form.
In the next phage-selection approach, we switched to individual recombinant proteins, which
were assumed to be putative building blocks of probable protein complexes over the size of
300 kDa. The biopanning assays were carried out in different implementations (varying type
and amount of Sup12-HMWF-selected phage inputs, number of selection cycles,
incubation/washing conditions and purity of the target antigen). Using the well-working two-
step chromatography method we were able to purify the putative intermedier filament
Ta1488, however the EM analysis of purified fractions did not prove that Ta1488 form a
Abstract
11
multimeric complex as it was predicted from its amino acid sequence. We also found
antibodies against the archaeal homologue of the fixABCX complex, these antibodies,
however, could not capture usable amounts of the putative complex. Instead, a formate
dehydrogenase homologue protein (Ta0425) was enriched from the cell extract together with
its putative small subunit constituent (Ta0424), corresponding to 450-500 kDa molecular
weight, which complex forming ability was proved by EM-anaysis.
Since most of the native and recombinant target proteins exhibited low expression levels
and/or were highly sensitive to the purification conditions, to overcome these hurdles, in the
next approach phages were isolated with a novel selection technique using nitrocellulose
membrane-immobilized antigens. The viability of this method was proved by the purification
of the 5 MDa 2-oxo acid dehydrogenase multi-enzyme complex, which was successfully
captured by a nitrocellulose-bound antigen-isolated scFv.
Finally, we carried out a library selection against the SAMP candidate Ta0895 protein aiming
the capturing of SAMP-labelled proteins/protein complexes by pull down assay. Following
phage selection, a significant number of phages proved to specifically recognize recombinant
Ta0895 in both ELISA and Western blot conditions, which indicated the successful
enrichment of SAMP specific phages from the system.
Taken together, the project aided the discovery of structurally unknown, putative protein
complexes by finding and isolating them with specific antibodies to provide a feasible
purification procedure for single particle EM studies. The project included the elaboration of
selection techniques together with their screening systems, furthermore, the development of a
gentle, antibody-based purification strategy suitable for isolating high molecular weight
protein complexes for structural studies. In contrast to other antibody libraries, where the
antibody set is targeted against a defined antigen, the scFv-library generated in this work
provided a diverse antibody set allowing for the selection of specific binders for a variety of
protein targets from the high molecular weight protein fraction of T. acidophilum. In
conclusion, our phage display library-based protein complex purification strategy can serve as
a platform for studies on visual proteomics approaches that aim the creation of a template
library for the generation of a cellular atlas.
Introduction
12
1. INTRODUCTION
1.1 Thermoplasma acidophilum as a model organism
Thermoplasma acidophilum is a thermoacidophilic archaeon that was first isolated from a
self-heating coal refuse pile (1). The microorganism thrives at 59°C and pH 2 and belongs to
the Euryarchaeota lineage, being a member of the genus Thermoplasma. T. acidophilum is a
facultative anaerobe microbe which uses oxygen as terminal electron acceptor or S0 if
cultured anaerobically. The cell morphology is pleomorphous with the cell size varying
between 0.2 and 2 µm. The common feature of the genus Thermoplasma is that the cells lack
rigid cell wall and are delimited only by a plasma membrane. The genome size of T.
acidophilum is around 1.5 Mbp and comprises 1507 open reading frames of which 1482
encodes for protein (2).
Proteomics studies based on 2DE-MALDI-TOF MS approach provided information on the
expressed cytosolic proteins and macromolecular complexes of T. acidophilum (3). In the
protein complement of T. acidophilum there are a number of macromolecular assemblies
playing important role in protein folding, degradation and methabolic pathways. Based on
database searches, many of those highly expressed proteins that form complexes are identified
and structurally characterized, such as the archaeal chaperon thermosome, the VCP-like
ATPase (VAT), which participates in numerous cellular activities (4-8), the “protein
graveyard” 20S proteasome, (9) or the tricorn protease, the core of a modular proteolytic
system (10). Molecular sieve chromatography in combination with LC-MS/MS helped to
reveal less abundant cytosolic proteins on the basis of size distribution and bioinformatics
analysis and thus, further enlarging the inventory of protein complexes (11). Using state-of-
the-art mass spectrometric technologies 1025 proteins were identified, covering 88% of the
cytosolic proteome of T. acidophilum (12). In the cytosolic proteome of T. acidophilum a
large proportion of the proteins are organized into dimer, trimer, oligomer or multimer forms,
amongst which 35 macromolecular assemblies have been identified with sizes over 300 kDa.
These large protein structures serve as adequate candidates to create template libraries for
visual proteomics studies and thereby promoting the generation of a comprehensive cellular
atlas of macromolecular complexes (13). Visual proteomics approaches aim to determine
Introduction
13
spatial relationships of macromolecular complexes inside an unperturbed cellular environment
by using cryoelectron tomography and pattern recognition procedures. The lack of cell wall,
relatively small genome and low cellular complexity make T. acidophilum a favourable model
organism for visual proteomics approaches.
The question, how extremophiles can survive harsh environments, has remained in the focus
of research for decades. The ability to respond to extreme environmental challenges requires
not only particular physiological functions but also structural suitability. These often results in
strange appearances and the presence of unusual biochemical pathways. T. acidophilum is an
interesting organism representing a colorful protein complex inventory, amongst which there
are assemblies that look like simple variations of their eukaryotic counterparts. With the help
of single particle electron microscopy and X-ray crystallography many of these large
complexes have been structurally characterized, however, there are still many hypothetical
and partially characterized protein complexes whose molecular architecture and biochemical
function is not yet explored. The characterization of these macromolecular assemblies could
help to elucidate the structure and function of their similar but more complex eukaryotic
homologues.
1.2 Protein complexes
1.2.1 Protein complexes and their structure determination
Protein complexes are assemblies of multiple proteins that play essential roles in living
organisms in accomplishing and regulating cellular processes. To be able to perform their
molecular functions macromolecules fold into specific three-dimensional shapes acquiring
their functional, native state. The final architecture is determined by the primary structure of
molecules (i.e their amino acid sequences). Within the long polypeptide chains there are
regions which form ordered secondary structure elements, namely α-helices and β-sheets. To
carry out biochemical processes, many single protein molecules are organized into multi-
molecular complexes allowing the interaction partners to function as one entity, executing
several multi-step reactions in an ordered way at a time. These multi-molecular assemblies
Introduction
14
give the proteins the quaternary structure, in which the number and type of individual proteins
(subunits) determines their functional characteristics and structural appearances. The
quaternary structure of a protein complex depends on the oligomerization capacity of the
protein subunits, which can form dimers, trimers, tetramers and other oligomers. The subunit
content of a multimeric protein may be identical, similar or completely different concerning
the type of proteins. Protein complexes being assembled with the same type of proteins are
called homo-oligomers or homo-multimers, while complexes containing dissimilar subunits
are known as hetero-oligomers or hetero-multimers. Many naturally occurring proteins and
enzymes are arranged in oligo- or multi-protein complexes to carry out their biological
functions in the intracellular environment or in the cell membrane. Such well-known protein
complexes are for instance the homo-tetramer hemoglobin, the bacterial chaperone GroEL,
the multi-enzyme complex 50S and 70S ribosomes, the PSI and PSII photosystems, the 26S
proteasome, the pyruvate-dehydrogenases, and include furthermore several ion-channels,
microtubules and other cytoskeletal proteins (14).
To understand molecular functions and interactions taking place in different locations of the
cell - like cytoplasm, nucleus or membrane - the structural and functional investigation of
protein complexes is essential. Molecular structural biology studies the 3-dimensional
structure of biological macromolecules, how they acquire their structure, and how alterations
in their structures affect their function. The methods that structural biology uses for
determining 3D structures generally involve measurements on vast numbers of identical
molecules at the same time. The most widely applied methods for structural determination
include X-ray christallography, electron microscopy, NMR and CD-spectroscopy. Single
particle electron microscopy is an increasingly important tool for the structural analysis of
macromolecular complexes, whose main advantage is over other methods that it does not
require the growth of protein crystals prior to structural analysis. Cryoelectron microscopy
(CEM) is particularly important for membrane proteins and large protein complexes where
generating crystals is often the main barrier to structural determination. Furthermore, (CEM)
allows the observation of specimens that have not been stained or fixed in any way, showing
them in their native environment in contrast to X-ray crystallography, which generally
requires placing the samples in non-physiological environments that occasionally leads to
functionally irrelevant conformational changes. However, by combining single particle EM
Introduction
15
maps with high-resolution models of subunits or sub-complexes from X-ray crystallography
and NMR spectroscopy, it is possible to build up an atomic model of a macromolecular
assembly (15).
Computational data acquisition is used for data processing, image analysis, averaging and
aligning different datasets thereby, contributing to visualizing complete molecular
architectures. Bioinformatics approaches help to acquire complicated datasets and look for
patterns among the diverse sequences that give rise to particular shapes. A number of
computer programs developed for protein structure prediction, modelling and structural
alignment are now available and used to deduce information on protein structure (HNN, PSA,
Swiss model, PyTOM, PQS, PyMOL).
1.2.2 Purification strategies of protein complexes
Most purification schemes involve some form of chromatography, which are based on the
separation of protein components. Classical protein purification procedures are based on the
combination of chromatography techniques allowing the optimal purification yield required
for further studies. Since there is no universal method which would be effective to keep all
complexes in their intact and active state, the purification strategy of an unknown structure
should always be determined experimentally on an individual basis, which often requires a
number of time-consuming polishing steps. Different chromatography techniques with
different selectivities like size exclusion chromatography, glycerole and/or sucrose gradient
ultra centrifugation, ion-exchange chromatography, hydrophobic interaction chromatography
or hydroxyl-apatite chromatography can form powerful combinations for the purification of
any biomolecule. Although multi-step purification procedures often yield excellent purity of
proteins, those, which may be fairly easy to obtain in a pure state, are not always stable at the
applied conditions. Some proteins tend to aggregate, dissociate or unfold over a period of
time, which may lead to a significant loss of actively folded protein assemblies. The time of
purification procedure should therefore be always reduced to a minimum in order to avoid
unwanted changes in protein structure prior to the structural analysis.
Introduction
16
To accelerate the purification procedure novel methods have been developed. The
development of recombinant DNA techniques has revolutionized the production of affinity
tagged proteins in large quantities, facilitating their solubility and their purification by the
appropriate affinity chromatography (SUMO-tag (16), FLAG-tag (17), Strep-tag (18) His-tag
(19), GST-tag (20)). Although heterologous expression systems may enable the production of
high quantity of target proteins, the host contaminants are still present and problems related to
solubility, structural integrity and biological activity can still exist. Therefore, chromosomally
tagged protein purification technologies are becoming more and more popular if genetic tools
are available for the investigated host. Free-flow electrophoresis (FFE) is used for the
analytical and preparative separation of intracellular components from the native cellular
environment (21, 22). It separates charged particles ranging in size from molecular to cellular
dimensions according to their electrophoretic mobilities (EPMs) or isoelectric points (pIs).
However, it is not always an applicable method, since it may cause the disassembly of
instable protein structures in the electric field. Native polyacrylamide gel electrophoresis
combined with electron microscopy grid blotting is a fast and efficient method to transfer high
molecular weight protein complexes from the acrylamide gel matrix directly to electron
microscopy grids, which promote a quick structural analysis (23). This technique can be
applied if the proper separation of certain protein complexes from each other is not feasible by
conventional chromatography methods. However, it can only be used for protein bands
containing high quantities of protein samples.
Single particle electron microscopy approaches does not require high protein quantities for the
structural determination in contrast to X-ray crystallography. Therefore, the antibody-based
small-scale pull-down assays may alone supply sufficient amount of protein samples for
image analysis and data acquisition. This can be crucial, if the protein target is expressed at
extremely low level and cannot be traced by conventional chromatography methods. The
capturing of natively folded proteins with highly specific monoclonal antibodies directly from
cell extracts is a mild and fast purification method, which usually does not require additional
purification steps and can also be used to study specific protein-protein interactions. Large
sets of combinatorial antibody libraries have nowadays been constructed and selected for
target specificities using the phage display technology (24), which has revolutionized
Introduction
17
antibody engineering by extending the antibody repertoire with potential new binders. By
combining the epitope recognizing variable regions of IgG (Immunoglobulin G) molecules,
small molecular weight, recombinant antibody libraries can be generated (scFv, Fab, dsFv)
that allow a wider utility of antibodies by means of their increased stability (25-29).
Conventional protein pull-down assays can be used to enrich high molecular weight protein
complexes by highly specific antibodies and are frequently used in proteomics studies to
investigate the structural constitution and interaction partners of protein assemblies (30-32).
1.3 Phage display technology
1.3.1 Overview
Phage display technology is a powerful method to study protein–protein, protein–peptide, and
protein–DNA interactions. The technology was first described in 1985 by George Smith, who
introduced bacteriophage as an expression vector that displays peptides on the surface of a
virion (24). Since then it has become a widely used technique in cell biology, immunology,
pharmacology and drog discovery. In phage display technology the DNA encoding the protein
of interest is fused to a gene that encodes for one of the coat proteins, thus allowing the
presentation of large peptides and proteins on the surface of a filamentous phage. The
bacteriophage - displaying the target protein - delivers its genetic material into E. coli via an
expressed F-pilus displayed on the surface of the cell envelop. This way, the connection
between genotype and phenotype, allows screening and amplification of large protein libraries
in a process called “in vitro selection”, which is analogous to natural selection. Phage display
libraries containing up to 1010
variants can be constructed simultaneously, allowing high-
throughput screening of protein interactions, instead of low-throughput individual engineering
of proteins or peptides to express, purify, and analyze each variant of them one at a time. In
the past decades a large number of phage display libraries have been constructed, leading to
various approaches and techniques for library screening procedures (25, 33-38).
Introduction
18
1.3.2 Bacteriophages and their role in phage display technology
Bacteriophages (or simply phages) are viruses that infect bacteria by injecting genetic
material into the host cell. Infection occurs by attachment to specific receptors on the surface
of bacteria, including lipo-polysaccharides, teichoic acids, proteins or flagella. The host range
of phage is determined by its receptor specificity and only those bacteria can be infected
which possess the phage specific receptor. The phage genome can be single- or double-
stranded DNA or RNA arranged in either circular or linear forms. The protective coating of
the genome is composed of phage genome encoded proteins. Phages use bacterial ribosomes
to translate their mRNAs to proteins required for replication and virion assembly. There are
two versions of viral reproduction cycles: the lytic and the lysogen types. Some phages, like
T4 are only capable of lytic growth, in which the phage genome replicates independently from
the host chromosome and the assembled virions cause immediate cell lysis when exiting the
cell. In contrast, lysogen or temperate phages, like lambda phages, can maintain their genome
as a “prophage” in a dormant state, in most cases within the chromosome of a bacterial host,
which allows the phage genome to replicate together with the host chromosome. The release
of phage genome will occur at certain environmental conditions followed by proliferation of
new virions via the lytic cycle. From this point of view filamentous phages are exceptional,
because they do not kill the host cell while exiting it, thus they are considered to be non-lytic
phages making them the most frequently used helper phages in phage display technology.
Phages mostly used in phage display technology are filamentous, however, there are also
examples of studies based on T4 (39), T7 (40) or lambda phage (41) aided library screening
methods. Filamentous phages have filament- or rod-like shape and possess a circular, single-
stranded DNA genome. They belong to the family Inoviridae, including a number of
Enterobacteria, Pseudomonas, Xanthomonas and Vibrio phage species
(http://www.ictvonline.org). Filamentous phages which infect F' episome bearing Gram
negative bacteria are known as Ff phages. Their infection procedure starts with the attachment
of protein pIII to the F-pilus, leading to a fusion of the phage and the bacterial membrane.
Finally, the viral genome is released into the cytoplasm. The most commonly used
filamentous phages in phage display technology are the closely related M13, f1 and fd phages
which have highly similar structural and functional characteristics.
Introduction
19
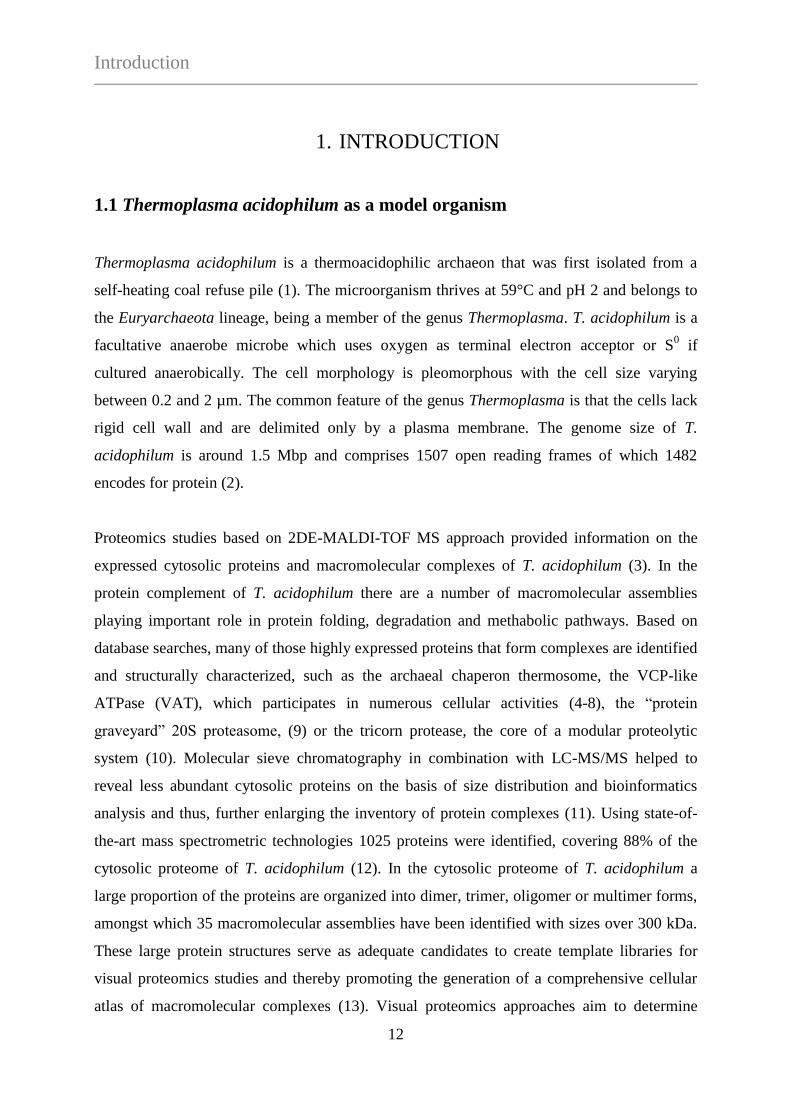
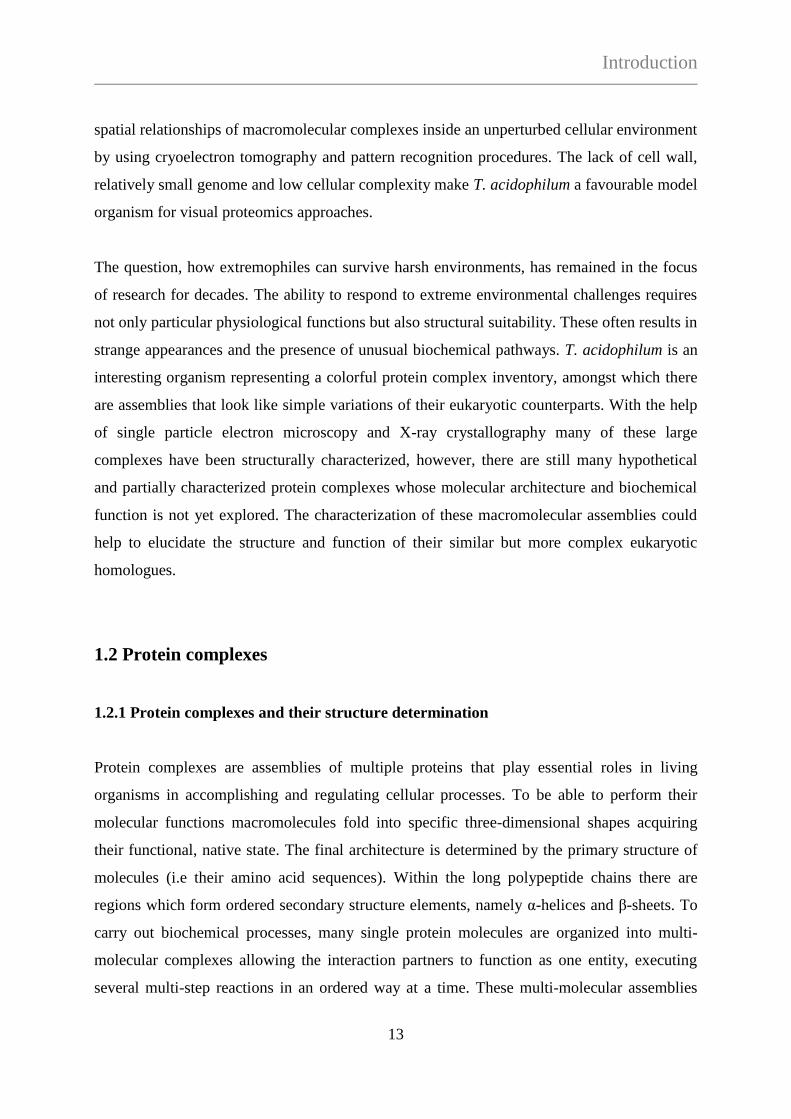
The genomes of M13, f1 and fd phages are more than 98% identical and their gene products
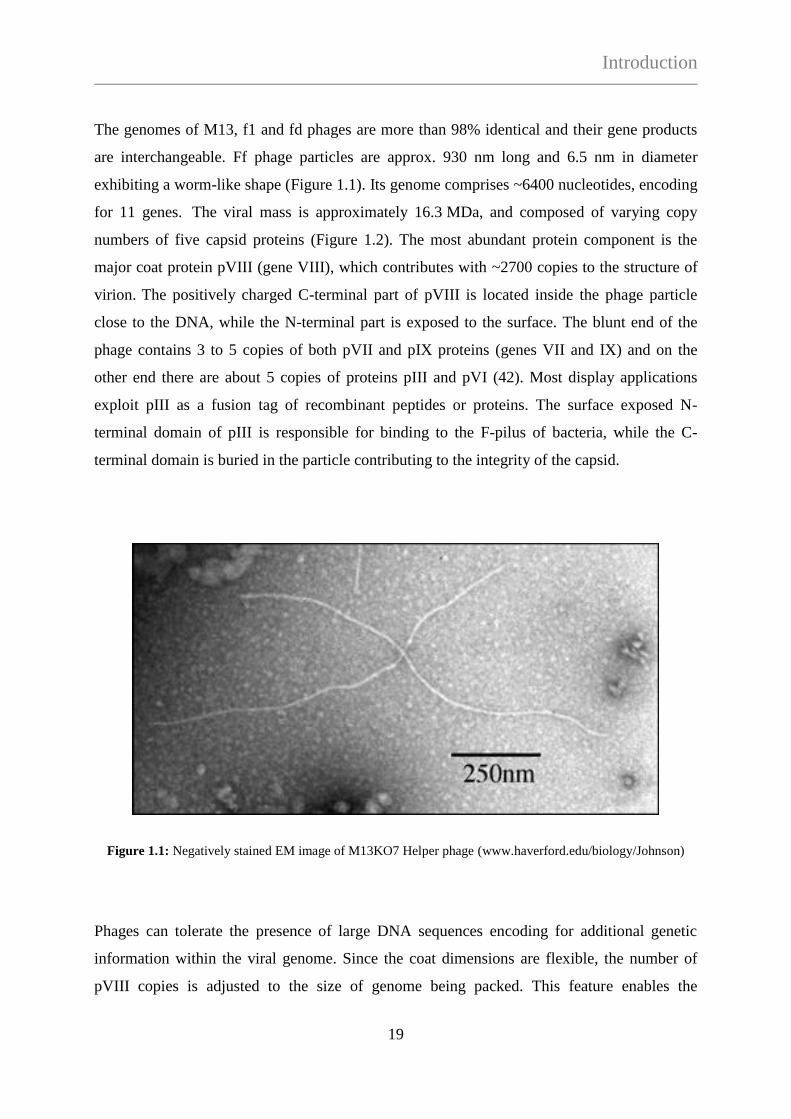
are interchangeable. Ff phage particles are approx. 930 nm long and 6.5 nm in diameter
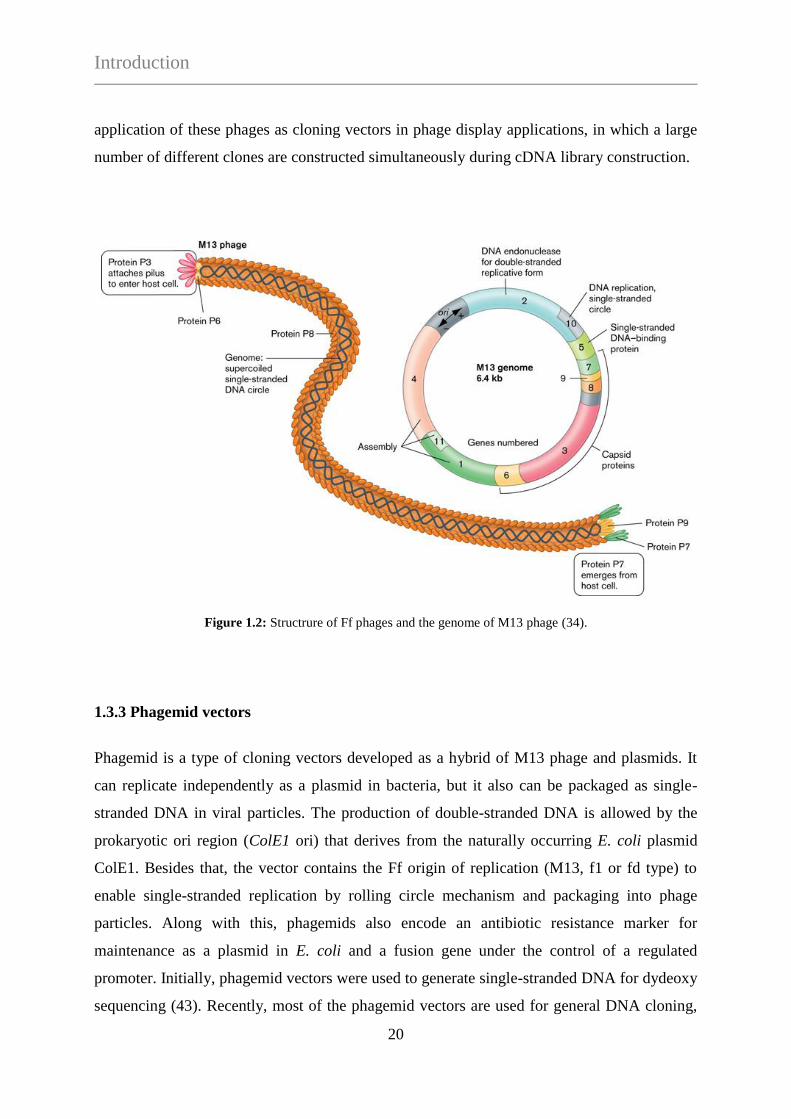
exhibiting a worm-like shape (Figure 1.1). Its genome comprises ~6400 nucleotides, encoding
for 11 genes. The viral mass is approximately 16.3 MDa, and composed of varying copy
numbers of five capsid proteins (Figure 1.2). The most abundant protein component is the
major coat protein pVIII (gene VIII), which contributes with ~2700 copies to the structure of
virion. The positively charged C-terminal part of pVIII is located inside the phage particle
close to the DNA, while the N-terminal part is exposed to the surface. The blunt end of the
phage contains 3 to 5 copies of both pVII and pIX proteins (genes VII and IX) and on the
other end there are about 5 copies of proteins pIII and pVI (42). Most display applications
exploit pIII as a fusion tag of recombinant peptides or proteins. The surface exposed N-
terminal domain of pIII is responsible for binding to the F-pilus of bacteria, while the C-
terminal domain is buried in the particle contributing to the integrity of the capsid.
Figure 1.1: Negatively stained EM image of M13KO7 Helper phage (www.haverford.edu/biology/Johnson)
Phages can tolerate the presence of large DNA sequences encoding for additional genetic
information within the viral genome. Since the coat dimensions are flexible, the number of
pVIII copies is adjusted to the size of genome being packed. This feature enables the
Introduction
20
application of these phages as cloning vectors in phage display applications, in which a large
number of different clones are constructed simultaneously during cDNA library construction.
Figure 1.2: Structrure of Ff phages and the genome of M13 phage (34).
1.3.3 Phagemid vectors
Phagemid is a type of cloning vectors developed as a hybrid of M13 phage and plasmids. It
can replicate independently as a plasmid in bacteria, but it also can be packaged as single-
stranded DNA in viral particles. The production of double-stranded DNA is allowed by the
prokaryotic ori region (ColE1 ori) that derives from the naturally occurring E. coli plasmid
ColE1. Besides that, the vector contains the Ff origin of replication (M13, f1 or fd type) to
enable single-stranded replication by rolling circle mechanism and packaging into phage
particles. Along with this, phagemids also encode an antibiotic resistance marker for
maintenance as a plasmid in E. coli and a fusion gene under the control of a regulated
promoter. Initially, phagemid vectors were used to generate single-stranded DNA for dydeoxy
sequencing (43). Recently, most of the phagemid vectors are used for general DNA cloning,

Introduction
21
transcription or in vitro mutagenesis, such as the pUC19 derivative pTZ19R/U (Fermentas),
pBS (Stratagene), pCDNA3 (Invitrogene), pCF20 (USB) and there are a number of
expression constructs as well, like the commonly used pBluescript II (Stratagene), pAMP1
(BRL), pCDM8 (Invitrogene) and pEX1 (Clontech). These vectors are applicable in E. coli
hosts but there are also available phagemids as E. coli/Saccharomyces shuttle vectors, like
pFL64 (ATCC) or the pGhost shuttle vectors (Applichem), which have broad host range.
Phage display vectors
The common feature of phage display vectors is that they possess an expression/display
cassette beside the phagemid backbone. The display cassette contains an inducible promoter
(e.g. lac) followed by a leader sequence (or signal sequence) that directs the synthesized
peptide/protein to the bacterial periplasm where the phage particle is assembled. The most
frequently used signal sequences are pelB (44-46) and the M13-derived gIII leader peptide
(47-49). In the periplasm, the signal sequence is cleaved by a signal peptidase before the
fusion protein is incorporated into the phage coat. There are restriction sites for cloning
purposes and a fusion peptide tag (e.g. poly-histidie-tag, myc-tag, Flag-tag) that allows
detection of soluble expression products downstream of the leader sequence. The
expression/display cassette ends with the phage coat protein gene (usually pIII or pVIII),
which allows the expressed protein/peptide to be incorporated into the phage particle and to
be displayed. Another substantial property of phage display vectors is that they lack necessary
viral components for phage assembly consequently, they are not infectious. For the
conversion into infective phages the phagemid-bearing cells must be super-infected with
helper phage (VCSM13 or M13KO7) that supplies all the necessary genes required for single-
stranded DNA replication and packaging into phage particles.
1.3.4 Theory of phage displaying
The process starts with the transformation of appropriate E. coli cells with the phagemids
carrying the DNA fragments of a given library (e.g. Fab, scFv, cDNA, peptide library) thus,
generating a phage display library. Commonly used E. coli strains for phage display purposes
Introduction
22
are TG1, JM110, SS320, DH5αF’, XL1-Blue or ER2738. These strains carry the F' episome,
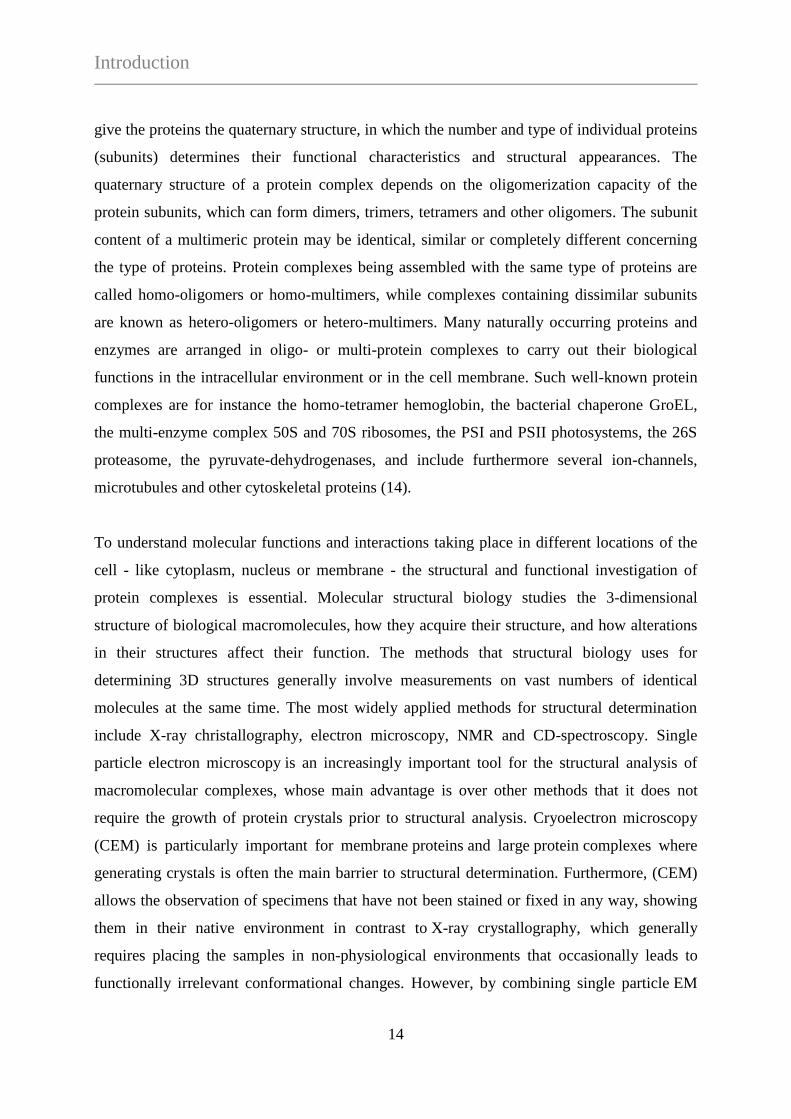
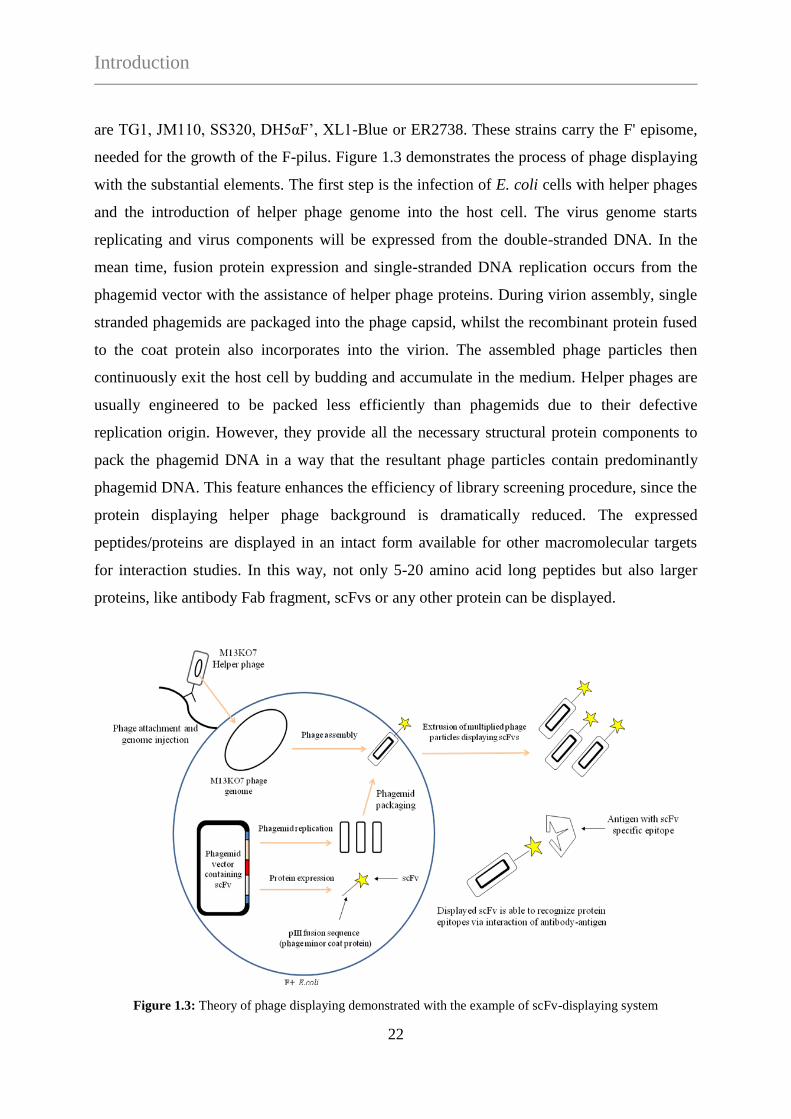
needed for the growth of the F-pilus. Figure 1.3 demonstrates the process of phage displaying
with the substantial elements. The first step is the infection of E. coli cells with helper phages
and the introduction of helper phage genome into the host cell. The virus genome starts
replicating and virus components will be expressed from the double-stranded DNA. In the
mean time, fusion protein expression and single-stranded DNA replication occurs from the
phagemid vector with the assistance of helper phage proteins. During virion assembly, single
stranded phagemids are packaged into the phage capsid, whilst the recombinant protein fused
to the coat protein also incorporates into the virion. The assembled phage particles then
continuously exit the host cell by budding and accumulate in the medium. Helper phages are
usually engineered to be packed less efficiently than phagemids due to their defective
replication origin. However, they provide all the necessary structural protein components to
pack the phagemid DNA in a way that the resultant phage particles contain predominantly
phagemid DNA. This feature enhances the efficiency of library screening procedure, since the
protein displaying helper phage background is dramatically reduced. The expressed
peptides/proteins are displayed in an intact form available for other macromolecular targets
for interaction studies. In this way, not only 5-20 amino acid long peptides but also larger
proteins, like antibody Fab fragment, scFvs or any other protein can be displayed.
Figure 1.3: Theory of phage displaying demonstrated with the example of scFv-displaying system
Introduction
23
1.3.5 Phage display libraries and their applications
The first phage display application was incarnated in the enrichment of only one expressed
and displayed protein against the wild type phage population (24). In the past decades the
technique has become a widely used high-throughput method for library screening procedures
in molecular interaction studies, since a vast number of peptides, proteins, protein domains
and antibodies have been routinely displayed on phages (50-52). Phage display-based libraries
serve as robust tools for selecting proteins or peptides with specific binding properties from
huge numbers of variants and, as such, considerably reduce the time and simplify the work
required for time-consuming screening procedures.
In the aspect of fragment sizes being displayed, peptide or protein displaying libraries can be
distinguished. Both libraries bear the common feature that the information of displayed
fragments is encoded on DNA inserts, which are cloned in the phage display vector.
Biological display systems apply natural libraries, in which the genomic information coding
for a given protein repertoire derives from a biological host and its biological reactions, while
non-biological libraries provide synthetically produced peptides or semi-synthetic derivatives.
Natural peptide libraries are constructed by ligating randomly fragmented genomic DNA with
phagemids (53-55). Synthetic peptide libraries contain randomly synthesized DNA fragments
encoding for artificial peptide sequences (56-60). In the last few years a number of natural
cDNA libraries have also been constructed and developed for phage display purposes (61-63).
By the display of cDNA libraries we can get insights into a portion of the transcriptome of a
variety of organisms. Antibody phage display libraries are also considered to be cDNA
libraries however, they only represent certain domains of full length protein sequences. The
isolation of monoclonal antibodies using large antibody fragment libraries has been one of the
most successful applications of phage display (25, 50, 64) and become a powerful alternative
to hybridoma technology (65).
Antibody libraries and display formats
Efficient techniques have been developed to design and build large libraries of antibody
fragments, and several ingenious selection procedures have been established to derive
Introduction
24
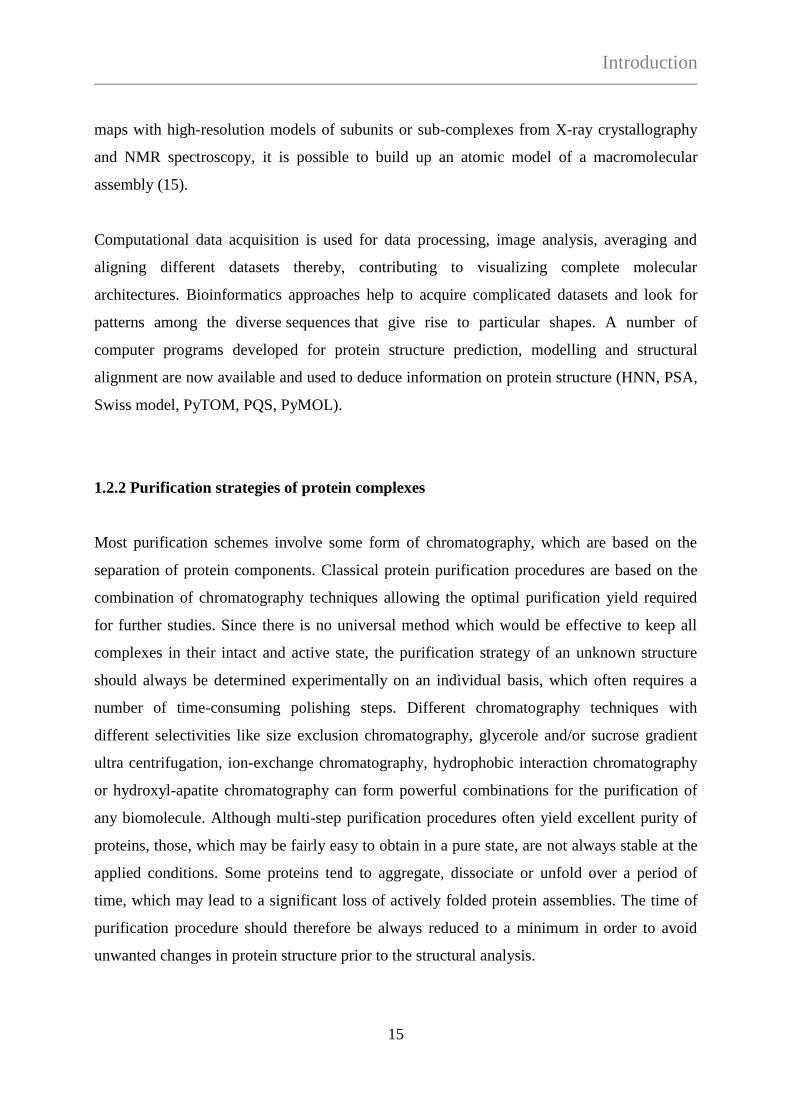
antibodies with the desired characteristics. IgG (Immunoglobuline G) is an isotype of
immunoglobulines that is found most abundantly in the circulation. IgGs are 150 kDa
molecules consisting of two identical heavy chains and two identical light chains, forming a
fork-like structure. They are secreted by the plasma B cells into the circulation. The effective
display formats for antibodies are scFvs (single chain variable fragment) (25, 66, 67), Fab
fragments (fragment antigen binding) (26, 27, 34, 68), dsFvs (disulfide-stabilized variable
fragment) (28, 29, 69) and diabody fragments (70, 71). The common feature of these
fragments is that they all contain the epitope recognizing variable region of IgGs in different
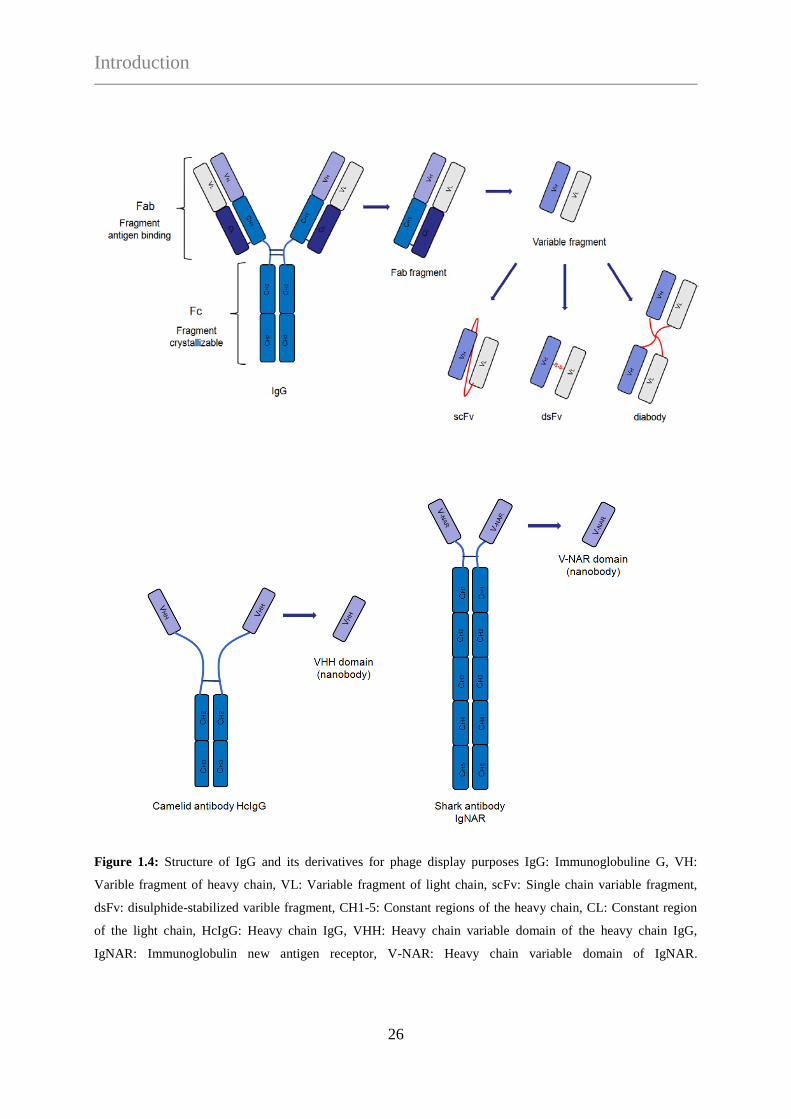
formats (Figure 1.4).
Fab-displaying libraries essentially comprise both heavy and light chain constituent of the
whole Fab fragment. To display Fab fragments on phage, one of the chains is fused to pIII,
and the partner chain is expressed un-fused. The two chains are separately secreted into the
periplasmic space, where they associate to form an intact 50 kDa Fab fragment. ScFv libraries
encode only for the variable region of IgGs and are thus, the truncated versions of Fab,
lacking its non-variable regions. The variable fragments of the heavy and light chains are
connected via a linker peptide, which stabilizes the formation of scFv. The smaller size of the
scFv format makes these libraries genetically more stable than Fab libraries. Another form of
antibody libraries is the dsFv-displaying library, in which an intermolecular disulphide bond
stabilizes the variable fragments, engineered between structurally conserved framework
positions of the two chains (28, 29, 69). Antibody libraries may also be constructed for
displaying diabodies, which are the dimerized versions of scFvs (70, 71). Diabodies can be
designed for bivalent or bispecific interactions from a bicistronic cassette containing two VH-
VL fusion products (72). By reducing the length of the linker peptide of scFvs, the pairing
between the two domains on the similar chain will be hindered, thus, they are forced to pair
with the complementary domains of another chain. One of the two VH-VL fusion products is
fused to the phage coat protein by which the diabodies can be incorporated into the capsid and
displayed (71).
While most of the known IgGs consist of two identical heavy and two identical light chains,
the serum of Camelidae contains also a considerable fraction of heavy chain antibodies
(HcIgG). Camelid “heavy chain” IgGs consist of two heavy chains and completely lack light
chains, although they are fully functional (73). Another characteristic feature is the lack of
Introduction
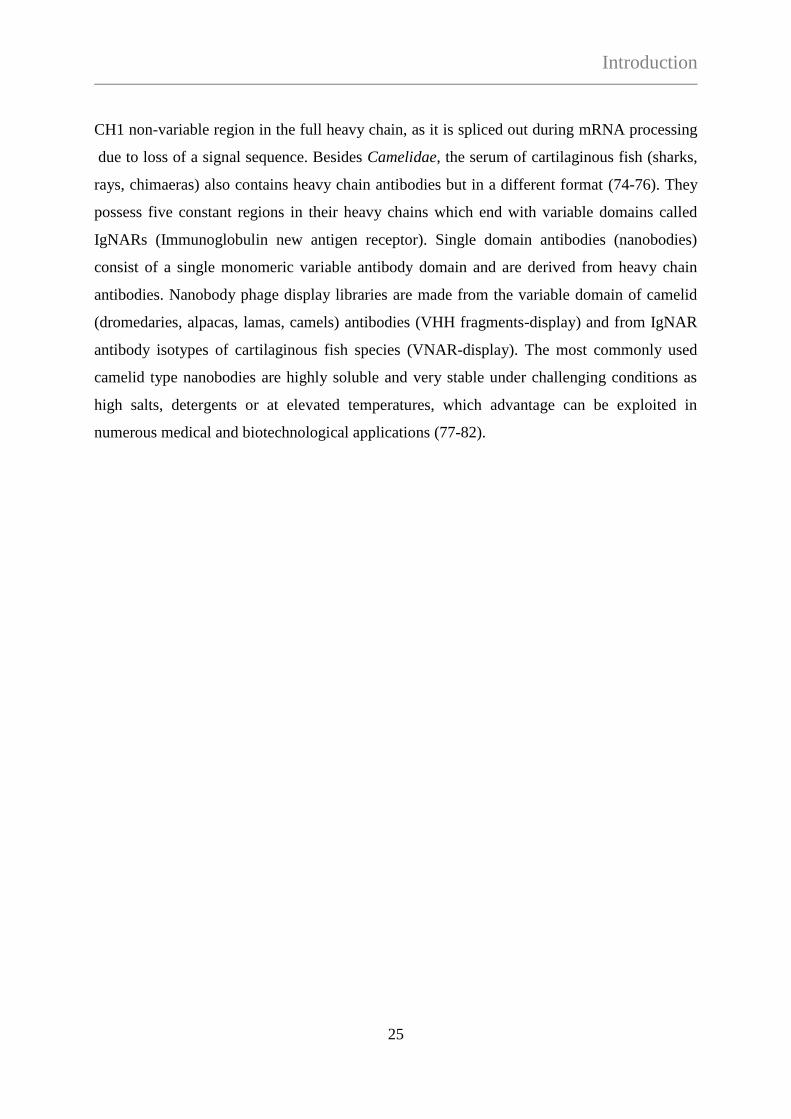
25
CH1 non-variable region in the full heavy chain, as it is spliced out during mRNA processing
due to loss of a signal sequence. Besides Camelidae, the serum of cartilaginous fish (sharks,
rays, chimaeras) also contains heavy chain antibodies but in a different format (74-76). They
possess five constant regions in their heavy chains which end with variable domains called
IgNARs (Immunoglobulin new antigen receptor). Single domain antibodies (nanobodies)
consist of a single monomeric variable antibody domain and are derived from heavy chain
antibodies. Nanobody phage display libraries are made from the variable domain of camelid
(dromedaries, alpacas, lamas, camels) antibodies (VHH fragments-display) and from IgNAR
antibody isotypes of cartilaginous fish species (VNAR-display). The most commonly used
camelid type nanobodies are highly soluble and very stable under challenging conditions as
high salts, detergents or at elevated temperatures, which advantage can be exploited in
numerous medical and biotechnological applications (77-82).
Introduction
26
Figure 1.4: Structure of IgG and its derivatives for phage display purposes IgG: Immunoglobuline G, VH:
Varible fragment of heavy chain, VL: Variable fragment of light chain, scFv: Single chain variable fragment,
dsFv: disulphide-stabilized varible fragment, CH1-5: Constant regions of the heavy chain, CL: Constant region
of the light chain, HcIgG: Heavy chain IgG, VHH: Heavy chain variable domain of the heavy chain IgG,
IgNAR: Immunoglobulin new antigen receptor, V-NAR: Heavy chain variable domain of IgNAR.

Aim of the study
27
2. AIM OF THE STUDY
In this study we aimed the isolation of native protein complexes from the cytosolic extract of
T. acidophilum using an antibody library, thereby providing homogenous samples for EM-
based structural studies. For this purpose we adapted the mono-antigen targeted phage display
technology to a multi-antigen targeted version and generated a combinatorial scFv-library
against the high molecular weight fraction of T. acidophilum which contained more than 300
proteins as subunits of protein complexes over the size of 300 kDa. Since protein complexes
are sensitive to harsh purification conditions, our goal was to develop an antibody-based mild
and fast protein isolation technique, which can keep the molecular assemblies in their intact
and active form for subsequent structural and biochemical analyses. The project involved the
implementation of sophisticated selection and screening assays that aided the identification of
positive binders from a huge antibody repertoire against low abundant complexes, analogue to
finding needles in a haystack with “magnetic” needles found in another haystack.
Materials and methods
28
3. MATERIALS AND METHODS
3.1 Applied materials
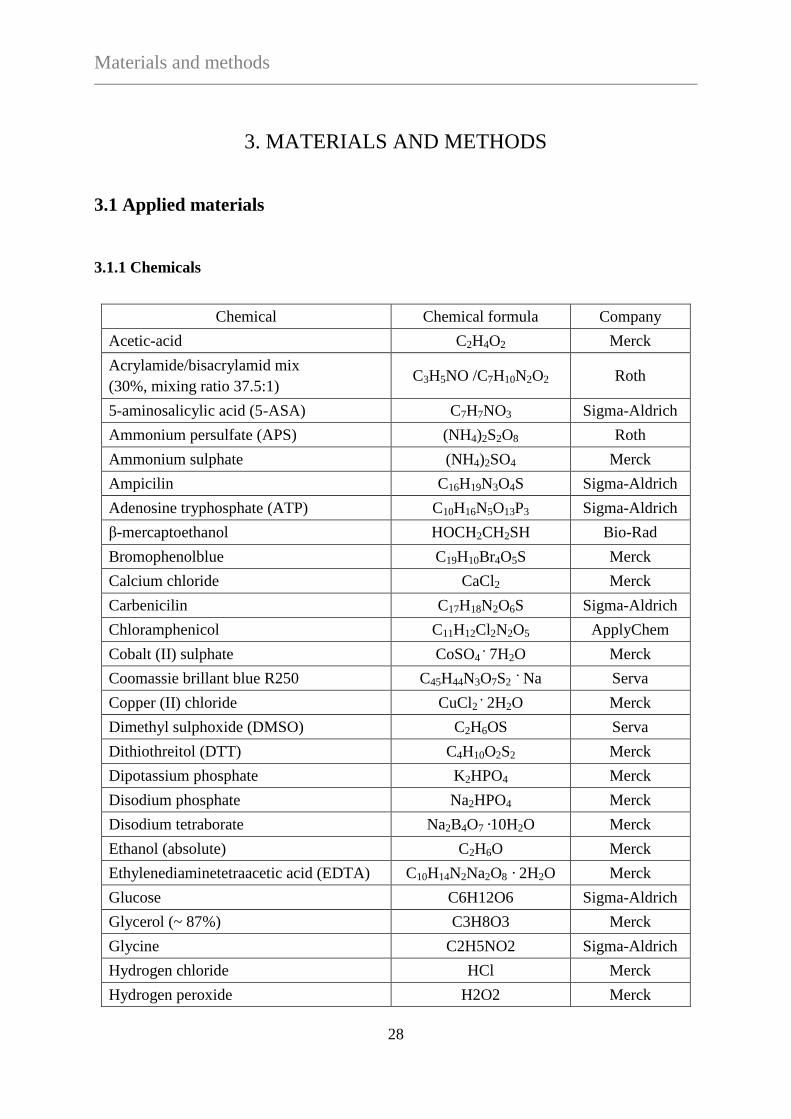
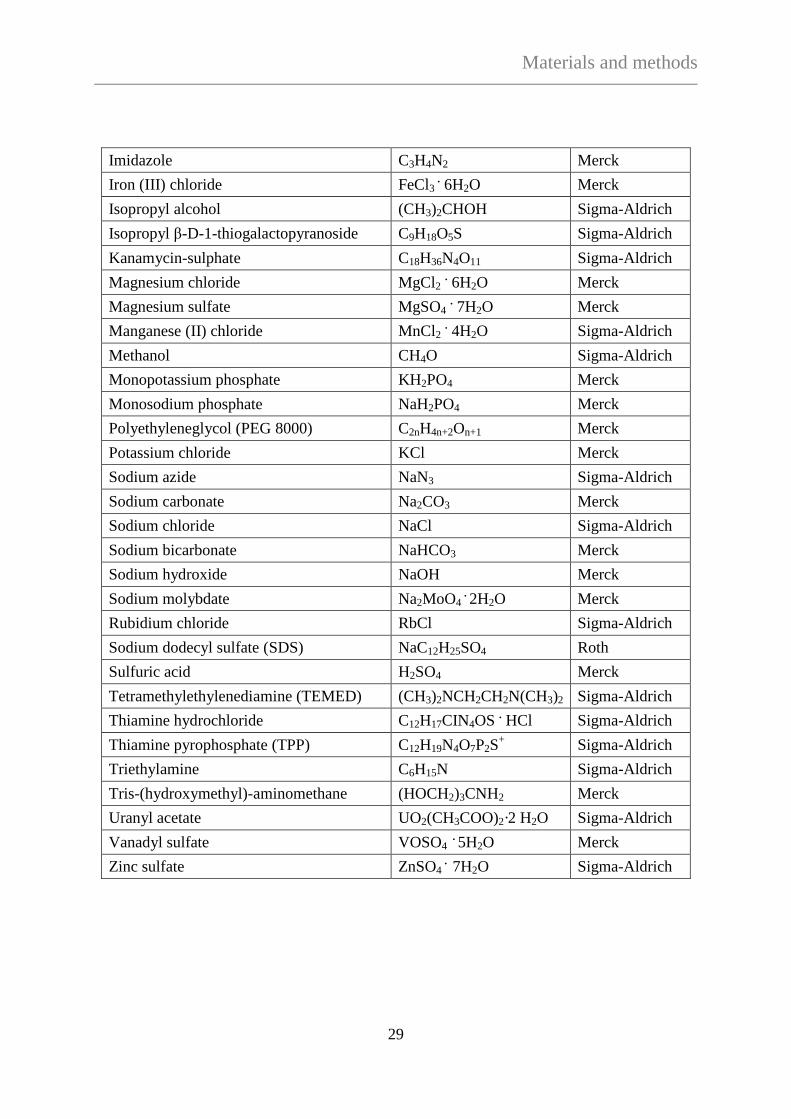
3.1.1 Chemicals
Chemical Chemical formula Company
Acetic-acid C2H4O2 Merck
Acrylamide/bisacrylamid mix
(30%, mixing ratio 37.5:1) C3H5NO /C7H10N2O2 Roth
5-aminosalicylic acid (5-ASA) C7H7NO3 Sigma-Aldrich
Ammonium persulfate (APS) (NH4)2S2O8 Roth
Ammonium sulphate (NH4)2SO4 Merck
Ampicilin C16H19N3O4S Sigma-Aldrich
Adenosine tryphosphate (ATP) C10H16N5O13P3 Sigma-Aldrich
β-mercaptoethanol HOCH2CH2SH Bio-Rad
Bromophenolblue C19H10Br4O5S Merck
Calcium chloride CaCl2 Merck
Carbenicilin C17H18N2O6S
Sigma-Aldrich
Chloramphenicol C11H12Cl2N2O5
ApplyChem
Cobalt (II) sulphate CoSO4 . 7H2O Merck
Coomassie brillant blue R250 C45H44N3O7S2 . Na Serva
Copper (II) chloride CuCl2 . 2H2O Merck
Dimethyl sulphoxide (DMSO) C2H6OS Serva
Dithiothreitol (DTT) C4H10O2S2 Merck
Dipotassium phosphate K2HPO4 Merck
Disodium phosphate Na2HPO4 Merck
Disodium tetraborate Na2B4O7 ·10H2O Merck
Ethanol (absolute) C2H6O Merck
Ethylenediaminetetraacetic acid (EDTA) C10H14N2Na2O8 · 2H2O Merck
Glucose C6H12O6 Sigma-Aldrich
Glycerol (~ 87%) C3H8O3 Merck
Glycine C2H5NO2 Sigma-Aldrich
Hydrogen chloride HCl Merck
Hydrogen peroxide H2O2 Merck
Materials and methods
29
Imidazole C3H4N2 Merck
Iron (III) chloride FeCl3 . 6H2O Merck
Isopropyl alcohol (CH3)2CHOH Sigma-Aldrich
Isopropyl β-D-1-thiogalactopyranoside C9H18O5S Sigma-Aldrich
Kanamycin-sulphate C18H36N4O11 Sigma-Aldrich
Magnesium chloride MgCl2 . 6H2O Merck
Magnesium sulfate MgSO4 . 7H2O Merck
Manganese (II) chloride MnCl2 . 4H2O Sigma-Aldrich
Methanol CH4O Sigma-Aldrich
Monopotassium phosphate KH2PO4 Merck
Monosodium phosphate NaH2PO4 Merck
Polyethyleneglycol (PEG 8000) C2nH4n+2On+1 Merck
Potassium chloride KCl Merck
Sodium azide NaN3 Sigma-Aldrich
Sodium carbonate Na2CO3 Merck
Sodium chloride NaCl Sigma-Aldrich
Sodium bicarbonate NaHCO3 Merck
Sodium hydroxide NaOH Merck
Sodium molybdate Na2MoO4 . 2H2O Merck
Rubidium chloride RbCl Sigma-Aldrich
Sodium dodecyl sulfate (SDS) NaC12H25SO4 Roth
Sulfuric acid H2SO4 Merck
Tetramethylethylenediamine (TEMED) (CH3)2NCH2CH2N(CH3)2 Sigma-Aldrich
Thiamine hydrochloride C12H17CIN4OS . HCl Sigma-Aldrich
Thiamine pyrophosphate (TPP) C12H19N4O7P2S+
Sigma-Aldrich
Triethylamine C6H15N Sigma-Aldrich
Tris-(hydroxymethyl)-aminomethane (HOCH2)3CNH2 Merck
Uranyl acetate UO2(CH3COO)2·2 H2O Sigma-Aldrich
Vanadyl sulfate VOSO4 . 5H2O Merck
Zinc sulfate ZnSO4 .
7H2O Sigma-Aldrich
Materials and methods
30
Other ingredients:
Agarose A9539 Sigma-Aldrich
Bacto Agar 214030 BD
Bacto Tryptone 211705 BD
Bacto Yeast extract 210934 BD
Skim milk powder 70166 Sigma-Aldrich
Tween20TM
170-6531
Bio Rad
3.1.2 Kits
EzWayTM
PAG Protein Elution Kit K33010 Koma Biotech
Pure Yield Plasmid Miniprep System A1222 Promega
Pierce® Co-immunoprecipitation Kit 26149 Thermo Scientific
QIAprep Spin Miniprep Kit 27104 Qiagen
QIAquick Gel Extraction Kit 28704 Qiagen
QIAquick PCR purification Kit 28104 Qiagen
QuikChange® Site-Directed Mutagenesis Kit 200518 Agilent Technologies
Rapid DNA ligation Kit K1422 Fermentas
Ready-To-Go RT-PCR beads 27-9266-01 GE Healthcare
RNeasy Midi Kit 75144 Qiagen
Wizard®
SV Gel and PCR Clean-up system A9281 Promega
3.1.3 Standards
GeneRulerTM
1 kb DNA Ladder (250-10000 kb) SM0311 Fermentas
HMW Native Marker Kit (66-669 kDa) 17044501 GE Helthcare
PageRulerTM
Prestained Protein Ladder (10-250 kDa) SM0671 Fermentas
Prestained Protein Molecular Weight Marker (20-120 kDa) SM0441 Fermentas
Materials and methods
31
3.1.4 Dyes and staining solutions
DNA loading dye R0611 Fermentas
GelRedTM
DNA dye 41001 Biotium
Instant Blue protein dye 07-300-150 Fisher Scientific
6 x SDS protein sample buffer: 375 mM Tris-Cl, pH 6.8
6 % (w/v) SDS
48 % (v/v) glycerol
9 % (v/v) β-mercaptoethanol
0.03 % (w/v) bromophenol blue
3.1.5 Antibodies
Goat anti-rabbit IgG-AP conjugate sc-2034 Santa Cruz Biotechnology
His-probe (6-18) rabbit polyclonal IgG sc-803 Santa Cruz Biotechnology
Mouse anti-M13KO7-HRP conjugate 45-001-419 Amersham Pharmacia Biotech
Goat anti-mouse IgG-AP conjugate sc-2047 Santa Cruz Biotechnology
Rabbit anti-E-tag monoclonal antibody A190-133P Bethyl Laboratories
3.1.6 Bacterial strains
E. coli BL21(DE3) C6000-03 Invitrogene
E. coli HB2151 27-9401-01 Amersham Biosciences
E. coli Rosetta 2 (DE3) 71400-4 Merck Chemicals Ltd
E. coli TG1 27-9401-01 Amersham Biosciences
E. coli TOP10 C4040-10 Invitrogen
E. coli Tuner (DE3) pLysS Biochemistry core facility of MPI
E. coli XL10 Gold 200-314 Agilent technologies
Thermoplasma acidophilum DSM 1728
Materials and methods
32
3.1.7 Enzymes
Restriction enzymes:
Ecl136II ER0251 5’...GAG↓CTC...3’ Fermentas
3’...CTC↑GAG...5’
Fast Digest NcoI FD0573 5’...C↓CATGG...3’ Fermentas
3’...GGTAC↑C...5’
Fast Digest NotI FD0593 5’...GC↓GGCCGC...3’ Fermentas
3’...CGCCGG↑CG...5’
Fast Diges SfiI FD1824 5’...GGCC↓CAGCCGGCC...3’ Fermentas
3’...CCGGGTCGG↑CCGG...5’
Fast Digest XhoI FD0694 5’...C↓TCGAG...3’ Fermentas
3’...GAGCT↑C...5’
Fast Digest NdeI FD0584 5’...CA↓TATG...3’ Fermentas
3’...GTAT↑AC...5’
NotI R0189M 5’...GC↓GGCCGC...3’ New England Biolabs
3’...CGCCGG↑CG...5’
SfiI R0123L 5’...GGCC↓CAGCCGGCC...3’ New England Biolabs
3’...CCGGGTCGG↑CCGG...5’
SphI-HF R3182S 5’...GCATG↓C...3’ New England Biolabs
3’...C↑GTACG...5’
Other enzymes:
Bensonase® Nuclease E1014 Sigma-Aldrich
DNase I from bovine pancreas 10104159001 Roche
Lysozyme from chicken egg white L7651 Sigma-Aldrich
Pfu DNA polymerase EP0571 Fermentas
T4 Ligase M0202L New England Biolabs

Materials and methods
33
3.1.8 Plasmids and phagemids
M13KO7 Helper phage N0315S New England Biolabs
pCANTAB 5E 27-9401-01 Amersham Biosciences
pET28a 69864-3 Novagen
3.1.9 Primers
The applied primers were HPLC-purified and synthesized by Metabion GmbH.
Primer
No. Primer name Primer sequence
1 pET28SphI for pET28(SfiI) construct CCGCAAGGAATGGTGCATGCAAGGA
GATGG
2 pET28SfiI for pET28(SfiI) construct GGTACGATGGCCGGCTGGGCCATGGT
ATATCTCCTTCTTAAAGTTAAA
3 pET28NotI for pET28(SfiI) construct CTCCGTCGACAAGCTTGCGGCCGCAC
TCGAG
4 T7 promoter sequencing primer TAATACGACTCACTATAGGG
5 T7 terminator sequencing primer GCTAGTTATTGCTCAGCGG
6 pCANTAB 5E sequencing primer 1 GGAATTGTGAGCGGATAACAAT
7 pCANTAB 5E sequencing primer 2 CCAGTACAAACCACCAACGCCTGT
3.1.10 Media
Unless otherwise stated additives were added to medium after autoclaving and after medium
has cooled to 50-60°C. Heat-sensitive additives were sterilized through 0.22 μm pore size
sterile filters.

Materials and methods
34
Liquid media:
T. acidophilum medium: Solution A: 0.1 ml CoSO4 * 7H2O (1 w%)
0.5 ml CuCl2 * 2H2O (1 w%)
1.93 g FeCl3 * 6H2O
0.18 g MnCl2 * 4H2O
0.45 g Na2B4O7 * 10H2O
0.3 ml Na2MoO4 * 2H2O (1% (w/w))
0.38 ml VOSO4 * 5H2O (1% (w/w))
2.2 ml ZnSO4 * 7H2O (1% (w/w))
Adjusted to 1000 ml with ddH2O
Autoclaved at 121°C for 20 min
Solution B: 0.74 g CaCl2 * 2H2O
3.72 g KH2PO4
2.47 g MgSO4 * 7H2O
13.2 g (NH4)2SO4
Adjusted to 1000 ml with ddH2O
Autoclaved at 120°C for 20 min
The final medium contained: 10 ml Solution A
100 ml Solution B
20 ml yeast extract (10% (w/v), autoclaved)
2 ml ccH2SO4 (98%)
50 ml glucose (20% (w/v), filter sterilized)
Adjusted to 1000 ml with autoclaved ddH2O
Materials and methods
35
LB-medium: 10 g Bacto tryptone
5 g Yeast extract
10 g NaCl
Dissolved in 1000 ml ddH2O
Autoclaved at 121°C for 20 min
LB-Amp: LB-medium containing 100 μg/ml ampicillin
LB-Kan: LB-medium containing 50 μg/ml kanamycin
2 x YT-medium: 16 g Tryptone
10 g Yeast extract
5 g NaCl
Dissolved in 1000 ml ddH2O
Autoclaved at 121°C for 20 min
YTCbG: 2 x YT containing 2% (w/v) glucose and 100 μg/ml carbenicillin
YTCbK: 2 x YT containing 100 μg/ml carbenicillin and 50 μg/ml kanamycin
YTCbN: 2 x YT containing 100 μg/ml carbenicillin and 100 μg/ml nalidixic acid
Solid media:
Bacto-agar (1.5 % (w/v) was added to media prior to autoclave as solidifying agent. Additives
and antibiotics were added to the agar-medium after cooling to 50-60°C and immediately
poured into Petri dishes.
Solid LB-agar media: LB-Kan
LB-Amp
Materials and methods
36
Solid YT-media: YTCbG
YTCbN
Minimal medium for E. coli TG1 and HB2151: Prepared from the following solutions:
1M MgCl2.6H2O: 20.33 g MgCl2
.6H2O dissolved in 100 ml H2OMilliQ then
autoclaved
1M CaCl2.2H2O: 14.7 g CaCl2
.2H2O dissolved in 100 ml H2OMilliQ then
autoclaved
20% (w/v) glucose: 20 g of glucose dissolved in 100 ml H2OMilliQ then filter
sterilized
1M thiamine hydrochloride: 33.73 g thiamine hydrochloride dissolved in 100 ml
H2OMilliQ then sterilized by filtration.
Agar-solution: 15 g Bacto-agar dissolved in 500 ml H2OMilliQ then
autoclaved
Buffer solution: 20 g Na2HPO4
3 g KH2PO4
1g NH4Cl
Dissolve in 500 ml 100 ml H2OMilliQ and adjust pH to 7.4
with NaOH
Autoclaved at 121°C for 20 min
The buffer and agar solutions were combined after t cooling (50-60 °C) and supplemented
with 1 ml of 1M MgCl2 . 6H2O, 1 ml of 1M CaCl2
. 2H2O, 1 ml of thiamine hydrochloride and
5 ml of 20% (w/v) glucose. The medium was mixed well and poured into plates.
Materials and methods
37
3.1.11 Buffers and stock solutions
The applied buffers and stock solutions were prepared with H2OMilliQ , autoclaved or filter
sterilized by using Millex®-GS syringe filter (0.22 μm). The clarification and degassing of
chromatography buffers was carried out by a Nalgene reusable filter system using Pall
membrane filters (0.45 μm or 0.22 μm).
10 x PBS: 80 g NaCl
2g KCl
14.4g Na2HPO4
2.4g KH2PO4
Dissolved in 1000 ml H2OMilliQ and pH was adjusted to 7.4 with NaOH
Autoclaved at 121°C for 20 min
1 x PBST: 100 ml 10 x PBS
0.5 ml Tween 20
Diluted to1000 ml with H2OMilliQ
2 % MPBS: 20 g skim milk powder dissolved in 1000 ml 1 x PBS
Always freshly prepared
3 % MPBS: 30 g skim milk powder dissolved in 1000 ml 1 x PBS
Always freshly prepared
Materials and methods
38
MPBST: 3 g skim milk powder diluted in 1000 ml 1 x PBST
Always freshly prepared
1M Tris-Cl, pH 7.5: 121.1 g Tris base adjusted to 1000 ml with H2OMilliQ
pH was adjusted with HCl to 7.5
Autoclaved at 121°C for 20 min
10 x TBS: 1.5 M NaCl
200 mM Tris-Cl pH 7.5
Autoclaved at 121°C for 20 min
1 x TBST: 1 x TBS containing 0.05% Tween 20
MTBS: 1 x TBS containing 3% (w/v) Skim milk powder
Always freshly prepared
4 x separating gel buffer: 1.5 M Tris-Cl, pH 8.8
0.4 % (w/v) SDS
Filter sterilized and stored at 4°C
4 x stacking gel buffer: 0.5 M Tris-Cl, pH 6.8
0.4% (w/v) SDS
Filter sterilized and stored at 4°C
Materials and methods
39
10 x Tris-Glycine buffer: 30.3 g Tris base
144 g Glycine
Adjusted to 1000 ml with H2OMilliQ and filtered
Native running buffer: 1 x Tris-Glycine buffer
SDS running buffer: 1 x Tris-Gycine buffer containing 0.1 % SDS
(Laemmli buffer)
Transfer buffer: 1 x Tris-Glycine buffer containing 10% (v/v) methanol and
0.05% (w/v) SDS
10 x Coupling buffer: 0.08 M Na2HPO4
(Modified PBS) 0.02 M KH2PO4
1.4 M NaCl
0.1 M KCl
pH adjusted to 7.4
Autoclaved at 121°C for 20 min
IMAC-buffers for His-tagged scFv purification:
Ni-NTA-equilibration buffer: 1 x Coupling buffer supplemented with 10 mM imidazole
Ni-NTA-wash buffer: 1 x Coupling buffer supplemented with 20 mM imidazole
Ni-NTA-elution buffer: 1 x Coupling buffer supplemented with 250 mM imidazole
-pH adjusted to 7.4 with NaOH
Materials and methods
40
IMAC-buffers for purifying recombinant proteins of T. acidophilum:
Ni-NTA-equilibration buffer: 50 mM NaH2PO4, 300 mM NaCl, 10 mM imidazole
Ni-NTA-wash buffer: 50 mM NaH2PO4, 300 mM NaCl, 20 mM imidazole
Ni-NTA-elution buffer: 50 mM NaH2PO4, 300 mM NaCl, 250 mM imidazole
-pH adjusted to 8.0 with NaOH
RTBF I solution: 30 mM KOAc (potassium acetate)
100 mM RbCl
10 mM CaCl2
50 mM MnCl2
15% glycerol
pH adjusted to 5.8 with acetic acid
Sterilized with 0.2 μm filter
RTBF II solution: 10 mM MOPS
75 mM CaCl2
10 mM RbCl
15% glycerol
pH adjusted to 6.5 with KOH
Sterilized with 0.2 μm filter
50 x TAE-buffer: 242 g Tris base
57.1 ml glacial acetic acid
100 ml 0.5 M EDTA
Dilute to 1000 ml with H2OMilliQ and adjust pH to 8.0
Materials and methods
41
1 x TES-buffer: 0.2 M Tris-Cl, pH 8.0
0.5 mM EDTA
0.5 M sucrose
Sterilized with 0.2 μm filter
3.1.12 Antibiotic stock solutions
100 mg/ml ampicillin: 1 g dissolved in 10 ml H2OMilliQ and filter sterilized
100 mg/ml carbenicilin: 1 g dissolved in 10 H2OMilliQ and filter sterilized
50 mg/ml kanamycin: 0.5 g dissolved in 10 ml H2OMilliQ and filter sterilized
34 mg/ml chloramphenicol: 0.34 g dissolved in 10 ml ethanol and filter sterilized
100 mg/ml nalidixic acid: 1 g dissolved in 10 ml 1M NaOH and filter sterilized
3.1.13 Chromogenic substrate solutions
SigmaFast BCIP®/NBT tablet B5655 Sigma-Aldrich
(dissolved in 10 ml H2OMilliQ)
1-Step Ultra TMB-ELISA 34028 Thermo Scientific
1-Step TMB-Blotting 34018 Thermo Scientific
One Step NBT/BCIP 34042 Thermo Scientific
3.1.14 Chromatography columns
HiTrap FF crude GE Healthcare
Superose 6 GE Healthcare
Superose 12 GE Healthcare
Hydroxyapatite (Bio-Gel HTP) Bio-Rad Laboratories

Materials and methods
42
3.1.15 Laboratory equipment
Tools:
Agarose gel chamber MPI workshop
Blotting filter papers Extra thick Western Blotting Filter
Paper, 88605, Invitrogene
Concentrator tubes (Amicon Ultra and Microcon) Millipore
Cryotubes (1.8 ml) Nunc 375418
ELISA plates (Microlon flat bottom, high binding) Greiner Bio One 655061
Immuno-tubes (MaxiSorp) 4 ml Nunc 444474
Inoculation loops (Sterile, plastic) Greiner Bio One 731165
Microcentrifuge tubes (1.5 ml, 2 ml) Safe Lock tubes, Eppendorf
Microtest Flat Bottom 96-well plates BD-Falcon, 353936
Needles Terumo
Nitrocellulose membrane (Reinforced NC) Whatman, Optitran BA-S85
PAGE chambers
2050 Midget Electrophoresis Unit,
LKB Bromma, XCell SureLock Mini-
Cell Electrophoresis System, Life
Technologies
Parafilm Bemis Flexible Packaging
Pipette tips (Sterile filter tips) Greiner Bio One
Pipettes Pipetman Classic, Gilson
Plastic Petri dishes Greiner Bio One
Sterile centrifuge tubes (50 ml and 15 ml) BD-Falcon, TPP
Sterile filter system 500 ml Filter System, 431097,
Corning
Sterile pipettes (50 ml, 25 ml, 10 ml, 5 ml) Greiner Bio One
Sterile scalpels Bayha
Syringes BD, Braun Omnifix, Norm-Ject
Western blot incubation chambers Genscript
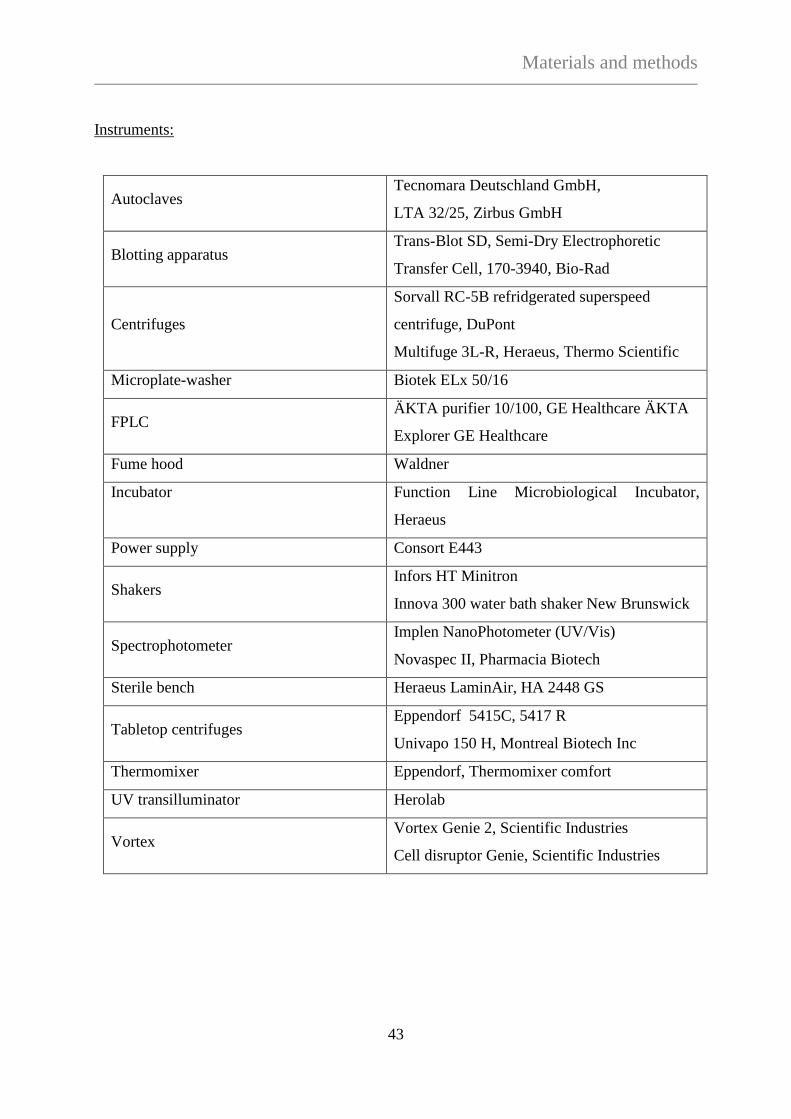
Materials and methods
43
Instruments:
Autoclaves Tecnomara Deutschland GmbH,
LTA 32/25, Zirbus GmbH
Blotting apparatus Trans-Blot SD, Semi-Dry Electrophoretic
Transfer Cell, 170-3940, Bio-Rad
Centrifuges
Sorvall RC-5B refridgerated superspeed
centrifuge, DuPont
Multifuge 3L-R, Heraeus, Thermo Scientific
Microplate-washer Biotek ELx 50/16
FPLC ÄKTA purifier 10/100, GE Healthcare ÄKTA
Explorer GE Healthcare
Fume hood Waldner
Incubator Function Line Microbiological Incubator,
Heraeus
Power supply Consort E443
Shakers Infors HT Minitron
Innova 300 water bath shaker New Brunswick
Spectrophotometer Implen NanoPhotometer (UV/Vis)
Novaspec II, Pharmacia Biotech
Sterile bench Heraeus LaminAir, HA 2448 GS
Tabletop centrifuges Eppendorf 5415C, 5417 R
Univapo 150 H, Montreal Biotech Inc
Thermomixer Eppendorf, Thermomixer comfort
UV transilluminator Herolab
Vortex Vortex Genie 2, Scientific Industries
Cell disruptor Genie, Scientific Industries
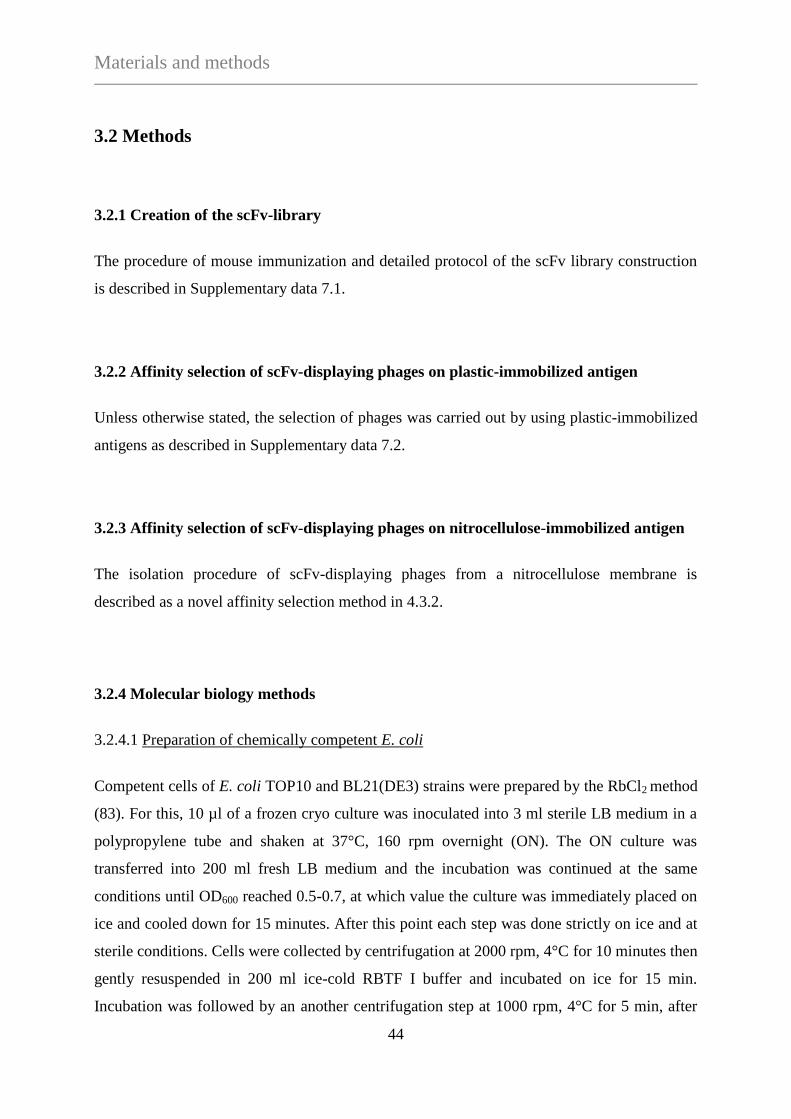
Materials and methods
44
3.2 Methods
3.2.1 Creation of the scFv-library
The procedure of mouse immunization and detailed protocol of the scFv library construction
is described in Supplementary data 7.1.
3.2.2 Affinity selection of scFv-displaying phages on plastic-immobilized antigen
Unless otherwise stated, the selection of phages was carried out by using plastic-immobilized
antigens as described in Supplementary data 7.2.
3.2.3 Affinity selection of scFv-displaying phages on nitrocellulose-immobilized antigen
The isolation procedure of scFv-displaying phages from a nitrocellulose membrane is
described as a novel affinity selection method in 4.3.2.
3.2.4 Molecular biology methods
3.2.4.1 Preparation of chemically competent E. coli
Competent cells of E. coli TOP10 and BL21(DE3) strains were prepared by the RbCl2 method
(83). For this, 10 µl of a frozen cryo culture was inoculated into 3 ml sterile LB medium in a
polypropylene tube and shaken at 37°C, 160 rpm overnight (ON). The ON culture was
transferred into 200 ml fresh LB medium and the incubation was continued at the same
conditions until OD600 reached 0.5-0.7, at which value the culture was immediately placed on
ice and cooled down for 15 minutes. After this point each step was done strictly on ice and at
sterile conditions. Cells were collected by centrifugation at 2000 rpm, 4°C for 10 minutes then
gently resuspended in 200 ml ice-cold RBTF I buffer and incubated on ice for 15 min.
Incubation was followed by an another centrifugation step at 1000 rpm, 4°C for 5 min, after
Materials and methods
45
which the supernatant was removed. Cells were carefully resuspended in 6 ml ice-cold RBTF
II buffer, and aliquots of 50, 100 and 150 µl were distributed in 1.5 ml Eppendorf tubes and
stored at -80°C.
3.2.4.2 Heat shock transformation of chemically competent E. coli
To transform E. coli strains (RbCl2-competent or “Chemically” competent cells from
Invitrogen and Agilent Technologies) with plasmid/phagemid DNA the heat shock
transformation protocol was carried out as follows. 50-100 µl competent cells were thawed on
ice for 15 minutes than mixed with 1-2 µl purified plasmid DNA or 2-10 µl ligation mixture.
Cells were incubated with the plasmid DNA on ice for 20 minutes then heated at 42°C for 30
seconds. After this the cells were placed immediately on ice for 2 minutes then mixed with
500-1000 µl sterile LB or SOC medium and gently shaken at 37°C for 45 minutes. Cells were
plated out on sterile, antibiotic-containing LB-agar media and incubated at 37°C ON.
3.2.4.3 Amplification and isolation of plasmid DNA from E. coli
For plasmid amplification a few µl of the maintained cryo stocks were spread on appropriate
agar-plates and grown at 37°C ON. Next day, a single colony was used to inoculate 3-5 ml
antibiotic-containing liquid medium and cultured at 37°C, 180 rpm ON. The purification of
plasmid DNA from E. coli was implemented with the help of two alternative plasmid isolation
kits (QIAprep Spin Miniprep Kit or Pure Yield Plasmid Miniprep System Kit) according to
the manufacturer’s protocol. The concentration of purified plasmid DNA was measured and
appropriate amounts were used for sequence analysis, PCR-reaction, transformation of E. coli
or cloning procedures. The remaining plasmid DNA was stored at -20°C
3.2.4.4 Agarose gel electrophoresis
The quality of DNA samples were assayed with agarose gel electrophoresis using a horizontal
gel electrophoresis apparatus. 1% or 1.5% agarose gels were prepared in 1 x TAE-buffer and
poured into the gel chamber. After solidification the gel was covered with 1 x TAE-running
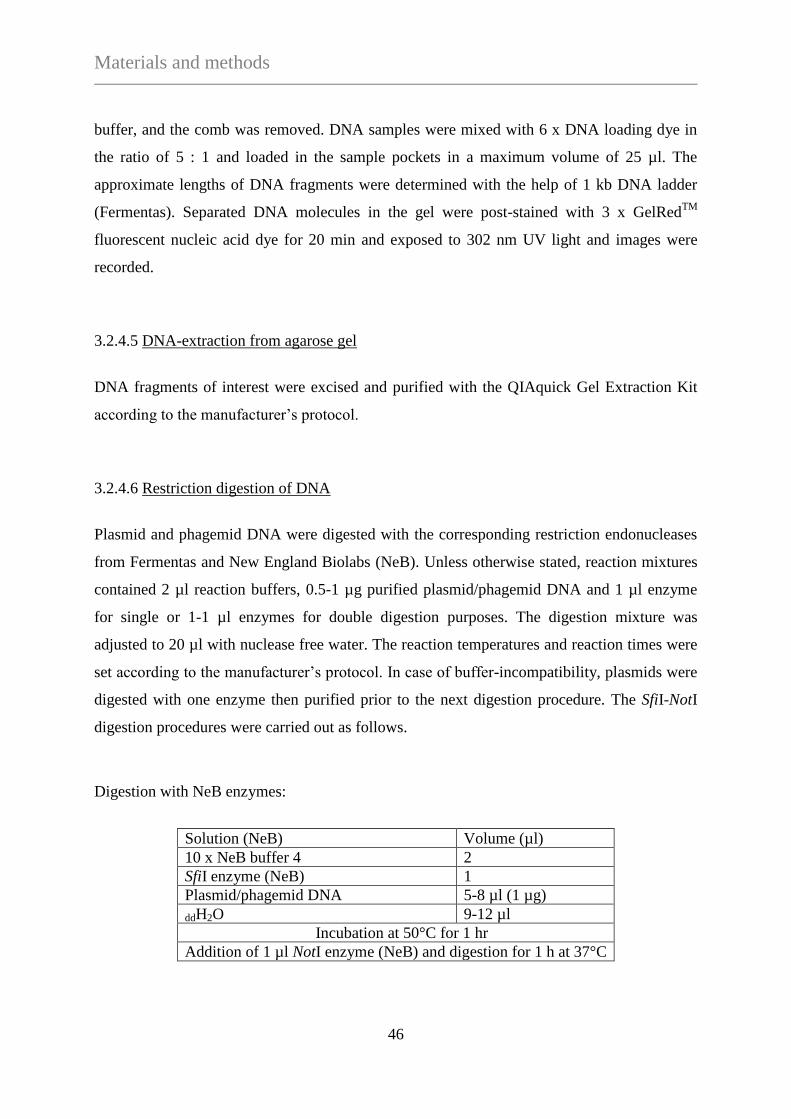
Materials and methods
46
buffer, and the comb was removed. DNA samples were mixed with 6 x DNA loading dye in
the ratio of 5 : 1 and loaded in the sample pockets in a maximum volume of 25 µl. The
approximate lengths of DNA fragments were determined with the help of 1 kb DNA ladder
(Fermentas). Separated DNA molecules in the gel were post-stained with 3 x GelRedTM
fluorescent nucleic acid dye for 20 min and exposed to 302 nm UV light and images were
recorded.
3.2.4.5 DNA-extraction from agarose gel
DNA fragments of interest were excised and purified with the QIAquick Gel Extraction Kit
according to the manufacturer’s protocol.
3.2.4.6 Restriction digestion of DNA
Plasmid and phagemid DNA were digested with the corresponding restriction endonucleases
from Fermentas and New England Biolabs (NeB). Unless otherwise stated, reaction mixtures
contained 2 µl reaction buffers, 0.5-1 µg purified plasmid/phagemid DNA and 1 µl enzyme
for single or 1-1 µl enzymes for double digestion purposes. The digestion mixture was
adjusted to 20 µl with nuclease free water. The reaction temperatures and reaction times were
set according to the manufacturer’s protocol. In case of buffer-incompatibility, plasmids were
digested with one enzyme then purified prior to the next digestion procedure. The SfiI-NotI
digestion procedures were carried out as follows.
Digestion with NeB enzymes:
Solution (NeB) Volume (µl)
10 x NeB buffer 4 2
SfiI enzyme (NeB) 1
Plasmid/phagemid DNA 5-8 µl (1 µg)
ddH2O 9-12 µl
Incubation at 50°C for 1 hr
Addition of 1 µl NotI enzyme (NeB) and digestion for 1 h at 37°C
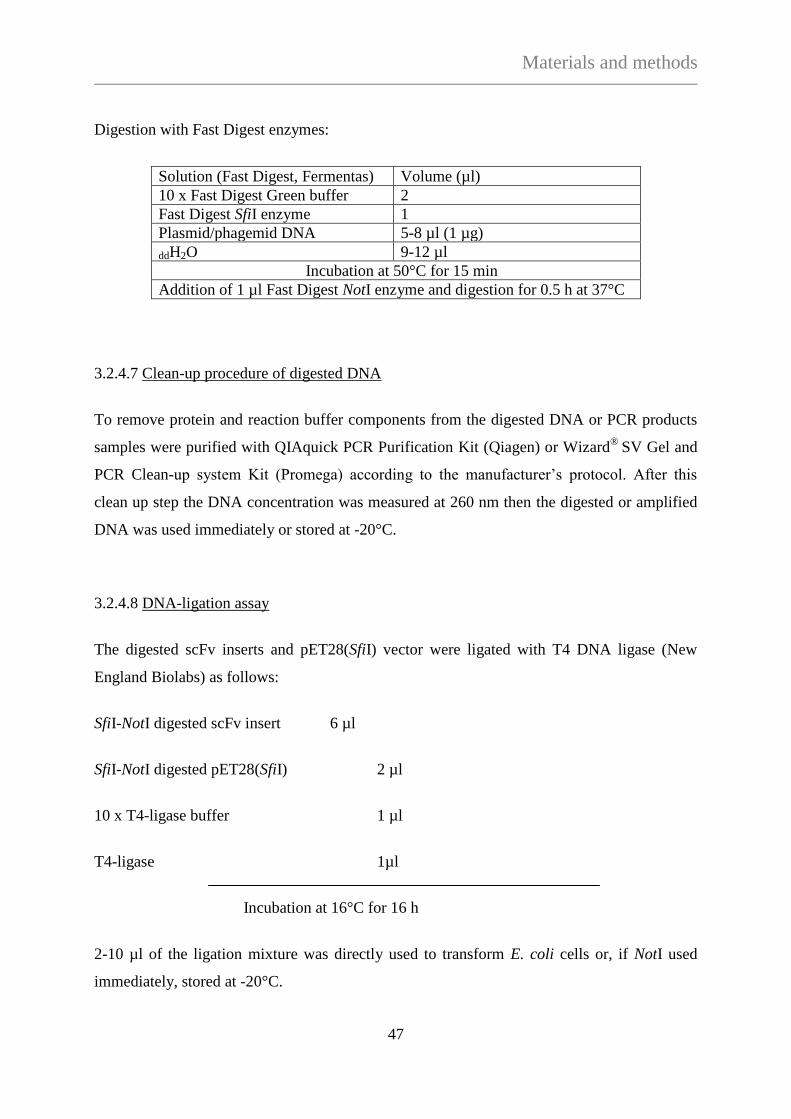
Materials and methods
47
Digestion with Fast Digest enzymes:
Solution (Fast Digest, Fermentas) Volume (µl)
10 x Fast Digest Green buffer 2
Fast Digest SfiI enzyme 1
Plasmid/phagemid DNA 5-8 µl (1 µg)
ddH2O 9-12 µl
Incubation at 50°C for 15 min
Addition of 1 µl Fast Digest NotI enzyme and digestion for 0.5 h at 37°C
3.2.4.7 Clean-up procedure of digested DNA
To remove protein and reaction buffer components from the digested DNA or PCR products
samples were purified with QIAquick PCR Purification Kit (Qiagen) or Wizard®
SV Gel and
PCR Clean-up system Kit (Promega) according to the manufacturer’s protocol. After this
clean up step the DNA concentration was measured at 260 nm then the digested or amplified
DNA was used immediately or stored at -20°C.
3.2.4.8 DNA-ligation assay
The digested scFv inserts and pET28(SfiI) vector were ligated with T4 DNA ligase (New
England Biolabs) as follows:
SfiI-NotI digested scFv insert 6 µl
SfiI-NotI digested pET28(SfiI) 2 µl
10 x T4-ligase buffer 1 µl
T4-ligase 1µl
Incubation at 16°C for 16 h
2-10 µl of the ligation mixture was directly used to transform E. coli cells or, if NotI used
immediately, stored at -20°C.
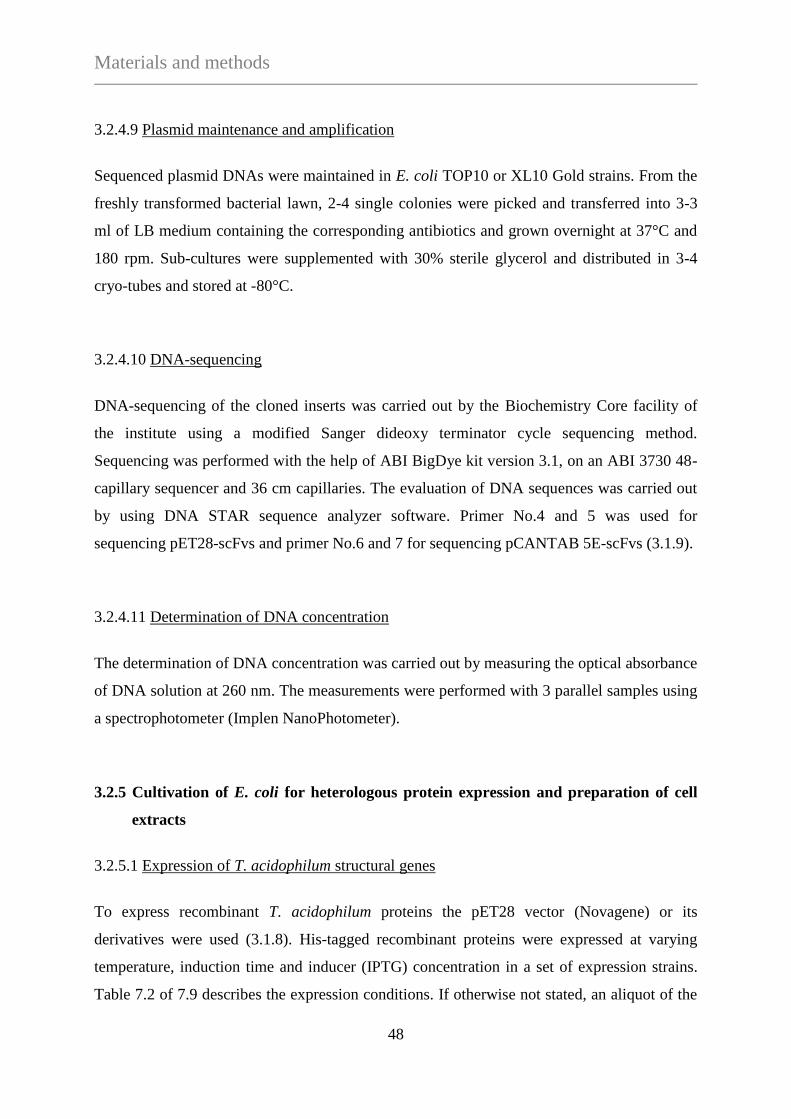
Materials and methods
48
3.2.4.9 Plasmid maintenance and amplification
Sequenced plasmid DNAs were maintained in E. coli TOP10 or XL10 Gold strains. From the
freshly transformed bacterial lawn, 2-4 single colonies were picked and transferred into 3-3
ml of LB medium containing the corresponding antibiotics and grown overnight at 37°C and
180 rpm. Sub-cultures were supplemented with 30% sterile glycerol and distributed in 3-4
cryo-tubes and stored at -80°C.
3.2.4.10 DNA-sequencing
DNA-sequencing of the cloned inserts was carried out by the Biochemistry Core facility of
the institute using a modified Sanger dideoxy terminator cycle sequencing method.
Sequencing was performed with the help of ABI BigDye kit version 3.1, on an ABI 3730 48-
capillary sequencer and 36 cm capillaries. The evaluation of DNA sequences was carried out
by using DNA STAR sequence analyzer software. Primer No.4 and 5 was used for
sequencing pET28-scFvs and primer No.6 and 7 for sequencing pCANTAB 5E-scFvs (3.1.9).
3.2.4.11 Determination of DNA concentration
The determination of DNA concentration was carried out by measuring the optical absorbance
of DNA solution at 260 nm. The measurements were performed with 3 parallel samples using
a spectrophotometer (Implen NanoPhotometer).
3.2.5 Cultivation of E. coli for heterologous protein expression and preparation of cell
extracts
3.2.5.1 Expression of T. acidophilum structural genes
To express recombinant T. acidophilum proteins the pET28 vector (Novagene) or its
derivatives were used (3.1.8). His-tagged recombinant proteins were expressed at varying
temperature, induction time and inducer (IPTG) concentration in a set of expression strains.
Table 7.2 of 7.9 describes the expression conditions. If otherwise not stated, an aliquot of the
Materials and methods
49
bacterial cryo stock was inoculated into 3-100 ml of antibiotic(s)-containing medium and
grown ON at 37°C. Bacteria were then transferred into fresh LB-medium and further
incubated at 37 °C in the presence of the appropriate antibiotic(s). In the exponential growth
phase (OD600=0.8), protein expression was induced by adding IPTG to the cell culture.
Expressions, using the Novagen autoinduction medium were carried out according to the
manufacturer’s protocol. Small-scale expressions were carried out in 10 ml LB-medium while
the large-scale expression of proteins was performed in 2-10 L medium with proper aeration,
applying the best expression conditions. After the required induction time bacteria were
collected by centrifugation at 4°C, 4000 x g for 20 minutes. The pellet was resuspended in
ddH2O and centrifuged again for 20 minutes after which the supernatant was discarded and the
pellet was stored at -80°C.
3.2.5.2 Expression of mouse scFvs
The cloning of scFvs in pCANTAB 5E and their expression on phage in E. coli TG1 was
performed as described in 7.1.2 and 7.2, respectively. The expression of soluble, E-tagged
scFvs was carried out in the amber suppressor E. coli HB2151 strain similarly to His-tagged
proteins (3.2.5.1). Alternatively, scFvs were cloned into a modified pET28 vector and
expressed as C-terminally His-tagged proteins in small and large scale, as described (3.2.5.1).
Detailed description of applied recombinant strains with the necessary information is listed in
supplementary data (7.8).
3.2.5.3 Whole cell extract preparation
10-15 g frozen biomass was thawed on ice then resuspended in 20 ml ddH2O containing 1/2
tablet of EDTA-free protease inhibitor cocktail (Roche). The cell suspension was
supplemented with 1 mg/ml lysozyme and with the appropriate volume of 10 x buffer (IMAC
or Coupling buffer, 3.1.11) to obtain 1x buffer concentration and incubated on ice for 1 h. To
decrease the viscosity of the lysate 50 μg/ml DNAse (Sigma-Aldrich) or 2-3 μl of Bensonase®
was added. For proper cell wall degradation the lysate was sonicated on ice 5-8 times for 1
minute (duty cycle: 30 %, output control: 6-8, Sonifier 250, Branson). Crude cell extract was
Materials and methods
50
centrifuged at 4°C, 30 000 x g, 40 minutes and the clear supernatant containing the soluble
protein fraction was immediately used.
For small scale preparations the pellet of 1.5 ml cell culture was resuspended in 150 μl buffer
containing protease inhibitor cocktail and lysed by mechanic cell wall disruption. 1/3 volume
of zirconium beads were added and the cell suspension was vortexed for 8-10 minutes at 4°C
(Cell Disruptor Genie, Scientific Industries). The crude cell lysate was then centrifuged at
13 000 x g, 4°C for 10 minutes and the supernatant was immediately used or stored at -20°C
in the presence of 15% glycerol.
3.2.5.4 Periplasmic extract preparation
Periplasmic extracts were prepared by mild osmotic shock. Pellets of 25 ml cell cultures were
resuspended in 0.5 ml ice-cold 1 x TES buffer after which 0.75 ml of ice-cold 1/5 TES was
added and the cell suspensions were incubated on ice for 30 minutes then centrifuged at
13 000 x g, 4°C for 10 minutes. Supernatants containing the soluble periplasmic fraction were
transferred into a new tube and used immediately or stored at -20°C in the presence of 15%
glycerol.
3.2.6 Culturing and cell extract preparation of Thermoplasma acidophilum
3.2.6.1 Growth and harvest of T. acidophilum
T. acidophilum cells were cultured as described earlier (84) with minor modifications (3).
Briefly: 4 ml T. acidophilum cryo stock or 1 ml fresh culture was added to 50 ml medium and
grown at 59°C and 120 rpm in oil bath until OD600 reached 1.0 - 1.2 ( 2-3 days). Cells were
centrifuged at 4000 g for 10 minutes at RT, washed with ddH2O andstored at -80°C.
3.2.6.2 Preparation of T. acidophilum cytosolic extract
Frozen cell pellet was thawed on ice and resuspended in ddH2O (2 ml/1 g cell pellet)
containing EDTA-free protease inhibitor cocktail (Roche). Cell lysis was triggered by
Materials and methods
51
elevating the pH of the suspension to 7.5 with non-buffered 1M Tris. After cell lysis DNase I
or bensonase enzymes were added to digest released DNA and RNA polymers and the cell
lysate was incubated on ice for 1 h. Crude extract was centrifuged at 30 000 x g, 4°C for 20
min to remove cell debris and the supernatant was further centrifuged for 15 min to sediment
the membrane fraction. Clear cytosolic extract was immediately used or frozen with 15%
glycerol and stored at -20°C.
3.2.6.3 Long-term storage of T. acidophilum
100 ml of a T. acidophilum culture was cooled down to room temperature then the pH was
adjusted to 3 using 7% NH4OH. As cryoprotectant, 15 g sucrose was dissolved in the cell
suspension and 1.5 ml aliquots were flash frozen in liquid nitrogen and stored at -80°C.
3.2.7 Protein purification
3.2.7.1 Ni-affinity chromatography of recombinant His-tagged proteins
Large scale affinity purification of His-tagged proteins was carried out by IMAC
(Immobilized metal ion affinity chromatography) technique (85) using a 1 ml HisTrapTM FF
crude column (Ni-SepharoseTM 6 Fast Flow, GE Healthcare) that was connected to a fast
protein liquid chromatography (FPLC) system (ÄKTA Purifier 10, GE Healthcare). The
purification was carried out in a cold cabinet at 10°C with a flow rate of 0.8 ml/min Elution
profile was monitored with a UV-detector operating at 230, 254 and 280 nm. The applied
buffers and their preparation are described in unit 3.1.11. Prior to loading protein sample (cell
extract) the column was first equilibrated with the appropriate running buffer supplemented
with 10 mM imidazol. Unbound proteins were washed with 20 mM imidazole-containing
running buffer until A280 reached a constant base line. The elution of proteins was
implemented with a 20-250 mM imidazole gradient which was expanded to 40-45 column
volume. Fractions of 0.8 ml volumes were collected during the gradient elution then analyzed
on SDS-PAGE. Fractions of interest were pooled and concentrated by using Amicon Ultra
concentrator tubes with appropriate MWCO (molecular weight cut off) or directly used for
size exclusion chromatography (3.2.7.2).
Materials and methods
52
The small scale and batch purification of His-tagged proteins was performed on Ni-NTA
Agarose matrix (Ni-NTA coupled to Sepharose® CL 6B, Qiagen) applying the same buffer
conditions as for the large scale chromatography. To exchange the storing buffer of Ni-NTA
beads and to purify the target proteins the reactions were set up in 50 ml Falcon tubes. Each
centrifugation step was carried out at 4°C, 1000 x g for 1 minute and supernatants were gently
removed by pipetting. The volume of settled resin was 50 or 250 μl, respectively which was
first washed 3 times with 1 ml H2OMilliQ to remove ethanol then equilibrated 3 times with 1 ml
of the appropriate equilibration buffer. The cytosolic extract (100-200 μl or 20-40 ml) was
added to the equilibrated resin and incubated at 4°C for 1 h by continuous rotation. The resin
was then collected by centrifugation and washed 3 times with 1040 ml of washing buffer
depending on the volume of applied Ni-NTA resin. The elution of bound proteins was carried
out in 3-5 steps using 0.1-1 ml of elution buffer. Elution procedure was continued until no
protein was detected in the last fraction. Elution fractions were collected in separate tubes and
their protein concentration was analyzed as described (3.2.8.2). Samples of flow-through,
washing and elution fractions were analyzed by SDS-PAGE. Elution fractions containing
proteins of interest were pooled, concentrated and loaded on a gel filtration column or
dialyzed against the appropriate buffer and stored/used according to the experimental set up.
3.2.7.2 Size exclusion chromatography
Superose 12 chromatography
The enrichment of macromolecular complexes from T. acidophilum cytosolic extract was
carried out with size exclusion chromatography on a Superose 12 semi-preparative column
(GE-Healthcare). The column was connected to an FPLCsystem (ÄKTA Purifier 10, GE
Healthcare). 500 µl (max. 4 mg protein) of the cytosolic extract was loaded on the column
that was previously equilibrated with running buffer (25 mM K2HPO4-KH2PO4 buffer, pH 7.5
containing 1mM ATP, 1mM DTT and 5 mM MgCl2). During the separation the injected
samples were running at 10°C with 0.4 ml/min flow rate and the protein elution profile was
monitored with a UV-detector operating at 280 nm. 35 protein-containing fractions, each of
0.6 ml volume, were collected. Fractions 8 and 9 from each run, containing the high
molecular weight protein complexes (over the size of 300 kDa) were pooled and concentrated
to 2.5 ml volume. The protein solution was mixed with 15% glycerol, aliquoted to 100-200 µl
Materials and methods
53
volumes, frozen in liquid nitrogen and stored at -80°C until further use. This protein solution
served as antigen mixture for mouse immunization and as target protein mixture for the
phage-biopanning and scFv-screening procedure. Additionally, the high molecular weight
protein fraction was used as intput protein sample in further fractionation procedure by
hydroxy-apatite chromatography (3.2.7.3).
Superose 6 chromatography
After Ni-NTA separation scFv-captured macromolecular complexes were separated from
smaller contaminants on a semi-preparative Superose 6 chromatography column (GE-
Healthcare). The column was connected to an FPLC system (ÄKTA Purifier 10, GE
Healthcare) and operated at 0.4 ml/min flow rate and 10 °C. The protein elution profile was
monitored with a UV-detector operating at 280 nm. A sample volume of 300-500 µl was
loaded and 0.4 ml fractions were collected. Aliquots of them were loaded on SDS-gels and
evaluated.
3.2.7.3 Hydroxy-apatite chromatography
Hydroxyapatite chromatography was used to further fractionate Superose 12-separated high
molecular weight protein fractions of T. acidophilum. The sample was loaded on a 20 ml
hydroxyapatite column (Bio-Gel HTP, Bio-Rad Laboratories) which was operated at 4°C and
equilibrated with the loading buffer (10 mM K2HPO4-KH2PO4, pH 8.0). Step elution of bound
proteins was carried out sequentially with buffers containing 150, 300 and 500 mM K2HPO4-
KH2PO4, pH 8.0, at 0.5 ml/min flow rate. Protein elution profiles were detected and the 3
protein-containing fractions were collected. Protein fractions were dialyzed ON against 20
mM Na2HPO4-NaH2PO4 buffer, pH 8.0 at 4°C and concentrated with Amicon Ultra
concentrator tubes, 5 kDa MWCO.

Materials and methods
54
3.2.8 Protein analysis
3.2.8.1 Polyacrylamid gel electrophoresis (PAGE)
The protein content and quality of the protein samples were checked with PAGE under
denaturing or non-denaturing conditions, depending on the information of interest.
PAGE under denaturing conditions (SDS-PAGE)
The separation of proteins under denaturing and reducing conditions was carried out at room
temperature according to Laemmli’s protocol (86). Materials and buffer solutions used for the
gel preparation and running procedure are described in 3.1. The separation of protein samples
was performed on 15 % SDS polyacrylamid gels, which were prepared as follows:
15% separating gel: ddH2O 15 ml
4 x separating gel buffer 15 ml
30% acrylamid/bis-acrylamid mix (37.5 : 1) 30 ml
10% APS (w/v) 0.24 ml
TEMED 0.03 ml
6% stacking gel: ddH2O 33 ml
4 x stacking gel buffer 15 ml
30% acrylamid/bis-acrylamid mix (37.5 : 1) 12 ml
10% APS (w/v) 0.48 ml
TEMED 0.06 ml
Materials and methods
55
SDS-PAGE protocol:
Gels were placed in the electrophoretic chamber (Mighty Small II-System (8 x 7 cm, GE
Healthcare) and covered with 1 x Running buffer. For total protein separation 10 μl of pellet
was resuspended in 90 μl of ddH2O then 20 μl of 6 x SDS-sample buffer was added to the
suspension and heated at 95°C for 10 minutes. 5 μl of this mixture was loaded. Other protein
samples were diluted in ddH20, if it was necessary and supplemented with the sample buffer in
the ratio of 5 : 1 then heated at 75°C for 10 minutes. 10-15 µg protein was loaded in a
maximum volume of 12 µl. 5 µl pre-stained molecular marker was loaded in one of the wells
to be able to monitor protein separation. The applied electric field in the initial phase was 135
V and increased to 160-165 V when the bromophenolblue dye reached the border of stacking
and resolving gel. The gel was run until the blue dye reached the end of the gel, after which
the gels were rinsed with ddH2O and stained with Instant Blue protein staining solution for 1 h
then rinsed with water and scanned/stored.
Native-PAGE
NuPAGE®
Novex 3-8% Tris-acetate precast gels, (Invitrogen) were used to separate proteins
at native conditions. 5 µl HMW Native Marker (GE Healthcare) and protein samples mixed
with 6x native sample buffer were loaded (max. volume 20 µl) in the wells of a gel which had
been placed into an electrophoretic chamber (XCell Sure Lock Mini Cell, Invitrogene) and
covered with native running bufferl. The chamber was placed to 4°C and connected to a
power supply. The applied electric field was 100 V during the separation (until the
bromophenolblue dye reached the bottom of gel). After this the gel was removed and rinsed
with ddH2O and stained with Instant Blue protein staining solution for 1 h then rinsed with
water and scanned/stored.
3.2.8.2 Determination of protein concentration
Protein concentration was determined by measuring the absorbance of protein solutions at 280
nm. The measurements were performed with 3 parallel samples using a spectrophotometer
(Implen NanoPhotometer).
Materials and methods
56
3.2.8.3 Mass spectrometry
The MS/MS analysis of protein samples was carried out by the Biochemistry Core Facility of
the institute. The protein samples were first digested with trypsin either in solution or in gel
(87). Digested peptide mixtures were separated by on-line nanoLC and analyzed by
electronspray tandem mass spectrometry. The experiments were performed on an Agilent
1200 nanoflow system connected to an LTQ Orbitrap mass spectrometer (Thermo Electron,
Bremen, Germany) equipped with a nanoelectrospray ion source (Proxeon Biosystems,
Odense, Denmark). The data analysis was performed with the MaxQuant software as
described (88) supported by Mascot or Andromeda as the database search engine for peptide
identifications. Peaks in MS scans were determined as three-dimensional hills in the mass-
retention time plane. MS/MS peak lists were filtered to contain at most six peaks per 100 Da
interval and searched against a concatenated forward and reversed version of the
Thermoplasma acidophilum and Escherichia coli databases (extracted from NCBInr) and
Mouse database (International Protein Index database:
ftp://ftp.ebi.ac.uk/pub/databases/IPI/old/MOUSE) and contained frequently observed
contaminants like proteases and human keratins. The initial mass tolerance in MS mode was
set to 7 p.p.m. and MS/MS mass tolerance was 0.5 Da. Cysteine carbamidomethylation was
searched as a fixed modification, whereas N-acetyl protein and oxidized methionine were
searched as variable modifications.
3.2.8.4 Electron microscopy
Sample preparation
For EM-analysis, protein samples were prepared by negative staining on copper grids (100 x
400 meshes coated with a continuous carbon film, PLANO GmbH). The grids were first glow
discharged for 30 seconds in a plasma cleaner. For negative staining, the grid was placed C-
side down on a 5 μl drop of the protein sample and incubated for 60 seconds. After the
incubation the grid was blotted with the help of a filter paper (Whatman, Grade No.1) In the
same way, grids were washed and blotted quickly 2 times with 5 μl ddH2O and incubated for
60 seconds on a 2 μl droplet of 2 % uranyl-acetate before drying by blotting with filter paper.
The grids were then analysed or stored at room temperature.
Materials and methods
57
Data acquisition
The electron micrographs were acquired with a transmission electron microscope (CM 200
FEG TEM, 160 kV, Philips) equipped with a TVIPS CCD camera (CCD size: 4096 x 4096
pixel, CCD physical pixel size: 15 mue, conversion factor: 67 counts per incident electron).
The applied defocus and magnification of the images varied between -2 and -3 μm and
539600 and 93126, respectively.
3.2.9 Immunology methods
3.2.9.1 Monoclonal ELISA assay
ELISA assay was used to determine antigen specificity of monoclonal scFv-displaying phages
derived from the scFv library after the phage biopanning procedure. The growth of
monoclonal phages was carried out as described in supplementary data (7.2.1). ELISA-assay
was carried out with Nunc MaxiSorp® flat-bottom 96 well plates. The plate was first coated
with 100 μl of the appropriate antigen solution (10-100 μg/ml) diluted in PBS (1-10 μg
protein/100 μl PBS/well) at 4°C, ON with gentle horizontal shaking. Additionally, a negative
control plate was prepared for each antigen plate containing 100 μl of 2 % MPBS/well and
incubated on the same way. Next day, plates were washed 3 times with 350 μl PBS using an
automated microtiter plate-washer (Biotek ELx50/16). To block free binding surfaces, wells
were filled with 250 μl of 2 % MPBS and incubated with shaking at room temperature for 2 h.
After blocking, plates were washed 3 times with PBS in the same way as described. After
washing step, 100-100 μl of PBST was added to each well then mixed with 90-90 μl of the
corresponding phage supernatants (see 7.3.1) or 90-90 μl of soluble scFv-containing
supernatants (see 7.3.2). Plates were covered with Parafilm and incubated for 1.5 h at room
temperature. Wells were washed 3 times with PBST then 3 times with PBS. After washing
steps the following antibody solutions were added:
- Phage detection: 100-100 μl of 5000 x diluted HRP-conjugated anti-M13KO7 antibody.
- Soluble scFv detection: 100-100 μl of 5000 x diluted HRP-conjugated anti-E-tag antibody.
Materials and methods
58
Plates were incubated with the antibody solution for 1 h at room temperature then washed 3
times with PBST and 3 times with PBS as already described. To develop ELISA-signals
either of the HRP substrate solutions was added, as follows:
5-aminosalicylic acid substrate solution:
- 1 tablet of 5-aminosalicylic acid was dissolved in 50 ml of 20 mM Na2HPO4-NaH2PO4, pH
6.0. Prior to development, 4 μl of H2O2 was added to the substrate solution then plates were
incubated with 100 µl of this mixture for 20-30 minutes at RT. Reaction was stopped with
50 μl of 1M HCl.
TMB substrate solution:
- 50-100 µl of 1-Step Ultra TMB-ELISA substrate solution (Thermo Scientific) was added to
the plates and incubated for 10-20 minutes at RT after which reaction was stopped with 2M
H2SO4.
3.2.9.2 Western blot assay
Western blot assay was carried out using a horizontal, semi-dry electro-blotting system.
Nitrocellulose membrane was placed on a thick blotting filter paper sheet, which was
previously soaked in transfer buffer. SDS-gel containing the separated protein samples was
placed on the nitrocellulose membrane immediately after run and covered with a pre-soaked
thick filter paper sheet after which the lid was attached to the blotting chamber. The protein
transfer was carried out applying 15V electric field for 48 min. After the transfer, the
membrane was placed into 3 % MPBS solution and incubated at RT for 2 h or at 4°C ON to
block protein-free binding spaces on the nitrocellulose. Membrane was After the blocking the
membrane was placed into the target primary antibody solution. The following antibodies
were used in our experiments:
A. 5 X diluted polyclonal phage solution in PBST
B. 15 X diluted monoclonal phage solution in PBST
C. 1000 x diluted Rabbit anti-poly-histidine antibody in TBST
D. 100-1000 x diluted monoclonal His-tagged scFv in TBST
Materials and methods
59
The membrane was incubated with the primary antibody solution for 1 h at RT, then washed 3
x 5 min with the corresponding wash buffer (PBST or TBST). This step was followed by the
incubation with the secondary antibody for 30 min, then washed 1 x 10 and 2 x 5 min with the
appropriate wash buffer (PBST or TBST). The following secondary antibodies were used:
1. 5000 x diluted Mouse anti-M13-HRP conjugate in PBST for primary antibodies A and B
2. 5000 x diluted Goat anti-rabbit-AP conjugate in TBST for primary antibody C
3. 1000 x diluted Rabbit anti-poly-histidine antibody in TBST for primary antibody D
When a combination of A.1 and B.1 and D.3 was probed a tertier antibody solution was
applied:
- 5000 x diluted Goat anti-mouse-AP in PBST for combinations A.1 and B.1
- 5000 x diluted Goat anti-rabbit-AP in TBST for combination D.3
The membrane was incubated with the tertier antibody for 30 min then washed with the
corresponding wash buffer (PBST or TBST).
The signal was developed with the appropriate substrate solution after the last washing step.
The used substrates were:
- One Step Western blot TMB solution for HRP-conjugated antibodies and
- One Step Western blot BCIP/NBT solution or Sigma Fast BCIP/NBT tablet
dissolved in 10 ml ddH2O for AP-conjugated antibodies.
The membrane was incubated in the substrate solution for 5-10 min or until the desired color
developed after which the membrane was rinsed with water and conserved between
cellophane sheets.

Results and discussion
60
4. RESULTS AND DISCUSSION
4.1 Creation of the scFv library
Superose12-separated high molecular weight protein fraction (>300 kDa) of T. acidophilum
cytosolic cell extract was used to immunize mice. The preparation of T. acidophilum cell
extract and its subsequent Superose 12 chromatography purification was performed as
described in 3.2.6.2 and 3.2.7.2, respectively. Detailed work-flow of the mouse immunization
procedure and spleen harvest is described in 7.1.1. The extraction of total RNA and the scFv-
library construction was carried out according to a basic protocol described in 7.1.2 using
pCANTAB 5E vector. The scFv-library contained 1.4 × 10⁸ independent clones of which six
clones were randomly selected and sequenced. All the sequences were different (Figure
7.1.3.) indicating a diverse scFv library.
4.2 Selection of scFv-library against complex antigen mixtures
In the first approaches the original phage display library was selected and screened against
mixtures of protein complexes that were separated by two different chromatography
techniques. References, based on proteomics analyses and protein complex purification
studies of T. acidophilum served as starting points for the selection of target antigen mixtures.
Previous studies described that OH-apatite chromatography, glycerol gradient
ultracentrifugation and molecular sieve chromatography are applicable methods to separate
high molecular weight protein complexes from smaller constituents (3, 11, 89, 90). In the first
scFv selection experiments we applied the Superose 12 separated high molecular weight
protein fraction of T. acidophilum (Sup12-HMWF) and its further separated OH-apatite
elution fractions. The applied protein mixtures contained considerable amounts of protein
complexes over the size of 300 kDa. The preparation of target protein samples was carried out
as described in protein purification methods 3.2.7.2 and 3.2.7.3.
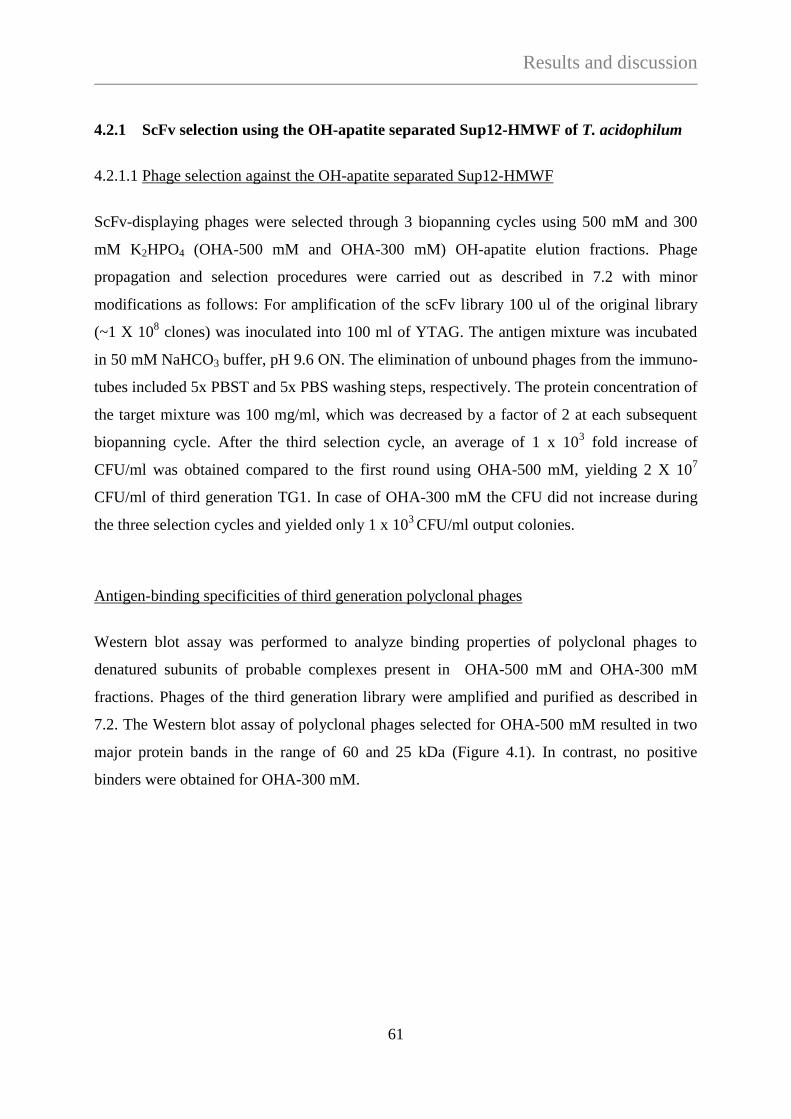
Results and discussion
61
4.2.1 ScFv selection using the OH-apatite separated Sup12-HMWF of T. acidophilum
4.2.1.1 Phage selection against the OH-apatite separated Sup12-HMWF
ScFv-displaying phages were selected through 3 biopanning cycles using 500 mM and 300
mM K2HPO4 (OHA-500 mM and OHA-300 mM) OH-apatite elution fractions. Phage
propagation and selection procedures were carried out as described in 7.2 with minor
modifications as follows: For amplification of the scFv library 100 ul of the original library
(~1 X 10⁸ clones) was inoculated into 100 ml of YTAG. The antigen mixture was incubated
in 50 mM NaHCO3 buffer, pH 9.6 ON. The elimination of unbound phages from the immuno-
tubes included 5x PBST and 5x PBS washing steps, respectively. The protein concentration of
the target mixture was 100 mg/ml, which was decreased by a factor of 2 at each subsequent
biopanning cycle. After the third selection cycle, an average of 1 x 10³ fold increase of
CFU/ml was obtained compared to the first round using OHA-500 mM, yielding 2 X 10⁷
CFU/ml of third generation TG1. In case of OHA-300 mM the CFU did not increase during
the three selection cycles and yielded only 1 x 10³ CFU/ml output colonies.
Antigen-binding specificities of third generation polyclonal phages
Western blot assay was performed to analyze binding properties of polyclonal phages to
denatured subunits of probable complexes present in OHA-500 mM and OHA-300 mM
fractions. Phages of the third generation library were amplified and purified as described in
7.2. The Western blot assay of polyclonal phages selected for OHA-500 mM resulted in two
major protein bands in the range of 60 and 25 kDa (Figure 4.1). In contrast, no positive
binders were obtained for OHA-300 mM.
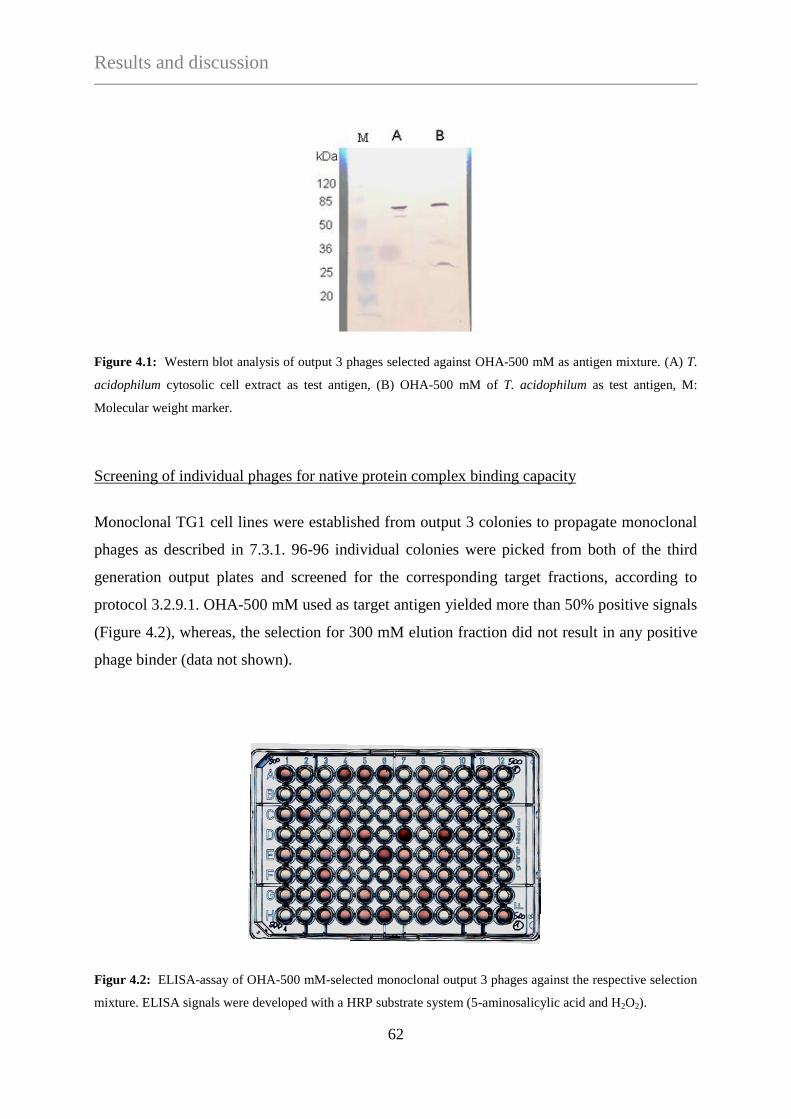
Results and discussion
62
Figure 4.1: Western blot analysis of output 3 phages selected against OHA-500 mM as antigen mixture. (A) T.
acidophilum cytosolic cell extract as test antigen, (B) OHA-500 mM of T. acidophilum as test antigen, M:
Molecular weight marker.
Screening of individual phages for native protein complex binding capacity
Monoclonal TG1 cell lines were established from output 3 colonies to propagate monoclonal
phages as described in 7.3.1. 96-96 individual colonies were picked from both of the third
generation output plates and screened for the corresponding target fractions, according to
protocol 3.2.9.1. OHA-500 mM used as target antigen yielded more than 50% positive signals
(Figure 4.2), whereas, the selection for 300 mM elution fraction did not result in any positive
phage binder (data not shown).
Figur 4.2: ELISA-assay of OHA-500 mM-selected monoclonal output 3 phages against the respective selection
mixture. ELISA signals were developed with a HRP substrate system (5-aminosalicylic acid and H2O2).
Results and discussion
63
Detection of protein complexes recognized by OHA-500 mM-selected phages with Western
blot assay
Phages derived from monoclonal cell-lines were further screened by Western blot assay. The
analyzed protein complex-containing fractions included the cytosolic cell extract of T.
acidophilum and the selection target mixture OHA-500 mM. 24 ELISA-positive monoclonal
phages were tested for protein binding properties, of which 7 gave positive signal at 60 kDa
and 3 at 25 kDa, corresponding to the recognition pattern of polyclonal phages. One weak
positive clone was obtained that recognized a protein at 20 kDa. No signal pattern was
obtained in case of remaining phage clones, which however, does not necessarily mean that
the phages were not specific to any of the target antigens. Signal intensities may vary due to
unequal protein ratio in the separated protein mixture, which results in inadequate target
quantity suppressed by abundant proteins. Low concentration (originating from poor
expression level of certain scFv-displaying phage clones) of purified, specific phages can also
result weak signal intensity. Besides, the 3D structure of target complexes and their subunit
composition can be dramatically influenced by assay conditions, which can strongly affect the
scFv-antigen binding by means of structural changes in the target antigen. Therefore, epitopes
for specific scFvs often remain hidden at native conditions. Good examples are for this
ELISA and Western blot assays, where the target antigens of interest are accessible either in
their native structure or in denatured forms, respectively. This should also be considered while
evaluating results arising from both screening techniques. Since our studies are focusing on
intact protein complex isolation, ELISA-assay alone can serve as satisfying screening method
for identifying specific scFv-binders, however, combining with Western blot analysis the
evaluation and verification is more precise.
4.2.1.2 Affinity purification of protein complexes using agarose bead-immobilized scFv-
displaying phages
Two ELISA and Western blot positive phages A2 and D1 from OHA-500 mM-selected
monoclonal output 3 TG1 were selected and coupled to activated agarose beads to capture
protein complexes from T. acidophilum cytosolic extract. In the elution fractions no protein
was detectable, indicating that no protein binding occurred or it remained under detection
level.
Results and discussion
64
This might be explained with the fact that the quality and quantity of the bait protein strongly
influences the purity and yield of the prey molecule. The maximum saturation of beads with
the desired antibody results in higher prey binding capacity, which leads to a better
purification yield. Filamentous phage particles are constituted of thousands of the major coat
protein (pVIII) whose amino terminal end forms the outer hydrophilic surface of the virion.
Therefore the primery amines (-NH2) on the N-terminus are exposed to the reactive aldehyde
groups in the cross-linking reaction. Consequently, the great mass of potential coupling sites
is occupied by the phage minor coat protein, which dramatically reduces the number of
potentially attachable scFvs in a surface unit. Thus, the low copy number scFv cannot capture
usable amount of prey. Additionally, these huge filamentous phages can clog the pores of the
resin causing poor protein distribution. With this end in view we concluded that the use of
phage based pull-down assays have their limits and not applicable for protein purification
purposes.
4.2.1.3 Affinity purification of protein complexes using surface-immobilized scFvs
Since scFv-displaying phage particles did not prove to be applicable for protein pull-down
assays we targeted the expression of soluble scFvs. The expression of phage-free, affinity
tagged scFvs (~27-28 kDa) was carried out in two different ways, using pCANTAB 5E and
pET28(SfiI) expression systems, respectively.
Expression of free E-tagged scFvs derived from positive phagemid clones
In the first approach we applied E. coli HB2151 non-suppressor strain, which allows free, E-
tagged protein expression from the same phagemid without the need to re-clone scFvs into a
new expression vector. To carry out soluble protein expression phagemids HB2151 cells were
infected with third generation OHA-500 mM selected polyclonal phages. The growth of
HB2151 and the propagation of phages were performed similarly as described in 7.2 using
YTCbGN and YTCbKN media instead of YTCbG and YTCbK, respectively. Individual
colonies harboring pCANTAB 5E-scFvs were harvested from plates and used to establish
monoclonal cell-lines. The expression of monoclonal scFvs was carried out via IPTG
induction as described in 7.3.2. The specificity of soluble scFvs expressed into the medium
Results and discussion
65
was tested with monoclonal ELISA-assay using anti-E-tag antibodies (3.2.9.1). OHA-500
mM was used as test antigen mixture for testing antibody specificities.
The monoclonal ELISA test of soluble E-tagged scFvs resulted in slight positive signal
intensities compared to those expressed on phages, indicating that the concentration of soluble
free scFvs in the medium is significantly lower than their displayed versions. Since the
concentration of expressed soluble scFvs may strongly differ in their three possible locations
(cytosol, periplasm, medium) no conclusions can be drawn from the real expression rate of a
certain clone. Therefore expression tests of two randomly selected clones were performed to
monitor secreted, periplasmic and cytosolic expression levels. Periplasmic and whole cell
extracts were prepared and SDS-PAGE and Western blot analyses were performed to detect
scFvs in the three different cellular locations. These assays did not provide unambiguous
results regarding the location of scFvs, only MS/MS analysis detected traces of scFvs in the
periplasms and whole cell extracts, while almost nothing in the media.
The expression of eukaryotic antibodies and their derivatives in prokaryotic systems is a
challenging task, which in many cases requires time-consuming testing procedures for
obtaining the desired yield and quality of recombinant protein. The HB2151-pCANTAB 5E
expression system did not prove to be appropriate either for high-throughput screening or for
expression optimization of soluble scFvs due to more limitations. HB2151 needs to be
infected with phages via the F-pilus, however, it infects quite poorly, which lessens
transfection efficiency. pCANTAB 5E enables only E-tagged scFv expression with an N-
terminal leader sequence which directs the protein into three different locations. The testing of
clones for soluble scFv expression requires time-consuming expression tests, moreover, the
undigested leader sequence on scFvs may influence proper antibody folding and epitope
recognizing ability if the protein is enriched in the cytoplasm.
Expression of His-tagged scFvs derived from positive phagemid clones
For the faster and easier implementation of expression tests, positive scFv inserts were re-
cloned into a modified pET28 vector (pET28-SfiI) to allow expression of scFvs with a C-
terminal 6 Histidine fusion tag. The 6-His fusion tag allows fast and reproducible affinity

Results and discussion
66
purification using considerably cheaper IMAC resins instead of costly, low binding capacity
antibody-affinity columns. pET28 may be introduced in a variety of expression strains to
optimize recombinant expression level and protein solubility. To be able to clone scFvs
directly into pET28, the insertion of a SfiI restriction site was required. The schematic picture
of construction procedure is shown in 7.4. The detailed cloning protocol of scFvs in
pET28(SfiI) is described in molecular biology methods (3.2.4). After sequence analysis of re-
cloned scFvs, plasmids were used to transform E. coli BL21(DE3) to perform expression. The
small scale expression of His-tagged scFvs was tested at 37°C in the presence of 1mM IPTG
as an induction agent for 2.5 and 5 h, respectively. The presence of scFvs was examined from
the total cell extract of hosts and assayed by Western blot using His-probe antibody. The
expression tests of 10 randomly selected scFvs (corresponding ELISA-assay of clones see
Figure 4.2) are demonstrated with SDS-PAGE and their corresponding Western blot assay
(Figures 4.3 and 4.4). A minor increase in scFv rate was observed with extending the
induction time. The presence of scFvs separated along with the host proteins is not
unambiguous on the SDS-gels, however, they show slight differences in their protein pattern
if un-induced control samples are compared to the induced ones.
Figure: 4.3: Expression tests of OHA-500 mM-selected His-tagged scFvs separated by 15% SDS-PAGE. A8-
H10 represent total cell extracts of BL21(DE3) expressing individual scFv clones. 1: Un-induced control (5 h),
2: 1 mM IPTG induction, 2.5 h induction time, 3: 1 mM IPTG induction, 5 h induction time. M: Molecular
weight marker.
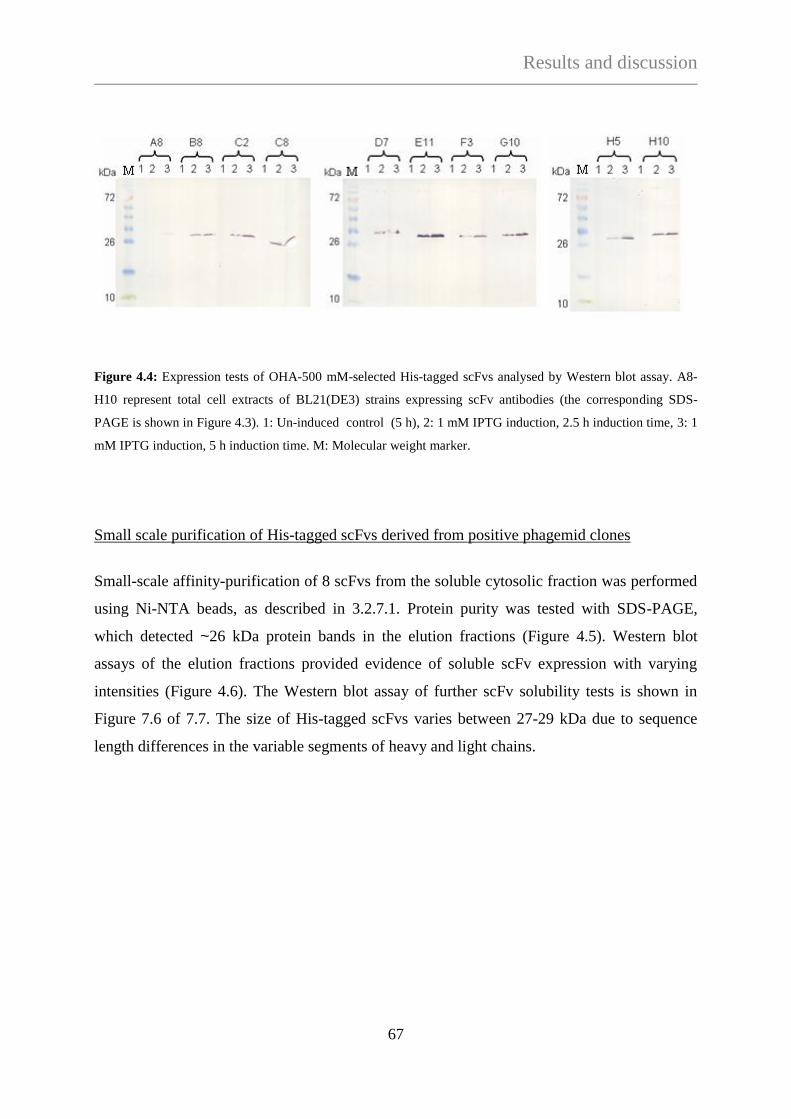
Results and discussion
67
Figure 4.4: Expression tests of OHA-500 mM-selected His-tagged scFvs analysed by Western blot assay. A8-
H10 represent total cell extracts of BL21(DE3) strains expressing scFv antibodies (the corresponding SDS-
PAGE is shown in Figure 4.3). 1: Un-induced control (5 h), 2: 1 mM IPTG induction, 2.5 h induction time, 3: 1
mM IPTG induction, 5 h induction time. M: Molecular weight marker.
Small scale purification of His-tagged scFvs derived from positive phagemid clones
Small-scale affinity-purification of 8 scFvs from the soluble cytosolic fraction was performed
using Ni-NTA beads, as described in 3.2.7.1. Protein purity was tested with SDS-PAGE,
which detected ~26 kDa protein bands in the elution fractions (Figure 4.5). Western blot
assays of the elution fractions provided evidence of soluble scFv expression with varying
intensities (Figure 4.6). The Western blot assay of further scFv solubility tests is shown in
Figure 7.6 of 7.7. The size of His-tagged scFvs varies between 27-29 kDa due to sequence
length differences in the variable segments of heavy and light chains.

Results and discussion
68
Figure 4.5: 15% SDS-PAGE analysis of Ni-NTA-purified soluble His-tagged scFvs. Small-scale expression and
Ni-NTA purification of scFvs from the soluble cell fraction were carried out as described in 3.2.5.3 and 3.2.7.1,
applying 1 x Coupling buffer. Bands of A8-H10 represent individual scFv clones. 1: Cytosolic extract, 2: Flow
through, 3: Washing step, 4: 250 mM imidazole elution fraction. Red arrows show His-tagged scFvs. M:
Molecular weight marker.
Figure 4.6: Western blot assay of Ni-NTA-purified soluble His-tagged scFvs (corresponding to SDS-PAGE in
Figure 4.5). Bands of C2-H10 represent affinity-purified His-tagged scFvs. M: Molecular weight marker.

Results and discussion
69
Identification of protein complexes using Ni-NTA-purified His-tagged scFvs
The antigen recognizing ability of purified scFvs was verified by Western blot assay, applying
OHA-500 mM of T. acidophilum cytosolic extract as target mixture. Ni-NTA-purified His-
tagged scFvs were used as primary antibody, while His-probe antibody and alkaline
phosphatase conjugated anti-rabbit were used as secondary and tertier antibodies, respectively
(Figure 4.7).
Three of the tested scFv clones (corresponding ELISA-assay of clones see in Figure 4.2 of
4.2.1.1) showed reactivity in the size range of 58 kDa (B8, C8, G10) and three clones in the
size range of 35 kDa (A11, D7, F3). No scFv binding was obtained in case of four clones,
which might be indicative of low scFv concentration applied for the incubation or the low
concentration of specific target protein in the cytosolic extract.
Figure 4.7: Identification of protein bands by affinity-purified His-tagged scFvs selected for OHA-500 mM
proteins. Bands of A8-H10 represent affinity-purified scFvs tested for protein specificity against OHA-500 mM
as test antigen mixture. Red arrows show proteins recognized by the specific scFv clones. M: Molecular weight
marker.
Affinity purification of protein complexes on agarose bead-immobilized scFvs
Our first attempts showed that scFv-displaying phages coupled to agarose beads were not
applicable for protein pull-down assays. Therefore, in the second approach we used agarose-
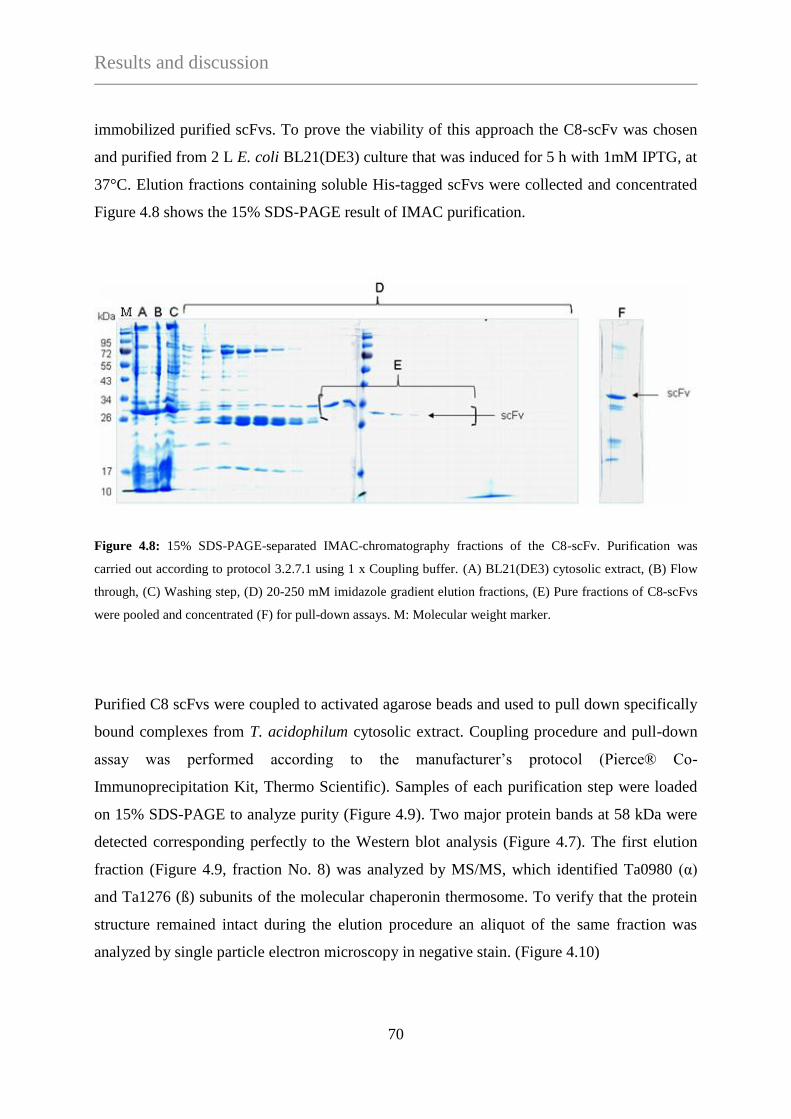
Results and discussion
70
immobilized purified scFvs. To prove the viability of this approach the C8-scFv was chosen
and purified from 2 L E. coli BL21(DE3) culture that was induced for 5 h with 1mM IPTG, at
37°C. Elution fractions containing soluble His-tagged scFvs were collected and concentrated
Figure 4.8 shows the 15% SDS-PAGE result of IMAC purification.
Figure 4.8: 15% SDS-PAGE-separated IMAC-chromatography fractions of the C8-scFv. Purification was
carried out according to protocol 3.2.7.1 using 1 x Coupling buffer. (A) BL21(DE3) cytosolic extract, (B) Flow
through, (C) Washing step, (D) 20-250 mM imidazole gradient elution fractions, (E) Pure fractions of C8-scFvs
were pooled and concentrated (F) for pull-down assays. M: Molecular weight marker.
Purified C8 scFvs were coupled to activated agarose beads and used to pull down specifically
bound complexes from T. acidophilum cytosolic extract. Coupling procedure and pull-down
assay was performed according to the manufacturer’s protocol (Pierce® Co-
Immunoprecipitation Kit, Thermo Scientific). Samples of each purification step were loaded
on 15% SDS-PAGE to analyze purity (Figure 4.9). Two major protein bands at 58 kDa were
detected corresponding perfectly to the Western blot analysis (Figure 4.7). The first elution
fraction (Figure 4.9, fraction No. 8) was analyzed by MS/MS, which identified Ta0980 (α)
and Ta1276 (ß) subunits of the molecular chaperonin thermosome. To verify that the protein
structure remained intact during the elution procedure an aliquot of the same fraction was
analyzed by single particle electron microscopy in negative stain. (Figure 4.10)
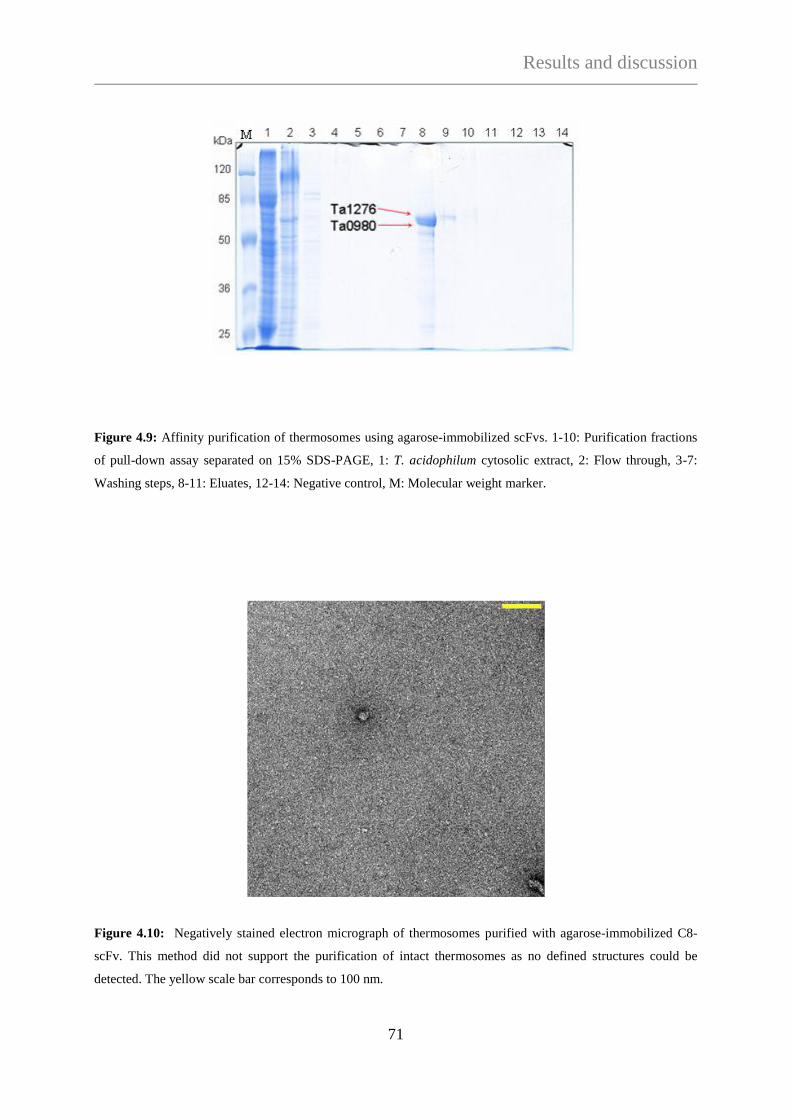
Results and discussion
71
Figure 4.9: Affinity purification of thermosomes using agarose-immobilized scFvs. 1-10: Purification fractions
of pull-down assay separated on 15% SDS-PAGE, 1: T. acidophilum cytosolic extract, 2: Flow through, 3-7:
Washing steps, 8-11: Eluates, 12-14: Negative control, M: Molecular weight marker.
Figure 4.10: Negatively stained electron micrograph of thermosomes purified with agarose-immobilized C8-
scFv. This method did not support the purification of intact thermosomes as no defined structures could be
detected. The yellow scale bar corresponds to 100 nm.
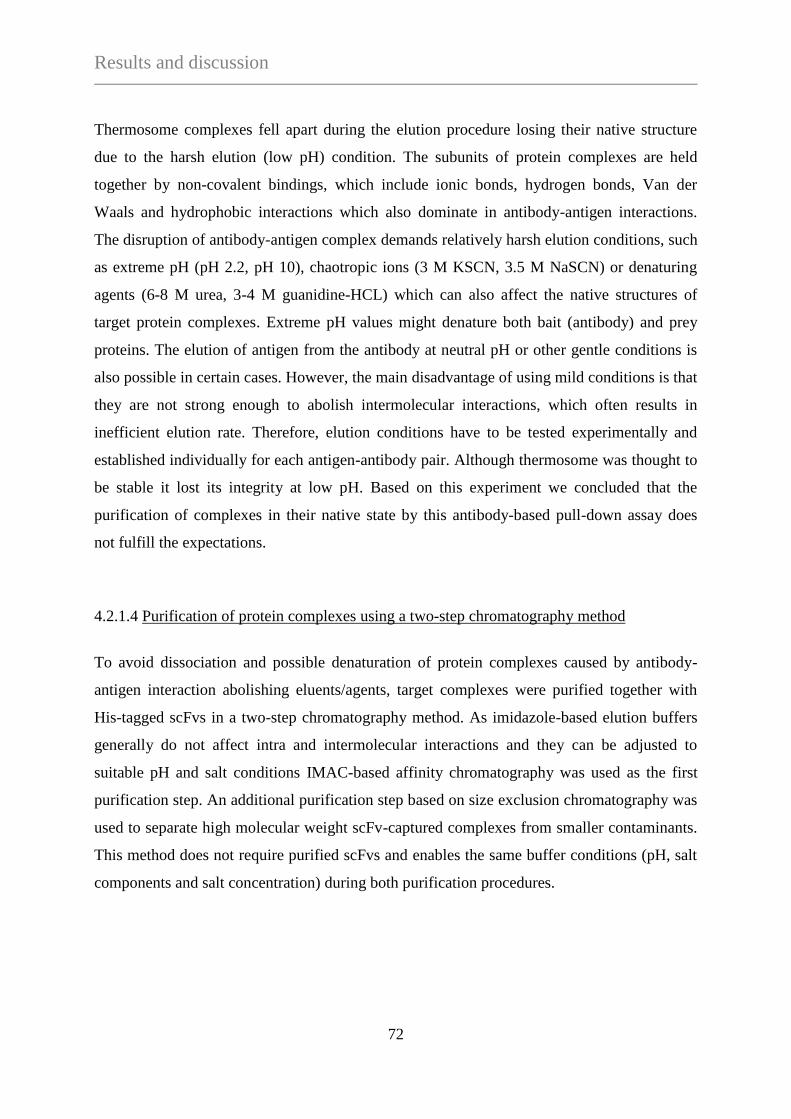
Results and discussion
72
Thermosome complexes fell apart during the elution procedure losing their native structure
due to the harsh elution (low pH) condition. The subunits of protein complexes are held
together by non-covalent bindings, which include ionic bonds, hydrogen bonds, Van der
Waals and hydrophobic interactions which also dominate in antibody-antigen interactions.
The disruption of antibody-antigen complex demands relatively harsh elution conditions, such
as extreme pH (pH 2.2, pH 10), chaotropic ions (3 M KSCN, 3.5 M NaSCN) or denaturing
agents (6-8 M urea, 3-4 M guanidine-HCL) which can also affect the native structures of
target protein complexes. Extreme pH values might denature both bait (antibody) and prey
proteins. The elution of antigen from the antibody at neutral pH or other gentle conditions is
also possible in certain cases. However, the main disadvantage of using mild conditions is that
they are not strong enough to abolish intermolecular interactions, which often results in
inefficient elution rate. Therefore, elution conditions have to be tested experimentally and
established individually for each antigen-antibody pair. Although thermosome was thought to
be stable it lost its integrity at low pH. Based on this experiment we concluded that the
purification of complexes in their native state by this antibody-based pull-down assay does
not fulfill the expectations.
4.2.1.4 Purification of protein complexes using a two-step chromatography method
To avoid dissociation and possible denaturation of protein complexes caused by antibody-
antigen interaction abolishing eluents/agents, target complexes were purified together with
His-tagged scFvs in a two-step chromatography method. As imidazole-based elution buffers
generally do not affect intra and intermolecular interactions and they can be adjusted to
suitable pH and salt conditions IMAC-based affinity chromatography was used as the first
purification step. An additional purification step based on size exclusion chromatography was
used to separate high molecular weight scFv-captured complexes from smaller contaminants.
This method does not require purified scFvs and enables the same buffer conditions (pH, salt
components and salt concentration) during both purification procedures.
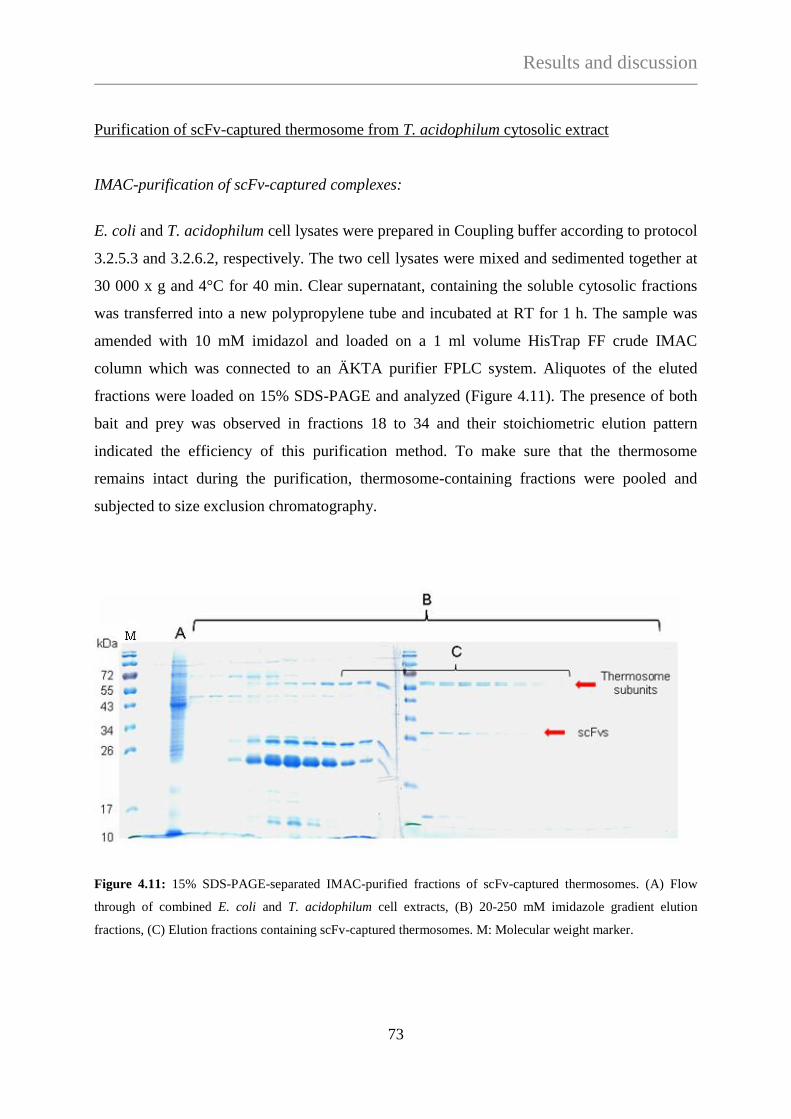
Results and discussion
73
Purification of scFv-captured thermosome from T. acidophilum cytosolic extract
IMAC-purification of scFv-captured complexes:
E. coli and T. acidophilum cell lysates were prepared in Coupling buffer according to protocol
3.2.5.3 and 3.2.6.2, respectively. The two cell lysates were mixed and sedimented together at
30 000 x g and 4°C for 40 min. Clear supernatant, containing the soluble cytosolic fractions
was transferred into a new polypropylene tube and incubated at RT for 1 h. The sample was
amended with 10 mM imidazol and loaded on a 1 ml volume HisTrap FF crude IMAC
column which was connected to an ÄKTA purifier FPLC system. Aliquotes of the eluted
fractions were loaded on 15% SDS-PAGE and analyzed (Figure 4.11). The presence of both
bait and prey was observed in fractions 18 to 34 and their stoichiometric elution pattern
indicated the efficiency of this purification method. To make sure that the thermosome
remains intact during the purification, thermosome-containing fractions were pooled and
subjected to size exclusion chromatography.
Figure 4.11: 15% SDS-PAGE-separated IMAC-purified fractions of scFv-captured thermosomes. (A) Flow
through of combined E. coli and T. acidophilum cell extracts, (B) 20-250 mM imidazole gradient elution
fractions, (C) Elution fractions containing scFv-captured thermosomes. M: Molecular weight marker.

Results and discussion
74
Superose 6 chromatography of IMAC-purified scFv-captured thermosomes
Fractions of Superose 6 chromatography were analyzed by 15% SDS-PAGE. (Figure 4.12)
Thermosome subunits were detected in fractions 11-18 representing a Gaussian distribution.
The peak maximum corresponds to 11.5 ml retention volume, where ~900-1000 kDa
molecular weight complexes are eluted which is in good agreement with the size of the
thermosome complex. The stoichiometry of thermosome subunits and the scFvs along the
two-step chromatography purification indicates that the termosomes were captured by their
highly specific scFvs. The purification assay yielded 80 µg, 98% purity of thermosomes from
2 g T. acidophilum biomass.
Figure 4.12: Chromatogram of Superose 6-purified scFv-captured thermosomes (A) and the 15% SDS-PAGE
analysis of the corresponding chromatography fractions (B). Fractions 11-18 contain the captured thermosome
particles. M: Molecular weight marker.
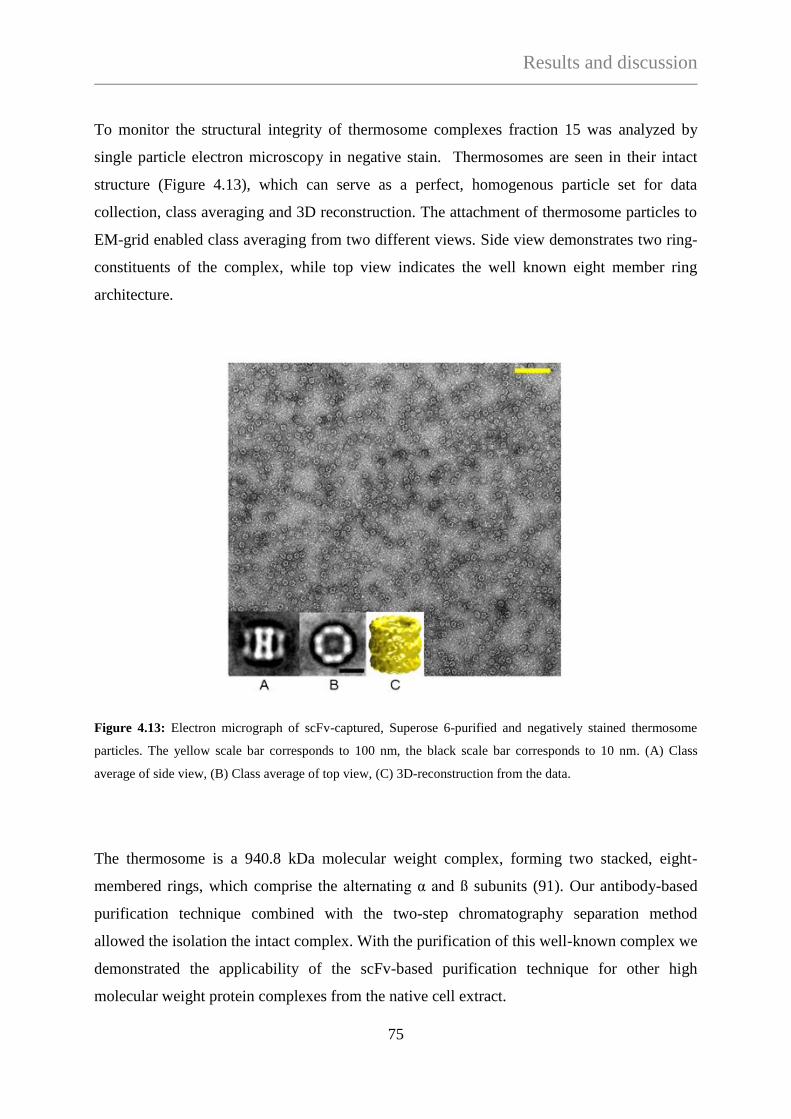
Results and discussion
75
To monitor the structural integrity of thermosome complexes fraction 15 was analyzed by
single particle electron microscopy in negative stain. Thermosomes are seen in their intact
structure (Figure 4.13), which can serve as a perfect, homogenous particle set for data
collection, class averaging and 3D reconstruction. The attachment of thermosome particles to
EM-grid enabled class averaging from two different views. Side view demonstrates two ring-
constituents of the complex, while top view indicates the well known eight member ring
architecture.
Figure 4.13: Electron micrograph of scFv-captured, Superose 6-purified and negatively stained thermosome
particles. The yellow scale bar corresponds to 100 nm, the black scale bar corresponds to 10 nm. (A) Class
average of side view, (B) Class average of top view, (C) 3D-reconstruction from the data.
The thermosome is a 940.8 kDa molecular weight complex, forming two stacked, eight-
membered rings, which comprise the alternating α and ß subunits (91). Our antibody-based
purification technique combined with the two-step chromatography separation method
allowed the isolation the intact complex. With the purification of this well-known complex we
demonstrated the applicability of the scFv-based purification technique for other high
molecular weight protein complexes from the native cell extract.

Results and discussion
76
Purification of scFv-captured proteasome complexes from T. acidophilum cytosolic extract
The next scFv candidate for purification purposes was A11-scFv (corresponding ELISA-assay
is shown in Figure 4.2). The purification of complexes was performed in the same way as
described (4.2.1.4). ScFv-containing protein fractions were analyzed by single particle EM in
negative stain and the major proteins of the fractions were identified by MS/MS. Figure 4.14
demonstrates the results of the second purification step.
Figure 4.14: Chromatogram of Superose 6-purified scFv-captured proteasomes (A) combined with the 15%
SDS-PAGE of respective chromatography fractions (B). Fractions 14-19 - indicating pure proteasome bands -
were analyzed by MS/MS and EM. M: Molecular weight marker.
A11-scFv was identified as recognizing a ~26 kDa protein target (data not shown).
Accordingly, a protein band of 26 kDa was detected in fractions 14-19. The protein band
showed stoichiometric conformity with a slightly bigger protein in the same retention
volumes. The MS/MS analysis identified α and ß subunits of T. acidophilum proteasome,
Ta1288 and Ta0612, respectively. Furthermore, the analysis identified significant amounts of
antibody in the same protein samples. The real molecular weight of α-subunit is 25.8 kDa,
while ß-subunit is 23.2 kDa, but our SDS-PAGE running conditions did not allow the proper
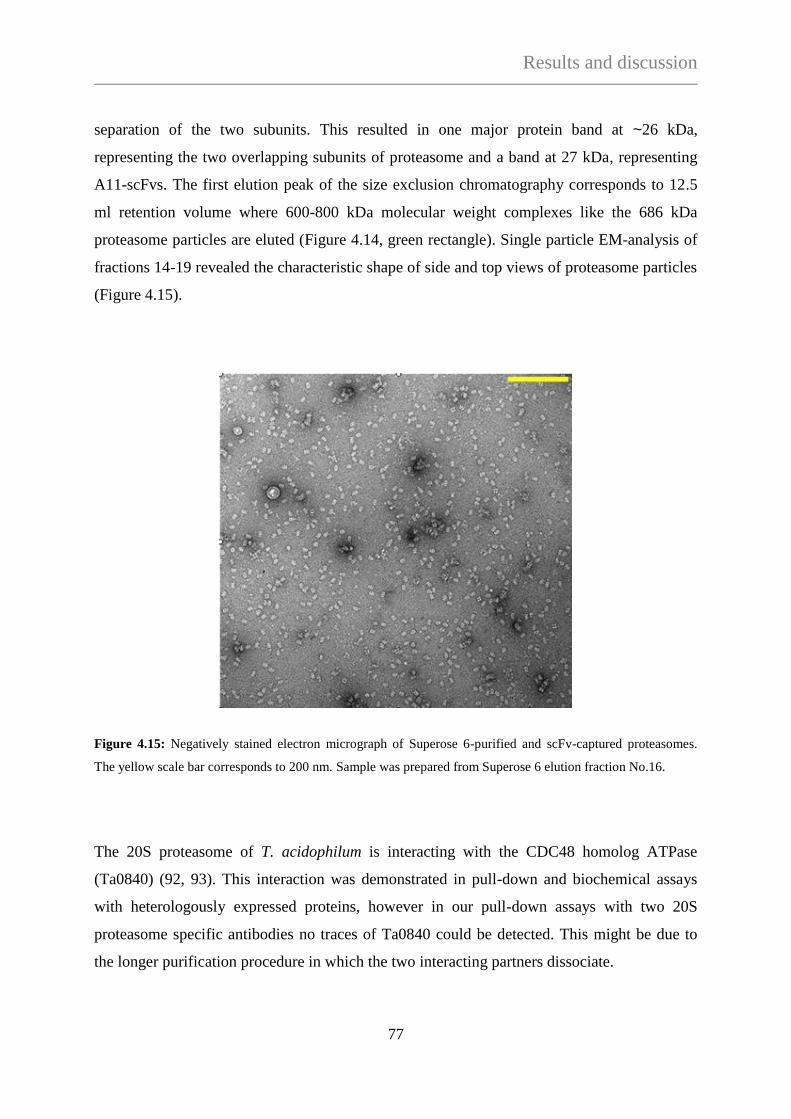
Results and discussion
77
separation of the two subunits. This resulted in one major protein band at ~26 kDa,
representing the two overlapping subunits of proteasome and a band at 27 kDa, representing
A11-scFvs. The first elution peak of the size exclusion chromatography corresponds to 12.5
ml retention volume where 600-800 kDa molecular weight complexes like the 686 kDa
proteasome particles are eluted (Figure 4.14, green rectangle). Single particle EM-analysis of
fractions 14-19 revealed the characteristic shape of side and top views of proteasome particles
(Figure 4.15).
Figure 4.15: Negatively stained electron micrograph of Superose 6-purified and scFv-captured proteasomes.
The yellow scale bar corresponds to 200 nm. Sample was prepared from Superose 6 elution fraction No.16.
The 20S proteasome of T. acidophilum is interacting with the CDC48 homolog ATPase
(Ta0840) (92, 93). This interaction was demonstrated in pull-down and biochemical assays
with heterologously expressed proteins, however in our pull-down assays with two 20S
proteasome specific antibodies no traces of Ta0840 could be detected. This might be due to
the longer purification procedure in which the two interacting partners dissociate.
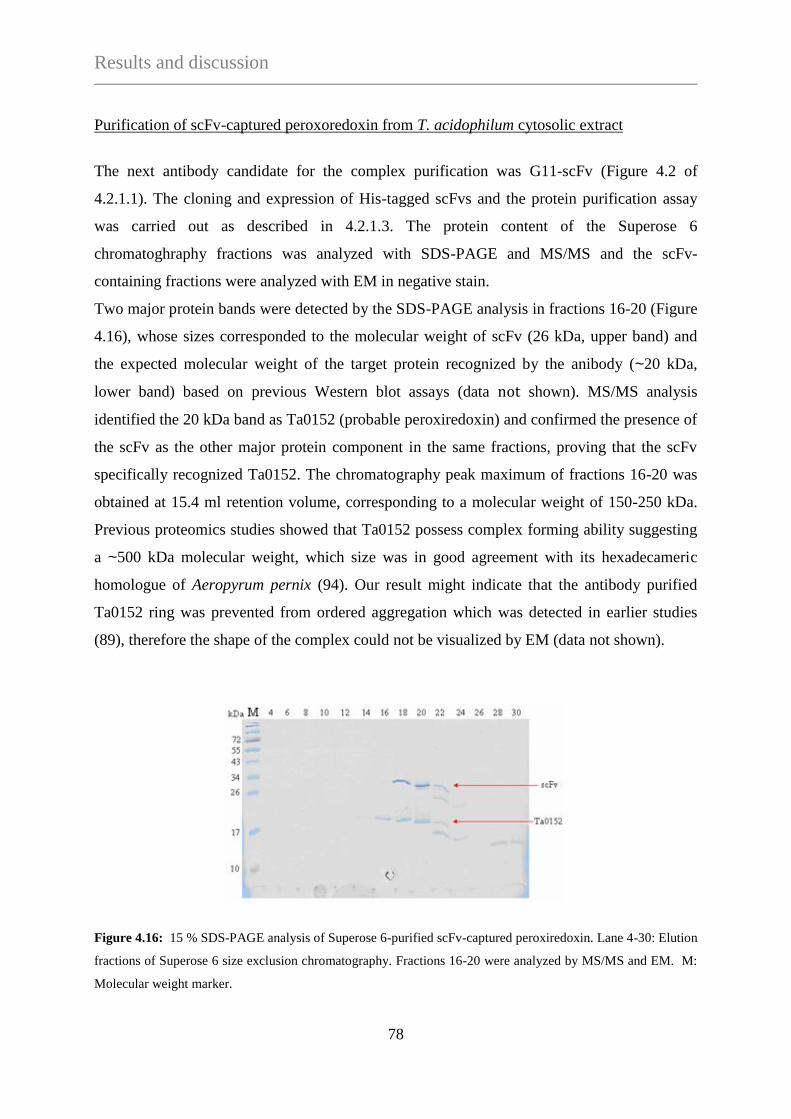
Results and discussion
78
Purification of scFv-captured peroxoredoxin from T. acidophilum cytosolic extract
The next antibody candidate for the complex purification was G11-scFv (Figure 4.2 of
4.2.1.1). The cloning and expression of His-tagged scFvs and the protein purification assay
was carried out as described in 4.2.1.3. The protein content of the Superose 6
chromatoghraphy fractions was analyzed with SDS-PAGE and MS/MS and the scFv-
containing fractions were analyzed with EM in negative stain.
Two major protein bands were detected by the SDS-PAGE analysis in fractions 16-20 (Figure
4.16), whose sizes corresponded to the molecular weight of scFv (26 kDa, upper band) and
the expected molecular weight of the target protein recognized by the anibody (~20 kDa,
lower band) based on previous Western blot assays (data not shown). MS/MS analysis
identified the 20 kDa band as Ta0152 (probable peroxiredoxin) and confirmed the presence of
the scFv as the other major protein component in the same fractions, proving that the scFv
specifically recognized Ta0152. The chromatography peak maximum of fractions 16-20 was
obtained at 15.4 ml retention volume, corresponding to a molecular weight of 150-250 kDa.
Previous proteomics studies showed that Ta0152 possess complex forming ability suggesting
a ~500 kDa molecular weight, which size was in good agreement with its hexadecameric
homologue of Aeropyrum pernix (94). Our result might indicate that the antibody purified
Ta0152 ring was prevented from ordered aggregation which was detected in earlier studies
(89), therefore the shape of the complex could not be visualized by EM (data not shown).
Figure 4.16: 15 % SDS-PAGE analysis of Superose 6-purified scFv-captured peroxiredoxin. Lane 4-30: Elution
fractions of Superose 6 size exclusion chromatography. Fractions 16-20 were analyzed by MS/MS and EM. M:
Molecular weight marker.
Results and discussion
79
4.2.2 Superose 12-enriched high molecular weight protein fraction (Sup12-HMWF) of T.
acidophilum cytosolic extract as target mixture
As previous results showed, the specificity of scFv-displaying phages in the third generation
scFv-library is limited and disproportional to proteins that are present in the cytosol at high
concentration (3) and are good antigens (thermosome and proteasome). The use of OH-apatite
chromatography as a second target fractionation step further increases the enrichment of these
abundant protein complexes in the OHA-500 mM target mixture. The abundance of
thermosomes and proteasomes in the applied antigen mixture favors their corresponding
scFvs to be selected during the selection procedure. Thus, those scFv-displaying phages,
which are specific for low expression level protein complexes are not exposed to high
selection drift due to unequal protein ratios. This hinders the diversity of phage binders during
the biopanning cycles.
To avoid segregation of highly abundant target complexes by further fractionation, the next
selection procedure was carried out against the crude Superose12-separated cytosolic extract
of T. acidophilum (this protein mixture was used for mouse immunization).
4.2.2.1 Phage selection and screening against Sup12-HMWF
ScFv-displaying phages were selected through 3 biopanning cycles using Sup12-HMWF as
target protein mixture. The phage propagation and selection procedure was carried out
according to basic protocol 7.2 with minor modifications as follows: to amplify scFv library
100 ul (~1 x 10⁸ clones) of the original library was inoculated into 100 ml of YTAG. Target
antigens in the immuno-tubes were incubated in 1 x PBS buffer, ON. In each cycle, the
elimination of unbound phages included 5 PBST and 5 PBS washing steps, respectively.
After the third selection cycle an 8 x 10³ fold-increase was obtained compared to the first
round, yielding 4 X 10⁸ CFU/ml. Third generation phages were checked by Western blot
assays to test diversity of the polyclonal phage mixture.
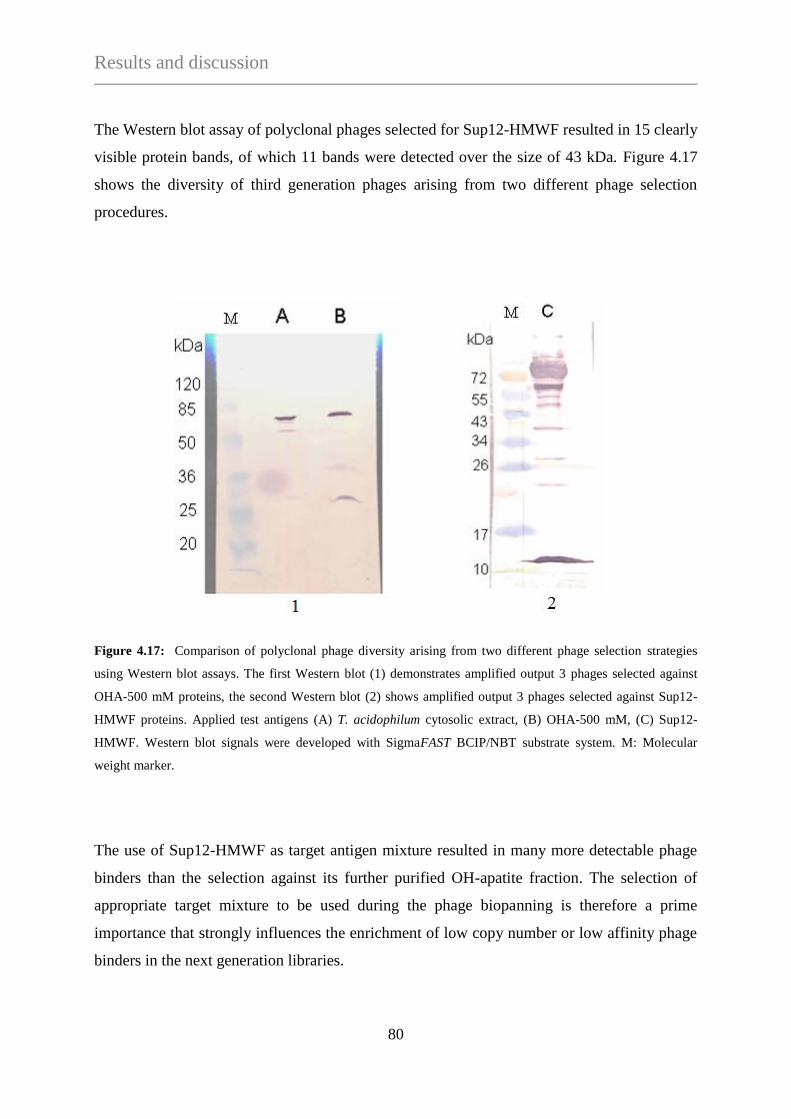
Results and discussion
80
The Western blot assay of polyclonal phages selected for Sup12-HMWF resulted in 15 clearly
visible protein bands, of which 11 bands were detected over the size of 43 kDa. Figure 4.17
shows the diversity of third generation phages arising from two different phage selection
procedures.
Figure 4.17: Comparison of polyclonal phage diversity arising from two different phage selection strategies
using Western blot assays. The first Western blot (1) demonstrates amplified output 3 phages selected against
OHA-500 mM proteins, the second Western blot (2) shows amplified output 3 phages selected against Sup12-
HMWF proteins. Applied test antigens (A) T. acidophilum cytosolic extract, (B) OHA-500 mM, (C) Sup12-
HMWF. Western blot signals were developed with SigmaFAST BCIP/NBT substrate system. M: Molecular
weight marker.
The use of Sup12-HMWF as target antigen mixture resulted in many more detectable phage
binders than the selection against its further purified OH-apatite fraction. The selection of
appropriate target mixture to be used during the phage biopanning is therefore a prime
importance that strongly influences the enrichment of low copy number or low affinity phage
binders in the next generation libraries.
Results and discussion
81
4.2.2.2 Phage selection against low abundant complexes combined with de-selections against
abundant complexes
To increase the diversity of our scFv libraries, de-selection steps against abundant protein
complexes were introduced. The de-selection approach is a library clean-up approach, in
which the third phage selection cycle is followed by further biopanning steps using purified
antigens to remove their binders in order to facilitate the discovery of scFvs against other
complexes.
De-selection of phages against recombinant thermosome and proteasome
Sup12-HMWF-selected and amplified output 3 phages were used as phage input for the de-
selection assay (corresponding Western blot assay of phages see in Figure 4.17 of 4.2.2.1).
Immunotubes were coated with 4 ml of 100 µg/ml protein mixture diluted in PBS. The protein
mixture contained 40 % α-proteasome, 30 % α-thermosome and 30 % ß-thermosome. Tubes
were incubated, blocked and washed according to the standard protocol and filled with 4 ml
PBS containing 100 μl purified phage solution. Tubes were incubated with the phages for 1.5
h at RT. Output phages (output phage 4) were added to 11 ml of exponentially growing TG1
cells and incubated at 37°C for 30 minutes. The infected cells were grown ON at 30°C,
counted, and collected. The de-selection process was repeated again as described with minor
modifications: after incubation with target antigens, 2 ml of the output phage solution (output
phage 5) was added to 10 ml exponentially growing TG1 cells. The rest of phages was mixed
with 15% glycerol and stored at -80°C. The infected cells were grown ON at 30°C, counted
and collected.
The de-selections yielded 7.5 x 10¹⁰
CFU/ml of output phage 4 and 1.4 x 10¹⁰
CFU/ml of
output phage 5. Since the input phage mixture contained 8 x 10¹²
CFU/ml of phages, this
meant a ~102 fold decrease of phage number in each de-selection cycle.
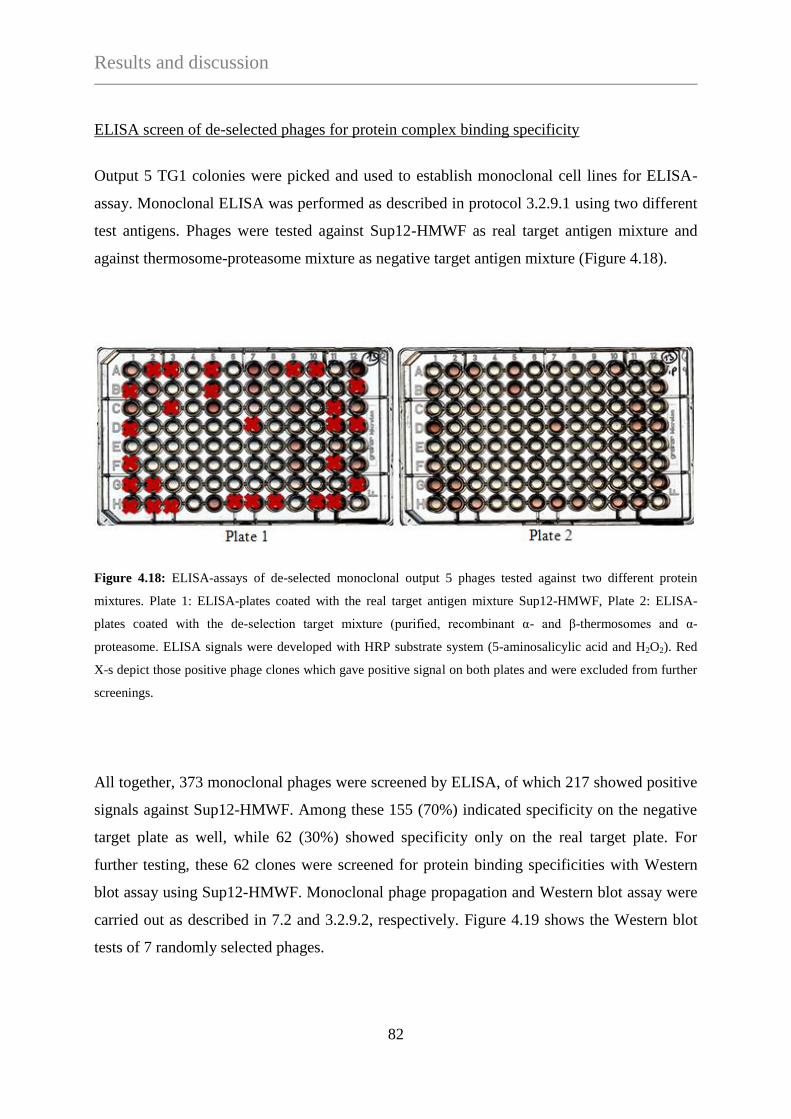
Results and discussion
82
ELISA screen of de-selected phages for protein complex binding specificity
Output 5 TG1 colonies were picked and used to establish monoclonal cell lines for ELISA-
assay. Monoclonal ELISA was performed as described in protocol 3.2.9.1 using two different
test antigens. Phages were tested against Sup12-HMWF as real target antigen mixture and
against thermosome-proteasome mixture as negative target antigen mixture (Figure 4.18).
Figure 4.18: ELISA-assays of de-selected monoclonal output 5 phages tested against two different protein
mixtures. Plate 1: ELISA-plates coated with the real target antigen mixture Sup12-HMWF, Plate 2: ELISA-
plates coated with the de-selection target mixture (purified, recombinant α- and β-thermosomes and α-
proteasome. ELISA signals were developed with HRP substrate system (5-aminosalicylic acid and H2O2). Red
X-s depict those positive phage clones which gave positive signal on both plates and were excluded from further
screenings.
All together, 373 monoclonal phages were screened by ELISA, of which 217 showed positive
signals against Sup12-HMWF. Among these 155 (70%) indicated specificity on the negative
target plate as well, while 62 (30%) showed specificity only on the real target plate. For
further testing, these 62 clones were screened for protein binding specificities with Western
blot assay using Sup12-HMWF. Monoclonal phage propagation and Western blot assay were
carried out as described in 7.2 and 3.2.9.2, respectively. Figure 4.19 shows the Western blot
tests of 7 randomly selected phages.
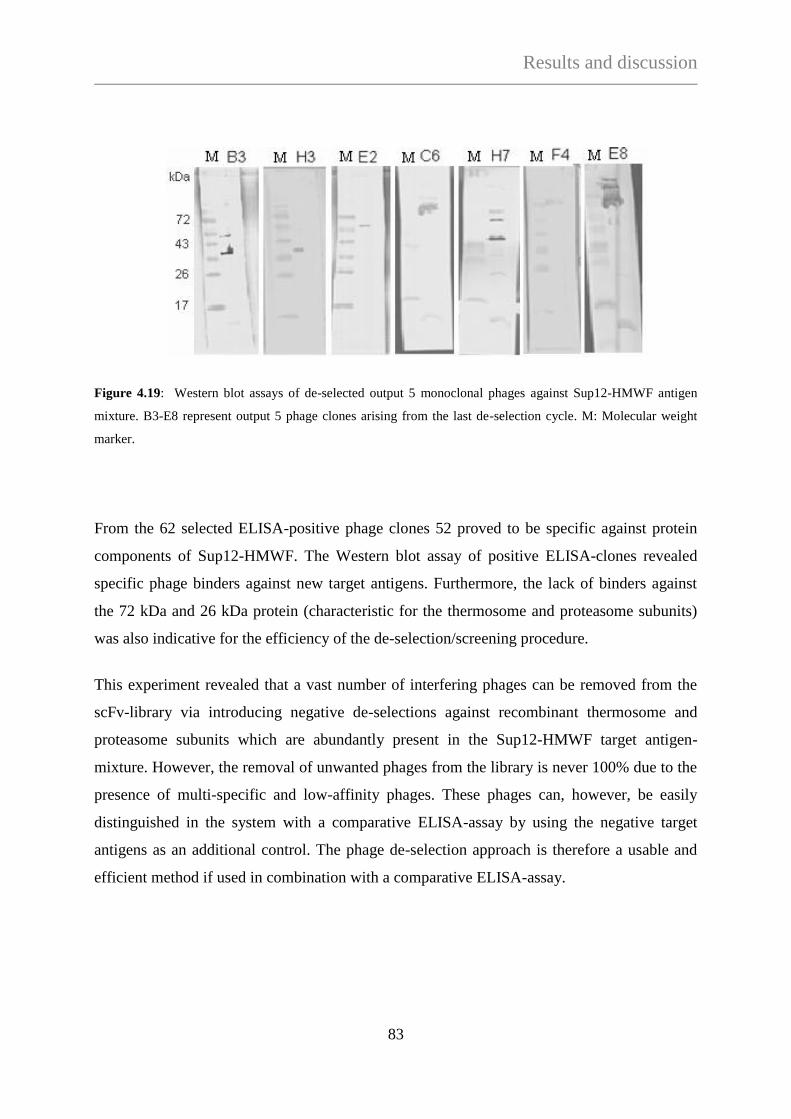
Results and discussion
83
Figure 4.19: Western blot assays of de-selected output 5 monoclonal phages against Sup12-HMWF antigen
mixture. B3-E8 represent output 5 phage clones arising from the last de-selection cycle. M: Molecular weight
marker.
From the 62 selected ELISA-positive phage clones 52 proved to be specific against protein
components of Sup12-HMWF. The Western blot assay of positive ELISA-clones revealed
specific phage binders against new target antigens. Furthermore, the lack of binders against
the 72 kDa and 26 kDa protein (characteristic for the thermosome and proteasome subunits)
was also indicative for the efficiency of the de-selection/screening procedure.
This experiment revealed that a vast number of interfering phages can be removed from the
scFv-library via introducing negative de-selections against recombinant thermosome and
proteasome subunits which are abundantly present in the Sup12-HMWF target antigen-
mixture. However, the removal of unwanted phages from the library is never 100% due to the
presence of multi-specific and low-affinity phages. These phages can, however, be easily
distinguished in the system with a comparative ELISA-assay by using the negative target
antigens as an additional control. The phage de-selection approach is therefore a usable and
efficient method if used in combination with a comparative ELISA-assay.
Results and discussion
84
Cloning and heterologous expression of de-selected scFvs
In the next steps, 26 scFv clones were selected to be tested for soluble His-scFv expression in
E. coli BL21(DE3) cells. The cloning of scFv inserts was carried out as already described
(4.2.1.3). Surprisingly, the digestion of pCANTAB 5E-scFv DNAs produced an additional
DNA fragment at 500 bp besides the 750 bp scFv fragment in 70% of the clones. These
constructs were sequenced to ascertain proper scFv coding frames. However, the sequence
analysis of each clone failed due to unidentified reasons. It could originate from mixed
sequences in the DNA template, which can occur due to multiple priming sites, frame-shift
mutations or slippage due to homo-polymer or repeat regions in the template. In spite of this,
SfiI-NotI-digested 750 bp long fragments were excised from the agarose gel and cloned into
pET28(SfiI), but despite of successful cloning, the sequence analyses failed again. As small
scale expressions did not result any His-tagged scFvs these kinds of experiments were
terminated.
Results and discussion
85
4.3 Protein complex purification with scFvs selected against recombinant T.
acidophilum proteins
A set of target proteins - putative building blocks of probable protein complexes like Ta0202
(iron ABC transporter, ATP-binding protein), Ta0316 (putative ATP-ase, twitching mobility
releated protein), Ta0326-27-28-29 (subunits of a putative, cytosolic fixABCX complex)
Ta1073 (5’-diphosphate-sulfoquinovose synthase (SQD1) homolog protein), Ta1194
(phosphopantetheine adenylyltransferase), Ta1315 (ribulose-phosphate 3-epimerase), Ta1435-
36-37-38 (subunits of the 2-oxoacid dehydrogenase complex) and Ta1488 (hypothetical
protein COG coiled coil) (3, 11)- were heterologously expressed. The applied vectors,
expression strains and the corresponding expression conditions of the respective recombinant
targets are listed in table 7.2 of 7.9. The 15% SDS-PAGE analysis of protein expression
profiles is shown in Figure 7.5 of 7.6.
4.3.1 Phage selection against recombinant targets
The conventional phage selection procedure (7.2) was used to select scFv-displaying phages
for different implementations. The biopanning assays were carried out on plastic-immobilized
surface and the type and amount of phage inputs, the number of selection cycles, the
incubation/washing conditions and the target antigens were varied.
4.3.1.1 Phage selection against Ta0316, Ta1194, Ta1315 and Ta1435-38
Biopanning assays were carried out using Ta0316, Ta1194, Ta1315 and the co-expressed
subunits of the Ta1435-36-37-38 complex as antigens. The recombinant proteins were
expressed as described (Table 7.2 of 7.9), and purified by large-scale IMAC affinity
chromatography according to protocol 3.2.7.1.
Results and discussion
86
Phage biopanning and screening against Ta0316, Ta1194 and Ta1435-38
Output 3 phages (4.2.2.1) were used as phage input in biopanning experiments. IMAC-
purified recombinant protein fractions were pooled and diluted to 100 μg/μl concentration in
PBS and used to coat immuno-tubes (1 tube/protein). The biopanning procedure was carried
out as described in 7.2 with minor modifications, as follows: 400 μl amplified output 3 phages
was used for the phage selection and 5 washing steps were applied with PBST and PBS,
respectively. Only one selection cycle was performed on the plastic-immobilized recombinant
antigens to test panning output. Colonies were obtained from each output which were
collected and stored as output stocks. The obtained output phages (8 x 10⁴ CFU/ml) were
immediately used for Western blot analysis to check protein specificity. Western blot assays
were performed as described (3.2.9.2) using the corresponding recombinant proteins as test
antigens.
The Western blot assay did not indicate any positive phage binder probably due to the low
phage concentration in the incubation mixture (1.6 X 10⁴ CFU/ml). The number of phages in
the panning output can be influenced by different factors like the purity and concentration of
the target antigen, the binding affinity to the target and the number of phages applied in the
panning procedure. In our case the reason of the radical decrease in the phage output number
could also be that the applied input phage solution was previously selected against a number
of different protein targets and not against a defined one. If those phages, which are specific
for the corresponding target proteins are under-represented in the input mixture, further
biopanning cycles must be considered. On the other hand, the sensitivity of Western blot
assay has also to be taken into account while evaluating signal intensities. Since the number
of phage particles in the output mixture is always less then in the input phage solution, output
phages must be amplified prior to Western blot assays in order to maximize the number of
potential phage binders. The fact that the panning output yielded 4 x 10⁴
fold less CFU/ml
then the output CFU obtained after the previous selection cycle (4 x 10⁸, see 4.2.2.1) is also an
explanation for the poor signal intensities.
To screen for positive binders among the output phages, colonies from the panning output
plates obtained after Ta1194 and Ta1315 selection were picked and used to create monoclonal
cell lines. Furthermore, phages were also tested against Sup12-HMWF as a second test
antigen. Surprisingly, no positive signal occurred on either of the test plates containing the
Results and discussion
87
recombinant proteins, however, a certain number of positive binders were obtained on both
plates coated with Sup12-HMWF (see supplementary data 7.4, ELISA plate 1-2). Although
some phages proved to be specific for either of the target proteins in this target mixture, the
lack of signals on the recombinant target plates indicated an unsatisfactory selection
procedure against these targets.
Another critical point of this selection approach was the use of low expression level and/or
unstable recombinant proteins. The selected recombinant candidates (Ta1315, Ta1194)
showed a strong tendency to precipitate shortly after purification. This is especially crucial, if
the protein is expressed recombinantly at an extremely low level (Ta1073). The proteins were
therefore used in a fresh, affinity purified form for the coating of immuno-tubes to reduce
storage time. However, proteins already started to precipitate prior to the ELISA assay, which
resulted in less properly folded target antigen. Taking into account that the three biopanning
steps and the additional ELISA screening requires a minimum of 7 days and the application of
freshly purified protein sample for the coating procedure is not always feasible, we focused on
more stable targets.
4.3.1.2 Phage selection against Ta1488
The next recombinant antigen used for the affinity selection of phages was the 35 kDa
putative intermedier filament Ta1488. This protein proved to be stable in a wide temperature
range and is expressed recombinantly at extremely high level. The 15% SDS-PAGE analysis
of Ta1488 heat treatment is shown in Figure 7.4 of 7.6. The protein purity obtained after
IMAC-chromatography was more than 90% and the concentrated protein stock showed no
precipitation tendency even after several week storage at 4°C.
Phage biopanning and screening against Ta1488
The biopanning of scFv-displaying phages was carried out as described in 7.2 with minor
modifications, as follows: 100 μl of output 5 phages (4.2.2.2) and 100 μl of amplified output 3
phages (4.2.2.1) were used as input phage mixtures. Two immuno-tubes were coated with 50
μg/ml affinity purified Ta1488 and used as panning target for both phage inputs. After one
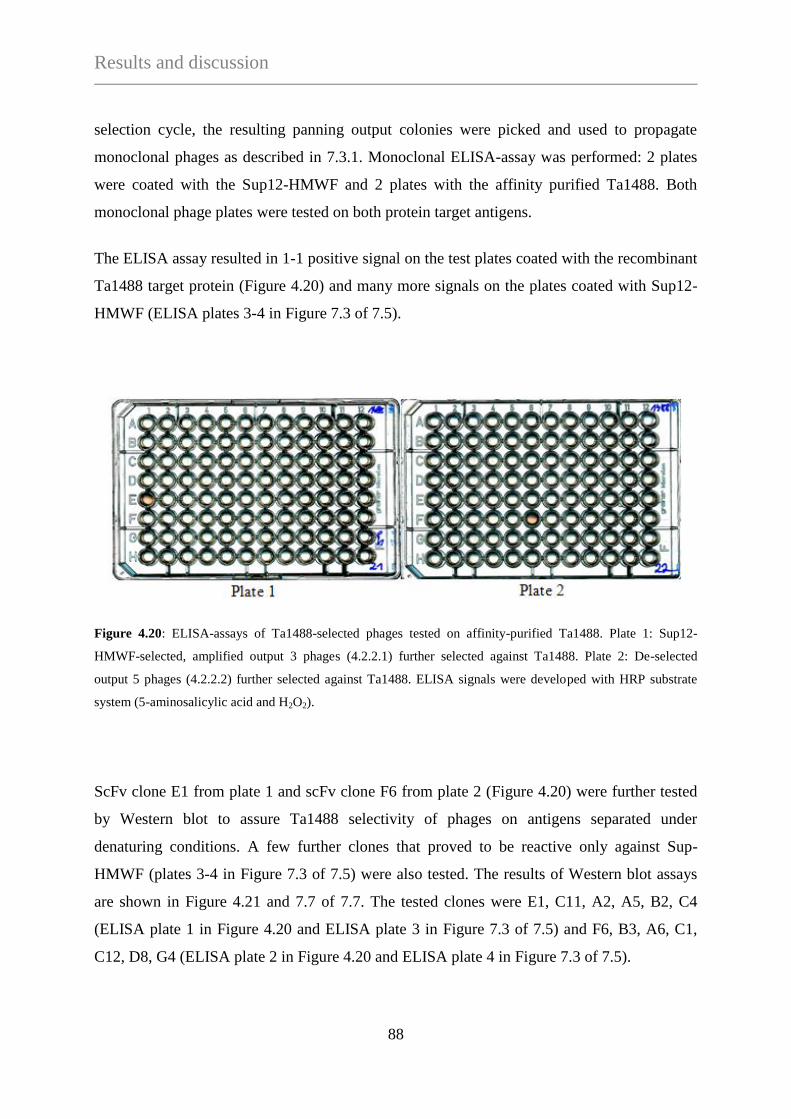
Results and discussion
88
selection cycle, the resulting panning output colonies were picked and used to propagate
monoclonal phages as described in 7.3.1. Monoclonal ELISA-assay was performed: 2 plates
were coated with the Sup12-HMWF and 2 plates with the affinity purified Ta1488. Both
monoclonal phage plates were tested on both protein target antigens.
The ELISA assay resulted in 1-1 positive signal on the test plates coated with the recombinant
Ta1488 target protein (Figure 4.20) and many more signals on the plates coated with Sup12-
HMWF (ELISA plates 3-4 in Figure 7.3 of 7.5).
Figure 4.20: ELISA-assays of Ta1488-selected phages tested on affinity-purified Ta1488. Plate 1: Sup12-
HMWF-selected, amplified output 3 phages (4.2.2.1) further selected against Ta1488. Plate 2: De-selected
output 5 phages (4.2.2.2) further selected against Ta1488. ELISA signals were developed with HRP substrate
system (5-aminosalicylic acid and H2O2).
ScFv clone E1 from plate 1 and scFv clone F6 from plate 2 (Figure 4.20) were further tested
by Western blot to assure Ta1488 selectivity of phages on antigens separated under
denaturing conditions. A few further clones that proved to be reactive only against Sup-
HMWF (plates 3-4 in Figure 7.3 of 7.5) were also tested. The results of Western blot assays
are shown in Figure 4.21 and 7.7 of 7.7. The tested clones were E1, C11, A2, A5, B2, C4
(ELISA plate 1 in Figure 4.20 and ELISA plate 3 in Figure 7.3 of 7.5) and F6, B3, A6, C1,
C12, D8, G4 (ELISA plate 2 in Figure 4.20 and ELISA plate 4 in Figure 7.3 of 7.5).
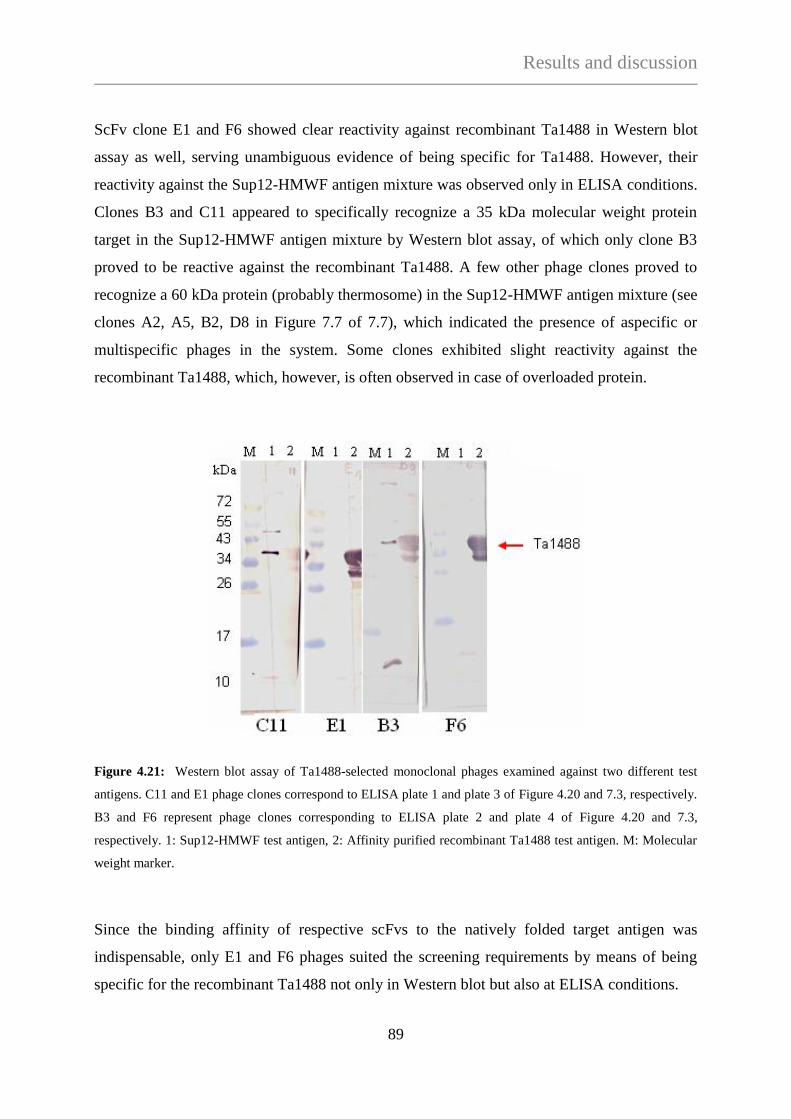
Results and discussion
89
ScFv clone E1 and F6 showed clear reactivity against recombinant Ta1488 in Western blot
assay as well, serving unambiguous evidence of being specific for Ta1488. However, their
reactivity against the Sup12-HMWF antigen mixture was observed only in ELISA conditions.
Clones B3 and C11 appeared to specifically recognize a 35 kDa molecular weight protein
target in the Sup12-HMWF antigen mixture by Western blot assay, of which only clone B3
proved to be reactive against the recombinant Ta1488. A few other phage clones proved to
recognize a 60 kDa protein (probably thermosome) in the Sup12-HMWF antigen mixture (see
clones A2, A5, B2, D8 in Figure 7.7 of 7.7), which indicated the presence of aspecific or
multispecific phages in the system. Some clones exhibited slight reactivity against the
recombinant Ta1488, which, however, is often observed in case of overloaded protein.
Figure 4.21: Western blot assay of Ta1488-selected monoclonal phages examined against two different test
antigens. C11 and E1 phage clones correspond to ELISA plate 1 and plate 3 of Figure 4.20 and 7.3, respectively.
B3 and F6 represent phage clones corresponding to ELISA plate 2 and plate 4 of Figure 4.20 and 7.3,
respectively. 1: Sup12-HMWF test antigen, 2: Affinity purified recombinant Ta1488 test antigen. M: Molecular
weight marker.
Since the binding affinity of respective scFvs to the natively folded target antigen was
indispensable, only E1 and F6 phages suited the screening requirements by means of being
specific for the recombinant Ta1488 not only in Western blot but also at ELISA conditions.
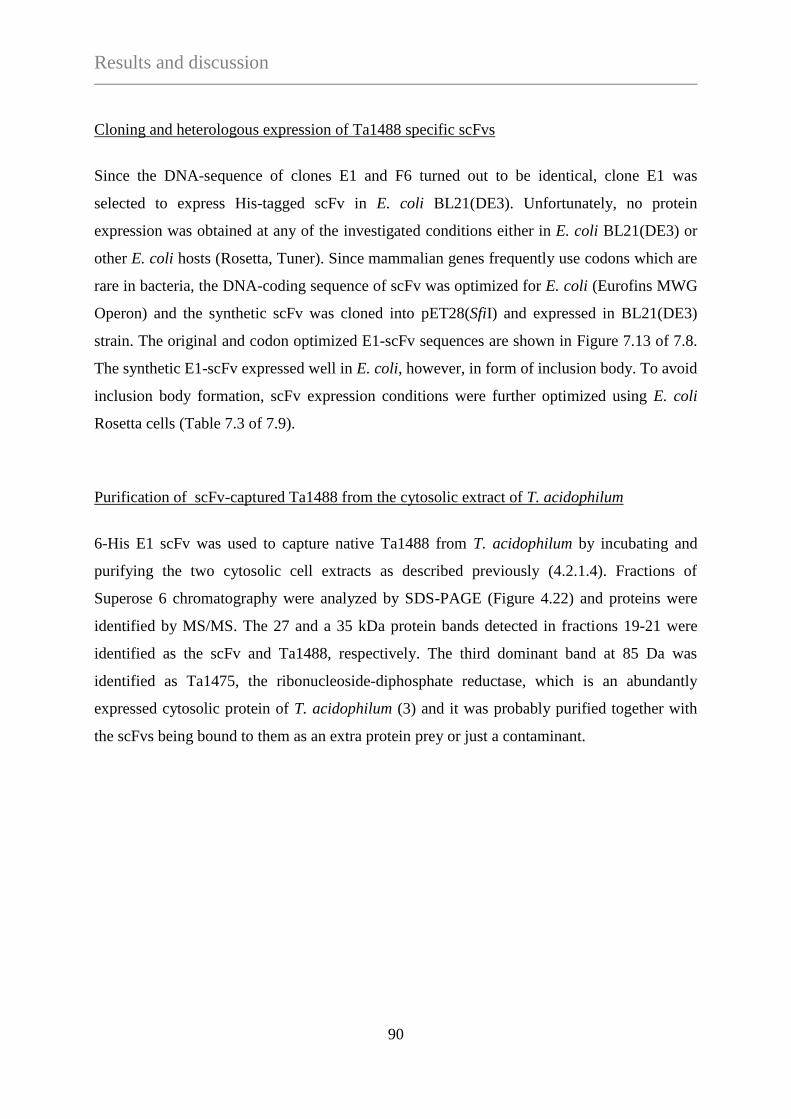
Results and discussion
90
Cloning and heterologous expression of Ta1488 specific scFvs
Since the DNA-sequence of clones E1 and F6 turned out to be identical, clone E1 was
selected to express His-tagged scFv in E. coli BL21(DE3). Unfortunately, no protein
expression was obtained at any of the investigated conditions either in E. coli BL21(DE3) or
other E. coli hosts (Rosetta, Tuner). Since mammalian genes frequently use codons which are
rare in bacteria, the DNA-coding sequence of scFv was optimized for E. coli (Eurofins MWG
Operon) and the synthetic scFv was cloned into pET28(SfiI) and expressed in BL21(DE3)
strain. The original and codon optimized E1-scFv sequences are shown in Figure 7.13 of 7.8.
The synthetic E1-scFv expressed well in E. coli, however, in form of inclusion body. To avoid
inclusion body formation, scFv expression conditions were further optimized using E. coli
Rosetta cells (Table 7.3 of 7.9).
Purification of scFv-captured Ta1488 from the cytosolic extract of T. acidophilum
6-His E1 scFv was used to capture native Ta1488 from T. acidophilum by incubating and
purifying the two cytosolic cell extracts as described previously (4.2.1.4). Fractions of
Superose 6 chromatography were analyzed by SDS-PAGE (Figure 4.22) and proteins were
identified by MS/MS. The 27 and a 35 kDa protein bands detected in fractions 19-21 were
identified as the scFv and Ta1488, respectively. The third dominant band at 85 Da was
identified as Ta1475, the ribonucleoside-diphosphate reductase, which is an abundantly
expressed cytosolic protein of T. acidophilum (3) and it was probably purified together with
the scFvs being bound to them as an extra protein prey or just a contaminant.
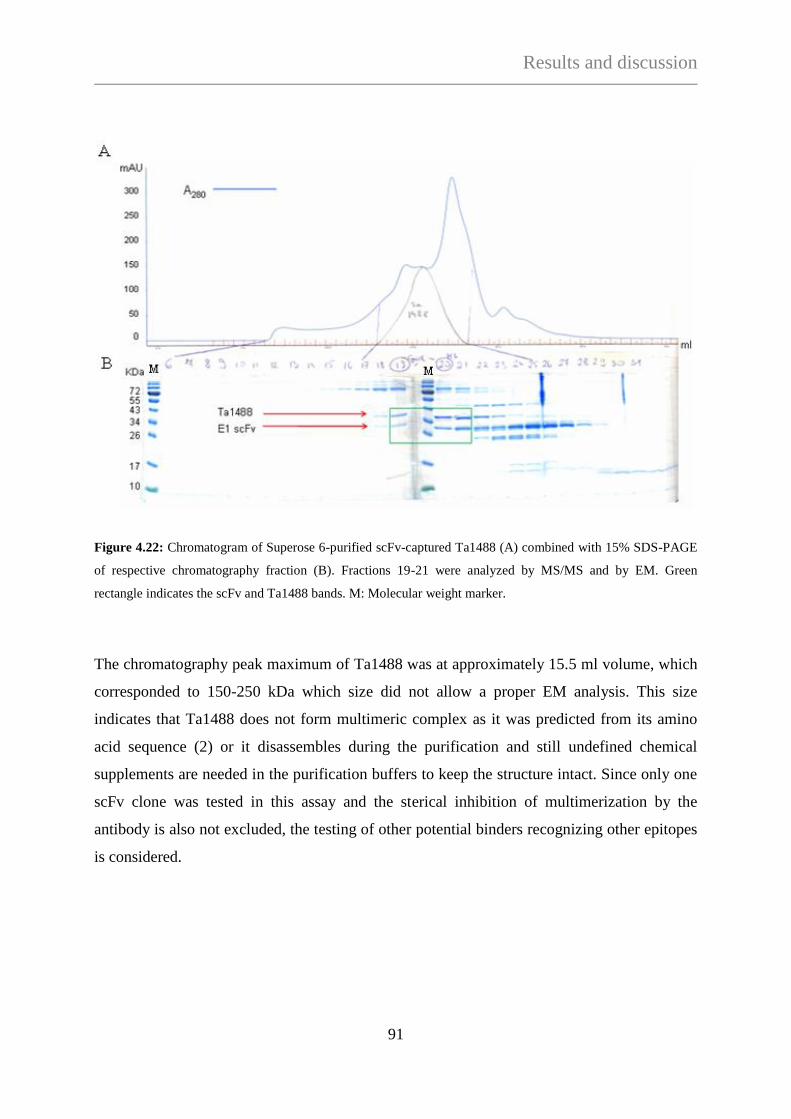
Results and discussion
91
Figure 4.22: Chromatogram of Superose 6-purified scFv-captured Ta1488 (A) combined with 15% SDS-PAGE
of respective chromatography fraction (B). Fractions 19-21 were analyzed by MS/MS and by EM. Green
rectangle indicates the scFv and Ta1488 bands. M: Molecular weight marker.
The chromatography peak maximum of Ta1488 was at approximately 15.5 ml volume, which
corresponded to 150-250 kDa which size did not allow a proper EM analysis. This size
indicates that Ta1488 does not form multimeric complex as it was predicted from its amino
acid sequence (2) or it disassembles during the purification and still undefined chemical
supplements are needed in the purification buffers to keep the structure intact. Since only one
scFv clone was tested in this assay and the sterical inhibition of multimerization by the
antibody is also not excluded, the testing of other potential binders recognizing other epitopes
is considered.
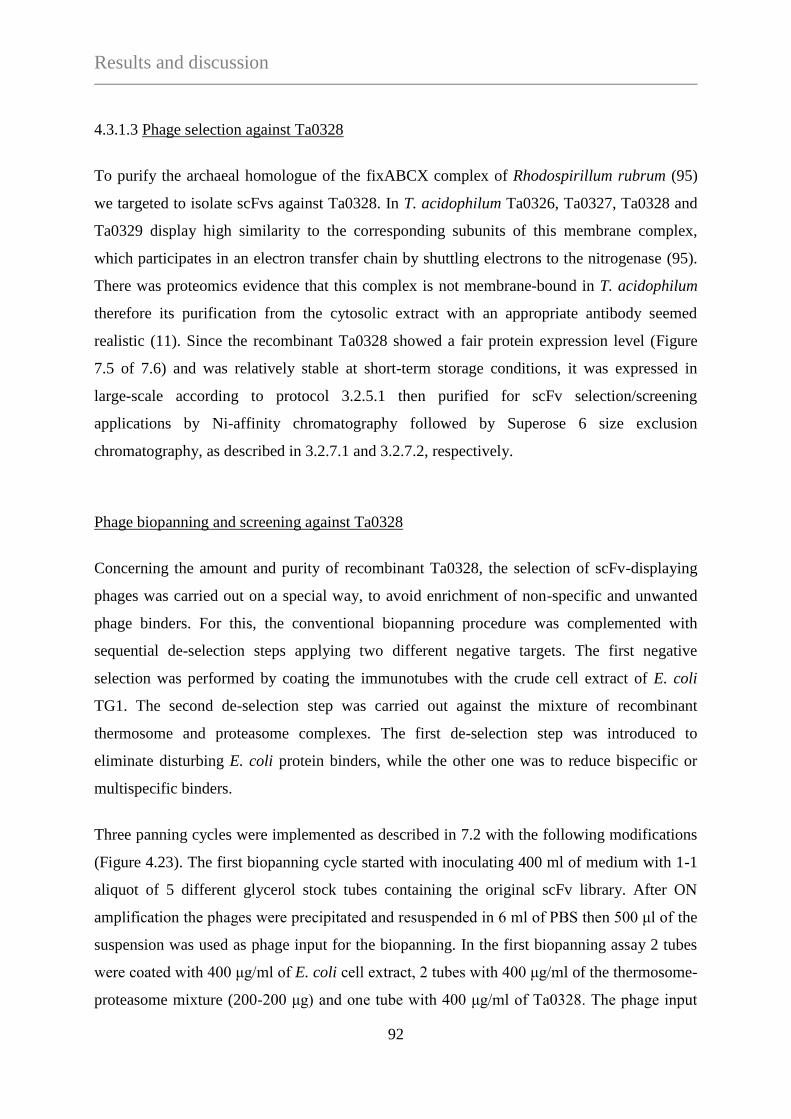
Results and discussion
92
4.3.1.3 Phage selection against Ta0328
To purify the archaeal homologue of the fixABCX complex of Rhodospirillum rubrum (95)
we targeted to isolate scFvs against Ta0328. In T. acidophilum Ta0326, Ta0327, Ta0328 and
Ta0329 display high similarity to the corresponding subunits of this membrane complex,
which participates in an electron transfer chain by shuttling electrons to the nitrogenase (95).
There was proteomics evidence that this complex is not membrane-bound in T. acidophilum
therefore its purification from the cytosolic extract with an appropriate antibody seemed
realistic (11). Since the recombinant Ta0328 showed a fair protein expression level (Figure
7.5 of 7.6) and was relatively stable at short-term storage conditions, it was expressed in
large-scale according to protocol 3.2.5.1 then purified for scFv selection/screening
applications by Ni-affinity chromatography followed by Superose 6 size exclusion
chromatography, as described in 3.2.7.1 and 3.2.7.2, respectively.
Phage biopanning and screening against Ta0328
Concerning the amount and purity of recombinant Ta0328, the selection of scFv-displaying
phages was carried out on a special way, to avoid enrichment of non-specific and unwanted
phage binders. For this, the conventional biopanning procedure was complemented with
sequential de-selection steps applying two different negative targets. The first negative
selection was performed by coating the immunotubes with the crude cell extract of E. coli
TG1. The second de-selection step was carried out against the mixture of recombinant
thermosome and proteasome complexes. The first de-selection step was introduced to
eliminate disturbing E. coli protein binders, while the other one was to reduce bispecific or
multispecific binders.
Three panning cycles were implemented as described in 7.2 with the following modifications
(Figure 4.23). The first biopanning cycle started with inoculating 400 ml of medium with 1-1
aliquot of 5 different glycerol stock tubes containing the original scFv library. After ON
amplification the phages were precipitated and resuspended in 6 ml of PBS then 500 μl of the
suspension was used as phage input for the biopanning. In the first biopanning assay 2 tubes
were coated with 400 μg/ml of E. coli cell extract, 2 tubes with 400 μg/ml of the thermosome-
proteasome mixture (200-200 μg) and one tube with 400 μg/ml of Ta0328. The phage input
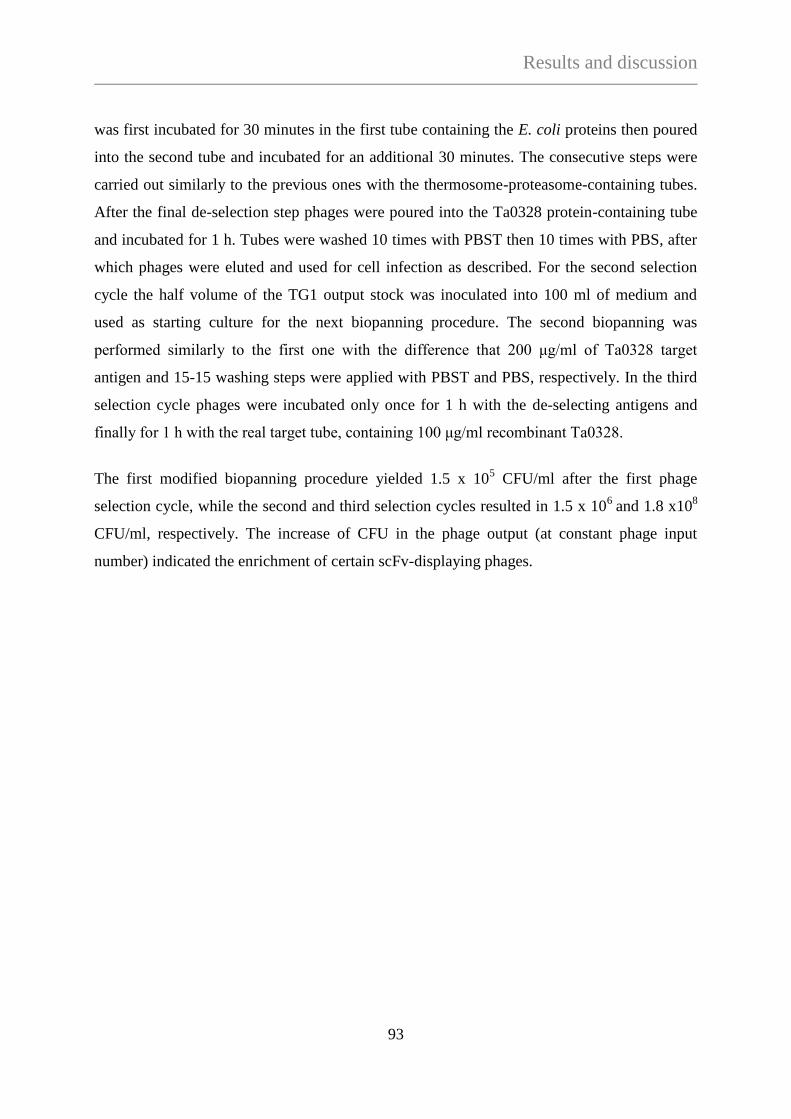
Results and discussion
93
was first incubated for 30 minutes in the first tube containing the E. coli proteins then poured
into the second tube and incubated for an additional 30 minutes. The consecutive steps were
carried out similarly to the previous ones with the thermosome-proteasome-containing tubes.
After the final de-selection step phages were poured into the Ta0328 protein-containing tube
and incubated for 1 h. Tubes were washed 10 times with PBST then 10 times with PBS, after
which phages were eluted and used for cell infection as described. For the second selection
cycle the half volume of the TG1 output stock was inoculated into 100 ml of medium and
used as starting culture for the next biopanning procedure. The second biopanning was
performed similarly to the first one with the difference that 200 μg/ml of Ta0328 target
antigen and 15-15 washing steps were applied with PBST and PBS, respectively. In the third
selection cycle phages were incubated only once for 1 h with the de-selecting antigens and
finally for 1 h with the real target tube, containing 100 μg/ml recombinant Ta0328.
The first modified biopanning procedure yielded 1.5 x 10⁵ CFU/ml after the first phage
selection cycle, while the second and third selection cycles resulted in 1.5 x 10⁶
and 1.8 x10⁸
CFU/ml, respectively. The increase of CFU in the phage output (at constant phage input
number) indicated the enrichment of certain scFv-displaying phages.
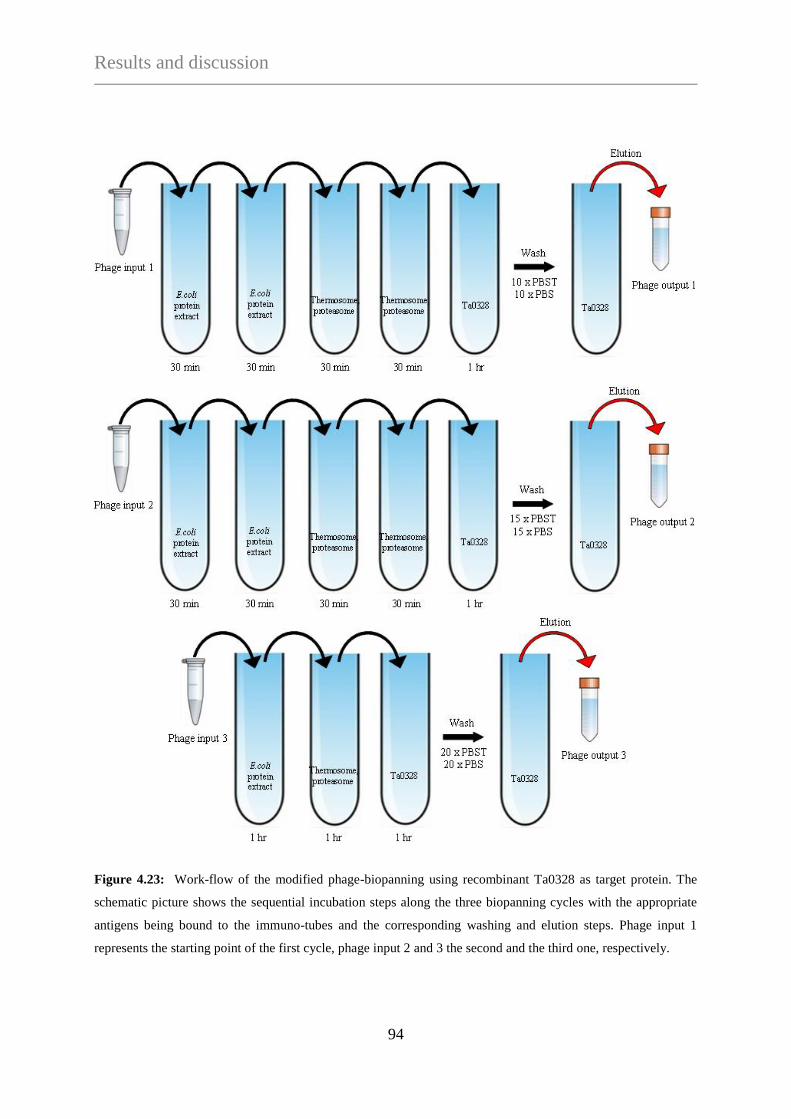
Results and discussion
94
Figure 4.23: Work-flow of the modified phage-biopanning using recombinant Ta0328 as target protein. The
schematic picture shows the sequential incubation steps along the three biopanning cycles with the appropriate
antigens being bound to the immuno-tubes and the corresponding washing and elution steps. Phage input 1
represents the starting point of the first cycle, phage input 2 and 3 the second and the third one, respectively.
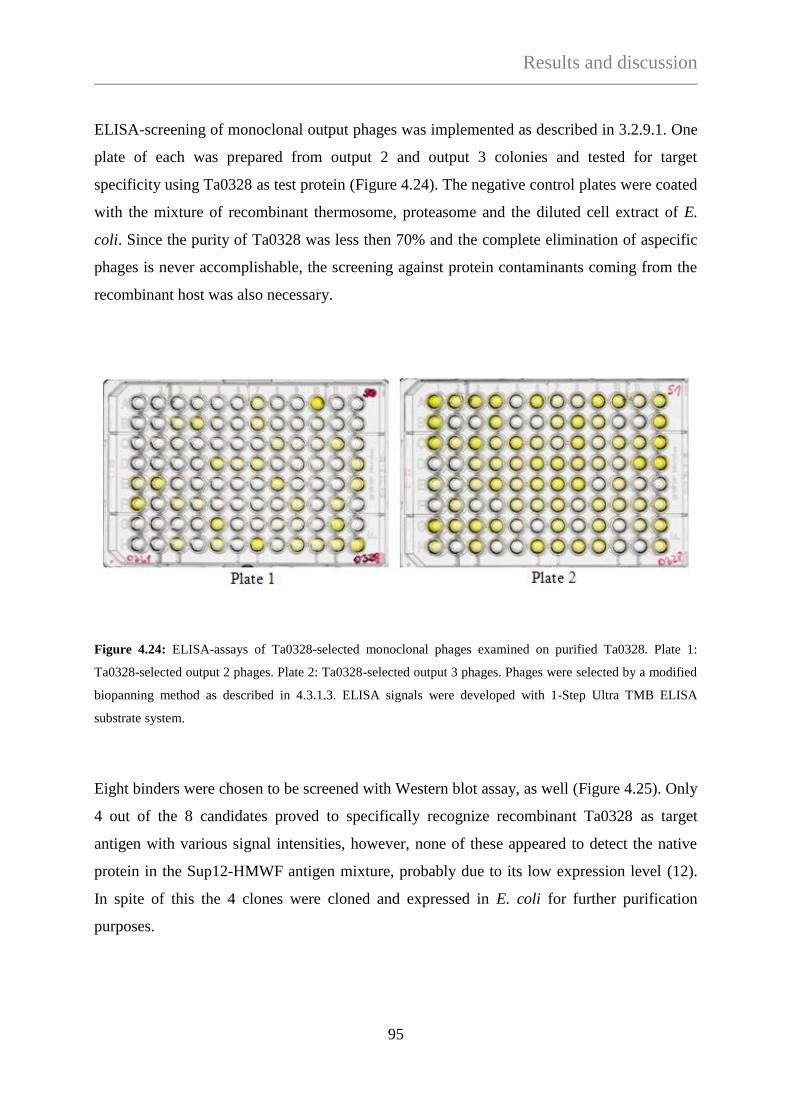
Results and discussion
95
ELISA-screening of monoclonal output phages was implemented as described in 3.2.9.1. One
plate of each was prepared from output 2 and output 3 colonies and tested for target
specificity using Ta0328 as test protein (Figure 4.24). The negative control plates were coated
with the mixture of recombinant thermosome, proteasome and the diluted cell extract of E.
coli. Since the purity of Ta0328 was less then 70% and the complete elimination of aspecific
phages is never accomplishable, the screening against protein contaminants coming from the
recombinant host was also necessary.
Figure 4.24: ELISA-assays of Ta0328-selected monoclonal phages examined on purified Ta0328. Plate 1:
Ta0328-selected output 2 phages. Plate 2: Ta0328-selected output 3 phages. Phages were selected by a modified
biopanning method as described in 4.3.1.3. ELISA signals were developed with 1-Step Ultra TMB ELISA
substrate system.
Eight binders were chosen to be screened with Western blot assay, as well (Figure 4.25). Only
4 out of the 8 candidates proved to specifically recognize recombinant Ta0328 as target
antigen with various signal intensities, however, none of these appeared to detect the native
protein in the Sup12-HMWF antigen mixture, probably due to its low expression level (12).
In spite of this the 4 clones were cloned and expressed in E. coli for further purification
purposes.
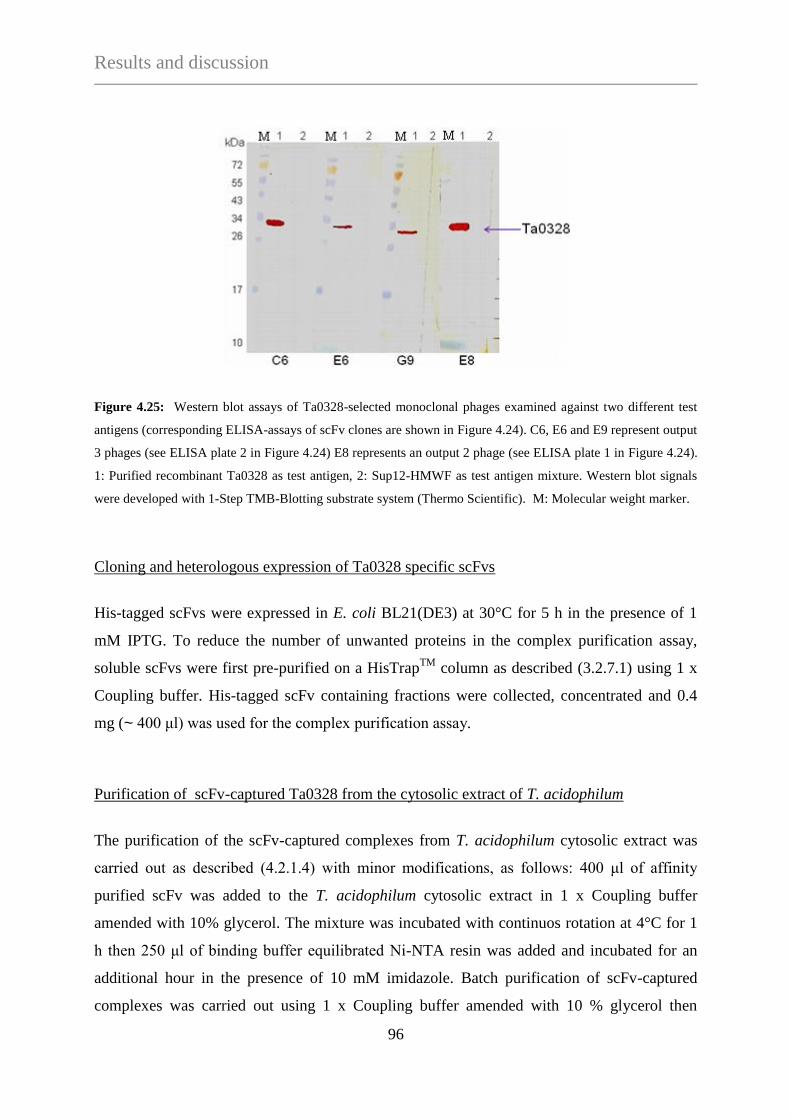
Results and discussion
96
Figure 4.25: Western blot assays of Ta0328-selected monoclonal phages examined against two different test
antigens (corresponding ELISA-assays of scFv clones are shown in Figure 4.24). C6, E6 and E9 represent output
3 phages (see ELISA plate 2 in Figure 4.24) E8 represents an output 2 phage (see ELISA plate 1 in Figure 4.24).
1: Purified recombinant Ta0328 as test antigen, 2: Sup12-HMWF as test antigen mixture. Western blot signals
were developed with 1-Step TMB-Blotting substrate system (Thermo Scientific). M: Molecular weight marker.
Cloning and heterologous expression of Ta0328 specific scFvs
His-tagged scFvs were expressed in E. coli BL21(DE3) at 30°C for 5 h in the presence of 1
mM IPTG. To reduce the number of unwanted proteins in the complex purification assay,
soluble scFvs were first pre-purified on a HisTrapTM
column as described (3.2.7.1) using 1 x
Coupling buffer. His-tagged scFv containing fractions were collected, concentrated and 0.4
mg (~ 400 μl) was used for the complex purification assay.
Purification of scFv-captured Ta0328 from the cytosolic extract of T. acidophilum
The purification of the scFv-captured complexes from T. acidophilum cytosolic extract was
carried out as described (4.2.1.4) with minor modifications, as follows: 400 μl of affinity
purified scFv was added to the T. acidophilum cytosolic extract in 1 x Coupling buffer
amended with 10% glycerol. The mixture was incubated with continuos rotation at 4°C for 1
h then 250 μl of binding buffer equilibrated Ni-NTA resin was added and incubated for an
additional hour in the presence of 10 mM imidazole. Batch purification of scFv-captured
complexes was carried out using 1 x Coupling buffer amended with 10 % glycerol then
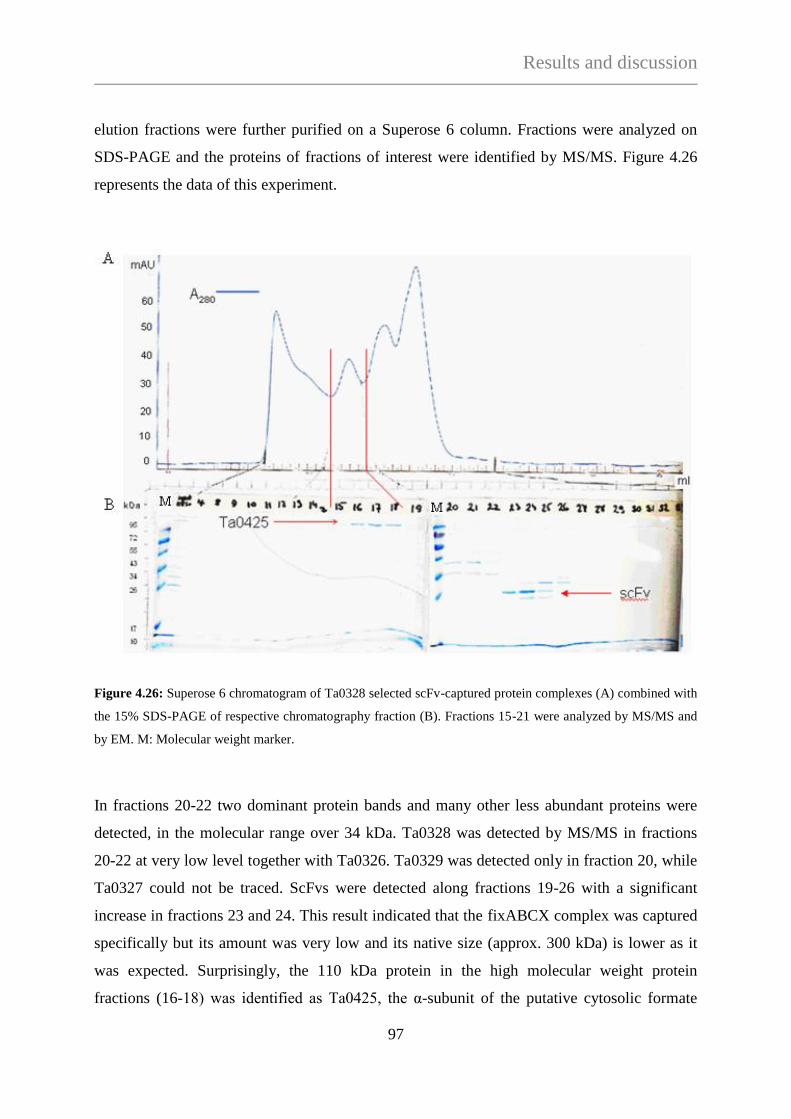
Results and discussion
97
elution fractions were further purified on a Superose 6 column. Fractions were analyzed on
SDS-PAGE and the proteins of fractions of interest were identified by MS/MS. Figure 4.26
represents the data of this experiment.
Figure 4.26: Superose 6 chromatogram of Ta0328 selected scFv-captured protein complexes (A) combined with
the 15% SDS-PAGE of respective chromatography fraction (B). Fractions 15-21 were analyzed by MS/MS and
by EM. M: Molecular weight marker.
In fractions 20-22 two dominant protein bands and many other less abundant proteins were
detected, in the molecular range over 34 kDa. Ta0328 was detected by MS/MS in fractions
20-22 at very low level together with Ta0326. Ta0329 was detected only in fraction 20, while
Ta0327 could not be traced. ScFvs were detected along fractions 19-26 with a significant
increase in fractions 23 and 24. This result indicated that the fixABCX complex was captured
specifically but its amount was very low and its native size (approx. 300 kDa) is lower as it
was expected. Surprisingly, the 110 kDa protein in the high molecular weight protein
fractions (16-18) was identified as Ta0425, the α-subunit of the putative cytosolic formate
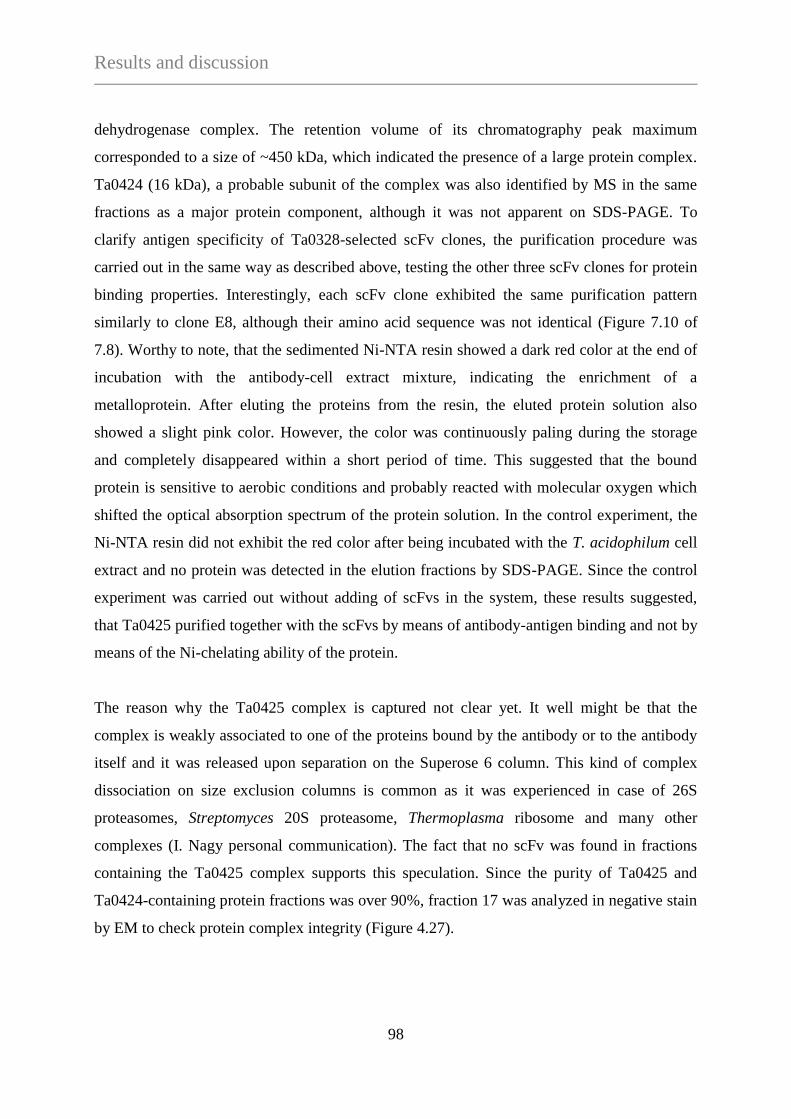
Results and discussion
98
dehydrogenase complex. The retention volume of its chromatography peak maximum
corresponded to a size of ~450 kDa, which indicated the presence of a large protein complex.
Ta0424 (16 kDa), a probable subunit of the complex was also identified by MS in the same
fractions as a major protein component, although it was not apparent on SDS-PAGE. To
clarify antigen specificity of Ta0328-selected scFv clones, the purification procedure was
carried out in the same way as described above, testing the other three scFv clones for protein
binding properties. Interestingly, each scFv clone exhibited the same purification pattern
similarly to clone E8, although their amino acid sequence was not identical (Figure 7.10 of
7.8). Worthy to note, that the sedimented Ni-NTA resin showed a dark red color at the end of
incubation with the antibody-cell extract mixture, indicating the enrichment of a
metalloprotein. After eluting the proteins from the resin, the eluted protein solution also
showed a slight pink color. However, the color was continuously paling during the storage
and completely disappeared within a short period of time. This suggested that the bound
protein is sensitive to aerobic conditions and probably reacted with molecular oxygen which
shifted the optical absorption spectrum of the protein solution. In the control experiment, the
Ni-NTA resin did not exhibit the red color after being incubated with the T. acidophilum cell
extract and no protein was detected in the elution fractions by SDS-PAGE. Since the control
experiment was carried out without adding of scFvs in the system, these results suggested,
that Ta0425 purified together with the scFvs by means of antibody-antigen binding and not by
means of the Ni-chelating ability of the protein.
The reason why the Ta0425 complex is captured not clear yet. It well might be that the
complex is weakly associated to one of the proteins bound by the antibody or to the antibody
itself and it was released upon separation on the Superose 6 column. This kind of complex
dissociation on size exclusion columns is common as it was experienced in case of 26S
proteasomes, Streptomyces 20S proteasome, Thermoplasma ribosome and many other
complexes (I. Nagy personal communication). The fact that no scFv was found in fractions
containing the Ta0425 complex supports this speculation. Since the purity of Ta0425 and
Ta0424-containing protein fractions was over 90%, fraction 17 was analyzed in negative stain
by EM to check protein complex integrity (Figure 4.27).
Results and discussion
99
Figure 4.27: Negatively stained electron micrograph of the Superose 6-purified putative formate-dehydrogenase
protein complex from fraction 17. Yellow scale bar corresponds to 100 nm. Red circles depict highly similar X-
like structures which are probable formate dehydrogenase particles.
Ta0425 is a structurally not characterized protein complex exhibiting high homology to
formate dehydrogenase H. Furthermore, Ta0425 showed significant homology to succinate
dehydrogenases and uncharacterized anaerobic dehydrogenases, as well (COG3383) (96). On
the gene level, the N-terminus of Ta0424 and the C-terminus of Ta0425 overlap by four
bases, indicating an operon structure. Since both proteins were detected in the same Superose
6 fractions it is very likely that Ta0424 and Ta0425 form a complex. The estimated molecular
mass of the protein is 450-500 kDa, which can be analyzed by cryo-EM. To substantiate the
roles and stoichiometry of subunits within the respective complex, detailed structural and
functional analyses are needed. Since recombinant expression of Ta0425 was not successful,
the purification of its native form from T. acidophilum with scFv will help to elucidate the
structure and function of this protein complex.
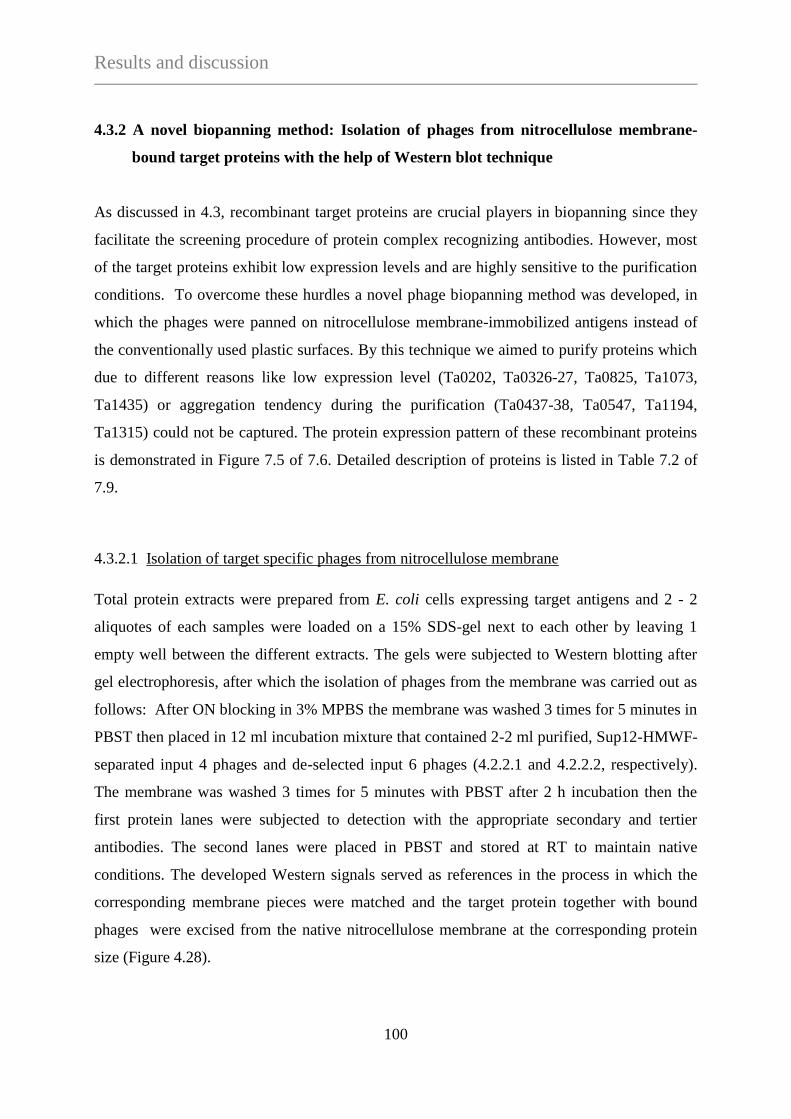
Results and discussion
100
4.3.2 A novel biopanning method: Isolation of phages from nitrocellulose membrane-
bound target proteins with the help of Western blot technique
As discussed in 4.3, recombinant target proteins are crucial players in biopanning since they
facilitate the screening procedure of protein complex recognizing antibodies. However, most
of the target proteins exhibit low expression levels and are highly sensitive to the purification
conditions. To overcome these hurdles a novel phage biopanning method was developed, in
which the phages were panned on nitrocellulose membrane-immobilized antigens instead of
the conventionally used plastic surfaces. By this technique we aimed to purify proteins which
due to different reasons like low expression level (Ta0202, Ta0326-27, Ta0825, Ta1073,
Ta1435) or aggregation tendency during the purification (Ta0437-38, Ta0547, Ta1194,
Ta1315) could not be captured. The protein expression pattern of these recombinant proteins
is demonstrated in Figure 7.5 of 7.6. Detailed description of proteins is listed in Table 7.2 of
7.9.
4.3.2.1 Isolation of target specific phages from nitrocellulose membrane
Total protein extracts were prepared from E. coli cells expressing target antigens and 2 - 2
aliquotes of each samples were loaded on a 15% SDS-gel next to each other by leaving 1
empty well between the different extracts. The gels were subjected to Western blotting after
gel electrophoresis, after which the isolation of phages from the membrane was carried out as
follows: After ON blocking in 3% MPBS the membrane was washed 3 times for 5 minutes in
PBST then placed in 12 ml incubation mixture that contained 2-2 ml purified, Sup12-HMWF-
separated input 4 phages and de-selected input 6 phages (4.2.2.1 and 4.2.2.2, respectively).
The membrane was washed 3 times for 5 minutes with PBST after 2 h incubation then the
first protein lanes were subjected to detection with the appropriate secondary and tertier
antibodies. The second lanes were placed in PBST and stored at RT to maintain native
conditions. The developed Western signals served as references in the process in which the
corresponding membrane pieces were matched and the target protein together with bound
phages were excised from the native nitrocellulose membrane at the corresponding protein
size (Figure 4.28).
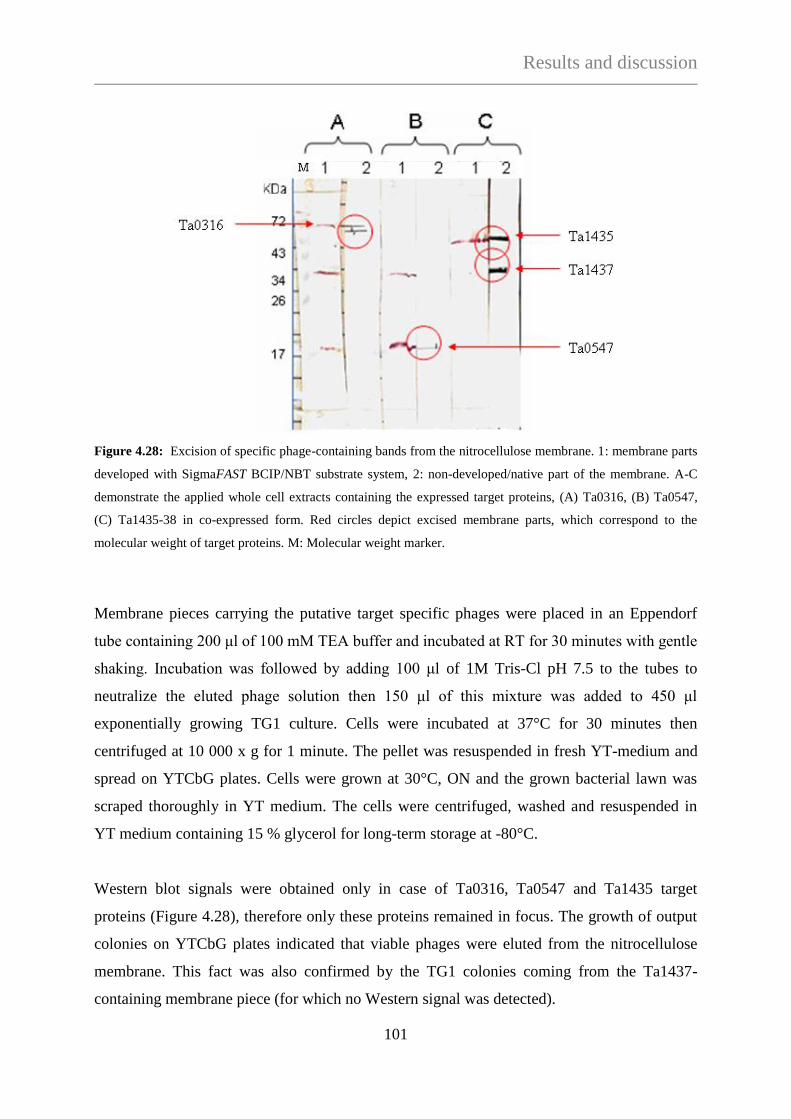
Results and discussion
101
Figure 4.28: Excision of specific phage-containing bands from the nitrocellulose membrane. 1: membrane parts
developed with SigmaFAST BCIP/NBT substrate system, 2: non-developed/native part of the membrane. A-C
demonstrate the applied whole cell extracts containing the expressed target proteins, (A) Ta0316, (B) Ta0547,
(C) Ta1435-38 in co-expressed form. Red circles depict excised membrane parts, which correspond to the
molecular weight of target proteins. M: Molecular weight marker.
Membrane pieces carrying the putative target specific phages were placed in an Eppendorf
tube containing 200 μl of 100 mM TEA buffer and incubated at RT for 30 minutes with gentle
shaking. Incubation was followed by adding 100 μl of 1M Tris-Cl pH 7.5 to the tubes to
neutralize the eluted phage solution then 150 μl of this mixture was added to 450 μl
exponentially growing TG1 culture. Cells were incubated at 37°C for 30 minutes then
centrifuged at 10 000 x g for 1 minute. The pellet was resuspended in fresh YT-medium and
spread on YTCbG plates. Cells were grown at 30°C, ON and the grown bacterial lawn was
scraped thoroughly in YT medium. The cells were centrifuged, washed and resuspended in
YT medium containing 15 % glycerol for long-term storage at -80°C.
Western blot signals were obtained only in case of Ta0316, Ta0547 and Ta1435 target
proteins (Figure 4.28), therefore only these proteins remained in focus. The growth of output
colonies on YTCbG plates indicated that viable phages were eluted from the nitrocellulose
membrane. This fact was also confirmed by the TG1 colonies coming from the Ta1437-
containing membrane piece (for which no Western signal was detected).

Results and discussion
102
The Western blot assay of polyclonal phages serves not only as a visual reference revealing
the diversity of scFvs in the respective phage solution but also as an antigen surface for the
phage biopanning. Moreover, the elution of specific phages from an isolated area of the
membrane could help to filter out unwanted phages through the biopanning cycles. As it
manifested from previous experiments (4.2.1) the lack of signal intensity against certain
antigens does not necessarily mean the lack of specific phages in the polyclonal mixture.
Therefore, with the help of nitrocellulose excision technique rare phage binders may be
enriched from the diverse scFv-library by means of separating them from the abundant
repressor phages being attached to their specific targets.
4.3.2.2 Selection of nitrocellulose-isolated phages on plastic-immobilized antigen
Since the membrane-bound proteins represented the denatured versions of target antigens the
nitrocellulose-isolation approach was further refined with 1 cycle general biopanning in case
of Ta0316 and Ta0547 selected phages using the plastic-immobilized recombinant cytosolic
cell extracts. The resulting output colonies were used to establish monoclonal cell lines then
screened by ELISA for specific phages. The Sup12-HMWF and the freshly prepared cytosolic
extract of the recombinant protein expressing strains were used as screening targets.
The phage biopanning did not result considerable number of output colonies which was
indicative for poor phage elution yield. A few colonies exhibited reactivity against the target
proteins, but similar reactivities were detected on the negative control plates. Therefore, they
did not pass the quality control criteria. Additional biopanning cycles combined with de-
selection steps against E. coli protein components might result positive phages (4.3.1.3).
4.3.2.3 Direct screening of nitrocellulose-isolated phages
Output colonies harboring the putative Ta1435 specific nitrocellulose-eluted scFvs were used
to establish monoclonal cell lines and screened by ELISA-assay (Figure 4.29). The ELISA
assay revealed more then 10 positive signals, of which 8 were chosen to be propagated and
tested by Western blot assay. Western blot assays were performed against the corresponding
recombinant cell extract (Figure 4.30) and against the cytosolic extract of T. acidophilum
(Figure 4.31).
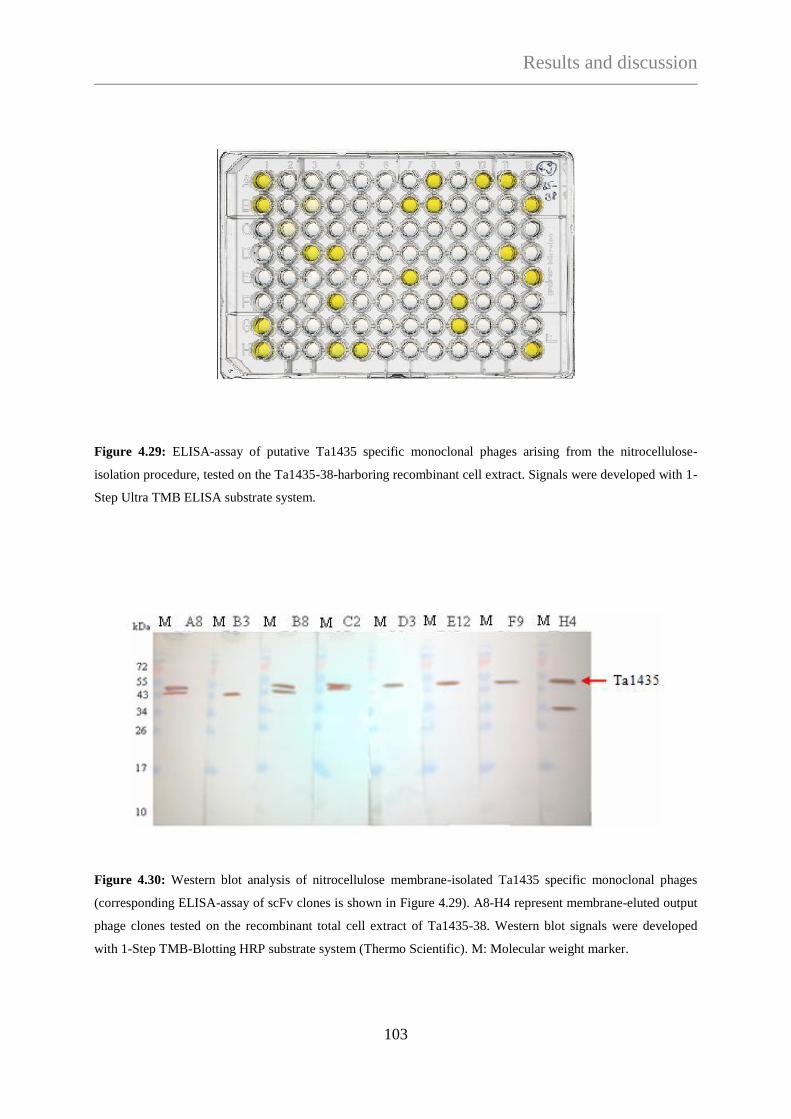
Results and discussion
103
Figure 4.29: ELISA-assay of putative Ta1435 specific monoclonal phages arising from the nitrocellulose-
isolation procedure, tested on the Ta1435-38-harboring recombinant cell extract. Signals were developed with 1-
Step Ultra TMB ELISA substrate system.
Figure 4.30: Western blot analysis of nitrocellulose membrane-isolated Ta1435 specific monoclonal phages
(corresponding ELISA-assay of scFv clones is shown in Figure 4.29). A8-H4 represent membrane-eluted output
phage clones tested on the recombinant total cell extract of Ta1435-38. Western blot signals were developed
with 1-Step TMB-Blotting HRP substrate system (Thermo Scientific). M: Molecular weight marker.
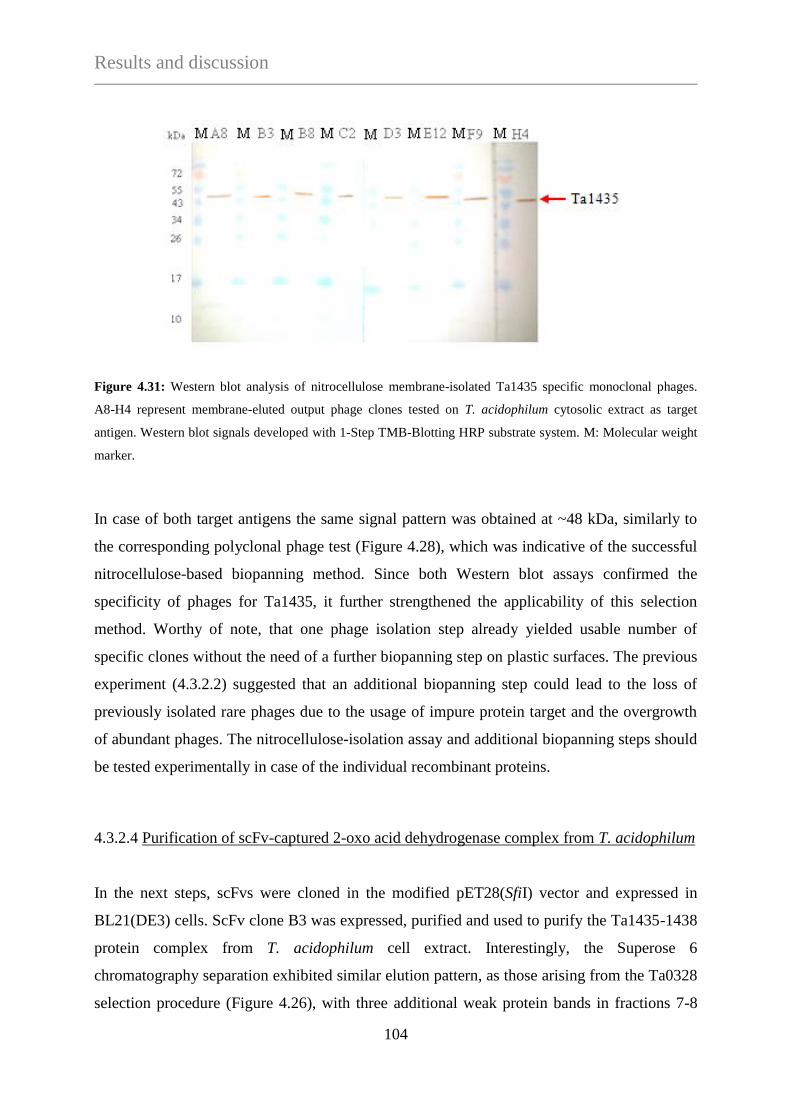
Results and discussion
104
Figure 4.31: Western blot analysis of nitrocellulose membrane-isolated Ta1435 specific monoclonal phages.
A8-H4 represent membrane-eluted output phage clones tested on T. acidophilum cytosolic extract as target
antigen. Western blot signals developed with 1-Step TMB-Blotting HRP substrate system. M: Molecular weight
marker.
In case of both target antigens the same signal pattern was obtained at ~48 kDa, similarly to
the corresponding polyclonal phage test (Figure 4.28), which was indicative of the successful
nitrocellulose-based biopanning method. Since both Western blot assays confirmed the
specificity of phages for Ta1435, it further strengthened the applicability of this selection
method. Worthy of note, that one phage isolation step already yielded usable number of
specific clones without the need of a further biopanning step on plastic surfaces. The previous
experiment (4.3.2.2) suggested that an additional biopanning step could lead to the loss of
previously isolated rare phages due to the usage of impure protein target and the overgrowth
of abundant phages. The nitrocellulose-isolation assay and additional biopanning steps should
be tested experimentally in case of the individual recombinant proteins.
4.3.2.4 Purification of scFv-captured 2-oxo acid dehydrogenase complex from T. acidophilum
In the next steps, scFvs were cloned in the modified pET28(SfiI) vector and expressed in
BL21(DE3) cells. ScFv clone B3 was expressed, purified and used to purify the Ta1435-1438
protein complex from T. acidophilum cell extract. Interestingly, the Superose 6
chromatography separation exhibited similar elution pattern, as those arising from the Ta0328
selection procedure (Figure 4.26), with three additional weak protein bands in fractions 7-8
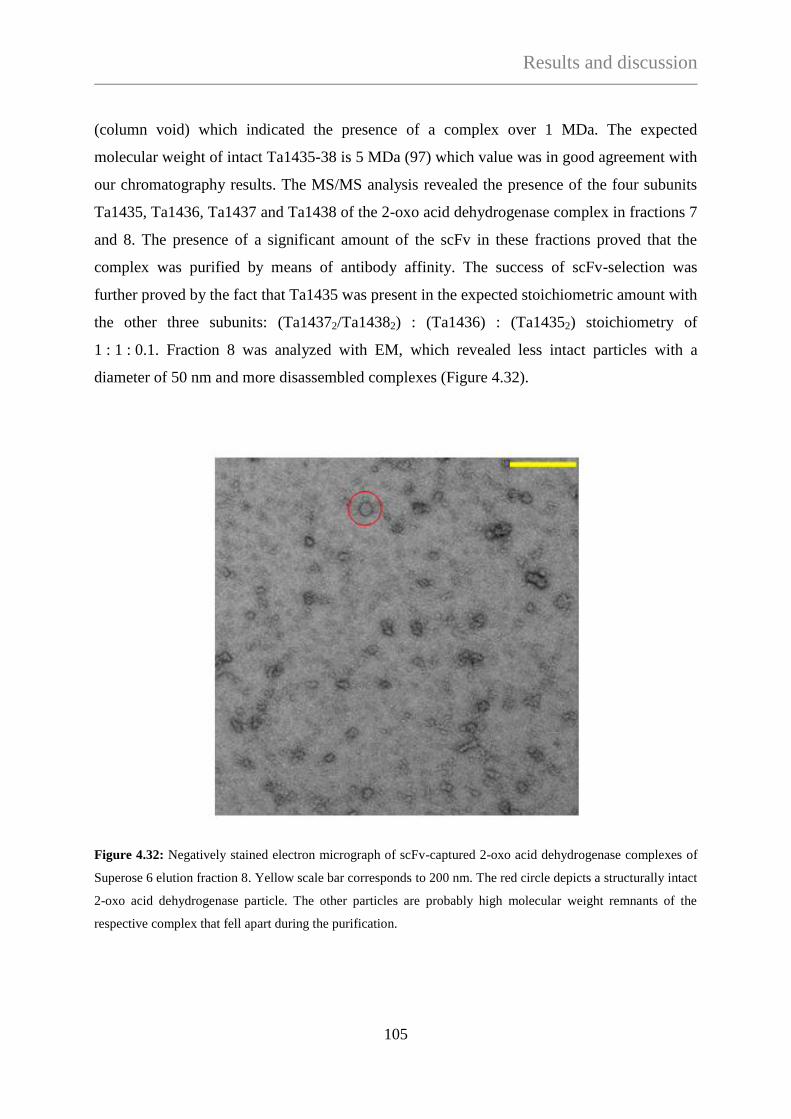
Results and discussion
105
(column void) which indicated the presence of a complex over 1 MDa. The expected
molecular weight of intact Ta1435-38 is 5 MDa (97) which value was in good agreement with
our chromatography results. The MS/MS analysis revealed the presence of the four subunits
Ta1435, Ta1436, Ta1437 and Ta1438 of the 2-oxo acid dehydrogenase complex in fractions 7
and 8. The presence of a significant amount of the scFv in these fractions proved that the
complex was purified by means of antibody affinity. The success of scFv-selection was
further proved by the fact that Ta1435 was present in the expected stoichiometric amount with
the other three subunits: (Ta14372/Ta14382) : (Ta1436) : (Ta14352) stoichiometry of
1 : 1 : 0.1. Fraction 8 was analyzed with EM, which revealed less intact particles with a
diameter of 50 nm and more disassembled complexes (Figure 4.32).
Figure 4.32: Negatively stained electron micrograph of scFv-captured 2-oxo acid dehydrogenase complexes of
Superose 6 elution fraction 8. Yellow scale bar corresponds to 200 nm. The red circle depicts a structurally intact
2-oxo acid dehydrogenase particle. The other particles are probably high molecular weight remnants of the
respective complex that fell apart during the purification.
Results and discussion
106
Ta1435-Ta1438 are gene products of four, closely spaced, adjacent genes showing significant
sequence identities with the bacterial and eukaryotic components of 2-oxo acid
dehydrogenase complexes (OADHCs) that perform the oxidative decarboxylation of 2-oxo
acids to corresponding acyl-CoAs. The 2-oxo acid dehydrogenase complex is composed of
multiple copies of four subunits. Ta1436 is a dihydrolipoamide acetyltransferase component
of the complex, which forms the E2 core by the assembly of 42 subunits. Ta1437 and Ta1438
are the α- and β-chains of a probable 3-methyl-2-oxobutanoate dehydrogenase component that
forms the E1 tetramer of the complex. Ta1435 is the dihydrolipoamide dehydrogenase
component that forms the mobile E3 dimer of the respective complex. Reportedly, the
recombinantly expressed subunits are active and assemble into a large multienzyme complex
constituting the proof that this complex is functional in T. acidophilum (97, 98). However, the
whole complex comprising each four subunits has not been detected in Thermoplasma,
because the motile subunit Ta1435 was never connected to the E1-E2 complex (89).
Results and discussion
107
4.4 Protein purification with scFvs selected for small archaeal modifier
proteins (SAMPs)
Small archaeal modifier proteins (SAMPs) are low molecular weight proteins possessing β-
grasp fold and C-terminal diglycine motif, which, similarly to ubiquitin are conjugated to
protein targets in Haloferax volcanii (99). Studies on Haloferax volcanii revealed the diversity
of pathways modified by SAMPylation suggesting that this kind of conjugation plays a
central role in Archaea. Comparative genomic analysis identified four SAMP candidates from
T. acidophilum (100) of which only one, Ta0895 was confirmed by MS/MS-analysis to have a
modifier role. Although the intracellular level of Ta0895-conjugated proteins is extremely
low, a variety of proteins have been proved to be conjugated to it (unpublished data).
4.4.1 Phage selection against Ta0895
Since MS/MS-analyses revealed the existence of Ta0895-conjugated proteins in the cytosolic
fraction of T. acidophilum, we aimed to capture Ta0895-labelled proteins/protein complexes
by pull down assay. Since Ta0895 is expressed in E. coli in a highly soluble form and requires
only an IMAC purification step to achieve excellent protein purity (Figure 4.33), it proved to
be an ideal target for the scFv selection procedure.
Phage biopanning and screening against Ta0895
The selection of scFv-displaying phages was carried out through 3 biopanning cycles
according to protocol 7.2, with minor modifications, as follows: The first selection cycle was
performed in 4 immuno-tubes, which were coated with 100 μg/ml of affinity purified
recombinant Ta0895. A loopful of each phage library glycerol stock was used to inoculate
medium for the first starting culture and phages were grown in 400 ml YTCbK ON. 3 ml of
the purified phages was mixed with 13 ml of 2% MPBS and 4 ml of this mixture was added to
each immuno-tubes. In the second and third selection cycles only 2-2 immuno-tubes were
coated with 50 μg/ml and 25 μg/ml of antigen, respectively. The subsequent selection cycles
started with inoculating the half of the previous, amplified output TG1 stock into 100 ml
medium. The output phages, arising from the respective biopanning steps, were always
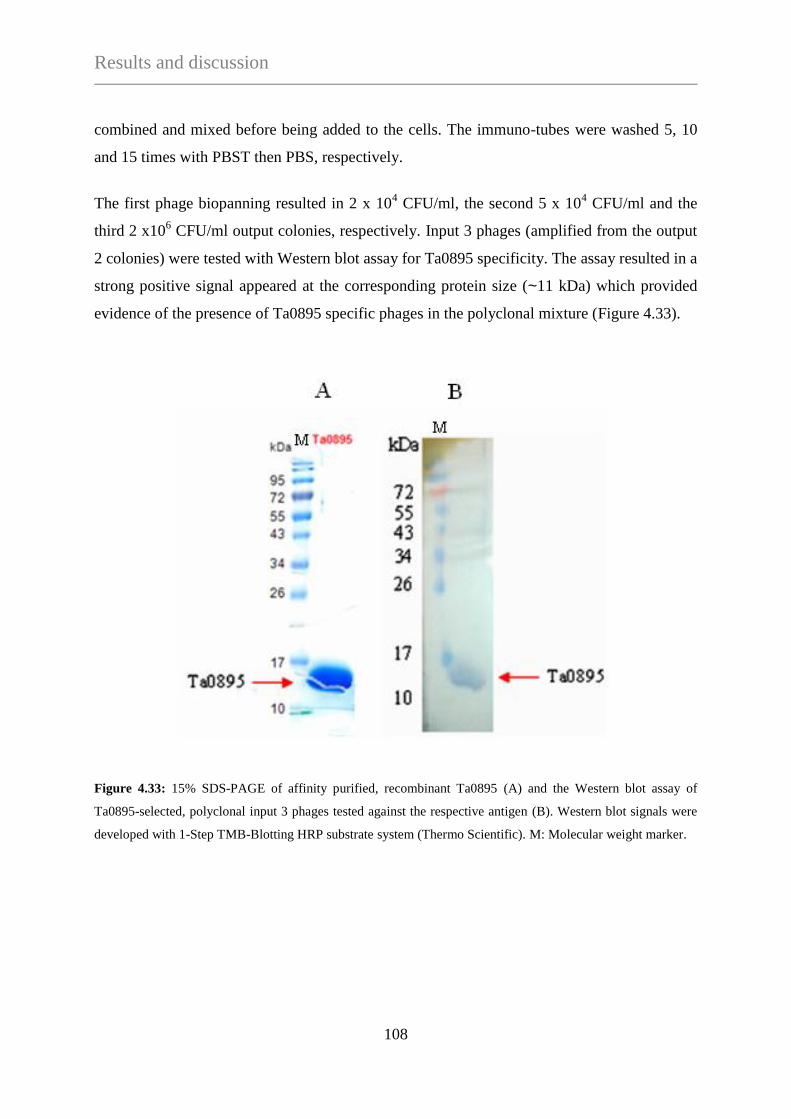
Results and discussion
108
combined and mixed before being added to the cells. The immuno-tubes were washed 5, 10
and 15 times with PBST then PBS, respectively.
The first phage biopanning resulted in 2 x 10⁴ CFU/ml, the second 5 x 10
4 CFU/ml and the
third 2 x10⁶ CFU/ml output colonies, respectively. Input 3 phages (amplified from the output
2 colonies) were tested with Western blot assay for Ta0895 specificity. The assay resulted in a
strong positive signal appeared at the corresponding protein size (~11 kDa) which provided
evidence of the presence of Ta0895 specific phages in the polyclonal mixture (Figure 4.33).
Figure 4.33: 15% SDS-PAGE of affinity purified, recombinant Ta0895 (A) and the Western blot assay of
Ta0895-selected, polyclonal input 3 phages tested against the respective antigen (B). Western blot signals were
developed with 1-Step TMB-Blotting HRP substrate system (Thermo Scientific). M: Molecular weight marker.
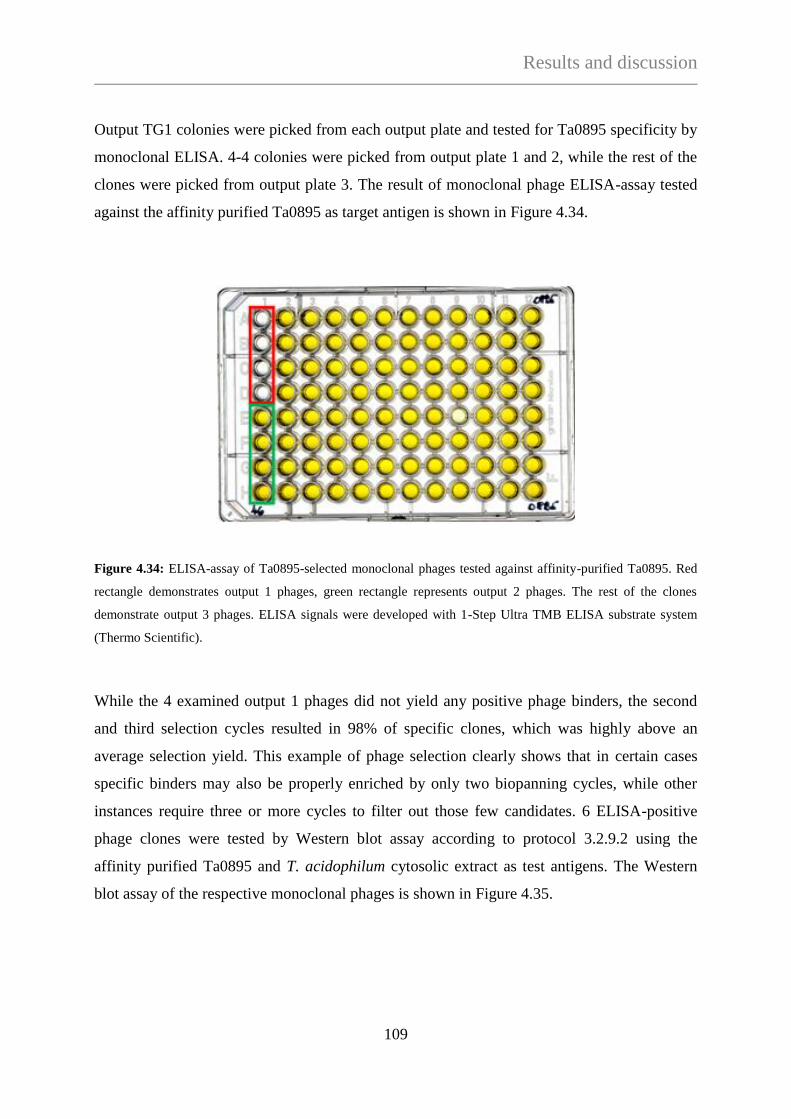
Results and discussion
109
Output TG1 colonies were picked from each output plate and tested for Ta0895 specificity by
monoclonal ELISA. 4-4 colonies were picked from output plate 1 and 2, while the rest of the
clones were picked from output plate 3. The result of monoclonal phage ELISA-assay tested
against the affinity purified Ta0895 as target antigen is shown in Figure 4.34.
Figure 4.34: ELISA-assay of Ta0895-selected monoclonal phages tested against affinity-purified Ta0895. Red
rectangle demonstrates output 1 phages, green rectangle represents output 2 phages. The rest of the clones
demonstrate output 3 phages. ELISA signals were developed with 1-Step Ultra TMB ELISA substrate system
(Thermo Scientific).
While the 4 examined output 1 phages did not yield any positive phage binders, the second
and third selection cycles resulted in 98% of specific clones, which was highly above an
average selection yield. This example of phage selection clearly shows that in certain cases
specific binders may also be properly enriched by only two biopanning cycles, while other
instances require three or more cycles to filter out those few candidates. 6 ELISA-positive
phage clones were tested by Western blot assay according to protocol 3.2.9.2 using the
affinity purified Ta0895 and T. acidophilum cytosolic extract as test antigens. The Western
blot assay of the respective monoclonal phages is shown in Figure 4.35.

Results and discussion
110
Figure 4.35: Western blot assays of Ta0895-selected monoclonal phages against two different test antigens. A8-
H1 represent output 3 phages. 1: Affinity-purified Ta0895 as test antigen., 2: T. acidophilum cytosolic extract as
test antigen mixture. Western blot signals were developed with 1-Step TMB-Blotting substrate system (Thermo
Scientific). M: Molecular weight marker.
Each of the randomly selected phage clones proved to specifically recognize the
nitrocellulose-bound recombinant Ta0895. Similarly to the polyclonal phage assay (Figure
4.33), a positive signal at the corresponding protein size of recombinant Ta0895 (~11 kDa)
indicated the reactivity of phages to the respective antigen. In spite of this, no positive protein
band was obtained on the T. acidophilum cytosolic extract, which indicated the extremely low
level of Ta0895-conjugated proteins in the cytosol. To overcome this hurdle, the Ta0895-
labelled proteins must be enriched from the cell extract by a pull down assay, using soluble
scFvs coupled to agarose beads.
Cloning and heterologous expression of Ta0895 specific scFvs
ScFv clones derived from the monoclonal phage test (Figure 4.35) were cloned into the
modified pET28(SfiI) and used to express soluble His-tagged scFvs. Since none of the scFv
clones were expressed in any of the applied expression strains, codon optimization was
required. Clone A8 and G7-scFv were selected for the gene optimization procedure, of which
only G7-scFv could be synthesized (Eurofins MWG Operon). Optimized G7-scFv was
expressed in soluble form in Rosetta(DE3) cells. Expression conditions are shown in Table
7.3 of 7.9.
Results and discussion
111
Purification of scFv-captured Ta0895-labelled proteins from T. acidophilum
Although the recombinant expression of G7-scFv yielded usable amount of soluble protein,
the vast amount was detected in inclusion bodies. The purification of scFv from the soluble
fraction was carried out by affinity chromatography and an additional ion-exchange
chromatography, yielding 60% protein purity. Additionally, the purified protein exhibited a
strong tendency to precipitate during storage. Therefore, the expression and purification of the
scFv need to be further optimized to achieve eligible purity and stability for pull down
studies. Thus, the purification of Ta0895-labelled proteins with the specific G7-scFv remains
for future studies.
Conclusions and perspectives
112
5. CONCLUSIONS AND PERSPECTIVES
Protein purification methods have to overcome many hurdles working against obtaining high
amount of pure and soluble proteins to satisfy the criteria of biochemical assays and/or
structural analyses. Native protein purification from the natural host often fails due to low
expression levels, while recombinant protein expression technologies have to face inefficient
expression levels or formation of inclusion bodies. The combination of the advantageous
properties of different techniques may aim either homologous expression of affinity tagged
proteins or in cases where there are no genetic tools available antibody based purification
methods can be developed. In the frame of this study we aimed to create an scFv-based phage
display library for the gentle purification of protein complexes of T. acidophilum with specific
antibodies. The phage display technology was developed originally for single protein targets
that we had to adapt to our needs to raise antibodies against a protein mixture containing at
least 300 proteins. The project included the elaboration on selection techniques together with
their accurate screening systems, furthermore, the development of an antibody-based
purification strategy suitable for isolating high molecular weight protein complexes for EM
studies. The high molecular weight protein fractions of Superose 12-separated cell extract
(Sup12-HMWF) were used to immunize mice and induce specific antibodies. A combinatorial
scFv-library was created in pCANTAB 5E phagemid vector by recombination of heavy and
light chain encoding sequences of IgGs using mouse spleen total mRNA as template.
In the first attempt we tried to identify potential phage binders from the antibody repertoire
against high molecular weight protein complexes. The first antigen cocktail used for phage
biopanning was the Sup12-HMWF which was further fractionated by OH-apatite
chromatography to lessen the antigen diversity. The 500 mM K2HPO4-KH2PO4 elution
fraction (OHA-500 mM) yielded more than 50% positive binders of output 3 phages, while
the selection for the 300 mM K2HPO4-KH2PO4 elution fraction (OHA-300 mM) did not result
in any reactive phage binders. The remarkable difference in the selection outputs could be due
to the segregation of antigenic targets by the OH-apatite fractionation. ELISA-positive phages
(24) were tested for binding specificities by Western blotting, which revealed 7 binders
against a 60 kDa, 3 binders against a 25 kDa and 1 binder against a 20 kDa protein target.
After identifying positive phage binders we attempted the purification of protein complexes
Conclusions and perspectives
113
with agarose bead immobilized phages using a conventional pull-down technology. However,
this conception failed due to the structural limitation of filamentous phage particles as the
ratio of the major coat proteins and the scFv fused to the minor coat protein is ~2700 : 5.
Therefore, a pull-down assay using soluble antibodies as bait was developed. The expression
of soluble E-tagged scFvs was carried out in a non-suppressor E. coli strain (HB2151) which
could not be used directly to express phage-free form of affinity-tagged antibodies. However,
this expression system did not prove to be reasonable for scFv expression as it required too
much time and labor to monitor the location (cytosol, periplasm and/or medium) of soluble
proteins. For the faster and easier implementation of expression tests, we developed a
modified pET28 vector (pET28(SfiI)) to allow expression of scFvs with a C-terminal 6
Histidine fusion tag. The viability of the new expression system was validated by Western
assays that proved the expression of soluble scFvs in most of the cases. This pull-down
approach with agarose-immobilized scFvs resulted in successful purification of the molecular
chaperonin thermosome (Ta0980 and Ta1276), however, no intact particles could be obtained
due to harsh elution conditions. To avoid dissociation and possible denaturation of protein
complexes caused by antibody-antigen interaction abolishing eluents/agents, in the next pull-
down approach thermosome complexes were purified by a two-step chromatography method.
Cell extracts from T. acidophilum and the E. coli host expressing the specific scFv were
mixed, incubated and purified by His-tag affinity chromatography and subsequent size
exclusion chromatography. This resulted in pure and intact thermosome particles ideal for EM
data collection, class averaging and 3D reconstruction. With the example of the thermosome
we demonstrated the viability of this scFv-based purification technique for isolating high
molecular weight protein complexes directly from cell extracts. We were able to isolate intact
proteasome particles (Ta0612 and Ta1288) and probable peroxiredoxin (Ta0152) components
with the same method, however, in the latter case the complex could not be visualized by EM
(94).
Since the use of OHA-500 mM as selection target mixture revealed only thermosome,
peroxiredoxin and proteasome specific phage binders from the library, in the next selection
approach we applied the original antigen solution (Sup12-HMWF) to capture binders against
other targets. This resulted in many more phage binders than the selection against OH-apatite
fraction, indicating that the appropriate selection target has prime importance and can strongly
influence the enrichment of hidden, low copy number or low affinity phage binders in the
Conclusions and perspectives
114
next generation libraries. To further fine tune the efficiency of phage selection, de-selections
against abundant protein complexes (thermosome, proteasome) were introduced in the
biopanning. The library clean-up was monitored with a comparative ELISA-assay that aided
to visualize the efficiency of de-selection method. Out of 373 tested clones 217 were
identified as positive binder, of which 62 (30%) appeared to recognize potential new target
antigens. Subsequent Western blots revealed 6-8 new characteristic protein bands recognized
by the de-selected phages, providing evidence that the exclusion of thermosome and
proteasome binders from the third generation phage library facilitates the discovery of new
scFvs against other target complexes. Interestingly, in spite of the successful cloning, none of
the de-selected scFv clones could be sequenced (the reason is misty) and in contrast to their
phage-displayed versions they were not expressed at all, indicating the enrichment of an
unusual scFv form.
In the next phage-selection approach, we used individual recombinant proteins as selection
targets, which were assumed to be putative building blocks of probable protein complexes.
The biopanning assays were first carried out on plastic-immobilized antigens in different
implementations (varying type and amount of Sup12-HMWF-selected phage inputs, number
of selection cycles, incubation/washing conditions and purity of the target antigen). The
critical attendant of the recombinant target approach was that many of the targeted
recombinant antigens possessed low expression levels (Ta0202, Ta0326-27, Ta0825, Ta1073,
Ta1435) and/or were highly instable and/or sensitive to the purification conditions (Ta0437-
38, Ta0547, Ta1194, Ta1315). Since many of the recombinant candidates showed a strong
tendency to precipitate shortly after the purification we focused on more stable targets, such
as the putative intermedier filament Ta1488. Only one biopanning cycle was carried out using
equal amounts of two different phage input solutions (second generation de-selected phages
(output 5) and amplified third generation output 3 phages), which resulted in one specific,
identical scFv out of 96 tested clones in both cases. Since the soluble expression of scFv could
not be achieved using the common optimization methods, the DNA-coding sequence of the
scFv was optimized for E. coli which yielded usable amount of soluble antibody. Using the
well-working two-step chromatography method we were able to purify Ta1488 from the
cytosolic extract of T. acidophilum, however the EM analysis of purified fractions did not
prove that Ta1488 form a multimeric complex as it was predicted from its amino acid
sequence (2).
Conclusions and perspectives
115
We aimed to purify the archaeal homologue of the fixABCX complex of Rhodospirillum
rubrum (95) by isolating scFvs against one of the putative subunit component, Ta0328.
Concerning the low amount and purity of recombinant Ta0328 we introduced library clean up
steps against E. coli host proteins, thermosomes and proteasomes to avoid enrichment of non-
specific and unwanted phage binders. We identified 4 different scFvs which passed the
screening criteria and they were used to capture the fixABCX complex by the two-step
chromatography method. Interestingly, both of them exhibited the same purification pattern,
however, none of them could capture usable amount of the complex. Instead, a formate
dehydrogenase homologue protein (Ta0425) was enriched from the cell extract together with
its putative small subunit constituent (Ta0424), corresponding to 450-500 kDa molecular
weight and the EM-anaysis revealed an X-like shape. Since the formate dehydrogenase
releated protein is structurally not characterized, the purification of its native form with
specific scFvs would contribute to EM studies and further biochemical investigations.
Since most of the native and recombinant target proteins exhibited low expression levels
and/or were highly sensitive to the purification conditions, in the next approach a novel phage
biopanning method was developed to overcome these hurdles. In this conception, the phages
were isolated from nitrocellulose membrane-immobilized denatured antigens instead of the
conventionally used plastic surfaces. The Western blot assay of polyclonal phages served as a
visual reference revealing the diversity of scFvs in the respective phage solution.
Furthermore, the elution of specific phages from an isolated area of the membrane could help
to filter out unwanted phages through the biopanning cycles, thereby promoting the
enrichment of rare phage binders. The viability of this method was proved by the purification
of the 5 MDa 2-oxo acid dehydrogenase multi-enzyme complex. Interestingly, the enzyme
complex was purified together with Ta0425 exhibiting a similar purification pattern as those
arisen from the Ta0328 selection procedure.
The last library selection approach aimed the capturing of SAMP-labelled proteins/protein
complexes by pull down assay (99). The SAMP candidate used as target antigen for the phage
biopanning was Ta0895, which was proved to be conjugated to other proteins in the cytosolic
fraction of T. acidophilum. Due to the high expression level and highly soluble form of
recombinant Ta0895, a conventional phage biopanning could be carried out using plastic-
immobilized antigen. Following phage selection, each of the randomly selected phage clones
Conclusions and perspectives
116
proved to specifically recognize recombinant Ta0895 in both ELISA and Western blot
conditions, which indicated the successful enrichment of SAMP specific phages from the
system. ScFv sequences were optimized for E. coli to attempt soluble form protein
expression, however, the expression and purification of scFv need to be further optimized to
achieve eligible purity and stability. The pull-down of Ta0895-conjugated proteins therefore
remains for future studies, in which the role of this kind of conjugation will be examined.
Interstingly, no phage binder could be found against several abundant proteins like the
subunits of the 70S ribosome and VAT ATPase (Ta0840). The reason of this might be
diverse. These proteins might be weakly antigenic or the library was too diverse or the
expressed binders are incompatible with propagation, while others can be susceptible to
proteolysis during propagation. The underrepresentation of these phages can be further
enhanced by the overgrowth of “background” phages. Furthermore, in spite of their relatively
high genetic stability, scFvs are prone to dimer-and trimerisation which can further hamper
selection and enrichment of such scFvs. Since the scFv selection and screening is
implemented at phage level, the enrichment of many potential binders is hindered by the
defective phage display. These disadvantages all affect the diversity, affinity and specificity
of output phages arising from the selection cycles, leading to the segregation of most
persistent phages.
In conclusion, our results show that the construction of a scFv-library against a targeted
antigen cocktail is a feasible approach to develop specific antibodies recognizing high
molecular weight protein complexes and thereby can contribute to identify/purify structurally
non-characterized proteins/protein complexes. The novelty in our phage display approach was
that the antibody production was stimulated against a complex antigen mixture instead of a
defined epitope, allowing the generation of a diverse scFv library possessing binding
specificities against diverse protein targets. The selection and screening using complex target
mixtures helped to reveal specific antibodies against three different proteins (thermosome,
proteasome and peroxiredoxin), while the use of individual recombinant targets promoted the
antibody selection against four proteins (Ta1488, Ta0425/0424, Ta1435/1436/1437/1438 and
Ta0895). The combination of de-selection and selection steps in the biopanning assays helped
to filter out frequent and unwanted phages from the system and enhanced the selection of
potential new binders. Our novel nitrocellulose-based phage biopanning technique enabled a
Conclusions and perspectives
117
fast and accurate antibody selection, which may be used as a powerful alternative to the
conventional plastic surface-based method if the proper phage selection is limited by
inadequate amount, purity and/or stability of the targeted antigen. Furthermore, using specific
scFvs we were able to carry out protein complex purifications without the need of harsh,
interaction abolishing eluents, which is a crucial prerequisite for single particle electron
microscopy studies. Finally, our phage display approach permitted the generation of
antibodies against the SAMP-candidate Ta0895 protein, which opens avenues for elucidating
the function of this posttranslational labeling in T. acidophilum.
Taken together, the creation of a scFv-library against the high molecular weight protein
fraction of T. acidophilum provided a diverse antibody set, which, in contrast to other libraries
could be selected against a variety of protein targets and resulted in a set of specific binders
which recognize specific targets. The project aids the discovery of structurally unknown,
putative protein complexes by finding then isolating them with specific antibodies to provide
a feasible purification procedure for single particle EM studies. Our phage display library-
based protein complex purification strategy can serve as a platform for studies on visual
proteomics approaches that aim the creation of a template library for the generation of a
cellular atlas.
Abbreviations
118
6. ABBREVIATIONS
A: Adenine
ATP: Adenosine triphosphate
AP: Alkaline phosphatase
B: Cytosine or guanine or thymine
Bp: Base pair
C: Cytosine
°C: Degree Celsius
CEM: Cryo-electron microscopy
CFU: Colony forming unit
D: Adenine or guanine or thymine
ddH2O: Double distilled water
DNA: Deoxyribonucleic acid
E. coli: Escherichia coli
EDTA: Etylene diamine tetra-acetic acid
ELISA: Enzyme-linked immunosorbent assay
G: Guanine
g: Gramm
x g: Times gravity
h: Hour
H: Adenine or cytosine or thymine
HRP: Horseradish peroxidase
IgG: Immunoglobuline G
Abbreviations
119
IMAC: Immobilized metal affinity chromatography
IPTG: Isopropyl-ß-D-thiogalactopyranoside
K: Guanine or thymine
kb: Kilobase
kDa: Kilodalton
LB: Luria-Bertani medium
M: Adenine or cytosine
MS: Mass spectrometry
Mw: Molecular weight
MWCO: Molecular weight cut-off
N: Any nucleotide base
Ni-NTA: Nickel-nitriloacetic acid
nm: Nanometer
OD600: Optical density measured at a wavelength of 600 nm
OH-apatite: Hydroxy-apatite
OHA-500 mM: 500 mM K2HPO4-KH2PO4 elution fraction of T. acidophilum cytosolic
extract
OHA-300 mM: 300 mM K2HPO4-KH2PO4 elution fraction of T. acidophilum cytosolic
extract
ON: Overnight
PAGE: Polyacrylamide gel electrophoresis
PBS: Phosphate-buffered saline
PCR: Polymerase chain reaction
PEG: Polyethylene glycol
Abbreviations
120
pH: Pondus hidrogenii – equal to the negative logarithmic value of the
Hydrogen ion (H+)
concentration
R: Adenine or guanine
RNA: Ribonucleic acid
rpm: Revolutions per minute
RT: Room temperature
S: Guanine or cytosine
scFv: Single chain variable fragment
SDS: Sodium dodecyl sulphate
Sup12-HMWF: Superose 12-separated high molecular weight protein fraction
T: Thymine
T. acidophilum: Thermoplasma acidophilum
TBS: Tris-buffered saline
V: Adenine or cytosine or guanine
W: Adenine or thymine
Y: Cytosine or thymine
Supplementary data
121
7. SUPPLEMENTARY DATA
7.1 Creation of the scFv library
7.1.1 Immunization of mice and harvest of spleens
Superose12-separated high molecular weight protein fractions of T. acidophilum cytosolic cell
extract (Sup12-HMWF) was used for the immunization of eight Balb/c type, 5-6 weeks old
female mice. Mice were immunized with 45 g of Sup12-HMWF 3 times with 2 weeks
intervals. The immunization procedure was carried out using Freund’s adjuvant as previously
described (101). Spleens of mice were removed three days after the last injection and 70 mg
pieces of them were subjected to RNA extraction procedure.
7.1.2 Construction of the scFv repertoire in a phagemid vector
The next steps were carried out as described in Short protocols in immunology, Unit 14.3,
Phage display of single-chain antibody constructs, basic protocol 1: Construction of a scFv
repertoire in a phagemid vector, page 15-21 (102). The detailed protocol is described below:
1. Total RNA from the spleen was extracted using a total RNA extraction kit according to
the manufacturer’s protocol (RNeasy Midi kit, Qiagen) and recovered in 0.5 ml of
DEPC-treated water then used immediately as template for RT-PCR. The remaining
RNA was stored in 50-μl aliquots at -80°C.
2. Four reverse-transcription reactions (RT reaction) were set up for two-step RT-PCR
(reverse transcription PCR) according to the instructions of the RT-PCR kit (Ready-
To-Go-RT-PCR beads, Amersham Pharmacia Biotech). Each reaction had a final
volume of 48 μl and contained 20 μg of total RNA and 0.5 μg of oligo-dT12-18. The RT
reaction was terminated by incubating 10 min at 95°C then tubes were placed on ice.
Supplementary data
122
3. PCR-amplification: The following primer mixes were added to each tube (see table 1)
in 2 ml that resulted in a final primer concentration of 50 pmol/50 μl reaction.
Tube 1: Primers MuVH1-6-BACK (primer no.1 to 6 mixed according to percentages
in Table 1. and primer Mu-JH1-FOR(S) (primer no.10)
Tube 2: Primers MuVH1-6-BACK (primer no.1 to 6 mixed according to percentages
in Table 1. and primer Mu-JH2-FOR(S) (primer no.11)
Tube 3: Primers MuVK1-7-BACK(S) (primer no. 16 to 22 mixed according to
percentages in Table 1.) and primer Mu-JK1-FOR (primer no 32)
Tube 4: Primers MuVK1-7-BACK(S) (primer no. 16 to 22 mixed according to
percentages in Table 1.) and primer Mu-JK2-FOR (primer no 33)
Using the RT-PCR kit, the reaction included a final concentration of 1 x PCR
buffer, 0.2 mM dNTPs, and 1 to 2 U of a thermo-stable DNA polymerase.
4. PCR amplification was carried out according to the following parameters:
1 cycle: 5 min 95°C initial denaturation
35 cycles: 30 sec 95°C denaturation
1 min 55°C annealing
1 min 72°C extension
1 cycle : 5 min 72°C final product extension
The PCR product was kept at 4°C
5. 5-μl aliquot of the PCR reactions was analyzed on a 1.5 % agarose gel against the 1 kb
ladder DNA size marker (Fermentas).
6. Remaining PCR products were separated on a 1.5 % preparative agarose gel, stained
and visualized as described in protocol 3.2.4.4. The 350-bp VH fragments (reactions 1
and 2) and the 330-bp VK fragments (reactions 3 and 4) were excised.
Supplementary data
123
7. DNA fragments were extracted as described in method 3.2.4.5 and recovered in 50 μl
of 10 mM Tris-Cl, pH 8.5.
8. DNA-concentration was measured according to protocol 3.2.4.11.
9. For re-amplification of the gel-purified VH and VK fragments four, 50 μl PCR reactions
were prepared, containing:
- 50 ng of template DNA
- 50 pmol/reaction of primers mixed according to table 1.
- 1 to 2 U high-fidelity thermostable DNA polymerase
- 0.2 mM dNTP mix
- 1 x PCR buffer
For VH:
Tube 1: 50 ng of product 1 as template with primers MuVH1-6-BACK (primer no.1
to 6) and Mu-JH1-FOR(L) (primer no.13)
Tube 2: 50 ng of product 2 as template with primers MuVH1-6-BACK (primer no.1
to 6) and Mu-JH1-FOR(L) (primer no.14)
For VK:
Tube 3: 50 ng of product 3 as template with primers MuVH1-7-BACK(L) (primer
no.24 to 30) and Mu-JK1-FOR (primer no.32)
Tube 4: 50 ng of product 4 as template with primers MuVH1-7-BACK(L) (primer
no.24 to 30) and Mu-JK2-FOR (primer no.33)
10. PCR amplification was carried out according to the following parameters:
1 cycle: 5 min 95°C initial denaturation
30 cycles: 30 sec 95°C denaturation
1 min 55°C annealing
1 min 72°C extension
1 cycle : 5 min 72°C final product extension
The PCR products were kept at 4°C
Supplementary data
124
11. PCR products were recovered from the preparative agarose gel then quantified as in
steps 6 to 8.
12. 5 assembly PCR reactions were set up as follows:
Template: 75 ng of product 1 was combined with 25 ng of product 2, 75 ng of
product 3 an 25 ng of product 4.
Primers: 50 pmol of Mu-Sfi-BACK (primer no.9), 37.5 pmol of Mu-JK1-FOR
(primer no.32) and 12.5 pmol of Mu-VK2-FOR (primer no.33).
50-μl PCR reaction contained 1 to 2 U of a thermostable DNA polymerase, 1 x PCR
buffer and 0.2 mM dNTP mix.
13. PCR amplification was carried out according to the following parameters:
1 cycle: 5 min 95°C initial denaturation
30 cycles: 30 sec 95°C denaturation
1 min 55°C annealing
1 min 72°C extension
1 cycle : 5 min 72°C final product extension
PCR products were kept at 4°C.
14. 5 μl of the PCR products was analyzed on a 1 % agarose gel (expecting an average
length of 750 bp).
15. The assembled PCR products were recovered from a 1 % preparative agarose gel and
quantified as described in steps 6 to 8.
16. 5 μg of pCANTAB 5E phagemid DNA was digested with 5 U of SfiI for 3 h at 50°C
then with 5 U of NotI for 2 h at 37°C.
Supplementary data
125
17. The digested vector was loaded in a 4 cm wide well of a preparative, 1% agarose gel.
The upper (vector) band was recovered from the gel and purified, quantified as
described in steps 6 to 8.
18. The assembled scFv repertoire (step 15) was digested with SfiI and NotI as described
in step 16 and purified using a Microcon PCR filter and recovered in 22 μl ddH2O.
19. Five identical DNA ligation reactions were set up that contained the following
ingredients:
100 ng SfiI + NotI digested, purified pCANTAB 5E vector DNA
80 ng SfiI + NotI digested, purified scFvs inserts
2 μl 10 x ligation buffer
1 μl T4 DNA ligase (NeB)
ddH2O to a final volume of 20 μl
Mixture was incubated for 16 h at 16°C.
20. Ligations were combined and loaded on a Microcon-PCR filter to exchange the
buffer to ddH2O. 500 μl volume of water was added to the cartridge and centrifuged
again. DNA was recovered in a final volume of 50 μl ddH2O.
21. Electroporation-competent E. coli TG-1 cells were dispensed in 100 μl aliquots into
prechilled 1.5 ml microcentrifuge tubes and kept on ice. Electroporation device was
set up for E. coli electroporation protocol.
22. 20 individual electroporations were performed by adding 2.5 μl of the purified
ligation product to 100 μl electroporation-competent cells. Cells were briefly mixed
by gentle pipetting and placed back on ice for 40 to 50 sec.
23. DNA/cell mixture was transferred into a chilled 0.2 cm cuvette then immediately
inserted into the electroporation chamber and treated with 4- to 5 -msec electric
pulse. The cuvette was removed from the electroporation device and 900 μl pre-

Supplementary data
126
warmed SOC medium was added to the mixture. Cells were pipetted up and down
then transferred to a 13 ml sterile polypropylene tube. The tubes (20) were placed for
1 h in a 37°C incubator and shaken at 250 rpm.
24. 10 μl aliquots of the regenerated cells were combined into a single tube and library
size was determined by plating ten-fold serial dilutions of the transformed cells on
selective YTCbG agar plates. Plates were incubated for 16 h at 30°C.
25. The remaining cells were centrifuged for 10 min at 5000 x g at RT. Pellets were
resuspended in 100 μl of fresh SOC medium then spread on one YTCbG plate/tube.
Plates were incubated for 16 h at 25°C.
26. Using a cell scraper, cells were collected from each plate into 10 ml of YTCbG
medium. After this, the suspension were combined and collected as in step 25. Cells
were resuspended in 10 ml of YTCbG medium containing 15 % glycerol. Serial
dilutions were plated onto YTCbG plates to determine library amplification. Glycerol
stocks of the library were stored in 1 ml aliquots at -80°C.
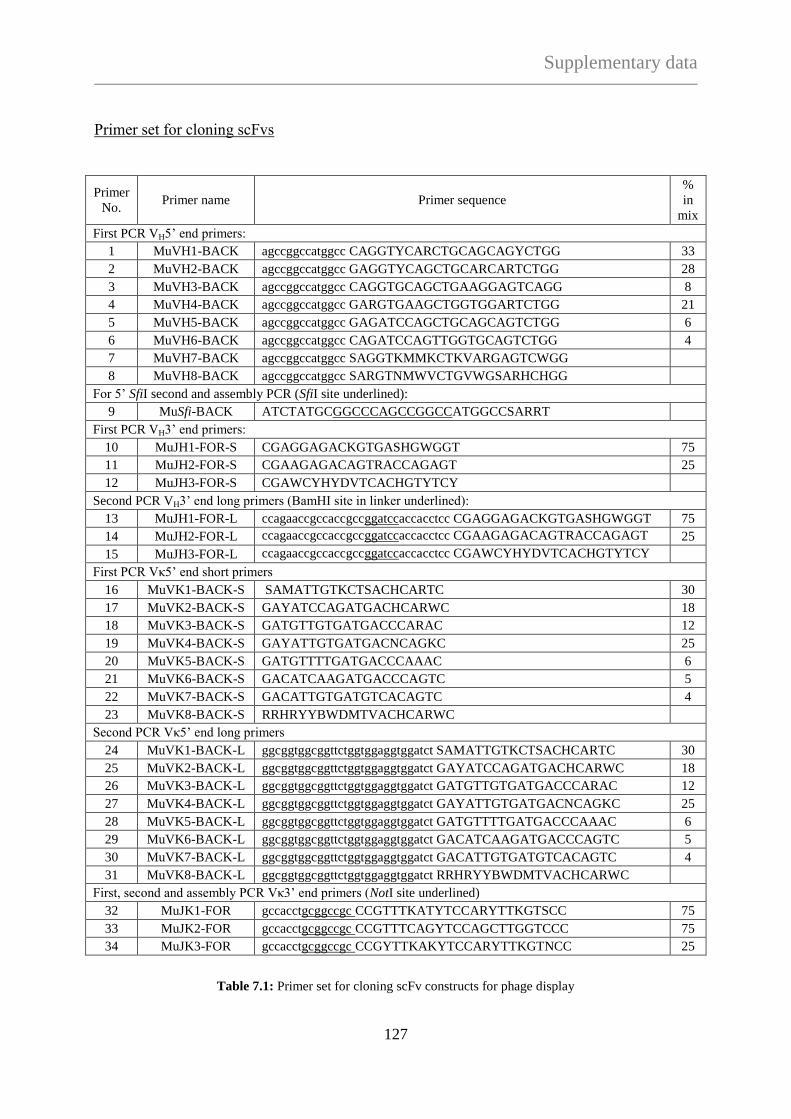
Supplementary data
127
Primer set for cloning scFvs
Primer
No. Primer name Primer sequence
%
in
mix
First PCR VH5’ end primers:
1 MuVH1-BACK agccggccatggcc CAGGTYCARCTGCAGCAGYCTGG 33
2 MuVH2-BACK agccggccatggcc GAGGTYCAGCTGCARCARTCTGG 28
3 MuVH3-BACK agccggccatggcc CAGGTGCAGCTGAAGGAGTCAGG 8
4 MuVH4-BACK agccggccatggcc GARGTGAAGCTGGTGGARTCTGG 21
5 MuVH5-BACK agccggccatggcc GAGATCCAGCTGCAGCAGTCTGG 6
6 MuVH6-BACK agccggccatggcc CAGATCCAGTTGGTGCAGTCTGG 4
7 MuVH7-BACK agccggccatggcc SAGGTKMMKCTKVARGAGTCWGG
8 MuVH8-BACK agccggccatggcc SARGTNMWVCTGVWGSARHCHGG
For 5’ SfiI second and assembly PCR (SfiI site underlined):
9 MuSfi-BACK ATCTATGCGGCCCAGCCGGCCATGGCCSARRT
First PCR VH3’ end primers:
10 MuJH1-FOR-S CGAGGAGACKGTGASHGWGGT 75
11 MuJH2-FOR-S CGAAGAGACAGTRACCAGAGT 25
12 MuJH3-FOR-S CGAWCYHYDVTCACHGTYTCY
Second PCR VH3’ end long primers (BamHI site in linker underlined):
13 MuJH1-FOR-L ccagaaccgccaccgccggatccaccacctcc CGAGGAGACKGTGASHGWGGT 75
14 MuJH2-FOR-L ccagaaccgccaccgccggatccaccacctcc CGAAGAGACAGTRACCAGAGT 25
15 MuJH3-FOR-L ccagaaccgccaccgccggatccaccacctcc CGAWCYHYDVTCACHGTYTCY
First PCR Vκ5’ end short primers
16 MuVK1-BACK-S SAMATTGTKCTSACHCARTC 30
17 MuVK2-BACK-S GAYATCCAGATGACHCARWC 18
18 MuVK3-BACK-S GATGTTGTGATGACCCARAC 12
19 MuVK4-BACK-S GAYATTGTGATGACNCAGKC 25
20 MuVK5-BACK-S GATGTTTTGATGACCCAAAC 6
21 MuVK6-BACK-S GACATCAAGATGACCCAGTC 5
22 MuVK7-BACK-S GACATTGTGATGTCACAGTC 4
23 MuVK8-BACK-S RRHRYYBWDMTVACHCARWC
Second PCR Vκ5’ end long primers
24 MuVK1-BACK-L ggcggtggcggttctggtggaggtggatct SAMATTGTKCTSACHCARTC 30
25 MuVK2-BACK-L ggcggtggcggttctggtggaggtggatct GAYATCCAGATGACHCARWC 18
26 MuVK3-BACK-L ggcggtggcggttctggtggaggtggatct GATGTTGTGATGACCCARAC 12
27 MuVK4-BACK-L ggcggtggcggttctggtggaggtggatct GAYATTGTGATGACNCAGKC 25
28 MuVK5-BACK-L ggcggtggcggttctggtggaggtggatct GATGTTTTGATGACCCAAAC 6
29 MuVK6-BACK-L ggcggtggcggttctggtggaggtggatct GACATCAAGATGACCCAGTC 5
30 MuVK7-BACK-L ggcggtggcggttctggtggaggtggatct GACATTGTGATGTCACAGTC 4
31 MuVK8-BACK-L ggcggtggcggttctggtggaggtggatct RRHRYYBWDMTVACHCARWC
First, second and assembly PCR Vκ3’ end primers (NotI site underlined)
32 MuJK1-FOR gccacctgcggccgc CCGTTTKATYTCCARYTTKGTSCC 75
33 MuJK2-FOR gccacctgcggccgc CCGTTTCAGYTCCAGCTTGGTCCC 75
34 MuJK3-FOR gccacctgcggccgc CCGYTTKAKYTCCARYTTKGTNCC 25
Table 7.1: Primer set for cloning scFv constructs for phage display
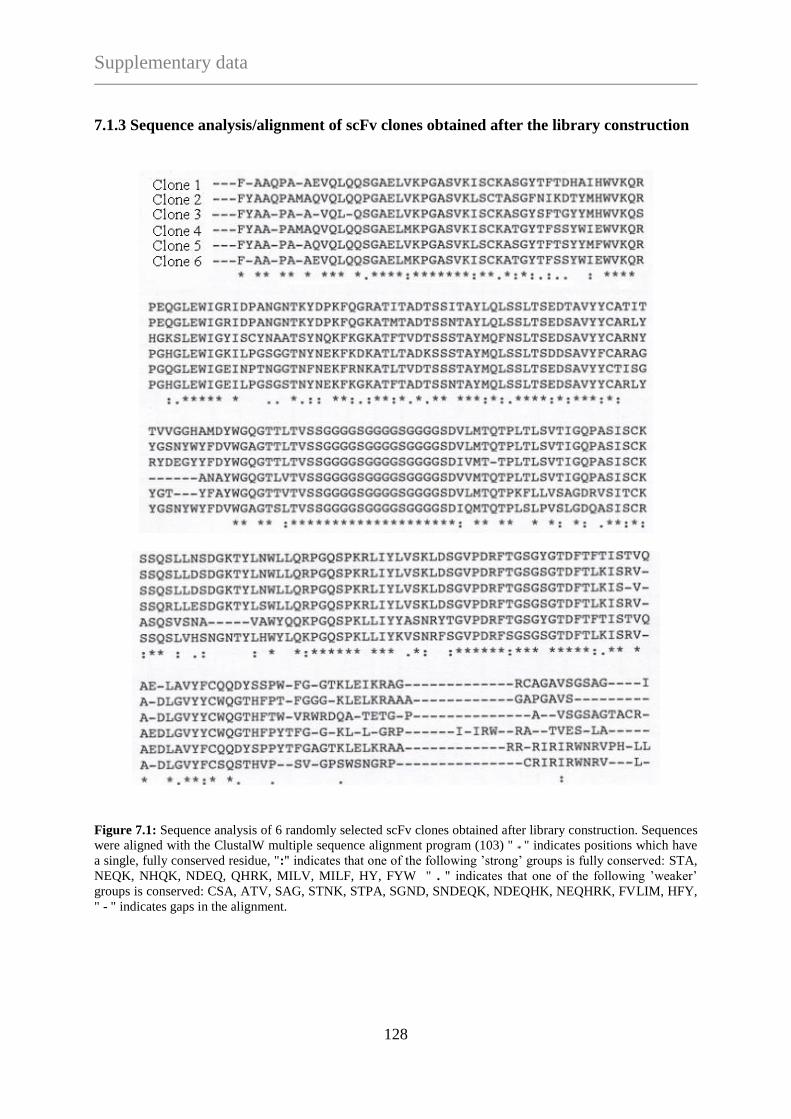
Supplementary data
128
7.1.3 Sequence analysis/alignment of scFv clones obtained after the library construction
Figure 7.1: Sequence analysis of 6 randomly selected scFv clones obtained after library construction. Sequences
were aligned with the ClustalW multiple sequence alignment program (103) " * " indicates positions which have
a single, fully conserved residue, ":" indicates that one of the following ’strong’ groups is fully conserved: STA,
NEQK, NHQK, NDEQ, QHRK, MILV, MILF, HY, FYW " . " indicates that one of the following ’weaker’
groups is conserved: CSA, ATV, SAG, STNK, STPA, SGND, SNDEQK, NDEQHK, NEQHRK, FVLIM, HFY,
" - " indicates gaps in the alignment.
Supplementary data
129
7.2 Affinity selection of scFv-displaying phages on plastic-immobilized
antigens
The affinity selection of scFv-displaying phages was carried out as described in Short
protocols in immunology, Unit 14.3, Phage display of single-chain antibody constructs, basic
protocol 2: Affinity selection of scFv-displaying phage on plastic-immobilized antigen, page
22-25 (102).
Growth of E. coli cells:
1. Day 1: A TG1 bacterial colony was transferred from a minimal medium plate into 5
ml of 2 x YT medium and grown ON at 37°C with shaking.
2. Day 2: The cell suspension was diluted 1:100 into 20 ml of fresh 2 x YT medium and
grown with shaking at 37°C until OD600 reached a value of 0.4 to 0.6 after which
it was infected with phages.
Growth and rescue of phage library:
3. Day 3: An aliquot of the bacterial library glycerol stock (~ 1 x 10¹⁰
clones) was
inoculated into 100 ml of 2 x YTCbG medium and grown with shaking at 37°C
until the OD600 reached 0.5.
4. Cells were infected with M13KO7 helper phage at ratio of 1 : 20 (number of
bacterial cells/helper phage particles, taking into account that 1 OD600 = ~ 2 x
108 bacteria/ml). Cells were incubated for 30 min at 37°C without shaking then
transferred to a 37°C shaker/incubator and grown for 30 min with shaking at 200
rpm.
Supplementary data
130
5. The infected cells were centrifuged for 10 min at 3300 x g, at RT and the pellet
was resuspended in 100 ml of YTCbK medium. Cells were incubated ON with
shaking at 220 rpm, at 30°C.
6. Day 2: ON-grown cell culture was centrifuged for 10 min at 8000 x g (or 30 min at 3300
x g), 4°C. Supernatant was transferred into a new polypropylene tube and 1/5
volume PEG/NaCl was added. After mixing, tubes were left on ice for 1-2 h.
Phage precipitate was centrifuged for 30 min at 10.800 x g, 4°C then the white
pellet was resuspended in 40 ml of ddH2O. 8 ml PEG/NaCl was added to the
water then tube was mixed and left on ice for further 20-40 min. Phage
precipitate was centrifuged for 10 min at 10.800 x g, 4°C then supernatant was
carefully aspirated. Phages were centrifuged briefly again and the remaining
PEG/NaCl was aspirated entirely.
7. Phage pellet was resuspended in 5 ml PBS and centrifuged for 10 min at 11.600
x g, RT. The supernatant was filtered through a 0.45 μm sterile filter and stored
at 4°C until usage or stored at -80°C in the presence of 15% glycerol for later
purposes.
8. Ten-fold serial dilutions were made in sterile PBS to titer of the phage stock.
Early log phase TG1 cells were infected with phage dilutions by mixing and
incubating them for 30 min at 37°C. Infected cells were spread on YTCbG plates
and grown ON at 37°C.
Biopanning: First selection cycle:
9. Day 2: Immuno-tubes were coated ON at 4°C with 4 ml of the required antigen. 10 to
100 μg/ml antigen was diluted in PBS or in 50 mM NaHCO3, pH 9.6.
10. Day 3: Next day, tubes were washed 3 times with PBS by pouring PBS into the tube
and immediately pouring it out. Tubes were filled with 2% MPBS, covered with
Parafilm and incubated for 2 h at room temperature to block the tube. Tubes
were washed 3 times with PBS.

Supplementary data
131
11. For panning, 1011
to 1012
rescued phages (from step 7) were added into the tube
in 4 ml of 2% MPBS and incubated for 1 to 2 h at RT with continuous rotation.
For each wash, tubes were filled with buffer then emptied. Immunotubes were
washed 10 times with PBST for the first selection cycle, then 10 times with PBS
to remove detergent. For the second and subsequent selection cycles tubes were
washed 20 times with PBST, then 20 times with PBS.
12. The remaining PBS was removed from the tubes and phages were eluted in 1 ml
of 100 mM triethylamine (TEA) with continuous rotation for 30 min at RT.
13. During the incubation period, 13-ml polypropylene culture tubes with 0.5 ml of
1 M Tris-Cl, pH 7.4 were prepared to neutralize eluted phages from step 12.
14. After elution, another 200 μl of 1 M Tris-Cl, pH 7.4 was added to the immuno-
tubes to neutralize the remaining phages. Tubes were rotated such that every part
of it came in contact with the neutralizing solution.
15. 750 μl of the eluted, neutralized phage solution was added to 9.25 ml
exponentially growing TG1 culture (step 2). Parallel with it, 4 ml of TG1 culture
was added to the immunotube. Both cultures were incubated for 30 min at 37°C
without shaking to allow infection of the cells.
16. The 10 and 4 ml infected TG1 suspensions were pooled and 100 μl of it was
saved to make 4 or 5 ten-fold serial dilutions. Aliquots of the dilutions were
plated on YTCbG plates and incubated ON at 37°C to determine the panning
output.
17. The remaining infected cells were centrifuged for 10 min at 3300 x g, RT. The
bacterial pellet was resuspended in 1 ml of 2 x YT medium and spread entirely
on four YTCbG plates. Cells were grown at 30°C ON, or until colonies were
visible.

Supplementary data
132
Additional cycles:
18. Day 4: To collect output colonies the plates were overlayed with 5 to 6 ml of 2 x YT
medium supplemented with 15% glycerol and cells were loosened with a cell
scraper. 50 to 100 μl of the scraped bacteria was inoculated into 50 to 100 ml of
YTCbG medium and incubated at 37°C with shaking at 180 rpm until the OD600
reached 0.5. The remaining bacteria were stored as output 1 glycerol stocks at -
80°C.
19. 10 ml of the exponentially growing culture from step 18 was infected with
M13KO7 helper phage in the ration of 1:20. Cells were incubated for 30 min at
37°C without shaking and an additional 30 min at 37°C with shaking. Infected
cells were centrifuged for 10 min at 3300 x g, RT then pellet and the pellet was
resuspended in 50 ml of YTCbK medium. Cells were incubated ON at 30°C
with shaking.
20. Day 5: 40 ml of the ON-grown cell culture was centrifuged for 10 min at 8000 x g (or
30 min at 3300 x g), 4°C. Supernatant was transferred into a new polypropylene
tube then 1/5 volume PEG/NaCl was added. The liquids were mixed and left for
1 to 2 h on ice. Phage precipitate was centrifuged at 10.800 x g for 10 min then
supernatant was aspirated off. Tubes were centrifuged again briefly then the
remaining PEG/NaCl was aspirated off entirely. White pellet was resuspended in
2 ml PBS and centrifuged for 10 min at 11.600 x g, 4°C to remove most of the
remaining bacterial debris.
21. The resulting phage preparation was titered and 1 ml of it was used as input for
the next round of affinity selection. The remaining phages were stored at 4°C for
short-term or at -80°C for long-term in the presence of 15% glycerol.
22. The phage selection was repeated for another 2 or 3 cycles as described above.
In each cycle, the concentration of antigen in the immunotube was decreased by
a factor of 2.
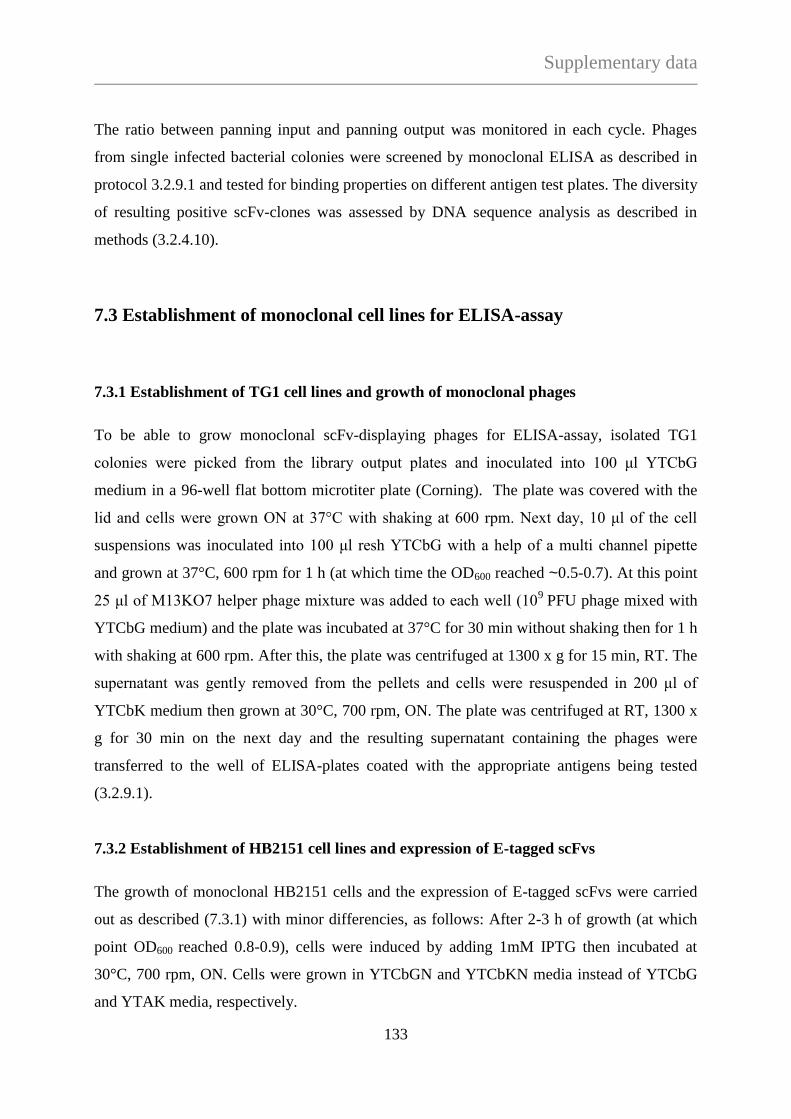
Supplementary data
133
The ratio between panning input and panning output was monitored in each cycle. Phages
from single infected bacterial colonies were screened by monoclonal ELISA as described in
protocol 3.2.9.1 and tested for binding properties on different antigen test plates. The diversity
of resulting positive scFv-clones was assessed by DNA sequence analysis as described in
methods (3.2.4.10).
7.3 Establishment of monoclonal cell lines for ELISA-assay
7.3.1 Establishment of TG1 cell lines and growth of monoclonal phages
To be able to grow monoclonal scFv-displaying phages for ELISA-assay, isolated TG1
colonies were picked from the library output plates and inoculated into 100 μl YTCbG
medium in a 96-well flat bottom microtiter plate (Corning). The plate was covered with the
lid and cells were grown ON at 37°C with shaking at 600 rpm. Next day, 10 μl of the cell
suspensions was inoculated into 100 μl resh YTCbG with a help of a multi channel pipette
and grown at 37°C, 600 rpm for 1 h (at which time the OD600 reached ~0.5-0.7). At this point
25 μl of M13KO7 helper phage mixture was added to each well (109
PFU phage mixed with
YTCbG medium) and the plate was incubated at 37°C for 30 min without shaking then for 1 h
with shaking at 600 rpm. After this, the plate was centrifuged at 1300 x g for 15 min, RT. The
supernatant was gently removed from the pellets and cells were resuspended in 200 μl of
YTCbK medium then grown at 30°C, 700 rpm, ON. The plate was centrifuged at RT, 1300 x
g for 30 min on the next day and the resulting supernatant containing the phages were
transferred to the well of ELISA-plates coated with the appropriate antigens being tested
(3.2.9.1).
7.3.2 Establishment of HB2151 cell lines and expression of E-tagged scFvs
The growth of monoclonal HB2151 cells and the expression of E-tagged scFvs were carried
out as described (7.3.1) with minor differencies, as follows: After 2-3 h of growth (at which
point OD600 reached 0.8-0.9), cells were induced by adding 1mM IPTG then incubated at
30°C, 700 rpm, ON. Cells were grown in YTCbGN and YTCbKN media instead of YTCbG
and YTAK media, respectively.
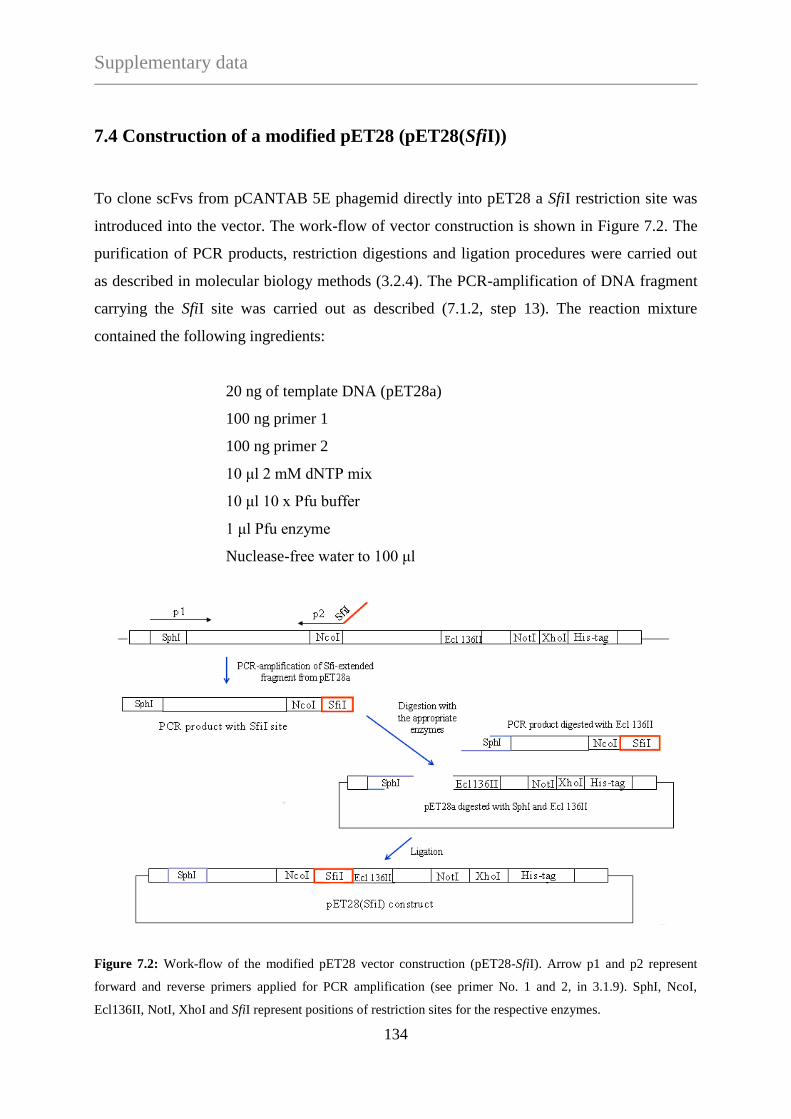
Supplementary data
134
7.4 Construction of a modified pET28 (pET28(SfiI))
To clone scFvs from pCANTAB 5E phagemid directly into pET28 a SfiI restriction site was
introduced into the vector. The work-flow of vector construction is shown in Figure 7.2. The
purification of PCR products, restriction digestions and ligation procedures were carried out
as described in molecular biology methods (3.2.4). The PCR-amplification of DNA fragment
carrying the SfiI site was carried out as described (7.1.2, step 13). The reaction mixture
contained the following ingredients:
20 ng of template DNA (pET28a)
100 ng primer 1
100 ng primer 2
10 μl 2 mM dNTP mix
10 μl 10 x Pfu buffer
1 μl Pfu enzyme
Nuclease-free water to 100 μl
Figure 7.2: Work-flow of the modified pET28 vector construction (pET28-SfiI). Arrow p1 and p2 represent
forward and reverse primers applied for PCR amplification (see primer No. 1 and 2, in 3.1.9). SphI, NcoI,
Ecl136II, NotI, XhoI and SfiI represent positions of restriction sites for the respective enzymes.
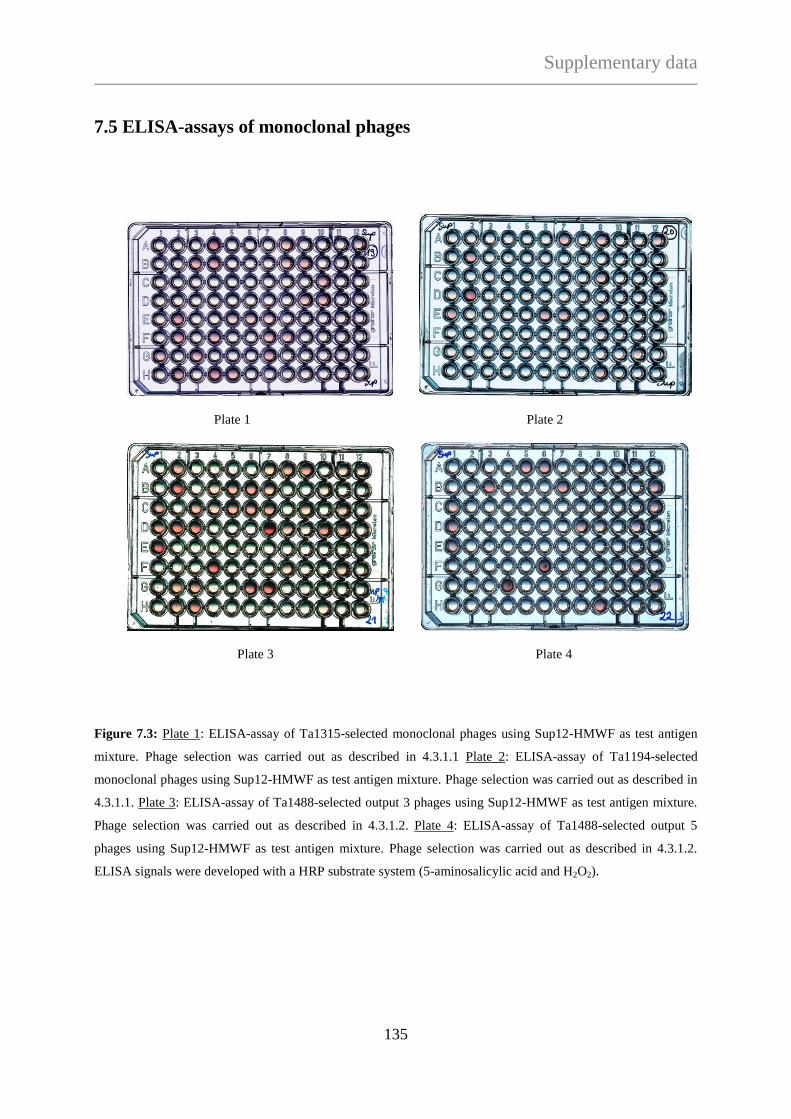
Supplementary data
135
7.5 ELISA-assays of monoclonal phages
Plate 1 Plate 2
Plate 3 Plate 4
Figure 7.3: Plate 1: ELISA-assay of Ta1315-selected monoclonal phages using Sup12-HMWF as test antigen
mixture. Phage selection was carried out as described in 4.3.1.1 Plate 2: ELISA-assay of Ta1194-selected
monoclonal phages using Sup12-HMWF as test antigen mixture. Phage selection was carried out as described in
4.3.1.1. Plate 3: ELISA-assay of Ta1488-selected output 3 phages using Sup12-HMWF as test antigen mixture.
Phage selection was carried out as described in 4.3.1.2. Plate 4: ELISA-assay of Ta1488-selected output 5
phages using Sup12-HMWF as test antigen mixture. Phage selection was carried out as described in 4.3.1.2.
ELISA signals were developed with a HRP substrate system (5-aminosalicylic acid and H2O2).

Supplementary data
136
7.6 SDS-PAGE analysis of proteins
Figure 7.4: 15% SDS-PAGE of a heat treated and affinity purified recombinant Ta1488. Protein samples were
heated for 10 minutes at 24, 45, 50, 55, 60, 65 and 70°C then centrifuged for 1 minute at 13 000 x g and the
supernatant was loaded on 15% SDS-PAGE. M: Molecular marker.
Figure 7.5: 15% SDS-PAGE of total E. coli cell extracts containing recombinant T. acidophilum proteins. The
recombinant expression of respective proteins was carried out as described in table 7.2 of 7.9. Proteins highlited
in red color demonstrate antigen targets used for the nitrocellulose-selection method of phages. M: Molecular
marker.
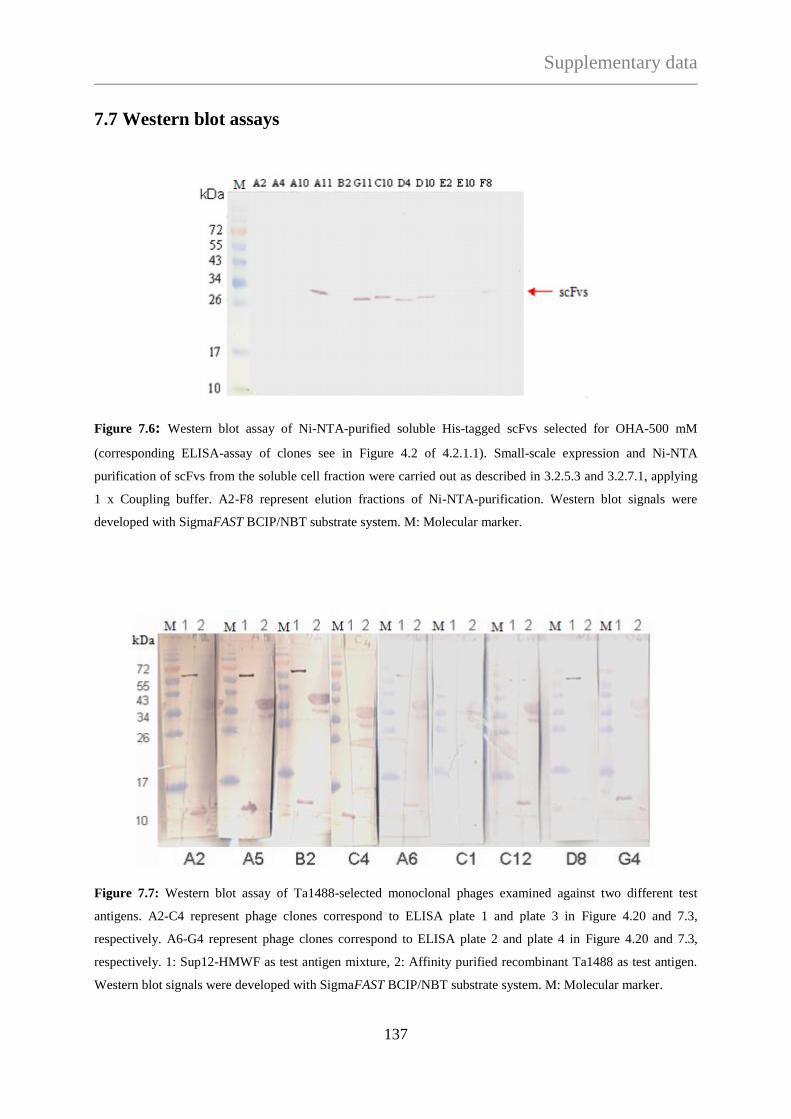
Supplementary data
137
7.7 Western blot assays
Figure 7.6: Western blot assay of Ni-NTA-purified soluble His-tagged scFvs selected for OHA-500 mM
(corresponding ELISA-assay of clones see in Figure 4.2 of 4.2.1.1). Small-scale expression and Ni-NTA
purification of scFvs from the soluble cell fraction were carried out as described in 3.2.5.3 and 3.2.7.1, applying
1 x Coupling buffer. A2-F8 represent elution fractions of Ni-NTA-purification. Western blot signals were
developed with SigmaFAST BCIP/NBT substrate system. M: Molecular marker.
Figure 7.7: Western blot assay of Ta1488-selected monoclonal phages examined against two different test
antigens. A2-C4 represent phage clones correspond to ELISA plate 1 and plate 3 in Figure 4.20 and 7.3,
respectively. A6-G4 represent phage clones correspond to ELISA plate 2 and plate 4 in Figure 4.20 and 7.3,
respectively. 1: Sup12-HMWF as test antigen mixture, 2: Affinity purified recombinant Ta1488 as test antigen.
Western blot signals were developed with SigmaFAST BCIP/NBT substrate system. M: Molecular marker.
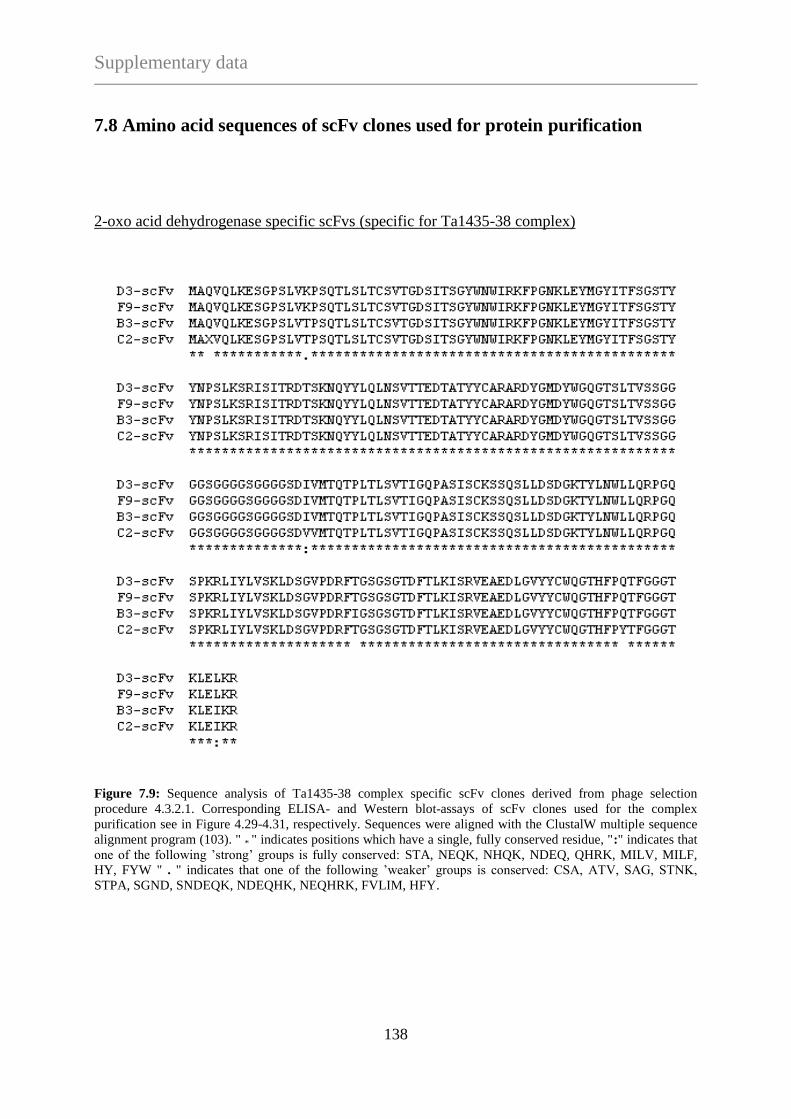
Supplementary data
138
7.8 Amino acid sequences of scFv clones used for protein purification
2-oxo acid dehydrogenase specific scFvs (specific for Ta1435-38 complex)
Figure 7.9: Sequence analysis of Ta1435-38 complex specific scFv clones derived from phage selection
procedure 4.3.2.1. Corresponding ELISA- and Western blot-assays of scFv clones used for the complex
purification see in Figure 4.29-4.31, respectively. Sequences were aligned with the ClustalW multiple sequence
alignment program (103). " * " indicates positions which have a single, fully conserved residue, ":" indicates that
one of the following ’strong’ groups is fully conserved: STA, NEQK, NHQK, NDEQ, QHRK, MILV, MILF,
HY, FYW " . " indicates that one of the following ’weaker’ groups is conserved: CSA, ATV, SAG, STNK,
STPA, SGND, SNDEQK, NDEQHK, NEQHRK, FVLIM, HFY.

Supplementary data
139
Formate-dehydrogenase specific scFvs (specific for Ta0425-0424 complex)
Figure 7.10: Sequence analysis of Ta0328-selected scFv clones derived from phage selection procedure 4.3.1.3.
Corresponding ELISA- and Western blot-assays of scFv clones used for the complex purification see in Figure
4.24 and 4.25 of 4.3.1.3, respectively. Sequences were aligned with the ClustalW multiple sequence alignment
program (103). " * " indicates positions which have a single, fully conserved residue, ":" indicates that one of the
following ’strong’ groups is fully conserved: STA, NEQK, NHQK, NDEQ, QHRK, MILV, MILF, HY, FYW " .
" indicates that one of the following ’weaker’ groups is conserved: CSA, ATV, SAG, STNK, STPA, SGND,
SNDEQK, NDEQHK, NEQHRK, FVLIM, HFY, " - " indicates gaps in the alignment.

Supplementary data
140
Small archaeal modifier protein specific scFvs (specific for Ta0895)
Figure 7.11: Sequence analysis of Ta0895-specific scFv clones derived from phage selection procedure 4.41.
Corresponding ELISA- and Western blot assay of scFv-clones are shown in Sequences were aligned with the
ClustalW multiple sequence alignment program (103). " * " indicates positions which have a single, fully
conserved residue, ":" indicates that one of the following ’strong’ groups is fully conserved: STA, NEQK,
NHQK, NDEQ, QHRK, MILV, MILF, HY, FYW " . " indicates that one of the following ’weaker’ groups is
conserved: CSA, ATV, SAG, STNK, STPA, SGND, SNDEQK, NDEQHK, NEQHRK, FVLIM, HFY.
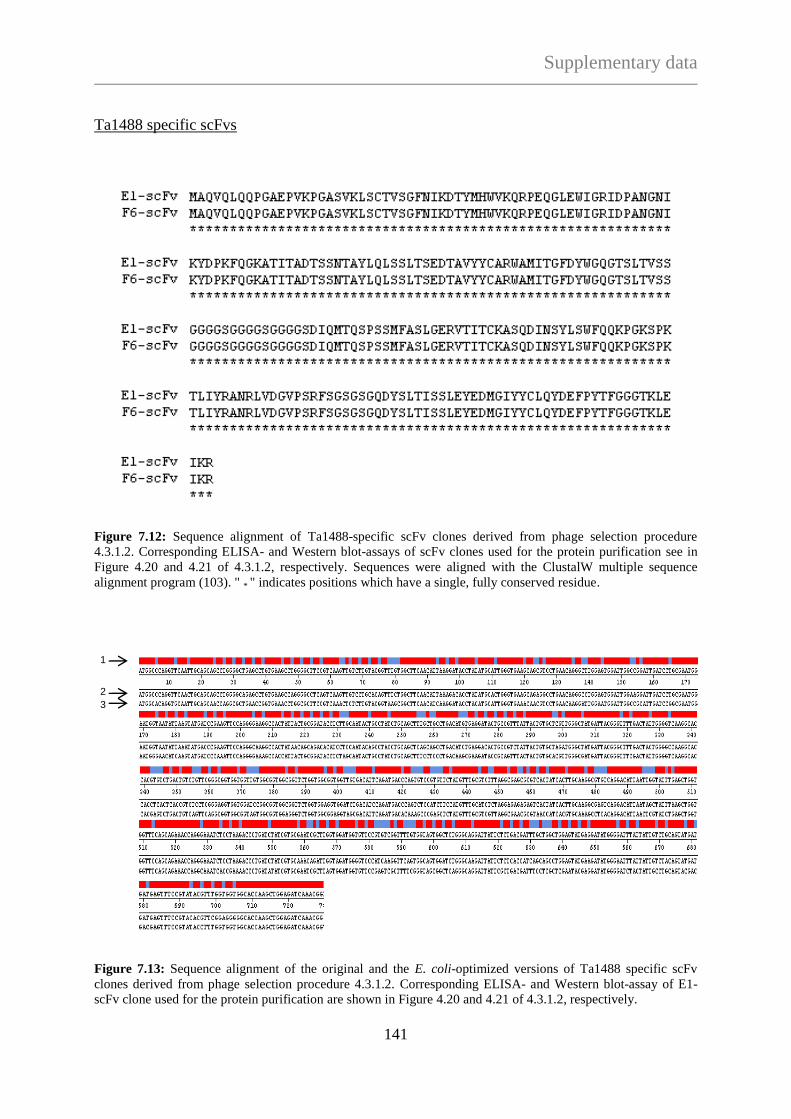
Supplementary data
141
Ta1488 specific scFvs
Figure 7.12: Sequence alignment of Ta1488-specific scFv clones derived from phage selection procedure
4.3.1.2. Corresponding ELISA- and Western blot-assays of scFv clones used for the protein purification see in
Figure 4.20 and 4.21 of 4.3.1.2, respectively. Sequences were aligned with the ClustalW multiple sequence
alignment program (103). " * " indicates positions which have a single, fully conserved residue.
Figure 7.13: Sequence alignment of the original and the E. coli-optimized versions of Ta1488 specific scFv
clones derived from phage selection procedure 4.3.1.2. Corresponding ELISA- and Western blot-assay of E1-
scFv clone used for the protein purification are shown in Figure 4.20 and 4.21 of 4.3.1.2, respectively.
1
2
3
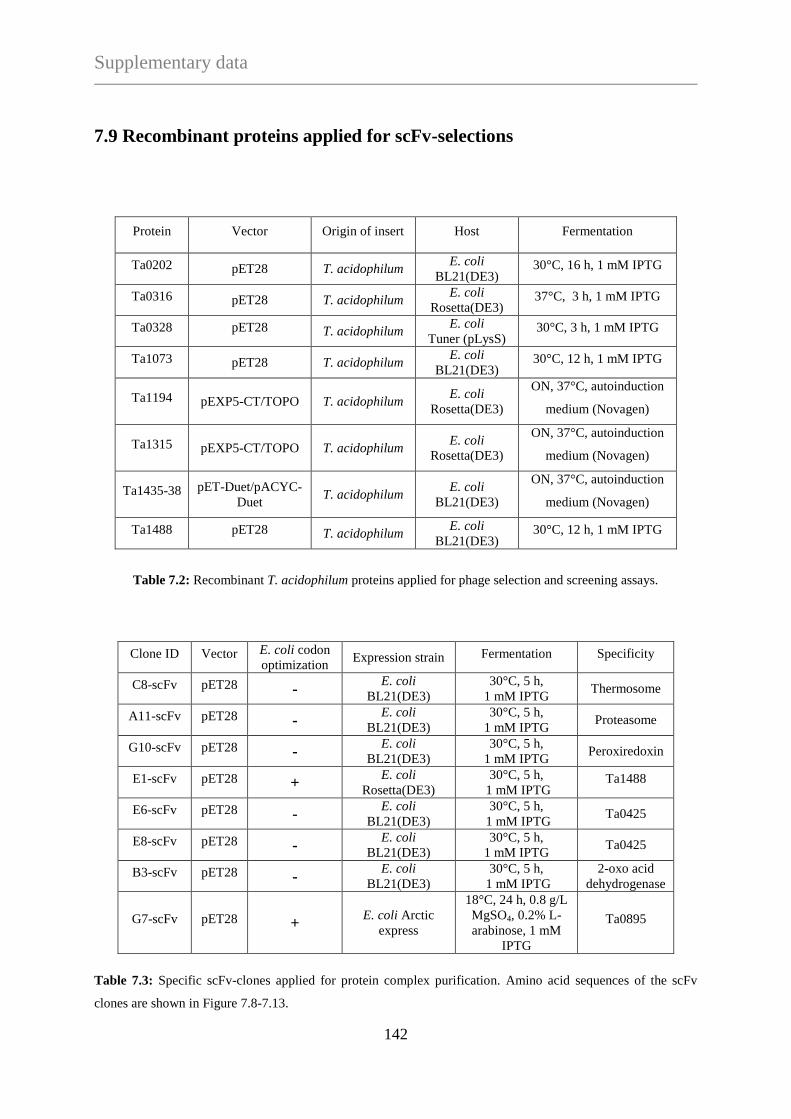
Supplementary data
142
7.9 Recombinant proteins applied for scFv-selections
Protein Vector Origin of insert Host Fermentation
Ta0202 pET28 T. acidophilum E. coli
BL21(DE3) 30°C, 16 h, 1 mM IPTG
Ta0316 pET28 T. acidophilum E. coli
Rosetta(DE3) 37°C, 3 h, 1 mM IPTG
Ta0328 pET28 T. acidophilum E. coli
Tuner (pLysS) 30°C, 3 h, 1 mM IPTG
Ta1073 pET28 T. acidophilum E. coli
BL21(DE3) 30°C, 12 h, 1 mM IPTG
Ta1194 pEXP5-CT/TOPO T. acidophilum E. coli
Rosetta(DE3)
ON, 37°C, autoinduction
medium (Novagen)
Ta1315 pEXP5-CT/TOPO T. acidophilum E. coli
Rosetta(DE3)
ON, 37°C, autoinduction
medium (Novagen)
Ta1435-38 pET-Duet/pACYC-
Duet T. acidophilum
E. coli
BL21(DE3)
ON, 37°C, autoinduction
medium (Novagen)
Ta1488 pET28 T. acidophilum E. coli
BL21(DE3) 30°C, 12 h, 1 mM IPTG
Table 7.2: Recombinant T. acidophilum proteins applied for phage selection and screening assays.
Clone ID Vector E. coli codon
optimization Expression strain Fermentation Specificity
C8-scFv pET28 - E. coli
BL21(DE3)
30°C, 5 h,
1 mM IPTG Thermosome
A11-scFv pET28 - E. coli
BL21(DE3) 30°C, 5 h,
1 mM IPTG Proteasome
G10-scFv pET28 - E. coli
BL21(DE3) 30°C, 5 h,
1 mM IPTG Peroxiredoxin
E1-scFv pET28 + E. coli
Rosetta(DE3)
30°C, 5 h,
1 mM IPTG Ta1488
E6-scFv pET28 - E. coli
BL21(DE3) 30°C, 5 h,
1 mM IPTG Ta0425
E8-scFv pET28 - E. coli
BL21(DE3) 30°C, 5 h,
1 mM IPTG Ta0425
B3-scFv pET28 - E. coli
BL21(DE3) 30°C, 5 h,
1 mM IPTG
2-oxo acid
dehydrogenase
G7-scFv pET28 + E. coli Arctic
express
18°C, 24 h, 0.8 g/L
MgSO4, 0.2% L-
arabinose, 1 mM
IPTG
Ta0895
Table 7.3: Specific scFv-clones applied for protein complex purification. Amino acid sequences of the scFv
clones are shown in Figure 7.8-7.13.
References
143
8. REFERENCES
1. Darland G, Brock TD, Samsonoff W, & Conti SF (1970) A thermophilic, acidophilic
mycoplasma isolated from a coal refuse pile. (Translated from eng) Science
170(3965):1416-1418 (in eng).
2. Ruepp A, et al. (2000) The genome sequence of the thermoacidophilic scavenger
Thermoplasma acidophilum. 407).
3. Sun N, et al. (2007) Proteomics analysis of Thermoplasma acidophilum with a focus
on protein complexes. (Translated from eng) Mol Cell Proteomics 6(3):492-502 (in
eng).
4. Wang Q, Song C, & Li CC (2004) Molecular perspectives on p97-VCP: progress in
understanding its structure and diverse biological functions. (Translated from eng) J
Struct Biol 146(1-2):44-57 (in eng).
5. Gerega A, et al. (2005) VAT, the thermoplasma homolog of mammalian p97/VCP, is
an N domain-regulated protein unfoldase. (Translated from eng) J Biol Chem
280(52):42856-42862 (in eng).
6. Golbik R, Lupas AN, Koretke KK, Baumeister W, & Peters J (1999) The Janus face of
the archaeal Cdc48/p97 homologue VAT: protein folding versus unfolding.
(Translated from eng) Biol Chem 380(9):1049-1062 (in eng).
7. Pamnani V, et al. (1997) Cloning, sequencing and expression of VAT, a CDC48/p97
ATPase homologue from the archaeon Thermoplasma acidophilum. (Translated from
eng) FEBS Lett 404(2-3):263-268 (in eng).
8. Rockel B, et al. (1999) Structure of VAT, a CDC48/p97 ATPase homologue from the
archaeon Thermoplasma acidophilum as studied by electron tomography. (Translated
from eng) FEBS Lett 451(1):27-32 (in eng).
9. Ruepp A, Rockel B, Gutsche I, Baumeister W, & Lupas AN (2001) The Chaperones
of the archaeon Thermoplasma acidophilum. (Translated from eng) J Struct Biol
135(2):126-138 (in eng).
10. Tamura N, Lottspeich F, Baumeister W, & Tamura T (1998) The role of tricorn
protease and its aminopeptidase-interacting factors in cellular protein degradation.
(Translated from eng) Cell 95(5):637-648 (in eng).
11. Sun N, et al. (2009) Size distribution of native cytosolic proteins of Thermoplasma
acidophilum. (Translated from eng) Proteomics 9(14):3783-3786 (in eng).
12. Sun N, et al. (2010) Quantitative proteome and transcriptome analysis of the archaeon
Thermoplasma acidophilum cultured under aerobic and anaerobic conditions.
(Translated from eng) J Proteome Res 9(9):4839-4850 (in eng).
13. Nickell S, Kofler C, Leis AP, & Baumeister W (2006) A visual approach to
proteomics. (Translated from eng) Nat Rev Mol Cell Biol 7(3):225-230 (in eng).
14. Alberts B, et al. (Molecular biology of the cell. 1994. Garland, New York.
15. Rubinstein JL (2007) Structural analysis of membrane protein complexes by single
particle electron microscopy. (Translated from eng) Methods 41(4):409-416 (in eng).
16. Panavas T, Sanders C, & Butt TR (2009) SUMO fusion technology for enhanced
protein production in prokaryotic and eukaryotic expression systems. (Translated from
eng) Methods Mol Biol 497:303-317 (in eng).
References
144
17. Hopp TP, Prickett, Kathryn S., Price, Virginia L., Libby, Randell T., March, Carl J.,
Pat Cerretti, Douglas., Urdal, David L., Conlon, Paul J (1988) A Short Polypeptide
Marker Sequence Useful for Recombinant Protein Identification and Purification. Nat
Biotech 6(10).
18. Schmidt TG & Skerra A (1993) The random peptide library-assisted engineering of a
C-terminal affinity peptide, useful for the detection and purification of a functional Ig
Fv fragment. (Translated from eng) Protein Eng 6(1):109-122 (in eng).
19. Hochuli E, Dobeli H, & Schacher A (1987) New metal chelate adsorbent selective for
proteins and peptides containing neighbouring histidine residues. (Translated from
eng) J Chromatogr 411:177-184 (in eng).
20. Smith DB & Johnson KS (1988) Single-step purification of polypeptides expressed in
Escherichia coli as fusions with glutathione S-transferase. (Translated from eng) Gene
67(1):31-40 (in eng).
21. Weber G & Bocek P (1998) Recent developments in preparative free flow isoelectric
focusing. (Translated from eng) Electrophoresis 19(10):1649-1653 (in eng).
22. Krivankova L & Bocek P (1998) Continuous free-flow electrophoresis. (Translated
from eng) Electrophoresis 19(7):1064-1074 (in eng).
23. Knispel RW, Kofler C, Boicu M, Baumeister W, & Nickell S (2012) Blotting protein
complexes from native gels to electron microscopy grids. (Translated from eng) Nat
Methods 9(2):182-184 (in eng).
24. Smith GP (1985) Filamentous fusion phage: novel expression vectors that display
cloned antigens on the virion surface. (Translated from eng) Science 228(4705):1315-
1317 (in eng).
25. McCafferty J, Griffiths AD, Winter G, & Chiswell DJ (1990) Phage antibodies:
filamentous phage displaying antibody variable domains. (Translated from eng)
Nature 348(6301):552-554 (in eng).
26. Garrard LJ, Yang M, O'Connell MP, Kelley RF, & Henner DJ (1991) Fab assembly
and enrichment in a monovalent phage display system. (Translated from eng)
Biotechnology (N Y) 9(12):1373-1377 (in eng).
27. Hoogenboom HR, et al. (1991) Multi-subunit proteins on the surface of filamentous
phage: methodologies for displaying antibody (Fab) heavy and light chains.
(Translated from eng) Nucleic Acids Res 19(15):4133-4137 (in eng).
28. Brinkmann U, Chowdhury PS, Roscoe DM, & Pastan I (1995) Phage display of
disulfide-stabilized Fv fragments. (Translated from eng) J Immunol Methods
182(1):41-50 (in eng).
29. Reiter Y, et al. (1995) Construction of a functional disulfide-stabilized TCR Fv
indicates that antibody and TCR Fv frameworks are very similar in structure.
(Translated from eng) Immunity 2(3):281-287 (in eng).
30. Collins MO & Choudhary JS (2008) Mapping multiprotein complexes by affinity
purification and mass spectrometry. (Translated from eng) Curr Opin Biotechnol
19(4):324-330 (in eng).
31. Oeljeklaus S, Meyer HE, & Warscheid B (2009) New dimensions in the study of
protein complexes using quantitative mass spectrometry. (Translated from eng) FEBS
Lett 583(11):1674-1683 (in eng).
32. Oeljeklaus S, Meyer HE, & Warscheid B (2009) Advancements in plant proteomics
using quantitative mass spectrometry. (Translated from eng) J Proteomics 72(3):545-
554 (in eng).
References
145
33. Bass S, Greene R, & Wells JA (1990) Hormone phage: an enrichment method for
variant proteins with altered binding properties. (Translated from eng) Proteins
8(4):309-314 (in eng).
34. Barbas CF, 3rd, Kang AS, Lerner RA, & Benkovic SJ (1991) Assembly of
combinatorial antibody libraries on phage surfaces: the gene III site. (Translated from
eng) Proc Natl Acad Sci U S A 88(18):7978-7982 (in eng).
35. Smith GP (1991) Surface presentation of protein epitopes using bacteriophage
expression systems. (Translated from eng) Curr Opin Biotechnol 2(5):668-673 (in
eng).
36. Smith GP & Scott JK (1993) Libraries of peptides and proteins displayed on
filamentous phage. (Translated from eng) Methods Enzymol 217:228-257 (in eng).
37. Hoogenboom HR (2002) Overview of antibody phage-display technology and its
applications. (Translated from eng) Methods Mol Biol 178:1-37 (in eng).
38. Szardenings M (2003) Phage display of random peptide libraries: applications, limits,
and potential. (Translated from eng) J Recept Signal Transduct Res 23(4):307-349 (in
eng).
39. Ren ZJ, et al. (2008) Orally delivered foot-and-mouth disease virus capsid protomer
vaccine displayed on T4 bacteriophage surface: 100% protection from potency
challenge in mice. (Translated from eng) Vaccine 26(11):1471-1481 (in eng).
40. Danner S & Belasco JG (2001) T7 phage display: a novel genetic selection system for
cloning RNA-binding proteins from cDNA libraries. (Translated from eng) Proc Natl
Acad Sci U S A 98(23):12954-12959 (in eng).
41. Sternberg N & Hoess RH (1995) Display of peptides and proteins on the surface of
bacteriophage lambda. (Translated from eng) Proc Natl Acad Sci U S A 92(5):1609-
1613 (in eng).
42. Webster R (2001) Filamentous phage biology. Phage Barbas CF, Burton DR, Scott JK
and Silverman (eds) Phage Display: A Laboratory Manual. Cold Spring Harbor
Laboratory Press, Cold Spring Harbor pp:1.1-1.37.
43. Sanger F, Coulson AR, Barrell BG, Smith AJ, & Roe BA (1980) Cloning in single-
stranded bacteriophage as an aid to rapid DNA sequencing. (Translated from eng) J
Mol Biol 143(2):161-178 (in eng).
44. Welschof M, et al. (1997) The antigen-binding domain of a human IgG-anti-F(ab')2
autoantibody. (Translated from eng) Proc Natl Acad Sci U S A 94(5):1902-1907 (in
eng).
45. Viti F, Nilsson F, Demartis S, Huber A, & Neri D (2000) Design and use of phage
display libraries for the selection of antibodies and enzymes. (Translated from eng)
Methods Enzymol 326:480-505 (in eng).
46. Loset GA, et al. (2005) Construction, evaluation and refinement of a large human
antibody phage library based on the IgD and IgM variable gene repertoire. (Translated
from eng) J Immunol Methods 299(1-2):47-62 (in eng).
47. McCafferty J, et al. (1994) Selection and rapid purification of murine antibody
fragments that bind a transition-state analog by phage display. (Translated from eng)
Appl Biochem Biotechnol 47(2-3):157-171; discussion 171-153 (in eng).
48. Baek H, Suk KH, Kim YH, & Cha S (2002) An improved helper phage system for
efficient isolation of specific antibody molecules in phage display. (Translated from
eng) Nucleic Acids Res 30(5):e18 (in eng).
49. Hoet RM, et al. (2005) Generation of high-affinity human antibodies by combining
donor-derived and synthetic complementarity-determining-region diversity.
(Translated from eng) Nat Biotechnol 23(3):344-348 (in eng).
References
146
50. Winter G (1998) Making antibody and peptide ligands by repertoire selection
technologies. (Translated from eng) J Mol Recognit 11(1-6):126-127 (in eng).
51. Nissim A, et al. (1994) Antibody fragments from a 'single pot' phage display library as
immunochemical reagents. (Translated from eng) Embo J 13(3):692-698 (in eng).
52. Rodi DJ, Soares AS, & Makowski L (2002) Quantitative assessment of peptide
sequence diversity in M13 combinatorial peptide phage display libraries. (Translated
from eng) J Mol Biol 322(5):1039-1052 (in eng).
53. Sambrook J & Russell DW (2001) Molecular cloning: a laboratory manual (CSHL
press).
54. Folgori A, et al. (1994) A general strategy to identify mimotopes of pathological
antigens using only random peptide libraries and human sera. (Translated from eng)
Embo J 13(9):2236-2243 (in eng).
55. Felici F, Castagnoli L, Musacchio A, Jappelli R, & Cesareni G (1991) Selection of
antibody ligands from a large library of oligopeptides expressed on a multivalent
exposition vector. (Translated from eng) J Mol Biol 222(2):301-310 (in eng).
56. Scott JK & Smith GP (1990) Searching for peptide ligands with an epitope library.
(Translated from eng) Science 249(4967):386-390 (in eng).
57. Parmley SF & Smith GP (1988) Antibody-selectable filamentous fd phage vectors:
affinity purification of target genes. (Translated from eng) Gene 73(2):305-318 (in
eng).
58. Kay BK, Winter J, & McCafferty J (1996) Phage display of peptides and proteins: a
laboratory manual (Academic Press).
59. Cwirla SE, Peters EA, Barrett RW, & Dower WJ (1990) Peptides on phage: a vast
library of peptides for identifying ligands. (Translated from eng) Proc Natl Acad Sci U
S A 87(16):6378-6382 (in eng).
60. Devlin JJ, Panganiban LC, & Devlin PE (1990) Random peptide libraries: a source of
specific protein binding molecules. (Translated from eng) Science 249(4967):404-406
(in eng).
61. Jespers LS, et al. (1995) Surface expression and ligand-based selection of cDNAs
fused to filamentous phage gene VI. (Translated from eng) Biotechnology (N Y)
13(4):378-382 (in eng).
62. Cochrane D, Webster C, Masih G, & McCafferty J (2000) Identification of natural
ligands for SH2 domains from a phage display cDNA library. (Translated from eng) J
Mol Biol 297(1):89-97 (in eng).
63. Santi E, et al. (2000) Bacteriophage lambda display of complex cDNA libraries: a new
approach to functional genomics. (Translated from eng) J Mol Biol 296(2):497-508 (in
eng).
64. Rader C & Barbas CF, 3rd (1997) Phage display of combinatorial antibody libraries.
(Translated from eng) Curr Opin Biotechnol 8(4):503-508 (in eng).
65. Kohler G & Milstein C (1975) Continuous cultures of fused cells secreting antibody of
predefined specificity. (Translated from eng) Nature 256(5517):495-497 (in eng).
66. Clackson T, Hoogenboom HR, Griffiths AD, & Winter G (1991) Making antibody
fragments using phage display libraries. (Translated from eng) Nature 352(6336):624-
628 (in eng).
67. Bird RE, et al. (1988) Single-chain antigen-binding proteins. (Translated from eng)
Science 242(4877):423-426 (in eng).
68. Chang CN, Landolfi NF, & Queen C (1991) Expression of antibody Fab domains on
bacteriophage surfaces. Potential use for antibody selection. (Translated from eng) J
Immunol 147(10):3610-3614 (in eng).
References
147
69. Webber KO, Reiter Y, Brinkmann U, Kreitman R, & Pastan I (1995) Preparation and
characterization of a disulfide-stabilized Fv fragment of the anti-Tac antibody:
comparison with its single-chain analog. (Translated from eng) Mol Immunol
32(4):249-258 (in eng).
70. Holliger P, Prospero T, & Winter G (1993) "Diabodies": small bivalent and bispecific
antibody fragments. (Translated from eng) Proc Natl Acad Sci U S A 90(14):6444-
6448 (in eng).
71. McGuinness BT, et al. (1996) Phage diabody repertoires for selection of large
numbers of bispecific antibody fragments. (Translated from eng) Nat Biotechnol
14(9):1149-1154 (in eng).
72. Holliger P & Winter G (1993) Engineering bispecific antibodies. (Translated from
eng) Curr Opin Biotechnol 4(4):446-449 (in eng).
73. Hamers-Casterman C, et al. (1993) Naturally occurring antibodies devoid of light
chains. (Translated from eng) Nature 363(6428):446-448 (in eng).
74. Greenberg AS, et al. (1995) A new antigen receptor gene family that undergoes
rearrangement and extensive somatic diversification in sharks. (Translated from eng)
Nature 374(6518):168-173 (in eng).
75. Nuttall SD, et al. (2001) Isolation of the new antigen receptor from wobbegong
sharks, and use as a scaffold for the display of protein loop libraries. (Translated from
eng) Mol Immunol 38(4):313-326 (in eng).
76. Streltsov VA, Carmichael JA, & Nuttall SD (2005) Structure of a shark IgNAR
antibody variable domain and modeling of an early-developmental isotype.
(Translated from eng) Protein Sci 14(11):2901-2909 (in eng).
77. Abbady AQ, Al-Mariri A, Zarkawi M, Al-Assad A, & Muyldermans S (2011)
Evaluation of a nanobody phage display library constructed from a Brucella-
immunised camel. (Translated from eng) Vet Immunol Immunopathol 142(1-2):49-56
(in eng).
78. Muyldermans S (2001) Single domain camel antibodies: current status. (Translated
from eng) J Biotechnol 74(4):277-302 (in eng).
79. Saerens D, et al. (2004) Single domain antibodies derived from dromedary lymph
node and peripheral blood lymphocytes sensing conformational variants of prostate-
specific antigen. (Translated from eng) J Biol Chem 279(50):51965-51972 (in eng).
80. Kruger C, et al. (2006) Therapeutic effect of llama derived VHH fragments against
Streptococcus mutans on the development of dental caries. (Translated from eng) Appl
Microbiol Biotechnol 72(4):732-737 (in eng).
81. Szynol A, de Soet JJ, Sieben-van Tuyl E, Bos JW, & Frenken LG (2004) Bactericidal
effects of a fusion protein of llama heavy-chain antibodies coupled to glucose oxidase
on oral bacteria. (Translated from eng) Antimicrob Agents Chemother 48(9):3390-
3395 (in eng).
82. Coppieters K, et al. (2006) Formatted anti-tumor necrosis factor alpha VHH proteins
derived from camelids show superior potency and targeting to inflamed joints in a
murine model of collagen-induced arthritis. (Translated from eng) Arthritis Rheum
54(6):1856-1866 (in eng).
83. Hanahan D (1985) Techniques for transformation of E. coli. DNA cloning 1:109-135.
84. Robb FT (1995) Archaea: A laboratory manual (Cold Spring Harbor Laboratory
Press).
85. Porath J, Carlsson J, Olsson I, & Belfrage G (1975) Metal chelate affinity
chromatography, a new approach to protein fractionation. (Translated from eng)
Nature 258(5536):598-599 (in eng).
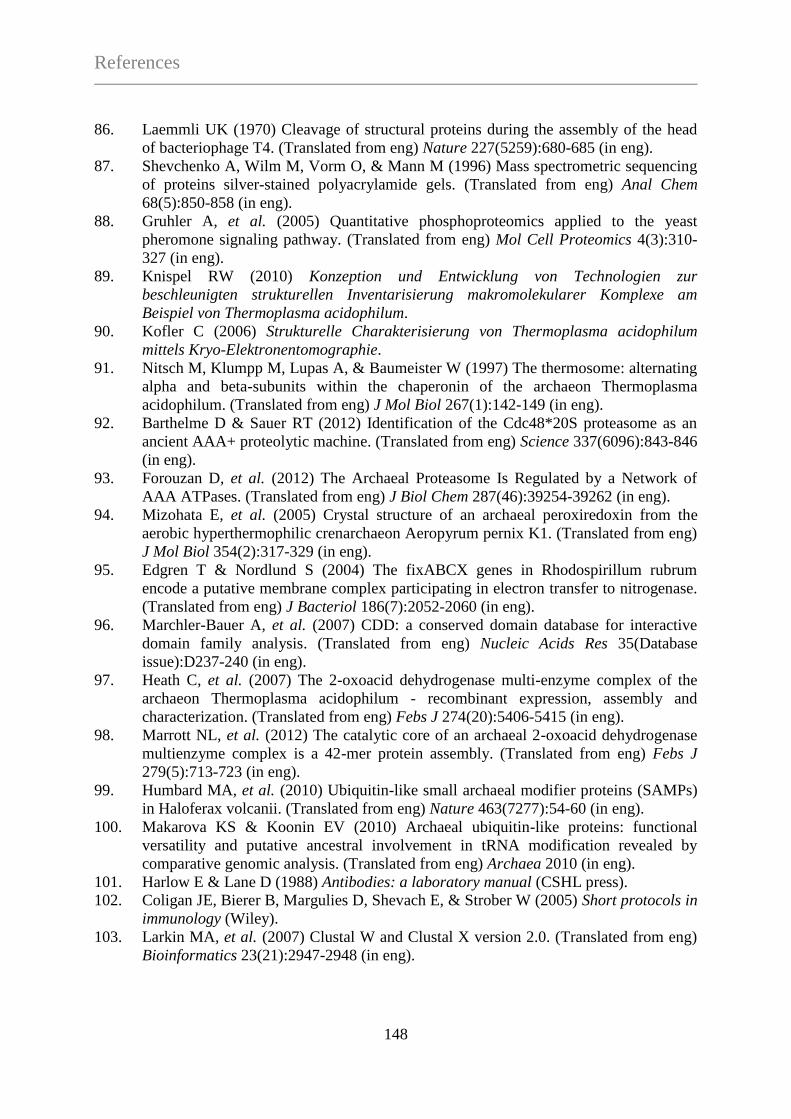
References
148
86. Laemmli UK (1970) Cleavage of structural proteins during the assembly of the head
of bacteriophage T4. (Translated from eng) Nature 227(5259):680-685 (in eng).
87. Shevchenko A, Wilm M, Vorm O, & Mann M (1996) Mass spectrometric sequencing
of proteins silver-stained polyacrylamide gels. (Translated from eng) Anal Chem
68(5):850-858 (in eng).
88. Gruhler A, et al. (2005) Quantitative phosphoproteomics applied to the yeast
pheromone signaling pathway. (Translated from eng) Mol Cell Proteomics 4(3):310-
327 (in eng).
89. Knispel RW (2010) Konzeption und Entwicklung von Technologien zur
beschleunigten strukturellen Inventarisierung makromolekularer Komplexe am
Beispiel von Thermoplasma acidophilum.
90. Kofler C (2006) Strukturelle Charakterisierung von Thermoplasma acidophilum
mittels Kryo-Elektronentomographie.
91. Nitsch M, Klumpp M, Lupas A, & Baumeister W (1997) The thermosome: alternating
alpha and beta-subunits within the chaperonin of the archaeon Thermoplasma
acidophilum. (Translated from eng) J Mol Biol 267(1):142-149 (in eng).
92. Barthelme D & Sauer RT (2012) Identification of the Cdc48*20S proteasome as an
ancient AAA+ proteolytic machine. (Translated from eng) Science 337(6096):843-846
(in eng).
93. Forouzan D, et al. (2012) The Archaeal Proteasome Is Regulated by a Network of
AAA ATPases. (Translated from eng) J Biol Chem 287(46):39254-39262 (in eng).
94. Mizohata E, et al. (2005) Crystal structure of an archaeal peroxiredoxin from the
aerobic hyperthermophilic crenarchaeon Aeropyrum pernix K1. (Translated from eng)
J Mol Biol 354(2):317-329 (in eng).
95. Edgren T & Nordlund S (2004) The fixABCX genes in Rhodospirillum rubrum
encode a putative membrane complex participating in electron transfer to nitrogenase.
(Translated from eng) J Bacteriol 186(7):2052-2060 (in eng).
96. Marchler-Bauer A, et al. (2007) CDD: a conserved domain database for interactive
domain family analysis. (Translated from eng) Nucleic Acids Res 35(Database
issue):D237-240 (in eng).
97. Heath C, et al. (2007) The 2-oxoacid dehydrogenase multi-enzyme complex of the
archaeon Thermoplasma acidophilum - recombinant expression, assembly and
characterization. (Translated from eng) Febs J 274(20):5406-5415 (in eng).
98. Marrott NL, et al. (2012) The catalytic core of an archaeal 2-oxoacid dehydrogenase
multienzyme complex is a 42-mer protein assembly. (Translated from eng) Febs J
279(5):713-723 (in eng).
99. Humbard MA, et al. (2010) Ubiquitin-like small archaeal modifier proteins (SAMPs)
in Haloferax volcanii. (Translated from eng) Nature 463(7277):54-60 (in eng).
100. Makarova KS & Koonin EV (2010) Archaeal ubiquitin-like proteins: functional
versatility and putative ancestral involvement in tRNA modification revealed by
comparative genomic analysis. (Translated from eng) Archaea 2010 (in eng).
101. Harlow E & Lane D (1988) Antibodies: a laboratory manual (CSHL press).
102. Coligan JE, Bierer B, Margulies D, Shevach E, & Strober W (2005) Short protocols in
immunology (Wiley).
103. Larkin MA, et al. (2007) Clustal W and Clustal X version 2.0. (Translated from eng)
Bioinformatics 23(21):2947-2948 (in eng).
Acknowledgements
149
9. ACKNOWLEDGEMENTS
This work was performed in the Department of Molecular Structural Biology, Max Planck
Institute of Biochemistry, Martinsried.
I would like to express profound gratitude to Professor Dr. Wolfgang Baumeister, head of the
Department of Molecular Structural Biology, for giving me the opportunity to pursue my
Ph.D thesis in this department, and for his generous support and supervision.
I would like to express my deepest gratitude to Dr. István Nagy not only for his patient,
continuous guidance and supervision of my project, but also for his optimism, enthusiasm and
his encouragement in the crucial parts of the project. His wide range of knowledge and his
professional thinking helped me to deepen my scientific learning and facilitated to implement
complex scientific experiments in a reasonable way. I am also thankful to him for his critical
reading and correction of my thesis among his busiest time of work and for his valuable
recommendations.
I would like to thank Prof. Dr. Tomohiro Tamura for the experimental design of phage display
library. I am highly grateful to Dr.Yasuo Mitani for constructing the scFv-library and
introducing me into the phage display project. I am thankful to him for his patient, precise and
devoted training of the technique during the initial stage of this work and for giving me the
opportunity to acquire the essential experimental work. His continuous helpfulness has been
very much appreciated.
My grateful thanks are also extended to Dr. Stephan Nickell, whose professionalism and
inspiring attitude had a good influence on me. His critical suggestions and ideas at giving
scientific talks have been highly appreciated by me.
I would like to thank all my colleagues for creating a pleasant working atmosphere and for
their contribution to this project. Thanks to Marius Boicu for performing the FPLC-
purification and EM-analysis of protein samples and for providing me with hundreds of
perfectly prepared SDS-gels. I am also thankful to Ganesh Pathare, Andreas Schweitzer,
Acknowledgements
150
Daniel Bollschweiler, Oana Michalache, Marga Schüler, Marion Jasnin, Inga Wolf, Amy
Schönegge, Stefan Bohn, Shoh Asano and Roland Knispel for their kindness and for giving
me helping hands whenever it was necessary.
I would like to take the opportunity to thank the Microchemistry Core Facility, especially Dr.
Sabine Suppman for her cooperation in the recombinant protein expressions, Snezan
Marinkovic for the DNA-sequencing and Dr. Cyril Boulegue and Beatrix Scheffer for
performing the MS/MS-analyses of protein samples.
I am also thankful to our secretaries, Birgit Book and Sabina von Polenz, for their always
patient and kind help with all the official and personal things.
Special thanks to Dr. Sarah Breuer not only for her invaluable support and encouragement,
but also for her friendship and the nice time spent together in the lab.
My special thanks are extended to Dr. József Kukolya for his kindness, cordiality and placing
reliance on me towards the Ph.D study.
Last but not least, I would like to thank my beloved family for their support- my husband,
Péter, for his deep understanding, constant supports and good soul, my mother for her endless
unselfishness, favour and efforts that she in me invested, my brother for his always
encouraging and optimistic attitude and my father for trusting me. Without these, I would not
have been able to achieve so much! Thank you!