Embed Size (px)
DESCRIPTION
Dwell360 has published this report on the residential real estate market statistics for 2014, 2013, 2012, 2011, 2010, 2009, 2008, 2007, 2006, and 2005 for Needham, Massachusetts. The market statistics include residential sales averages for single family, condominium, and multifamily homes. Review the information presented by the Massachusetts boutique real estate brokerage Dwell360 based in Newton.
Citation preview

Single Family, Condominium, and Multifamily Homes
Year End 2014
Needham, Massachusetts
Market Repor t
Range
Number of
Listing Sold
Days on
the Market
Average
Sale Price
2 Bed $447,000 - $621,250 6 52 561,042$
3 Bed $395,000 - $1,870,000 90 33 708,148$
4 Bed $475,000 - $1,650,000 128 51 953,141$
5 Bed $500,001 - $2,599,000 67 77 1,309,215$
6+ Bed $560,000 - $2,305,000 9 161 1,482,889$
Year % Change
Number of
Listing Sold
Days on
the Market
Average
Sale Price
2005 278 62 811,702$
2006 -5.277% 296 103 768,865$
2007 -2.639% 373 96 748,577$
2008 4.956% 267 88 785,675$
2009 -1.321% 273 89 775,293$
2010 3.915% 306 90 805,643$
2011 1.551% 281 100 818,141$
2012 -1.397% 336 101 806,708$
2013 11.758% 329 59 901,561$
2014 7.282% 300 55 967,217$
Source: MLSPIN, as of 01/15/2015
Needham Statistics
Average Sale Price - Number of Bedrooms - 2014
Historical Average Sale Price - Past 10 Years
Single Family Homes
$811,702 $768,865 $748,577 $785,675 $775,293 $805,643 $818,141 $806,708
$901,561 $967,217
2005 2006 2007 2008 2009 2010 2011 2012 2013 2014

Market stat ist ics
[email protected] | 617-299-1854
Single Family, 1/1/2014 - 12/31/2014
# of Avg. Days Average Average SP:LP Average SP:OP
Listings
on
Market Sale Price List Price Ratio Orig Price Ratio
$350,000 - $399,999 1 13 $395,000 $349,000 113 $349,000 113
$400,000 - $449,999 1 136 $447,000 $460,000 97 $500,000 89
$450,000 - $499,999 5 61 $476,900 $503,400 95 $542,400 88
$500,000 - $599,999 27 37 $554,280 $563,981 98 $576,096 97
$600,000 - $699,999 39 43 $657,668 $649,285 102 $676,859 99
$700,000 - $799,999 46 33 $744,915 $738,333 101 $750,443 100
$800,000 - $899,999 49 44 $837,752 $831,898 101 $840,896 100
$900,000 - $999,999 21 30 $960,248 $966,121 100 $984,017 98
$1,000,000 - $1,499,999 90 72 $1,270,970 $1,280,327 100 $1,297,093 98
$1,500,000 - $1,999,999 18 107 $1,634,250 $1,652,661 99 $1,701,800 97
$2,000,000 - $2,499,999 2 269 $2,220,000 $2,262,000 98 $2,397,000 93
$2,500,000 - $2,999,999 1 13 $2,599,000 $2,599,000 100 $2,599,000 100
Total Properties 300 55 $967,217 $969,969 100 $988,885 99
Source: MLSPIN, as of 01/15/2015
Price Range
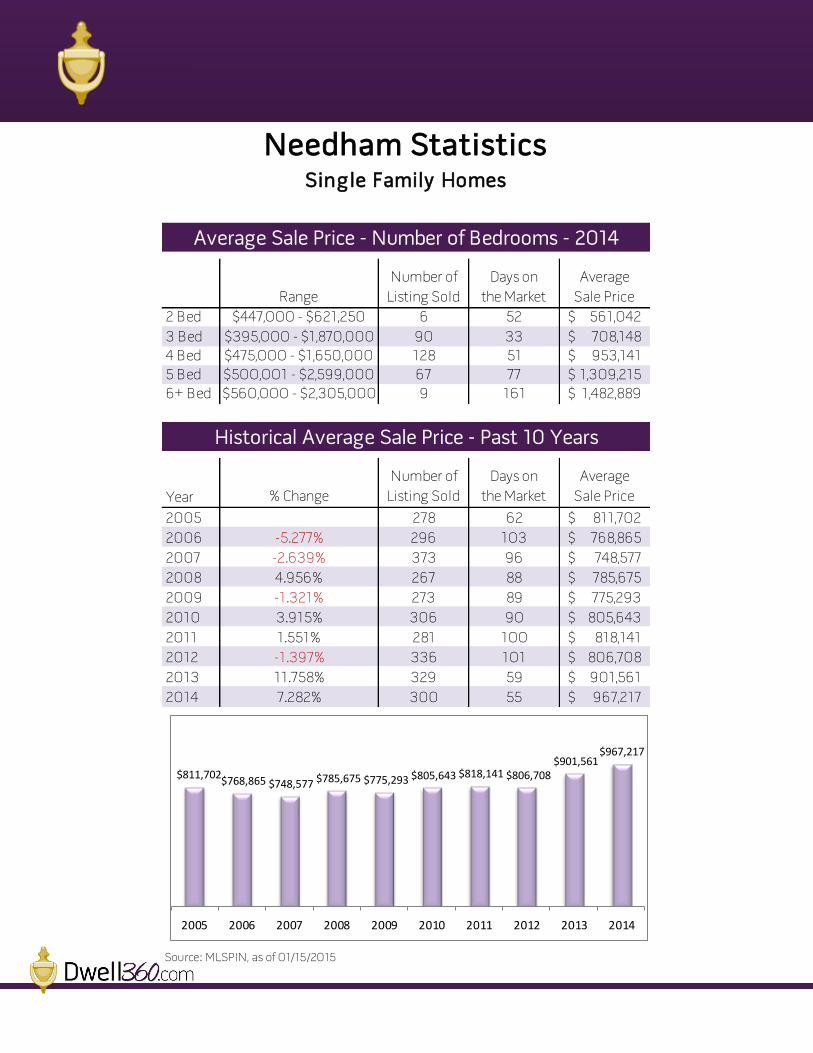
Total Sold - Needham, MA

Range
Number of
Listing Sold
Days on
the Market
Average
Sale Price
1 Bed $193,000 - $401,000 7 35 271,071$
2 Bed $209,000 - $699,000 23 39 409,477$
3 Bed $199,621 - $830,000 19 36 588,173$
4 Bed $690,000 - $930,000 18 57 869,381$
5 Bed $899,900 1 3 899,900$
Year % Change
Number of
Listing Sold
Days on
the Market
Average
Sale Price
2005 47 94 602,276$
2006 -20.831% 33 152 476,815$
2007 10.040% 48 159 524,686$
2008 6.629% 40 178 559,465$
2009 -12.868% 38 153 487,472$
2010 -0.992% 40 131 482,635$
2011 1.580% 39 91 490,260$
2012 -6.369% 53 114 459,033$
2013 26.830% 63 71 582,191$
2014 -1.388% 68 42 574,110$
Source: MLSPIN, as of 01/15/2015
Needham StatisticsCondominiums
Average Sale Price - Number of Bedrooms - 2014
Historical Average Sale Price - Past 10 Years
$602,276
$476,815 $524,686
$559,465
$487,472 $482,635 $490,260 $459,033
$582,191 $574,110
2005 2006 2007 2008 2009 2010 2011 2012 2013 2014
Market stat ist ics
[email protected] | 617-299-1854
Condominiums, 1/1/2014 - 12/31/2014
# of Avg. Days Average Average SP:LP Average SP:OP
Listings
on
Market Sale Price List Price Ratio Orig Price Ratio
$150,000 - $199,999 2 118 $196,311 $220,000 90 $225,000 87
$200,000 - $249,999 6 54 $234,833 $245,800 96 $247,317 95
$250,000 - $299,999 9 13 $272,778 $280,422 97 $280,422 97
$300,000 - $349,999 2 1 $306,500 $304,000 101 $304,000 101
$350,000 - $399,999 3 26 $372,500 $388,300 96 $394,833 94
$400,000 - $449,999 2 25 $409,750 $389,500 106 $389,500 106
$450,000 - $499,999 2 39 $490,900 $522,000 94 $522,000 94
$500,000 - $599,999 6 30 $538,667 $524,483 103 $526,150 103
$600,000 - $699,999 14 40 $654,477 $648,779 101 $649,779 101
$700,000 - $799,999 3 51 $722,554 $719,000 101 $719,000 101
$800,000 - $899,999 16 53 $872,264 $867,600 101 $872,100 100
$900,000 - $999,999 3 74 $910,842 $888,333 103 $888,333 103
Total Properties 68 42 $574,110 $573,057 100 $575,038 99
Source: MLSPIN, as of 01/15/2015
Total Sold - Needham, MA
Price Range

Range
Number of
Listing Sold
Days on
the Market
Average
Sale Price
1 Unit $287,500 1 6 287,500$
2 Units $515,000 1 6 515,000$
Year % Change
Number of
Listing Sold
Days on
the Market
Average
Sale Price
2005 4 16 634,638$
2006 -5.360% 6 87 600,622$
2007 -13.978% 3 169 516,667$
2008 -9.281% 7 129 468,714$
2009 3.795% 3 37 486,500$
2010 12.025% 2 33 545,000$
2011 3.001% 7 35 561,357$
2012 6.973% 7 35 600,500$
2013 -9.316% 9 25 544,556$
2014 -26.316% 2 6 401,250$
Source: MLSPIN, as of 01/15/2015
Needham StatisticsMultifamily Homes
Average Sale Price - Number of Units in Building - 2014
Historical Average Sale Price - Past 10 Years
$634,638 $600,622
$516,667 $468,714 $486,500
$545,000 $561,357 $600,500
$544,556
$401,250
2005 2006 2007 2008 2009 2010 2011 2012 2013 2014
Market stat ist ics
[email protected] | 617-299-1854
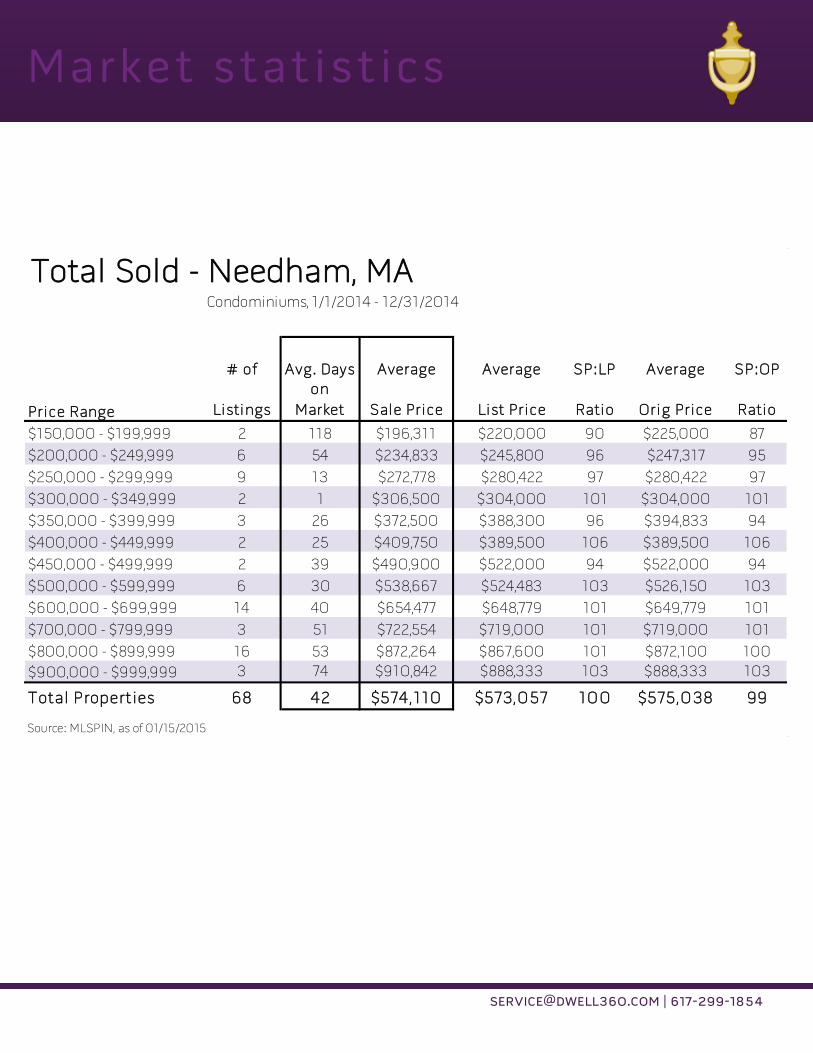
Multifamily Homes, 1/1/2014 - 12/31/2014
# of Avg. Days Average Average SP:LP Average SP:OP
Listings
on
Market Sale Price List Price Ratio Orig Price Ratio
$250,000 - $299,999 1 6 $287,500 $295,000 97 $295,000 97
$300,000 - $349,999 0 0 $0 $0 0 $0 0
$350,000 - $399,999 0 0 $0 $0 0 $0 0
$400,000 - $449,999 0 0 $0 $0 0 $0 0
$450,000 - $499,999 0 0 $0 $0 0 $0 0
$500,000 - $599,999 1 6 $515,000 $495,000 104 $495,000 104
Total Properties 2 6 $401,250 $395,000 101 $395,000 101
Source: MLSPIN, as of 01/15/2015
Total Sold - Needham, MA
Price Range

www.Dwell360.com [email protected]
617-299-1854
Dwell360 46 Austin Street Suite 302 Newton, MA 02460
Trust. Knowledge. Experience.
You want an agent who cares – We are experienced real estate agents who use professional marketing tools. We have neighborhood insight and are current with local market conditions. We know the inventory, have opinions about each property, are confident negotiators, and care about our clients – because buying and selling a home is a big deal!