Embed Size (px)
Citation preview


//////////////////////////////////////////////////////////////////////////////////////////////////////////////////////////////////////////////////////////////////////
Forward-Looking Statements and Additional Information
Forward-Looking StatementsThis presentation contains forward-looking statements, including statements about the expected future financial condition, results of operations and earnings outlook of Crawford & Company. Statements, both qualitative and quantitative, that are not statements of historical fact may be "forward-looking statements" as defined in the Private Securities Litigation Reform Act of 1995 and other securities laws. Forward-looking statements involve a number of risks and uncertainties that could cause actual results to differ materially from historical experience or Crawford & Company's present expectations. Accordingly, no one should place undue reliance on forward-looking statements, which speak only as of the date on which they are made. Crawford & Company does not undertake to update forward-looking statements to reflect the impact of circumstances or events that may arise or not arise after the date the forward-looking statements are made. Results for any interim period presented herein are not necessarily indicative of results to be expected for the full year or for any other future period. For further information regarding Crawford & Company, and the risks and uncertainties involved in forward-looking statements, please read Crawford & Company's reports filed with the Securities and Exchange Commission and available at www.sec.gov or in the Investor Relations section of Crawford & Company's website at www.crawfordandcompany.com.
Crawford's business is dependent, to a significant extent, on case volumes. The Company cannot predict the future trend of case volumes for a number of reasons, including the fact that the frequency and severity of weather-related claims and the occurrence of natural and man-made disasters, which are a significant source of cases and revenue for the Company, are generally not subject to accurate forecasting.
Revenues Before Reimbursements ("Revenues")Revenues Before Reimbursements are referred to as "Revenues" in both consolidated and segment charts, bullets and tables throughout this presentation.
Segment and Consolidated Operating EarningsUnder the Financial Accounting Standards Board's Accounting Standards Codification ("ASC") Topic 280, "Segment Reporting," the Company has defined segment operating earnings as the primary measure used by the Company to evaluate the results of each of its four operating segments. Segment operating earnings exclude income taxes, interest expense, amortization of customer-relationship intangible assets, goodwill impairment charges, restructuring and special charges, stock option expense, earnings or loss attributable to non-controlling interests, and certain unallocated corporate and shared costs and credits. Consolidated operating earnings is the total of segment operating earnings and certain unallocated and shared costs and credits.
Earnings Per ShareThe Company's two classes of stock are substantially identical, except with respect to voting rights and the Company's ability to pay greater cash dividends on the non-voting Class A Common Stock than on the voting Class B Common Stock, subject to certain limitations. In addition, with respect to mergers or similar transactions, holders of Class A Common Stock must receive the same type and amount of consideration as holders of Class B Common Stock, unless different consideration is approved by the holders of 75% of the Class A Common Stock, voting as a class.
In certain periods, the Company has paid a higher dividend on CRD-A than on CRD-B. This may result in a different earnings per share ("EPS") for each class of stock due to the two-class method of computing EPS as required by ASC Topic 260 - "Earnings Per Share". The two-class method is an earnings allocation method under which EPS is calculated for each class of common stock considering both dividends declared and participation rights in undistributed earnings as if all such earnings had been distributed during the period.
Non-GAAP Financial InformationFor additional information about certain non-GAAP financial information presented herein, see the Appendix following this presentation.
Total Compensation”Total Compensation" includes compensation, payroll taxes, and benefits provided to the employees of the Company, as well as payments to outsourced service providers that augment our staff. The difference between “Total Compensation” and the total of “Direct Compensation, Fringe Benefits & Non-Employee Labor” of our segments in our “Management’s Discussion and Analysis” in our Form 10-Q and Form 10-K represents the compensation, payroll taxes and benefits and payment to outsourced service providers that augment our staff for certain administrative functions performed by central headquarters staff that are included in “Expenses Other Than Direct Compensation, Fringe Benefits & Non-Employee Labor” of our segments.
2

//////////////////////////////////////////////////////////////////////////////////////////////////////////////////////////////////////////////////////////////////////
Crawford & Company in the Market
Exchange / Ticker(s)
Share Price1
Market Capitalization1
Annual Dividend
Current Dividend Yield
2017 P/E Ratio
Analyst Coverage
NYSE / “CRD-A” & “CRD-B”
$8.44 (CRD-A), $9.54 (CRD-B)
$497.64mm (Both Share Classes)
$0.28 (CRD-A), $0.20 (CRD-B)
3.3% (CRD-A), 2.1% (CRD-B)
9.9x (CRD-A), 12.3x (CRD-B)
Raymond James (OUTPERFORM) – Greg Peters
SunTrust Robinson Humphrey (BUY) – Mark Hughes
William Blair (OUTPERFORM) – Adam Klauber
(1) As of January 12, 2018
3

//////////////////////////////////////////////////////////////////////////////////////////////////////////////////////////////////////////////////////////////////////
Crawford & Company Overview
• The world’s largest publicly listed independent provider of claims management solutions to insurance companies and self-insured entities, with a global network serving clients in more than 70 countries
• Crawford employs more than 9,000 employees handling in excess of 1.5 million claims annually in over 150 countries
• The company’s claims management solutions, business process outsourcing (BPO) programs, and consulting services are delivered to clients including multinational insurance carriers, brokers, and local insurance firms as well as more than 200 of the Fortune 500 through four operating segments: U.S. Services, International, Broadspire and Garden City Group
Claims Handled Around the World1.5Million
Total Claims Payments Made
$14BillionTotal Employees
4

Four Distinct Business Segments ///////////////////////////////////////////////////////////////////////////////////////////////////////////////////////////////////////////////////
Percentage of trailing twelve month total company revenues before reimbursement by business segment, which totaled $1.079 billion through September 30, 2017
5(1)
Based on Crawford & Company data and estimates

//////////////////////////////////////////////////////////////////////////////////////////////////////////////////////////////////////////////////////////////////////
Investment Thesis
Crawford’s core business has experienced a significant strategic and cultural transformation over the past two years, and is now primed to grow after realizing the operational benefits of cost take-out initiatives
Core Business Primed for
Growth
Favorable Capital Return
Profile
Dividend yield has shown a positive trajectory as Crawford continues to return capital to shareholders via both quarterly cash dividends and share repurchases
Conservative Leverage Profile
Conservative balance sheet with total debt to LTM EBITDA under 2.0x, through the end of the third quarter 2017
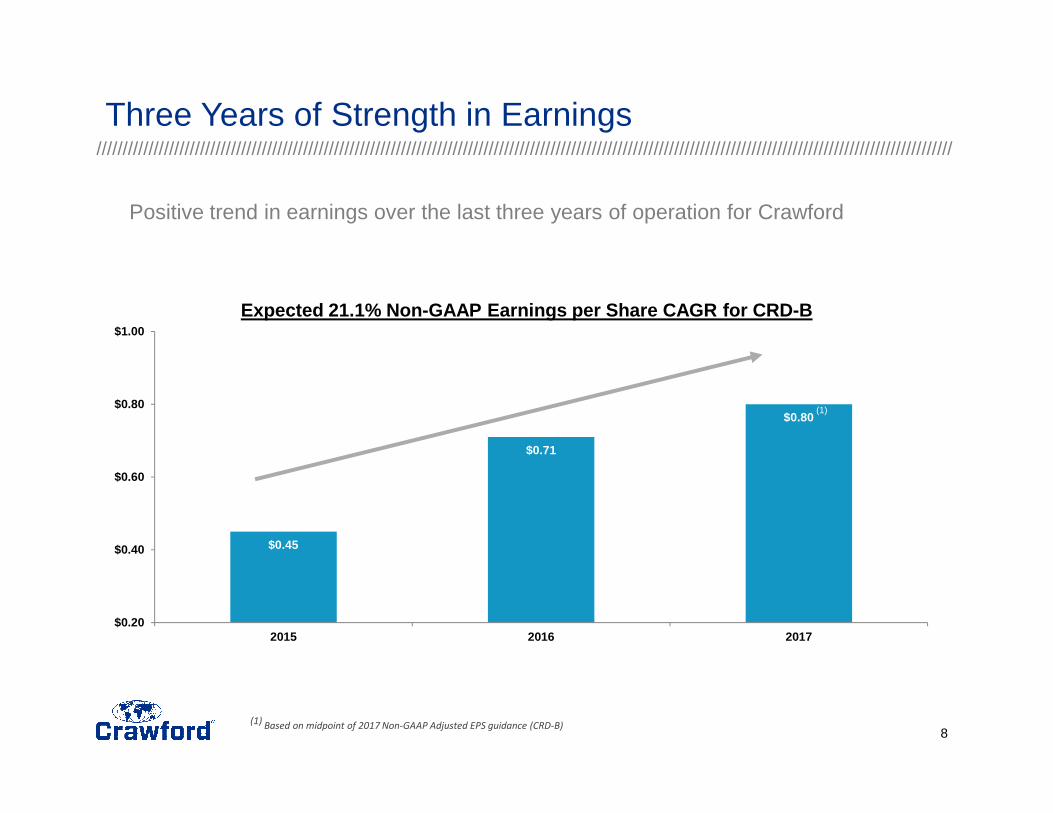
Three Years of Strength in Earnings
Crawford has shown a positive trend in earnings growth from 2015 and is on track to hit guidance for 2017, which implies a 21.1% CAGR at the midpoint of the non-GAAP EPS guidance range (CRD-B shares)
Strong Management
Team
Crawford’s management team has extensive knowledge and experience in creating value at large service organizations, and brings best-in-class leadership skills to bear for all of Crawford’s stakeholders
6

//////////////////////////////////////////////////////////////////////////////////////////////////////////////////////////////////////////////////////////////////////
Executive Management Team
Name Background Experience
Harsha V. AgadiPresident and Chief Executive Officer
• Leadership positions at both public and private companies, including several Fortune 500 companies
• Member of the Crawford Board of Directors since 2010• 30 Years
Rohit VermaChief Operating Officer
• 10 years of recent experience at Zurich North America• Previously management consultant with McKinsey & Company and
Deloitte Consulting• 20 Years
Bruce SwainChief Financial Officer
• CFO since 2006 with experience in public and corporate accounting• Held multiple financial positions during nearly 25 years at Crawford
• 30 Years
Danielle LisenbeyPresident, TPA Solutions, Broadspire
• Former COO for Broadspire, responsible for the operation of medical and case management services
• Member of WeGoLook Board of Directors since 2017• 25 Years
Kieran RigbyPresident, Claims Solutions
• Served as Crawford CEO for Europe and Latin America • Previously CEO of GAB Robins UK until acquisition by Crawford
• 35 Years
Larry ThomasPresident, Specialty Solutions
• Served as CEO for Crawford U.S. P&C and Contractor Connection division
• Held various management positions as well as regional vice president roles during 35 year tenure with Crawford
• 35 Years
7
//////////////////////////////////////////////////////////////////////////////////////////////////////////////////////////////////////////////////////////////////////
$0.45
$0.71
$0.80
$0.20
$0.40
$0.60
$0.80
$1.00
2015 2016 2017
Three Years of Strength in Earnings
8
Positive trend in earnings over the last three years of operation for Crawford
Expected 21.1% Non-GAAP Earnings per Share CAGR for CRD-B
(1)
(1) Based on midpoint of 2017 Non-GAAP Adjusted EPS guidance (CRD-B)

//////////////////////////////////////////////////////////////////////////////////////////////////////////////////////////////////////////////////////////////////////
Focus On Delivering Revenue Growth
9
Repositioning the Global Claims business
Continued expansion of GTS and Contractor Connection
Transformational acquisition of WeGoLook
Broadspire’s re-entry into the U.S. disability market
Returning GCG to growth
Focus on innovation, new products, and cross selling
Multiple Avenues of Revenue Growth Available Globally

10
////////////////////////////////////////////////////////////////
• One of the world’s largest independent providers of claims management solutions with an unparalleled competitive position and globally recognized portfolio of brands
• Delivering complex solutions to clients when speed of execution matters
• Integrated approach to managing national and multinational claims programs
• Strong client focus, leadership, consultation and guidance• Provides services to approximately half of the Fortune 500
companies
• Strategic Focus – Drive top line growth and improved profitability:
o Expand Global Technical Services (GTS)o Pursue runoff claims administration opportunitieso Provide innovative solutions focused on client needso Continue to grow Contractor Connectiono WeGoLook acquisition to transform the high frequency, low
severity claims market
Global Claims Management Business

//////////////////////////////////////////////////////////////////////////////////////////////////////////////////////////////////////////////////////////////////////
Global Technical Services (GTS)
Crawford GTS has the largest, most experienced team of technical adjusters in the world
Our VisionTo be the world’s leading and most trusted provider of specialist loss management, forensic accounting and consulting solutions – powered by advanced analytics
GTS has a global footprint comprising 400+ executive general adjusters who are specialists in providing quality, end to end claims managementOverview
Client Need Carriers seek global, integrated end to end solutions for complex and major claims given a lack of complex claims experience, the need to control cost inflation, and inadequate customer outcomes
Value Proposition
Crawford GTS delivers clients reduced indemnity spend, friction costs and claims settlement time - resulting in improved policy holder and broker experiences
Market Opportunity
The total addressable market (TAM) is estimated at over $3.8 billion(1)
annually - Crawford is well-equipped to take share
(1) Based on Crawford & Company data and estimates
11
//////////////////////////////////////////////////////////////////////////////////////////////////////////////////////////////////////////////////////////////////////
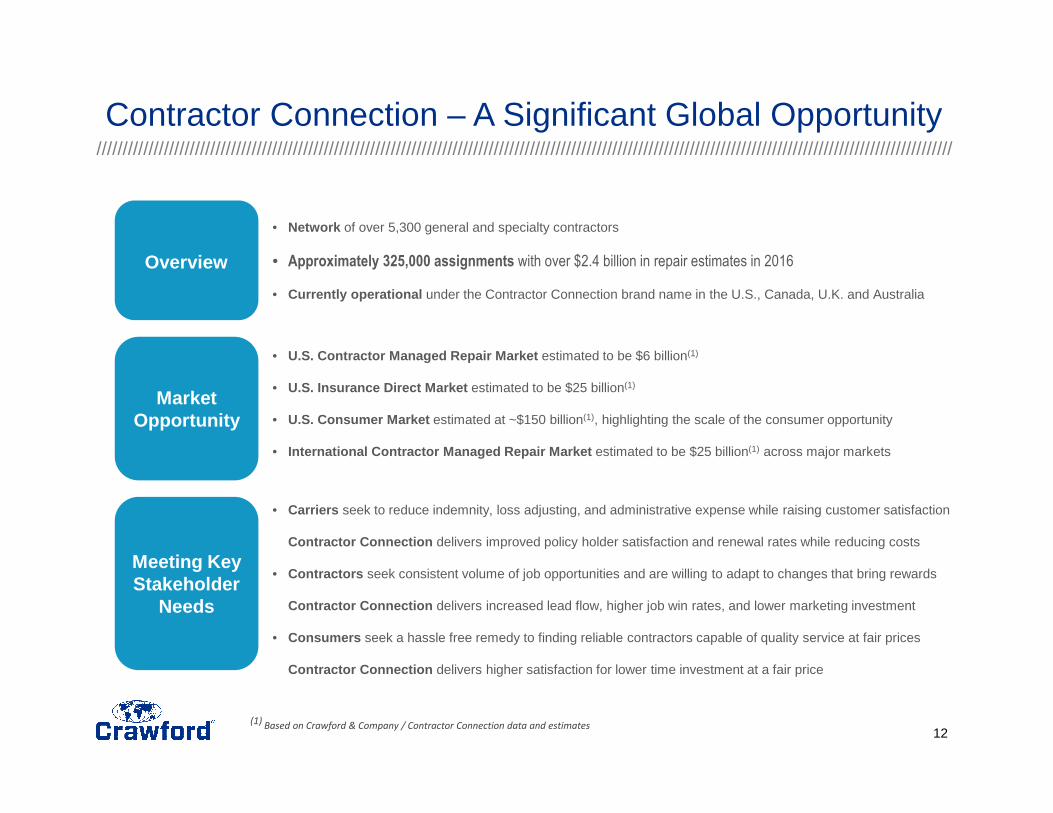
Contractor Connection – A Significant Global Opportunity
• U.S. Contractor Managed Repair Market estimated to be $6 billion(1)
• U.S. Insurance Direct Market estimated to be $25 billion(1)
• U.S. Consumer Market estimated at ~$150 billion(1), highlighting the scale of the consumer opportunity
• International Contractor Managed Repair Market estimated to be $25 billion(1) across major markets
• Carriers seek to reduce indemnity, loss adjusting, and administrative expense while raising customer satisfaction
Contractor Connection delivers improved policy holder satisfaction and renewal rates while reducing costs
• Contractors seek consistent volume of job opportunities and are willing to adapt to changes that bring rewards
Contractor Connection delivers increased lead flow, higher job win rates, and lower marketing investment
• Consumers seek a hassle free remedy to finding reliable contractors capable of quality service at fair prices
Contractor Connection delivers higher satisfaction for lower time investment at a fair price
• Network of over 5,300 general and specialty contractors
• Approximately 325,000 assignments with over $2.4 billion in repair estimates in 2016
• Currently operational under the Contractor Connection brand name in the U.S., Canada, U.K. and Australia
Overview
Market Opportunity
Meeting Key Stakeholder
Needs
(1) Based on Crawford & Company / Contractor Connection data and estimates
12

13
////////////////////////////////////////////////////////////////////////////////////////////////////////////////////////////////
WeGoLook – A Transformative Acquisition
• Acquisition closed on January 4, 2017
• WeGoLook provides crowd sourced field services, leveraging the “gig” economy
• 150+ employees, headquartered in Oklahoma City
• 40,000+ on-demand “Looker” community globally
• Addressable market defined by nearly 200 million inspections with roughly $7 billion in value (1)
• Revenues are expected to grow rapidly over the next three years
• Expanding into both Canada and the UK
• Expected EPS accretion beginning in 2018
• Disrupting the market for high frequency, low severity claims
(1) Based on Crawford & Company data and estimates

14
////////////////////////////////////////////////////////////////////////////////////////////////////////////////////////////////
Broadspire
A global Third Party Administration (TPA) business specializing in servicing the claims needs of corporations, brokers and insurers who wish to take a greater control over the claims process, indemnity spend, and data capture and to access meaningful management information
• Largest global footprint of any third party claims administrator in the world
• Providing an entire range of claims management services
• Large addressable market opportunity positions Broadspire to grow market share and drive revenue growth
o Medical Management is a $3.1bn(1) market opportunity where Broadspire has a 5.2% share
o Broadspire has a 2.8%(2) share of the $4.5bn TPA Casualty market
o Broadspire has re-entered the $2.0bn(3) US Disability market
• Integrated claim and clinical model with ability to quantify program and claim level loss cost savings
• Innovative technology utilizing data analytics with predictive modelling solutions
(1) TAM based on Crawford & Company data
(2) Total Addressable Market (TAM) based on 2015 TPA Directory (2014 results)
(3) According to IBIS World Disability Insurance Report (Aug 2016)

15
////////////////////////////////////////////////////////////////////////////////////////////////////////////////////////////////
Garden City Group
Recognized leader in providing legal administration services for class action settlements, bankruptcy cases, mass tort and legal noticing programs for over 30 years
• Strong senior leadership team
• Brand equity is significant – GCG is a top tier provider of claims administration across the globe, and has dominant market share among large class action cases
• Key 2017 wins include:
o Takata Airbag Individual Restitution Fund
o Ferrick v. Spotify
o TD Bank – Penny Arcade
o Manulife Financial Corporation Securities Class Action
• Challenging conditions in the class action market combined with the expected decline of two large projects led to losses in 2017
• Re-positioning Garden City Group for a return to profitability over time through a focus on growing our global product lines and further cost reductions

//////////////////////////////////////////////////////////////////////////////////////////////////////////////////////////////////////////////////////////////////////
Driving Adjusted EBITDA Margin Expansion
Goal to deliver predictable financial results while reducing weather dependence
Trailing Twelve Month Non-GAAP Adjusted EBITDA Margins (1)
(1) See Appendix for non-GAAP explanation and reconciliation
10.2%
10.9%
11.2%11.4%
11.2%
11.8%11.7%
8%
9%
10%
11%
12%
Q116 Q216 Q316 Q416 Q117 Q217 Q317
16

//////////////////////////////////////////////////////////////////////////////////////////////////////////////////////////////////////////////////////////////////////
Crawford Is Focused On Shareholder Returns
$0.18
$0.24
$0.28 $0.28 $0.28
$0.14
$0.18 $0.20 $0.20 $0.20
2013 2014 2015 2016 2017
Crawford & CompanyCash Dividends Per Share
Class A Common Stock Class B Common Stock
• Crawford continues to return capital to shareholders in the form of quarterly cash dividends and share repurchases
• Through the third quarter Crawford has repurchased ~550k shares of CRD-A and ~176k shares of CRD-B under the Company’s two million share repurchase authorization plan
• Dividends on both the Class A and B shares were stable in 2016 and 2017, after increasing over the prior 3 years
17
18
////////////////////////////////////////////////////////////////////////////////////////////////////////////////////////////////
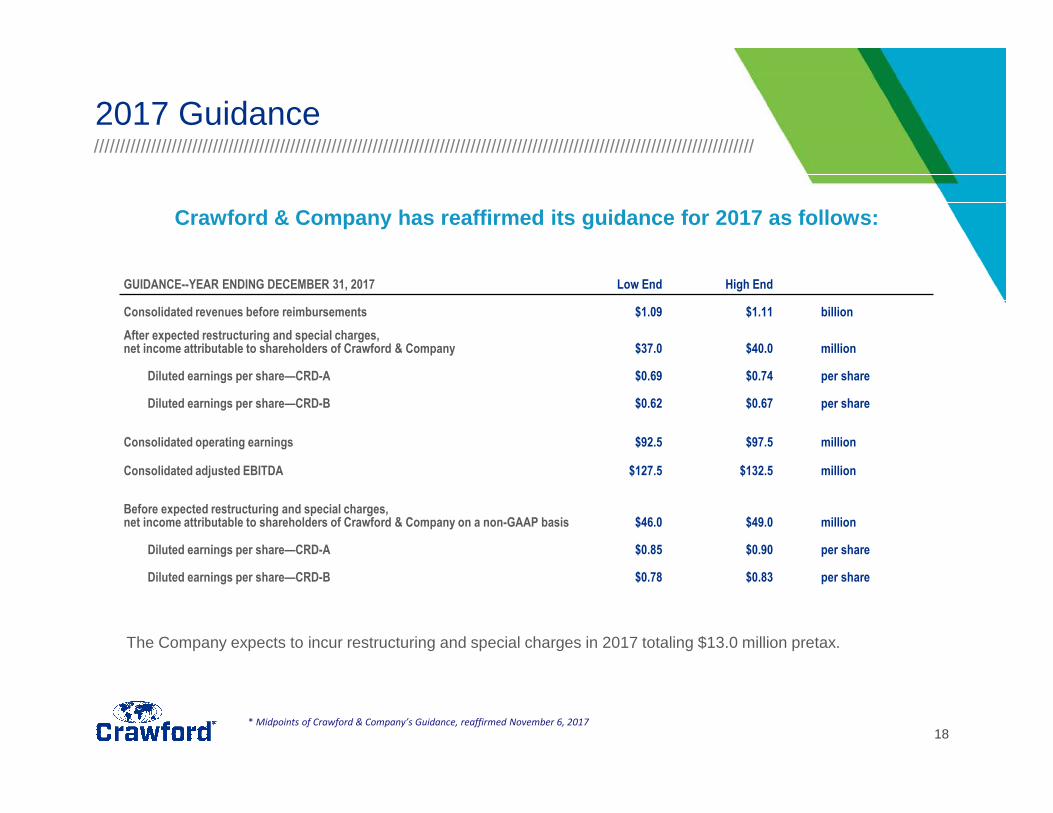
2017 Guidance
Crawford & Company has reaffirmed its guidance for 2017 as follows:
GUIDANCE--YEAR ENDING DECEMBER 31, 2017 Low End High End
Consolidated revenues before reimbursements $1.09 $1.11 billion
After expected restructuring and special charges, net income attributable to shareholders of Crawford & Company $37.0 $40.0 million
Diluted earnings per share—CRD-A $0.69 $0.74 per share
Diluted earnings per share—CRD-B $0.62 $0.67 per share
Consolidated operating earnings $92.5 $97.5 million
Consolidated adjusted EBITDA $127.5 $132.5 million
Before expected restructuring and special charges, net income attributable to shareholders of Crawford & Company on a non-GAAP basis $46.0 $49.0 million
Diluted earnings per share—CRD-A $0.85 $0.90 per share
Diluted earnings per share—CRD-B $0.78 $0.83 per share
The Company expects to incur restructuring and special charges in 2017 totaling $13.0 million pretax.
* Midpoints of Crawford & Company’s Guidance, reaffirmed November 6, 2017

19
////////////////////////////////////////////////////////////////////////////////////////////////////////////////////////////////
Maintain strong fiscal responsibilityContinue expense discipline and make intelligent capital decisions
Growth with a strategic vision Strengthen position in mature markets and increase under penetrated markets
Enhancing global capabilitiesImplement integrated platform and services
Delivering excellence in executionDevelop top talent to provide consistent top performance
Provide targeted sales solutions Deliver customized value propositions to clients
2018 Strategic Initiatives
19

Questions & Answers//////////////////////////////////////////////////////////////////////////

Appendix A: Consolidated Financial Information
//////////////////////////////////////////////////////////////////////////
22
////////////////////////////////////////////////////////////////////////////////////////////////////////////////////////////////
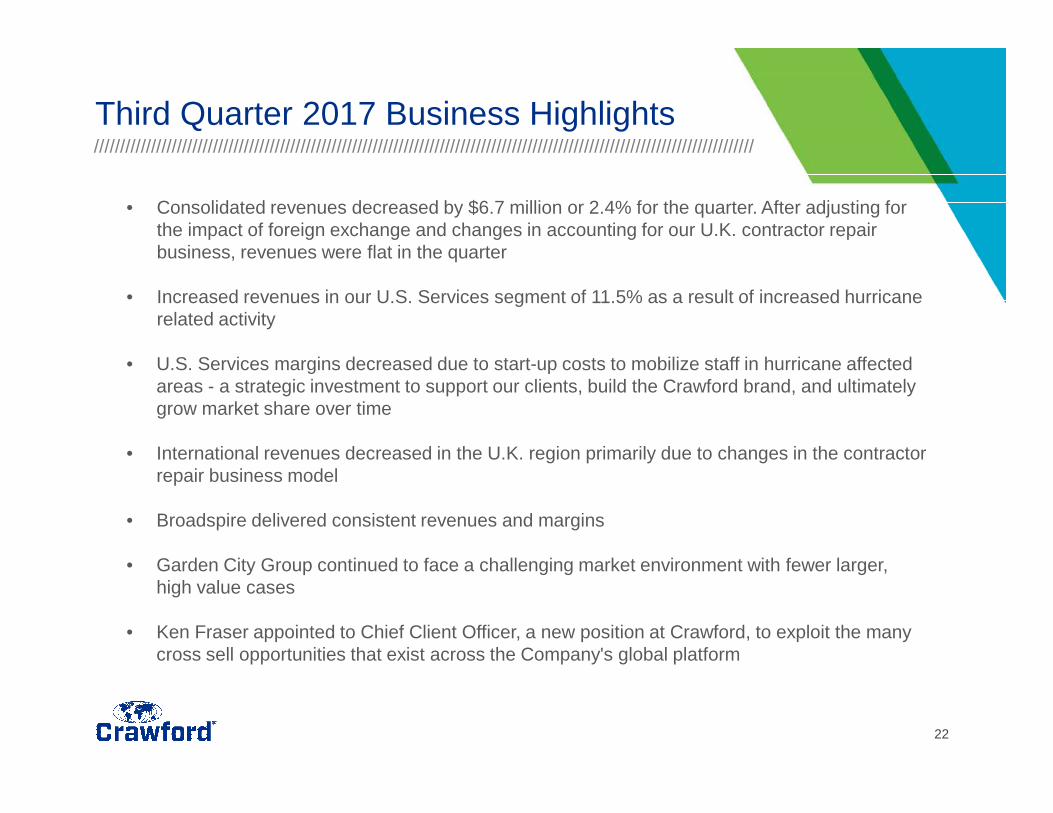
Third Quarter 2017 Business Highlights
• Consolidated revenues decreased by $6.7 million or 2.4% for the quarter. After adjusting for the impact of foreign exchange and changes in accounting for our U.K. contractor repair business, revenues were flat in the quarter
• Increased revenues in our U.S. Services segment of 11.5% as a result of increased hurricane related activity
• U.S. Services margins decreased due to start-up costs to mobilize staff in hurricane affected areas - a strategic investment to support our clients, build the Crawford brand, and ultimately grow market share over time
• International revenues decreased in the U.K. region primarily due to changes in the contractor repair business model
• Broadspire delivered consistent revenues and margins
• Garden City Group continued to face a challenging market environment with fewer larger, high value cases
• Ken Fraser appointed to Chief Client Officer, a new position at Crawford, to exploit the many cross sell opportunities that exist across the Company's global platform

//////////////////////////////////////////////////////////////////////////////////////////////////////////////////////////////////////////////////////////////////////
Third Quarter and Year to Date 2017 Revenues, Operating Earnings & Adjusted EBITDA
Third Quarter
Year to DateRevenues
($ in millions)Consolidated Operating Earnings (1)
($ in millions)
Revenues($ in millions)
Consolidated Operating Earnings (1)
($ in millions)
Adjusted EBITDA (1)
($ in millions)
Adjusted EBITDA (1)
($ in millions)
(1) See Appendix for non-GAAP explanation and reconciliation
24.1
26.3
$15
$18
$20
$23
$25
$28
September 30,2017
September 30,2016
32.5
34.7
$24
$27
$29
$32
$34
$37
September 30,2017
September 30,2016
270.6
277.3
$240
$248
$256
$264
$272
$280
September 30,2017
September 30,2016
807.1 836.9
$600
$650
$700
$750
$800
$850
September 30,2017
September 30,2016
71.6 71.9
$65
$67
$68
$70
$71
$73
September 30,2017
September 30,2016
97.4 97.1
$90
$92
$94
$96
$98
$100
September 30,2017
September 30,2016
23

Appendix B: Non-GAAP Financial Information
//////////////////////////////////////////////////////////////////////////

//////////////////////////////////////////////////////////////////////////////////////////////////////////////////////////////////////////////////////////////////////
Appendix: Non-GAAP Financial Information
Measurements of financial performance not calculated in accordance with GAAP should be considered as supplements to, and not substitutes for, performance measurements calculated or derived in accordance with GAAP. Any such measures are not necessarily comparable to other similarly-titled measurements employed by other companies.
Reimbursements for Out-of-Pocket ExpensesIn the normal course of our business, our operating segments incur certain out-of-pocket expenses that are thereafter reimbursed by our clients. Under GAAP, these out-of-pocket expenses and associated reimbursements are required to be included when reporting expenses and revenues, respectively, in our consolidated results of operations. In this presentation, we do not believe it is informative to include in reported revenues the amounts of reimbursed expenses and related revenues, as they offset each other in our consolidated results of operations with no impact to our net income or operating earnings (loss). As a result, unless noted in this presentation, revenue and expense amounts exclude reimbursements for out-of-pocket expenses.
Segment and Consolidated Operating EarningsOperating earnings is the primary financial performance measure used by our senior management and chief operating decision maker to evaluate the financial performance of our Company and operating segments, and make resource allocation and certain compensation decisions. Management believes operating earnings is useful to others in that it allows them to evaluate segment and consolidated operating performance using the same criteria our management and chief operating decision maker use. Consolidated operating earnings represent segment earnings including certain unallocated corporate and shared costs, but before net corporate interest expense, stock option expense, amortization of customer-relationship intangible assets, goodwill impairment charges, restructuring and special charges, income taxes, and net income or loss attributable to noncontrolling interests.
Adjusted EBITDAAdjusted EBITDA is used by management to evaluate, assess and benchmark our operational results and the Company believes that adjusted EBITDA is relevant and useful information widely used by analysts, investors and other interested parties. Adjusted EBITDA is defined as net income with adjustments for depreciation and amortization, interest expense-net, income tax provision, goodwill impairment charges, restructuring and special charges, and non-cash stock-based compensation expense. Adjusted EBITDA is not a term defined by GAAP and as a result our measure of adjusted EBITDA might not be comparable to similarly titled measures used by other companies.
Non-GAAP Adjusted Net Income and Diluted Earnings per ShareExcluded from non-GAAP adjusted net income and diluted earnings per share are goodwill impairment, restructuring and special charges, which arise from non-core items not directly related to our normal business or operations, or our future performance. Management believes it is useful to exclude these charges when comparing net income and diluted earnings per share across periods, as these charges are not from ordinary operations.
25

26
////////////////////////////////////////////////////////////////////////////////////////////////////////////////////////////////
Reconciliation of Non-GAAP Items Revenue & Trailing Twelve Month Adjusted EBITDA Margins
Q116 Q216 Q316 Q416 Q117 Q217 Q317
Unaudited ($ in thousands)
Total revenues $ 290,908 $ 297,669 $ 295,387 $ 293,624 $ 279,530 $ 283,972 $ 286,666
Reimbursements (13,674) (15,326) (18,101) (21,201) (12,263) (14,725) (16,115)
Revenues before reimbursements $ 277,234 $ 282,343 $ 277,286 $ 272,423 $ 267,267 $ 269,247 $ 270,551
Net income attributable to shareholders of Crawford & Company $ 8,630 $ 8,627 $ 10,945 $ 7,764 $ 7,664 $ 10,201 $ 11,813
Add:
Depreciation and amortization 10,294 10,264 10,085 10,100 10,180 10,178 10,290
Stock-based compensation 729 1,228 1,289 2,006 1,296 2,109 1,568
Net corporate interest expense 2,768 2,523 2,262 1,632 2,036 2,114 2,524
Goodwill impairment charges - - - - - - -
Restructuring and special charges 2,417 3,526 1,488 2,059 605 6,782 1,431
Income taxes 5,307 6,116 8,606 5,536 4,835 6,812 4,922
Adjusted EBITDA $ 30,145 $ 32,284 $ 34,675 $ 29,097 $ 26,616 $ 38,196 $ 32,548
Adjusted EBITDA Margins 10.9% 11.4% 12.5% 10.7% 10.0% 14.2% 12.0%
Trailing Twelve Month Adjusted EBITDA Margin 10.2% 10.9% 11.2% 11.4% 11.2% 11.8% 11.7%
26
27
////////////////////////////////////////////////////////////////////////////////////////////////////////////////////////////////
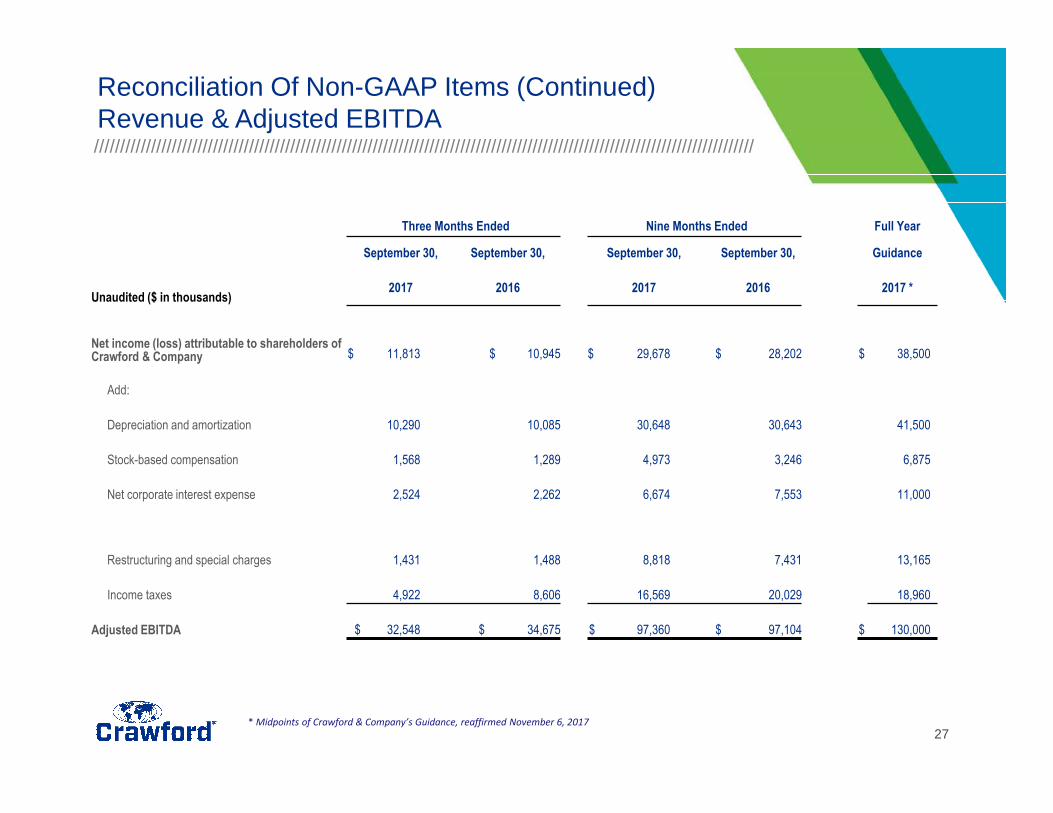
Reconciliation Of Non-GAAP Items (Continued)Revenue & Adjusted EBITDA
Three Months Ended Nine Months Ended Full Year
September 30, September 30, September 30, September 30, Guidance
Unaudited ($ in thousands)2017 2016 2017 2016 2017 *
Net income (loss) attributable to shareholders of Crawford & Company $ 11,813 $ 10,945 $ 29,678 $ 28,202 $ 38,500
Add:
Depreciation and amortization 10,290 10,085 30,648 30,643 41,500
Stock-based compensation 1,568 1,289 4,973 3,246 6,875
Net corporate interest expense 2,524 2,262 6,674 7,553 11,000
Restructuring and special charges 1,431 1,488 8,818 7,431 13,165
Income taxes 4,922 8,606 16,569 20,029 18,960
Adjusted EBITDA $ 32,548 $ 34,675 $ 97,360 $ 97,104 $ 130,000
* Midpoints of Crawford & Company’s Guidance, reaffirmed November 6, 2017

28
////////////////////////////////////////////////////////////////////////////////////////////////////////////////////////////////
Reconciliation Of Non-GAAP Items (Continued)Non-GAAP Adjusted Net Income & Diluted EPS
Guidance for year ending December 31, 2017 based on midpoints
Unaudited ($ in thousands)Income Before
Taxes Income Taxes Net Income
Net Income Attributable to
Crawford & Company
Diluted Earnings per CRD-A Share
Diluted Earnings per CRD-B Share
GAAP $ 57,560 $ (18,960) $ 38,600 $ 38,500 $ 0.71 $ 0.64
Add back:
Restructuring and special charges 13,165 (4,344) 8,821 8,821 0.16 0.16
Non-GAAP Adjusted $ 70,725 $ (23,304) $ 47,421 $ 47,321 $ 0.87 $ 0.80
Year Ended December 31, 2016
Unaudited ($ in thousands)Income Before
Taxes Income Taxes Net Income
Net Income Attributable to
Crawford & Company
Diluted Earnings per CRD-A Share
Diluted Earnings per CRD-B Share
GAAP $ 63,241 $ (25,565) $ 37,676 $ 35,966 $ 0.67 $ 0.60
Add back:
Restructuring and special charges 9,490 (3,120) 6,370 6,370 0.12 0.11
Non-GAAP Adjusted $ 72,731 $ (28,685) $ 44,046 $ 42,336 $ 0.79 $ 0.71
Year Ended December 31, 2015
Unaudited ($ in thousands)Income Before
Taxes Income Taxes Net Income
Net Income Attributable to
Crawford & Company
Diluted Earnings per CRD-A Share
Diluted Earnings per CRD-B Share
GAAP $ (31,773) $ (13,832) $ (45,605) $ (45,488) $ (0.79) $ (0.87)
Add back:
Goodwill impairment charges 49,314 (1,706) 47,608 47,608 0.86 0.86
Restructuring and special charges 34,395 (9,046) 25,349 25,349 0.46 0.46
Non-GAAP Adjusted $ 51,936 $ (24,584) $ 27,352 $ 27,469 $ 0.53 $ 0.45
28