Embed Size (px)
Citation preview

Necessity is the mother of invention
Plato
(Greek philosopher, 429/423 BC – 348/347 BC)

Promotor: Prof. Dr. ir. Karel De Schamphelaere
Department of Applied Ecology and Environmental Biology
Laboratory of Environmental Toxicology and Aquatic Ecology
Environmental Toxicology Group (GhenToxLab)
Dean: Prof. Dr. ir. Guido Van Huylenbroeck
Rector: Prof. Dr. Anne De Paepe
JANA ASSELMAN
TRANSCRIPTOMIC PROFILES AND FITNESS OF DAPHNIA EXPOSED TO
CYANOBACTERIA AND INTERACTIONS WITH INSECTICIDES.
Thesis submitted in fulfillment of the requirements
for the degree of Doctor (PhD) in Applied Biological Sciences

Dutch Title: Genexpressieprofielen en reproductiepotentieel van Daphnia blootgesteld aan
cyanobacterien en interacties met insecticiden
Cover: Gene networks generated with Cytoscape ©, Daphnia image modified from De Coninck (2014).
Created and edited by Jana Asselman
Reference:
Asselman J, 2014. Transcriptomic profiles and fitness of daphnia exposed to cyanobacteria and
interactions with insecticides. Thesis submitted in fulfillment of the requirements for the degree of
Doctor (PhD) in Applied Biological Sciences, Ghent University, Ghent, Belgium.
ISBN-number:
ISBN 978-90-5989-700-7
The author and promotor give the authorisation to consult and to copy parts of this work for personal
use only. Every other use is subject to the copyright laws. Permission to reproduce any material
contained in this work should be obtained from the author.

Jana Asselman was financially supported by a personal PhD grant
from the Institute for the Promotion of Innovation through Science
and Technology in Flanders (IWT-Vlaanderen)
Experimental work for this dissertation was performed at:
the Environmental Toxicology Group (GhenToxLab), Laboratory of Environmental Toxicology
and Aquatic Ecology, Faculty of Bioscience Engineering, Ghent University, Ghent, Belgium
the Shaw Lab, School of Public and Environmental Affairs, Indiana University, Bloomington,
IN, USA
the Pfrender Lab, Department of Biological Sciences, University of Notre Dame, Notre Dame,
IN, USA
This research contributed to and benefitted from the Daphnia Genomics Consortium


i
Acknowledgement
About 150 years ago Charles Dickens started his most famous work, “A tale of two cities”, as follows:
“It was the best of times, it was the worst of times.” Although Charles Dickens may have written those
words to characterize the relationship between France and England at the end of the French
Revolution, it perfectly describes four years of doctoral study. To me, it reminds me of that feeling
when your first paper is accepted or when you just received your very first scientific prize. But it also
brings back memories of those long hours in the lab that still resulted in a failed experiment, those
inexplicable errors in a programming code that you just cannot seem to resolve.
Four years of doctoral study are however not spent in isolation and Dickens’ continuation, i.e. “It was
the age of wisdom, it was the age of foolishness.”, perfectly highlights that. It reminds me of the
guidance that I have benefitted from with Karel as my promoter. He often mentioned that he was but a
novice in omics research and bioinformatics. Yet, this often put me on the spot as he was extremely
critical about any new methodology, experimental design or analysis. He has instilled in me a critical
and analytical way of thinking that has been extremely invaluable in my scientific research. Although
he has always given me enough freedom and opportunities to pursue my own scientific interests and
research, he always steered me in the right direction. He stimulated me to not foolishly and
unreservedly put my faith in commonly used techniques or practices but rather critically evaluate them
and extract the good parts and make it better. This perfectly fits with Dickens next phrase, “It was the
epoch of belief, it was the epoch of incredulity.”
“It was the season of light, it was the season of darkness.” A PhD is achieved with ups and downs, it
feels like a free ride on an emotional rollercoaster. Luckily for me, that rollercoaster was always filled
with caring and loving people. Friends and family made sure that even in the darkest times there was
light brightly shining through. The friends of the GSR, the friends of the Rooiegemlaan, and An-Sofie in
particular, were always there to lighten up the atmosphere. But, the brightest torch of all was always
carried by my close family. I never knew who was more enthusiastic about an accepted talk at a
conference, a new research opportunity abroad, me or my parents? It is unique to have parents who
give their unwavering support to their children regardless of their choices, but I was lucky enough to
have two. But it does not end there, indeed, I seem to have won the lottery with my husband Dieter.

ii
Dieter, my greatest fan and my severest critic, has not only been a beacon of love and support but a
fountain of wisdom that has been my scientific first aid kit for the last four years.
“It was the spring of hope, it was the winter of despair.” Unlike in Charles Dickens pessimistic view, in
my optimistic way of thinking winter comes before the spring, despair before hope. It is so
characteristic for science, failure followed by solution, Eureka!. Or in other words, in a good
environment, everything will fall into place eventually. Whether I was in Ghent, in the GhenToxLab, in
Bloomington, in the Shaw Lab or in Notre Dame, in the Pfrender lab, I was always able to conduct my
research in constructive and enthusiastic environment. There was always a helping hand in the lab or
in the office when needed, always someone ready to help out when you were ill or could not make it in
the weekend. I remember the nightly hours with Jackie in the Pfrender lab to finish all the microarrays
or the whiteboard discussion in the Shaw lab with Chip to resolve the mystery of the MessageAmp kits
or the determination of Nancy to detect those extremely low concentrations of pesticides with the GC
in the GhenToxLab. All of the labs I have worked in where also extremely social environments. From
birthday cakes and donuts to after work drinks and team buildings, work hard, play hard.
“We had everything before us, we had nothing before us.” Four years later, now at the end of the PhD,
I think the future lies brightly ahead. I have met so many amazing people at UGent, IU or Notre Dame,
through the Daphnia Genomics Consortium and through SETAC who I am sure will cross my path
again in the future. And to end with a final quote: “I can`t tell where journey will end, but I know where
to start.”

iii
Table of contents
Acknowledgement .....................................................................................................................................i
Table of contents ..................................................................................................................................... iii
List of abbreviations ..................................................................................................................................v
Chapter 1 ................................................................................................................................................. 1
General introduction and conceptual framework ..................................................................................... 1
Chapter 2 ............................................................................................................................................... 35
A comparison of the sensitivity of Daphnia pulex to different cyanobacterial species .......................... 35
Chapter 3 ............................................................................................................................................... 49
Combined and interaction effects of cyanobacteria and insecticides across full concentration
responses .............................................................................................................................................. 49
Chapter 4 ............................................................................................................................................... 73
Combined effects of cyanobacteria and insecticides across a large set of combinations .................... 73
Chapter 5 ............................................................................................................................................... 91
Identification of pathways, gene networks and paralogous gene families in D. pulex responding to
exposure to the toxic cyanobacterium Microcystis aeruginosa. ............................................................ 91
Chapter 6 ............................................................................................................................................. 109
General and specific molecular mechanisms of cyanobacterial toxicity in Daphnia pulex ................. 109
Chapter 7 ............................................................................................................................................. 125
Combined effects of cyanobacteria and insecticides at the transcriptomic level ................................ 125
Chapter 8 ............................................................................................................................................. 147
Integration of transcriptomic and organismal data to study combined effects of cyanobacteria and
insecticides .......................................................................................................................................... 147
Chapter 9 ............................................................................................................................................. 175
General Conclusion and further research perspectives ...................................................................... 175

iv
References .......................................................................................................................................... 187
Summary ............................................................................................................................................. 211
Samenvatting ....................................................................................................................................... 217
Curriculum Vitae .................................................................................................................................. 225
Appendix A .......................................................................................................................................... 237
Supplementary material for Chapter 2 ................................................................................................ 237
Appendix B .......................................................................................................................................... 245
Supplementary material for Chapter 3 ................................................................................................ 245
Appendix C .......................................................................................................................................... 259
Supplementary material for Chapter 4 ................................................................................................ 259
Appendix D .......................................................................................................................................... 267
Supplementary material for Chapter 5 ................................................................................................ 267
Appendix E .......................................................................................................................................... 277
Supplementary material for Chapter 6 ................................................................................................ 277
Appendix F........................................................................................................................................... 301
Supplementary material for Chapter 7 ................................................................................................ 301

v
List of abbreviations
AIC Aikaike Information Criterion
ANA Anabaena
ANOVA Analysis of Variance
AOP Adverse Outcome Pathway
APH Aphanizomenon
ATP Adenosine Triphosphate
BMAA Beta-Methylamino-L-alanine
CA Concentration Addition
cDNA Complementary DeoxyriboNucleic Acid
CICCM Cawthron Institute Culture Collection of Micro-algae
CYL Cylindrospermopsis
DE Differentially Expressed
DNA DeoxyriboNucleic Acid
EC Enzyme Classification
EC50 Effect Concentration causing 50% effect
ECx Effect Concentration causing x% effect
EFSA European Food Safety Authority
ELISA Enzyme-linked Immunosorbent Assay
EU European Union
FAME Fatty Acid Methyl Esther
FDR False Discovery Rate
GC Gas Chromatography
GEO Gene Expression Omnibus
GLM General Linearized Model
GO Gene Ontology
IA Independent Action
IRAC Insecticide Resistance Action Committee
KAAS KEGG Automatic Annotation Server
KEGG Kyoto Encyclopedia of Genes and Genomes
KO Kegg Orthology
KOG Eukaryotic Orthology Groups
LIMMA Linear Models for Microarray Data
LPS Lipopolysaccharide
Mb Megabase
MC Microcystis

vi
MTBE Methyl-tert-butylether
NA Not Available
NADH Nicotinamide Adenine Dinucleotide
NCBI National Centre for Biotechnology Information
NIH National Institutes of Health
NOD Nodularia
OECD Organisation for Economic Cooperation and Development
OSL Oscillatoria
PCB Polychlorinated biphenyl
PCC Pasteur Culture Collection
PCR Polymerase Chain Reaction
PPP Plant Protection Product
PUFA Poly Unsaturated Fatty Acids
qPCR quantitative Polymerase Chain Reaction
RNA Ribonucleic Acid
SCCAP Scandinavian Culture Collection for Algae and Protozoa
SCCS Scientific Committee on Consumer Safety
SCENIHR Scientific Committee on Emerging and Newly Identified Health Risks
SCHER Scientific Committee on Health and Environmental Risks
Sig Significance
SPE Solvent-phase Extraction
SSE Sum of Squared Errors
US EPA United States Environmental Protection Agency
USA United States of America
UTEX University of Texas Culture Collection
UV Ultraviolet
WGCNA Weighted Gene Co-Expression Network
WHO World Health Organization

Chapter 1
General introduction and conceptual
framework


General introduction and conceptual framework
3
Organisms inhabit complex environments leaving them exposed to various stressors of both
anthropogenic and natural origin. This contradicts current standard ecotoxicity experiments where
organisms are exposed to a single stressor under controlled conditions. The definition of stress in this
dissertation follows Bradshaw and Hardwick (1989), Calow (1989), Heugens et al. (2001), Koehn and
Bayne (1989), Sibly and Calow (1989) where stress is defined as “an environmental change that
affects the functioning of organisms (i.e., growth and reproduction), leading to reduced fitness”. In
environmental reality, the response of organisms is therefore often the result of complex interactions
that cannot be easily disentangled into effects attributed to each individual stressor. Indeed, the effects
of multiple stress might be larger (synergistic effect) or smaller (antagonistic effect) than the sum of the
effects of each of the individual stressors (Van Gestel et al. 2010).
1.1 Interaction effects
In the last decade, an increasing number of studies have addressed this discrepancy between
laboratory settings of “single stress” versus the environmental reality of “multiple stress”. Holmstrup et
al. (2010) reviewed 159 studies which focused on interactions between anthropogenic and natural
stressors. In the majority of these studies synergistic effects were observed. For combinations of heat
stress and chemical stress, synergistic effects, i.e. more negative effects than expected, were
observed in almost 80% of the studies. For example, Heugens et al. (2003) observed increased
mortality in acute toxicity experiments with Daphnia exposed to cadmium when the temperature was
higher than the thermal tolerance of the Daphnia. In addition, uptake rates of cadmium were observed
to be higher at 20°C than at 10°C suggesting increasing cadmium accumulation with increasing
temperature. Heugens et al. (2003) conclude that the synergistic effect, i.e. increased mortality,
depends upon the temperature which influences both the thermal tolerance as well as the uptake rate
of cadmium. Antagonistic effects, i.e. more positive effects than expected, were observed in less than
10% of the studies. For example, Perschbacher (2005) observed decreasing copper toxicity with
increasing temperature in the catfish Ictalurus punctatus which resulted in increased survival. They
speculated a better functioning of resisting mechanism for copper toxicity with increasing
temperatures, which resulted in an increased survival of the fish at 27°C compared to 23°C.
Heugens et al. (2001) studied interaction effects from a different perspective. They reanalyzed
experimental data available in literature and used mathematical equations to model relationships
Chapter 1
4
between natural and chemical stressors. Heugens et al. (2001) observed that in about 70% of the
analyzed studies toxicity of the chemical increases with increasing temperature. In general, Heugens
et al. (2001) observed that organisms living in conditions close to their thermal tolerance were more
susceptible to the toxicity of a chemical than organisms living in optimal conditions. Similarly for
nutritional state, they observed that increasing starvation, i.e. decreasing nutritional state, increased
the toxicity of the chemical in 80% of the analyzed studies. Furthermore, transgenerational effects
were also observed for Daphnia species. Heugens et al. (2003) concluded that daphnids from well-fed
mothers were more susceptible to toxicants than daphnids from poor-fed mothers indicating that
interactions or multiple stress can affect not only the current generation but also future generations.
Different results were obtained for interactions with salinity. Overall, increasing salinity resulted in a
decrease of metal toxicity due to a decreased bio-availability of the metal. In contrast, increasing
salinity resulted in an increased toxicity of organophosphate pesticides due to increased accumulation.
No clear relationship was observed between salinity and the toxicity of other chemicals. Laskowski et
al. (2010) found significant interactions between chemicals and environmental factors in over 60% of
the studied cases without specifying the direction of the interaction effects.
The majority of reported studies discuss effects of combinations of two stressors. Yet, many more
possible combinations exist. Laskowski et al. (2010) report two papers studying three-factor
interactions. A detailed study by Coors and De Meester (2008) focused on the potential three way
interactions between predation, parasitism and pesticides on Daphnia magna. They observed
synergistic effects on survival, i.e. decreased survival, between pesticide exposure and parasite
challenge. According to Coors and De Meester (2008), this suggests a potential immunomodulatory
activity of the pesticide. In contrast, predation threat showed antagonistic effects when combined with
either a parasite challenge or a pesticide exposure on the number of offspring in the first brood.
Although all three stressors together did not result in synergistic or antagonistic effects on the age and
size of maturity, the combined effects of these three stressors resulted in a considerable delay in the
onset of reproduction compared to control conditions. These results clearly indicate that adding only a
third factor already significantly complicates the potential effects and interactions on the organism.
Interaction effects under multiple stress conditions may thus significantly complicate risk assessment
approaches of chemicals (Hooper et al., 2013; Moe et al., 2013), which are currently still primarily
General introduction and conceptual framework
5
focused on a chemical-by-chemical basis (Landis et al., 2013; Van Gestel et al, 2010). Consequently,
there is a need for additional knowledge concerning these combined and interaction effects to improve
current risks assessment practices. Indeed, without taking interaction effects into consideration,
predicted effects based on single substance datasets may over- or underestimate the effects actually
occurring in the environment (Moe et al., 2013; Van Gestel et al., 2010). Although adding additional
safety factors may alleviate the potential negative impact on the aquatic ecosystem, unfounded safety
factors may hamper economic activities. Therefore, there is a need for a science-based approach that
will adequately assess the risks of complex environments.
At present, three main factors are still lacking to construct an adequate scientific framework for the
effects of multiple stress. The first is the lack of a general statistical framework and terminology. The
second is the lack of predictive or mechanistic models for interaction effects. The third factor is the
lack of a comprehensive database that allows easy comparison across different multiple stress
combinations.
1.1.1 A defined statistical framework for combined effects
Despite the growing body of literature on interaction effects under multiple stress conditions, a general
statistical framework remains to be adopted. Studies described by Laskowski et al. (2010) used six
different statistical methodologies: analysis of variance (ANOVA), general linear model (GLM),
Kruskal-Wallis test, χ2 test and two MixToxmodels as developed by Jonker et al. (2005). Holmstrup et
al. (2010) also observed a wide variety of statistical methods without referring to the specific methods
used in each study.
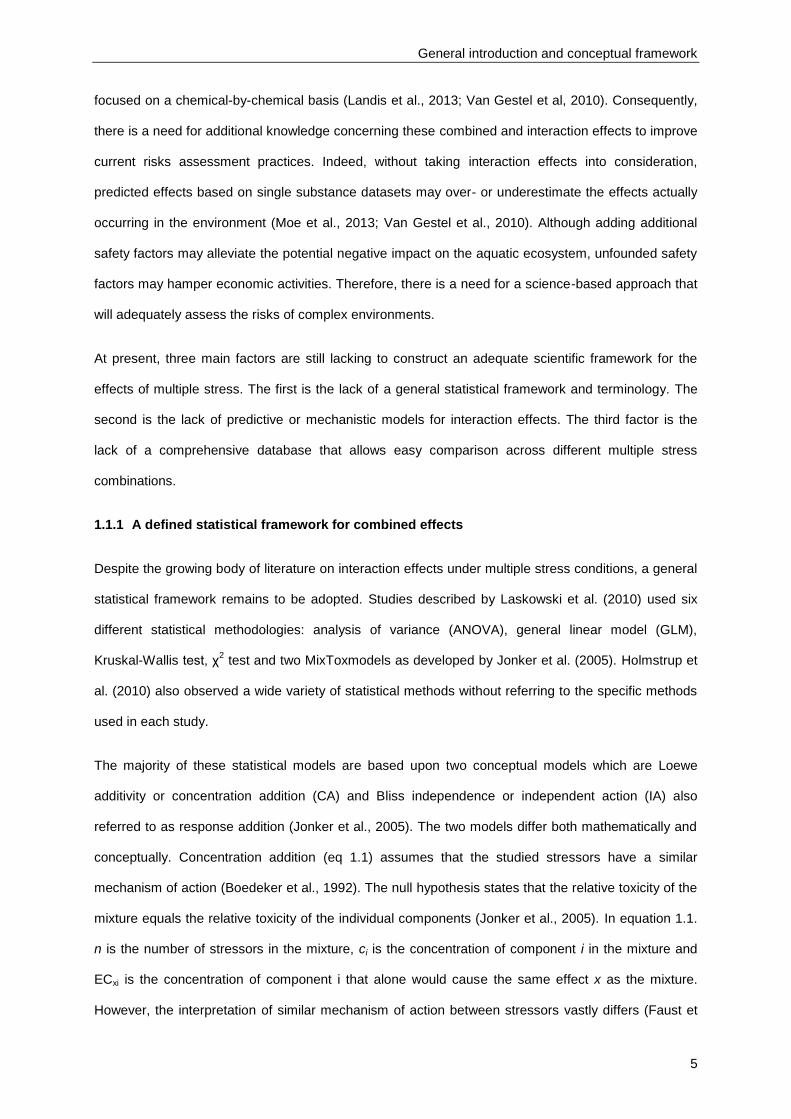
The majority of these statistical models are based upon two conceptual models which are Loewe
additivity or concentration addition (CA) and Bliss independence or independent action (IA) also
referred to as response addition (Jonker et al., 2005). The two models differ both mathematically and
conceptually. Concentration addition (eq 1.1) assumes that the studied stressors have a similar
mechanism of action (Boedeker et al., 1992). The null hypothesis states that the relative toxicity of the
mixture equals the relative toxicity of the individual components (Jonker et al., 2005). In equation 1.1.
n is the number of stressors in the mixture, ci is the concentration of component i in the mixture and
ECxi is the concentration of component i that alone would cause the same effect x as the mixture.
However, the interpretation of similar mechanism of action between stressors vastly differs (Faust et
Chapter 1
6
al., 2003). A strict pharmacological viewpoint defines similar mechanism of action as interacting with
the same molecular target site (Pöch, 1993), whereas from a broad phenomenological viewpoint a
similar mechanism of action may also be causing a common toxicological response (Berenbaum,
1989). As a consequence, concentration addition has therefore been suggested to be applicable for all
chemicals (Berenbaum, 1989).
∑
(eq 1.1.)
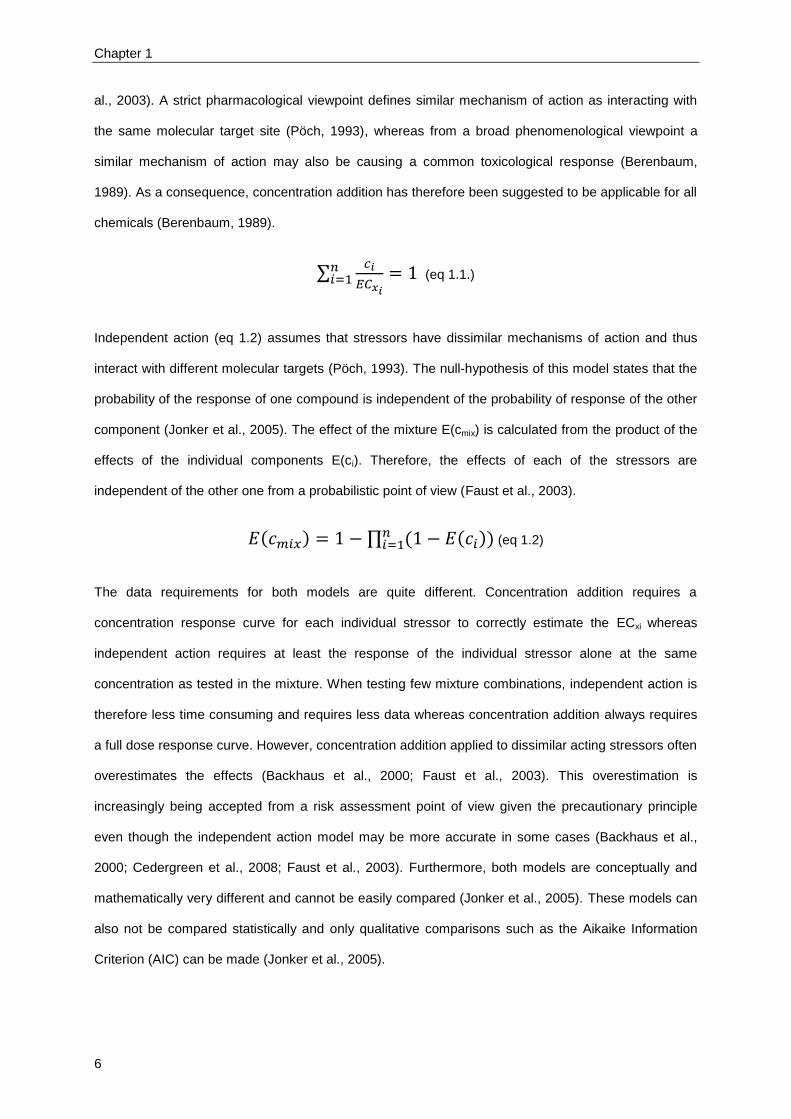
Independent action (eq 1.2) assumes that stressors have dissimilar mechanisms of action and thus
interact with different molecular targets (Pöch, 1993). The null-hypothesis of this model states that the
probability of the response of one compound is independent of the probability of response of the other
component (Jonker et al., 2005). The effect of the mixture E(cmix) is calculated from the product of the
effects of the individual components E(ci). Therefore, the effects of each of the stressors are
independent of the other one from a probabilistic point of view (Faust et al., 2003).
( ) ∏ ( ( )) (eq 1.2)
The data requirements for both models are quite different. Concentration addition requires a
concentration response curve for each individual stressor to correctly estimate the ECxi whereas
independent action requires at least the response of the individual stressor alone at the same
concentration as tested in the mixture. When testing few mixture combinations, independent action is
therefore less time consuming and requires less data whereas concentration addition always requires
a full dose response curve. However, concentration addition applied to dissimilar acting stressors often
overestimates the effects (Backhaus et al., 2000; Faust et al., 2003). This overestimation is
increasingly being accepted from a risk assessment point of view given the precautionary principle
even though the independent action model may be more accurate in some cases (Backhaus et al.,
2000; Cedergreen et al., 2008; Faust et al., 2003). Furthermore, both models are conceptually and
mathematically very different and cannot be easily compared (Jonker et al., 2005). These models can
also not be compared statistically and only qualitative comparisons such as the Aikaike Information
Criterion (AIC) can be made (Jonker et al., 2005).
General introduction and conceptual framework
7
In addition, terminology differs between the two models but is often used interchangeably. For
example, effects are often referred to as additive in terms of concentration addition even when
analyzed with the independent action concept or with an ANOVA model (Cerbin et al., 2010; Coors
and De Meester, 2008). To avoid confusion, it is therefore necessary to either place such statements
in the context of the reference model or to refer to more general terminology such as no interaction or
absence of interaction. Also, mixture toxicity and interaction effects are often used interchangeably
although they are quite different. Mixture toxicity refers to the toxicity of the mixture which is most often
more toxic than either of the compounds alone or in other words mixture toxicity refers to the
combined effects of the stressors. In contrast, interaction effects refer to a statistical context in which
interaction occurs because the predicted toxicity of the mixture tested differs from the observed toxicity
of that same mixture. As a consequence, the mixture toxicity can be higher than the toxicity of the
compounds alone without the presence of interaction effects or mixture toxicity can be lower than the
toxicity of the compounds alone with the presence of interaction effects. To avoid confusion, this
dissertation will use the terminology of combined and interaction effects rather than mixture toxicity.
1.1.2 Predictive and mechanistic models for interaction effects
Currently, neither the concentration addition model nor the independent action model allow predicting
the occurrence of interaction (Belden and Lydy, 2006). Both models can only predict the toxicity of the
combination of stressors under the hypothesis of non-interaction. Interactions are thus detected by
comparing the observed response versus the predicted response which requires actual experiments.
This has of course significant consequences for risk assessment as it means that interaction effects
can only be incorporated by testing each potential combination of stressors, which is unfeasible.
Nevertheless, current models do allow for incorporation of combined effects under the hypothesis of
no interaction.
The lack of predictive models could potentially be attributed to the lack of mechanistic knowledge.
Most studies regarding interactions focus on life history responses (Cedergreen et al., 2008; Faust et
al., 2003; Jonker et al., 2005). Yet, these types of data may not contain sufficient information to
enhance the current mechanistic understanding of interaction effects which is crucial in developing
predictive models. New emerging technologies are currently being used to improve our understanding
of interaction effects and will be discussed further on (Altenburger et al., 2012).

Chapter 1
8
1.1.3 The need for comprehensive comparative datasets
Any general accepted statistical framework or mechanistic model needs to be validated across a
comprehensive dataset. At present, few studies have generated such datasets. Faust et al. (2003) and
Backhaus et al. (2000) investigated a rather large number of compounds but in a single
multicomponent mixture at various concentrations of the different compounds. Cedergreen et al.
(2008) were able to compare seven mixture combinations with the same statistical models, CA and IA.
In reviews by Holmstrup et al. (2010), Heugens et al. (2001) and Laskowski et al. (2010), a large
number of multiple stress studies were collected but given the differences in experimental design no
statistical comparison was possible with a single model across all the collected studies as insufficient
data was available about each of the studies. Clearly, there is a need to generate larger datasets
standardized in experimental design to allow extensive comparisons of statistical and mechanistic
models. Results of such comparisons can then be used to suggest and validate general frameworks
that can be subsequently applied in risk assessment.
Based on recent reviews and literature, interaction effects under multiple stress conditions
occur in at least half of the investigated studies. Yet, a generalized statistical framework as well
as predictive models are lacking. These are however necessary to incorporate effects of
multiple stress in risk assessment, but they first need to be scientifically validated across a
comprehensive comparative dataset which is currently lacking.
1.2 Cyanobacteria
Cyanobacteria are unicellular organisms, also referred to as blue green algae. Unlike other
prokaryotes, cyanobacteria have the ability to carry out oxygen-producing photosynthesis (Schopf,
2000). Therefore, some botanists consider them as a division of algae while their cellular and
organismal morphology resembles that of bacteria (Stanier et al., 1971). At present, they are classified
as bacteria with about 150 genera and more than 2000 species (van Apeldoorn, 2006; Fristachi and
Sinclair, 2008). They have been dated back to more than 3 billion years ago based upon fossil
evidence in Western Australia (Schopf, 2000). The conditions of the earth were then vastly different
from the current environment. Anoxia, increased UV exposure and increased temperature compared
to current conditions together with high levels of iron, methane and sulfur were environmental factors
General introduction and conceptual framework
9
shaping cyanobacteria evolution (Paul, 2008). This evolutionary history has been put forward as an
explanation to why cyanobacteria currently thrive in extreme environments or under high
environmental stress (Paul, 2008). Cyanobacteria have gained interest over the last century due to
their toxicity which resulted in poisonings of fish, wild life and livestock in freshwater environments
(Codd, 1995; Duy et al., 2000) as well as due to their presence in bloom formation (Peperzak, 2003).
1.2.1 Impact of cyanobacteria on the environment
Cyanobacteria and in particular cyanobacterial blooms can significantly impact freshwater
environments due to a variety of factors. Cyanobacteria are known to produce a wide range of
secondary metabolites of which some can be extremely toxic (Chorus et al., 2001; Gerwick et al.,
2001). At present, toxin production by cyanobacteria has been estimated to include 40 genera, the
main ones are Anabaena, Aphanizomenon, Cylindrospermopsis, Lyngbya, Microcystis, Nostoc and
Oscillatoria (van Apeldoorn et al., 2007). A variety of different types of toxins has been identified and is
summarized in Table 1.1. Specific guidelines with regards to drinking water quality have been derived
for some toxins (Table 1.1) although an overall guideline is also available. The World Health
Organization (WHO) defines risk levels based upon cyanobacteria cells/ml, where 20,000 cells/ml
defines low risk, 100,000 cells/ml moderate risks and bloom formation is defined as high risk (WHO,
2005). In addition to toxin production, cyanobacterial blooms can impact aquatic ecosystems through a
variety of factors. First, adverse tastes and odors hamper the use of water bodies with cyanobacterial
blooms for both drinking water and recreational use (Paerl et al., 2001). Second, cyanobacterial
blooms may “rob” the underlying water layers of oxygen, causing physicochemical changes in the
water leading to hypoxia and anoxia which will kill most fauna (Jankowski et al., 2006; Paerl et al.,
2001). Indeed, at high bloom densities, nutrients and resources are rapidly depleted which will
ultimately lead to a sudden decline in biomass, which in turn leads to decaying scums that consume
large amounts of oxygen (Paerl et al., 2001). Third, cyanobacterial blooms may deplete nutrient
resources in the water body (O’Neil et al., 2012; Paerl et al., 2001). Fourth, cyanobacteria outcompete
phytoplankton species generally abundant in lakes and ponds which directly affects zooplankton
species for which the phytoplankton serves as a food source (Paerl et al., 2001). Therefore,
cyanobacteria and cyanobacterial blooms have been identified as significant threats to aquatic
ecosystems and even human health (Carmichael et al., 1985; Carmichael, 2001; Paerl et al., 2001).

Chapter 1
10
Table 1.1 Overview of cyanobacterial toxins, their chemical structure, mechanism of action and the
drinking water guideline and source organisms (van Apeldoorn et al., 2007). NA = not available
Name Chemical structure
Mechanism of action
Drinking water guideline
Genera know to produce the toxins
Microcystin Cyclic peptide Eukaryotic protein serine/threonine phosphatases 1A and 2A inhibitor
1 µg/L1 Microcystis, Anabaena,
Oscillatoria, Nostoc
Nodularin Monocyclic pentapeptide
Eukaryotic protein serine/threonine phosphatases 1A and 2A inhibitor
10 µg/L2 Nodularia
Anatoxin-a Alkaloid Stereospecific nicotinic agonist
1 µg/L3
Anabaena, Aphanizomenon, Cylindrospermopsis, Oscillatoria
Anatoxin-a(s) Guanidium methyl phosphate ester
Choline esterase inhibitor
1 µg/L3 Anabeana, Aphanizomenon
Cylindrospermopsin Tricyclic alkaloid Cytotoxin: irreversible protein synthesis inhibition
1 µg/L3
Cylindrospermopsis, Aphanizomenon, Umezaka,
Rhadiopsis
Saxitoxin Carbamate alkaloid
Voltage gated Sodium channel antagonist
3 µg/L3
Anabaena, Aphanizomenon, Oscillatoria
Aplysiatoxin Phenolic bislacton
Protein kinase C activator – tumor promoter
NA Marine species such as Lyngbia
Lyngbyatoxin Isomer of teleocidin A
Not determined NA Lyngbia
1 WHO, 2005
2 Fitzgerald et al., 1999.
3 Burch, 2008
1.2.2 Cyanobacteria as an emerging threat
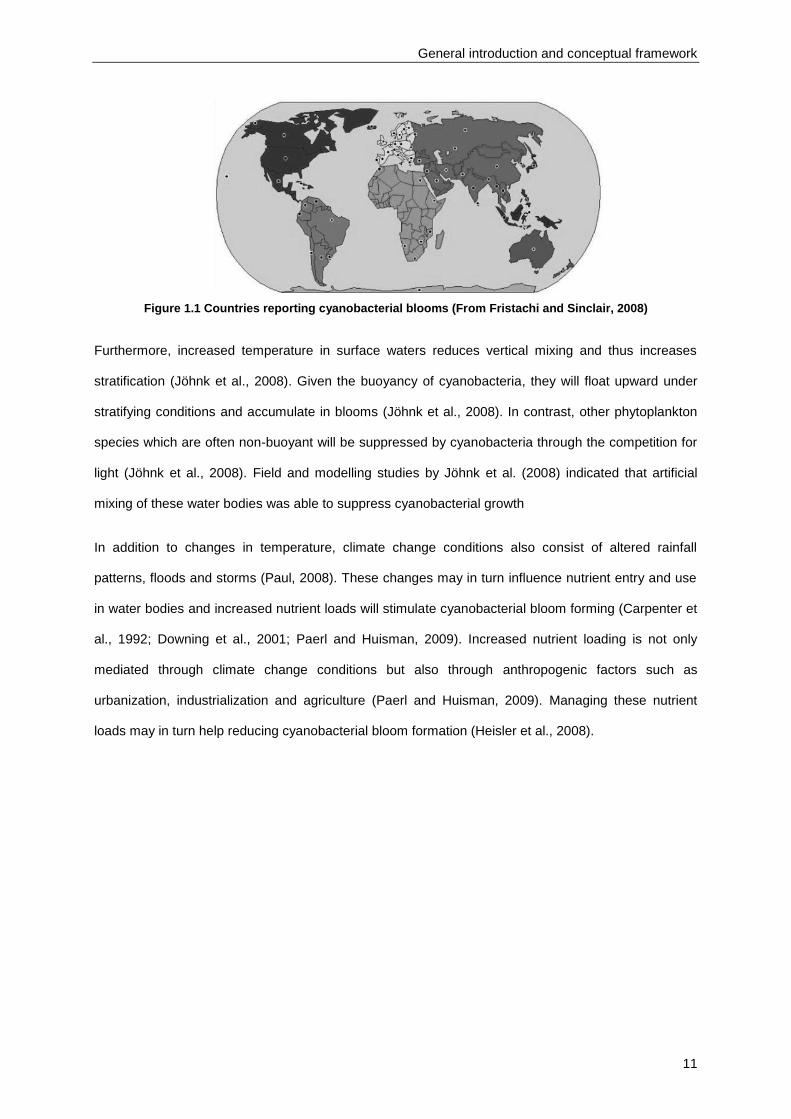
Over the last decade, cyanobacteria have again gained interest due to the increased incidence and
frequency of cyanobacterial blooms in water bodies (Carmichael, 2008) (Fig. 1.1). This increase has
been attributed to a variety of factors of which climate change and eutrophication are the most
prominent (Schiedek et al., 2007; Paerl and Huisman, 2008; Paerl and Huisman, 2009) (Fig. 1.2.).
Climate change conditions stimulate cyanobacterial growth primarily through increased temperature as
cyanobacteria grow better at higher temperatures compared to other phytoplankton species (Paerl and
Huisman, 2008). The best example is Cylindrospermopsis raciborskii, originally characterized as a
(sub) tropical species, which now occurs as far north as Germany (Wiedner et al., 2007).
General introduction and conceptual framework
11
Figure 1.1 Countries reporting cyanobacterial blooms (From Fristachi and Sinclair, 2008)
Furthermore, increased temperature in surface waters reduces vertical mixing and thus increases
stratification (Jöhnk et al., 2008). Given the buoyancy of cyanobacteria, they will float upward under
stratifying conditions and accumulate in blooms (Jöhnk et al., 2008). In contrast, other phytoplankton
species which are often non-buoyant will be suppressed by cyanobacteria through the competition for
light (Jöhnk et al., 2008). Field and modelling studies by Jöhnk et al. (2008) indicated that artificial
mixing of these water bodies was able to suppress cyanobacterial growth
In addition to changes in temperature, climate change conditions also consist of altered rainfall
patterns, floods and storms (Paul, 2008). These changes may in turn influence nutrient entry and use
in water bodies and increased nutrient loads will stimulate cyanobacterial bloom forming (Carpenter et
al., 1992; Downing et al., 2001; Paerl and Huisman, 2009). Increased nutrient loading is not only
mediated through climate change conditions but also through anthropogenic factors such as
urbanization, industrialization and agriculture (Paerl and Huisman, 2009). Managing these nutrient
loads may in turn help reducing cyanobacterial bloom formation (Heisler et al., 2008).

Chapter 1
12
Figure 1.2 Visual summary of natural and anthropogenic factors stimulating cyanobacterial bloom
formation (From Paerl and Huisman, 2009).
1.2.3 Effects of cyanobacteria on zooplankton species
Although cyanobacteria affect a great number of species, they are of particular concern to zooplankton
as cyanobacteria outcompete other green algae normally serving as a food source for zooplankton
(Dehn, 1930). Responses of zooplankton feeding on cyanobacteria have been widely reported in
literature and consist of negative effects on survival, fecundity and body size (Kirk and Gilbert, 1992;
Koski et al., 1999; Kozlowsky-Suzuki et al., 2003; Ojaveeret al., 2003) although some studies have
reported tolerance to cyanobacteria for some Daphnia isolates (De Coninck et al., 2014; Gustafsson
and Hansson, 2004). Effects of cyanobacteria on zooplankton have been primarily attributed to three
main factors: lack of essential nutrients such as fatty acids or sterols, impairment or inhibition of
feeding, i.e. mechanical interference, and toxin production (Demott and Müller-Navarra, 1997; Haney
et al., 1994; rling, 200 . Current literature rling, 200 ; ohrlack, 1 ) remains undecided
whether the effect of cyanobacteria on zooplankton can be contributed to only one of these factors or
a combination of them. Two recent studies conducted by Wilson et al. (2006) and Tillmans et al.

General introduction and conceptual framework
13
(2008) further confirmed these findings. Both groups conducted a meta-analysis of published
laboratory experiments with cyanobacteria and zooplankton. Wilson et al. (2006) observed that
cyanobacteria were indeed poor food quality to zooplankton but found no differences between toxin
and non-toxin producing cyanobacteria on population growth rates. They did observe differences
between cyanobacteria with different morphologies on population growth rates. In contrast, survival
rates of the grazers were more significantly impacted by toxin producing cyanobacteria than non-toxin
producing cyanobacteria although this may be caused by a single Microcystis strain PCC7806.
Overall, Wilson et al. (2006) could not make any conclusive statements given the significant
overrepresentation in the data of studies with the cyanobacteria PCC7806. Tillmans et al. (2008)
confirmed these findings in a subsequent meta-analysis. Furthermore, 21 of the 29 studied
zooplankton species maintained positive growth rates when fed a diet containing cyanobacteria thus
not supporting the hypothesis of potential mechanical interference. Tillmans et al. (2008) did observe a
large species-specific variation between the different zooplankton species. Overall, it remains unclear
which factors of cyanobacteria are primarily driving adverse effects on zooplankton.
1.2.4 Interactions between cyanobacteria and other stressors
The complexity of the aquatic environment where organisms face a variety of stressors has been
discussed in section 1.1. Cyanobacteria may also be part of such multiple stress conditions and even
interact with other stressors. Yet, despite the plethora of studies available on natural and chemical
stressors as summarized by Holmstrup et al. (2010) and Laskowski et al. (2010), little to no biotic
stressors were included. Potential interaction effects with cyanobacteria were not reported.
Literature search resulted in eleven studies concerning the potential interaction effects between
cyanobacteria and other stressors published since 2010 (Table 1.2.). Nine of the eleven studies were
conducted with Daphnia species (Table 1.2). Five studies focused on Microcystis aeruginosa, two on
Cylindrospermopsis raciborskii and one on Nodularia spumigena (Table 1.2). Exposure to
cyanobacterial toxins rather than cyanobacteria was conducted in three studies with microcystins
(Table 1.2). Interactions with chemicals were studied in five cases of which four observed interaction
effects (Table 1.2). However, in the study of De Coninck et al. (2013b), antagonistic interaction effects
between cadmium and Microcystis aeruginosa on the total reproduction were only observed for one of
the twenty studied Daphnia magna genotypes. For all other genotypes no significant interaction effects

Chapter 1
14
were observed. Nevertheless, for all observed genotypes, reproduction of organisms exposed to both
stressors was always lower than the reproduction of organisms exposed to each stressor alone.
Bernatowicz and Pijanowska (2011) also observed both presence and absence of interaction effects
on the number of eggs produced by organisms of genotypes of Daphnia longispina exposed to
Cylindrospermopsis raciborskii and polychlorinated biphenyls (PCB). Turja et al. (2013) observed
significant interaction effects on three of the four studied biomarkers, i.e. glutathione S-transferase,
catalase and glutathione peroxidase, in Gammarus oceanicus when exposed to mixtures of Nodularia
spumigena and benzo[a]pyrene whereas Cerbin et al. (2010) observed a synergistic effect only on the
size at first reproduction.
Combinations with abiotic stressors resulted in interaction for four of the five studies (Table 1.2). Yang
et al. (2011) observed interaction effects between microcystins and nitrite for two of the eight observed
endpoints, time to first batch of eggs and first clutch. For all other endpoints no interactions were
observed. A second study by Yang et al. (2012) found both synergistic and antagonistic effects on
different endpoints of Daphnia magna when exposed to ammonia and microcystin. All endpoints were
related to reproduction. In particular, synergistic effects were observed on the endpoint, time to first
eggs whereas antagonistic effects were observed on the total offspring per female. Bednarska et al.
(2011) observed interactions for some genotypes between temperature and Cylindrospermopsis
raciborskii on Daphnia magna. In particular, they observed a large difference between the control and
cyanobacterial treatment for the age at first reproduction at 20°C for some genotypes but this
difference was significantly smaller at 24°C. This indicates that at higher temperatures the age at first
reproduction is more comparable between green algae and cyanobacteria than at lower temperatures.
Sun et al. (2012) observed interaction effects between ammonia and microcystin on antioxidant
responses of Hypophthalmythys nobilis larvae.
Interaction with biotic stress was studied in one paper by Pires et al. (2011) who observed interaction
effects between Microcystis aeruginosa and bacterial lipopolysaccharides (LPS) on life history
responses of Daphnia galeata that depended on the type of Microcystis strain.
Interaction effects are clearly present between cyanobacteria and other stressors yet these effects
vary significantly between species and even genotypes of both the exposed organism as well as the
cyanobacterial strains. At present however the current literature contains too few studies to make
General introduction and conceptual framework
15
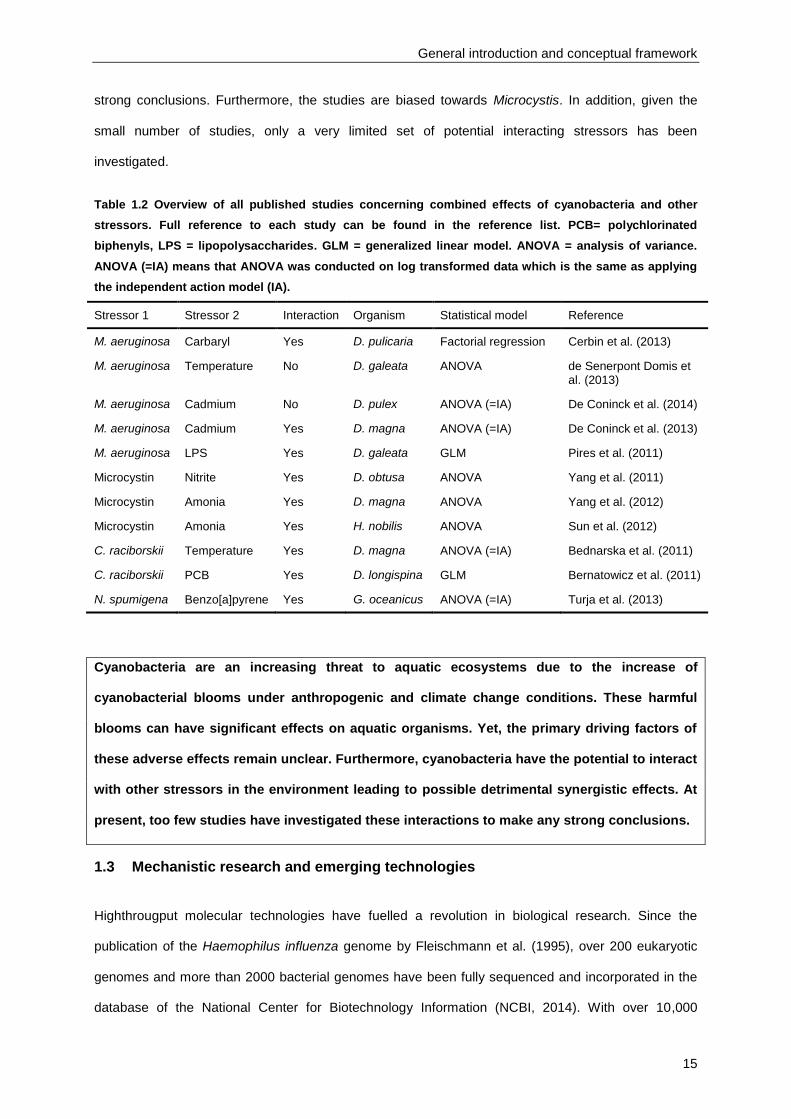
strong conclusions. Furthermore, the studies are biased towards Microcystis. In addition, given the
small number of studies, only a very limited set of potential interacting stressors has been
investigated.
Table 1.2 Overview of all published studies concerning combined effects of cyanobacteria and other
stressors. Full reference to each study can be found in the reference list. PCB= polychlorinated
biphenyls, LPS = lipopolysaccharides. GLM = generalized linear model. ANOVA = analysis of variance.
ANOVA (=IA) means that ANOVA was conducted on log transformed data which is the same as applying
the independent action model (IA).
Stressor 1 Stressor 2 Interaction Organism Statistical model Reference
M. aeruginosa Carbaryl Yes D. pulicaria Factorial regression Cerbin et al. (2013)
M. aeruginosa Temperature No D. galeata ANOVA de Senerpont Domis et al. (2013)
M. aeruginosa Cadmium No D. pulex ANOVA (=IA) De Coninck et al. (2014)
M. aeruginosa Cadmium Yes D. magna ANOVA (=IA) De Coninck et al. (2013)
M. aeruginosa LPS Yes D. galeata GLM Pires et al. (2011)
Microcystin Nitrite Yes D. obtusa ANOVA Yang et al. (2011)
Microcystin Amonia Yes D. magna ANOVA Yang et al. (2012)
Microcystin Amonia Yes H. nobilis ANOVA Sun et al. (2012)
C. raciborskii Temperature Yes D. magna ANOVA (=IA) Bednarska et al. (2011)
C. raciborskii PCB Yes D. longispina GLM Bernatowicz et al. (2011)
N. spumigena Benzo[a]pyrene Yes G. oceanicus ANOVA (=IA) Turja et al. (2013)
Cyanobacteria are an increasing threat to aquatic ecosystems due to the increase of
cyanobacterial blooms under anthropogenic and climate change conditions. These harmful
blooms can have significant effects on aquatic organisms. Yet, the primary driving factors of
these adverse effects remain unclear. Furthermore, cyanobacteria have the potential to interact
with other stressors in the environment leading to possible detrimental synergistic effects. At
present, too few studies have investigated these interactions to make any strong conclusions.
1.3 Mechanistic research and emerging technologies
Highthrougput molecular technologies have fuelled a revolution in biological research. Since the
publication of the Haemophilus influenza genome by Fleischmann et al. (1995), over 200 eukaryotic
genomes and more than 2000 bacterial genomes have been fully sequenced and incorporated in the
database of the National Center for Biotechnology Information (NCBI, 2014). With over 10,000
Chapter 1
16
ongoing genome projects in the NCBI database and the recent announcement of Illumina to deliver
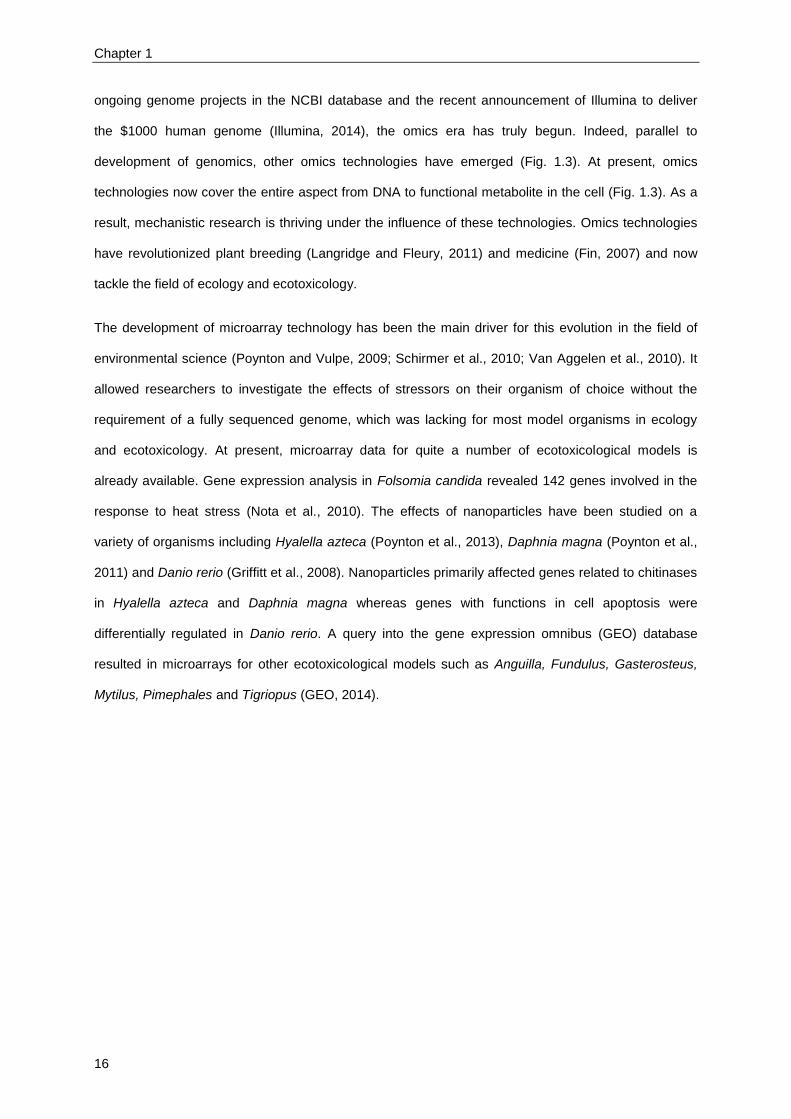
the $1000 human genome (Illumina, 2014), the omics era has truly begun. Indeed, parallel to
development of genomics, other omics technologies have emerged (Fig. 1.3). At present, omics
technologies now cover the entire aspect from DNA to functional metabolite in the cell (Fig. 1.3). As a
result, mechanistic research is thriving under the influence of these technologies. Omics technologies
have revolutionized plant breeding (Langridge and Fleury, 2011) and medicine (Fin, 2007) and now
tackle the field of ecology and ecotoxicology.
The development of microarray technology has been the main driver for this evolution in the field of
environmental science (Poynton and Vulpe, 2009; Schirmer et al., 2010; Van Aggelen et al., 2010). It
allowed researchers to investigate the effects of stressors on their organism of choice without the
requirement of a fully sequenced genome, which was lacking for most model organisms in ecology
and ecotoxicology. At present, microarray data for quite a number of ecotoxicological models is
already available. Gene expression analysis in Folsomia candida revealed 142 genes involved in the
response to heat stress (Nota et al., 2010). The effects of nanoparticles have been studied on a
variety of organisms including Hyalella azteca (Poynton et al., 2013), Daphnia magna (Poynton et al.,
2011) and Danio rerio (Griffitt et al., 2008). Nanoparticles primarily affected genes related to chitinases
in Hyalella azteca and Daphnia magna whereas genes with functions in cell apoptosis were
differentially regulated in Danio rerio. A query into the gene expression omnibus (GEO) database
resulted in microarrays for other ecotoxicological models such as Anguilla, Fundulus, Gasterosteus,
Mytilus, Pimephales and Tigriopus (GEO, 2014).
General introduction and conceptual framework
17
Figure 1.3 Overview of different types of omics. (From Weaver et al., 2014)
These recent advances in ecotoxicology often referred to as ecotoxicogenomics or environmental
genomics require some nuance. Although the significant benefit of these studies in understanding the
mechanisms of stress response of organisms remains unchallenged, several aspects still need to be
addressed. First, despite the wealth of information in microarrays, there is often no straightforward link
between gene expression and toxicological responses at the organismal level (Van Straalen and
Feder, 2011). Second, genes constantly modify their expression even when comparing standard or
“normal” conditions. It is therefore crucial to distinguish between these “neutral” genes and genes that
respond to the environment under study (Van Straalen and Feder, 2011). Third, there exists a large
variety in analysis and presentation of omics data between different studies (Ankley et al., 2006).
These challenges are currently being addressed by new frameworks such as the adverse outcome
pathway (AOP) framework (Fig 1.4). Adverse outcome pathways consist of a molecular initiating event
in which a certain chemical, or stressor in general, interacts macro-molecularly with a biological target.
Then, a series of cellular and organ responses will ultimately lead to organismal responses, e.g.
reduced reproduction or growth, and population responses. Adverse outcome pathways can thus be
seen as a framework developed to provide clear links between molecular changes and organismal
responses which tackles two of the three challenges raised in the paragraph above. Furthermore, the
development of this framework within standard regulatory practices will naturally lead to a more

Chapter 1
18
uniform analysis and presentation of results. Currently, a collaborative effort is ongoing through the
AOP wiki (OECD, 2014b). In addition, OECD has developed a guideline on developing and assessing
adverse outcome pathways (OECD, 2013). In this guideline, OECD clearly advocates that AOPs are a
framework that incorporates information from various existing methods and links those to higher
biological endpoints rather than a completely new methodology. Current AOPs under development
span a variety of modes of actions of chemicals including acetylcholine esterase inhibition and
mitochondrial toxicity (OECD, 2014b).
In addition to providing potential links between molecular events and apical effects, AOPs may
alleviate the pressure on environmental regulation which has to asses an ever increasing number of
chemicals, preferably with a greater speed and better accuracy as they are able to process information
from emerging technologies such as omics within a defined regulatory framework (Ankley, 2010).
Figure 1.4 Conceptual diagram of adverse outcome pathways (AOP). The first three boxes are the
parameters that define a toxicity pathway, as described by the National Research Council. (Adapted from
Ankley et al. 2010)
Next to the challenges raised for the application of omics in ecotoxicology, opportunities were also
identified. Antczak et al. (2013) used machine learning techniques to distinguish transcriptomic profiles
originating from different classes of chemicals, suggesting that transcriptomic signatures indicative of
toxicants could be archived and used as barcodes to identify chemicals in the environment. Several
studies have focused on elucidating responses to multiple stress conditions by using microarrays, e.g.
Hook et al. (2008), Garcia-Reyero et al. (2009), Vandenbrouck et al. (2009). Most of them have been
General introduction and conceptual framework
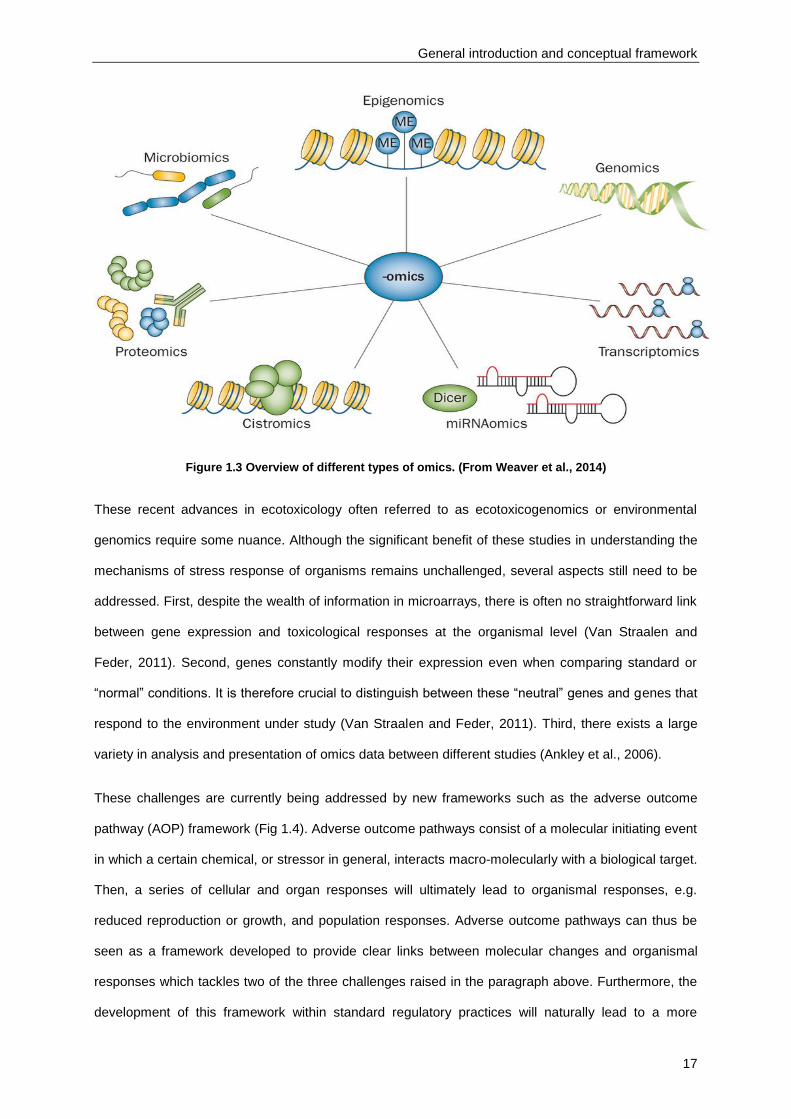
19
summarized by Altenburger et al. (2012). This review study structured current knowledge regarding
mixture effects, which primarily originates from non-molecular studies, within an omics framework (Fig.
1.5).
Figure 1.5 Conceptual framework for mixture toxicogenomic studies as proposed by Altenburger et al.
(2012) (From Altenburger et al. (2012))
Altenburger et al. (2012) identified 41 papers using mainly molecular technologies such as microarrays
and quantitative polymerase chain reaction (qPCR) to study mixture effects. All papers discussed
mixtures of chemicals varying from binary mixtures to complex environmental samples consisting of
multiple stressors. Six studies reported on chronic effects whereas the other studies conducted short
term exposures. The majority of the studies focused on responses in fish organs although some
studies investigating invertebrates such as Daphnia. Responses of mammalian cell lines were also
reported. Although it seems quite a large number of studies investigated mixtures, Altenburger et al.
(2012) remarked that none of them explicitly tested a mixture hypothesis. Often qualitative methods
were used to compare treatments rather than specifically testing for interaction effects. Altenburger et
al. (2012) observed that although authors referred to synergistic or antagonistic effects, this was often
a comparison of observations versus the authors` expectation rather than through an explicit statistical
hypothesis such as independent action or concentration addition. Hence, it was difficult to interpret
these results. Altenburger et al. (2012) further pointed out that the use of terminology was not
straightforward and different studies used similar terminology to describe different effects with different
interpretations. The lack of consistent and straightforward terminology has also been observed in non
omics mixture studies (section 1.1.1). Altenburger et al. (2012) suggested that research on interaction
effects with omics technologies could be improved by defining explicit null hypotheses. Also,
knowledge on interaction effects could be significantly improved by including concentration response

Chapter 1
20
data according to Altenburger et al. (2012). They further recommend the use of predicted expression
values of combined effects through the conceptual models of concentration addition and independent
action. Finally, Altenburger et al. (2012) emphasized the need to validate exposure concentrations
analytically in any type of study.
The rapid development of high throughput omics technologies is revolutionizing
ecotoxicology. Applications vary from purely mechanistic research to transcriptomic profiling
to identify chemicals and interaction effects. Yet, some challenges remain to be addressed.
Linking molecular responses to biological outcomes remains difficult but adverse outcome
pathways prove to be a promising framework. Potential interaction effects are already studied
in a diversity of studies but lack explicit hypothesis testing and standard conceptual models
such as concentration addition and independent action.
1.4 Model organism: Daphnia pulex
Daphnia pulex or the American water flea is one of the most common species of Daphnia. Daphnids
are small crustaceans, present in a large variety of lakes and ponds across a wide geographical range
(Lampert, 2006). It has been used as a model organism for ecological and ecotoxicological research
for more than 100 years (Lampert, 2011; Weismann, 1880). Literature has increased constantly and a
current literature search results in over 4000 papers in the last 50 years concerning Daphnia. Daphnia
has also been a standard model organism in ecotoxicity testing guidelines issued by both the OECD
(2008) and US EPA (1996). The reason for the success of the waterflea has been attributed to a
variety of factors (Lampert, 2006). Some of the most important ones are its ecological position, life
cycle, physical properties and species diversity. Daphnids are predators of phytoplankton while being
at the same time a prey to fish, giving them a unique and central position in the foodweb. They are
cyclic parthenogens, meaning that they reproduce both sexually as well as asexually (Fig. 1.6). In the
case of Daphnia, the asexual cycle in which mothers produce only genetically identical daughters
generally occurs. Only under stressful conditions will parthenogenetic females produce sons which
can in turn mate with the females to produce a resting egg or ephiphium (Lampert, 2006). The resting
egg is a dormant stage and will hatch when conditions become favorable again (Lampert, 2006). This
unique life cycle off course has many advantages. First, genetic variability can be excluded or included
in the experimental design. Second, parthenogenetic reproduction means only one daphnid is needed

General introduction and conceptual framework
21
to start-up a culture and allows for easy culture maintenance. Third, the consequences of both
parthenogenetic and sexual reproduction can be studied. Fourth, the ephiphium can survive in
sediment layers for over decades making it possible to resurrect Daphnia from the past and study past
populations (Orsini et al., 2013). Daphnids are small, transparent organisms with a short generation
time, i.e. 7 to 15 days, which makes them ideal organisms to culture in the lab. Finally, the genus of
Daphnia contains over 100 different species that demonstrate a wide range of phenotypic and
genotypic plasticity.
Figure 1.6 Schematic representation of the cyclic parthenogenetic life cycle of Daphnia (From Ebert, 2005)
The recent evolution in molecular technologies has propelled ecological and environmental research
to tackle longstanding hypotheses with a new biological level of understanding. This evolution has
greatly benefitted Daphnia, which is now emerging as a true model organism in ecological and
environmental genomics (Ebert, 2011). The well-known ecology and use in ecotoxicology made
Daphnia an ideal candidate for genome sequencing. The fully sequenced genome was published in
2011 (Colbourne et al.) and revealed a unique genomic structure unlike any other known genomic
Chapter 1
22
model. Daphnia has an inflated number of duplicated genes due to a disproportionate expansion of
gene families within the genome (Colbourne et al., 2011). Groups of these gene families cluster non
randomly within specific metabolic pathways such as the sphingolipid biosynthesis (Colbourne et al.,
2011). Expression patterns of these gene families within these specific pathways suggest non
independent functional divergence. More than a third of the genes are specific to the Daphnia lineage
and have no known detectable homology with any other gene in all available proteomes (Colbourne et
al., 2011). Expression studies highlighted that these lineage-specific genes are more susceptible to
ecological conditions and that gene duplicates demonstrate divergent expression patterns (Colbourne
et al., 2011). Indeed, Colbourne et al. (2011) observed an evolutionary diversification of duplicated
genes. They observed that divergence in expression pattern between gene duplicates corresponds
with the age in many gene families. In other words, recent gene duplicates have very similar
expression patterns whereas genes that duplicated a long time ago have very different expression
patterns. However, they also observed that quite a number of recently arisen paralogs differ in their
expression in at least one condition despite having nearly identical sequences. Colbourne et al. (2011)
conclude that paralogous genes often diverge in gene expression pattern upon exposure to
environmental conditions either at the time of duplication or soon after. This tight interaction between
the genome and the environment has made Daphnia particularly suitable to study such interactions
(Altshuler et al., 2011; Shaw et al., 2008). Despite the small genome size of only 200 megabases
(Mb), it has over 30000 genes with a reduced intron size resulting in an average gene span of more
than 1000 basepairs shorter than the average gene length in Drosophila (2300 basepairs versus 4000
basepairs) (Colbourne et al. 2011). However, the average protein length is similar in size between
these two species. This is due to a reduced average intron size, i.e. 170 basepairs versus 660
basepairs in Drosophila. Furthermore, of all sequenced arthropods, Daphnia shares the highest
number of genes with humans. Given all these features, Daphnia pulex is now recognized by the
National Institutes of Health (NIH) as a model organism for biomedical research (NIH, 2014).
Daphnia pulex can be considered as a true environmental genomics model organism. The
unique genome structure has highlighted its environmental relevance and is fully
complemented with its well-known ecology and ecotoxicological responses.

General introduction and conceptual framework
23
1.5 Model stressors
1.5.1 Cyanobacteria
Six species of cyanobacteria were selected representing the six main genera of toxic cyanobacteria
(van Apeldoorn et al., 2007). These species are classified in different orders based upon their
morphology (Table 1.3, Fig. 1.7). The following subsections will briefly situate each species
geographically, its prevalence and importance in bloom formation as well as summarize the main
effects on Daphnia.
Table 1.3 Overview of selected cyanobacteria classified within their order and the corresponding
morphology.
Species Order Morphologic characteristic of the classification order
Anabaena lemmermannii Nostocales Multicellular, trichal, heterocysts present, filamentous
Aphanizomenon sp. Nostocales Multicellular, trichal, heterocysts present, filamentous
Cylindrospermopsis raciborskii Nostocales Multicellular, trichal, heterocysts present, filamentous
Microcystis aeruginosa Chroococcales Unicellular, isopolar, colony forming
Nodularia sp. Nostocales Multicellular, trichal, heterocysts present, filamentous
Oscillatoria sp. Oscillatoriales Multicellular, trichal, heterocysts not present, filamentous
Figure 1.7 Morphology of cyanobacteria. From left to right: Nostocales – Oscillatoriales – Chroococcales
(From Mur et al., 1999).
Chapter 1
24
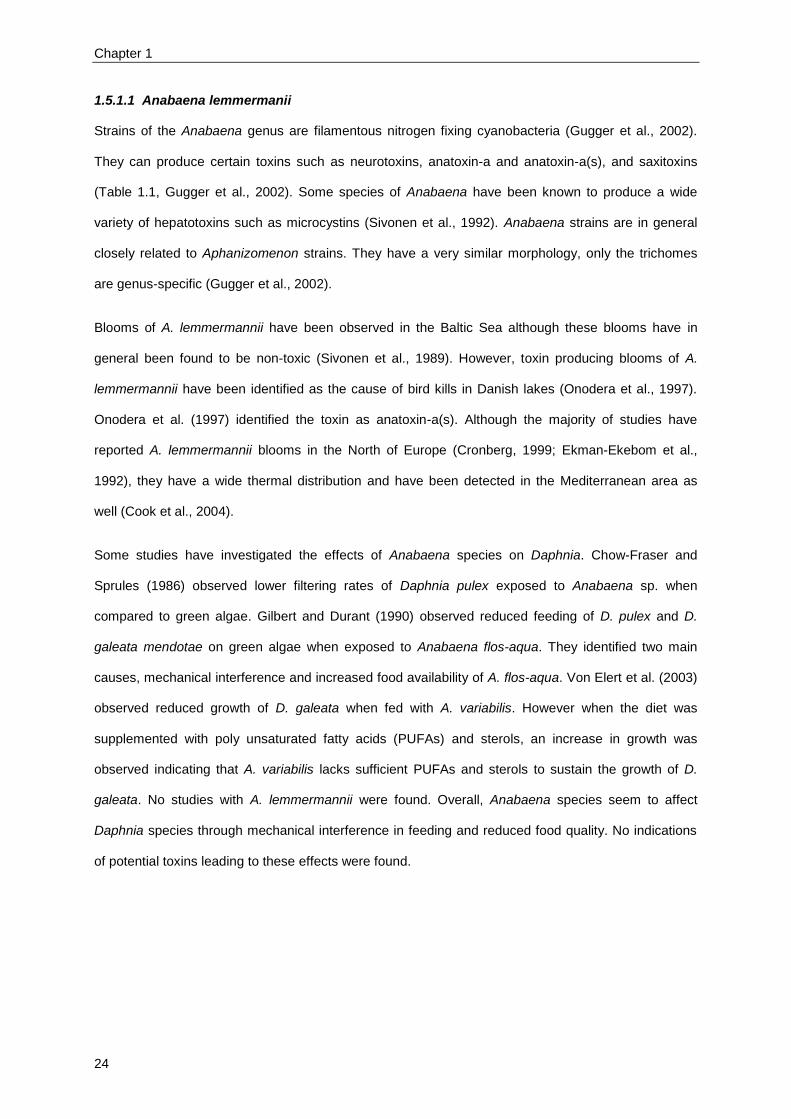
1.5.1.1 Anabaena lemmermanii
Strains of the Anabaena genus are filamentous nitrogen fixing cyanobacteria (Gugger et al., 2002).
They can produce certain toxins such as neurotoxins, anatoxin-a and anatoxin-a(s), and saxitoxins
(Table 1.1, Gugger et al., 2002). Some species of Anabaena have been known to produce a wide
variety of hepatotoxins such as microcystins (Sivonen et al., 1992). Anabaena strains are in general
closely related to Aphanizomenon strains. They have a very similar morphology, only the trichomes
are genus-specific (Gugger et al., 2002).
Blooms of A. lemmermannii have been observed in the Baltic Sea although these blooms have in
general been found to be non-toxic (Sivonen et al., 1989). However, toxin producing blooms of A.
lemmermannii have been identified as the cause of bird kills in Danish lakes (Onodera et al., 1997).
Onodera et al. (1997) identified the toxin as anatoxin-a(s). Although the majority of studies have
reported A. lemmermannii blooms in the North of Europe (Cronberg, 1999; Ekman-Ekebom et al.,
1992), they have a wide thermal distribution and have been detected in the Mediterranean area as
well (Cook et al., 2004).
Some studies have investigated the effects of Anabaena species on Daphnia. Chow-Fraser and
Sprules (1986) observed lower filtering rates of Daphnia pulex exposed to Anabaena sp. when
compared to green algae. Gilbert and Durant (1990) observed reduced feeding of D. pulex and D.
galeata mendotae on green algae when exposed to Anabaena flos-aqua. They identified two main
causes, mechanical interference and increased food availability of A. flos-aqua. Von Elert et al. (2003)
observed reduced growth of D. galeata when fed with A. variabilis. However when the diet was
supplemented with poly unsaturated fatty acids (PUFAs) and sterols, an increase in growth was
observed indicating that A. variabilis lacks sufficient PUFAs and sterols to sustain the growth of D.
galeata. No studies with A. lemmermannii were found. Overall, Anabaena species seem to affect
Daphnia species through mechanical interference in feeding and reduced food quality. No indications
of potential toxins leading to these effects were found.

General introduction and conceptual framework
25
1.5.1.2 Aphanizomenon sp.
The genus Aphanizomenon is very similar to the Anabaena genus as discussed in section 1.5.1.1.
The major differences are the trichome structure and toxin production. Aphanizomenon strains
primarily produce saxitoxins and anatoxin-a (Table 1.1, Gugger et al., 2002). Some strains are also
known to produce alkaloid cytotoxins such as cylindrospermopsins (Table 1.1, Gugger et al., 2002).
Aphanizomenon has been primarily associated with paralytic shellfish poisoning (Ballot et al., 2010;
Mahmood and Carmichael, 1986; Pereira et al., 2000). Blooms of Aphanizomenon have a wide
geographical distribution being reported in the Baltic Sea (Sivonen et al., 1989), in drinking reservoirs
in Portugal (Pereira et al., 2000) and in tropical lakes in Australia (Shaw et al., 1999). Blooms in the
Baltic Sea were not toxic whereas blooms in Portugal and Australia were reported to produce several
toxins.
Effects of Aphanizomenon species on Daphnia were attributed to nutritional quality, toxins and
combinations of both. Noguiera et al. (2004a) fed Daphnia magna with A. issatschenkoi and observed
reduced growth and survival due to the presence of paralytic shellfish toxins. Another study by
Noguiera et al. (2006) with a cylindrospermopsin producing A. ovalisporum observed effects on
Daphnia magna that could be attributed to both low nutritional value and toxin production. These
conclusions were made based on comparison with both a fed and unfed control treatment. Lampert
(1981) observed no effects on Daphnia pulicaria when fed a diet consisting of green algae and A.
gracile. However, a diet containing only A. gracile did have negative effects, indicating more an effect
of low food quality rather than toxins.
1.5.1.3 Cylindrospermopsis raciborskii
Cylindrospermopsis raciborskii has by far been the most studied species within the genus of
Cylindrospermopsis. This has two main reasons. First, C. raciborskii has been characterized as a
cylindrospermopsin producer and this specific toxin (Table 1.1) was implicated in one the most severe
human poisonings by cyanotoxins in Australia referred to as the Palm Island Mystery Disease (Blyth,
1980). Second, although it was characterized as only a tropical species, it has in less than ten years
gained a wide global distribution and has been referred to as an invasive species (Neilan et al., 2003).
Several authors have commented on this aspect and have pointed to the huge morphological and
physiological plasticity of this adaptive species (Neilan et al., 2003; Padisák, 1997).

Chapter 1
26
Studies with Daphnia again observed effects of both low quality food and toxins. Noguiera et al.
(2004b) observed significant effects on growth and survival of juveniles of D. magna when exposed to
toxin producing C. raciborskii. Effects were significantly less pronounced when exposed to non-toxin
producing C. raciborskii. On the other hand, Soares et al. (2009) observed primarily feeding inhibition
effects and no toxin effects of a toxin producing C. raciborskii strain on D. magna. Panosso and Lürling
(2010) noted significant effects on feeding due to low food quality when D. magna was exposed to C.
raciborskii.
1.5.1.4 Microcystis aeruginosa
Microcystis aeruginosa is by far the most common and best studied cyanobacterium (Fristachi and
Sinclair, 2008). Microcystis primarily produces microcystins (a group of toxic cyclic heptapeptides,
Table 1.1) and aeruginosins - a group of toxins with a peptide-like structure without any standard L-
amino acids (Ersmark et al., 2008; Sandler et al., 1998; van Apeldoorn et al., 2007).
The global occurrence of Microcystis has resulted in a large body of scientific literature regarding
Microcystis and microcystins. Toxicity of microcystins has been studied in a huge variety of organisms
ranging from aquatic invertebrates to fish and mammals and even plants (van Apeldoorn et al., 2007).
Microcystin is at present the only toxin for which the World Health Organization has established a
drinking water limit (Table 1.1).
The effects of Microcystis on Daphnia have been well studied (Demott et al., 1991; Lürling, 2003;
Nizan et al., 1986). Furthermore, some studies were even able to observe tolerance to Microcystis in
some isolates of Daphnia (De Schamphelaere et al., 2011; Gustafsson and Hansson, 2004). Despite
the large amount of research, no consensus is reached regarding the factors driving the negative
effects on zooplankton (Lürling, 2003; Rohrlack et al., 1999).
1.5.1.5 Nodularia sp.
Strains of the Nodularia genus mainly occur in brackish and coastal environment, although some are
found in freshwater environments (Beattie et al., 2000; Bolch et al., 1999). Blooms of this genus have
been reported worldwide, Australia, Baltic Sea, North America, (Bolch et al., 1999). Not all species
produce toxins. Some species, such as N. harveyana are known to never produce toxins or even
associated with toxic blooms (Bolch et al., 1999). Others such as N. spumigena appear to be always

General introduction and conceptual framework
27
toxic (Bolch et al., 1999). Poisonings have been reported in North of Germany, west of South Africa
and Sweden (Edler et al., 1985; Nehring, 1993; Van Halderen et al., 1995)
Studies with Daphnia are scarce. Literature search revealed a study by Demott et al. (1991) who
exposed three species of Daphnia to toxins from N. spumigena and observed feeding inhibition for all
three species. No studies were found in which Daphnia were exposed to actual cells of Nodularia sp.
1.5.1.6 Oscillatoria sp.
Oscillatoria strains have been reported in both freshwater and coastal waters (Sivonen et al., 1990).
Although most blooms have been reported in Northern Europe (Scandinavia, northern region of the
Netherlands, Scotland), some Oscillatoria blooms have occurred in warmer regions such as South
Australia (Buijse et al., 1993; Hayes and Burch, 1989; Sano et al., 1998; Sivonen et al., 1990).
Reports of specific poisonings as a result of an Oscillatoria bloom are limited. Literature search
revealed a case of dog poisoning in Scotland (Edwards et al., 1992).
Effects on Daphnia were studied mainly by Repka. Repka published a series of studies in which the
effects of Oscillatoria on several Daphnia species, including D. galeata and D. cucullata, were studied.
For all daphnids, Repka observed lower reproduction on diets containing Oscillatoria (Repka, 1996;
Repka, 1997). However, despite the lower reproduction daphnids were still able to maintain positive
growth suggesting that nutrition quality might be more prominent than toxin production.
The six selected cyanobacterial strains cover a diverse range of morphologies, geographical
distributions, habitats and toxin production. All have been reported in cyanobacterial blooms
that have often been correlated with poisoning of humans and animals. The majority of the
studies with Daphnia focus on the effect of Microcystis. Overall, no primary driving factor of
the adverse effects on Daphnia could be identified as these factors differed between feeding
inhibition, food quality and toxin production across the different studies
Chapter 1
28
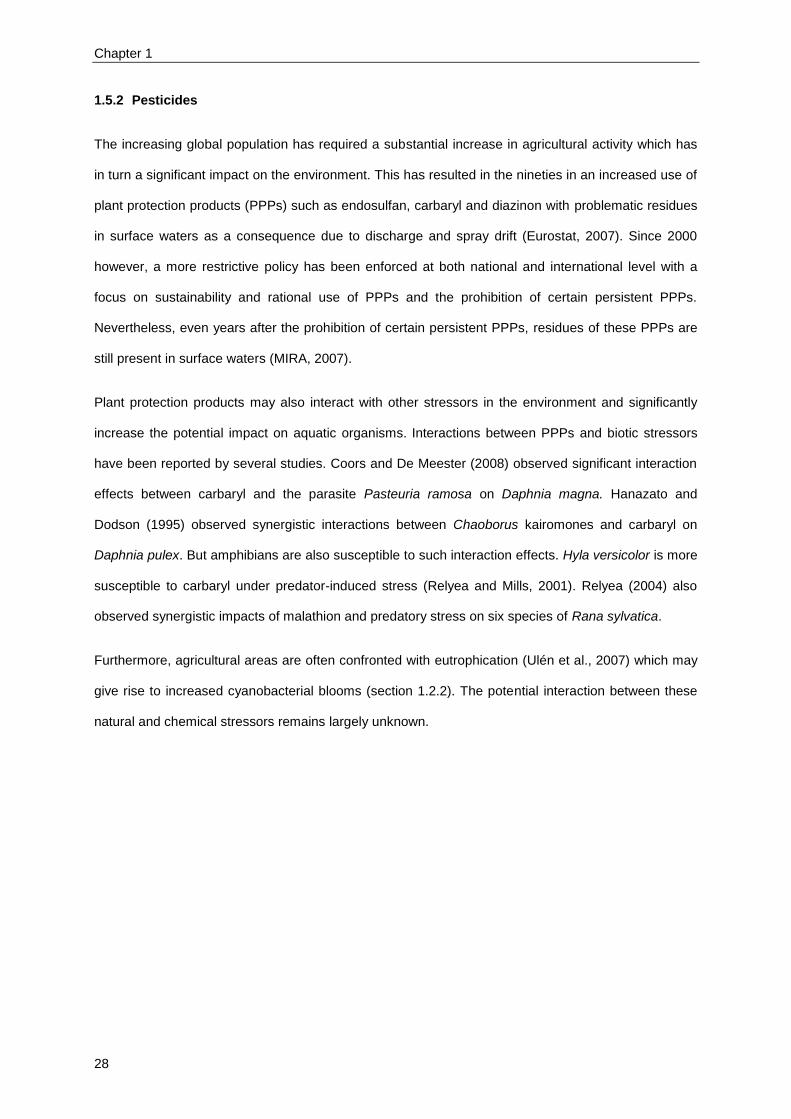
1.5.2 Pesticides
The increasing global population has required a substantial increase in agricultural activity which has
in turn a significant impact on the environment. This has resulted in the nineties in an increased use of
plant protection products (PPPs) such as endosulfan, carbaryl and diazinon with problematic residues
in surface waters as a consequence due to discharge and spray drift (Eurostat, 2007). Since 2000
however, a more restrictive policy has been enforced at both national and international level with a
focus on sustainability and rational use of PPPs and the prohibition of certain persistent PPPs.
Nevertheless, even years after the prohibition of certain persistent PPPs, residues of these PPPs are
still present in surface waters (MIRA, 2007).
Plant protection products may also interact with other stressors in the environment and significantly
increase the potential impact on aquatic organisms. Interactions between PPPs and biotic stressors
have been reported by several studies. Coors and De Meester (2008) observed significant interaction
effects between carbaryl and the parasite Pasteuria ramosa on Daphnia magna. Hanazato and
Dodson (1995) observed synergistic interactions between Chaoborus kairomones and carbaryl on
Daphnia pulex. But amphibians are also susceptible to such interaction effects. Hyla versicolor is more
susceptible to carbaryl under predator-induced stress (Relyea and Mills, 2001). Relyea (2004) also
observed synergistic impacts of malathion and predatory stress on six species of Rana sylvatica.
Furthermore, agricultural areas are often confronted with eutrophication (Ulén et al., 2007) which may
give rise to increased cyanobacterial blooms (section 1.2.2). The potential interaction between these
natural and chemical stressors remains largely unknown.

General introduction and conceptual framework
29
Table 1.4 Insecticides with their chemical structure, classification, mode of action and the approval of use in European Union (EU) and the United States (USA).
Insecticide Chemical structure1 Classification
2 Mode of action
2 Approval
3,4 PEC
3 / MAC
5,6,7 (µg/L)
Acetamiprid
Neonicotinoid Agonist of nicotinic acetylcholine receptor – Nerve action: hyperexcitation
Acetamiprid will mimic the action of acetylcholine at the nicotinic acetylcholine receptor
EU: Yes
USA: Yes
7 / NA
Carbaryl
Carbamate Inhibitor of acetylcholine esterase – Nerve action: hyperexcitation
Acetylcholine esterase normally terminates the action of acetylcholine at the nerve synapse.
EU: No
USA: Yes
0.6-45 / 2.1
Chlorpyrifos
Organophosphate Inhibitor of acetylcholine esterase – Nerve action: hyperexcitation
Acetylcholine esterase normally terminates the action of acetylcholine at the nerve synapse.
EU: Yes
USA: Yes
0.3 / 0.01
Deltamethrin
Pyrethroid Modulator of sodium channels – Nerve action: hyperexcitation
Deltamethrin will keep the sodium channels, which are involved in the propagation of action potentials, open.
EU: Yes
USA: Yes
0.02-0.04 / 0.004
Endosulfan
Cyclodiene organochlorine
Antagonist of GABA-gated chloride channels – Nerve action: hyperexcitation
GABA is the major inhibitory neurotransmitter in insects
EU: No
USA: Yes
0.2-8 / 0.1
Fenoxycarb
Fenoxycarb Juvenile hormone mimic – Growth regulation
Fenoxycarb will disrupt and prevent metamorphosis
EU: Yes
USA: Yes
22-87 / NA
Tebufenpyrad
METI insecticide Inhibitor of mitochondrial complex I electron transport – Energy metabolism
Tebufenpyrad will prevent the usage of energy by the cells
EU: Yes
USA: Yes
0.3 -10/ NA
Tetradifon
Tetradifon Inhibitor of mitochondrial ATP synthase – Energy metabolism EU: No
USA: No
NA

Chapter 1
30
1 Sigma Aldrich, 2014 www.sigmaaldrich.com
2 IRAC, 2009.
3 EU pesticide database: http://ec.europa.eu/sanco_pesticides/public/?event=homepage
4 US EPA: http://ppis.ceris.purdue.edu/
5 Waterframework directive: http://ec.europa.eu/environment/water/water-framework/
6 US EPA: National Water Quality Criteria http://water.epa.gov/scitech/swguidance/standards/criteria/current/index.cfm#cmc
7 Canadian freshwater guidelines for the protection of aquatic life: http://ceqg-rcqe.ccme.ca/
Eight insecticides were selected spanning a variety of chemical structures, modes of action and
classifications (Table 1.4). Given the impact of insecticides in the environment, a large body of
literature is available describing the effects of all these insecticides. Here, a selection of studies in
relation with Daphnia that sketch the current research field will be briefly discussed.
The effects of carbaryl on Daphnia are probably the best studied out of all insecticides. Jansen et al.
(2013) reported on the gene expression changes in Daphnia upon exposure to carbaryl. They
observed significant repression of cuticle genes and effects on gene transcription and translation.
Other literature reports the effect of carbaryl on Daphnia in combination with a selection of natural
stressors such as predators (Coors and De Meester, 2008), parasites (De Coninck et al., 2013b) and
even Microcystis (Cerbin et al., 2010). Similar studies were found for chlorpyrifos, also an
acetylcholine esterase inhibitor. They focused on interactions with both natural stress, toxic algal
blooms (Daam et al., 2011), and other organophosphates (Li and Tan, 2011) and even other
insecticides (Loureiro et al., 2010). The effects of juvenile hormone analogs such as fenoxycarb are
also well studied as a model for effects of endocrine disrupting chemicals (Tatarazako and Oda,
2007). Juvenile hormone analogs are also of particular interest as they seem to induce male
production (Lampert et al., 2012; Olmstead and LeBlanc, 2003). Pyrethroids and their effects on
Daphnia have been studied since the 1980s (Day and Kaushik, 1987). Current research focusses on
effects of deltamethrin in sex differentiation and embryonic development (Toumi et al., 2013) and
potential interactions with metals (Barata et al., 2006). Effects of endosulfan in contrast do not impact
sex differentiation in Daphnia (Zou and Fingerman, 1997). Like carbaryl, endosulfan has been studied
together with predation stress. In the study by Barry (2000), endosulfan inhibited phenotypic plasticity
of Daphnia pulex decreasing the probability of survival under predation stress.
Literature on the potential effects of the three other insecticides on Daphnia is much more limited. No
studies were found describing effects of acetamiprid on Daphnia. But Qi et al. (2013) studied the
General introduction and conceptual framework
31
effects of guadipyr, another neonicotinoid, on D. magna. Effects were observed on growth and
reproduction. No studies were found that solely focused on the effects of tebufenpyrad on Daphnia.
One study (Beketov et al., 2011) reported on the potential effects of tebufenpyrad on Daphnia within a
large set of pesticides. Beketov et al. (2011) observed antagonistic effects on Daphnia after exposure
to tebufenpyrad and increased UV radiation. Studies on tetradifon were primarily reported by Villaroel
et al. They (Villaroel et al., 1999) observed significant effects of tetradifon on the feeding behavior of
Daphnia magna. Further study (Villaroel et al., 2008) revealed reduced reproduction in mature
offspring, F1 generation, of parental exposed animals. Villaroel et al. (2009) also observed a good
correlation between decreased energy budget and effects of tetradifon on life history parameters such
as survival, growth and reproduction.
Insecticides can have significant effects on the life history of Daphnia varying from effects on
reproduction and survival to effects on male production and sex development. Quite a number
of studies are available for most insecticides with a well-known mode of action. Less is
however known about newer insecticide classes such as neonicotinoids or newer insecticides
such as tebufenpyrad and tetradifon. Interaction effects with other stressors have been studied
for both chemical and natural stressors although few studies so far have focused on the
combined effects with cyanobacteria.
1.6 Conceptual Framework
Aquatic ecosystems are complex environments where organisms interact with a heterogeneous group
of stressors from anthropogenic and natural origin. Yet, current chemical risk assessment practices fail
to include these combined effects of stressors and their potential interaction as they primarily use a
chemical-by-chemical approach. The lack of sufficient comprehensive data in literature and the lack of
predictive models further impede the incorporation of combined and interaction effects in
environmental legislation. The occurrence and the frequency of combined and interaction effects in the
environment are not unlikely to increase significantly in the future.
Anthropogenic factors and climate change conditions stimulate bloom formation of potential toxic
cyanobacteria. These organisms are an emerging concern for both environmental and public health.
Although effects on mammals are well documented and understood, the mechanisms driving effects
Chapter 1
32
on zooplankton species remain unclear and research is largely biased towards effects of Microcystis.
Therefore, chapter 2 has focused on the effects of six cyanobacteria species, representing six main
genera, on the life history of Daphnia. Effects of cyanobacteria were studied across the full
concentration response curve which will allow to accurately compare the effects of diverse group of
cyanobacteria. In addition, the comparison with a starvation response will allow to assess the impact
of nutritional factors affecting cyanobacterial toxicity.
Cyanobacteria are likely to occur in environments together with other stressors leading to multiple
stress conditions and altered responses of Daphnia exposed to cyanobacteria under such multiple
stress conditions. Indeed, the eutrophication of water bodies, known to enhance bloom formation,
often occurs in agricultural areas, which may give rise to unknown interaction effects with plant
protection products. In particular, insecticides can severely affect aquatic invertebrates and two
studies have shown interaction between insecticides and cyanobacteria on Daphnia. Given that each
study focused on specific combinations of stressors, conclusions cannot be generalized and the
potential interaction effects for insecticides and cyanobacteria in general remain largely unknown. In
chapter 3, these potential interaction effects were studied by exposing Daphnia to binary
combinations of a selection of cyanobacteria and insecticides. Combined and interaction effects were
evaluated within defined statistical frameworks with the two conceptual models concentration addition
and independent action under standard conditions of 21 day exposure. Evaluation within the two
defined frameworks will allow testing different hypotheses about the interaction effects due to the
different mathematical background of these models as well as allowing a thorough comparison of the
models from a mechanistic and a risk assessment point of view.
Such experiments are however labor intensive and time consuming. Chapter 4 therefore focused on
studying the effects on life history of a comprehensive set of 48 binary combinations of insecticides
and cyanobacteria under a shorter exposure time and with reduced experimental design. Statistical
evaluation of the effects is therefore only possible within the independent action framework. This
approach was however evaluated by comparing the results of chapters 3 and 4 for those
combinations that were repeated. Thus, it would be possible to evaluate the impact of shorted
exposure time and reduced experimental design on interaction effects as well as estimate whether
findings from chapter 3 can be extrapolated to other combinations of insecticides and cyanobacteria.
General introduction and conceptual framework
33
The evolution of high throughput molecular technologies has enhanced the mechanistic understanding
of organismal responses under stress. Mechanistic understanding is not only crucial to identify the
driving factors of stress response but may also aid in building predictive models. Chapter 5 identified
the potential of these technologies by studying the stress response of Daphnia pulex to Microcystis
aeruginosa with high throughput microarrays. A comprehensive set of pathway tools was developed
specifically taking into account the unique Daphnia genome within chapter 5 to identify crucial
pathways and gene networks involved in response to Microcystis.
Chapter 6 further applied microarray technology to study the response of Daphnia to the five other
studied cyanobacteria in chapter 2. The pathway tools developed in chapter 5 were used to compare
similarities and differences across stress responses to each of these cyanobacteria at different levels
of molecular organization and identify the main driving factors of adverse effects on Daphnia. In
particular, chapter 6 aimed elucidate the differences and similarities between the effects of the
different cyanobacteria at life history level by studying the effects at the molecular level.
In chapter 7, the molecular responses of daphnids to the 48 binary combinations, used in chapter 4,
were studied. Combined and interaction effects are determined within standard statistical frameworks
along with a priori defined hypotheses of non-interaction at the gene level. Genes, for whom
interaction effects were observed, were then subjected to a functional analysis to identify potential
mechanisms of interactions as well as crucial pathways involved in the interaction effects.
Ultimately, Chapter 8 integrated all data from chapters 4 and 7 by building comprehensive gene
networks on the transcriptomic data generated in chapter 7 and then integrating this data with life
history responses and interaction effects defined in chapter 4. Integration of the data within an overall
gene network will allow identifying factors driving interactions across the entire data set. These key
modules of genes driving life history responses and interaction effects at life history level were
functionally analyzed to help understand the mechanisms and pathways driving these effects.
Chapter 9 will give a final overview of the main conclusions reached throughout this dissertation and
how they have answered the concerns and research gaps put forward in the introduction. It will also
address the challenges that environmental research will still need to face in the future.

Chapter 2
A comparison of the sensitivity of
Daphnia pulex to different
cyanobacterial species
2
Redrafted after:
Jana Asselman*, Jennifer Hochmuth*, Karel AC De Schamphelaere. 2014. A comparison of the
sensitivities of Daphnia magna and Daphnia pulex to six different cyanobacteria species. Accepted in
Harmful Algae. *These authors contributed equally.


A comparison of the sensitivity of Daphnia pulex to different cyanobacterial species
37
2.1 Introduction
A large body of literature has discussed the significant environmental impact of cyanobacteria on
aquatic organisms and freshwater invertebrates in particular (Codd, 2005; Falconer, 2001; Paerl et al.,
2001; Sellner, 1997). As a consequence, the results of these studies are slowly being integrated in risk
assessment literature and even further in environmental legislation. Current risk assessments focus on
cyanobacterial toxins primarily and cyanobacteria secondarily in terms of toxicity to humans and other
mammals (Codd et al., 2005). Such an approach can allow sufficient protection of human health and
livestock but may not be recommended to ensure sufficient protection for aquatic invertebrates.
Indeed, studies of Wilson et al. (2006) and Tillmanns et al. (2008), both conducting a meta-analysis of
laboratory experiments, could not support cyanobacterial toxins as a primary driver for the negative
effects on zooplankton species. In particular, they did not observe significant differences between toxin
producing and non-producing strains of cyanobacteria. Although a significant bias towards Microcystis
aeruginosa was present in these datasets, they do indicate that concentrations of cyanobacterial
toxins may not be suitable as the basis for water quality criteria to adequately protect zooplankton
species. Potential other factors driving adverse effects on zooplankton according to Wilson et al.
(2006) and Tillmanns et al. (2008) could be morphology of the cyanobacteria and nutritional deficiency
of cyanobacteria compared to green algae. These hypotheses stem from, among others, the variability
of effects of different cyanobacterial species. Nutritional deficiency of cyanobacteria has been reported
by other authors and related to the lack of polyunsaturated fatty acids and sterols (Demott and Müller-
Navarra, 1997; Von Elert et al., 2003). Yet, no conclusive evidence has been reported and the
nutritional deficiency across different cyanobacterial species remains to be compared.
A confirmation of these hypotheses was not possible with a current meta-analysis due to the earlier
mentioned bias towards Microcystis aeruginosa. Furthermore, few concentration response data are
available (Hietala et al., 1997; Lürling, 2003; Wilson et al., 2006; Soares et al., 2009). Such data are
crucial from a risk assessment point of view to allow translation into a protective regulation. In addition,
field evidence highlights that both the total concentration of cyanobacteria and the percentage of
cyanobacteria relative to the total phytoplankton bio-volume differ considerably with season and year
(Wagner and Adrian 2009, Sondergaard et al. 2011). Thus, ecological reality requires experimental

Chapter 2
38
concentration response data to correctly estimate potential risks of cyanobacterial blooms to aquatic
invertebrates.
Therefore, the aim of this chapter was to investigate the effects on the reproduction of Daphnia pulex
of six different cyanobacteria at various concentrations of these cyanobacteria in the diet. The six
different selected cyanobacteria were: a Microcystis strain, Cylindrospermopsis strain,
Aphanizomenon strain, Anabaena strain, Nodularia strain and Oscillatoria strain. The motivation of this
choice is described in detail in Chapter 1 (section 1.5.1) and is attributed, among others, to their
reported presence in harmful algal blooms. D. pulex was exposed to each of these six cyanobacteria
species individually. A range of different concentrations in the diet was selected to be able to
determine the full concentration response curve upon exposure to each cyanobacteria species. These
concentration response curves can then be used to estimate effect concentrations (ECx) for each
specific cyanobacterium. With these concentration response data, two hypotheses can be tested.
First, estimated parameters describing the observed concentration response curves can be used to
test whether concentrations responses curves to different cyanobacteria are significantly different from
one another. Second, the concentration response curves can also be compared to a starvation control
to test whether the nutritional deficiency is significantly different from a starvation response.
Furthermore, the concentration response curves form a first scientific basis to draft regulations that
adequately protect aquatic invertebrates. In addition, the experimental design includes no bias
towards any of the cyanobacteria and will therefore be able to shed more light on the cyanobacterial
factors driving these negative effects on zooplankton.
2.2 Materials and methods
2.2.1 Experimental organisms
Daphnia pulex stock culture females were obtained from isoclonal laboratory cultures of an isolate
from the Shaw laboratory (Indiana University, Bloomington, IN, USA; Shaw, 2007). This isolate
belonged to the same isoclonal population as the isolate used in the genome sequencing (Colbourne
et al., 2011). Animals were cultured in COMBO medium without nitrogen and phosphorous stocks
(Shaw et al., 2007) under a photoperiod of 16:8h light:dark in a climate control chamber at 20±1°C.
They were fed daily with 2 mg dry weight L-1
of an algal mixture consisting of Pseudokirchneriella
subcapitata and Chlamydomonas reinhardtii in a 3:1 cell number ratio. These animals were
A comparison of the sensitivity of Daphnia pulex to different cyanobacterial species
39
synchronized in terms of age and reproduction and used as brood mothers. Neonates (less than 24
hours old) originating from these brood mothers were randomly assigned to experimental treatments.
All cyanobacteria originated from certified culture collections (Table 2.1) and were cultured in modified
referenced culture media to allow optimal growth (Allen, 1968; Kotai, 1972) as recommended by the
respective culture collections. Cyanobacteria were cultured under standardized conditions in a sterile
environment. Cultures were incubated in 6L volumetric flasks at 20±1°C under constant light
conditions (14 µmol photon/m²/s) with gentle aeration and allowed to grow until mid-log phase, which
had been assessed for each species during the optimization of the culture growth. Afterwards, cultures
were concentrated by centrifugation and cleaned by resuspension and centrifugation using COMBO
medium three times before use. Density of the cultures was determined with a counting chamber. In
addition, the dry weight was determined on a given subsample of 2 mL of the concentrated culture.
This subsample was dried in an oven for 24 hours at 40°C and then the weight of the completely dried
out mass was determined and converted to a ratio of dry weight per mL. Based on this ratio, animals
were fed with the concentrated culture in the experimental treatments. Additionally cyanobacterial
cultures were set up under the same standard conditions to determine the fatty acid methyl ester
(FAME) profile for each cyanobacterium. The green algae mixture of P. subcapitata and C. reinhardtii
served as a reference sample. All cell cultures, cyanobacterial cultures and green algal cultures, were
centrifuged until no more water could be poured off, resulting in a thick paste. Fatty acid composition
of the cyanobacteria was determined as described in De Schamphelaere et al. (2007). Briefly, the
samples were dried and subjected to direct acid catalyzed transesterification according to the
procedure of Lepage and Roy (1984). FAME were extracted with hexane and were prepared for
injection in the gas-chromatograph after evaporation of the solvent. Preparation for injection consisted
of dissolution of the sample in iso-octane. Quantitative determination was obtained through a
Chrompack CP9001 gas-chromatograph with a polar capillary column, BPX70 (SGE, Australia) and a
flame ionization detection method.
Daphnia are non-selective filter feeders and will therefore ingest any particle ranging from 1 to 50 µm,
occasionally even 70 µm (Ebert, 2005). Therefore, cyanobacterial cells were measured during
microscopic observation to ensure their size did not exclude them from being a food source to
Daphnia.
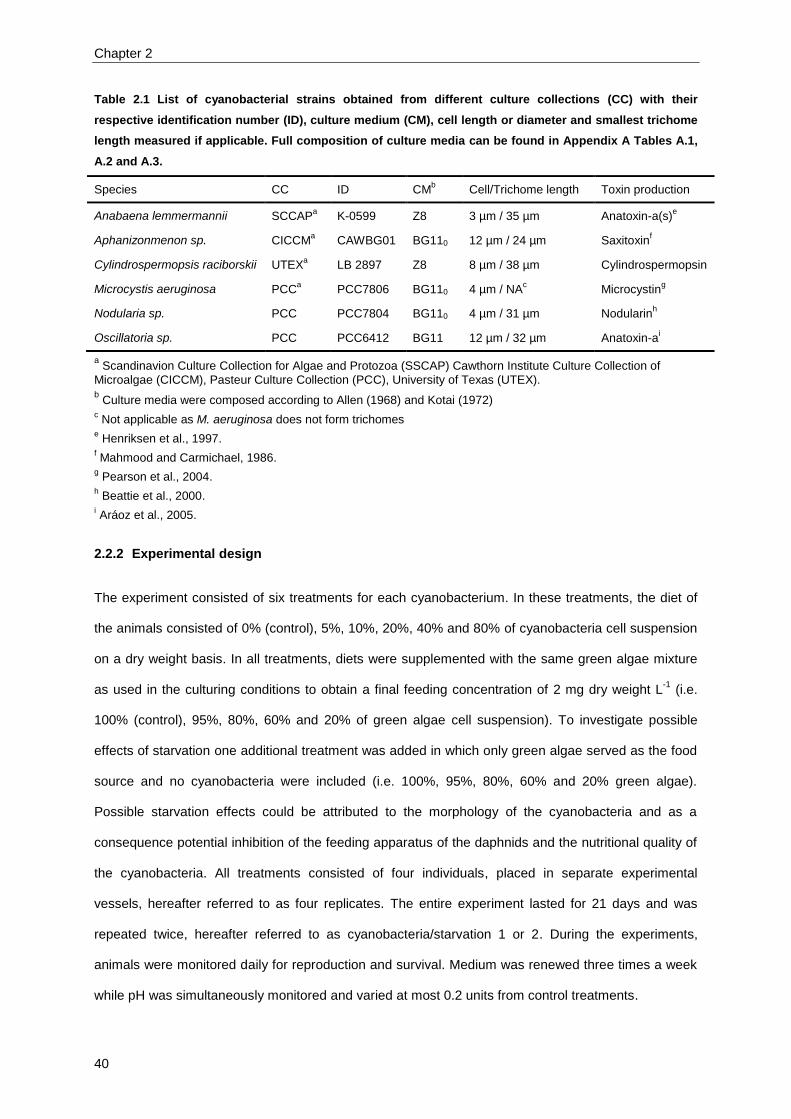
Chapter 2
40
Table 2.1 List of cyanobacterial strains obtained from different culture collections (CC) with their
respective identification number (ID), culture medium (CM), cell length or diameter and smallest trichome
length measured if applicable. Full composition of culture media can be found in Appendix A Tables A.1,
A.2 and A.3.
Species CC ID CMb Cell/Trichome length Toxin production
Anabaena lemmermannii SCCAPa K-0599 Z8 3 µm / 35 µm Anatoxin-a(s)
e
Aphanizonmenon sp. CICCMa CAWBG01 BG110 12 µm / 24 µm Saxitoxin
f
Cylindrospermopsis raciborskii UTEXa LB 2897 Z8 8 µm / 38 µm Cylindrospermopsin
Microcystis aeruginosa PCCa PCC7806 BG110 4 µm / NA
c Microcystin
g
Nodularia sp. PCC PCC7804 BG110 4 µm / 31 µm Nodularinh
Oscillatoria sp. PCC PCC6412 BG11 12 µm / 32 µm Anatoxin-ai
a Scandinavion Culture Collection for Algae and Protozoa (SSCAP) Cawthorn Institute Culture Collection of
Microalgae (CICCM), Pasteur Culture Collection (PCC), University of Texas (UTEX). b Culture media were composed according to Allen (1968) and Kotai (1972)
c Not applicable as M. aeruginosa does not form trichomes
e Henriksen et al., 1997.
f Mahmood and Carmichael, 1986.
g Pearson et al., 2004.
h Beattie et al., 2000.
i Aráoz et al., 2005.
2.2.2 Experimental design
The experiment consisted of six treatments for each cyanobacterium. In these treatments, the diet of
the animals consisted of 0% (control), 5%, 10%, 20%, 40% and 80% of cyanobacteria cell suspension
on a dry weight basis. In all treatments, diets were supplemented with the same green algae mixture
as used in the culturing conditions to obtain a final feeding concentration of 2 mg dry weight L-1
(i.e.
100% (control), 95%, 80%, 60% and 20% of green algae cell suspension). To investigate possible
effects of starvation one additional treatment was added in which only green algae served as the food
source and no cyanobacteria were included (i.e. 100%, 95%, 80%, 60% and 20% green algae).
Possible starvation effects could be attributed to the morphology of the cyanobacteria and as a
consequence potential inhibition of the feeding apparatus of the daphnids and the nutritional quality of
the cyanobacteria. All treatments consisted of four individuals, placed in separate experimental
vessels, hereafter referred to as four replicates. The entire experiment lasted for 21 days and was
repeated twice, hereafter referred to as cyanobacteria/starvation 1 or 2. During the experiments,
animals were monitored daily for reproduction and survival. Medium was renewed three times a week
while pH was simultaneously monitored and varied at most 0.2 units from control treatments.

A comparison of the sensitivity of Daphnia pulex to different cyanobacterial species
41
2.2.3 Data treatment and statistical analyses
All data analysis was conducted with the statistical software R (R Development Core Team, 2011,
version 3.0.1). The response variable was the total reproduction after 21 days for each surviving
organism, a standard parameter in toxicity testing in risk assessment (OECD, 2008) and identified as
the most sensitive endpoint for exposure to Microcystis (Lürling and Beekman, 2006). Concentration
response curves were fitted to each dataset (i.e. all response data for one of the cyanobacteria) with
the drc package (Ritz and Streibig, 2005, version 2.3-7). For each cyanobacterium, two concentration
response curves were modelled as the experiment was conducted twice. The log logistic function
(Finney, 1971) was chosen as it provided the best fit overall. It was characterized by three parameters,
i.e. the maximum response k, the median effect concentration EC50 and the slope s:
( (
) )
(eq. 2.1)
with:
y = response of measured endpoint (here: total reproduction)
k = response of measured endpoint at x = 0
s = slope parameter
x = concentration
EC50 = median effect concentration, resulting in a decline of 50% of the response variable relative to
control treatment
Equation 2.1 is a simplification of the original log logistic function which was defined as follows:
( ( )) (eq 2.2)
The parameters in eq. 2.1 are estimated using non-linear least squares which uses the function optim
in R, a general purpose optimization based on gradient algorithms (Ritz and Streibig, 2005). Kruskal-
Wallis Rank Sum tests were conducted to determine significant differences between concentration
response curves (Hollander and Wolfe, 1973). Therefore, the three parameters of the concentration

Chapter 2
42
response curves (eq. 2.1) were compared across the responses to different cyanobacteria. This non
parametric alternative was chosen due to a violation of assumptions of normality (Shapiro-Wilk test)
and homoscedasticity (Levene test) (Fox, 2008; Royston, 1982), that are generally required for
parametric statistics.
2.3 Results
Exposures to the different cyanobacteria resulted in a decline of the total reproduction with increasing
amount of cyanobacteria in the diet (Appendix A Fig. A.1). Similarly, decreasing the amount of green
algae or increased starvation of the Daphnia also resulted in an increased decline of total reproduction
in the starvation treatment (Appendix A Fig. A.1). No significant differences were observed for any of
the three parameters, modelling the response of total reproduction of all four replicates in all six
treatments in the two repeated experiments, between the different exposures (Table 2.2, pk=0.08,
pEC50=0.69, ps=0.53). Fitted concentration response curves as well as the raw data are represented in
Appendix A Fig A.1. The median effect concentrations varied between 30% and 50% of the total diet
for cyanobacterial treatments as well as the starvation treatment, which means that at this range in the
diet animals reproduced approximately half the amount of offspring compared to a diet containing
100% of green algae (Table 2.2). The lack of significance for the different values of the maximum
response k is not surprising as it refers to the maximum reproduction under control conditions, i.e.
100% of green algae in the diet, which should be consisted across all experiments. The lack of
significant differences for the values of the slope parameter s indicates that the decline in reproduction
with decreasing concentrations of green algae in the diet is comparable across all experiments.
Table 2.2 Estimated value and standard error of each parameter in equation 2.1, i.e. maximum response k,
median effect concentration (EC50) and slope parameter s, for the concentration response data represent
per repeated experiment labelled 1 or 2 for each cyanobacteria. Each repeated experiment consisted of
six concentrations and each concentration consisted of four replicates.
Maximum response k EC50 (% of diet) Slope parameter s
Anabaena 1 33.6 ± 2.98 52.5 ± 12.8 2.14 ± 1.29
Anabaena 2 25.3 ± 2.15 31.5 ± 9.86 0.89 ± 0.25
Aphanizomenon 1 32.1 ± 1.31 48.6 ± 5.70 1.42 ± 0.28
Aphanizomenon 2 36.2 ± 2.13 36.4 ± 6.38 1.18 ± 0.27
Cylindrospermopsis 1 37.7 ± 1.90 32.9 ± 4.20 1.78 ± 0.37
Cylindrospermopsis 2 33.2 ± 1.08 31.7 ± 3.31 1.10 ± 0.12

A comparison of the sensitivity of Daphnia pulex to different cyanobacterial species
43
(Table 2.2 cont.) Maximum response k EC50 (% of diet) Slope parameter s
Microcystis 1 29.4 ± 0.81 42.3 ± 2.73 3.09 ± 0.51
Microcystis 2 38.7 ± 1.37 43.3 ± 3.57 3.51 ± 1.11
Nodularia 1 31.7 ± 2.22 31.6 ± 5.41 2.12 ± 0.62
Nodularia 2 29.1 ± 1.29 42.7 ± 4.58 1.93 ± 0.44
Oscillatoria 1 33.4 ± 1.23 38.3 ± 3.16 2.52 ± 0.53
Oscillatoria 2 33.8 ± 1.49 31.9 ± 3.39 2.14 ± 0.40
Starvation 1 30.7 ± 1.12 46.4 ± 5.47 6.01 ± 4.59
Starvation 2 36.2 ± 1.38 49.2 ± 3.87 4.55 ± 1.49
No effects on survival time were observed as even in the treatments with the lowest percentage of
green algae in the diet, animals survived (Fig. 2.1). This indicates no effect on survival of Daphnia
pulex even when cyanobacteria make up the majority of the diet.
Figure 2.1 Mean survival time in the 21-day life history experiment. Two identically coloured bars
represent the repeated experiments 1 and 2. Error bars indicate the standard deviation within each
repeated experiment. When no error bars are plotted, all replicate animals in that treatment survived. Ana
= Anabaena, Aph = Aphanizomenon, Cyl = Cylindrospermopsis, Mc = Microcystis, Nod = Nodularia, Osl =
Oscillatoria.
The effects on reproduction could be attributed to a reduced number of clutches for organisms
exposed to the lowest percentage of green algae as well as an increase in the time to the first clutch
(Fig. 2.2). Both observations were only made for the lowest percentage of green algae as for high
percentages of green algae, i.e. 5 to 20%, little difference could be observed between the treatment
and the control. The size of the first clutch in treatments with lower percentages of green algae was
also smaller (Fig 2.2).

Chapter 2
44
Figure 2.2 Time first clutch (top), number of clutches (middle) and size of 1st
clutch (bottom) in the 21-day
life history experiment. Two identically coloured bars represent the repeated experiments 1 and 2. Error
bars indicate the standard deviation within each repeated experiment. When no error bars are plotted, the
same value has been reported for all replicate animals in that treatment for that parameter. Ana =
Anabaena, Aph = Aphanizomenon, Cyl = Cylindrospermopsis, Mc = Microcystis, Nod = Nodularia, Osl =
Oscillatoria.

A comparison of the sensitivity of Daphnia pulex to different cyanobacterial species
45
The fatty acid methyl ester profiles of all cell suspensions can be visually distinguished from one
another (Appendix A Fig. A.3.). The total FAME content is in line with results from Piorreck et al.
(1984), who also observed about three times more fatty acid methyl esters in green algae than in
various cyanobacteria including Microcystis aeruginosa and Oscillatoria. Furthermore, the content of
the specific fatty acids (Appendix A Fig. A.3) is line with values reported by Gugger et al. (2002) who
studied cellular fatty acid in six genera of cyanobacteria, including Anabaena, Aphanizomenon,
Microcystis and Nostoc. This could also be seen from the total omega-3 and omega-6 fatty acid
content (Fig. 2.1). The total omega-3 content is five to ten times higher in green algae compared to
cyanobacteria, excluding Anabaena. The omega-3 content in Anabaena is 1.5 to five times higher
than that of other cyanobacteria, but still only half of the omega-3 content in green algae. No clear
visual distinctions could be made between cyanobacterial FAME profiles on one hand and the green
algae profile on the other hand. However, the total FAME content in green algae cultures was at least
1.5 times higher than the total FAME content of the cyanobacterial cultures.
Figure 2.3 Bar chart of the total omega-3 and omega-6 poly unsatured fatty acid content for each of the
food suspensions as well as the total fatty acid methyl ester (FAME) content.
2.4 Discussion
The results indicate overall negative effects of cyanobacteria on the reproduction of Daphnia pulex,
even when cyanobacteria make up less than 50% of the diet, i.e. the median effect concentration
varied between 30-50% of cyanobacteria in the diet. Furthermore, no clear difference between effects
of different cyanobacteria on reproduction of D. pulex could be demonstrated. These findings are in
line with conclusions made by Wilson et al. (2006) and Tillmanns et al. (2008) which found no
evidence that toxin production would serve as a primary driver affecting zooplankton. More

Chapter 2
46
importantly, in contrast to previous studies, current results did not demonstrate a significant bias
towards Microcystis aeruginosa but covered a broader range of cyanobacterial species.
The lack of significant differences could be attributed to a lack of repeatability of the experiments given
that the variation between the cyanobacteria is comparable to the variation within repeated
experiments for some median effect concentrations and some slope parameters. However, this may
also be a consequence of the selected diet ratios that were tested. Indeed, if the actual median effect
concentration lies between two tested concentrations, the standard error on the median effect
concentration increases with the size of the interval. Given that the median effect concentration is
estimated between 30-50% and the tested concentrations were 20, 40 and 80%, the interval may not
have been optimally chosen to estimate this parameter. To exclude the lack of repeatability, Wilcoxon
Rank Sum tests were conducted to compare individual diet ratios across the different experiments,
rather than estimating the dose response. No significant differences were observed between the
effects at 20% of cyanobacteria in the diet (p=0.13) nor at 80% of cyanobacteria in the diet (p=0.14) in
the different experiments. However, significant differences were observed at a concentration of 40% in
the diet (p=0.005). This suggests that the lack of significant differences is not due to a lack of
repeatability but rather that significant differences are only observed in a narrow range of the diet ratio
around the 40% value.
The overall effects could be attributed to a general starvation effect given the lack of significant
differences between the starvation concentration response data and any of the cyanobacteria
concentration response data for the full concentration response curve as well as for the majority of the
tested concentrations. These results suggest therefore common shared characteristics across the
different cyanobacteria resulting in a similar concentration response curve related to nutritional quality.
Furthermore, it underlines that, regardless of the potential of other mechanisms of toxicity of
cyanobacteria, the lack of good quality food drives the effect on D. pulex at the organismal level for the
majority of the diet ratios. Further mechanistic research is needed to assess the driving factors of
significant differences around the 40% diet range. The analysis of the FAME profiles revealed a large
difference in total FAME content between cyanobacteria cultures on one hand and green algae on the
other hand which may have a significant impact on their nutritional quality for zooplankton. The key
factors for good nutritional quality in cladocera such as Daphnia are among others the total content of
omega-3 polyunsaturated fatty acids in the food (Von Elert, 2004). The omega-3 content was also

A comparison of the sensitivity of Daphnia pulex to different cyanobacterial species
47
different in green algae compared to cyanobacteria although Anabaena seems to be in-between the
green algae and the other cyanobacteria in terms of total omega-3 content. Furthermore, alpha-linoleic
acid (18:3(n-3)) is often referred to as one of the crucial omega-3 amino acids to influence growth (Von
Elert, 2004). Yet, Anabaena and Cylindrospermopsis contained at least 1.5 times as much alpha-
linoleic acid than green algae (Appendix A Fig. A.3). Despite the differences in fatty acid content and
omega-3 content, these results are thus not in line with the general knowledge concerning the specific
fatty acids limiting Daphnia growth. Here, a molecular analysis of the mechanisms affected by
cyanobacteria in D. pulex would be crucial to investigate how and whether nutritional quality is the only
mechanism driving cyanobacterial toxicity.
From a risk assessment perspective, these results do not support the use of cyanobacterial toxins in
regulations to protect zooplankton as they do not seem to drive detrimental effects on zooplankton
species in contrast to effects on human health or livestock. The use of cyanobacterial concentrations
rather than toxin concentrations may be a more suitable alternative or added value in particular given
the lack of differences for the majority of the concentrations and the significant differences around the
40% diet ratio. In addition, the nutritional quality of cyanobacteria relatively to green algae could be
used to indicate the lack of nutrition in terms of cyanobacteria concentrations.
These results also seem to suggest that a general risk assessment for all cyanobacteria could be
drafted as the concentration response curves do not differ significantly between different
cyanobacteria. However, D. pulex is but a single species and effects are known to vary considerably
between different zooplankton species (DeMott et al., 1991). Tillmans et al. (2008) did observe
significant differences between the effects of different cyanobacteria on D. magna. Pattinson et al.
(2003) observed that Daphnia lumholtzi was less susceptible to cyanobacterial stress than Daphnia
parvula and Daphnia mendotae. As a consequence, results should not be straightforwardly
extrapolated from one species to another but rather be used in a multiple species approach to fully
incorporate these variations.

Chapter 2
48
2.5 Conclusion
The current chapter highlights that concentration response curves of Daphnia pulex exposed to
different cyanobacteria remained conserved across the six studied cyanobacteria. This indicates that
cyanobacterial toxins are unlikely to drive adverse effects on zooplankton. Given the overall lack of
significant differences between cyanobacterial treatments and starvation treatments, the effects on the
fitness of Daphnia pulex were most likely driven by common lack of nutritional quality across all
cyanobacteria. Nevertheless significant differences were observed at a concentration of 40%
cyanobacteria in the diet. Further mechanistic research within this concentration range is however
needed to underpin the cause of these differences. Fatty acid methyl ester profiles revealed
differences in total FAME content and omega-3 content but were in contrast with general expectations
in literature.
Adverse effects on Daphnia pulex depended upon the concentration of cyanobacteria in the diet. This
underlines the importance of including cyanobacteria concentrations in risk assessments to sufficiently
protect zooplankton species. A proposed approach consists of using cyanobacterial concentration
response curves across multiple zooplankton species to also incorporate potential interspecies
variation.
Chapter 3
Combined and interaction effects of
cyanobacteria and insecticides across
full concentration responses
3 x
Redrafted after:
Jana Asselman, Joris Meys, Willem Waegeman, Bernard De Baets, Karel AC De Schamphelaere.
2013. Combined exposure to cyanobacteria and carbaryl results in antagonistic effects on the
reproduction of Daphnia pulex. Environmental Toxicology and Chemistry 32, 2153-2158.
Jana Asselman, Colin R Janssen, Guy Smagghe, Karel AC De Schamphelaere. 2014. Ecotoxicity of
binary mixtures of Microcystis aeruginosa and insecticides to Daphnia pulex. Environmental Pollution
188, 56–63.


Combined and interaction effects of cyanobacteria and insecticides across full concentration responses
51
3.1 Introduction
Over the last decade, significant progress has been made in environmental risk assessment. The
development of structural frameworks addressing combined effects has brought risk assessment
closer to environmental reality (Altenburger et al., 2013). Yet, several obstacles still need to be
addressed.
First, the consequences of interaction effects between biotic and chemical stressors remain largely
unknown as regulatory research efforts stay focused on combinations of chemicals. Pioneer studies
have been reported in section 1.1. However, as discussed in section 1.1, these studies address
interaction effects between specifically selected stressors widely scattered across the research
landscape and are mainly focused on abiotic stressors (Holmstrup et al. 2010).
Second, statistical methods to evaluate combined and interaction effects vary considerably between
studies. Most commonly used models are the independent action model (Bliss independence) and the
concentration addition model (Loewe additivity) (Bliss, 1939; Loewe, 1928). Some studies (Cerbin et
al., 2010; De Coninck et al., 2013b) adhere to general ANOVA principles, which is mathematically
equivalent to independent action after log transformation of the data (De Coninck et al., 2013b). At
present, neither of the two reference models can be unequivocally selected as the best model
(Backhaus et al., 2004; Cedergreen et al., 2008; Jonker et al., 2005).
Third, current statistical models can quite accurately predict combined effects when no interactions are
present. However, as highlighted in chapter 1 (section 1.1.2) significant deviations such as synergisms
and antagonisms cannot be predicted and can only be assessed by conducting full concentration
response experiments of the mixtures. Given the scale and time of these types of experiments, it is
impossible to conduct them on all possible stressor combinations. Hence, alternative approaches are
needed.
Here, Daphnia pulex was exposed for 21 days to binary combinations of Microcystis and five
insecticides (carbaryl, chlorpyrifos, fenoxycarb, tebufenpyrad and tetradifon) and binary combinations
of carbaryl and four cyanobacteria (Aphanizomenon, Cylindrospermopsis, Microcystis and
Oscillatoria). The aim of this chapter was therefore threefold. First, statistical models were applied on
this selection of binary combinations to gain crucial knowledge concerning these specific groups of
Chapter 3
52
toxicants. Here, insecticides and cyanobacteria were chosen due to their individual significant impact
on aquatic ecosystems as well as their potential interaction effects as discussed in chapter 1 (section
1.2.4). Due to experimental constraints, one insecticide and one cyanobacterium were selected:
carbaryl, an acetylcholine esterase inhibiting insecticide, and Microcystis aeruginosa, a
cyanobacterium. Acetylcholine esterase inhibitors in general and carbaryl in particular are among the
most extensively used pesticides and have been detected in freshwater environments (Hapeman et
al., 2002; Murray et al., 2010). Microcystis aeruginosa and its potential effects on the aquatic system
and Daphnia species in particular have been extensively studied (Lürling, 2003; Rohrlack et al., 1999).
Second, experimental data was analyzed with both independent action (IA) and concentration addition
(CA) to allow extensive and consistent comparison between the reference models. Third, carbaryl was
combined with several cyanobacteria, including Microcystis, and Microcystis was combined with
several pesticides, including carbaryl. Insecticides spanned a variety of modes of actions (section
1.5.2) and cyanobacteria differed in characteristics (section 1.5.1). Thus, two hypotheses can be
tested: interaction effects of carbaryl and cyanobacteria are comparable between different
cyanobacteria and interaction effects of Microcystis and pesticides are comparable between pesticides
with similar modes of action and different between pesticides with dissimilar modes of action.
Comparable interaction effects between different cyanobacteria combined with the same pesticide are
expected given the similar concentration response curves reported in chapter 2. Overall, it was
anticipated that this selection would allow an enhanced understanding of the mechanisms of
interaction effects across a defined group of stressors.
3.2 Materials and methods
3.2.1 Experimental organisms and cyanobacteria
The experimental organisms originated from D. pulex cultures as described in section 2.2.1. Likewise,
cyanobacteria culture conditions were also described in section 2.2.1.
3.2.2 Experimental design
Chronic toxicity experiments were conducted based on the central composite design (Fig. B.1),
commonly used in evaluating and assessing mixture data and which allows optimal evaluation of both
the independent action as well as the concentration addition model (Jonker et al., 2005; Lock and

Combined and interaction effects of cyanobacteria and insecticides across full concentration responses
53
Janssen, 2002), with the addition of five points for each of the two single stressors (Fig. 3.1, 3.2). This
allowed simultaneous evaluation of the effects of the individual stressors and the mixtures as
recommended by De Laender et al (2009). Each design point was replicated three times, i.e. three
daphnids per treatment, each in an individual vessel. A solvent control (0.016% of pure ethanol) was
added to exclude potential effects of the solvent in which insecticides were dissolved. Control and
solvent control were replicated five times. Concentration ranges of the insecticide only treatments
were determined based upon literature review and preliminary experiments with the single
compounds. They were selected in such a manner to cover the range of different EC50s (effect
concentration causing a 50% decline in reproduction) reported in literature and observed in preliminary
experiments. For each of the cyanobacteria, the concentrations were given as a percentage between
5% and 80% of the diet (on a dry weight per liter basis) supplemented with a mixture of
Pseudokirchneriella subcapitata and Chlamydomonas reinhardtii (3:1 cell based ratio) to a final target
concentration of 2 mg dry weight L-1
. This was based upon the results in chapter 2 (section 2.3).
Animals were exposed for a period of 21 days. The experiment was conducted in 25 mL glass vessels
with one neonate per vessel. All animals were fed daily with a final feeding concentration of 2 mg dry
weight L-1
of algae suspension. In each treatment, animals were monitored daily for survival and
reproduction. If the adult reproduced, neonates were counted and removed from the vessel. The
medium was renewed three times per week.
During all experiments, pH of old and new media was monitored at regular intervals and varied at most
0.2 units from control treatments (pH=7.00± 0.2). In addition, samples of the medium and stock
solutions were taken for insecticide concentration analysis.
3.2.3 Chemical stock solutions and analysis
All insecticides were obtained from Sigma-Aldrich (Bornem, Belgium) in pure powder form, analytical
grade i.e. purity ≥ % . Due to low water solubility of the compounds, stock solutions were made by
dissolving the insecticides in pure ethanol (analytical grade, Sigma-Aldrich, Bornem, Belgium).
All samples were stored in the dark at -20°C in glass tubes to prevent degradation until analysis with
gas chromatography – mass spectrometry (GC-MS: Trace GC 2000 series, Thermoquest; Polaris,
Finnigan/Thermoquest). For all insecticides, an apolar SLBTM-5ms column (Supelco, Sigma-Aldrich)

Chapter 3
54
was used. Extraction and elution were performed by Solid Phase Extraction according to the
manufacturer’s notes Waters and Phenomenex . Finally, the insecticide was eluted with tert-methyl-
butyl-ether (MTBE) Sigma Aldrich, purity ≥ . % . During the procedure, recipients and glassware
were rinsed with MTBE to avoid retention of insecticide residues on the glass or column wall. For each
insecticide, a separate internal standard was used to control and correct for losses during the
extraction and elution procedures (Appendix B.2). To control for the injection itself, a recovery
standard was added after the solid phase extraction (Appendix B.2). For each solid phase extraction, a
blank (no insecticide) and a spike (a given concentration of insecticide added to control medium from a
certified solution) were added to the analysis. Quality criteria for blank and spike were no detection of
the insecticide and more than 90% detection of the added amount of insecticide, respectively. Across
all insecticides, recovery of the spike was always between 90 and 115%. Based on OECD guideline
211 (OECD, 2008), the time weighted means of measured insecticide concentrations were used for all
further data analysis. All subsequent figures and tables therefore use time weighted means of
measured insecticide concentrations and not nominal concentrations (Fig. 3.1-3.2).
Figure 3.1 Experimental designs for the binary mixture combinations with carbaryl: Nominal
concentrations are represented by filled circles, measured concentrations are represented by open
squares with error bars representing standard deviation. Control treatment is represented by an open
circle.
Cyanobacteria % of diet
Carb
ary
l (µ
g/L
)

Combined and interaction effects of cyanobacteria and insecticides across full concentration responses
55
Figure 3.2 Experimental designs for the binary mixture combinations with Microcystis: Nominal concentrations are represented by filled circles, measured
concentrations are represented by open squares with error bars representing standard deviation. Control treatment is represented by an open circle.
Microcystis % of the diet
Microcystis % of the diet Microcystis % of the diet
Microcystis % of the diet
Chlo
rpyrifo
s (
ng/L
) T
ebufe
np
yra
d (
µg/L
)
Fenoxycarb
(ng/L
) T
etr
adifon (
µg/L
)

Chapter 3
56
3.2.4 Statistical analysis
The chosen response variable to determine combined and interaction effects was the total number of
offspring per surviving female at the end of the experiment. Females that did not survive the entire 21
day period were excluded from the analysis. In tebufenpyrad and tetradifon treatments, animals in the
highest concentration, i.e. 25 µg/L and 40 µg/L, all died within the first week. Therefore, these
concentrations were not taken into account in data analysis or in the concentration measurements.
First, results from control treatments and solvent control treatments were analyzed and compared to
exclude solvent effects. Comparison was done using a t-test after verifying assumptions of normality
and homoscedasticity by the Shapiro-Wilk test (Royston, 1982) and Levene test (Fox, 2008),
respectively.
The analysis of the binary mixture experiments was conducted with an in-house developed R-code (R
Development Core Team, 2008, version 3.0.1) (Appendix B.3). This code evaluates mixture
experiments with both the concentration addition and the independent action reference models based
on Jonker et al. (2005). It uses the log logistic concentration response function (eq. 2.1) and
subsequent derived equations for both concentration addition (eq. 3.1) and independent action (eq.
3.2) reference models as described by Jonker et al. (2005) and listed in the R-code (Appendix B.3)
In a mixture, under the concentration addition reference model, the sum of the toxic units is assumed
to equal 1 in case of no interaction and this is expressed as follows:
( )
( )
( ) (eq. 3.1)
Here, x is the concentration of the stressor and indexes 1 and 2 denote stressors 1 and 2 in the
mixture. Y is the response variable and f-1
denotes the inverse of the response function, i.e. the
inverse of eq. 2.1. G refers to the deviation function (eq. 3.3, as defined in Jonker et al., 2005) and the
value of G equals 0 under the hypothesis of no interaction.
Under the independent action reference model, the response to stressor 1 is assumed to act
independently from stressor 2 and this is mathematically expressed as follows:
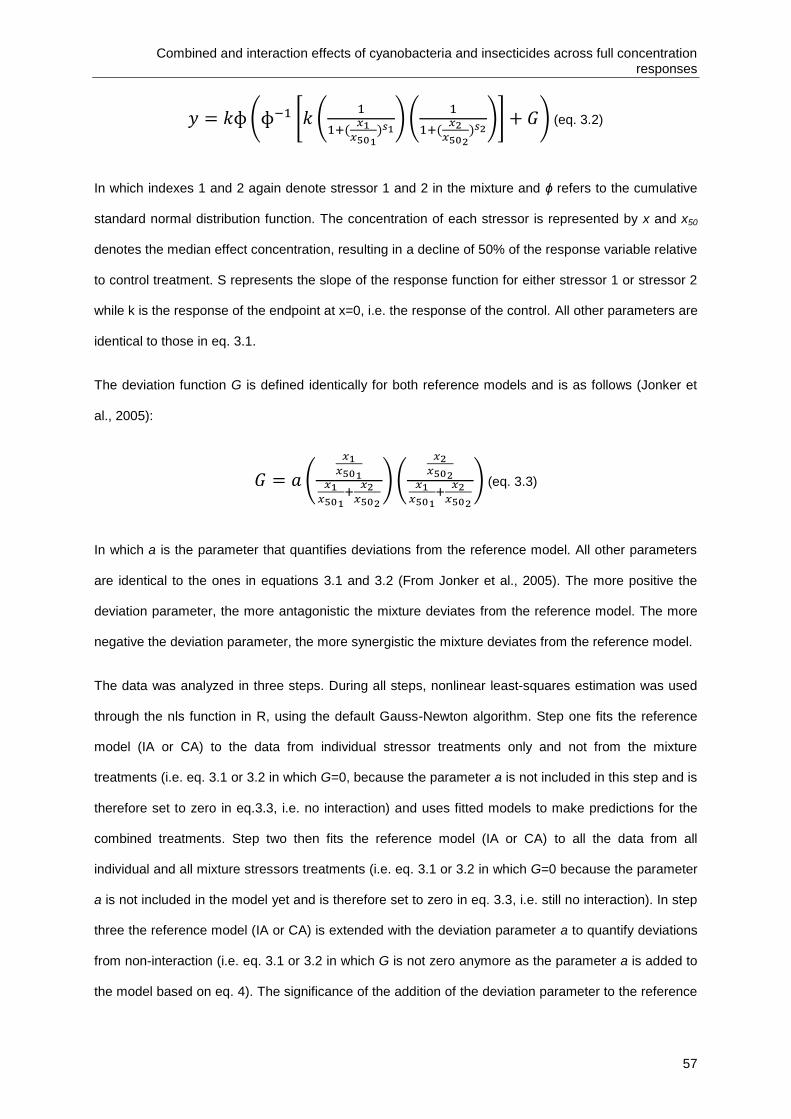
Combined and interaction effects of cyanobacteria and insecticides across full concentration responses
57
( [ (
(
) )(
(
) )] ) (eq. 3.2)
In which indexes 1 and 2 again denote stressor 1 and 2 in the mixture and ɸ refers to the cumulative
standard normal distribution function. The concentration of each stressor is represented by x and x50
denotes the median effect concentration, resulting in a decline of 50% of the response variable relative
to control treatment. S represents the slope of the response function for either stressor 1 or stressor 2
while k is the response of the endpoint at x=0, i.e. the response of the control. All other parameters are
identical to those in eq. 3.1.
The deviation function G is defined identically for both reference models and is as follows (Jonker et
al., 2005):
(
)(
) (eq. 3.3)
In which a is the parameter that quantifies deviations from the reference model. All other parameters
are identical to the ones in equations 3.1 and 3.2 (From Jonker et al., 2005). The more positive the
deviation parameter, the more antagonistic the mixture deviates from the reference model. The more
negative the deviation parameter, the more synergistic the mixture deviates from the reference model.
The data was analyzed in three steps. During all steps, nonlinear least-squares estimation was used
through the nls function in R, using the default Gauss-Newton algorithm. Step one fits the reference
model (IA or CA) to the data from individual stressor treatments only and not from the mixture
treatments (i.e. eq. 3.1 or 3.2 in which G=0, because the parameter a is not included in this step and is
therefore set to zero in eq.3.3, i.e. no interaction) and uses fitted models to make predictions for the
combined treatments. Step two then fits the reference model (IA or CA) to all the data from all
individual and all mixture stressors treatments (i.e. eq. 3.1 or 3.2 in which G=0 because the parameter
a is not included in the model yet and is therefore set to zero in eq. 3.3, i.e. still no interaction). In step
three the reference model (IA or CA) is extended with the deviation parameter a to quantify deviations
from non-interaction (i.e. eq. 3.1 or 3.2 in which G is not zero anymore as the parameter a is added to
the model based on eq. 4). The significance of the addition of the deviation parameter to the reference

Chapter 3
58
model is statistically determined through an F-statistic (Jonker et al., 2005). Alternatively the Aikaike
Information Criterion (AIC) can be used to give an indication of the best model fit although it is not a
true statistical measure. To exclude the possibility that a single design point would affect conclusions,
models of steps two and three were subsequently fitted and analyzed by each time leaving out one
design point. No design point significantly influenced statistical conclusions as leaving one design
point out did not alter the p-value (Appendix B Table B.1).
3.3 Results
Reproduction in control treatments was not significantly different from reproduction in solvent control
treatments (p=0.57). Thus an effect of the solvent on the test organism can be excluded. Mortality in
control treatments was less than 10% for all experiments. Measured concentrations of insecticides are
reported in Fig. 3.1 and Fig. 3.2. The effect concentration for the total reproduction per surviving
female resulting in a 50% decline of the total reproduction (EC50) was for all insecticides within the
tested concentration range as can be seen from the single dose response data (Appendix B Fig. B.2-
B.9) and the model estimates of step 1, using only single stressor data (Table 3.1). Fenoxycarb and
chlorpyrifos were the most toxic, both having an EC50 around 70 ng/L whereas tetradifon and
tebufenpyrad were significantly less toxic with EC50s around 10 µg/L (Table 3.1). The estimated EC50
for carbaryl (Table 3.2) was comparable between the different experiments, ranging between 1.93 and
6.16 µg/L.
The estimated EC50 for Microcystis ranged from 30% to 60% of the total diet between experiments
(Table 3.1). In the experiments with fenoxycarb and tetradifon (Appendix B Fig. B.3 and B.5), animals
exposed to 80% of Microcystis either died or survived without reproducing whereas in experiments
with chlorpyrifos and tebufenpyrad (Appendix B Fig. B.2 and B.4), animals exposed to 80% of
Microcystis were able to reproduce, albeit very little. In the mixture treatments, animals did not survive
in the combination of chlorpyrifos and Microcystis containing the highest chlorpyrifos concentration
(Appendix B Fig. B.2). In the three other combinations, at least one animal survived in each mixture
combination (Appendix B Fig. B.3-B.5). However for combinations of carbaryl and Microcystis and
carbaryl and Oscillatoria, animals did not reproduce in the mixture combination with the highest
concentration of cyanobacteria (Appendix B Fig. B.8-B.9). Based on the estimated EC50 for each
cyanobacterium (Table 3.2), Microcystis can be considered the most toxic followed by
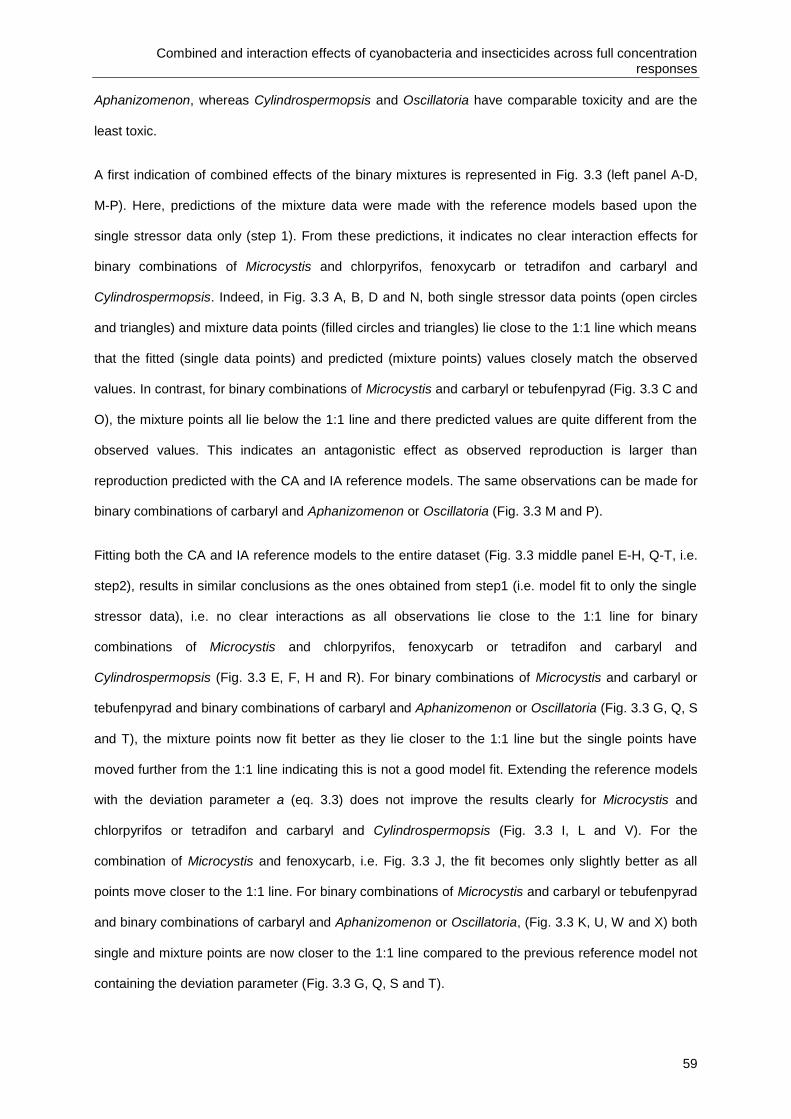
Combined and interaction effects of cyanobacteria and insecticides across full concentration responses
59
Aphanizomenon, whereas Cylindrospermopsis and Oscillatoria have comparable toxicity and are the
least toxic.
A first indication of combined effects of the binary mixtures is represented in Fig. 3.3 (left panel A-D,
M-P). Here, predictions of the mixture data were made with the reference models based upon the
single stressor data only (step 1). From these predictions, it indicates no clear interaction effects for
binary combinations of Microcystis and chlorpyrifos, fenoxycarb or tetradifon and carbaryl and
Cylindrospermopsis. Indeed, in Fig. 3.3 A, B, D and N, both single stressor data points (open circles
and triangles) and mixture data points (filled circles and triangles) lie close to the 1:1 line which means
that the fitted (single data points) and predicted (mixture points) values closely match the observed
values. In contrast, for binary combinations of Microcystis and carbaryl or tebufenpyrad (Fig. 3.3 C and
O), the mixture points all lie below the 1:1 line and there predicted values are quite different from the
observed values. This indicates an antagonistic effect as observed reproduction is larger than
reproduction predicted with the CA and IA reference models. The same observations can be made for
binary combinations of carbaryl and Aphanizomenon or Oscillatoria (Fig. 3.3 M and P).
Fitting both the CA and IA reference models to the entire dataset (Fig. 3.3 middle panel E-H, Q-T, i.e.
step2), results in similar conclusions as the ones obtained from step1 (i.e. model fit to only the single
stressor data), i.e. no clear interactions as all observations lie close to the 1:1 line for binary
combinations of Microcystis and chlorpyrifos, fenoxycarb or tetradifon and carbaryl and
Cylindrospermopsis (Fig. 3.3 E, F, H and R). For binary combinations of Microcystis and carbaryl or
tebufenpyrad and binary combinations of carbaryl and Aphanizomenon or Oscillatoria (Fig. 3.3 G, Q, S
and T), the mixture points now fit better as they lie closer to the 1:1 line but the single points have
moved further from the 1:1 line indicating this is not a good model fit. Extending the reference models
with the deviation parameter a (eq. 3.3) does not improve the results clearly for Microcystis and
chlorpyrifos or tetradifon and carbaryl and Cylindrospermopsis (Fig. 3.3 I, L and V). For the
combination of Microcystis and fenoxycarb, i.e. Fig. 3.3 J, the fit becomes only slightly better as all
points move closer to the 1:1 line. For binary combinations of Microcystis and carbaryl or tebufenpyrad
and binary combinations of carbaryl and Aphanizomenon or Oscillatoria, (Fig. 3.3 K, U, W and X) both
single and mixture points are now closer to the 1:1 line compared to the previous reference model not
containing the deviation parameter (Fig. 3.3 G, Q, S and T).

Chapter 3
60
Figure 3.3 Part 1 Mean observed versus fitted values for models for total reproduction for each binary experiment: chlorpyrifos x Microcystis (first row: A,E,I),
fenoxycarb x Microcystis (second row: B,F,J). Circles depict the independent action model fits (equation 3.2), triangles depict the concentration addition model fits
(equation 3.1). Open symbols denote the single stressor treatments, full symbols denote the mixed stressor treatments. For all models, the 1:1 line is plotted.
Observed values Observed values Observed values
Observed values Observed values Observed values
Fitte
d o
r pre
dic
ted
va
lues
Fitte
d o
r pre
dic
ted
va
lues
Fitte
d v
alu
es
Fitte
d v
alu
es
Fitte
d v
alu
es
Fitte
d v
alu
es

Combined and interaction effects of cyanobacteria and insecticides across full concentration responses
61
Figure 3.3 Part 2 Mean observed versus fitted values for models for total reproduction for each binary experiment: tebufenpyrad x Microcystis (first row: C,G,K),
tetradifon x Microcystis (second row: D,H,L). Circles depict the independent action model fits (equation 3.2), triangles depict the concentration addition model fits
(equation 3.1). Open symbols denote the single stressor treatments, full symbols denote the mixed stressor treatments. For all models, the 1:1 line is plotted.
Fitte
d o
r pre
dic
ted
va
lues
Fitte
d o
r pre
dic
ted
va
lues
Fitte
d v
alu
es
Fitte
d v
alu
es
Fitte
d v
alu
es
Fitte
d v
alu
es
Observed values Observed values Observed values
Observed values Observed values Observed values
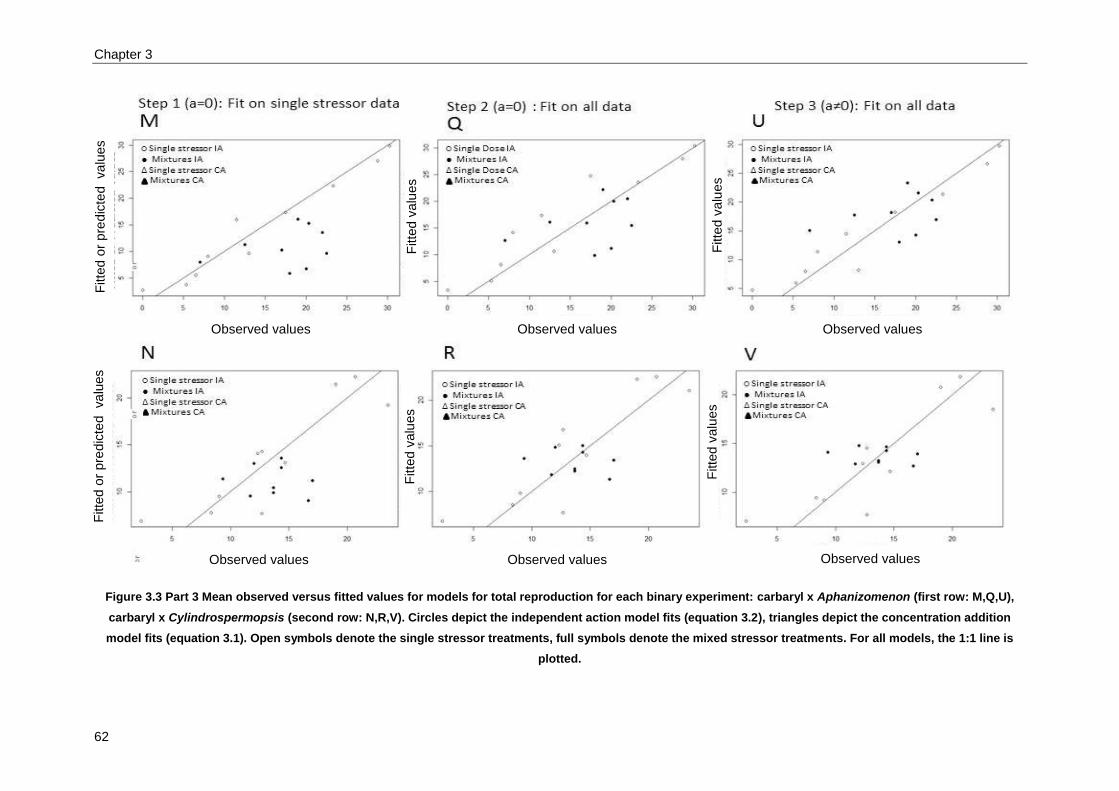
Chapter 3
62
Figure 3.3 Part 3 Mean observed versus fitted values for models for total reproduction for each binary experiment: carbaryl x Aphanizomenon (first row: M,Q,U),
carbaryl x Cylindrospermopsis (second row: N,R,V). Circles depict the independent action model fits (equation 3.2), triangles depict the concentration addition
model fits (equation 3.1). Open symbols denote the single stressor treatments, full symbols denote the mixed stressor treatments. For all models, the 1:1 line is
plotted.
Fitte
d o
r pre
dic
ted
va
lues
Fitte
d o
r pre
dic
ted
va
lues
Fitte
d v
alu
es
Fitte
d v
alu
es
Fitte
d v
alu
es
Fitte
d v
alu
es
Observed values Observed values Observed values
Observed values Observed values Observed values
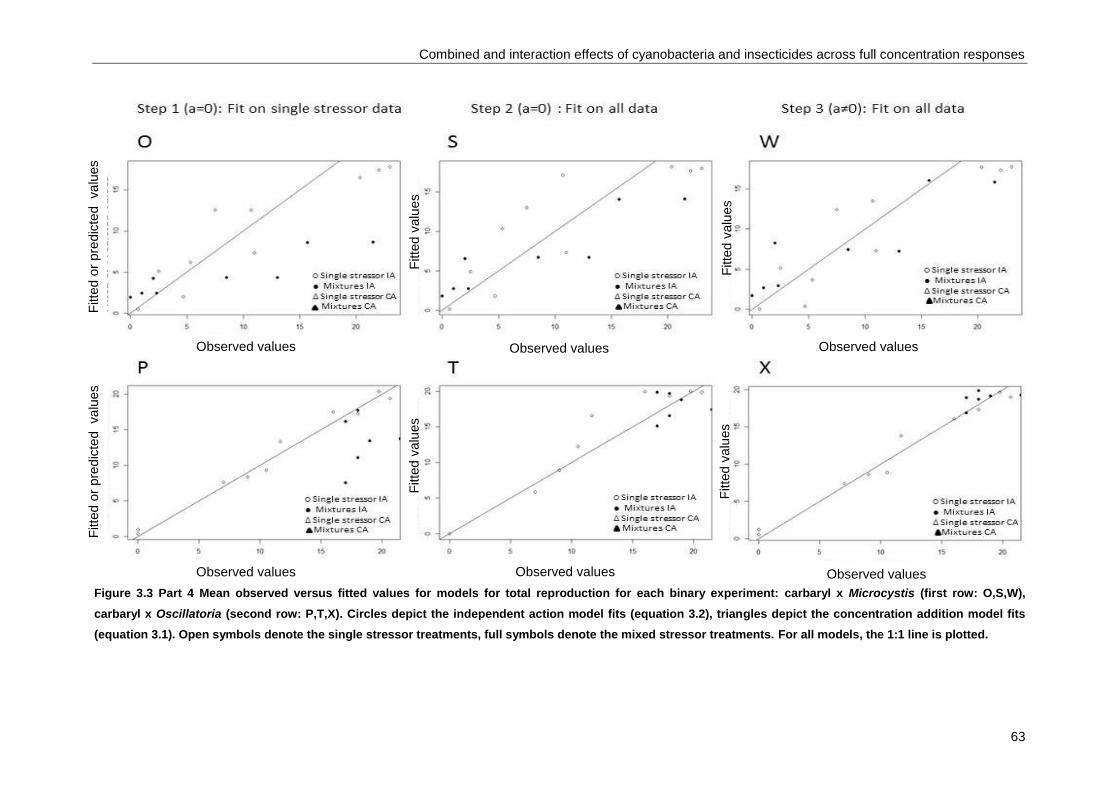
Combined and interaction effects of cyanobacteria and insecticides across full concentration responses
63
Figure 3.3 Part 4 Mean observed versus fitted values for models for total reproduction for each binary experiment: carbaryl x Microcystis (first row: O,S,W),
carbaryl x Oscillatoria (second row: P,T,X). Circles depict the independent action model fits (equation 3.2), triangles depict the concentration addition model fits
(equation 3.1). Open symbols denote the single stressor treatments, full symbols denote the mixed stressor treatments. For all models, the 1:1 line is plotted.
Observed values
Observed values Observed values
Observed values Observed values
Observed values
Fitte
d o
r pre
dic
ted
va
lues
Fitte
d o
r pre
dic
ted
va
lues
Fitte
d v
alu
es
Fitte
d v
alu
es
Fitte
d v
alu
es
Fitte
d v
alu
es
Chapter 3
64
Based on statistical comparisons between the reference model and the reference model extended with
the deviation parameter, three combinations (i.e. Microcystis combined with chlorpyrifos or tetradifon
and carbaryl combined with Cylindrospermopsis) adhered to non-interaction based on either the
concentration addition model or the independent action model (Table 3.1, Table 3.2, p-value>0.05).
This means that for these three combinations, the deviation parameter a is not significantly different
from zero, making the deviation function G (eq. 3.3) zero in both the independent action (eq. 3.2) as
well as the concentration addition model (eq. 3.1). In contrast, four other binary combinations, i.e.
Microcystis and carbaryl or tebufenpyrad and carbaryl and Aphanizomenon or Oscillatoria, resulted in
antagonistic effects on the reproduction of D. pulex based on both reference models (Table 3.1, Table
3.2, p-value<0.05). For binary combinations of fenoxycarb and Microcystis a synergistic deviation was
observed when analyzed with the independent action model (Table 3.1, Table 3.2, P-value<0.05).
Analysis with the concentration addition model for this combination concluded non-interaction (Table
3.1, Table 3.2, p-value>0.05), meaning the deviation parameter a becomes zero, resulting in the sum
of toxic units equaling 1 in eq. 3.1. The sum of squared errors (SSE) for the independent action
reference model (618.4) was slightly higher than the SSE for the concentration addition model (536.9).
However, addition of the deviation parameter to the independent action model reduced the SSE to
494.2, which is slightly lower than the SSE of the concentration addition reference model. The Aikaike
Information Criteria (AIC) were comparable between the best model based on concentration addition
(268.58) and the best model based on independent action (268.441).
Table 3.1 Estimated model parameters and their standard error: EC50 (50% effect concentration), s (slope
parameter), and a (deviation parameter to quantify mixture interaction) for each of the different steps: IA
(independent action, equation 3.2) or CA (concentration addition, equation 3.1)-model step 1 (reference
model based on data from single stressors treatments only), IA or CA-model step 2 (reference model
based on data from all treatments), IA or CA-model step 3 (reference model including the deviation
parameter a to quantify mixture interaction, equation 3.3) per cyanobacteria. The reported p value is for
the F-test that compared the nested models from step 2 and step 3. P-value <0.05 indicates a significant
deviation from the reference model (i.e. an interaction effect). EC50 of the insecticide has SI units of µg L-1
for tebufenpyrad and tetradifon and ng L-1
for chlorpyrifos and fenoxycarb.

Combined and interaction effects of cyanobacteria and insecticides across full concentration responses
65
Chlorpyrifos Fenoxycarb Tebufenpyrad Tetradifon
Slope parameter (s) Insecticide:
IA: step 1 1.52 ± 0.51 1.33 ± 0.44 2.60 ± 0.57 1.00 ± 0.25
IA: step 2 1.56 ± 0.47 1.51 ± 0.33 2.70 ± 0.52 0.93 ± 0.23
IA: step 3 2.24 ± 0.71 2.01 ± 0.43 2.25 ± 0.50 0.99 ± 0.24
CA: step 1 1.98 ± 0.30 2.26 ± 0.50 2.11 ± 0.37 1.85 ± 0.37
CA: step 2 3.06 ± 0.39 3.19 ± 0.34 2.86 ± 0.61 1.81 ± 0.27
CA: step 3 3.04 ± 0.39 3.27 ± 0.37 2.16 ± 0.38 1.75 ± 0.29
Slope parameter (s) Microcystis:
IA: step 1 2.13 ± 0.37 2.98 ± 1.02 1.55 ± 0.42 2.89 ± 0.76
IA: step 2 2.76 ± 0.46 3.44 ± 0.63 2.99 ± 0.85 2.48 ± 0.57
IA: step 3 2.96 ± 0.51 3.71 ± 0.64 1.66 ± 0.50 2.55 ± 0.63
CA: step 1 1.98 ± 0.30 2.26 ± 0.50 2.11 ± 0.37 1.85 ± 0.37
CA: step 2 3.06 ± 0.39 3.19 ± 0.34 2.86 ± 0.61 1.81 ± 0.27
CA: step 3 3.04 ± 0.39 3.27 ± 0.37 2.16 ± 0.38 1.75 ± 0.29
EC50 (Insecticide):
IA: step 1 75.53 ± 14.65 69.37 ± 10.16 10.98 ± 0.94 11.23 ± 2.00
IA: step 2 71.74 ± 13.82 57.80 ± 5.17 11.67 ± 0.81 9.18 ± 1.45
IA: step 3 66.36 ± 8.76 65.97 ± 5.03 10.35 ± 1.01 10.59 ± 1.94
CA: step 1 68.23 ± 6.69 66.09 ± 5.66 10.58 ± 1.05 12.19 ± 1.75
CA: step 2 64.23 ± 4.49 66.44 ± 3.15 13.83 ± 1.11 10.86 ± 1.28
CA: step 3 62.48 ± 4.56 65.41 ± 3.32 10.37 ± 1.03 11.55 ± 1.56
EC50 (Microcystis) (% of diet):
IA: step 1 37.61 ± 3.56 28.74 ± 3.93 55.40 ± 9.51 30.48 ± 3.13
IA: step 2 32.75 ± 1.89 25.55 ± 1.35 64.11 ± 7.41 31.51 2.83
IA: step 3 36.42 ± 2.94 29.37 ± 1.90 58.30 ± 9.96 33.17 ± 3.50
CA: step 1 37.66 ± 3.67 30.04 ± 4.59 54.62 ± 7.65 33.61 ± 5.49
CA: step 2 41.06 ± 2.34 30.76 ± 1.78 88.07 ± 12.45 32.87 ± 3.92
CA: step 3 37.97 ± 3.17 29.58 ± 2.33 57.74 ± 8.30 34.54 ± 5.27
Deviation parameter a:
IA: step 3 -1.51 ± 0.86 -2.10 ± 0.63 2.37 ± 0.88 -0.74 ± 0.67
CA: step 3 0.37 ± 0.33 0.23 ± 0.32 2.703 ± 0.64 -0.44 ± 0.64
Conclusion IA: Non-interaction Synergism Antagonism Non-interaction
P-value (IA: step 2 / IA: step 3) 0.1035 0.001584 0.03555 0.2813
Conclusion CA: Non-interaction Non-interaction Antagonism Non-interaction
P-value (CA: step 2 / CA: step 3) 0.2853 0.4851 <0.00001 0.4793

Chapter 3
66
Table 3.2 Estimated model parameters and their standard error: EC50 (50% effect concentration), s (slope
parameter), and a (deviation parameter to quantify mixture interaction) for each of the different steps: IA
(independent action, equation 3.2) or CA (concentration addition, equation 3.1)-model step 1 (reference
model based on data from single stressors treatments only), IA or CA-model step 2 (reference model
based on data from all treatments), IA or CA-model step 3 (reference model including the deviation
parameter a to quantify mixture interaction, equation 3.3) per cyanobacteria. The reported p value is for
the F-test that compared the nested models from step 2 and step 3. P-value <0.05 indicates a significant
deviation from the reference model (i.e. an interaction effect). Aph=Aphanizomenon,
Cyl=Cylindrospermopsis, MC=Microcystis, Osl=Oscillatoria.
Aph Cyl MC Osl
Slope parameter (s) Carbaryl:
IA: step 1 1.56 ± 0.63 1.01 ± 0.38 3.43 ± 1.81 2.88 ± 2.58
IA: step 2 2.07 ± 0.57 1.16 ± 0.35 3.79 ± 2.34 11.16 ± 7.69
IA: step 3 1.26 ± 0.48 0.82 ± 0.40 3.36 ± 1.98 2.58 ± 1.66
CA: step 1 1.28 ± 0.29 1.24 ± 0.29 2.77 ± 0.87 1.94 ± 0.84
CA: step 2 1.14 ± 0.26 1.05 ± 0.31 2.93 ± 0.91 2.29 ± 0.86
CA: step 3 1.32 ± 0.25 1.08 ± 0.29 3.43 ± 0.84 1.89 ± 0.67
Slope parameter (s) Cyanobacteria:
IA: step 1 1.35 ± 0.33 1.72 ± 0.60 2.09 ± 0.75 1.40 ± 1.15
IA: step 2 1.23 ± 0.34 2.24 ± 0.85 3.54 ± 1.04 2.60 ± 1.09
IA: step 3 1.26 ± 0.31 1.33 ± 0.53 3.48 ± 1.01 1.55 ± 0.72
CA: step 1 1.28 ± 0.29 1.24 ± 0.29 2.77 ± 0.87 1.94 ± 0.84
CA: step 2 1.14 ± 0.26 1.05 ± 0.31 2.93 ± 0.91 2.29 ± 0.86
CA: step 3 1.32 ± 0.25 1.08 ± 0.29 3.43 ± 0.84 1.89 ± 0.67
EC50 (Carbaryl) (µg L-1
):
IA: step 1 2.18 ± 0.64 3.52 ± 0.72 5.96 ± 0.69 2.31 ± 0.63
IA: step 2 3.52 ± 0.49 3.87 ± 0.64 6.16 ± 0.80 2.60 ± 0.13
IA: step 3 2.44 ± 0.70 3.05 ± 0.84 6.07 ± 0.80 2.29 ± 0.44
EC50 (Carbaryl) (µg L-1
):
CA: step 1 1.93 ± 0.60 3.64 ± 0.60 6.11 ± 0.83 2.25 ± 0.65
CA: step 2 3.07 ± 0.70 4.27 ± 0.74 7.04 ± 1.16 3.45 ± 0.75
CA: step 3 2.48 ± 0.54 3.36 ± 0.68 6.08 ± 0.76 2.14 ± 0.52
EC50 (Cyanobacteria) (% of diet):
IA: step 1 35.31 ± 6.23 54.87 ± 9.67 14.54 ± 2.77 59.22 ± 26.53
IA: step 2 44.51 ± 8.55 64.05 ± 10.70 21.59 ± 1.93 73.28 ± 13.29
IA: step 3 33.69 ± 6.14 62.18 ± 15.45 13.45 ± 2.24 66.69 ± 17.38
CA: step 1 38.16 ± 7.35 58.48 ± 13.35 13.70 ± 2.28 61.82 ± 15.43
CA: step 2 48.22 ± 9.94 82.70 ± 25.26 26.60 ± 3.76 97.02 ± 25.82

Combined and interaction effects of cyanobacteria and insecticides across full concentration responses
67
(Table 3.2 cont.) Aph Cyl MC Osl
CA: step 3 33. 41 ± 2.67 65.19 ± 18.80 13.25 ± 2.13 64.12 ± 13.53
Deviation parameter a:
IA-model 3 2.50 ± 0.95 1.91 ± 0.99 7.77 ± 3.76 5.49 ± 2.62
CA-model 3 2.67 ± 0.89 1.86 ± 1.09 5.31 ± 1.66 6.07 ± 3.08
Conclusion IA: Antagonism Non-interaction Antagonism Antagonism
P-value (IA: step 2 / IA: step 3) 0.0071 0.079 0.0073 0.0183
Conclusion CA: Antagonism Non-interaction Antagonism Antagonism
P-value (CA: step 2 / CA: step 3) 0.0023 0.055 <0.0001 <0.0001
3.4 Discussion
Interaction effects between chemical and natural stressors have been demonstrated for a variety of
combinations (Holmstrup et al., 2010). Here, research was focused on a specific group of stressors,
i.e. cyanobacteria and insecticides. Four out of eight combinations of cyanobacteria and insecticides
demonstrated a significant antagonistic interaction on the reproduction of Daphnia pulex, i.e. the
reproduction upon exposure to these combinations was higher than expected based upon the
reproduction upon exposure to the stressors alone. Three combinations demonstrated no interaction
effects at all whereas a single combination demonstrated no interaction effects with the concentration
addition model and a significant synergistic interaction with the independent action model.
Different interaction effects were observed for insecticides with different modes of action.
Combinations of chlorpyrifos and Microcystis affected reproduction of Daphnia differently than
combinations of carbaryl and Microcystis. This suggests that even for insecticides that target the same
enzyme (i.e. acetylcholine esterase), the observation of interaction or non-interaction effects cannot be
extrapolated from one insecticide to another. However, inhibition of acetylcholine esterase by
organophosphates such as chlorpyrifos is less reversible and hence longer-lasting than inhibition of
acetylcholine esterase by carbamates (Pope et al., 2005). This difference in recovery time may be a
potential explanation for the shift in combined effects with cyanobacteria from antagonistic interaction
with carbaryl (a carbamate) to non-interaction with chlorpyrifos (an organophosphate). Alternatively,
choline esterase inhibitors have been shown to target other molecules than acetylcholine esterase
(Pope et al., 2005). Differences in the ability to target other molecules could also be a potential

Chapter 3
68
explanation for the differences in interaction effects observed for carbaryl and chlorpyrifos. Likewise,
differences in metabolic activation and degradation between organophosphates and carbamates
(Fukuto, 1990) may also be a potential cause for the difference in interaction pattern with Microcystis.
Furthermore, the antagonistic interaction between Microcystis and carbaryl contrasts with previous
results of Cerbin et al. (2010), who observed a synergistic pattern. However, the study of Cerbin et al.
(2010) and the present study differ in length of exposure period as well as endpoint. Cerbin et al.
(2010) exposed animals only until the first clutch, whereas the present study used a continuous
exposure of 21 days. In addition, the endpoints observed were different and different Daphnia clones
were used in the two studies, which may have differed in sensitivities toward the stressors used. This
has already been demonstrated for Microcystis stress (Hietala et al., 1995).
Likewise, tebufenpyrad and tetradifon, both are targeting the oxidative phosphorylation albeit through
different molecular mechanisms, demonstrated different interaction effects with Microcystis.
Combinations with tebufenpyrad were antagonistic whereas combinations with tetradifon were
adhering to non-interaction. Tetradifon inhibits ATP-synthases while tebufenpyrad inhibits
NADH:ubiquinone reductase activity in complex I of the mitochondrial respiration (IRAC, 2009; Sherer
et al., 2006). Again, subtle differences in the molecular target between two insecticides lead to vastly
different conclusions in terms of combined and interaction effects.
These observations, i.e. different interaction effects for insecticides with closely related molecular
targets (e.g. carbaryl – chlorpyrifos, tetradifon – tebufenpyrad) when combined with the same stressor
(here: Microcystis) in a binary mixture, suggest a potential mechanistic basis for interaction effects that
may well be detectable at the molecular level. However, the differences in molecular mechanisms take
place at the macro-molecular level and may not be distinguishable at the pathway level (e.g. tetradifon
and tebufenpyrad both affect the oxidative phosphorylation).
Furthermore, two very different pesticide, carbaryl and tebufenpyrad (Table 1.4), demonstrated similar
antagonistic interaction effects when combined with Microcystis. At present, it is still unclear to what
extent the antagonistic effects caused by these two combinations are similar. Indeed, these
insecticides have little in common in terms of molecular targets (IRAC, 2009) yet they do seem to
affect biological processes that are also affected by Microcystis. A recent study by Jansen et al. (2013)
indicated a significant effect of carbaryl on NADH:ubiquinone reductase after exposing Daphnia
Combined and interaction effects of cyanobacteria and insecticides across full concentration responses
69
magna for 96 hours to 5.6 µg/L of carbaryl. These findings do indicate that the occurrence of
antagonistic interaction effects with Microcystis for both tebufenpyrad and carbaryl could be potentially
caused by interactions with NADH:ubiquinone reductase.
Three out of four cyanobacteria acted antagonistically when combined with carbaryl. The fourth
cyanobacteria, Cylindrospermopsis, did not interact with carbaryl although the p-value bordered on the
5% significance level and the a-value was positive. Overall, different cyanobacteria act quite similar to
one another when combined with carbaryl. This is in line with the results obtained in chapter 2 (section
2.3) where no significant differences between the effects of different cyanobacteria on Daphnia were
observed across the full dose response curve. Although carbaryl can cause oxidative stress and cell
lysis in cyanobacteria, the potential effect of carbaryl on the cyanobacteria itself can be excluded.
Indeed, the concentrations needed to elicit such a response are a factor 1000 higher than the
concentrations used in the present study (Habib et al., 2011). The targeted mode of action of carbaryl
is the inhibition of the enzyme acetylcholineesterase. Effects on NADH:ubiquinone reductase have
also been reported in Daphnia (Jansen et al., 2013), yet no literature is available on the effects of
cyanobacteria other than Microcystis on NADH:ubiquinone reductase. A study by Lethonen et al.
(2003) demonstrated potential effects of nodularin, a cyanobacterial toxin, on the
acetylcholineesterase enzyme activity in the clam Macoma balthica, which is also the main
mechanism of toxicity of carbaryl. Potential antagonistic effects might also be the result of a similar
biotransformation or detoxification process for both stressors. Indeed, cyanotoxins are primarily
biotransformed through glutathione-S-transferase and cytochrome P450 (Wiegand and Pflugmacher,
2005). Furthermore, induction of glutathione-S-transferase activity as well as cytochrome 1A has been
observed in Oncorhynchus mykiss exposed to carbaryl (Ferrari et al., 2007). Hence, molecular and
biochemical research is needed to fully understand the mechanisms leading to these antagonistic
interactions.
For the combination of Microcystis and fenoxycarb, different statistical conclusions were drawn with
the two different reference models (Table 3.2). Such differences have been reported in literature and
attributed to among others the different mathematical background of the reference models (Dresher
and Boedeker, 1995; Jonker et al., 2005). Indeed, independent action hypothesizes that the probability
of response to one stressor is independent from the probability of response to the other stressor
(Jonker et al., 2009). In contrast, concentration addition hypothesizes that the relative toxicity of the

Chapter 3
70
combined stressors is the same as the relative toxicity of the individual stressors (Jonker et al., 2009).
Furthermore, this specific binary combination further confirms the general agreement in literature that
the concentration addition reference model provides more conservative estimates of mixture toxicity
for risk assessment than independent action reference model (Altenburger et al., 1996; Faust and
Schlolze, 2004). However, like Cedergreen et al. (2008), these findings and recommendations are not
based on a greater accuracy of concentration addition compared to independent action. Therefore,
from a mechanistic point of view, the current data and subsequent analysis cannot fully exclude or
confirm synergistic interactions between fenoxycarb, a juvenile hormone analog, and Microcystis as
there is too little knowledge about how biological pathways are affected by these two stressors other
than the primary molecular targets. At present, the two reference models, CA and IA, are sometimes
compared by determining whether the data falls into the 95% confidence interval from one model
rather than the other (Dias da Silva et al., 2013). However, when both model fits are similar (as is the
case for this combination, Fig. 3.2 F and J) and their parameter values overlap (Table 3.1), again no
conclusion can be made to select one model above the other. Requirements of accuracy are the
primordial driver for pharmacokinetic studies or mechanistic studies, especially in human toxicology.
Indeed, in those studies, the aim is to find the most accurate model for a given mixture. Based on the
data in this study, both models are equally valid for these types of studies and one model cannot be
selected above the other based on accuracy. The development of AOPs for different compounds may
aid in model selection in the future as the similar or dissimilar mode of action at the molecular and
even at the organismal level will become clearer and comparison will be more straightforward.
For risk assessment, however, the requirements of adequate protection of the aquatic ecosystems are
more important than the requirement for an accurate mechanistic model. Overall, concentration
addition always provided effect predictions that are conservative from a risk assessment point of view
compared to the observed effects, i.e. the predicted effects are always as large as or larger than the
observed effects. As a consequence, the protection of the ecosystem has a high probability of success
with a conservative model such as the concentration addition model. Hence, risk assessment of
combined and interaction effects for combinations of insecticides and cyanobacteria based on
concentration addition model predictions will likely result in a sufficient protection of the aquatic
ecosystem. Such an assessment will be necessary in the future when climate change conditions will

Combined and interaction effects of cyanobacteria and insecticides across full concentration responses
71
stimulate cyanobacterial blooms and as consequence combined exposure to cyanobacteria and
insecticides (Moe et al., 2012; Paerl and Huisman, 2009).
Overall, these results clearly demonstrate the importance of combined and interaction effects in
aquatic ecosystems. This has important implications for current regulatory risk assessment that mainly
focuses on single substances. Based on the results of the present study, the concentration addition
model can serve as a protective scenario in risk assessment of insecticides and cyanobacteria at
sublethal effect levels for the observed endpoint reproduction.
3.5 Conclusion
Insecticides with different molecular targets showed different interaction patterns when combined with
Microcystis on the reproduction of Daphnia pulex. In contrast, different cyanobacteria showed similar
interaction patterns when combined with carbaryl on the reproduction of Daphnia pulex. Four out of
eight combinations showed antagonistic deviation patterns, three showed no interaction patterns
whereas one yielded different patterns depending on the reference models used.
These results demonstrated that interaction effects cannot be generalized for insecticides targeting the
same pathway and even for insecticides targeting the same enzyme. In contrast, results may
potentially be generalized across different cyanobacteria combined with the same insecticide. Yet,
further mechanistic research is needed.
Overall, concentration addition provided more conservative predictions of effects than independent
action. Furthermore, these effect predictions were always conservative compared to the observed
effects which suggest using the concentration addition model to ensure an adequate protection of the
aquatic ecosystem.

Chapter 4
Combined effects of cyanobacteria
and insecticides across a large set of
combinations
4

Combined effects of cyanobacteria and insecticides across a large set of combinations.
75
4.1 Introduction
The impact of interaction effects between natural and chemical stressors and cyanobacteria and
insecticides in particular, has been amply discussed in chapter 1 (sections 1.1, 1.2.4 and 1.5.2).
Chapter 3 further focused on this topic by addressing the combined effects of a selection of
cyanobacteria combined with carbaryl and a selection of insecticides combined with Microcystis.
Although new and important conclusions could be made, the question remains to what extent the
results can be extrapolated across a wider set of insecticides and cyanobacteria.
Here, the dataset will be expanded to cover a wide variety of cyanobacteria and insecticides (section
1.5) in 48 binary combinations. By assessing combined effects across a large dataset, patterns of
mixture toxicity will become clearer and it may be possible to infer hypotheses based upon a priori
mechanistic knowledge regarding the mechanisms of toxicity of the different stressors. For example,
based on the results of chapters 2 and 3, different cyanobacteria affect Daphnia in a similar manner
and therefore interaction effects could be potentially extrapolated from one cyanobacterium to another.
In contrast, insecticides often have different modes of action and the results from chapter 3 indicated
that effects cannot be straightforwardly extrapolated from one insecticide to another. Furthermore, a
large dataset will allow for more powerful conclusions with regards to a potential generalization or
extrapolation of combined and interaction effects to other stressors which may form a scientific basis
for risk assessment frameworks as well as enhance our understanding of how organisms responds to
combinations of stressors.
4.2 Materials and methods
4.2.1 Experimental organisms and cyanobacteria
The experimental organisms originated from D. pulex cultures as described in section 2.2.1. Likewise,
cyanobacteria culture conditions were also described in section 2.2.1.
4.2.2 Experimental design
All exposures were conducted inside a climate controlled room at a constant temperature (20 ± 1°C)
and photoperiod (16:8h light-dark). The experimental design is depicted in Fig. 4.1. Insecticide and
mixture treatments consisted of five replicate beakers. For control and cyanobacterial treatments, this
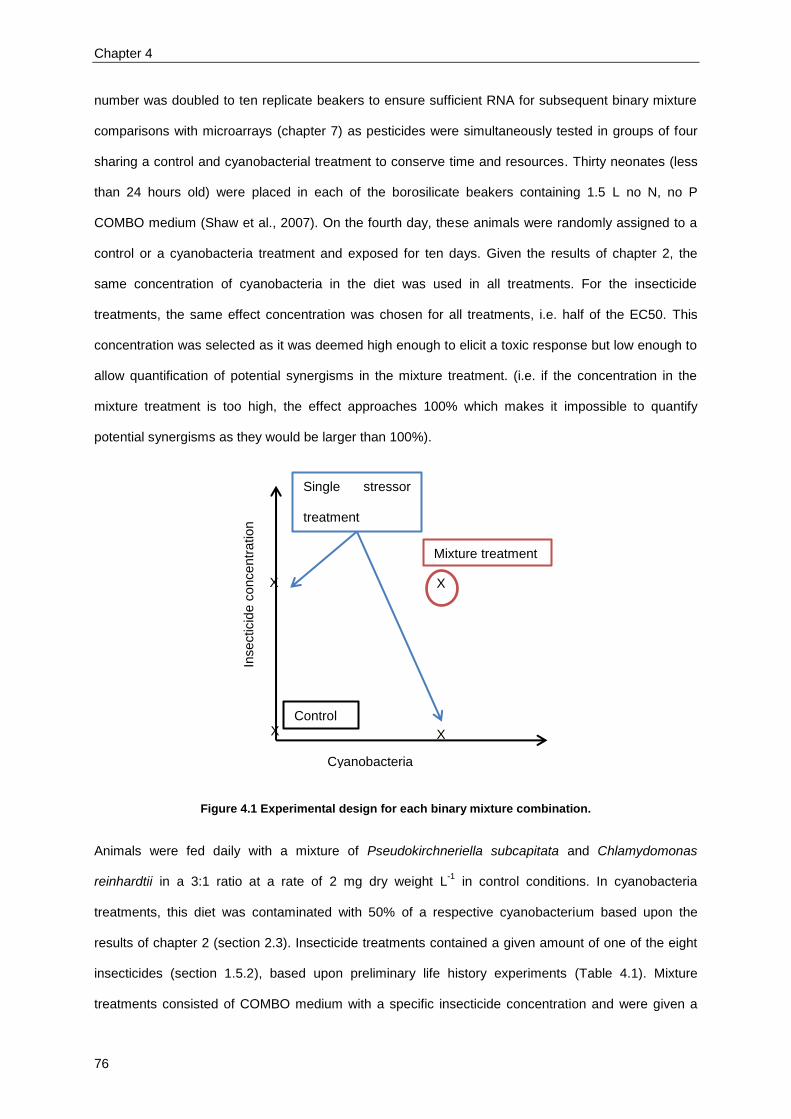
Chapter 4
76
number was doubled to ten replicate beakers to ensure sufficient RNA for subsequent binary mixture
comparisons with microarrays (chapter 7) as pesticides were simultaneously tested in groups of four
sharing a control and cyanobacterial treatment to conserve time and resources. Thirty neonates (less
than 24 hours old) were placed in each of the borosilicate beakers containing 1.5 L no N, no P
COMBO medium (Shaw et al., 2007). On the fourth day, these animals were randomly assigned to a
control or a cyanobacteria treatment and exposed for ten days. Given the results of chapter 2, the
same concentration of cyanobacteria in the diet was used in all treatments. For the insecticide
treatments, the same effect concentration was chosen for all treatments, i.e. half of the EC50. This
concentration was selected as it was deemed high enough to elicit a toxic response but low enough to
allow quantification of potential synergisms in the mixture treatment. (i.e. if the concentration in the
mixture treatment is too high, the effect approaches 100% which makes it impossible to quantify
potential synergisms as they would be larger than 100%).
Figure 4.1 Experimental design for each binary mixture combination.
Animals were fed daily with a mixture of Pseudokirchneriella subcapitata and Chlamydomonas
reinhardtii in a 3:1 ratio at a rate of 2 mg dry weight L-1
in control conditions. In cyanobacteria
treatments, this diet was contaminated with 50% of a respective cyanobacterium based upon the
results of chapter 2 (section 2.3). Insecticide treatments contained a given amount of one of the eight
insecticides (section 1.5.2), based upon preliminary life history experiments (Table 4.1). Mixture
treatments consisted of COMBO medium with a specific insecticide concentration and were given a
X X
X X
Cyanobacteria
Insecticid
e c
once
ntr
ation
Single stressor
treatment
Mixture treatment
Control

Combined effects of cyanobacteria and insecticides across a large set of combinations.
77
diet contaminated with 50% of a respective cyanobacterium. For all treatments, medium was renewed
every two days. At the same time, reproduction and survival were monitored. If the animals
reproduced, neonates were counted and removed from the beaker. At the end of the experiment, RNA
was extracted from adult exposed animals for gene expression analysis at the end of the experiment.
Results of gene expression analysis will be discussed in chapter 7.
Table 4.1 The observed effect concentration for total reproduction (EC50) from preliminary life history
experiments per insecticide and the final concentration of insecticide used in both insecticide and
mixture treatments.
Insecticide Observed EC50 Final Concentration Measured Concentration
Acetamiprid 30.34 µg/L 15 µg/L 17.26 ± µg/L
Carbaryl 0.50 µg/L 0.25 µg/L 0.16 ± 0.03 µg/L
Chlorpyrifos 31.33 ng/L 16 ng/L 21.12 ± ng/L
Deltamethrin 0.45 ng/L 0.23 ng/L NA
Endosulfan 1.00 µg/L 0.5 µg/L 2.06 ± µg/L
Fenoxycarb 2.00 ng/L 1 ng/L NA
Tebufenpyrad 6.06 µg/L 3 µg/L 3.12 ± 0.91 µg/L
Tetradifon 8.09 µg/L 4 µg/L 3.91 ± 0.81 µg/L
Samples for concentration analysis of insecticides were taken with every medium renewal of both old
and new media. At the same time, pH was measured for all treatments to ensure that pH never
differed more than 0.2 units from control treatments (pH=7.00± 0.2).
4.2.3 Statistical analysis
Total reproduction per replicate beaker was analyzed for all replicates. Significant differences between
treatments were analyzed by comparing the reproduction relative to control reproduction across
treatments. As data was not normally distributed, Kruskal Wallis Rank sum test (Hollander and Wolf,
1973) was used to compare reproduction across all treatments. Subsequent pairwise comparisons
were executed with a Mann-Whitney U-test (Bauer, 1972). Analysis of variance with two factors was
performed to determine interaction effects for each binary combination of cyanobacteria and
insecticides on the log transformed total reproduction. Log transformation of the data is essential to
test the hypothesis of independent action through an analysis of variance as described in De Coninck
et al. (2013a). Assumptions of normality and homoscedasticity were verified on the log transformed
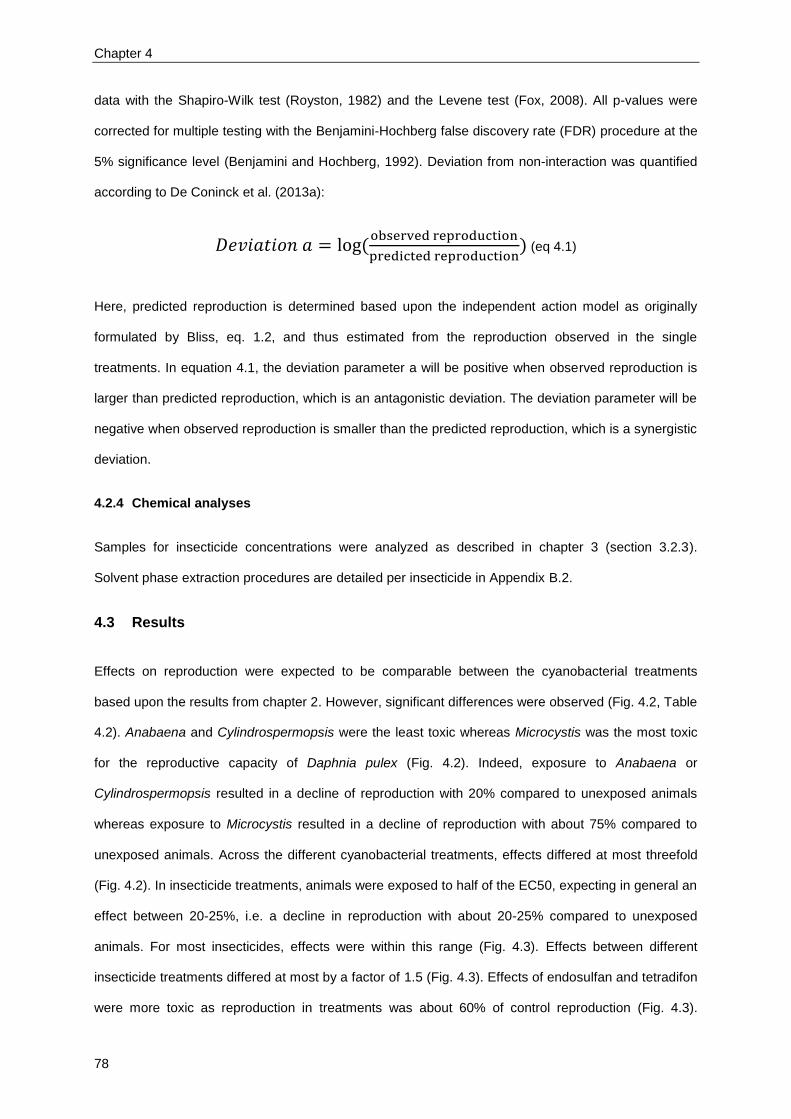
Chapter 4
78
data with the Shapiro-Wilk test (Royston, 1982) and the Levene test (Fox, 2008). All p-values were
corrected for multiple testing with the Benjamini-Hochberg false discovery rate (FDR) procedure at the
5% significance level (Benjamini and Hochberg, 1992). Deviation from non-interaction was quantified
according to De Coninck et al. (2013a):
(
) (eq 4.1)
Here, predicted reproduction is determined based upon the independent action model as originally
formulated by Bliss, eq. 1.2, and thus estimated from the reproduction observed in the single
treatments. In equation 4.1, the deviation parameter a will be positive when observed reproduction is
larger than predicted reproduction, which is an antagonistic deviation. The deviation parameter will be
negative when observed reproduction is smaller than the predicted reproduction, which is a synergistic
deviation.
4.2.4 Chemical analyses
Samples for insecticide concentrations were analyzed as described in chapter 3 (section 3.2.3).
Solvent phase extraction procedures are detailed per insecticide in Appendix B.2.
4.3 Results
Effects on reproduction were expected to be comparable between the cyanobacterial treatments
based upon the results from chapter 2. However, significant differences were observed (Fig. 4.2, Table
4.2). Anabaena and Cylindrospermopsis were the least toxic whereas Microcystis was the most toxic
for the reproductive capacity of Daphnia pulex (Fig. 4.2). Indeed, exposure to Anabaena or
Cylindrospermopsis resulted in a decline of reproduction with 20% compared to unexposed animals
whereas exposure to Microcystis resulted in a decline of reproduction with about 75% compared to
unexposed animals. Across the different cyanobacterial treatments, effects differed at most threefold
(Fig. 4.2). In insecticide treatments, animals were exposed to half of the EC50, expecting in general an
effect between 20-25%, i.e. a decline in reproduction with about 20-25% compared to unexposed
animals. For most insecticides, effects were within this range (Fig. 4.3). Effects between different
insecticide treatments differed at most by a factor of 1.5 (Fig. 4.3). Effects of endosulfan and tetradifon
were more toxic as reproduction in treatments was about 60% of control reproduction (Fig. 4.3).
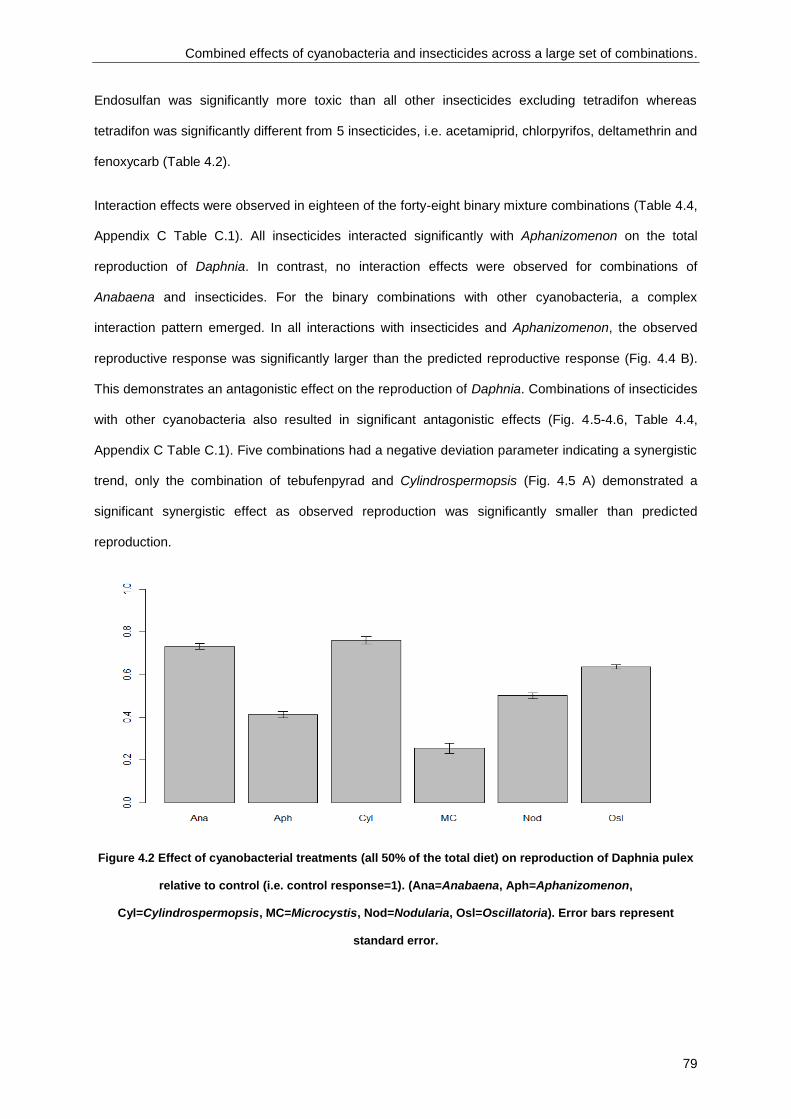
Combined effects of cyanobacteria and insecticides across a large set of combinations.
79
Endosulfan was significantly more toxic than all other insecticides excluding tetradifon whereas
tetradifon was significantly different from 5 insecticides, i.e. acetamiprid, chlorpyrifos, deltamethrin and
fenoxycarb (Table 4.2).
Interaction effects were observed in eighteen of the forty-eight binary mixture combinations (Table 4.4,
Appendix C Table C.1). All insecticides interacted significantly with Aphanizomenon on the total
reproduction of Daphnia. In contrast, no interaction effects were observed for combinations of
Anabaena and insecticides. For the binary combinations with other cyanobacteria, a complex
interaction pattern emerged. In all interactions with insecticides and Aphanizomenon, the observed
reproductive response was significantly larger than the predicted reproductive response (Fig. 4.4 B).
This demonstrates an antagonistic effect on the reproduction of Daphnia. Combinations of insecticides
with other cyanobacteria also resulted in significant antagonistic effects (Fig. 4.5-4.6, Table 4.4,
Appendix C Table C.1). Five combinations had a negative deviation parameter indicating a synergistic
trend, only the combination of tebufenpyrad and Cylindrospermopsis (Fig. 4.5 A) demonstrated a
significant synergistic effect as observed reproduction was significantly smaller than predicted
reproduction.
Figure 4.2 Effect of cyanobacterial treatments (all 50% of the total diet) on reproduction of Daphnia pulex
relative to control (i.e. control response=1). (Ana=Anabaena, Aph=Aphanizomenon,
Cyl=Cylindrospermopsis, MC=Microcystis, Nod=Nodularia, Osl=Oscillatoria). Error bars represent
standard error.
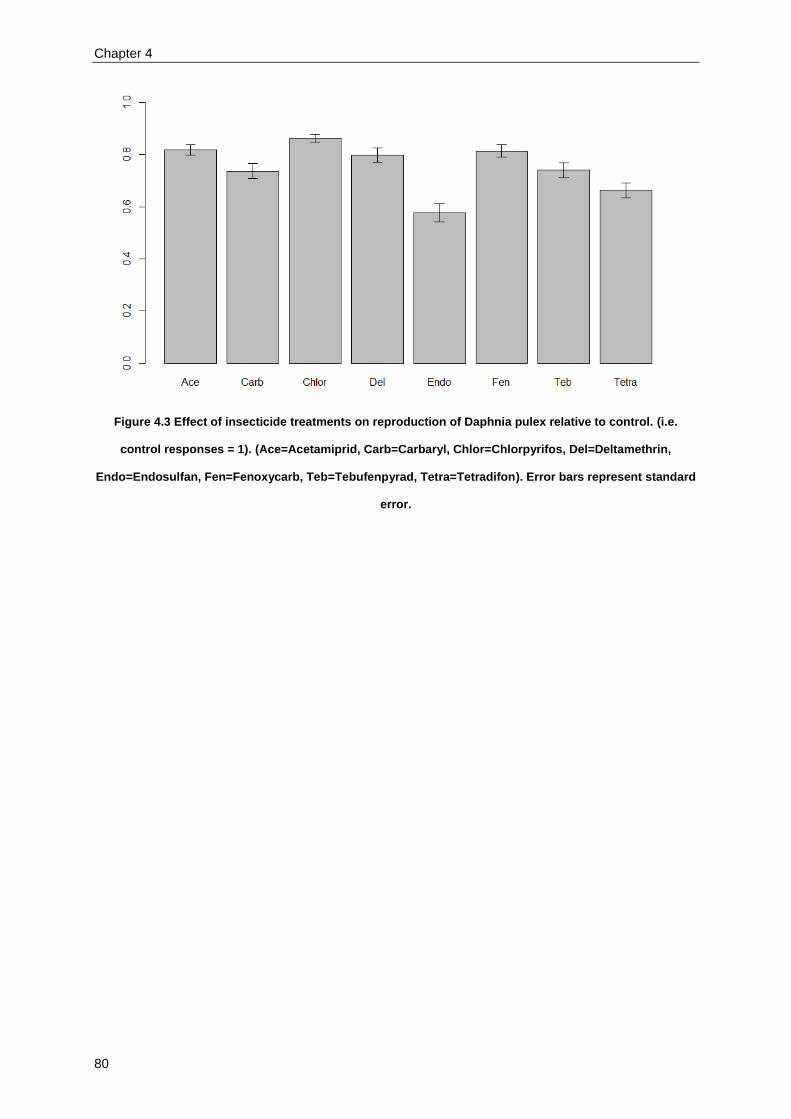
Chapter 4
80
Figure 4.3 Effect of insecticide treatments on reproduction of Daphnia pulex relative to control. (i.e.
control responses = 1). (Ace=Acetamiprid, Carb=Carbaryl, Chlor=Chlorpyrifos, Del=Deltamethrin,
Endo=Endosulfan, Fen=Fenoxycarb, Teb=Tebufenpyrad, Tetra=Tetradifon). Error bars represent standard
error.
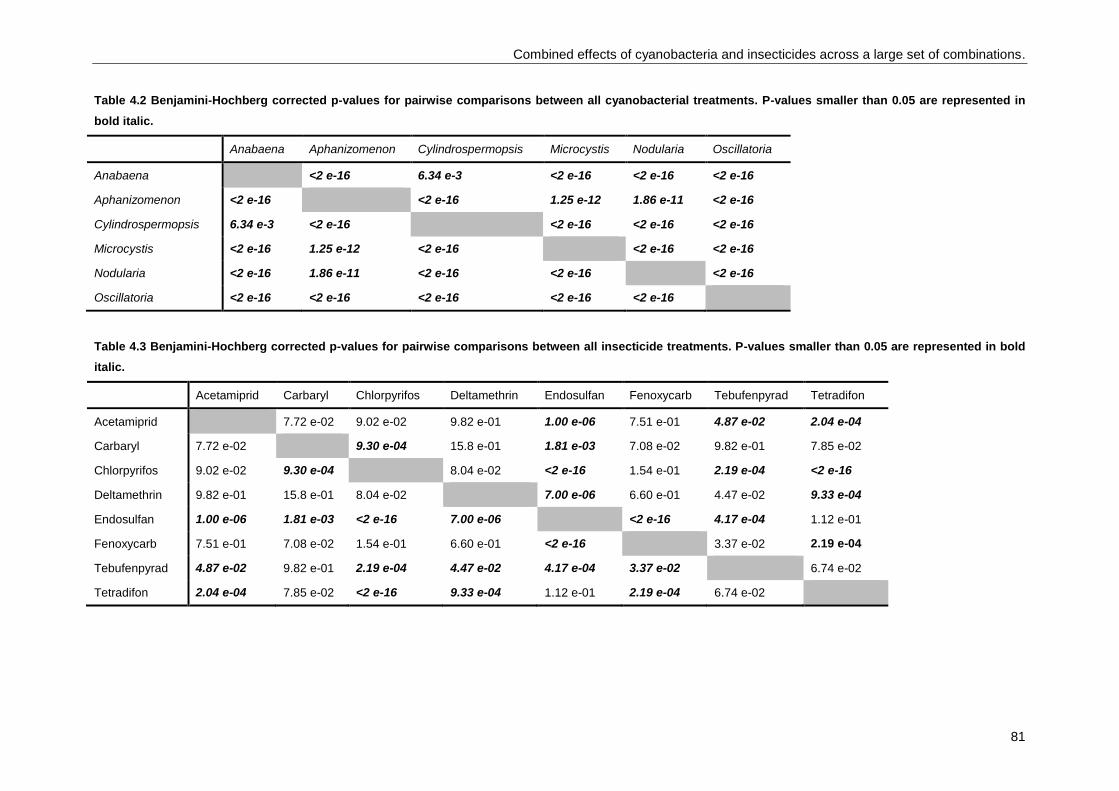
Combined effects of cyanobacteria and insecticides across a large set of combinations.
81
Table 4.2 Benjamini-Hochberg corrected p-values for pairwise comparisons between all cyanobacterial treatments. P-values smaller than 0.05 are represented in
bold italic.
Anabaena Aphanizomenon Cylindrospermopsis Microcystis Nodularia Oscillatoria
Anabaena <2 e-16 6.34 e-3 <2 e-16 <2 e-16 <2 e-16
Aphanizomenon <2 e-16 <2 e-16 1.25 e-12 1.86 e-11 <2 e-16
Cylindrospermopsis 6.34 e-3 <2 e-16 <2 e-16 <2 e-16 <2 e-16
Microcystis <2 e-16 1.25 e-12 <2 e-16 <2 e-16 <2 e-16
Nodularia <2 e-16 1.86 e-11 <2 e-16 <2 e-16 <2 e-16
Oscillatoria <2 e-16 <2 e-16 <2 e-16 <2 e-16 <2 e-16
Table 4.3 Benjamini-Hochberg corrected p-values for pairwise comparisons between all insecticide treatments. P-values smaller than 0.05 are represented in bold
italic.
Acetamiprid Carbaryl Chlorpyrifos Deltamethrin Endosulfan Fenoxycarb Tebufenpyrad Tetradifon
Acetamiprid 7.72 e-02 9.02 e-02 9.82 e-01 1.00 e-06 7.51 e-01 4.87 e-02 2.04 e-04
Carbaryl 7.72 e-02 9.30 e-04 15.8 e-01 1.81 e-03 7.08 e-02 9.82 e-01 7.85 e-02
Chlorpyrifos 9.02 e-02 9.30 e-04 8.04 e-02 <2 e-16 1.54 e-01 2.19 e-04 <2 e-16
Deltamethrin 9.82 e-01 15.8 e-01 8.04 e-02 7.00 e-06 6.60 e-01 4.47 e-02 9.33 e-04
Endosulfan 1.00 e-06 1.81 e-03 <2 e-16 7.00 e-06 <2 e-16 4.17 e-04 1.12 e-01
Fenoxycarb 7.51 e-01 7.08 e-02 1.54 e-01 6.60 e-01 <2 e-16 3.37 e-02 2.19 e-04
Tebufenpyrad 4.87 e-02 9.82 e-01 2.19 e-04 4.47 e-02 4.17 e-04 3.37 e-02 6.74 e-02
Tetradifon 2.04 e-04 7.85 e-02 <2 e-16 9.33 e-04 1.12 e-01 2.19 e-04 6.74 e-02
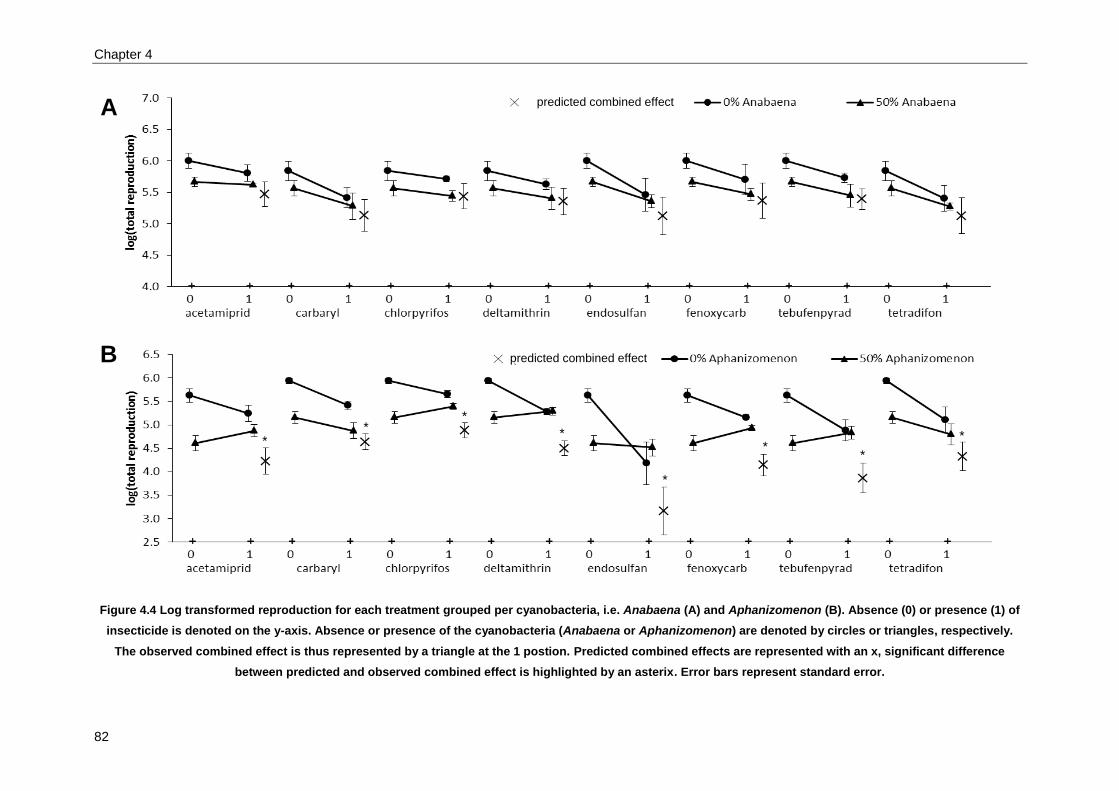
Chapter 4
82
Figure 4.4 Log transformed reproduction for each treatment grouped per cyanobacteria, i.e. Anabaena (A) and Aphanizomenon (B). Absence (0) or presence (1) of
insecticide is denoted on the y-axis. Absence or presence of the cyanobacteria (Anabaena or Aphanizomenon) are denoted by circles or triangles, respectively.
The observed combined effect is thus represented by a triangle at the 1 postion. Predicted combined effects are represented with an x, significant difference
between predicted and observed combined effect is highlighted by an asterix. Error bars represent standard error.
* *
*
*
*
* *
*
predicted combined effect
predicted combined effect
A
B

Combined effects of cyanobacteria and insecticides across a large set of combinations.
83
Figure 4.5 Log transformed reproduction for each treatment grouped per cyanobacteria, i.e. Cylindrospermopsis (A) and Microcystis (B). Absence (0) or (1)
presence of insecticide is denoted on the y-axis. Absence or presence of the cyanobacteria (Cylindrospermopsis or Microcystis) are denoted by circles or
triangles, respectively. The observed combined effect is thus represented by a triangle at the 1 postion. Predicted combined effects are represented with an x,
significant difference between predicted and observed combined effect is highlighted by an asterix. Error bars represent standard error.
*
*
*
*
*
predicted combined effect
predicted combined effect
A
B

Chapter 4
84
Figure 4.6 Log transformed reproduction for each treatment grouped per cyanobacteria, i.e. Nodularia (A) and Oscillatoria (B). Absence (0) or presence (1) of
insecticide is denoted on the y-axis. Absence or presence of the cyanobacteria (Nodularia or Oscillatoria) are denoted by circles or triangles, respectively. The
observed combined effect is thus represented by a triangle at the 1 postion. Predicted combined effects are represented with an x, significant difference between
predicted and observed combined effect is highlighted by an asterix. Error bars represent standard error.
*
*
*
*
predicted combined effect
predicted combined effect A
B
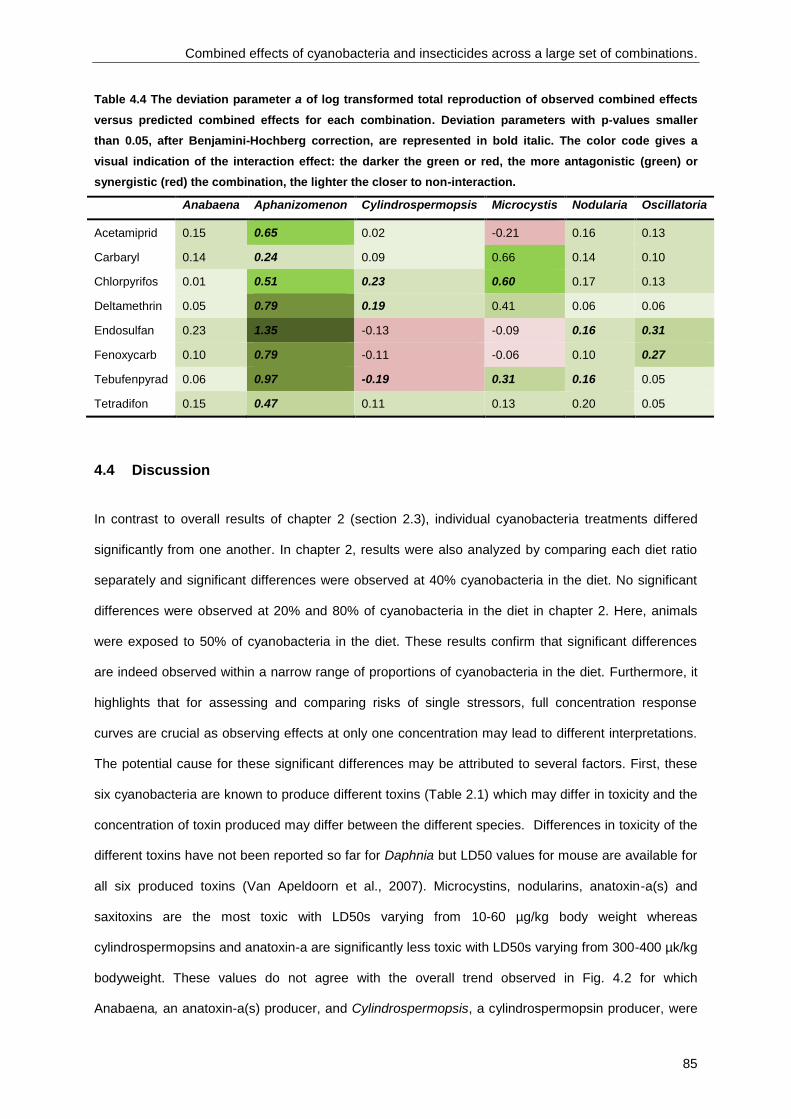
Combined effects of cyanobacteria and insecticides across a large set of combinations.
85
Table 4.4 The deviation parameter a of log transformed total reproduction of observed combined effects
versus predicted combined effects for each combination. Deviation parameters with p-values smaller
than 0.05, after Benjamini-Hochberg correction, are represented in bold italic. The color code gives a
visual indication of the interaction effect: the darker the green or red, the more antagonistic (green) or
synergistic (red) the combination, the lighter the closer to non-interaction.
Anabaena Aphanizomenon Cylindrospermopsis Microcystis Nodularia Oscillatoria
Acetamiprid 0.15 0.65 0.02 -0.21 0.16 0.13
Carbaryl 0.14 0.24 0.09 0.66 0.14 0.10
Chlorpyrifos 0.01 0.51 0.23 0.60 0.17 0.13
Deltamethrin 0.05 0.79 0.19 0.41 0.06 0.06
Endosulfan 0.23 1.35 -0.13 -0.09 0.16 0.31
Fenoxycarb 0.10 0.79 -0.11 -0.06 0.10 0.27
Tebufenpyrad 0.06 0.97 -0.19 0.31 0.16 0.05
Tetradifon 0.15 0.47 0.11 0.13 0.20 0.05
4.4 Discussion
In contrast to overall results of chapter 2 (section 2.3), individual cyanobacteria treatments differed
significantly from one another. In chapter 2, results were also analyzed by comparing each diet ratio
separately and significant differences were observed at 40% cyanobacteria in the diet. No significant
differences were observed at 20% and 80% of cyanobacteria in the diet in chapter 2. Here, animals
were exposed to 50% of cyanobacteria in the diet. These results confirm that significant differences
are indeed observed within a narrow range of proportions of cyanobacteria in the diet. Furthermore, it
highlights that for assessing and comparing risks of single stressors, full concentration response
curves are crucial as observing effects at only one concentration may lead to different interpretations.
The potential cause for these significant differences may be attributed to several factors. First, these
six cyanobacteria are known to produce different toxins (Table 2.1) which may differ in toxicity and the
concentration of toxin produced may differ between the different species. Differences in toxicity of the
different toxins have not been reported so far for Daphnia but LD50 values for mouse are available for
all six produced toxins (Van Apeldoorn et al., 2007). Microcystins, nodularins, anatoxin-a(s) and
saxitoxins are the most toxic with LD50s varying from 10-60 µg/kg body weight whereas
cylindrospermopsins and anatoxin-a are significantly less toxic with LD50s varying from 300-400 µk/kg
bodyweight. These values do not agree with the overall trend observed in Fig. 4.2 for which
Anabaena, an anatoxin-a(s) producer, and Cylindrospermopsis, a cylindrospermopsin producer, were

Chapter 4
86
the least toxic to the Daphnia. Although sensitivity can be rarely extrapolated in a straightforward
manner from mouse to Daphnia, it does suggest that toxins do not primarily drive these differences,
which is in agreement with literature (Wilson et al., 2006). Second, these cyanobacteria differ in their
morphology (Table 1.3. Fig. 1.7) which may lead to different biological effects on the exposed
Daphnia. Again, the different morphologous classes from Table 1.3 do not overlap with the differences
observed in Fig. 4.2. Third, their PUFA content also differs (Fig. 2.3). Again, similar conclusions can be
drawn as for the other two factors, no clear overlap between the PUFA content and the effect on
reproduction can be observed.
Differences in effect between the different insecticide treatments were also observed but could be
attributed to the nonlinear slope of the concentration response curve resulting in potential different
effects at half of the EC50 concentration. In addition, slight differences in nominal and measured
concentration may also account for the differences (Table 4.1). Furthermore, this has no influence on
the interaction effects given that interaction effects are estimated by comparing the response to the
insecticide alone with the response of the mixture alone without relation to the original EC50/2
estimate or any other insecticide.
Conclusions related to combined and interaction effects were similar for four of the eight combinations
previously tested in life history experiments (section 3.3). Indeed, mixtures of Aphanizomenon and
carbaryl and mixtures of Microcystis and tebufenpyrad were antagonistic in both experiments. For
combinations of Microcystis and tetradifon and Cylindrospermopsis and carbaryl, no interaction effects
could be detected in the two experiments.
Combinations of Microcystis and carbaryl were significantly antagonistic in previous life history
experiments. Here, this antagonistic deviation could not be statistically confirmed although the p-value
was close to the significance level (i.e. 0.05). This discrepancy may be in part attributed to a strong
multiple testing correction as the p-value was significant prior to this correction.
For the three other combinations effects differed between the life history experiments and these
exposures. First, combinations of chlorpyrifos and Microcystis showed an antagonistic deviation not
detectable during the life history experiments where no interaction effects were observed. Second,
combinations of fenoxycarb and Microcystis were synergistic in the 21 day life-history experiments, but
this synergism was not observed in these exposures. Although for this combination, synergism was
Combined effects of cyanobacteria and insecticides across a large set of combinations.
87
only observed with the independent action model and not with the concentration addition model
(section 3.3). Last, combinations of Oscillatoria and carbaryl showed an antagonistic deviation in the
21 day life-history experiments which was not observed in this chapter.
These differences between the previous chapter and the current chapter could in part be attributed to
experimental design and analysis: exposure duration, exposure concentration and statistical analysis.
Differences in response at different exposure times and endpoints have been already demonstrated
by Alda et al. (2006) for a fungicide and a chlorinated aromatic hydrocarbon and by Jager et al. (2006)
for cadmium. Differences in mixture effects due to exposure time have already been discussed by
Baas et al. (2007) and Van Gestel and Hensbergen (1997). However, the data from chapter 3 were re-
analyzed in the exact same manner but only including reproduction up and until day 14. This analysis
did not result in different conclusions compared to the analysis after 21 days (Appendix C Tables C.2-
C.3, Tables 3.1-3.2). Again, these results suggest other factors than exposure time influencing these
differences. Regardless of the cause, it indicates that the toxicity of a mixture is a complex process
dependent upon a variety of factors but seems to remain consistent over the duration of the exposure.
As a consequence, generalization across concentrations of combined and interaction effects at the life
history level seems difficult.
In chapter 3, similar interaction effects were observed for different cyanobacteria combined with the
same insecticide and different interaction effects for different insecticides combined with the same
cyanobacteria. Here, similar interaction effects were observed for all insecticides combined with
Aphanizomenon and no interaction effects were observed for any combination of an insecticide with
Anabaena. Also, antagonistic trends were observed for insecticides combined with Nodularia and
Oscillatoria despite the lack of significance in the majority of these combinations. The results suggest
that extrapolation of interaction effects from one insecticide to the other depends upon the
cyanobacteria used or insecticide used. Indeed, for Aphanizomenon and Anabaena effects are
consistent whereas for Microcystis and Cylindrospermopsis, different interactions are observed for
combinations with different insecticides. Combinations of Nodularia and Oscillatoria have a general
similar antagonistic trend across all insecticides yet only a few can be confirmed statistically.
Furthermore, correlation analysis of deviation parameters for each insecticide combined with the six
cyanobacteria indicated no significant correlations except for endosulfan and fenoxycarb (Appendix C
Table C.3). Thus, interaction effects of endosulfan and fenoxycarb when combined with the same

Chapter 4
88
cyanobacteria were similar for these two insecticides. This correlation cannot be explained from a
mode of action point of view as the modes of action are very different (section 1.5.2). However,
insecticides can affect other processes than their known molecular target (Pope, 1999) which may
explain the correlation although mechanistic confirmation is needed. Also, different interaction effects
of different cyanobacteria combined with the same insecticide were observed. Thus, when looking at a
larger group of stressors, interaction effects of cyanobacteria combined with insecticides cannot
always be extrapolated to other cyanobacteria. Correlation analysis confirmed no significant
correlations between the different cyanobacteria (Appendix C Table C.4). Cedergreen et al. (2009)
studied the reproducibility of binary mixture studies by replicating binary mixture experiments. They
concluded increased variability when the complexity of the test organism, e.g. unicellular organisms
such as bacteria or algae are less complex than multicellular organisms such as Daphnia, increases
leading to less reproducible conclusions. Furthermore, Cedergreen and Streibig (2005) also found
differences in mixture effects on different endpoints.
Overall, these results in combination with the previous results from chapters 2 and 3 indicate that life
history data is insufficient to understand mechanisms of combined and interaction effects. At the life
history level, interaction seems a complex trait dependent upon exposure concentration and
experimental design. Confounding factors such as variability between experiments and differences in
statistics may further complicate the matter. Alternative approaches have been suggested by Borgert
et al. (2004) and Jager et al. (2010). Borgert et al. (2004) suggest a thorough characterization of
toxicodynamics and kinetics in combinations with the general mode of action of the chemical to help
elucidate interaction effects. In contrast, Jager et al. (2010) suggest biology based models that use a
dynamic energy budget concept. Yet, both concepts require a priori available estimates of parameters
and large data sets which is neither always feasible nor available for every toxicant. In addition, both
concepts do not focus on a clear molecular understanding of mechanisms which may be crucial given
the subtle differences in the data presented here (e.g. different effects for closely related insecticides).
In conclusion, an integrative approach using both life history data and molecular data may be a way
forward.

Combined effects of cyanobacteria and insecticides across a large set of combinations.
89
4.5 Conclusion
Life history observations across a large set of combinations of cyanobacteria and insecticides
indicated interaction to be a complex trait dependent upon several factors. Both exposure
concentration and experimental design significantly altered conclusions drawn in relation to combined
and interaction effects together with other confounding factors such as biological variability,
experimental design and statistics. As a consequence, studying combined and interaction effects at
the life history level are insufficient to attain a clear insight in the dynamics and processes leading to
interactions. A consolidated approach combining both life history and molecular studies is the next
logical step.


Chapter 5
Identification of pathways, gene
networks and paralogous gene
families in D. pulex responding to
exposure to the toxic cyanobacterium
Microcystis aeruginosa.
5
Redrafted after:
Asselman J, De Coninck DIM, Glaholt S, Colbourne JK, Janssen CR, Shaw JR, De Schamphelaere
KAC. 2012. Identification of pathways, gene networks and paralogous gene families in Daphnia pulex
responding to exposure to the toxic cyanobacterium Microcystis aeruginosa. Environ Sci Technol 46,
8448-8457.


Identification of pathways, gene networks and paralogous gene families in D. pulex responding to exposure to the toxic cyanobacterium Microcystis aeruginosa.
93
5.1 Introduction
The most common and best studied cyanobacterium is Microcystis aeruginosa (Fristachi and Sinclair,
2008). The effects of Microcystis stress on Daphnia at physiological and life-history level have been
studied since the 1980s (Demott et al., 1991; Gustafsson and Hansson., 2004; Nizan et al., 1986) and
have primarily been related to three different factors: lack of essential nutrients such as essential fatty
acids or lipids (Haney et al., 1995; Lürling, 2003; Nizan et al., 1986), deterring feeding (Demott et
al.,1991, Lürling, 2003), or toxin production (Demott et al., 1991; Lürling, 2003; Rohrlack et al., 1999).
Current literature (Lürling, 2003; Rohrlack et al., 1999) remains undecided whether the effect of
Microcystis on Daphnia can be contributed to only one of these factors or a combination of them.
The goal of this chapter was therefore to investigate the effects of cyanobacterial stress, i.e. M.
aeruginosa, on the transcriptome of Daphnia pulex. The transcriptional stress response of D. pulex
feeding on M. aeruginosa will be described by using a comprehensive transcriptome microarray. Such
an array will allow identifying pathways or gene networks that characterize the response of Microcystis
stress. Using microarrays to characterize stress response in Daphnia has been done before (e.g.:
Poynton et al. (2007, 2008 and 2011), Heckmann et al. (2008) and Soetaert et al. (2007)). All these
studies use acute or short-term exposure which contrasts ecological reality where exposure is of a
more chronic nature.
In this chapter, microarrays will be implemented to assess chronic toxicity of M. aeruginosa. As a
consequence, the results of this chapter will not only serve to elucidate the mechanisms of Microcystis
toxicity but also as a proof-of-principle concept to assess molecular mechanisms of chronic toxicity
response in Daphnia.
An additional aim of this chapter was to develop a tailor-made bioinformatics pathway pipeline for
Daphnia pulex microarrays. Such a framework is necessary given the specific characteristics of the
Daphnia genome (Colbourne et al., 2011): a very high number of lineage specific genes (i.e. they have
no detectable sequence homology to genes in any of the current genome databases) and a very high
number of duplicated genes.

Chapter 5
94
5.2 Materials and methods
5.2.1 Experimental organisms
Daphnia pulex were obtained from isoclonal laboratory cultures of an isolate, originating from the
Basshaunt Lake, Dorset region, Ontario, Canada. Culture conditions were already described in section
2.2.1. Cultures were fed daily with Ankistrodesmus falcatus at a rate of 1.5 mg dry weight L-1
. For
experiments, neonates (< 24 h old) were isolated from unexposed maintenance cultures.
The cyanobacterial strain used was a microcystin producing Microcystis aeruginosa strain (UTEX
LB2385). Culture conditions were described in section 2.2.1.
5.2.2 Experimental design
Animals were exposed in 1 L polyethylene beakers (18 neonates per beaker) for a period of sixteen
days under a constant photoperiod (16:8h light dark) and constant temperature of 20 ± 1°C. Both
control and exposed treatments consisted of four biological replicates, i.e. four beakers. All animals
were fed with a diet in which the final feeding concentration was 1.5 mg dry weight L-1
. The diet of the
exposed animals contained 50% of Microcystis aeruginosa and 50% of Ankistrodesmus falcatus,
control diet consisted of 100% A. falcatus. This ratio was based on De Schamphelaere et al. (2011),
where it resulted in a decline of 50% in reproduction in exposed animals. During the experiment, pH of
the media was monitored on regular intervals. At the end of the experiment, animals were isolated for
gene expression analysis.
5.2.3 mRNA extraction, labelling and hybridization.
RNA was extracted with the RNeasy kit and Qiashredder (Qiagen, Venlo, Netherlands) following
manufacturer’s protocol. All animals 18 in total from one beaker were pooled into one sample and will
further be referred to as one biological replicate. DNA contamination was removed by a DNAse
treatment (Qiagen, Venlo, Netherlands). RNA quantity and quality were determined with the
spectrophotometer (Nanodrop, Thermo Fisher Scientific, Wilmington, DE, USA) and with the
Bioanalyzer 2100 (Agilent Technologies, Santa Clara, CA, USA) respectively. Samples were stored at
-80°C until RNA amplification.

Identification of pathways, gene networks and paralogous gene families in D. pulex responding to exposure to the toxic cyanobacterium Microcystis aeruginosa.
95
The microarray protocol follows detailed instructions by Lopez and Colbourne, 2011. Samples were
amplified using a T7-based RNA amplification technique. One microgram of total RNA was amplified
with the MessageAmp II aRNA Amplification kit (Ambion, Applied Biosystems, Carlsbad, CA, USA)
following manufacturer’s protocol. Quantity and quality of the amplified NA were determined with the
spectrophotometer and Bioanalyzer 2100.
Double stranded cDNA was synthetized with SuperScript Double-Stranded cDNA Synthesis Kit
(Invitrogen, Carlsbad, CA, USA) following clean up (alkaline hydrolysis and Qiaquick columns,
Qiagen). Concentration and integrity of the cDNA were determined with Nanodrop spectrophotometer
and Bioanalyzer 2100.
Samples were labeled with Dual-Color DNA Labeling Kit (Roche NimbleGen, Madison, WI, USA)
following manufacturers protocol. Quantity and quality of the samples were again determined with the
spectrophotometer and Bioanalyzer 2100.
The microarray design (Appendix D Table D.1) consisted of four arrays, each containing two samples,
i.e. a control and a Microcystis exposed sample. Different biological replicates were used for each
array and dye swaps were conducted. All eight labeled samples were pooled according to the design
(i.e. one control biological replicate was pooled with one Microcystis exposed replicate), resulting in
four pools to be hybridized to four arrays. Each pool was dried and resuspended in hybridization buffer
according to oche NimbleGen’s User Guide for Expression Analysis for Cy-labeled cDNA derived
from Eukaryote systems. Subsequent hybridization of each of these pools on the respective arrays
followed the same protocol (Lopez and Colbourne, 2011) and was executed with the NimbleGen
Hybridization Kit (Roche NimbleGen, Madison, WI, USA). After hybridization the slides were washed
with NimbleGen Hybridization Wash Buffers (Roche NimbleGen, Madison, WI, USA). The microarray
itself is a transcriptome array developed by the Centre for Genomics and Bioinformatics (Indiana
University, Bloomington, IN, USA) and is in the National Center for Biotechnology Information (NCBI)
Gene Expression Omnibus under the accession number (GEO: GPL11278). Finally, arrays were
scanned with the NimbleGen MS 200 Microarray Scanner to measure fluorescence and images were
processed with NimbleScan 2.6 Software and deposited in (GEO: GSE36635).

Chapter 5
96
5.2.4 Image analysis and data processing
Microarray images were analyzed with the statistical software package R (R Development Core Team,
2011, version 3.0.1) and Bioconductor (Gentleman et al., 2004). The LIMMA (Smyth, 2004, version
3.16.7) package was used with additions and modifications according to Colbourne et al. (2011). All
signal distributions were quantile normalized across arrays, samples and replicates. Differential
expression of a gene was determined based on the mean M-value of probes that represent the gene
in question. The M-value for a gene was defined as the log2 ratio of the expression in the exposed
animals and the expression of the animals in the control treatment. Linear models were constructed
with lmFit function, which fits multiple linear models using least-squares and empirical Bayes Statistics
were implemented with eBayes function, which computes moderated t-statistics after empirical Bayes
moderation of the standard errors towards a common value (Smyth, 2004). Benjamin-Hochberg
method (Benjamini and Hochberg, 1995) was implemented to adjust p-values for multiple testing at a
95% significance level.
5.2.5 Analysis of gene-lists
The analysis of the gene lists was combined with annotation information on each gene available
through wFleabase.org (Colbourne et al., 2005), KEGG database (Kanehisa et al., 2010) and KOG
(clusters of eukaryotic orthologous groups) database (Tatusov et al., 2003) in R. Annotation
information from wFleabase.org including KOG annotation, and enzyme classification (EC) numbers,
was downloaded in batch and combined with gene expression lists in R. Annotation information from
the KEGG database was obtained with KAAS (Moriya et al., 2007), for which all protein sequences of
the draft genome sequence were uploaded to the KAAS server. All results were stored in a txt file for
further use in R. Hence, the gene lists were analyzed in three different steps: KOG grouping analysis,
pathway analysis and analysis of paralogous gene families. To assess the impact of duplicated genes,
both KOG and KEGG analysis were executed once with and once without duplicated genes (i.e. only
single copy genes were considered in the latter analysis). Duplicated genes were excluded based on
their grouping into a paralog family as defined on wFleabase.org, which has used OrthoMcl
(http://wfleabase.org/release1/current_release/gene-predictions/dpulex1_gnomon_
paralog_mcl2ids.tab). KOG analysis was executed based on KOG classification as defined by the
Joint Genome Institute (http://genome.jgi-psf.org/cgi-bin/kogBrowser?db=Dappu1) where p-value was

Identification of pathways, gene networks and paralogous gene families in D. pulex responding to exposure to the toxic cyanobacterium Microcystis aeruginosa.
97
calculated with a Fisher`s exact Test (Fisher, 1922) and corrected for multiple testing with the
Benjamin-Hochberg method (Benjamini and Hochberg, 1995). Pathway analysis with KEGG reference
pathway maps revealed differential expression of pathways, where p-values were calculated with a
Fisher`s exact Test and corrected with Benjamin-Hochberg method for multiple testing. KEGGSOAP
package (Kanehisa et al., 2010) was used in R to query KEGG databases for full pathway annotation.
Pathway analysis was executed with both annotated enzyme classification number and KEGG
Orthology (KO) classification as input identifiers. A global metabolic pathway map was created within
KEGG through KEGGSOAP from R. In addition, gene lists were analyzed with Ingenuity Pathway
Analysis (Ingenuity® Systems, www.ingenuity.com). The input identifier for Ingenuity Pathway
Analysis was the UniProt accession number for each gene. Genes from the dataset that had an
absolute M-value larger than 1 and a q-value <0.05, were associated with biological functions in the
Ingenuity Knowledge Base and were included in the analysis. The significance of the association
between the data set and the canonical pathway was measured in two ways: 1) a ratio of the number
of molecules from the data set that mapped to the pathway divided by the total number of molecules
that mapped to the canonical pathway is displayed. 2) Fisher’s exact test was used to calculate a p‐
value determining the probability that the association between the genes in the dataset and the
canonical pathway is explained by chance alone. Significantly expressed genes were screened for the
overrepresentation of gene families. All genes were grouped according to annotation information
available through wfleabase.org, excluding lineage specific genes as no annotation information was
available. The representation of these groups in the genome was compared with their representation
within the significantly expressed genes through a Fisher`s exact test. Finally, overrepresentation of
paralog families in the differentially expressed (DE) gene set was studied in a similar manner. Again
Fisher`s exact test and Benjamin-Hochberg method were used to determine p-values at a 95%
significance level.
5.2.6 Validation of the microarray results through quantitative real-time PCR
Microarray results were validated with real-time qPCR. We selected six significantly regulated genes
and one reference gene from different pathways/ gene families: trypsin (Dappudraft_224995), ATP-
synthase (Dappudraft_230756), apoptosis inducing factor (Dappudraft_327425), neurexin IV
(Dappudraft_227614), presenilin 2 (PSEN2) (Dappudraft_306694), serine/threonine kinase
(Dappudraft_259493), reference gene glyceraldehyde-3-phosphate dehydrogenase (GAPDH)

Chapter 5
98
(Dappudraft_302823) based upon Asselman et al. (2012). For each of these genes, three biological
replicates, i.e. three independently collected RNA samples, were run in duplicate, i.e. technical
replication, on a single qPCR plate. Samples included replicate RNA from the microarray as well as
independent biological replicates. RNA was extracted using the same protocols as described above
for the microarray samples. Primers were designed with PrimerQuest (IDT technologies, Coralville, IA,
USA) and are listed in Appendix D Table D.2. Reverse transcription was conducted with the
Transcriptor First Strand cDNA Synthesis Kit (Roche Diagnostics, Indianapolis, IN, USA) according to
manufacturer’s protocol. A total of one µg RNA was reverse transcribed using random hexamer
primers. Quality of the RNA and cDNA were determined using the same methods as for the microarray
samples. Real-time qPCR was conducted with the Roche Lightcycler 480 DNA SYBR Green I Master
kit according to manufacturer’s protocol on the oche LightCycler II 480. A total of five µL of each
cDNA sample was added to 35 µL of mastermix. Plate design included negative (both no template and
no primer controls) and positive controls as well as standard curves with 2-fold dilution series of a
single cDNA sample. The amplification steps consisted of 45 cycles (10s at 95°C, 20s at 59°C, 30s at
72°C) preceded by one cycle at 95°C for five minutes and followed by a melt curve analysis. Samples
were analyzed with the Roche Lightcycler corresponding software release 1.5.0. Analysis consisted of
quality analysis of the melt curves and Ct values for each sample were normalized with the reference
gene according to Pfaffl 2001 . qPC results were compared with microarray results with Pearson’s
Coefficient of Correlation. Assumptions (e.g. normality) were verified prior to using the correlation
statistic (Sigmaplot 12, Systat Software).
5.3 Results
At a false discovery rate of 5%, the microarray experiment (GSE36635) revealed 2247 differentially
expressed (DE) genes (7.6% of the array) in response to Microcystis, of which 17% are lineage
specific and 49% are gene duplicates (paralogs) (Fig. 5.1). qPCR confirmed the expression obtained
with the microarray, both in magnitude and direction for six DE genes (Fig. 5.2) with a Pearson
correlation coefficient of 0.982 (p<0.01).

Identification of pathways, gene networks and paralogous gene families in D. pulex responding to exposure to the toxic cyanobacterium Microcystis aeruginosa.
99
Figure 5.1 Venn diagram of the microarray analysis of all genes (29546) for which probes are printed on
the microarray. Lineage-specific genes are genes having no sequence homology to genes in the currently
available genome databases. Paralogues are genes assigned to a gene family as defined on
wFleabase.org. Differently expressed (DE) genes are defined at a false discovery rate (FDR) of 5%.
Figure 5.2 Confirmation of the array results with qPCR. Array results are represented with a diamond.
Bars represent mean expression determined with qPCR and the corresponding standard deviation for
each gene, expression in control samples was set to one.
First, the functional eukaryotic orthology groups (KOG) analysis of these results indicated a complex
pattern of over and underrepresentation in the different KOG groups and subgroups (Table 5.1,
Appendix D Table D.3). This pattern differed between groups and subgroups. For seven of these KOG
subgroups (Table 5.1), results depended on whether or not duplicated genes where included in the
analysis. These belonged to three major groups: cellular processes and signaling, information storage
9499

Chapter 5
100
and processing, and metabolism. Six of these were significantly overrepresented by DE genes when
accounting for duplicated genes. Five of these KOGs were involved in metabolic functions whereas
one was involved in information storage and processing. One other, containing genes involved in
cellular processes and signaling, was significantly overrepresented by DE genes when duplicated
genes were excluded from the analysis (Table 5.1). This contrasts with the five KOG subgroups where
results were significant independent of the method used (Table 5.1). Two of these groups had no
known functional annotation, either poorly characterized or lineage specific genes. These differences
clearly indicate the importance of accounting for duplicated genes.
Table 5.1. Gene counts, number of differentially expressed (DE at 5% FDR) genes and DE single copy
genes in the different KOG groups and significant KOG functions provided by the Joint Genome Institute
(http://genome.jgi-psf.org/cgi-bin/kogBrowser?db=Dappu1) for all the genes on the array. In each column
header, the total number of genes in that gene set is listed. Genes with no KOG are indicated in the final
row. KOG functions with proportions differing significantly (p<0.05, based on Fisher`s exact test with
multiple testing correction) from the total gene set are indicated with *, p-value is given between
parentheses. In addition to the counts, O and U indicate respectively over- and underrepresentation of
that group or function in the DE set. Full list of KOG functions is presented in Appendix D Table D.3.
KOG Classification (Function ID) N° genes (29546)
N° significant genes (2247)
N° significant single copy genes (1157)
Cellular processes & signaling 5561 518* (p<0.01) O 245* (p<0.01) O
1.3 Posttranslational modification, protein turnover, chaperones (O)
1256 114
56* (p=0.02) O
1.4 Signal transduction mechanisms (T) 2188 219* (p<0.01) O 91* (p<0.01) O
Information storage & processing 3261 253 170* (p<0.01) O
2.3 Translation, ribosomal structure and biogenesis (J)
509 91* (p<0.01) O
67* (p<0.01) O
2.5 Replication, recombination and repair (L) 409 16* (p<0.01) U 8
Metabolism 3197 389* (p<0.01) O 111* (p<0.01) O
3.1 Energy production and conversion (C) 305 45* (p<0.01) O 26* (p<0.01) O
3.3 Amino acid transport and metabolism (E) 536 56 * (p=0.03) O 9
3.5 Carbohydrate transport and metabolism (G) 636 92* (p<0.01) O 23
3.7 Lipid transport and metabolism (I) 489 64* (p<0.01) O 15
3.8 Inorganic ion transport and metabolism (P)
309 36* (p=0.03) O 9
3.9 Secondary metabolites biosynthesis, transport and catabolism (Q)
167 23* (p=0.01) O 3
Poorly Characterized 3527 288 154
4.2 Function Unknown (S) 1061 113* (p<0.01) O 73* (p<0.01) O
No KOG id available 14018 799* (p<0.01) U 477 * (p<0.01) U
5.1 Lineage specific genes 7888 373* (p<0.01) U 298* (p<0.01) U

Identification of pathways, gene networks and paralogous gene families in D. pulex responding to exposure to the toxic cyanobacterium Microcystis aeruginosa.
101
Second, we identified four pathways or gene networks as defined by KEGG (Kanehisa et al., 2010)
significantly regulated by Microcystis exposure, i.e. ribosome, oxidative phosphorylation, mitochondrial
dysfunction and protein export (Table 5.2). All significantly affected pathways are enriched by up-
regulated genes, although all but the mitochondrial dysfunction did contain at least one gene that was
significantly down-regulated (Table 5.2). Furthermore, the number of repressed genes decreased to
zero in the ribosome and the oxidative phosphorylation when analyzing the data without the duplicated
genes (Table 5.2). Ingenuity Pathway Analysis software (Ingenuity Systems, California, USA),
revealed similar p-values (Table 5.2). For all pathways except the protein export, analysis with or
without duplicated genes resulted in the same outcome. In contrast, the protein export pathway was
only significant when analyzed without accounting for duplicated genes (Table 5.2).
Table 5.2 The significantly regulated pathways (as defined by KEGG (2011) and Ingenuity©): the number
of genes annotated to pathways, number of significantly upregulated and downregulated genes after
Microcystis exposure and the p-value of enrichment tests for the pathway. P-values in parentheses are
determined using Ingenuity©. Analysis was executed with and without duplicates (denoted as
with/without). Maximum, minimum and median values are given for the number of genes in the pathway.
Pathway N° of
genes in pathway
N° of genes
(q<0.05 & M>0)
N° of genes
(q<0.05 & M<0)
P-value
Maximum M-value
Minimum M-value
Median of M-value
Ribosome 351/169 50/41 8/0 <0.01/<0.01
(<0.01/0.01) 1.67/1.37 -1.32/-0.97 0.80/0.33
Oxidative phosphorylation
148/96 30/26 1/0 <0.01/<0.01
(<0.01/<0.01) 1.30/1.30 -1.11/-0.46 0.81/0.38
Mitochondrial Dysfunction
107/66 24/22 0/0 <0.01/<0.01
(<0.01/<0.01) 1.16/1.16 -0.44/-0.23 0.38/0.55
Protein Export 61/31 8/8 3/1 0.12/<0.01
(0.15/<0.01) 1.37/1.37 -0.97/-0.88 0.01/0.23
Third, analysis of all 2356 paralog clusters, including lineage specific genes, resulted in six clusters
that were significantly overrepresented in the DE gene set (Table 5.3). In contrast, the singly copy
genes were underrepresented in the DE gene set (Table 5.3). Also, we observed almost no up-
regulated genes in these six clusters, whereas the majority of the singly copy DE genes were up-
regulated (Table 5.3).
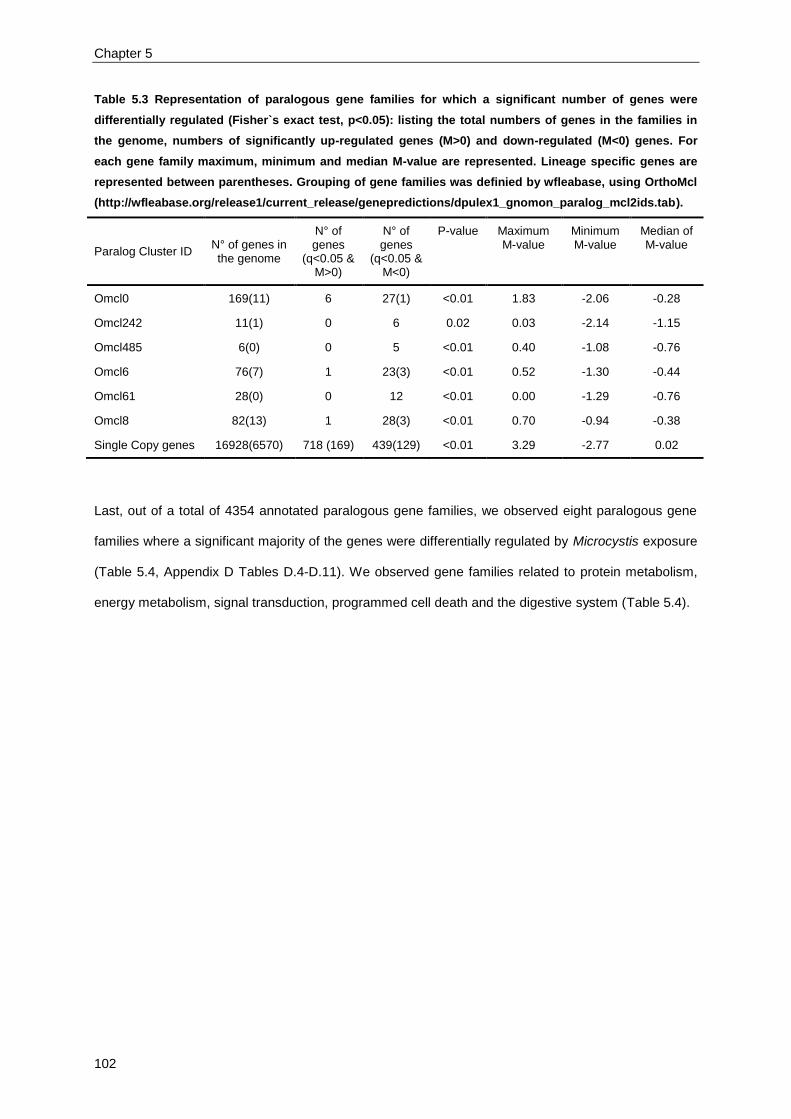
Chapter 5
102
Table 5.3 Representation of paralogous gene families for which a significant number of genes were
differentially regulated (Fisher`s exact test, p<0.05): listing the total numbers of genes in the families in
the genome, numbers of significantly up-regulated genes (M>0) and down-regulated (M<0) genes. For
each gene family maximum, minimum and median M-value are represented. Lineage specific genes are
represented between parentheses. Grouping of gene families was definied by wfleabase, using OrthoMcl
(http://wfleabase.org/release1/current_release/genepredictions/dpulex1_gnomon_paralog_mcl2ids.tab).
Paralog Cluster ID N° of genes in the genome
N° of genes
(q<0.05 & M>0)
N° of genes
(q<0.05 & M<0)
P-value Maximum M-value
Minimum M-value
Median of M-value
Omcl0 169(11) 6 27(1) <0.01 1.83 -2.06 -0.28
Omcl242 11(1) 0 6 0.02 0.03 -2.14 -1.15
Omcl485 6(0) 0 5 <0.01 0.40 -1.08 -0.76
Omcl6 76(7) 1 23(3) <0.01 0.52 -1.30 -0.44
Omcl61 28(0) 0 12 <0.01 0.00 -1.29 -0.76
Omcl8 82(13) 1 28(3) <0.01 0.70 -0.94 -0.38
Single Copy genes 16928(6570) 718 (169) 439(129) <0.01 3.29 -2.77 0.02
Last, out of a total of 4354 annotated paralogous gene families, we observed eight paralogous gene
families where a significant majority of the genes were differentially regulated by Microcystis exposure
(Table 5.4, Appendix D Tables D.4-D.11). We observed gene families related to protein metabolism,
energy metabolism, signal transduction, programmed cell death and the digestive system (Table 5.4).

Identification of pathways, gene networks and paralogous gene families in D. pulex responding to exposure to the toxic cyanobacterium Microcystis aeruginosa.
103
Table 5.4. Representation of paralogous annotated gene families for which a significant number of genes
were both in magnitude and direction differentially regulated (Fisher`s exact test, p<0.05): listing the total
numbers of the genes within families in the genome, numbers of significantly up-regulated genes (M>0)
and down-regulated (M<0) genes. For each gene family maximum, minimum and median M-value are
represented.
Gene Function N° of genes in the genome
N° of genes (q<0.05 & M>0)
N° of genes (q<0.05 & M<0)
P-value Maximum M-value
Minimum M-value
Median of M-value
Serine/threonine protein kinase
66 1 13 <0.01 1.15 -1.17 -0.40
40S Ribosomal protein
34 16 0 <0.01 1.32 0.64 0.87
60S Ribosomal protein
48 16 0 <0.01 1.21 0.62 0.81
Mitochondrial ribosomal protein
53 31 0 <0.01 1.19 0.62 0.8
NADH:ubiquinone oxidoreductase
26 11 0 <0.01 1.04 0.67 0.82
Neurexin IV 50 2 13 <0.01 1.41 -2.06 -1.01
Apoptosis Inducing Factor
25 0 11 <0.01 -0.63 -0.87 -0.74
Trypsin 255 12 20 0.02 1.86 -2.33 -0.1
5.4 Discussion
In this chapter, microarray technology was implemented to study the response of the recently
sequenced micro-crustacean D. pulex exposed to the environmental stressor Microcystis aeruginosa.
Four pathways/gene networks (Table 5.2) and eight paralogous gene families (Table 5.4) were
affected by Microcystis and correspond with the significant over or underrepresentation of KOG groups
in the differentially expressed gene set (Table 5.1). These KOG groups indicate a broad range of
functional networks that are potentially affected by Microcystis. Yet, the identified pathways/gene
networks are essential to understand interactions and relations among genes through their responses
in these pathways and networks and to identify primary mechanisms in the stress response. The
expression pattern of representative genes in these identified pathways and families were validated by
qPCR (Fig. 5.2), which confirms the validity of the conclusions from the microarray analysis and
emphasizes the potential of this technology in environmental genomics. In addition, the fact that
different results (Table 5.1-5.2) were obtained using different analysis methods, tailored to account for

Chapter 5
104
the unique structure of the D. pulex genome (i.e. duplicated genes), emphasizes the necessity for
these methods. Indeed, the elevated number of paralogous gene families in the D. pulex genome had
a clear impact on the analysis of the list of the DE genes and should be taken into account in further
gene transcription studies with this species. Collectively, these results demonstrate that duplicated
genes can either be those that are primarily responsive to a stressor (Table 5.1, KOG groups 2.5, 3.3,
3.5, 3.7, 3.8, 3.9) or they can mask potential effects on singly copy genes if they are less responsive
(Table 5.1, KOG group 1.3). Indeed, in small pathways with few enzymes, duplicated genes, all
encoding the same enzyme, can mask potential effect of the single copy genes which are smaller in
number.
Four pathways/networks were identified that are significantly overrepresented after chronic Microcystis
exposure. First, differential regulation of the ribosome (Table 5.1, KOG group 2.4; Table 5.2), including
three DE paralogous gene families in this network (40S, 60S and mitochondrial ribosomal proteins;
Table 5.4, Appendix D Tables D.5-D.7), suggests an impact of Microcystis on protein synthesis of D.
pulex. The differential regulation of ribosomes in D. pulex has already been observed after exposure to
stressful conditions such as metal stress, oxidative stress, and carbamates (Pereira et al., 2010;
Vandegehuchte et al., 2010). Interestingly, the direction of the expression in these studies is at odds
with the results here, in which the majority of the genes of network and all paralogous gene families
were upregulated, whereas the other studies observed downregulation. Nevertheless, the significant
overrepresentation observed here does indicate a clear impact on the protein synthesis. Furthermore,
Pereira et al. (2010) observed a downregulation of the ribosomes upon exposure to the insecticide
methomyl, which belongs to the same family as carbaryl, i.e. the carbamates. Indeed, these findings
could be a potential explanation for the observed antagonistic interaction between Microcystis and
carbaryl in chapter 3 as a carbamate and Microcystis both affect the ribosome but in the opposite
direction. This off course depends upon whether the effects from methomyl can be extrapolated to
carbaryl.
The second identified pathway/network is the oxidative phosphorylation, involved in energy production
and conversion (Table 5.1 KOG group 3.1, Table 5.2) and including all genes of the paralogous gene
family encoding NADH:ubiquinone oxidoreductases (Table 5.4, Appendix D Table D.8). A plausible
explanation for the overrepresentation of genes in the oxidative phosphorylation is the additional
requirement for energy of the organism, because of a general stress response. A general stress

Identification of pathways, gene networks and paralogous gene families in D. pulex responding to exposure to the toxic cyanobacterium Microcystis aeruginosa.
105
response has often been observed upon exposing Daphnia to a variety of oxidative stressors, e.g.
paraquat, cadmium, UV-radiation (Shaw et al., 2007; Barata et al., 2005; Poynton et al., 2007; Vega
and Pizarro, 2000) and is also a major response mechanism following microcystin exposure (Campos
and Vasconcelos, 2010; Amado and Monserrat, 2010). This leads to the hypothesis that D. pulex
requires additional energy to cope with the Microcystis stress, for instance to support increased protein
synthesis (cfr up-regulated ribosomes, up-regulated protein export, Table 5.2), or to cope with
misfolded proteins (Table 5.1 KOG group 1.3, Table 3 serine/protein kinases). In addition, readers are
referred to the review by Amado and Monserrat (2010), who provide an overview of oxidative stress
related to microcystin exposure in several aquatic species. Based on a compilation of evidence, these
authors postulated an interacting mechanism between oxidative stress and glutathione-S-transferase
levels in the cell that consequently affects the mitochondria. Here, one out of the twelve glutathione-S-
transferases was up-regulated, yet it was the only one belonging to KOG cluster KOG0868 (Appendix
D Table D.12). This points to a differential response of genes with the same protein annotation, yet
belonging to a different KOG cluster, to an environmental stressor and suggests different roles for
these glutathione-S-transferases in stress response. These results show how future studies
investigating gene responses under a variety of environmental stress conditions can help to
ecologically annotate genes in expanded gene families, of which glutathione-S-transferases are just
one example.
The third significantly overrepresented pathway was the mitochondrial dysfunction pathway. This
pathway in combination with the effects on the oxidative phosphorylation suggests another possible
reason for the effects on the latter. Microcystis, and more specifically microcystins, are known to affect
mitochondria and the oxidative phosphorylation. Several studies have investigated these effects in a
wide range of species (e.g. rats, rabbits, bighead carp, goldfish) (Zhao et al., 2008; Qui et al., 2009;
La-Salete et al., 2008; Ding et al., 1998; Zhang et al., 2007; Li et al., 2005). Campos and Vasconcelos
(2010) summarized current literature and postulated a general mechanism of microcystin toxicity to
mitochondria, yet the exact target and interacting proteins leading to these effects remain unknown.
La-Salete et al. (2008) observed a decrease and inhibition of the mitochondrial membrane potential as
the result of an interaction of the oxidative phosphorylation with microcystins when rat kidneys were
exposed to microcystins. A study with Daphnia magna (Chen et al., 2005) exposed to pure
microcystin-LR demonstrated broken and blurry mitochondria. These observations correspond well

Chapter 5
106
with the results in this chapter, i.e. effects on the oxidative phosphorylation pathway and on the
mitochondrial dysfunction pathway (Table 5.2). The dysfunctioning of mitochondria - and more
specifically complex I to which the NADH:ubiquinone oxidoreductase paralogous gene family belongs
(Table 5.4) - is often associated with generation of reactive oxygen species as well as the activation of
the mitochondrial apoptosis-inducing pathway (Chomova and Racay, 2010). Although induced
apoptosis in mitochondria is often associated with microcystin exposure in a variety of species
(Campos and Vasconcelos, 2010; Vega and Pizarro, 2000), here eleven apoptosis inducing factors
were significantly down-regulated (Table 5.4, Appendix D Table D.10). These apoptosis inducing
factors have a wide range of functions, including scavenging free radicals and inducing apoptosis,
depending on the environmental conditions. The mechanisms behind these functions are tightly
regulated by pro- and anti-apoptotic proteins that control the release of apoptosis inducing factors and
thus the subsequent induction of apoptosis pathways (Saelens et al., 2004). For a thorough
explanation we refer to the available literature (Vega and Pizarro, 2000; Saelens et al., 2004). Here,
pro- and anti-apoptotic proteins, i.e. Bcl2, Bax and apoptosis inhibitors (IAP), were not significantly
regulated (Appendix D Table D.13). Differential regulation of these proteins would induce programmed
cell death pathways, resulting in the release of, among others, apoptosis inducing factors (Vega and
Pizarro, 2010). The lack of DE of these proteins suggests that the DE of the apoptosis inducing factors
is not correlated with the function in programmed cell death. A potential hypothesis can therefore be
that their differential expression is more related to their function in oxidative stress, i.e. scavenging free
radicals than in apoptosis. In addition, both explanations put forward above for the DE of the oxidative
phosphorylation may be complementary and the overall impact may well be an interaction between the
two.
In addition to the gene network analysis, the representation of annotated paralogous gene families in
the DE gene list was analyzed (Table 5.4). Paralogous gene families are of particular interest as it has
been suggested that the maintenance of these duplicated genes over the course of evolution is non-
random in Daphnia (Colbourne et al., 2011). Moreover, in some cases, it has been shown that
members of the same gene family can respond differently to environmental stress (Table 5.4,
Colbourne et al., 2011). Thus, studying such paralogous gene families under a broad range of
environmental conditions will provide essential information of the functional consequences of gene
duplication. This analysis returned eight paralogous gene families that are overrepresented in the DE

Identification of pathways, gene networks and paralogous gene families in D. pulex responding to exposure to the toxic cyanobacterium Microcystis aeruginosa.
107
gene list. Five of these could be associated with the pathways and networks in Table 5.2 and have
already been discussed above. Three others are serine/threonine protein kinases, neurexin IV and
trypsins. First, based on their KOG ID, serine/threonine protein kinases (KOG1027, Appendix D Table
D.4) are sensors of the unfolded protein response pathway. They play a primordial role in the
homeostatic regulation of protein folding as well as the stress response to cope with an increased
number of unfolded proteins (Walter and Ron, 2011). The differential expression of these genes
suggests an impact of Microcystis on protein folding and potential accumulation of misfolded proteins.
This is supported by the observed significant overrepresentation of single copy genes involved in
posttranslational modification, protein turnover and chaperones (Table 5.1). Second, neurexin IV
proteins (Table 5.4, Appendix D Table D.9, KOG3516) are involved in signal transduction mechanisms
(Table 5.1 KOG group 1.4). Studies on Neurexin IV, in Drosophila melanogaster, have detailed the
importance of this protein in the nervous system, more specifically in adhesive cell-cell contact
(Baumgartner et al., 1996; Stork et al., 2009). The DE of a part of this gene family is a potential
indication of divergent roles for the members of this gene family. Finally, trypsins (Table 5.4, Appendix
D Table D.11, KOG3627) are involved in the amino acid transport and metabolism (Table 5.1: KOG
group 3.3). Aeruginosins, toxins produced by M. aeruginosa (Cadel-Six et al., 2008; Ishida et al.,
1999), are known to inhibit the serine proteases such as trypsins at the protein level through direct
interaction with the protein (Ishida et al., 1999). Inhibition of trypsins is supported by a study of
Czarnecki et al. (2006), who also reported inhibited trypsin activity by Microcystis in Daphnia. Trypsins
represent one of the most important components in the digestive system in Daphnia
(Schwarzenberger et al., 2010). In addition, it has been suggested (Czarnecki et al., 2006) that
Microcystis strains could strongly inhibit digestive activity in Daphnia through the inhibition of trypsins.
As a result, this could lead to reduced food assimilation, as demonstrated by Rohrlack et al. (2004).
Here, DE genes encoding trypsins were regulated in both directions, i.e. up-regulation and down-
regulation. Although, DE at the transcriptional level cannot be straightforwardly related to effects at the
protein level, Agrawal et al. (2005) and Schwarzenberger et al. (2010) did show differential sensitivity
of Daphnia trypsins to Microcystis strains at both RNA and protein level. More precisely, they showed
inhibition of certain trypsins, but also an increased activity of non-inhibited trypsins. Additional
research is needed to test if effects of M. aeruginosa at the protein level correlate with effects on the
transcription of these trypsins.

Chapter 5
108
Finally, thirty-five percent of the D. pulex genome contains lineage specific genes with no detectable
homolog to any gene in the current databases (Colbourne et al., 2011). Here, a total of 273 DE
lineage-specific genes (Fig. 5.1), of which 75 were member of a paralogous gene family, were
observed. To gain information about these lineage specific genes, the overrepresentation of all
paralogous gene families in the DE gene list was studied. These results (Table 5.3) indicated six
overrepresented clusters, of which four contained lineage specific genes. The majority of the genes in
these clusters were repressed after M. aeruginosa exposure, including the lineage specific genes.
Although the precise functions of these DE lineage-specific genes in these clusters still remain
unknown, it can at least be concluded that their response to M. aeruginosa is similar to the response
of the majority of the genes in that cluster. Using this type of information, from exposures to a broad
range of environmental conditions, could aid the future annotation of these lineage specific genes.
5.5 Conclusion
In conclusion, the implementation of whole transcriptome microarray technology to study the response
to the natural stressor Microcystis aeruginosa in Daphnia pulex resulted in identifying a characteristic
stress response pattern. This pattern consisted of four major pathways/ gene networks as well as eight
paralogous gene families that were significantly affected. Some of these could explain why fitness is
reduced (e.g. oxidative phosphorylation, trypsins) based on energy budget considerations. For others,
a link with fitness remains to be established.
Moreover, this chapter underlines the need to take into account the specific and unique D. pulex
genome structure in expression studies, because it contains an elevated number of duplicated genes
as well as lineage specific genes which may influence conclusions drawn. Finally, this chapter
suggested a first approach to start functionally annotating these genes in environmentally relevant
conditions. Further advancement of molecular tools in D. pulex research would support such an effort.

Chapter 6
General and specific molecular
mechanisms of cyanobacterial toxicity
in Daphnia pulex
6 x


General and specific molecular mechanisms of cyanobacterial toxicity in Daphnia pulex
111
6.1 Introduction
The evolution in molecular technologies has propelled ecological and environmental research to tackle
longstanding hypotheses with a new biological level of understanding. This evolution has greatly
benefitted Daphnia, now emerging as a true model organism in ecological and environmental
genomics (Ebert, 2011). The well-known ecology and unique genomic structure, described in detail in
section 1.4, make Daphnia the perfect model of study. Gene expression analysis conducted in chapter
5 highlighted that Daphnia`s lineage-specific genes are susceptible to ecological conditions and that
gene duplicates demonstrate divergent expression patterns. This tight interaction between the
genome and the environment has made Daphnia particularly suitable to study such interactions.
Genome-environment interactions become increasingly complex with regards to biotic stressors.
These stressors, in particular cyanobacteria, can often not be straightforwardly linked to a single
molecular target or mode of action. Cyanobacteria are a complex form of stress as they can produce
toxins, which can be compared to chemical toxicants, but they also can inhibit feeding responses and
serve as a food source for zooplankton species. As discussed in previous chapters (chapters 1-3),
interactions between cyanobacteria and Daphnia have been studied extensively. Yet, despite the
extensive research, no conclusive mechanism of cyanobacterial stress has been put forward
(Rohrlack et al., 1999; Schwarzenberger et al., 2010; Von Elert et al., 2003). Results from chapters 2-4
suggest a novel approach is necessary.
Systems biology approaches have been successfully applied in the past with Daphnia (chapter 5,
Heckmann et al., 2008; Latta et al., 2012) to link molecular responses to higher organismal responses.
The previous chapter identified main mechanisms of stress in Daphnia pulex exposed to M.
aeruginosa. Here, gene expression analysis will be applied in a wider context by focusing on five
different cyanobacterial species and their potential effects on Daphnia pulex. The aim of the chapter is
to answer two crucial questions by formulating the following research hypotheses. First, transcriptomic
profiles of D. pulex exposed to different cyanobacteria can identify mechanisms of cyanobacterial
toxicity. Transcriptomic profiles are being increasingly used to identify the stress/chemical an organism
was exposed to. Indeed, Antczak et al. (2013) have implemented machine learning methods to
distinguish between different classes of chemical. These machine learning methods may help
environmental risk assessment by identifying the chemicals or stressors that are causing adverse

Chapter 6
112
effects. Second, transcriptomic profiles can distinguish between species-specific and general
cyanobacterial stress responses. Current identification and classification focusses on identifying the
general stress response for certain groups of chemicals, i.e. anti-inflammatory drugs (Heckmann et al.,
2008) or narcotics (Dom et al., 2012). Less attention is given to the potential differences between
general responses indicative of a group of stressors and specific responses unique to each stressor
within that same group. From a systems biology perspective, these questions will be answered at the
gene level and at the higher functional level of gene annotations and pathways. The integration of
these two levels is crucial to fully link molecular responses to higher level effects.
6.2 Material and methods
6.2.1 Experimental organisms
The experimental organisms originated from D. pulex cultures as described in section 2.2.1. Likewise,
cyanobacteria culture conditions (i.e. for Anabaena, Aphanizomenon, Cylindrospermopsis, Nodularia
and Oscillatoria) were also described in section 2.2.1.
6.2.2 Experimental design
All exposures were conducted as described in section 4.2.2 to ensure enough RNA material for all
hybridizations, a control treatment was set up for each cyanobacteria treatment. Each treatment
consisted of four biological replicates. For each cyanobacterium, exposures were conducted twice, i.e.
the entire experimental set-up was repeated independently, which resulted in a total of eight biological
samples or replicates per treatment.
6.2.3 Gene expression analysis
Gene expression patterns were assessed following detailed procedures described in section 5.2.3 and
section 5.2.4. Briefly, RNA was extracted, amplified and reverse transcribed to cDNA. Samples were
hybridized to whole transcriptome Nimblegen arrays. For each cyanobacterium, treatment samples
were hybridized together with control samples to allow for direct comparisons. Per exposure, eight
samples, four controls and four treatments, were hybridized which results in sixteen samples or eight
comparisons per cyanobacteria, including dye swaps, as experiments were duplicated. Data was
analyzed in LIMMA (version 3.16.7) which constructed linear models with least-squares and calculated
General and specific molecular mechanisms of cyanobacterial toxicity in Daphnia pulex
113
moderated t-statistics after empirical Bayes moderation of the standard errors. Analysis was
conducted on all data simultaneously and a gene expression list was generated for each
cyanobacterium, containing relative expression values (M-values), i.e. log2 expression in the treatment
versus the log2 expression in the control, and q-values, Benjamini-Hochberg corrected p-values.
6.2.4 Analysis of gene expression lists
The analysis of the five gene expression lists or profiles, one for each cyanobacterium, continued in R
(version 3.0.1), where they were combined with annotation information about each gene as available
through wfleabase.org (Colbourne et al., 2005). A schematic diagram of the analysis can be found in
Fig. 6.1. For each expression profile, significant genes, defined as having a q-value, i.e. Benjamini-
Hochberg corrected p-value, smaller than 0.05, with their full annotation information were extracted
from the expression profiles for further analysis. Venn diagrams were then constructed with the R
package Venn diagram (version 1.6.5) to determine the number of shared genes, shared functional
annotations and shared gene ontology (GO) terms within the lists of significant genes. GO terms and
functional annotations were defined as shared when there was at least one gene present with that
functional annotation or GO term in each of the five lists. Concordant and discordant expression of the
functional annotations was determined by bootstrapping all significant gene lists and randomly
assigning genes to each functional annotation. Concordant expression means that the variation in
expression of the genes in the functional annotation under study is smaller than expected.
Disconcordant expression means that the variation in expression of the genes in the functional
annotation under study is larger than expected. Therefore, the means of relative gene expression (M-
values) were first calculated for each functional annotation for each gene list, resulting in five means
for each functional annotation. Second, an overall standard deviation was calculated from the five
means for each functional annotation. This standard deviation was compared with the standard
deviation generated by bootstrapping. If the actual standard deviation of the functional annotation fell
outside the 95% confidence interval of the bootstrap data, expression was determined concordant or
discordant. Concordant expression was defined as having a standard deviation lower than the 2.5
percentile, whereas disconcordant expression was defined as having a standard deviation higher than
the 97.5 percentile. The bootstrap procedure was conducted only on significant genes. For each
functional annotation within the significant genes, the number of genes with that functional annotation
was determined. The same number of genes was then selected at random from the significant genes.

Chapter 6
114
This procedure was done for all the functional annotations within the significant gene list. The mean
and the standard deviations were then determined in the exact same manner as for the actual data.
The entire bootstrap procedure was repeated 1000 times which resulted in 1000 standard deviations
for each functional annotation.
In addition to the analysis represented in Fig. 6.1, gene lists were also analyzed for enrichment of
pathways as described in section 5.2.5.
Figure 6.1 Schematic representation of the analysis of expression profiles of Daphnia following exposure
to cyanobacteria (Cy). GO= gene ontology, St. dev. = standard deviation.

General and specific molecular mechanisms of cyanobacterial toxicity in Daphnia pulex
115
6.3 Results and discussion
Transcriptomic profiles of Daphnia exposed to the five cyanobacteria identified distinct responses to
each cyanobacterium (Fig. 6.2). Few genes, i.e. 22, were significantly regulated in all cyanobacterial
exposures (Fig. 6.3, Appendix E Table E.1). The functional annotations of shared significantly
regulated genes were diverse ranging from cytochrome P450 to trypsins and neurexins (Appendix E
Table E.1). They also corresponded well with the functions of significantly regulated genes in response
to Microcystis aeruginosa (section 5.3). Out of the 22 shared genes, 12 were shared with the
transcriptomic profile of Daphnia pulex exposed to Microcystis aeruginosa described in section 5.3
(Appendix E Table E.1). All 22 shared genes had positive M-values (Fig. 6.3) indicating induction of
gene expression upon exposure to cyanobacteria, i.e. expression in the exposure was higher than in
the control. The majority of the genes had an M-value between 1 and 1.5. Five of the 22 shared genes
had an M-value larger than 1.5 whereas five others had an M-value smaller than 1.
Figure 6.2 Venn diagram of genes significantly regulated (q-value<0.05) by each of the five cyanobacteria
compared to control conditions. The sum of the numbers of genes in the subsets of each oval is the total
number of genes significantly regulated by the cyanobacterium corresponding to that oval. 19409 genes
were not significantly regulated by any of the cyanobacteria. (Aphanizomenon: APH, Anabaena: ANA,
Cylindrospermopsis: CYL, Nodularia: NOD, Oscillatoria: OSL)
19409

Chapter 6
116
Figure 6.3 Significant genes (q-value<0.05) shared among all transcriptomic profiles. The mean M-value (log2 (Cyano)/(Control)) across all five transcriptomic
profiles is plotted, error bars represent standard deviation per gene across the five profiles. Gene IDs can be found in Appendix E Table E.1.
M-v
alu
e
Lectin Glycoprotein CYP450 Trypsin Esterase Neurexin Transferase Trypsin Esterase Neurexin Alkaloid
Lectin Neurexin CYP450 Neurexin Esterase Neurexin Esterase Glycoprotein CYP450 Oxygenase Triglyceride
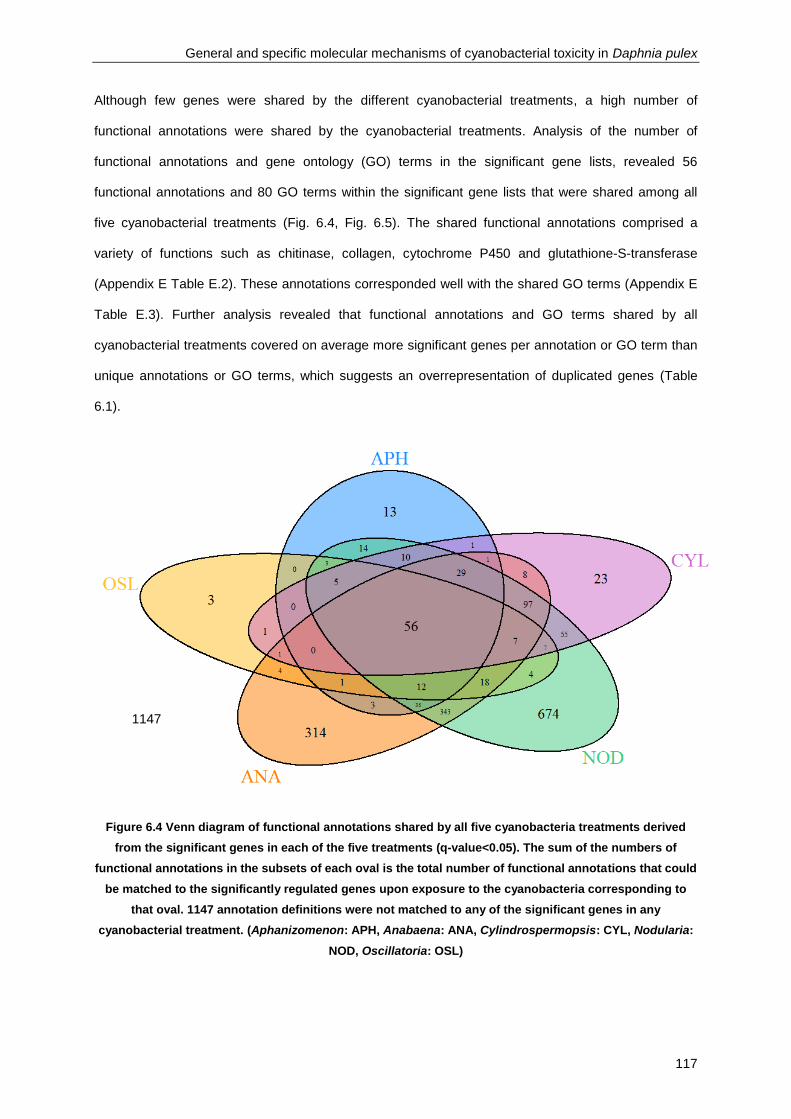
General and specific molecular mechanisms of cyanobacterial toxicity in Daphnia pulex
117
Although few genes were shared by the different cyanobacterial treatments, a high number of
functional annotations were shared by the cyanobacterial treatments. Analysis of the number of
functional annotations and gene ontology (GO) terms in the significant gene lists, revealed 56
functional annotations and 80 GO terms within the significant gene lists that were shared among all
five cyanobacterial treatments (Fig. 6.4, Fig. 6.5). The shared functional annotations comprised a
variety of functions such as chitinase, collagen, cytochrome P450 and glutathione-S-transferase
(Appendix E Table E.2). These annotations corresponded well with the shared GO terms (Appendix E
Table E.3). Further analysis revealed that functional annotations and GO terms shared by all
cyanobacterial treatments covered on average more significant genes per annotation or GO term than
unique annotations or GO terms, which suggests an overrepresentation of duplicated genes (Table
6.1).
Figure 6.4 Venn diagram of functional annotations shared by all five cyanobacteria treatments derived
from the significant genes in each of the five treatments (q-value<0.05). The sum of the numbers of
functional annotations in the subsets of each oval is the total number of functional annotations that could
be matched to the significantly regulated genes upon exposure to the cyanobacteria corresponding to
that oval. 1147 annotation definitions were not matched to any of the significant genes in any
cyanobacterial treatment. (Aphanizomenon: APH, Anabaena: ANA, Cylindrospermopsis: CYL, Nodularia:
NOD, Oscillatoria: OSL)
1147
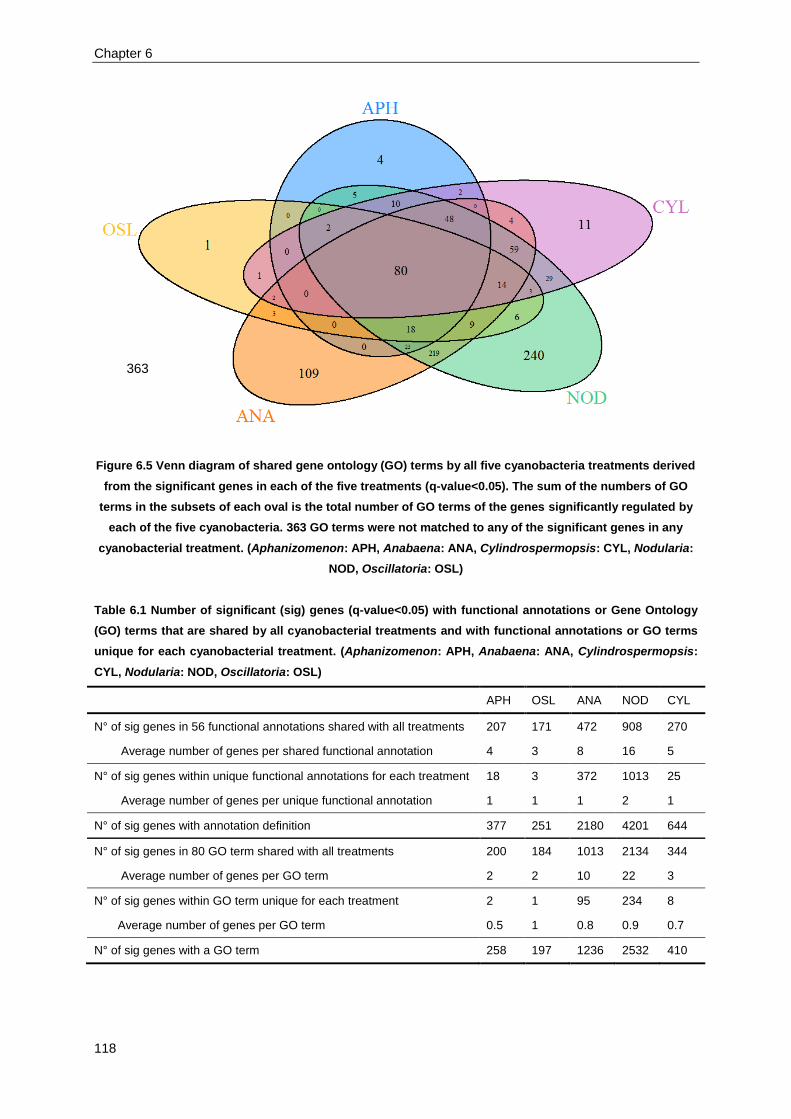
Chapter 6
118
Figure 6.5 Venn diagram of shared gene ontology (GO) terms by all five cyanobacteria treatments derived
from the significant genes in each of the five treatments (q-value<0.05). The sum of the numbers of GO
terms in the subsets of each oval is the total number of GO terms of the genes significantly regulated by
each of the five cyanobacteria. 363 GO terms were not matched to any of the significant genes in any
cyanobacterial treatment. (Aphanizomenon: APH, Anabaena: ANA, Cylindrospermopsis: CYL, Nodularia:
NOD, Oscillatoria: OSL)
Table 6.1 Number of significant (sig) genes (q-value<0.05) with functional annotations or Gene Ontology
(GO) terms that are shared by all cyanobacterial treatments and with functional annotations or GO terms
unique for each cyanobacterial treatment. (Aphanizomenon: APH, Anabaena: ANA, Cylindrospermopsis:
CYL, Nodularia: NOD, Oscillatoria: OSL)
APH OSL ANA NOD CYL
N° of sig genes in 56 functional annotations shared with all treatments 207 171 472 908 270
Average number of genes per shared functional annotation 4 3 8 16 5
N° of sig genes within unique functional annotations for each treatment 18 3 372 1013 25
Average number of genes per unique functional annotation 1 1 1 2 1
N° of sig genes with annotation definition 377 251 2180 4201 644
N° of sig genes in 80 GO term shared with all treatments 200 184 1013 2134 344
Average number of genes per GO term 2 2 10 22 3
N° of sig genes within GO term unique for each treatment 2 1 95 234 8
Average number of genes per GO term 0.5 1 0.8 0.9 0.7
N° of sig genes with a GO term 258 197 1236 2532 410
363

General and specific molecular mechanisms of cyanobacterial toxicity in Daphnia pulex
119
The discrepancy between the number of shared genes, only 22, on one hand and the number of
shared functional annotations (56) and GO terms (80) on the other hand, could in part be attributed to
the high number of duplicated genes within the Daphnia genome (Colbourne et al., 2011). In
particular, the expression of paralogous genes may differ between the different treatments but due to
their close sequence similarity, they are still assigned to the same functional annotation and GO term.
Colbourne et al. (2011) noted a condition-specific diversification of expression patterns. Here, a similar
conclusion could be made based on the high percentage of duplicated genes within functional
annotations shared by all cyanobacterial treatments (Table 6.2).
Table 6.2 Proportions of duplicated genes within different types of significant genes (q-value <0.05)
having a functional annotation, calculated for each cyanobacterial treatment separately.
(Aphanizomenon: APH, Anabaena: ANA, Cylindrospermopsis: CYL, Nodularia: NOD, Oscillatoria: OSL)
Groups: APH OSL ANA NOD CYL
% of duplicated genes within all functional annotations 65.9% 67.7% 72.1% 81.0% 70.2%
% of duplicated genes within functional annotations shared by all profiles 88.4% 83.6% 97.7% 99.6% 93.7%
% of duplicated genes within unique functional annotations 22.2% 0% 26.1% 47.9% 16.0%
Further analysis of the data on duplicated and non-duplicated genes separately supported the
hypothesis that the discrepancy between the number of shared genes and the number of shared
functional annotations can be attributed to paralogous genes. Indeed, paralogous genes were more
likely to be shared between the cyanobacterial treatments than non-duplicated genes (Table 6.3,
Appendix E Table E.4). In contrast, non-duplicated genes had a higher chance of being unique to only
one of the cyanobacteria treatments than duplicated genes (Table 6.3, Appendix E Table E.4). Only
the gene expression upon exposure to Oscillatoria did not have significant differences between
proportions of duplicated and non-duplicated genes in shared and unique functional annotations and
GO terms (Table 6.3). No difference was observed for either functional level (functional annotation and
GO term) between duplicates and tandem-duplicates for Aphanizomenon and Oscillatoria (Table 6.4,
Appendix E Table E.5). For Anabaena and Nodularia, significant differences were only observed at the
level of Gene Ontology terms whereas for Cylindrospermopsis, significant differences were only
observed at the gene level (Table 6.4, Appendix E Table E.5). Significant duplicated genes had a
higher probability of being unique to Cylindrospermopsis than tandem-duplicates (Table 6.4, Appendix

Chapter 6
120
E Table E.5). Anabaena and Nodularia stress resulted in more GO terms of significant duplicated
genes being shared than GO terms of tandem duplicated genes.
Table 6.3 P-values, corrected for multiple testing, of Fisher`s exact tests comparing the proportion of
shared and unique significantly regulated (q-value<0.05) genes, annotation definitions and gene ontology
(GO) terms between duplicated and non-duplicated genes, based upon data from Fig. 6.2.
(Aphanizomenon: APH, Anabaena: ANA, Cylindrospermopsis: CYL, Nodularia: NOD, Oscillatoria: OSL)
APH OSL ANA NOD CYL
Proportion of significantly regulated genes shared by all treatments versus unique for each treatments <0.01 0.06 <0.001 <0.001 <0.001
Proportion of annotation definitions within significant gene lists shared by all treatments versus unique for each treatment <0.001 0.09 <0.0001 <0.0001 <0.01
Proportion of GO terms within significant gene list shared by all treatments versus unique for each treatment <0.01 1.00 <0.0001 <0.0001 0.03
Table 6.4 P-values, corrected for multiple testing, of Fisher`s exact tests comparing the proportion of
shared and unique significantly regulated (q-value<0.05) genes, annotation definitions and gene ontology
(GO) terms between duplicated and tandem-duplicated genes, based upon data from Appendix E Table
E.2. (Aphanizomenon: APH, Anabaena: ANA, Cylindrospermopsis: CYL, Nodularia: NOD, Oscillatoria:
OSL)
APH OSL ANA NOD CYL
Proportion of significantly regulated genes shared by all treatments versus unique for each treatments 0.95 0.86 0.53 0.08 <0.001
Proportion of annotation definitions within significant gene lists shared by all treatments versus unique for each treatments 0.75 1.00 0.75 1.00 0.75
Proportion of GO terms within significant gene list shared by all treatments versus unique for each treatments 0.16 0.08 <0.01 <0.01 0.04
All but one of the 56 annotation definitions shared by all cyanobacterial treatments were also identified
in the transcriptomic profile of Microcystis aeruginosa stress (section 5.3). Like exposure to
Microcystis, exposure to all other cyanobacteria resulted in significant effects on genes involved in
detoxification, i.e. cytochrome P450 gene families, glutathione-S-transferases, which is represented by
both the shared annotation definitions as well as the GO terms. Given that only three cytochrome
P450 genes were shared across all five cyanobacteria, it indicates that these cyanobacteria produce
comparable toxic metabolites that are similar enough to induce the same type of cytochrome P450s
but different enough to induce different paralogous genes upon exposure to each cyanobacteria. This
is also supported by a review by Wiegand and Pflugmacher (2005) who discussed the different

General and specific molecular mechanisms of cyanobacterial toxicity in Daphnia pulex
121
biotransformation and degradation of cyanobacterial toxins through cytochrome P450 and glutathione-
S-transferase. The same conclusion can also be drawn for serine/threonine kinases which have also
been discussed in section 5.4 in relation to Microcystis exposure. As discussed in section 5.4, these
proteins are involved in protein folding and may help to cope with misfolded proteins due to increased
cyanobacterial stress.
In contrast, only a limited number of these annotation definitions were identified in transcriptomic
profiles under cadmium (De Coninck et al., 2014), i.e. 9 annotation definitions, and salinity (Latta et al.,
2013) stress, i.e. 14 annotation definitions (Appendix E Table E.6). Only five annotation definitions
were shared between the transcriptomic profiles in response to five cyanobacteria, salinity and
cadmium, seven conditions in total (Appendix E Table E.6). These shared annotation definitions also
only cover a limited part of the shared GO terms (Appendix E Table E.3). This observation suggests
that the majority of the 56 annotation definitions and GO terms common to all cyanobacterial
treatments were specific to cyanobacterial exposure, regardless of the cyanobacteria species, rather
than a general stress response. The annotation definitions and corresponding GO terms shared with
salinity and cadmium profiles primarily pertain to functions identified in literature with general stress
response: chitinases, trypsins, von Willebrand factor (Heckman et al., 2008; Poynton et al., 2007).
Surprisingly, while trypsins have been primarily reported in relation with cyanobacterial stress and
nutritional quality (section 5.4), they are also differentially regulated upon cadmium and salinity stress.
No clear explanation can be given at this point, in particular as trypsins are differentially regulated and
not solely up or downregulated. Furthermore, given that few trypsin genes are shared, it indicates
again a functional diversification of these paralogous genes in which their different roles depend upon
the environment as suggested by Colbourne et al (2011). Some annotation definitions not related to
general stress response but more specific were also identified as shared between the different
stressors. Both salinity and cyanobacterial stress affect kainite type ion channel receptors. Such a
response correlates with the known function of certain cyanobacterial toxins such as beta-
Methylamino-L-alanine (BMAA), known to stimulate kainite receptors (Rao et al., 2006). In addition,
neurexin IV was also shared by both salinity and cyanobacterial stress and is involved in signal
transduction (Baumgarter et al., 1996; Stork et al., 2009) yet its function under these two stress
conditions remains to be elucidated.

Chapter 6
122
At the pathway level, only the starch and sucrose metabolism was shared by all cyanobacterial
treatments. The steroid hormone biosynthesis, detoxification through cytochrome P450 and the
arachidonic acid metabolism were shared by all cyanobacterial treatments excluding Anabaena (Table
6.6). The lack of significance of the detoxification pathway through CYP450 upon exposure to
Anabaena is surprising given the presence of high number of significantly regulated genes belonging
to the CYP450 family compared to the other cyanobacteria (Appendix E Table E.2).
The shared pathways correlate well with known mechanisms of cyanobacterial stress: lack of sterols
(Von Elert et al., 2003) and fatty acids (Brett et al., 2006) and production of toxins (Codd et al., 2005).
Most likely neither of these mechanisms is a unique driver of cyanobacterial stress, but a
cyanobacterial species-specific combination of these mechanisms underlies their stress. Again, a
discrepancy between the gene level and a higher functional level was clear. Only 22 genes were
shared between all cyanobacterial treatments with a diverse set of functions (Fig. 6.2.) yet quite a
number of pathways were shared between all cyanobacterial treatments (Fig 6.6). This again indicates
that cyanobacterial treatments regulated different genes with a similar function, i.e. belonging to the
same pathway.
Table 6.6 Statistically enriched pathways (p-value<0.05) with significantly regulated genes (q-value<0.05)
for each cyanobacterial treatment. (Aphanizomenon: APH, Anabaena: ANA, Cylindrospermopsis: CYL,
Nodularia: NOD, Oscillatoria: OSL). Blank or white cells denote a p-value larger than 0.05, i.e. no
significant enrichment in that pathway for that cyanobacterial treatment, and filled or gray cells denote a
p-value smaller than 0.05, i.e. significant enrichment in that pathway for that cyanobacterial treatment.
APH OSL ANA NOD CYL
Arachidonic acid metabolism
Ascorbate and aldarate metabolism
Adipocytokine signaling pathway
Detoxification through cytochrome P450
Glutathione metabolism
Histidine metabolism
Pentose and glucuronate metabolism
Ribosomes
Starch and sucrose metabolism
Steroid biosynthesis
Tryptophan metabolism

General and specific molecular mechanisms of cyanobacterial toxicity in Daphnia pulex
123
Effects on genes can also be integrated with higher functional levels through their expression patterns.
Here, we observed high similarities at the functional levels (Fig. 6.4-6.5: GO terms and annotation
definitions) yet few shared genes (Fig. 6.3). Results have already attributed this to disproportionate
high number of duplicated genes in shared GO terms and functional annotations. Furthermore, the
results suggest a potential functional diversification of these duplicated genes with some individual
genes being primarily responsive to one cyanobacterium while others seem to be primarily affected by
another cyanobacterium.
Expression patterns may shed further light on these findings in terms of the regulation of these
duplicated genes. Here, we observed significant concordant expression, i.e. smaller standard
deviation in gene expression than expected between all cyanobacterial treatments for eight annotation
definitions (Table 6.7). For two functional annotations, acyl-CoA synthetase and type I
phosphodiesterase-nucleotide pyrophosphatase, gene expression was discordant, i.e. larger deviation
in gene expression than expected between all cyanobacterial treatments. The concordant expression
of these eight functional annotations indicated a strong and tight regulation of these functions among
the different cyanobacterial treatments even though the specific significantly regulated genes with
these functions were different in different cyanobacterial treatments. This tentatively suggests that the
function remains conserved, given the concordant regulation, but is mediated through different genes
dependent upon the environmental stressor.
In contrast, the discordant expression of acyl-CoA synthetase and pyrophosphatases indicated that
although all cyanobacteria affected these functions, the effects were widely different among the
different cyanobacterial treatments. Expression of acyl-coA synthetases, the rate-limiting enzyme in
the fatty acid synthesis (Zinke et al., 2002), most likely differed widely in expression due to the
different fatty acid composition of the cyanobacteria (section 2.3). In addition, the discordant
expression may also imply that the functions may have diversified to such an extent that they do not
fully correspond with the given annotation anymore. The majority of shared functional annotations
lacked clear concordant or discordant expression patterns. This means that although the genes within
these functional annotations all share a similar conserved function, the regulation of this gene function
differs upon exposure to different cyanobacteria. This suggests a complex pattern of conserved
mechanistic functions under cyanobacterial stress response and cyanobacteria specific effects on
these functions.

Chapter 6
124
Table 6.7 Annotation definitions with concordant expression across all transcriptomic profiles.
Annotation definition
Alpha-amylase
Lipid exporter ABCA1 and related proteins ABC superfamily
Neurexin IV
Peroxidase-oxygenase
Predicted transporter
Triglyceride lipase-cholesterol esterase
von Willebrand factor and related coagulation proteins
Zinc carboxypeptidase
6.4 Conclusion
Complex response patterns of Daphnia to cyanobacterial stress were identified that differ across levels
of molecular organization. These patterns suggest potential mechanisms of cyanobacterial stress.
Some were conserved across the responses to the different cyanobacterial stressors whereas others
were species specific. The observed discrepancy between the different levels of molecular biological
organization underlines the necessity of an integrative approach. Furthermore, the incorporation of the
unique features of the genome under study in the analysis benefitted the integration of these different
levels of organization in a true systems biology approach. Overall, cyanobacterial stress targeted
mainly similar mechanisms and pathways regardless of the cyanobacterial species. Yet, the effects on
these mechanisms and pathways were species-specific and were mediated at the gene level through
different genes.
Chapter 7
Combined effects of cyanobacteria
and insecticides at the transcriptomic
level
7 x

Combined effects of cyanobacteria and insecticides at the transcriptomic level
127
7.1 Introduction
Combined and interaction effects complicate environmental risk assessment. Yet, they are an
undeniable part of ecological reality. Research efforts focused on organismal or life history effects
remain insufficient to elucidate the complexity of these effects and to unravel mechanisms that
potentially could explain the occurrence of interaction effects.
In chapters 3 and 4, combined and interaction effects of insecticides and cyanobacteria were
extensively studied at the organismal level. Results could be summarized as complex patterns of
interaction effects across stressors that were insufficient to fully explain the occurrence of these
effects.
Here, a transcriptomics approach will be used to study combined and interaction effects at the
transcriptomic level. The usefulness of such an approach has been discussed in section 1.3 and has
been demonstrated for the effects of cyanobacteria on Daphnia in chapters 5 and 6. As mentioned in
section 1.3, few studies have investigated combined effects at the transcriptomic level after chronic
exposure of Daphnia (De Coninck et al., 2014; Stanley et al., 2013).
This chapter will build further on the transcriptomic approaches described in chapter 5 and 6. Whole
transcriptome arrays were used to query effects on gene expression of both single and combined
treatments of cyanobacteria and insecticides. As a consequence, mechanisms of interaction can be
studied at the gene expression level, which will allow characterization of combined and interaction
effects at this level. As mentioned in section 1.3, studies discussing combined and interaction effects
at the transcriptomic level do not generally estimate these effects through standard mixture toxicity
models such as multiplicative or additive models (section 1.1.1, section 1.3). Without the use of a
standard mixture toxicity model or framework, it is impossible to compare and potentially generalize
effects across studies.
Therefore, this chapter will focus on studying combined and interaction effects at the transcriptomic
level within a defined statistical framework using a standard mixture toxicity model based upon the
framework developed by De Coninck et al. (2014). The selection of 48 combinations will not only aid in
understanding the complex mechanisms driving interaction effects but also requires new

Chapter 7
128
methodologies to compare interaction effects between these combinations at the whole transcriptomic
level rather than estimating interaction effects gene-by-gene for each combination.
7.2 Material and Methods
7.2.1 Experimental organisms
The experimental organisms originated from D. pulex cultures as described in section 2.2.1. Likewise,
cyanobacteria culture conditions were also described in section 2.2.1.
7.2.2 Experimental design
Biological tissue originated from exposures described in chapter 4 (section 4.2.2). Exposures followed
a two factorial design depicted in Fig. 4.1. Briefly, Daphnia were exposed to control treatment, an
insecticide treatment with a concentration of half the EC50, a cyanobacteria treatment in which the diet
was contaminated with 50% of cyanobacteria, and a mixture treatment containing 50% of
cyanobacteria in the diet and having a concentration of half the EC50 for each insecticide. In total, 48
combinations were tested.
7.2.3 mRNA extraction, labelling and hybridization.
RNA extractions were conducted as detailed in section 5.2.3. Labelling and hybridization procedures
followed similar protocols as described in section 5.2.3 although the labelling design differed. The
labelling design followed a standard loop design for each binary mixture (Fig. 7.1) to allow optimal
comparison of single and combined effects within each mixture. Different biological replicates were
used on each array. No technical replicates were used as sufficient biological replicates were available
(i.e. four per treatment) for replication and dye swaps.

Combined effects of cyanobacteria and insecticides at the transcriptomic level
129
Figure 7.1 Labelling design for each binary combination. Arrows represent microarrays and point to red
labelled (Cy5) sample. The sample at the base of the arrow is then labelled green (Cy3).
7.2.4 Image analysis and data processing
Image and data processing followed general concepts described in section 5.2.4. However, given the
different experimental setup, a different approach to present the data and to construct the linear model
was used. Specifically, a separate channel analysis, i.e. each channel or each colour was first
analysed separately, was conducted rather than a log ratio analysis, i.e. both channels or colours were
analysed together as a log-ratio of the Cy5 labelled sample versus the Cy3 labelled sample. As
described by Smyth and Altman (2013), a separate channel analysis will improve detection power as it
will include more information than a standard log ratio analysis. In simple paired designs with only two
treatments, such as described in chapters 5 and 6, no information can be gained from a separate
channel analysis and both models will yield the same test statistic (Smyth and Altman, 2013).
However, in more complex designs such as here, where for example cyanobacteria treatments or
insecticide treatments serve as a common reference to control and mixture treatments, a significant
improvement can be made through separate channel analysis. In particular, separate channel analysis
includes the information captured by the A-value, i.e. average log intensity or half of the sum of the
log2 expressions of Cy3 and Cy5 that is ignored in a log ratio analysis. It consists of processing the
data as separate single channels and using standard techniques for normalization and quality
assessment as described in section 5.2.4. Subsequently, the intra-spot correlation, the correlation
between the Cy5 and Cy3 labelled sample for that spot on the array, is determined which together with
a standard design matrix and the microarray data is the input for the subsequent linear model analysis
for separate channels. In R (version 3.0.1), this analysis can be done using the function lmscFit.
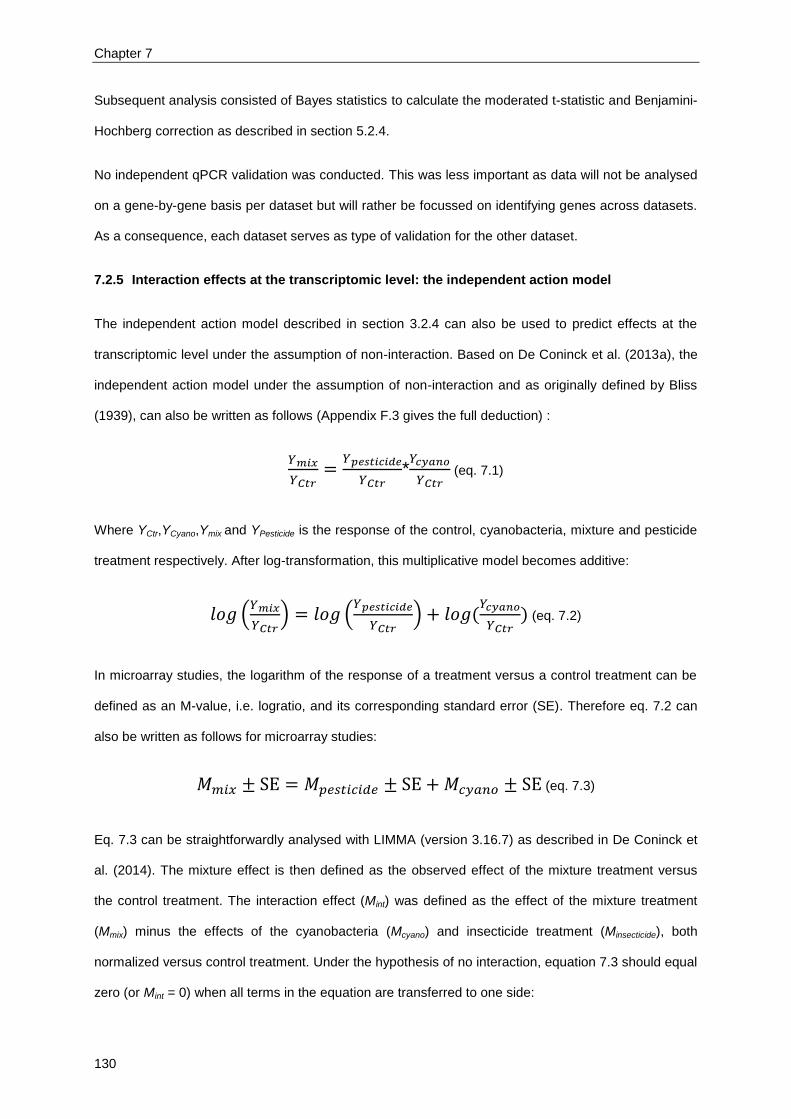
Chapter 7
130
Subsequent analysis consisted of Bayes statistics to calculate the moderated t-statistic and Benjamini-
Hochberg correction as described in section 5.2.4.
No independent qPCR validation was conducted. This was less important as data will not be analysed
on a gene-by-gene basis per dataset but will rather be focussed on identifying genes across datasets.
As a consequence, each dataset serves as type of validation for the other dataset.
7.2.5 Interaction effects at the transcriptomic level: the independent action model
The independent action model described in section 3.2.4 can also be used to predict effects at the
transcriptomic level under the assumption of non-interaction. Based on De Coninck et al. (2013a), the
independent action model under the assumption of non-interaction and as originally defined by Bliss
(1939), can also be written as follows (Appendix F.3 gives the full deduction) :
*
(eq. 7.1)
Where YCtr,YCyano,Ymix and YPesticide is the response of the control, cyanobacteria, mixture and pesticide
treatment respectively. After log-transformation, this multiplicative model becomes additive:
(
) (
) (
) (eq. 7.2)
In microarray studies, the logarithm of the response of a treatment versus a control treatment can be
defined as an M-value, i.e. logratio, and its corresponding standard error (SE). Therefore eq. 7.2 can
also be written as follows for microarray studies:
(eq. 7.3)
Eq. 7.3 can be straightforwardly analysed with LIMMA (version 3.16.7) as described in De Coninck et
al. (2014). The mixture effect is then defined as the observed effect of the mixture treatment versus
the control treatment. The interaction effect (Mint) was defined as the effect of the mixture treatment
(Mmix) minus the effects of the cyanobacteria (Mcyano) and insecticide treatment (Minsecticide), both
normalized versus control treatment. Under the hypothesis of no interaction, equation 7.3 should equal
zero (or Mint = 0) when all terms in the equation are transferred to one side:

Combined effects of cyanobacteria and insecticides at the transcriptomic level
131
(eq. 7.4)
Mathematically, the genes not adhering to eq. 7.3 are defined as genes with a significant interaction
effect and the deviation from zero can be seen as the deviation from non-interaction (Mint). The LIMMA
analysis results in a deviation value (Mint) and a p-value, based on moderated t-statistics after
empirical Bayes moderation of standard errors, indicating the significance of the deviation from non-
interaction for each gene. Genes demonstrating an interaction effect can be labelled as synergistic or
antagonistic based upon their M-value. If the observed M-value (Mmix) is smaller than the predicted M-
value (Mcyano + Minsecticide), the effect on the gene is smaller than predicted or antagonistic. If the
observed M-value (Mmix) is larger than the predicted M-value (Mcyano + Minsecticide), the effect on the
gene is larger than predicted or synergistic.
These results are then subjected to empirical Bayes statistics and Benjamini-Hochberg correction as
described in section 5.2.4. Interaction effects are thus quantified in terms of statistically significantly
deviation from non-interaction defined by Mint. Alternatively to Benjamini-Hochberg correction,
confidence intervals can be used to additionally filter the data after empirical Bayes moderation of
standard errors. Indeed, the requirement for a gene to demonstrate a significant interaction effect
would then be no overlap of the confidence intervals of the predicted M-value (Mcyano + Minsecticide) and
observed M-value (Mmix) rather than a cut-off q-value. Here, the confidence intervals of 95% and 90%
were selected. M-values are also often used as alternative to multiple testing (Hampton and Stanton,
2010). Here, several cut-off values were used, i.e. absolute Mint-value larger than 1, 2 and 3.
Biologically this implies that the predicted effect of the cyanobacteria and the pesticide differs by a
factor of 2, 4 or 8 from the observed effect of the cyanobacteria and the pesticide, which indicates a
large interaction effect.
The benefits and disadvantages of each of the three methods, i.e. Benjamini-Hochberg correction,
confidence interval filtering and M-value cut-off, will be discussed in the results section. The analysis
was conducted on all 48 combinations separately and in the end gives an M-value, deviation from
non-interaction, for each gene with a corresponding p-value for each combination. The significance of
the deviation from non-interaction is determined by the p-value and the subsequent correction, filter or
cut-off value. As a result, the gene list from the Limma ANOVA analysis will be filtered in six different
ways resulting in six different filtered gene lists as illustrated in Fig. 7.2 for each combination.

Chapter 7
132
Lastly, the pattern of the genes with an interaction effect based upon the gene list selected as the best
gene list out of the six gene lists, were visualized through interaction plots as described by De Coninck
et al. (2014).
Figure 7.2 Schematic overview of the analysis and the different methods to process the gene list
afterwards. n refers to the total number of genes with a significant p-value. A, b, c, x and y refer to the
numbers falling below the cut-off M-value or within overlapping confidence intervals.
For each combination, the number of genes with no interaction, a synergistic or antagonistic deviation
was calculated. However, to compare effects between combinations an overall measure of interaction
is recommended. No relevant literature was found, therefore two potential measures will be suggested
here. First, a measure based upon the numbers of synergistic and antagonistic genes. These numbers
were then used to determine the overall synergistic or antagonistic deviation from non-interaction for
the specific combination as followed:
(
) (eq. 7.5)

Combined effects of cyanobacteria and insecticides at the transcriptomic level
133
The metric in eq. 7.5 allows quantifying deviations similarly as the deviation parameter defined by
Jonker et al. (2005) for life history data. The metric becomes more positive as the number of
synergistic genes increases and becomes more negative when the number of antagonistic genes
increases. If any of the two numbers is zero, it will be set to one to allow calculating the log ratio. As a
consequence, if both are zero, the ratio will be one and the deviation parameter will be zero indicating
non-interaction, similarly to the deviation parameter of Jonker et al. (2005).
Second, a measure based upon the M-value of each gene defined as synergistic or antagonistic. The
M-value is a deviation from non-interaction for that gene and may be a suitable measure to quantify
overall interaction as followed:
∑ (eq. 7.6)
In which n is the number of genes with a significant deviation from non-interaction, Mi is defined as Mint
in eq. 7.4 of the ith gene. As the M-value itself is a log2 value, the deviation parameter will also be.
Similar to eq. 7.5, the more negative the deviation parameter, the more antagonistic the deviation. In
contrast, the more positive the parameter, the more synergistic the deviation will be. Indeed, the
deviation M-value, Mint, originates from the contrast from eq. 7.4. In this equation, if Mmix – Mcyano –
Mpesticide is positive, it means that Mmix is larger than Mcyano + Mpesticide , which indicates synergism.
However, if Mmix – Mcyano – Mpesticide is negative, it means that Mmix is smaller than Mcyano +Mpesticide ,
which indicates antagonism. Both methods will be compared and discussed in the following sections.
7.2.6 Analysis of gene lists
Analysis of the gene lists generated under 7.2.4 and 7.2.5 was previously described in section 5.2.5.
Similarly, analysis was conducted with all genes, without duplicated genes and with only duplicated
genes to assess the impact of gene duplication on the biological interpretation.
7.3 Results and discussion
The results and discussion section consists of three parts. In the first part, the different approaches
from Fig. 7.2 will be discussed, i.e. Benjamini-Hochberg (BH) correction, filtering based upon
confidence intervals and the cut-off Mint-value. All these methods resulted in gene lists in which each
gene was determined as significant from non-interaction or adhering to non-interaction. The second
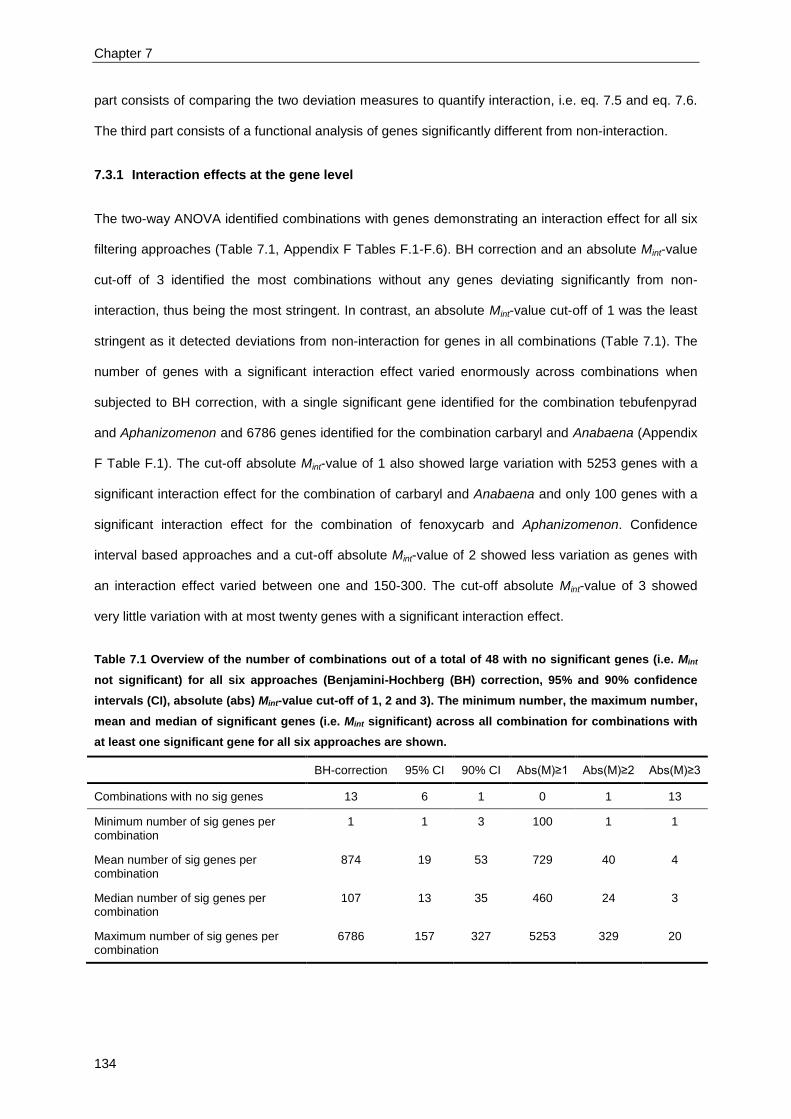
Chapter 7
134
part consists of comparing the two deviation measures to quantify interaction, i.e. eq. 7.5 and eq. 7.6.
The third part consists of a functional analysis of genes significantly different from non-interaction.
7.3.1 Interaction effects at the gene level
The two-way ANOVA identified combinations with genes demonstrating an interaction effect for all six
filtering approaches (Table 7.1, Appendix F Tables F.1-F.6). BH correction and an absolute Mint-value
cut-off of 3 identified the most combinations without any genes deviating significantly from non-
interaction, thus being the most stringent. In contrast, an absolute Mint-value cut-off of 1 was the least
stringent as it detected deviations from non-interaction for genes in all combinations (Table 7.1). The
number of genes with a significant interaction effect varied enormously across combinations when
subjected to BH correction, with a single significant gene identified for the combination tebufenpyrad
and Aphanizomenon and 6786 genes identified for the combination carbaryl and Anabaena (Appendix
F Table F.1). The cut-off absolute Mint-value of 1 also showed large variation with 5253 genes with a
significant interaction effect for the combination of carbaryl and Anabaena and only 100 genes with a
significant interaction effect for the combination of fenoxycarb and Aphanizomenon. Confidence
interval based approaches and a cut-off absolute Mint-value of 2 showed less variation as genes with
an interaction effect varied between one and 150-300. The cut-off absolute Mint-value of 3 showed
very little variation with at most twenty genes with a significant interaction effect.
Table 7.1 Overview of the number of combinations out of a total of 48 with no significant genes (i.e. Mint
not significant) for all six approaches (Benjamini-Hochberg (BH) correction, 95% and 90% confidence
intervals (CI), absolute (abs) Mint-value cut-off of 1, 2 and 3). The minimum number, the maximum number,
mean and median of significant genes (i.e. Mint significant) across all combination for combinations with
at least one significant gene for all six approaches are shown.
BH-correction 95% CI 90% CI Abs M ≥1 Abs M ≥2 Abs M ≥
Combinations with no sig genes 13 6 1 0 1 13
Minimum number of sig genes per combination
1 1 3 100 1 1
Mean number of sig genes per combination
874 19 53 729 40 4
Median number of sig genes per combination
107 13 35 460 24 3
Maximum number of sig genes per combination
6786 157 327 5253 329 20

Combined effects of cyanobacteria and insecticides at the transcriptomic level
135
Comparing the number of genes deviating significantly from non-interaction across combinations with
the Benjamini-Hochberg correction may be biased. Indeed, the experimental design will influence the
power to detect significant genes and this may differ between studies. Although differences in
experimental design were not a concern for these experiments as they were all conducted with a
similar experimental design, other concerns do play a role. First, a gene may be differentially corrected
for multiple testing in two datasets depending upon the rank of that gene in the overall gene list and
regardless of the value for Mint (Pawiton et al., 2005). Second, statistical significance does not always
correspond with biological significance, a gene may be statistical significant with a fold change of 0.5
whereas biological significance often requires a fold change of at least 1 or 2 (Hampton and Stanton,
2010). Third, very small p-values are rare in microarray studies using biological replicates and as a
consequence multiple testing procedures may limit biological findings. These aspects are discussed
by Hampton and Stanton (2010) who re-analysed and compared microarray studies investigating
genes underlying cystic fibrosis. They concluded that integrating ANOVA analysis with less restrictive
procedures such as cut-off Mint-values that underline biological rather than statistical findings improves
the data analysis. Based upon these arguments, the Benjamini-Hochberg correction was discarded.
Distributions of the p-value of all genes for all combinations again confirmed the cut-off absolute Mint -
value of 1 as the least stringent method (Fig. 7.3). The other four methods were much more
conservative which can be seen from the small difference between the first and third quartile, resulting
in a very “flat” box Fig. 7.3). The length and density of the whiskers do indicate some differences
between the methods that were less pronounced (Fig. 7.3). Evaluation of the boxplots of the
Benjamini-Hochberg corrected p-values confirmed that this correction was too conservative and would
exclude important biological findings, i.e. quite a number of genes with no 95% overlapping confidence
intervals obtained a BH-corrected p-value larger than 0.05. Density plots of the Mint-value of all genes
for all combinations supported these conclusions although they did highlight the very restrictive
approach of an absolute Mint-value cut-off of 3 resulting in a skewed density plot (Fig. 7.4). Taking into
account the observations made concerning Table 7.1, the absolute Mint-value cut-offs of 1 and 3 were
discarded as less suitable methods: the first for being not restrictive enough, the second for being too
restrictive.

Chapter 7
136
Figure 7.3 Boxplots of the p-values (left) and the Benjamini-Hochberg corrected-values (right) of all genes
for all combinations for each of the five filtering methods.
Absolute M-value ≥1
Absolute M-value ≥2
Absolute M-value ≥
90% Confidence Interval
95% Confidence Interval
P-v
alu
e
P-v
alu
e
P-v
alu
e
P-v
alu
e
P-v
alu
e

Combined effects of cyanobacteria and insecticides at the transcriptomic level
137
Figure 7.4 Density plots of all the Mint-values for all combinations for each of the five remaining filtering
methods. (Abs=Absolute, CI=Confidence Interval).
Based upon the results in Table 7.3, Fig. 7.3 and 7.4, three of the six filtering methods were excluded
from further research. Of the three remaining methods, i.e. absolute Mint-value cut-off of 2, confidence
intervals of 90 and 95%, not one could be selected above the other two or discarded in favour of the
other two based upon the results presented here.
Abs M ≥
Abs M ≥2 Abs M ≥1
CI:90% CI:95%
Mint Mint
Mint Mint
Mint
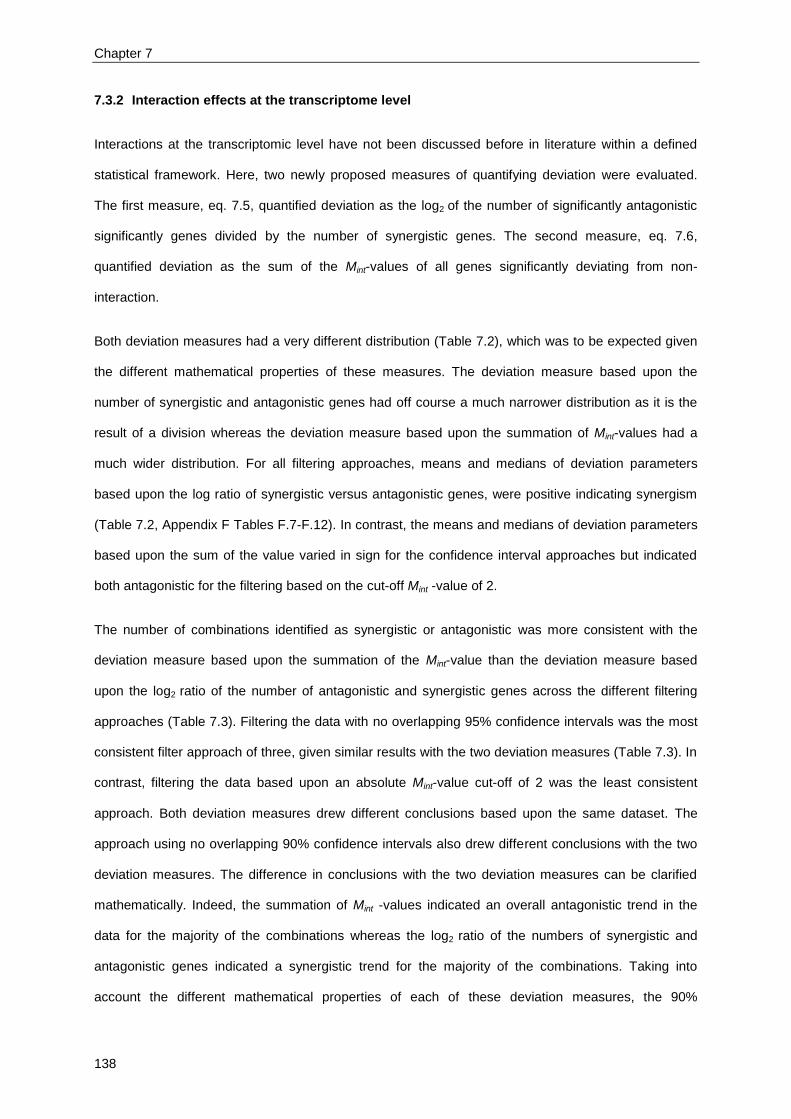
Chapter 7
138
7.3.2 Interaction effects at the transcriptome level
Interactions at the transcriptomic level have not been discussed before in literature within a defined
statistical framework. Here, two newly proposed measures of quantifying deviation were evaluated.
The first measure, eq. 7.5, quantified deviation as the log2 of the number of significantly antagonistic
significantly genes divided by the number of synergistic genes. The second measure, eq. 7.6,
quantified deviation as the sum of the Mint-values of all genes significantly deviating from non-
interaction.
Both deviation measures had a very different distribution (Table 7.2), which was to be expected given
the different mathematical properties of these measures. The deviation measure based upon the
number of synergistic and antagonistic genes had off course a much narrower distribution as it is the
result of a division whereas the deviation measure based upon the summation of Mint-values had a
much wider distribution. For all filtering approaches, means and medians of deviation parameters
based upon the log ratio of synergistic versus antagonistic genes, were positive indicating synergism
(Table 7.2, Appendix F Tables F.7-F.12). In contrast, the means and medians of deviation parameters
based upon the sum of the value varied in sign for the confidence interval approaches but indicated
both antagonistic for the filtering based on the cut-off Mint -value of 2.
The number of combinations identified as synergistic or antagonistic was more consistent with the
deviation measure based upon the summation of the Mint-value than the deviation measure based
upon the log2 ratio of the number of antagonistic and synergistic genes across the different filtering
approaches (Table 7.3). Filtering the data with no overlapping 95% confidence intervals was the most
consistent filter approach of three, given similar results with the two deviation measures (Table 7.3). In
contrast, filtering the data based upon an absolute Mint-value cut-off of 2 was the least consistent
approach. Both deviation measures drew different conclusions based upon the same dataset. The
approach using no overlapping 90% confidence intervals also drew different conclusions with the two
deviation measures. The difference in conclusions with the two deviation measures can be clarified
mathematically. Indeed, the summation of Mint -values indicated an overall antagonistic trend in the
data for the majority of the combinations whereas the log2 ratio of the numbers of synergistic and
antagonistic genes indicated a synergistic trend for the majority of the combinations. Taking into
account the different mathematical properties of each of these deviation measures, the 90%

Combined effects of cyanobacteria and insecticides at the transcriptomic level
139
confidence interval filtering and the absolute Mint -value cut-off of 2 seemed to select more genes with
a positive Mint-value than a negative Mint-value. However, the majority of these genes with a positive
sign seemed to have a rather small M-value whereas the genes with a negative sign seemed to have
larger M-values.
Table 7.2 Overview of the minimum, mean, median and maximum deviation across all 48 combinations for
the two deviation measures per filtering approach, based upon the results in Appendix F Tables F.7-F.12.
Deviation measure: (
) ∑
Filtering approach: Min Mean Median Max Min Mean Median Max
95% Confidence Interval -5.26 0.68 0.34 5.67 -115 -3.93 3.87 302
90% Confidence Interval -4.52 0.76 0.10 6.77 -207 0.85 -8.09 483
Absolute Mint -value equal or larger than 2 -5.78 1.3 0.85 5.78 -578 -30.7 -12.1 283
Table 7.3 Overview of the number of antagonistic and synergistic combinations for each deviation
measure per filtering approach, based upon the results in Appendix F Tables F.7-F.12.
Deviation measure: (
) ∑
Filtering approach: Antagonistic combinations
Synergistic combinations
Antagonistic combinations
Synergistic combinations
95% Confidence Interval 34 5 30 12
90% Confidence Interval 18 28 30 17
Absolute Mint -value equal or larger than 2 10 34 36 11
Overall, the approach of no overlapping 95% confidence intervals and the deviation parameter based
upon the sum of the Mint-values seemed to be the most consistent approaches and these were used
together for further analysis. The synergistic combinations, i.e. 12 combinations (25%) were scattered
across the matrix with the most severe ones being Anabaena and carbaryl and Oscillatoria and
fenoxycarb (Table 7.4). Four out of the twelve synergistic combinations were combinations with
Oscillatoria. The most severe antagonistic combinations were Oscillatoria and tetradifon and
Cylindrospermopsis and endosulfan. The distribution of the deviation parameter (Table 7.4), defined in
eq. 7.6, was not significantly different between combinations with different cyanobacteria (p=0.85) or
between combinations with different insecticides (p=0.78). This indicates that differences between
cyanobacteria alone or differences between insecticides alone did not explain the presence or
absence of genes with an interaction effect.

Chapter 7
140
Table 7.6 Deviation from non-interaction as defined by equation 7.6, i.e. sum of the M-values of the
significant genes deviating from non-interaction. Significance at the gene level was determined by the p-
value, i.e. smaller than 0.05, and the absolute Mint-value, i.e. larger than 2. The darker the red, the more
synergistic the deviation is. The darker the green, the more antagonistic, the observed deviation is.
Anabaena Aphanizomenon Cylindrospermopsis Microcystis Nodularia Oscillatoria
Acetamiprid -10.6 0 -28.2 -10.6 -7.17 9.21
Carbaryl 99.4 -1.23 -16.8 0.07 -5.45 -57.4
Chlorpyrifos -52.7 8.57 -1.10 0.71 0 -35.0
Deltamethrin 0 -16.9 1.84 -3.29 0 17.5
Endosulfan 0 -9.61 -91.2 -0.68 -32.4 21.6
Fenoxycarb -8.12 3.83 -4.45 -19.1 -14.5 302
Tebufenpyrad 14.8 -1.90 -45.9 0 -32.9 -7.53
Tetradifon -0.05 -26.7 -28.2 23.9 -7.59 -115
The behavior of the genes with a significant interaction effect was represented in interaction plots (Fig.
7.5, based on De Coninck et al., 2014) for the most abundant patterns covering around 70% of the
genes with an interaction effects. All other patterns can be found in Appendix F Fig. F.1-F.2. Figure 7.5
clearly indicates that these genes can have very distinct patterns. Furthermore, the current
interpretation generally used in life history experiments of synergism and antagonism seemed
insufficient to fully explain the diversity of patterns here. Indeed, the antagonistic pattern (Fig. 7.5 D)
and the third synergistic pattern (Fig. 7.5 G) genes were each other’s mirror image, yet they were
defined differently. An alternative would be to compare absolute observed and predicted Mint-values
instead. Although this would classify the current patterns with the same terminology, it may still be
insufficient to really address the complexity of the effects. For example, in the antagonistic interaction
plot in Fig. 7.5 C, the predicted effect was positive but smaller in absolute value than the observed
effect which was negative. Using the actual Mint-values will classify this as antagonistic, whereas using
absolute values will result in a synergistic effect. Yet, both terminologies seem insufficient as the
pattern is clearly different from the other patterns which indicated more ‘obvious’ synergisms or
antagonisms such the antagonistic interaction plot (Fig. 7.5 B) or the synergistic plot (Fig. 7.5 F).
Defining synergisms and antagonisms at the gene level is therefore not recommended with the current
terminology which was inadequate to describe all patterns properly.

Combined effects of cyanobacteria and insecticides at the transcriptomic level
141
A B
C D
E F
G H

Chapter 7
142
Figure 7.5 Interaction plots for genes with an interaction effect upon cyanobacterium exposure (presence
vs. absence) under no insecticide (solid line), addition of the insecticide (dash-dot line) and predicted
addition of the insecticide (dashed line). Arrows indicate the difference in expression level between
observed and predicted expression of the significant genes. Green arrows indicate antagonism, red
arrows indicate synergism. Horizontal axis intersects vertical axis at no differential expression. For
instance, in the top left panel, genes are not significantly regulated upon exposure to a cyanobacterium
and also upon exposure to an insecticide alone. The predicted expression level under exposure of
insecticide and a cyanobacterium is no regulation whereas in reality the genes are being downregulated
upon exposure to both. Observed expression is more negative than the predicted expression and
antagonism can be concluded. Numbers indicate the number of genes showing the particular expression
pattern.
7.3.3 Functional analysis and annotation of genes with an interaction effect
Transcriptomic analysis of section 7.3.2 revealed 812 genes demonstrating an interaction effect of
which 558 were unique to a single combination (Fig. 7.6) with 95% confidence interval filtering
approach. Thirteen genes were present in at least five combinations of which two genes were present
in 10 and 13 combinations respectively (Appendix F Table F.13). Thirty-five out of 141 genes were
classified in some combinations as synergistic but showed clear antagonistic effects in other
combinations (Appendix F Table F.14). Functional analysis of the 812 genes with an interaction effect
revealed a diverse set of metabolic functions (Fig. 7.7), including oxidative phosphorylation, fatty acid
elongation and biosynthesis, energy metabolism.
The 95% confidence interval filtering approach was the most consistent across all combinations but
does not fully guarantee the lack of false positives. This is especially a concern when looking at
individual genes. Therefore, the BH-corrected p-value of these 812 genes demonstrating an
interaction effect was evaluated. 115 genes had a BH-corrected p-value larger than 0.05 of which 64
had a BH-corrected p-value of 0.1. Of the 115 genes with a BH-corrected p-value larger than 0.05, 80
genes occur multiple times in the total set of 812 genes and have a BH-corrected p-value smaller than
0.05 in the majority of the combinations. Only 23 genes occur only once and thus have always a BH-
corrected p-value larger than 0.05. Only 6 genes occur twice with a BH-corrected p-value larger than
0.05. This is means that only 29 unique genes can be a false positive whereas all other 529 unique
genes are truly interacting for at least one combination at the 5% significance level.

Combined effects of cyanobacteria and insecticides at the transcriptomic level
143
Significant overrepresentation of genes with an interaction effect was observed in pathways related to
nutritional quality and detoxification (Table 7.5). The same results were obtained when analysis was
performed with or without the duplicated genes. Enrichment analysis of functional annotations
identified genes with functions such as trypsins, cytochrome P450, transcription factors and ribosomal
proteins (Table 7.6, Fig. 7.7). The functional annotation definition “NA”, indicating lineage-specific
genes, was the only definition significantly underrepresented than expected by genes with an
interaction effect. Analysis without the 115 genes with a BH-corrected p-value resulted in the same
conclusions for all pathways in Table 7.5 and the majority of the annotation definitions in Table 7.6.
Three definitions became not significant when leaving out the 115 genes with a BH-corrected p-value
larger than 0.05. Xaa-Pro aminopeptidase and Glycosylphosphatidylinositol anchor synthesis protein
both only had a single gene demonstrating an interaction effect when excluding the 115 genes which
resulted in a p-value of 0.07 and 0.10 respectively. Also, excluding the 115 genes resulted in only
eight trypsins with an interaction effect which lead to p-value 0.15.
Figure 7.6 Histogram of the number of combinations for which a gene was determined as having a
significant interaction effect.
Num
ber
of
genes
Number of combinations per gene
1 2 3 4 5 6 7 8 9 10 11 12 13

Chapter 7
144
Figure 7.7 Metabolic pathway map from KEGG database (http://www.genome.jp/kegg-bin/show_pathway?map01100) modified with all 812 genes with an interaction
effect, denoted in red. This figure gives a general overview of the entire metabolic pathway map and the red lines denote how many pathways contain genes with
an interaction effect without specifically highlighting any particular pathway.
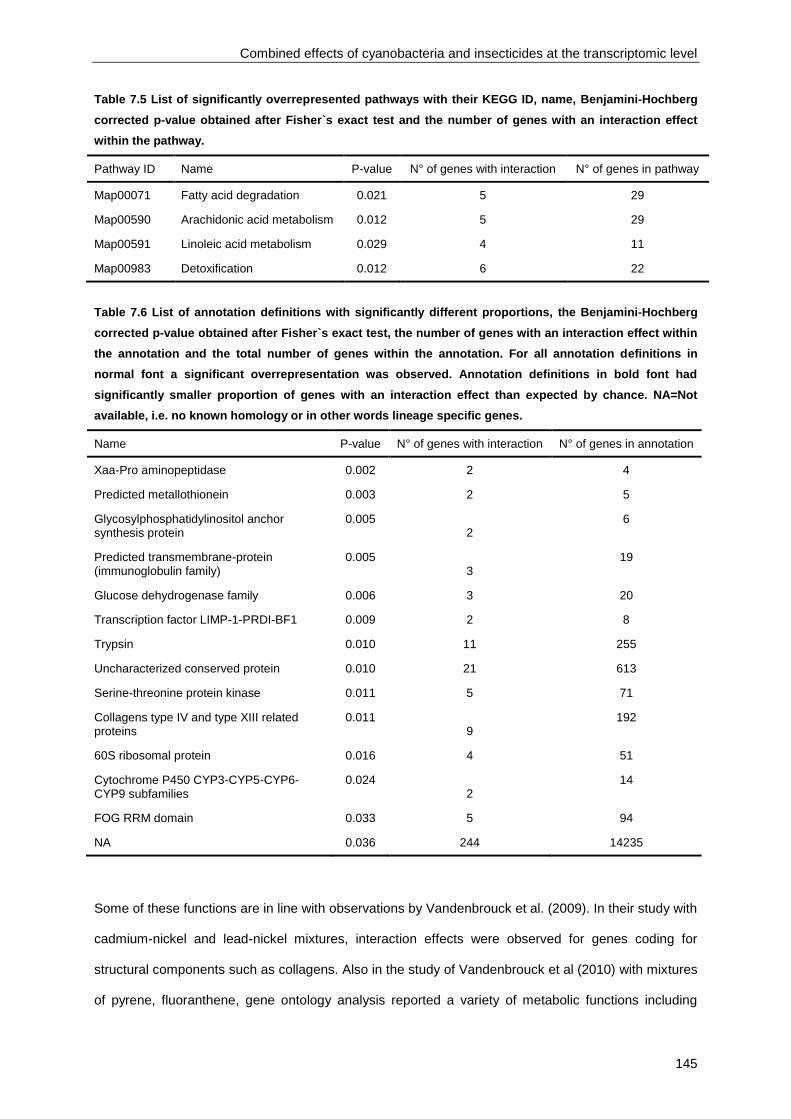
Combined effects of cyanobacteria and insecticides at the transcriptomic level
145
Table 7.5 List of significantly overrepresented pathways with their KEGG ID, name, Benjamini-Hochberg
corrected p-value obtained after Fisher`s exact test and the number of genes with an interaction effect
within the pathway.
Pathway ID Name P-value N° of genes with interaction N° of genes in pathway
Map00071 Fatty acid degradation 0.021 5 29
Map00590 Arachidonic acid metabolism 0.012 5 29
Map00591 Linoleic acid metabolism 0.029 4 11
Map00983 Detoxification 0.012 6 22
Table 7.6 List of annotation definitions with significantly different proportions, the Benjamini-Hochberg
corrected p-value obtained after Fisher`s exact test, the number of genes with an interaction effect within
the annotation and the total number of genes within the annotation. For all annotation definitions in
normal font a significant overrepresentation was observed. Annotation definitions in bold font had
significantly smaller proportion of genes with an interaction effect than expected by chance. NA=Not
available, i.e. no known homology or in other words lineage specific genes.
Name P-value N° of genes with interaction N° of genes in annotation
Xaa-Pro aminopeptidase 0.002 2 4
Predicted metallothionein 0.003 2 5
Glycosylphosphatidylinositol anchor synthesis protein
0.005 2
6
Predicted transmembrane-protein (immunoglobulin family)
0.005 3
19
Glucose dehydrogenase family 0.006 3 20
Transcription factor LIMP-1-PRDI-BF1 0.009 2 8
Trypsin 0.010 11 255
Uncharacterized conserved protein 0.010 21 613
Serine-threonine protein kinase 0.011 5 71
Collagens type IV and type XIII related proteins
0.011 9
192
60S ribosomal protein 0.016 4 51
Cytochrome P450 CYP3-CYP5-CYP6-CYP9 subfamilies
0.024 2
14
FOG RRM domain 0.033 5 94
NA 0.036 244 14235
Some of these functions are in line with observations by Vandenbrouck et al. (2009). In their study with
cadmium-nickel and lead-nickel mixtures, interaction effects were observed for genes coding for
structural components such as collagens. Also in the study of Vandenbrouck et al (2010) with mixtures
of pyrene, fluoranthene, gene ontology analysis reported a variety of metabolic functions including
Chapter 7
146
protein localization and chitin metabolic processes. The same conclusions could be drawn from the
study by Garcia-Reyero et al. (2012) who also observed a diverse set of metabolic functions present
only in exposures to mixture of munitions constituents and not their single treatments. De Coninck et
al. (2014) observed primarily interaction effects on the ubiquinone biosynthesis, serine-threonine
protein kinases and collagens type IV and type XIII when Daphnia were exposed to both Microcystis
and cadmium. No comparisons could be made with the study by David et al. (2011) focusing on
mixtures of sodium dichromate and benzo-a-pyrene as they only investigated responses to the
mixtures without reference to effects of single stressors.
The responses found here together with those in literature indicate that genes with an interaction
effect cover a wide array of metabolic functions and are involved in a broad stress response involving
a variety of affected pathways and mechanisms. These observations were in agreement with
observations in human toxicology (Sen et al., 2007). Interaction effects therefore do not seem to occur
from specific interaction at target sites or molecular events but rather from the complex interplay of the
entire stress response in the organism. It seems therefore necessary to incorporate interactions
between genes and pathways in analysis of mixture toxicity data to really underpin the complexity of
these effects and potentially identify those that drive phenotypic effects.
7.4 Conclusion
Transcriptomic profiling of 48 mixture combinations were evaluated on a gene-by-gene basis and on a
whole transcriptome level with three different filtering approaches and two different measures of
deviation. Overall, filtering the data based upon no overlapping 95% confidence intervals between
observations and predictions and subsequently calculating the sum of Mint-values of all genes with
significant deviations from non-interaction was the most consistent approach allowing identification of
statistical and biological significant genes. Genes with a significant interaction effect across all
combinations showed a diverse pattern of expression in both synergistic and antagonistic directions.
Current terminology of synergistic and antagonistic effects seems insufficient to fully explain the
changes in expression of genes demonstrating an interaction effect. Functional analysis of these
genes revealed a diverse set of metabolic functions and pathways indicating that interaction effects
trigger a complex general stress response in the organism.

Chapter 8
Integration of transcriptomic and
organismal data to study combined
effects of cyanobacteria and
insecticides
8 x


Integration of transcriptomic and organismal data to study combined effects of cyanobacteria and insecticides
149
8.1 Introduction
Within this dissertation, chapters 2 to 4 have discussed the effects at the life history level while
chapters 5 to 7 have focused on the effects at the molecular level. Results from all these previous
chapters indicated that both life history and molecular responses cannot fully explain the complexity of
interaction effects. Therefore, this final chapter will focus on integrating all data to identify those genes
and mechanisms driving effects at life history level which in turn will aid to elucidate combined and
interaction effects.
Few studies have addressed interaction effects with an integrative approach and of those, most are
discussed in section 7.4. Yet, even less studies have fully integrated approaches at both life history
and molecular level (Altenburger et al., 2012). Often, integration of molecular and life history data is
comparative and descriptive. Indeed, most studies describe gene expression changes in pathways
and networks as potential causes of observed fitness effects yet fail to directly correlate these two
levels quantitatively. Few studies use the full potential of these two levels of biological organization to
acquire new insights. Vandenbrouck et al. (2009) integrated suborganismal responses such as energy
reserves with gene expression to understand responses to metal mixtures. Ghazalpour et al. (2006)
correlated gene expression responses with the body weight of mice using weighed gene network co-
expression analysis.
The potential benefits of integrating multiple levels of biological organization have stimulated
environmental research towards a new vision (Villeneuve and Garcia-Reyero, 2011). Current
advances in environmental science have put forward adverse outcome pathways as a molecular
framework with high potential for risk assessment. Adverse outcome pathways are frameworks
starting from molecular initiation events to a final adverse outcome at organismal level or sometimes
even at population level as described previously (section 1.3) and can be summarized as a full
integration of all levels of biological organization. Although adverse outcome pathways are becoming
increasingly popular, only few are currently being constructed (OECD, 2014). The integrative approach
in this chapter therefore hopes to identify key genes and gene networks that are driving effects at
higher levels of functional organization. Such genes may form a crucial part of any adverse outcome
pathway and help assist in further developing these frameworks and incorporating them in risk
assessment. Furthermore, by identifying mechanisms involved in interaction effects, this approach
Chapter 8
150
could pave the way for integrating interaction effects in risk assessment through new frameworks such
as adverse outcome pathways. In addition, it will also address the current limitations that need to be
improved prior to a general integration in regulatory frameworks.
8.2 Material and methods
8.2.1 Experimental design and data origin
The data used in this chapter originate from experiments discussed in chapters 4 and 7. Briefly, life
history data was obtained from the experiment and analysis described in section 4.2. Molecular data
was obtained from the experiment and analysis described in section 7.2. Explorative analysis of the
two datasets, i.e. molecular and phenotypic data, consisted of standard Pearson`s correlation tests
conducted in R (version 3.0.1) using the deviation parameter at the life history level (eq. 4.1) and the
deviation parameter at the molecular level, summation of M-values of all genes with an interaction
effect (eq. 7.5).
8.2.2 Weighted gene co-expression analysis (WGCNA)
Here all data, both molecular and life history responses, was integrated in a weighted gene co-
expression analysis (Langfelder and Horvath, 2008). The WGCNA (version 1.27-1) has been
successfully applied in vertebrate studies where it was able to correlate transcriptomic profiles with
disease signatures (Korade and Mirnics, 2011; Wang et al., 2009). The analysis was conducted
according to the general framework from Langfelder and Horvath (2008), represented in Fig. 8.1. Two
types of networks were constructed. First, all expression data of all 48 combinations for single and
combined exposures, i.e. 144(=48*3) expression profiles, were selected for the analysis. Expression
profiles consisted of the M-values as generated through Limma analysis (chapter 7) for each gene on
the array across all combinations. As recommended by Langfelder and Horvath (2008), only a subset
of the genes was selected for the construction of gene networks to avoid noise and reduce
computational requirements. For each gene, the variance across all 144 expression profiles was
calculated and the 8000 genes with the largest variance were selected for further analysis upon
recommendation by Langfelder and Horvath (2008) which in terms of data storage also corresponds to
the maximum available memory in most standard desktops. As depicted in Fig. 8.1, gene networks
were then constructed based upon the expression information in all profiles.

Integration of transcriptomic and organismal data to study combined effects of cyanobacteria and insecticides
151
Figure 8.1 Analysis pipeline for weighted gene co-expression networks (From Langfelder and Horvath
BMC Bioinformatics 2008, 9:559).
The WGCNA searches for and identifies clusters of highly correlated genes after network construction.
In particular, gene networks can be represented as follows according to Langfelder and Horvath
(2008):
[ ] (
) (eq. 8.1)
In eq. 8.1 X represents an n x m matrix representing n nodes i=1,…, n) or genes and m samples or
treatments (k=1,.., m). Co-expression is then defined by the absolute correlation coefficient between
the expression profiles (all Mtreatment/control values of node i across all m treatments) of node i and node
i+1, here gene i and gene i+1(=j) (Langfelder and Horvath, 2008):
( ) (eq. 8.2)

Chapter 8
152
Genes are then clustered into modules based upon the adjacency a between genes i and gene j and
is defined as follows (Langfelder and Horvath, 2008):
(eq.8.3)
In eq. 8.3 β is the soft thresholding power selected based upon the scale free topology criterion,
generally used to describe biological networks (Zhang and Horvath, 2005). β is defined as a soft
threshold as it is a continuous parameter rather than a binary parameter which is defined as a hard
threshold. Indeed, a hard threshold would require the correlation coefficient between two genes to
cross a certain specified threshold after which the two genes would be correlated. However, gene
expression and correlation is not a black and white call but rather a continuous parameter which
expresses the degree of correlation between two genes which in turn is represented by the soft
thresholding power. The selection of the soft thresholding power based upon the scale free topology
criterion is illustrated in Figure 8.2. Indeed, the lowest soft thresholding power was selected for which
the curve in Figure 8.2 flattens after reaching a high value as the higher the value the lower the mean
connectivity of the network and the higher the computational requirements. In Figure 8.2, a soft
thresholding power of 16 and 24 would have been the most appropriate for the left and right plot
respectively.
Figure 8.2 The scale free topology fit for various soft thresholding powers. The line intersects at a scale
free topology fit of R2=0.8 in the left figure and at a scalfe free topology fit of R
2=0.9 in the right figure.

Integration of transcriptomic and organismal data to study combined effects of cyanobacteria and insecticides
153
After construction of the adjacency matrix for all genes, clustering is used to cluster genes into
modules. Several clustering methods are available within the WGCNA package. Here, the default
method was used, which is average linkage hierarchical clustering using the standard R function
hclust. Thus, branches of the dendogram generated with hierarchical clustering correspond to the
modules. Within the hierarchical clustering, the function dynamic tree cut is used which implements a
variable cut height value and subsequently re-examines the clusters and potentially re-assigns
clusters. Afterwards, modules whose eigengenes are highly correlated are merged. The expression
profile of each module can then be defined by the eigengene of the module which is defined within the
WGCNA package as the first principal component of the expression matrix of the module. Here, a soft
thresholding power was used, rather than a hard thresholding power, so the module membership of a
gene was fuzzy measure rather than a binary measure:
( ) (eq. 8.4)
Where xi is the expression profile of gene i (columvector with m columns) and E the eigengene of
module q (column vector with m columns) and the module membership K lies thus within [-1, 1] and
specifies how close gene i is to module q.
Afterwards, the generated gene network consists of modules of highly connected genes that can be
correlated with external information. Here, external information consisted of the reproductive output
relative to a control per treatment, averaged across biological replicates, and the deviation parameter
as defined in eq. 4.1 and represented in Table 4.4 for deviations at life history level, i.e. mixture
interaction effect. Correlation with external traits is defined as the gene significance GS:
( ) (eq. 8.5)
In which GS is the gene significance of gene i, xi the expression profile of gene i and T the external
information, e.g. reproduction data. The statistical significance of the GS measure for gene i is defined
by the p-value of the Pearson correlation test. Eq. 8.5 can also be modified to determine the module
significance, i.e. correlation between a module and the trait of interest in which xi then represents the
expression profile of the eigengene.

Chapter 8
154
Second, all expression profiles for the mixture data, i.e. 48 profiles, were used for network
construction. Again, a subset of genes was selected. Due to a much smaller dataset than above, no
selection criterion was necessary as the use of all genes was not limited by computational
requirements. Again, based on the gene list, here containing all genes, gene networks were
constructed and were correlated with external information after construction. The same external
information was related to the gene networks, i.e. reproductive output and deviation at life history level.
In both networks, the identified key modules, i.e. modules that correlated significantly with the
reproductive output or with the deviation at life history level, were analyzed for overrepresentation of
pathways, paralog clusters and functional annotations as described in section 5.2.5. Additionally, for
each significant module, gene significance and module membership were correlated for all genes in
the module. A significant positive correlation indicates that genes with high absolute gene significance
also have a high absolute module membership. In other words, genes that are highly correlated with
the trait of interest are also the most important genes in the network, i.e. hub genes. Langfelder and
Horvath (2008) define these genes as highly interconnected genes and such genes are often
representatives of the modules they were assigned to, described as key drivers, based upon eq. 8.4.
Here, for each module, hub genes were selected based upon Langfelder and Horvath (2008) as the
10 genes with the highest module membership defined through eq. 8.4. Modules were visualized with
Cytoscape by using their hub genes (Cline et al., 2007).
8.3 Results and discussion
Simpler models are often preferred to complex networks in any analysis due to ease of interpretation
and data requirements. Yet, no significant correlation was observed between the suggested deviation
measure which sums the Mint-values of all genes with a significant interaction effect, (eq. 7.6, Table
7.4) at the transcriptomic level, and the deviation from non-interaction at the life history level (eq. 4.1,
Table 4.4), defined as the difference between the log transformed predicted and observed effects on
reproduction (Fig. 8.3). Clearly, deviations at the transcriptional level as defined in section 7.2.5 did not
sufficiently explain deviations at the life history level and more appropriate parameters need to be
identified. The lack of correlation could have two different causes. First, the developed measure at the
transcriptomic level might not have been appropriate to quantify deviations at transcriptomic level that
are indicative of deviations from non-interaction at life history level. Second, transcriptomic information
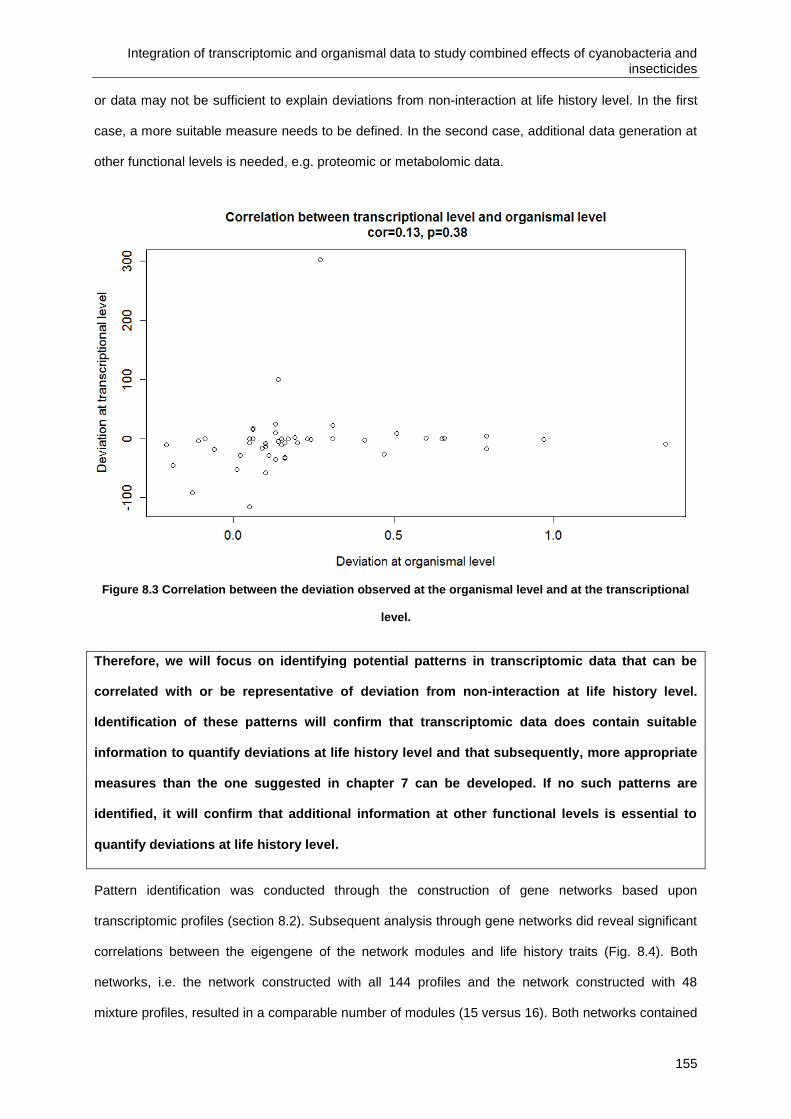
Integration of transcriptomic and organismal data to study combined effects of cyanobacteria and insecticides
155
or data may not be sufficient to explain deviations from non-interaction at life history level. In the first
case, a more suitable measure needs to be defined. In the second case, additional data generation at
other functional levels is needed, e.g. proteomic or metabolomic data.
Figure 8.3 Correlation between the deviation observed at the organismal level and at the transcriptional
level.
Therefore, we will focus on identifying potential patterns in transcriptomic data that can be
correlated with or be representative of deviation from non-interaction at life history level.
Identification of these patterns will confirm that transcriptomic data does contain suitable
information to quantify deviations at life history level and that subsequently, more appropriate
measures than the one suggested in chapter 7 can be developed. If no such patterns are
identified, it will confirm that additional information at other functional levels is essential to
quantify deviations at life history level.
Pattern identification was conducted through the construction of gene networks based upon
transcriptomic profiles (section 8.2). Subsequent analysis through gene networks did reveal significant
correlations between the eigengene of the network modules and life history traits (Fig. 8.4). Both
networks, i.e. the network constructed with all 144 profiles and the network constructed with 48
mixture profiles, resulted in a comparable number of modules (15 versus 16). Both networks contained

Chapter 8
156
modules that significantly correlated with the life history traits, i.e. reproduction and deviation from non-
interaction (Fig. 8.4). More and stronger correlations were observed for the network developed based
on 48 mixture profiles and the reproductive output than for the network developed based on all 144
profiles and the reproductive output. Only one module correlated significantly with reproductive output
in the network developed based on 144 profiles (Fig. 8.4). In contrast, no significant correlations with
the deviation from non-interaction at life history level were observed for the network with 48 mixture
profiles whereas several modules of the network with all 144 profiles did correlate significantly with this
life history parameter (Fig. 8.4).
Overall, this pattern demonstrated that expression of genes in profiles of exposure to single stressors
is necessary in addition to expression of genes in the mixture profiles to identify factors driving
interaction. Indeed, only the network profile containing both single and mixture profiles contained
modules significantly correlated with deviation from non-interaction at life history. In contrast, no
module of the network without these single stress profiles and only the mixture profiles correlated
significantly with interaction at life history. Further study should focus on determining whether these
driving factors can also be identified based upon expression profiles of single stressors alone. If this
would be the case, expression profiles may serve as a basis for predictive models regarding mixture
toxicity. The present study did not allow building such gene networks only with single stressor profiles
given that there were only fourteen single stressors available which is a too small number to build
reliable gene networks. Indeed, due to the size of the data, a limited number of profiles often require a
high soft thresholding power (Langfelder and Horvath, 2006). However, the higher the soft
thresholding power, the higher computational requirement needed to construct weighted gene
networks. At present, the 48 profiles required a soft thresholding power of 24 which is close to the
upper limit of current computational requirements and algorithms programmed within the WGCNA
package.
Gene network analysis was able to identify significant correlations between network modules
and life history traits, i.e. deviation from non-interaction and the reproductive output relative to
control. Information on the expression profile of the individual stressor in addition to the
mixture expression profile seems crucial in identifying gene modules that correlate with
deviations from non-interaction.

Integration of transcriptomic and organismal data to study combined effects of cyanobacteria and insecticides
157
Network based on all profiles Network based on mixture profiles
Module Reproduction Interaction Module Reproduction Interaction
MEBrown 0.17 (0.04) -0.25 (0.033) MEBrown 0.37 (0.01) -0.24 (0.1)
MEyellow 0.16 (0.05) -0.1 (0.2) MEturqouise 0.083 (0.6) 0.09 (0.6)
MEcyan -0.01 (0.9) -0.07 (0.3) MEyellow 0.31 (0.03) -0.1 (0.5)
MEred -0.11 (0.2) 0.03 (0.7) MEmagenta 0.22 (0.1) -0.09 (0.5)
MEpink -0.15 (0.07) -0.07 (0.4) MEtan 0.3 (0.04) -0.17 (0.3)
MEblack -0.02 (0.8) -0.3 (2e-04) MEpink -0.28 (0.05) 0.16 (0.3)
MEblue 2e-04 (1) -0.16 (0.05) MEsalmon -0.59 (1e-05) 0.28 (0.06)
MEgreenyellow -0.01 (0.9) 0.15 (0.07) MEcyan -0.04 (0.8) 0.17 (0.2)
MEsalmon 0.11 (0.2) 0.26 (0.002) MEgreenyellow 0.05 (0.8) 0.23 (0.1)
MEmagenta -0.1 (0.2) 0.09 (0.3) MEgreen -0.14 (0.4) 0.22 (0.1)
MEgreen -0.16 (0.06) 0.26 (0.002) MEpurple -0.1 (0.5) 0.07 (0.68)
MEpurple -0.15 (0.08) 0.18 (0.03) MEblack -0.26 (0.08) 0.04 (0.8)
MEtan 0.09 (0.3) -0.17 (0.06) MEred -0.27 (0.06) -0.09 (0.6)
MEturquoise 0.04 (0.6) 0.08 (0.3) MEblue -0.11 (0.4) -0.14 (0.4)
MEgrey -0.09 (0.3) 0.22 (0.009) MEmidnightblue -0.36 (0.01) -0.12 (0.4)
MEgrey 0.05 (0.7) 0.11 (0.5)
Figure 8.4 Heatmap of the modules (ME) within the gene network developed based on all expression data
(left) and the network developed based on only the mixture data (right) and their correlation with external
traits, reproduction at life history level (labelled Reproduction) and deviation from non-interaction
(labelled Interaction). For each module-trait combination in each network, the correlation value is
represented with the corresponding p-value between brackets. Significant correlations are printed in
bold. The more negative the correlation coeficient, the darker the green, the more positive the correlation
coefficient the darker the red.
For each network five to six modules were significantly correlated with reproduction or deviation from
non-interaction at life history level and these modules were then selected for functional analysis.
Modules size differed largely between the different modules and different networks (Table 8.1).
Modules with colors green, midnightblue, purple, salmon and tan were too small for functional analysis
and were therefore not included in the functional analysis.

Chapter 8
158
Table 8.1 List of modules significantly correlated with external traits and the number of genes in each of
these modules as well as the network they belong to.
Module Color N° of genes Network Module Color N° of genes Network
Brown 1020 All profiles Brown 1625 Mixture profiles
Black 123 All profiles Midnightblue 31 Mixture profiles
Salmon 48 All profiles Salmon 57 Mixture profiles
Green 479 All profiles Yellow 1338 Mixture profiles
Grey 1541 All profiles Tan 57 Mixture profiles
Purple 64 All profiles
In the network with all expression profiles, modules brown, green and grey were significantly
correlated with deviations from interaction on life history. In all modules, genes related with the amino
acid metabolism were overrepresented as well as lineage specific genes (Table 8.2, Table 8.3). The
brown and grey modules also contained genes in relation with signal transduction, i.e. G protein
coupled receptors, and histones, structural components of chromatin, MAPK signaling. In contrast, the
green module contained genes related to hormone biosynthesis, transcription and proteolysis. The
grey module contained genes related to digestion such as trypsins and genes with a still unknown
function in Daphnia such as Neurexin IV and speckle-type POZ (pox virus and zinc finger) proteins
(Bardwell and Treisman, 1994).
Table 8.2 List of significantly overrepresented pathways with their KEGG ID in modules of the gene
network based on all 148 expression profiles. The Benjamaini-Hochberg corrected p-value obtained after
Fisher`s exact test, the number of module genes belonging to each pathway and the color of the module
are shown.
Pathway ID Name P-value N° of module genes Module Color
Map00620 Pyruvate metabolism 0.021 6 Brown
Map00350 Tyrosine metabolism 0.024 11 Brown
Map00340 Histidine metabolism 0.014 6 Green
Map03022 Basal transcription factors 0.0010 4 Green
Map00260 Glycine, serine and threonine metabolism 0.017 5 Green
Map00520 Amino sugar and nucleotide sugar metabolism 0.038 6 Green
Map00981 Insect hormone biosynthesis 0.046 5 Green
Map00340 Histidine metabolism 0.017 14 Grey
Map04010 MAPK Signalling 0.003 7 Grey
Map04916 Melanogenesis 0.004 7 Grey

Integration of transcriptomic and organismal data to study combined effects of cyanobacteria and insecticides
159
Table 8.3 Number of module genes in functional annotations significantly overrepresented with module
genes of the gene network based all 144 expression profiles together with the Benjamini-Hochberg
corrected p-value from Fisher`s exact test and the color of the module.
Annotation defintion P-value N° of module genes Module color
NA ( no functional annotation available) 8.77 e-09 401 Brown
Uncharacterized conserved protein 6.95 e-05 41 Brown
Histone H4 0.0029 4 Brown
G-protein coupled receptors 0.013 5 Brown
NA ( no functional annotation available) 0.0049 200 Green
E3 ubiquitin-ligase 0.016 3 Green
NA ( no functional annotation available) 3.70 e-08 637 Grey
Speckle type POZ proteins 0.002 17 Grey
Trypsin 0.010 23 Grey
Neurexin IV 0.014 7 Grey
FOG-7 Transmembrane receptor 0.015 15 Grey
Chitinase 0.023 14 Grey
The brown, the green and the grey module correlated all significantly with the deviation from non-
interaction at life history level but in the opposite direction. In other words, the green and the grey
module correlated positively, meaning that changes in gene expression correlate positively with
changes in deviation from non-interaction. The brown module, in contrast, correlated negatively,
meaning that changes in gene expression correlated negatively with changes in deviations from non-
interaction. In terms of functional annotation, these results indicated that expression changes of genes
involved in hormone biosynthesis, transcription, digestion as well as proteolysis correlated positively
with changes in the deviation from non-interaction at life history level. However, expression changes in
genes involved in the energy metabolism, tyrosine metabolism as well as chromatin structure
correlated negatively with changes in deviation of interaction but correlated positively with changes in
the reproduction of the organism, given the significant correlation of the brown module with
reproduction.
In addition to the functional analysis, genes within all significantly correlated modules were analyzed
for potential correlations between gene significance and module membership. This was particularly
interesting for modules which are too small in size for a functional analysis. Indeed, positive significant
correlation indicates that genes have both high gene significance as well as a high module

Chapter 8
160
membership, indicating that the genes with the highest correlation with the trait of interest are also the
most important genes in the modules, i.e. hub genes. The green, grey and purple modules did not
have significant correlations between gene significance and module membership (Fig. 8.5 E, F, G)
whereas a high significant correlation was observed in the black and salmon modules (Fig. 8.5. C, D).
In the brown module, gene significance correlated significantly although the correlation value was not
very high with module membership for both traits, i.e. reproduction and deviation from non-interaction
(Fig. 8.5 A, B).
A
B
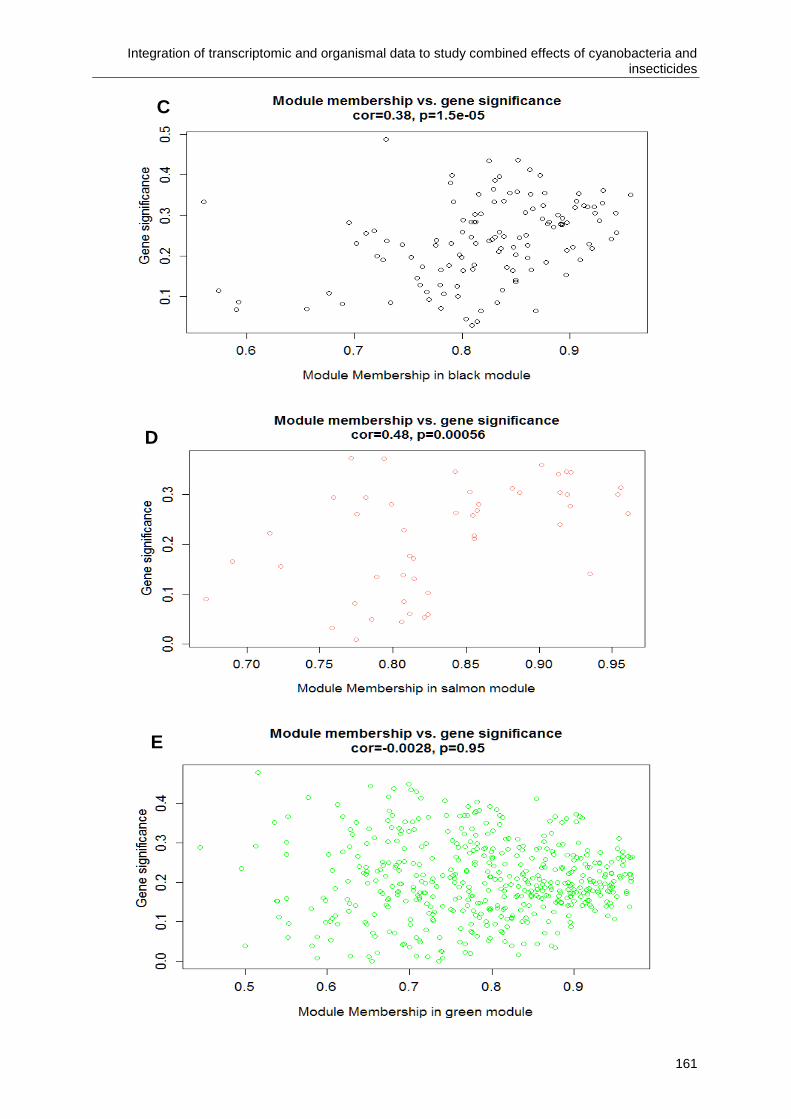
Integration of transcriptomic and organismal data to study combined effects of cyanobacteria and insecticides
161
C
D
E
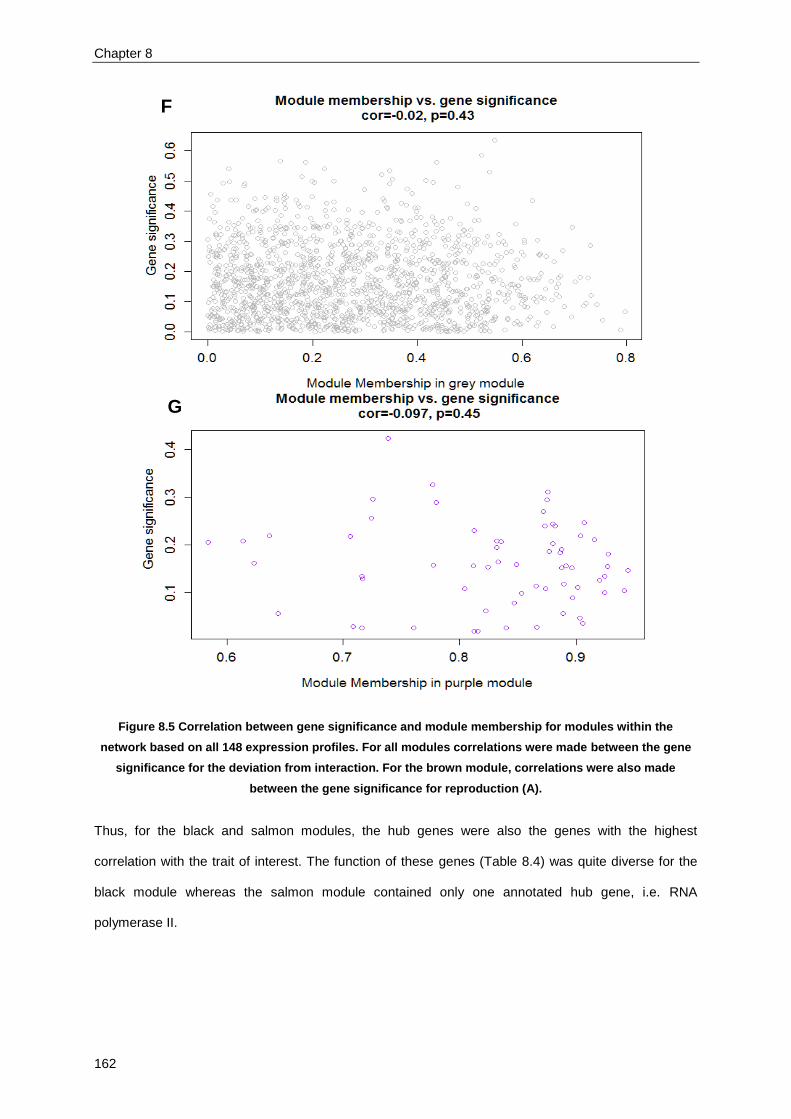
Chapter 8
162
Figure 8.5 Correlation between gene significance and module membership for modules within the
network based on all 148 expression profiles. For all modules correlations were made between the gene
significance for the deviation from interaction. For the brown module, correlations were also made
between the gene significance for reproduction (A).
Thus, for the black and salmon modules, the hub genes were also the genes with the highest
correlation with the trait of interest. The function of these genes (Table 8.4) was quite diverse for the
black module whereas the salmon module contained only one annotated hub gene, i.e. RNA
polymerase II.
F
G

Integration of transcriptomic and organismal data to study combined effects of cyanobacteria and insecticides
163
Table 8.4 Functional annotation of the ten most connected genes or hub genes in the black and salmon
modules of the network based on all 148 expression profiles. NA= no functional annotation available, i.e.
lineage specific gene.
Module Gene_id Functional Annotation
Black JGI_V11_118253 Nucleolar GTPase-ATPase p130
Black JGI_V11_114513 NA
Black JGI_V11_249001 RNA polymerase II
Black JGI_V11_109902 RNA polymerase II
Black JGI_V11_186885 NA
Black JGI_V11_299612 Golgi integral membrane protein
Black JGI_V11_209116 Protein-tyrosine sulfotransferase TPST1-TPST2
Black JGI_V11_122224 Transcription factor containing C2HC-type Zn finger
Black JGI_V11_196799 Predicted NAD synthase contains CN-hydrolase domain
Black JGI_V11_232534 NA
Salmon JGI_V11_242810 NA
Salmon JGI_V11_234827 RNA polymerase II
Salmon JGI_V11_306978 NA
Salmon JGI_V11_266550 NA
Salmon JGI_V11_308817 NA
Salmon JGI_V11_329725 NA
Salmon JGI_V11_261759 NA
Salmon JGI_V11_331152 NA
Salmon JGI_V11_310096 NA
Salmon JGI_V11_263306 NA
A visual representation of the significant gene modules by using the hub genes of each of these
modules revealed some interesting features (Fig. 8.6). First, hub genes of the purple and the green
gene network were interconnected with the genes in each of these respective modules but also with
each other. The hub genes in the salmon, black and brown modules were only connected with the hub
genes within their own module. In contrast, the grey module had few connections between its hub
genes and some hub genes were not even connected with each other. Also six of the ten hub genes
overlapped in their network topology two by two which was why only seven hub genes were
represented. This suggests that the hub genes of the grey module were each extremely
interconnected with other groups of genes within the grey module and not with other hub genes.
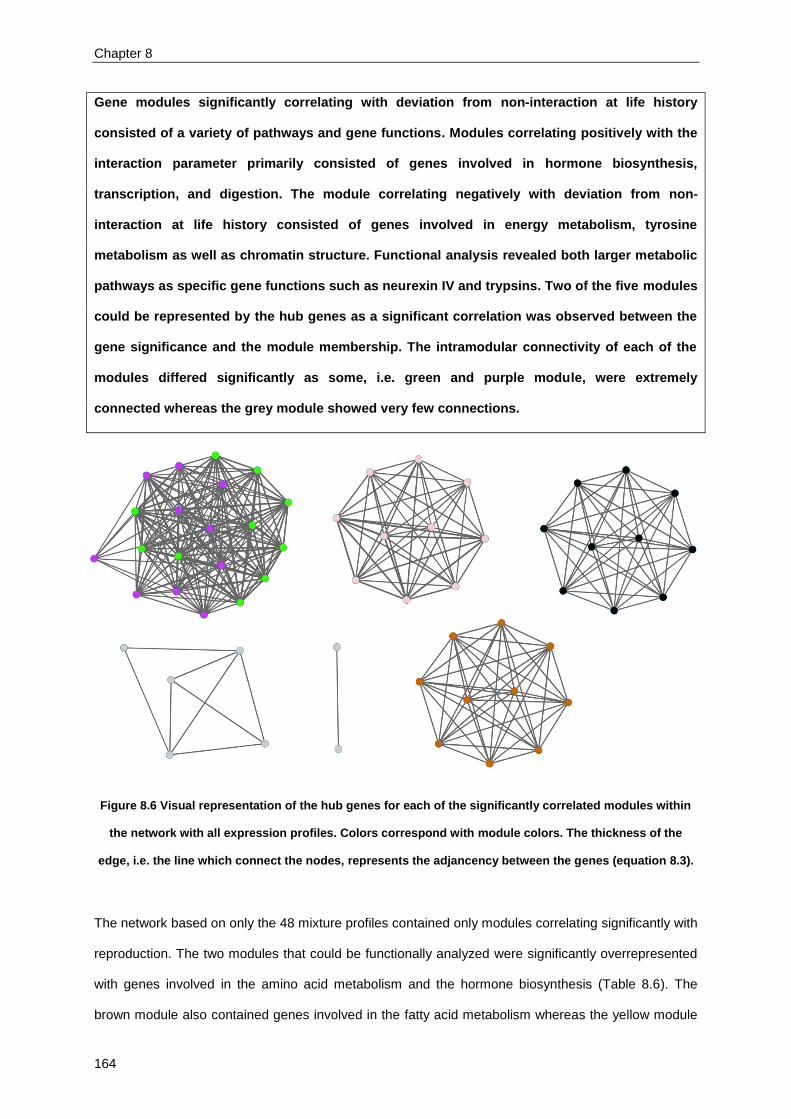
Chapter 8
164
Gene modules significantly correlating with deviation from non-interaction at life history
consisted of a variety of pathways and gene functions. Modules correlating positively with the
interaction parameter primarily consisted of genes involved in hormone biosynthesis,
transcription, and digestion. The module correlating negatively with deviation from non-
interaction at life history consisted of genes involved in energy metabolism, tyrosine
metabolism as well as chromatin structure. Functional analysis revealed both larger metabolic
pathways as specific gene functions such as neurexin IV and trypsins. Two of the five modules
could be represented by the hub genes as a significant correlation was observed between the
gene significance and the module membership. The intramodular connectivity of each of the
modules differed significantly as some, i.e. green and purple module, were extremely
connected whereas the grey module showed very few connections.
Figure 8.6 Visual representation of the hub genes for each of the significantly correlated modules within
the network with all expression profiles. Colors correspond with module colors. The thickness of the
edge, i.e. the line which connect the nodes, represents the adjancency between the genes (equation 8.3).
The network based on only the 48 mixture profiles contained only modules correlating significantly with
reproduction. The two modules that could be functionally analyzed were significantly overrepresented
with genes involved in the amino acid metabolism and the hormone biosynthesis (Table 8.6). The
brown module also contained genes involved in the fatty acid metabolism whereas the yellow module

Integration of transcriptomic and organismal data to study combined effects of cyanobacteria and insecticides
165
contained genes related to steroid synthesis (Table 8.5, Table 8.6). Analysis of overrepresentation of
functional annotations also revealed a high proportion of lineage specific genes (Table 8.6).
Table 8.5 List of pathways with their KEGG ID significantly overrepresented with genes of the modules of
the gene network based on only the 48 mixture profiles. The Benjamini-Hochberg corrected p-value
obtained after Fisher`s exact test, the number module genes belonging to each pathway and the module
color are shown.
Pathway ID Name P-value N° of module genes Module Color
Map00260 Glycine, serine and threonine metabolism 0.0004 14 Brown
Map00981 Insect hormone biosynthesis 0.004 15 Brown
Map01040 Biosynthesis of unsaturated fatty acids 0.006 12 Brown
Map00520 Amino sugar and nucleotide sugar metabolism 0.006 17 Brown
Map000620 Pyruvate metabolism 0.022 8 Brown
Map00340 Histidine metabolism 0.024 13 Brown
Map00350 Tyrosine metabolism 0.033 15 Brown
Map00981 Insect hormone biosynthesis 0.003 13 Yellow
Map00240 Pyrimidine metabolism 0.004 16 Yellow
Map00100 Steroid biosynthesis 0.012 6 Yellow
Map00340 Histidine metabolism 0.024 11 Yellow
Map00480 Glutathione metabolism 0.039 14 Yellow
Table 8.6 Number of module genes in functional annotations significantly overrepresented for genes of
modules of the gene network based on only the 48 mixture profiles together with the Benjamini-Hochberg
corrected p-value from Fisher`s exact test and the color of the module.
Annotation defintion P-value N° of module genes Module color
NA ( no functional annotation available) 8.35 e-08 637 Brown
Fatty acyl-coenzyme A elongase 0.009 5 Brown
Uncharacterized conserved protein 0.004 50 Brown
Mitochondrial ribosomal proteins 0.006 6 Brown
Phosphatidylinositol transfer protein 0.038 6 Brown
NA ( no functional annotation available) 4.8 e-25 461 Yellow
Predicted membrane proteine 0.0002 10 Yellow
Uncharacterized conserved protein 0.0008 46 Yellow
Proteins with POZ domains involved in signal transduction 0.018 6 Yellow
FOG leuchine rich repeat 0.018 7 Yellow

Chapter 8
166
A
B
C

Integration of transcriptomic and organismal data to study combined effects of cyanobacteria and insecticides
167
Figure 8.7 Correlation between gene significance and module membership for modules within the
network based on only the 48 mixture expression profiles. For all modules correlations were made
between the gene significance for reproduction.
Correlations of gene significance and module membership were significant for four of the five modules
(Fig. 8.7 A, B, C, D). Only in the salmon module (Fig. 8.7 E), no significant correlation was observed.
Functions of the hub genes in these four modules consisted primarily of lineage-specific genes and
uncharacterized proteins (Table 8.7). Additional functions were among others RNA polymerases, FOG
domain proteins, collagens and ABC superfamily related proteins.
D
E

Chapter 8
168
Table 8.7 Functional annotation of the ten most connected genes or hub genes in the black, midnightblue,
tan and purple modules of the network based on only the 48 mixture expression profiles.
Module Gene_id Functional Annotation
Brown JGI_V11_187192 3-Methylcrotonyl-CoA carboxylase
Brown JGI_V11_205678 Uncharacterized conserved protein
Brown JGI_V11_228142 NA
Brown JGI_V11_299660 NA
Brown JGI_V11_299669 Cell growth regulatory protein
Brown JGI_V11_304743 NA
Brown JGI_V11_306103 NA
Brown JGI_V11_307765 Uncharacterized conserved protein
Brown JGI_V11_337141 NA
Brown JGI_V11_93995 Membrane coat complex Retromer subunit
Midnightblue JGI_V11_119702 Collagens -type IV and type XIII-related proteins
Midnightblue JGI_V11_120485 NA
Midnightblue JGI_V11_122685 NA
Midnightblue JGI_V11_123715 Alternative splicing factors
Midnightblue JGI_V11_124343 NA
Midnightblue JGI_V11_305186 Lipid exporter ABCA1 and related proteins ABC superfamily
Midnightblue JGI_V11_66764 Multidrug-pheromone exporter ABC superfamily
Midnightblue JGI_V11_67653 Meprin A metalloprotease
Midnightblue JGI_V11_7071 NA
Midnightblue JGI_V11_7140 RNA polymerase II transcription termination factor superfamily
Tan JGI_V11_101682 NA
Tan JGI_V11_104443 Predicted transmembrane protein (immunoglobulin family)
Tan JGI_V11_110605 FOG Immunoglobulin C-2 Type-fibronectin type III domains
Tan JGI_V11_241465 NA
Tan JGI_V11_243781 NA
Tan JGI_V11_304016 NA
Tan JGI_V11_304032 NA
Tan JGI_V11_309130 NA
Tan JGI_V11_46113 FOG Zn-finger
Tan JGI_V11_92217 Uncharacterized conserved protein
Yellow JGI_V11_203235 NA
Yellow JGI_V11_208467 Cell-cycle nuclear protein contains WD-40 repeats
Yellow JGI_V11_307124 NA
Yellow JGI_V11_313246 NA

Integration of transcriptomic and organismal data to study combined effects of cyanobacteria and insecticides
169
Module (Table 8.7 cont.) Gene_id Functional Annotation
Yellow JGI_V11_317426 NA
Yellow JGI_V11_323650 NA
Yellow JGI_V11_325783 RNA polymerase II
Yellow JGI_V11_45609 Protein kinase containing WD40 repeats
Yellow JGI_V11_52570 DNA helicase
Yellow JGI_V11_95969 NA
Figure 8.8 Visual representation of the hub genes for each of the significantly correlated modules within
the network with only mixture expression profiles. Colors correspond with module colors. The thickness
of the edge, i.e. the line which connects the nodes, represents the adjancency between the genes
(equation 8.3).
Visual representation of the significant modules based on their hub genes indicated five tightly
connected modules with no overlap between the modules.

Chapter 8
170
Five gene modules within the network based on only the 48 mixture profiles correlated
significantly with the reproductive output. The majority of these modules could be represented
by their hub genes due to a significant correlation between gene significance and module
membership. Functional analysis indicated overrepresentation of genes involved in the amino
acid metabolism and the hormone biosynthesis. Specific gene functions in the modules were
among others speckle POZ proteins and phosphatidyl inositol transfer proteins.
Functional analysis of the modules within the two constructed gene networks that could be significantly
correlated with traits identified key pathways potentially driving these traits. Genes involved in
hormone biosynthesis were overrepresented in modules that correlated significantly with reproduction
or with deviations from non-interaction at life history level. Hormones in Daphnia play a crucial role in
the molt cycle and thus reproduction (Chang et al., 1993). Furthermore, deviation from non-interaction
at life history level was measured as how much observed reproduction deviates from predicted
reproduction. Deviations or changes in reproduction occur with variations in molt cycle and thus
variations in biosynthesis of these hormones, e.g. variation in ecdysteroids such as 20-
hydroxoyecydsone and the molt-inhibiting hormone (Leblanc, 2006). However, it was unclear at
present whether genes involved in hormone biosynthesis were a direct or indirect measure of
deviations from non-interaction. Indeed, the effect on these genes may have been indirectly mediated
through other pathways or pesticides and cyanobacteria may both have acted directly on these
pathways. Time series analysis of gene expression data should be able to distinguish in the future
between direct and indirect consequences of interactions. Nevertheless, these results indicated that
gene expression measurements may be suitable predictors of occurring higher level effects given the
clear correlation between known pathways affecting reproduction and the changes in reproductive
output.
The overrepresentation of genes involved in the amino acid metabolism in modules significantly
correlating with both reproductive output and deviation from non-interaction was less straightforward. It
correlated well off course with the RNA polymerases which had been identified as hub genes in
several modules (Tables 8.4, 8.7) as well as the presence of other genes involved in transcription
(Tables 8.3-8.4). Overall, this indicates that deviation from non-interaction was characterized by
changes in gene transcription and protein metabolism, i.e. requirement of changes in protein

Integration of transcriptomic and organismal data to study combined effects of cyanobacteria and insecticides
171
production to cope with the deviations from non-interaction or changes in reproduction. Again, the
same question arises whether these changes are the direct or indirect result of an interaction.
In addition to changes in large metabolic pathways, more specific gene functions were also
overrepresented in the modules correlating significantly with life history traits. Tables 8.3 and 8.6 list a
diverse set of functions that could not be straightforwardly linked to larger groups of pathways or
metabolism. Trypsins and neurexin IV genes could be indicative of the specific interactions with
cyanobacteria as these functional annotations were also overrepresented upon exposure to
cyanobacteria alone (chapters 5 and 6). Given their specificity and the prior knowledge concerning
their importance in exposure to cyanobacteria, these genes are a likely candidate for a quantitative
predictor at the transcriptional level that corresponds to interactions at life history level. Other
functional annotations included speckle type POZ proteins, lineage specific and uncharacterized
proteins which only offer limited additional understanding due to their lack of sufficient annotation at
the invertebrate level.
At present, it was not possible to identify a single measure at the transcriptional level that correlates
with interactions at the life history level. This could be attributed to the difficulty of selecting the
appropriate parameters or quantifiers for such a relationship rather than the actual data information.
Indeed, network construction of expression profiles and unsupervised clustering methods have
identified groups of genes that correlated significantly with interactions at the life history level. These
group of genes or modules could only be identified when using both single and mixture expression
profiles. The absence of single expression profiles resulted in no significant correlations with
interaction at the life history level, which confirms the importance of including effects of single
stressors. Whether these significant correlations between gene modules and interactions at life history
level could also be identified using single stressor profiles alone, remains to be investigated as the
current study did not have enough single stressor profiles to do so.
Interactions at life history level seemed to be driven by changes in larger metabolic pathways such as
hormone biosynthesis and amino acid metabolism as well as specific gene functions such as trypsins
and neurexin IVs. This confirmed the validity of transcriptional profiles to identify pathways and
mechanisms involved in interaction effects despite the large amount of lineage specific genes present
in significant modules.

Chapter 8
172
In addition to interactions at life history level, expression profiles were also correlated with reproductive
output. Significant correlations with gene modules were primarily observed when using only mixture
expression profiles. This may be attributed to the repetition of single treatments within the network
using all expression profiles. Indeed, all 144 profiles consisted of 48 unique mixture profiles, i.e. 48
unique treatments, and 96 single stressor profiles of which eight profiles were present for each of the
six cyanobacteria and six profiles were present for each of the eight insecticides due to the different
binary combinations. Effects on reproductive output could be described by major metabolic pathways,
i.e. hormone biosynthesis, amino acid and fatty acid metabolism. Specific functional annotations were
less pronounced and primarily consisted of lineage specific genes. In contrast to modules significantly
correlating with interactions, genes in the majority of the modules significantly correlating with
reproduction had both high gene significance and a high module membership. As a consequence,
modules significantly correlating with reproductive output could be represented by their hub genes in
addition to their eigengene. This was also confirmed in the visualization of the gene modules, where
modules correlating with reproduction were quite similar to one another and all well connected (Fig.
8.8). In contrast, modules significantly correlating with deviations from non-interaction were very
diverse as some were extremely connected and others had few connections (Fig. 8.7). These
observations underline the complexity of interaction effects which could not be uniformly grouped at
any level, life history level or transcription level.
The identified modules and the corresponding genes within these modules can already be used within
adverse outcome pathway frameworks as these genes are correlated with apical effects. This may
well be a first step towards developing an adverse outcome pathway framework for the risk
assessment of mixtures. Indeed, the current gene set can be used to query available microarray data
bases for additional expression data in other exposure studies to further validate these findings.
Further study is needed to identify whether the apical effects are directly mediated through these
genes or whether other genes are involved as discussed above as this will influence how this data is
incorporated within the adverse outcome pathway framework.
At present, it was not possible to identify the sequence of transcriptional changes or chain of response
to the stressors. Two potential approaches could in the future help to identify these changes. First,
time series analysis of gene expression data is the most straightforward way to identify which pathway
is perturbed or affected first and in turn affects another pathway initiating a series of transcriptional

Integration of transcriptomic and organismal data to study combined effects of cyanobacteria and insecticides
173
changes that will ultimately result in effects at life history level. Second, the current results may be
integrated into one large pathway in which distance measures between genes are used as an
estimate of steps needed to go from gene x to gene y. This would require a full integration of all
current pathway and biological knowledge which may in the case of Daphnia be insufficient to build a
complete transcriptomic pathway or map and would lead to the introduction of uncertain paths or even
gaps requiring advanced computational methods.
Lastly, this chapter has illustrated the potential of weighted gene network co-expression analysis to
correlate gene expression changes with apical effects. While this dissertation focused on multiple
stressors and cyanoabacteria and insecticides in particular, these analyses may also be applied for
identifying genes mediating effects of endocrine disruption or nonpolar narcosis which are adverse
outcome pathways under development (OECD, 2014a).
8.4 Conclusion
Transcription profiles were incorporated into gene networks of which gene modules correlated
significantly with external traits. Significant correlations between modules and deviation from non-
interaction could only be identified when using both single and mixture expression profiles. The
absence of single expression profiles resulted in no significant correlations with deviation from non-
interaction at the life history level, which confirmed the importance of including effects of single
stressors. Functional analysis of gene modules identified pathways such as hormone biosynthesis and
amino acid metabolism as well as significant proportion of lineage specific genes. Interaction effects
were also characterized by specific gene functions present in the significantly correlated modules such
as trypsins and neurexins IV. In addition, the identified modules can form a first foundation to
incorporate effects of multiple stress in adverse outcome pathways. Overall, modules describing
interaction effects were more diverse in terms of module structure and connectivity than modules
describing reproduction effects which underlined the complexity of interaction effects.


Chapter 9
General Conclusion and further
research perspectives
9 x


General conclusion and future research
177
9.1 General conclusion
Effects of cyanobacteria on zooplankton species remain, despite the large body of literature, poorly
understood. Meta-analyses reveal no clear impact of cyanobacterial toxins but rather point to
nutritional quality and cyanobacterial morphology. Given the significant bias towards Microcystis
species however, no definitive conclusions can be drawn. Chapter 2 has addressed these caveats by
studying the concentration response curves of Daphnia pulex exposed to six different cyanobacteria.
These curves were conserved across the six studied cyanobacteria and were not significantly different
from starvation treatments while for a limited range of diet ratios, i.e. at 40% of cyanobacteria in the
diet, effects differed significantly. This indicated a potential common lack of nutritional quality across all
cyanobacteria similarly affecting the fitness of D. pulex rather than effects of different cyanobacterial
toxins for the majority of the diet ratios tested. Fatty acid methyl ester profiles further revealed
differences in total FAME content and omega-3 content but were in contrast with general expectations
based on literature and did not explain the observed overall similarities nor the specific differences
observed at 40% of cyanobacteria in the diet.
Adverse effects occurred at concentrations of cyanobacteria in the diet that can be lower than
concentrations in cyanobacterial blooms. This underlined the importance of including cyanobacteria
concentrations in risk assessments to sufficiently protect zooplankton species. A proposed approach
consisted of using cyanobacterial concentration response curves across multiple zooplankton species
to fully incorporate potential interspecies variation. Indeed, the use of concentration response curve
will allow generalizing risk assessments across a potentially large group of cyanobacteria for the
majority of the tested concentrations yet also allowing for a specific or more stringent policy for those
concentration ranges where some cyanobacteria are more toxic than the other.
Mechanistic research is currently making significant progress through the development of high
throughput technologies such as microarrays and may help elucidate the driving factors of
cyanobacterial effects on Daphnia. Chapter 5 therefore implemented whole transcriptome microarray
technology to study the response of D. pulex to the natural stressor Microcystis aeruginosa. The stress
response pattern consisted of four major pathways or gene networks as well as eight paralogous gene
families. Differential regulation of the ribosome, including three paralogous gene families encoding
40S, 60S, and mitochondrial ribosomal proteins, suggested an impact of Microcystis on protein

Chapter 9
178
synthesis of D. pulex. In addition, differential regulation of the oxidative phosphorylation pathway
(including the NADH:ubiquinone oxidoreductase gene family) and the trypsin paralogous gene family
(a major component of the digestive system in D. pulex) could explain why fitness is reduced based on
energy budget considerations. Moreover, chapter 5 underlined the need to take into account the
specific and unique D. pulex genome structure in expression studies, which may influence conclusions
drawn. This genomic structure is characterized by, among others, a high number of lineage specific or
unknown genes (Colbourne et al., 2011). Chapter 5 further highlighted how these genes can be
functionally annotated in environmentally relevant conditions.
Chapter 6 used high throughput microarray technology to identify and compare complex response
patterns of Daphnia to six different cyanobacterial species. Both mechanisms that were specific to a
single cyanobacterial stressor as well as mechanisms that were conserved across all cyanobacterial
stressors were identified. The similarities and differences between these patterns across
cyanobacterial stressors depended upon the level of functional biological organization, i.e. genes,
functional annotations and pathways. The observed discrepancy between these levels underlined the
necessity of such a research approach. Indeed, a total of 56 gene functions or functional annotations
was shared by all cyanobacterial stress exposures whereas only 22 genes were shared across all
conditions. Functional annotations comprised functions such as cytochrome P450, chitinases,
collagens and neurexin IV. At the pathway level, only the starch and sucrose metabolism was shared
by all cyanobacterial treatments. The steroid hormone biosynthesis, detoxification through cytochrome
P450 and the arachidonic acid metabolism were shared by all cyanobacterial treatments excluding
Anabaena. Furthermore, the incorporation of the unique features of the genome under study, i.e. the
high gene duplication, in the analysis benefitted the integration of these different levels of organization
in a true systems biology approach. Indeed, paralogous genes were more likely to be shared between
the cyanobacterial treatments than non-duplicated genes. In contrast, non-duplicated genes had a
higher chance of being unique to only one of the cyanobacteria treatments than duplicated genes.
Overall, cyanobacterial stress targeted mainly similar mechanisms regardless of the cyanobacterial
species. Yet, the regulation of these mechanisms was species-specific as these mechanisms were
affected through the regulation of different genes albeit all having the same functional annotation. In
addition, this chapter has also highlighted the functional diversification of duplicated genes under
similar but still distinguishable forms of stress, i.e. cyanobacteria.

General conclusion and future research
179
Environmental reality contrasts laboratory experiments as Daphnia are rarely exposed to
cyanobacteria alone. Interaction effects between cyanobacteria and insecticides have been reported
in literature for a limited set of combinations. Chapter 3 studied the effects of different cyanobacteria
when combined with different insecticides on the reproduction of Daphnia pulex. Different interaction
patterns were observed for insecticides with different molecular targets when combined with
Microcystis. In contrast, different cyanobacteria showed similar interaction patterns when combined
with carbaryl. Four out of eight combinations showed antagonistic deviation patterns, three showed no
interaction patterns whereas one yielded different patterns dependent on the reference model. The
independent action model concluded synergism whereas the concentration addition model concluded
no significant deviations from non-interaction. Overall, concentration addition provided more
conservative predictions of effects than independent action. Therefore, the concentration addition
model is preferred over the independent action model from a risk assessment point of view as it
provided more conservative predictions. This is in agreement with observation from literature.
Nevertheless, from a mechanistic point of view, neither model can be selected above the other without
detailed knowledge concerning the modes of action of stressors under study. Chapter 3 clearly
highlighted that interaction effects cannot be generalized across modes of actions of insecticides
whereas results may potentially be generalized across different cyanobacteria combined with the
same insecticide.
Life history observations across a large set of combinations of cyanobacteria and insecticides, studied
in chapter 4. First, Chapter 4 confirmed the results of chapter 2. Indeed, for a narrow range of
concentrations of cyanobacteria in the diet, effects do differ significantly between the different
cyanobacteria. The results of the studied combinations indicated the occurrence of interaction effects
to be a complex trait dependent upon several factors. Indeed, conclusions regarding interaction effects
depended on exposure concentration and exposure design. Results from chapter 3 could be
extrapolated in a straightforward manner to the different experimental design in chapter 4. Further
analysis of the data indicated that exposure conditions and exposure concentration rather than
exposure time affected the conclusions concerning interaction. Indeed, conclusions about interaction
effects observed in chapter 3 remained conserved after 14 and 21 days suggesting potential
extrapolation of interaction effects over different time points. In conclusion, studies on life history level
Chapter 9
180
without further mechanistic research seem to be insufficient to attain a clear insight in the dynamics
and processes leading to interactions.
Therefore, chapter 7 focused on the transcriptomic profiling of 48 binary combinations of
cyanobacteria and insecticides. Transcriptomics have been used to study interaction effects but often
lack statistical frameworks and a priori defined hypotheses. Chapter 7 put forward and applied three
different approaches and two different measures of deviation. Overall, filtering the data based upon no
overlapping 95% confidence intervals between observations and predictions and then calculating the
sum of Mint-values of all genes with significant deviations from non-interaction was the most consistent
approach allowing identification of statistical and biological significant genes. Genes with a significant
interaction effect across all combinations showed a diverse pattern of expression in both synergistic
and antagonistic directions. This approach selected overall genes which remained significant after
benjamini-hochberg correction which reduced the chances of false positives within the selected gene
set. Nevertheless, the generally accepted terminology of synergism and antagonism at the life history
level was insufficient to explain all possible combinations and patterns of genes demonstrating an
interaction effect in terms of clear synergism or antagonisms which suggests that alternative
terminology is needed. Functional analysis of all genes with a significant interaction effect revealed a
diverse set of metabolic functions and pathways which indicated that interaction effects trigger a
complex general stress response in the organism, involving among others trypsins, collagens and
cytochrome P450 genes rather than specific pathways or genes particular to the molecular modes of
action insecticides or cyanobacteria.
Molecular high throughput technologies are increasingly being used in research. Yet, clear and direct
links between molecular and life-history effects remain difficult to establish. Therefore, chapter 8
incorporated the transcription profiles of chapter 7 into gene networks. The modules of these
networks were then in turn correlated with life history parameters and interaction parameters at both
the life history level, defined in chapter 4, and the molecular level, defined in chapter 7. Significant
correlations between modules and deviation from non-interaction could only be identified when using
both single and mixture expression profiles. The gene networks without single expression profiles did
not contain any modules significantly correlating with interaction at the life history level, which confirms
the importance of including effects of single stressors. Functional analysis of gene modules identified
that pathways such as hormone biosynthesis and amino acid metabolism as well as a significant

General conclusion and future research
181
proportion of lineage specific genes were correlated with reproductive toxicity. Interaction effects were
also characterized by specific gene functions present in the significantly correlated modules such as
trypsins and neurexins IV. Overall, modules describing interaction effects were more diverse in terms
of module structure and connectivity than models describing reproduction effects which underlined the
complexity of interaction effects.
9.2 Applicability of the results and future research perspectives
While scientists have advocated the need for knowledge concerning interaction effects, legislation has
remained focussed on the effects of single chemicals without regards to potential interaction effects.
The increase in scientific publications regarding interaction effects has pushed regulatory bodies to
take a stand. The European Commission has declared its intent to focus on priority mixtures,
assessing the impact of these mixtures on the environment, filling knowledge and data gaps in mixture
toxicity (European Commission, 2012). Results of chapters 3 and 4 have started to fill these
knowledge and data gaps for combinations of cyanobacteria and pesticides. In addition, the data itself
can be used to test and validate predictive models that can be implemented in risk assessment. In the
opinion of three scientific European committees on “the toxicity and assessment of chemical mixtures”,
several criteria are proposed to help tackle the risk assessment of an almost infinite number of
possible mixture combinations in the environment (SCHER, SCCS, SCENIHR, 2012). The results of
chapters 7 and 8 can be applied within two of these criteria. The first criterion is known information of
potential interactions. While chapters 3 and 4 have provided information about the interaction of 48
binary combinations at life history level, results of chapters 7 and 8 have provided additional
mechanistic information about these combinations that may be applied to new similar combinations
with other cyanobacteria or other insecticides. The second criterion is predictive information that
chemicals act similarly. Mechanistic information gained from new technologies such as microarrays
can add substantial mechanistic information that may help generating predictive information when
combined with toxicodynamics and toxicokinetics (Villeneuve and Garcia-Reyero, 2011). Therefore,
the microarray data generated in chapters 7 and 8 can be subsequently queried and used to extract
the necessary information. In this dissertation, a primary focus was the explorative analysis within
defined statistical frameworks and linking the results of this analysis with life history traits. Future
opportunities exist to query the data with more advanced techniques such as kernel methods or other

Chapter 9
182
machine learning techniques (Brown et al., 2000). In addition, more information can be integrated to
actually tackle gene interactions (Husmeier, 2003). Possibilities can be to combine pathway
information and distance measures to link all pathways and genes with each other (Pavlopoulos et al.,
2011). For example, the distance measure can be used to quantify the number of enzymes or
products between genes. Interactions between genes can then be studied at a new level of
organisation (Croes et al., 2006).
In addition to the need for adequate testing of chemicals and combined and interaction effects,
environmental regulation also requires a minimal of animal testing to achieve these goals. Alternatives
to animal testing are not only necessary from an ethical point of view but are also required to achieve
adequate screening of chemicals within a given timeframe (Collins et al., 2008). Indeed, animal
models, mammal models in particular, will only allow between 100-10000 tests a year whereas in vitro
screening and alternative methods, e.g. predictive models or molecular screening libraries, could
reach these numbers in a day (Collins et al., 2008). In vitro alternatives are only feasible if sufficient
mechanistic knowledge is available to allow prediction and extrapolation. Ankley et al. (2010)
proposed adverse outcome pathways (AOP) as a framework summarizing mechanistic knowledge
from the molecular initiating event to the eventual adverse outcome at life history level. The molecular
results obtained in chapters 5 to 8 are a first step to building such AOPs not only for chemicals but
also for natural stressors.
Indeed, emerging natural stressors such as cyanobacteria have significant impacts on aquatic
ecosystems and human health. The 2006 bathing water directive of the European Commission
(European Commission, 2006) stresses the potential effects of cyanobacteria in general but without
clear guidelines. Results from chapter 2 can be integrated in these directives and others relating to
environmental health in general to help set guidelines and criteria for cyanobacteria. Indeed, chapter
2 provided full concentration response curves of six common cyanobacterial species and
demonstrated that these curves remain conserved across the different species for the majority of the
concentrations. These observations can help to draft general guidelines for cyanobacteria that ensure
minimal effects on zooplankton species. The mechanistic results of chapters 5 and 6 can also be
integrated to better understand cyanobacterial toxicity on zooplankton species within adverse outcome
pathways.
General conclusion and future research
183
Despite the efforts in environmental regulation, several challenges remain to be addressed. First, the
exposure time remains a factor under continuous debate in science and in risk assessment. Often,
acute exposures are conducted because they require less time and resources. The question however
remains whether acute exposure conditions are relevant to determine chronic effects in the
environment. The OECD has developed standard test guidelines for Daphnia testing in both acute and
chronic settings (OECD, 1984; OECD, 2008). They have defined 48 hours as acute exposure to test
immobilisation and 21 days as a chronic exposure to test reproduction. However, results from
chapters 2, 3 and 4 show that similar conclusions were made with regards to research questions after
14 and 21 days of exposure. If these results can be extrapolated, it would mean a significant increase
in available resources and time as it reduces the chronic exposure assay with seven days. At present
however, the current results represent a too small dataset to make such extrapolations and further
research is necessary. For molecular assays, the same concerns arise. Chapters 5 to 8 have
focussed on chronic exposure to assess gene expression changes whereas previous studies have
primarily focussed on acute exposures. Comparisons between the current results and literature to
determine the most appropriate exposure time are not feasible. Indeed, the chronic exposures
presented here refer to exposures where daphnids were exposed for ten days from juvenile till adult
life stage. In contrast, acute exposures typically expose adults for a period ranging from 24 to 96
hours. As a consequence, it is impossible to define the most appropriate exposure time. There is
therefore a need to generate time-course data that study the changes in expression across different
time periods (Van Straalen and Feder, 2011). Asselman et al. (2013) observed time-dependent
expression of metallothioneins upon exposure to copper and cadmium. Furthermore, the most
appropriate time point to measure gene expression may differ from gene to gene as they have
different metabolic functions and gene expression of one gene may often be a consequence of gene
expression of another gene.
Second, the concentration of exposure significantly affects conclusions made about interaction effects
as demonstrated in chapter 4. Full concentration response curves overcome these issues but are
resource-demanding. Furthermore, the question remains to determine how many concentrations need
to be tested to draw correct conclusions. These concerns are extremely valid in molecular studies as
little concentration response data is available due to the high amount of resources needed. Yet, if we
want to fully understand the concentration response relationship, such data is needed as advocated

Chapter 9
184
already by Altenburger et al. (2012). When effects differ at different concentrations, in particular for
interaction effects and molecular effects, it is unclear to what extent, if at all, these results can be
extrapolated to environmentally relevant concentrations. This confirms the need that without clear
understanding of concentration response data in complicated settings such as mixtures, research
should focus on testing environmentally relevant concentrations. Here, concentrations for the studied
pesticides were within or below the ranges of predicted environmental concentrations (PEC) or the
maximum allowed concentrations (MAC) except for acetamiprid (Table 1.4) which indicates that the
effects observed here can also occur in the actual environment with significant effects on the
reproduction of Daphnia. The higher concentration of acetamiprid was selected due to the low
sensitivity of Daphnia (Beketov and Liess, 2008) but nevertheless acetamiprid may serve as a
mechanistic model stressor for other neonicotinoids.
Third, environmental risk assessment often focusses on populations with little to no genotypic
diversity, without taking into account the potential genetic variation within the studied species or
genus. This variation can significantly change conclusions on interaction effects. De Coninck et al.
(2013b) observed a variation of interaction effects for different genotypes of Daphnia exposed to
Microcystis and cadmium. The same observation was made when exposing two genotypes to carbaryl
and Pasteuria ramosa (De Coninck et al., 2013a). More research is needed to determine how genetic
diversity can be integrated in environmental risk assessment. Kramer et al. (2011) proposed an
extension of adverse outcome pathways from organismal level to population level but it remains a
challenge even in such frameworks to implement genetic diversity and its potential consequences on
stress response.
Nevertheless, results from chapter 3 and 4 can also have direct implications on risk management.
Indeed, guidelines could be drafted to prefer insecticides known to have antagonistic interactions with
cyanobacteria in those periods where water conditions are favourable for cyanobacterial bloom
formation. Combined effects would therefore be minimized if a bloom actually occurs. If possible,
depending on the agricultural needs and the potential persistence of the insecticides, a general
guideline could be drafted to prefer use of insecticides known to have antagonistic interactions with
cyanobacteria on Daphnia. In addition, new pesticides could be screened and selected for
antagonistic interactions with cyanobacteria during the development phase to reduce environmental
impact of these pesticides.
General conclusion and future research
185
Finally, the molecular techniques used in chapters 5 to 8 have highlighted the unique features of the
Daphnia genome, i.e. high gene duplication and lineage specific genes. Although the results
presented here have focussed on responses of known genes and pathways, the data contains a
wealth of potential environmental annotation information of gene duplicates and lineage specific
genes. The current dataset, combined with other molecular data, can aid in elucidating the gene
functions of these gene duplicates and lineage specific genes under a variety of environmental stress
responses. Results of chapter 5 and 6 in particular have demonstrated methods to start annotating
these genes environmentally while taking into account the specific structure of the Daphnia genome.
Daphnia was the first fully sequenced crustacean genome. Currently, other sequencing projects are
ongoing, e.g. Artemia genome (Artemia Genome Workshop, 2013), and these can only benefit from
the availability of the Daphnia genome and the knowledge and bioinformatic pathway tools generated
in this dissertation. Likewise, the availability of other crustacean genomes will allow for a better
definition of the currently defined lineage specific genes and will give a broader insight into the
function of gene duplication and evolutionary diversification of these duplicated genes.


References

References
189
Agrawal MK, Zitt A, Bagchi D, Weckesser J, Bagchi SN, von Elert E. 2005. Characterization of
proteases in guts of Daphnia magna and their inhibition by Microcystis aeruginosa PCC 7806.
Environ Toxicol 20, 314-322.
Alda Alvarez O, Jager T, Nunez Coloa B, Kammenga JE. 2006. Temporal dynamics of effect
concentrations. Environ Sci Technol 40, 2478-2484.
Allen MM. 1968. Simple conditions for growth of unicellular blue-green algae on plates. J. Phycol. 4, 1-
4.
Altenburger R, Backhaus T, Boedeker W, Faust M, Scholze M. 2013. Simplifying complexity: Mixture
toxicity assessment in the last 20 years. Environ Toxicol Chem 32, 1685-1687.
Altenburger R, Backhaus T, Boedeker W, Faust M, Scholze M, Grimme LH. 2000. Predictability of
multiple chemical mixtures to Vibrio fischeri: Mixtures composed of similarly acting chenicals.
Environ Toxicol Chem 19, 2341-2347.
Altenburger R, Boedeker W, Faust M, Grimme LH. 1996. Regulations for combined effects of
pollutants: Consequences from risk assessment in aquatic toxicology. Food Chem Toxicol 34,
1155-1157.
Altenburger R, Scholz S, Schmitt-Jansen M, Busch W, Escher BI. 2012. Mixture toxicity revisited from
a toxicogenomic perspective. Environ Sci Technol 46, 2508-2522.
Altshuler I, Demiri B, Xu S, Constantin A, Yan ND, Cristescu ME. 2011. An integrated multi-disciplinary
approach for studying multiple stressors in freshwater ecosystems: Daphnia as a model
organism. Integr Comp Biol 51, 623-633.
Ankley GT, Bennett RS, Erickson RJ, Hoff DJ, Hornung MW et al. 2010. Adverse outcome pathways:
A conceptual framework to support ecotoxicology research and risk assessment. Environ Toxicol
Chem 29, 730-741.
Ankley GT, Daston GP, Degitz SJ, Denslow ND, Hoke RA, et al. 2006. Toxicogenomics in regulatory
ecotoxicology. Environ Sci Technol 40, 4055-4065.
Antczak P, Jo HJ, Woo Seonock, Scanlan L, Poynton H, Loguinov A, Chan S, Falciani F, Vulpe C.
2013. Molecular toxicity identification evaluation (mTIE) approach predicts chemical exposure in
Daphnia magna. Environ Sci Technol 47, 11747-11756.
Aráoz R, Nghiêm H., Rippka R, Palibroda N, Tandeau de Marsac N, Herdman M. 2005. Neurotoxins in
axenic oscillatorian cyanobacteria: coexistence of anatoxin-a and homoanatoxin-a determined by
ligand-binding assay and GC/MS. Microbiol 151, 1263-1273.
Asselman J, Glaholt SP, Smith Z, Smagghe G, Janssen CR, Colbourne JK, Shaw JR, De
Schamphelaere KAC. 2012. Functional characterization of four metallothionein genes in Daphnia
pulex exposed to environmental stressors. Aquat Toxicol 110-111, 54-65.
References
190
Asselman J, Shaw, JR, Glaholt SP, Colbourne JK, De Schamphelaere KAC. 2013. Transcription
patterns of genes encoding four metallothionein homologs in Daphnia pulex exposed to copper
and cadmium are time- and homolog-dependent. Aquat Toxicol 142-143, 442-430.
Baas J, Van Houte BPP, Van Gestel CAM, Kooijman SALM. 2007. Modelling the effects of binary
mixtures on survival in time. Environ Toxicol Chem 26, 1320-1327.
Backhaus T, Altenburger R, Boedeker W, Faust M, Scholze M, Grimme LH. 2000. Predictability of the
toxicity of a multiple mixture of dissimilarly acting chemicals to Vibrio fischeri. Environ Toxicol
Chem 19, 2348 -2356.
Backhaus T, Faust M, Scholze M, Gramatica P, Vighi M, Horst Grimme L. 2004. Joint algal toxicity of
phenylurea herbicides is equally predictable by concentration addition and independent action.
Environ Toxicol Chem 23, 258-264.
Ballot A, Fastner J, Wiedner C. 2010. Paralytic shellfish poisoning toxin-producing cyanobacterium
Aphanizomenon gracile n Northeast Germany. Appl Environ Microbiol 76, 1173-1180.
Barata C, Baird DJ, Nogueira AJA, Soares AMVM, Riva MC. 2006. Toxicity of binary mixtures of
metals and pyrethroid insecticides to Daphnia magna Straus. Implications for multi-substance
risks assessment. Aquat Toxicol 78, 1-14.
Barata C, Varo I, Navarro JC, Arun S, Porte C. 2005. Antioxidant enzyme activities and lipid
peroxidation in the freshwater cladoceran Daphnia magna exposed to redox cycling compounds.
Comp. Biochem. Physiol. 140 C, 175-186.
Bardwell VJ,Treisman R. 1994. The POZ domain: a conserved protein-protein interaction motif. Genes
Dev. 8, 1664-1677.
Barry MJ. 2000. Effects of endosulfan on Chaoborus-induced life-history shifts and morphological
defenses in Daphnia pulex. J Plankton Res 22, 1705-1718.
Baumgartner S, Littleton JT, Broadie K, Bhat MA, Harbecke R, Lengyel JA, Chiquetehrismann R,
Prokop A, Bellen HJ. 1996. A Drosophila neurexin is required for septate junction and blood-
nerve barrier formation and function. Cell 87,1059-1068.
Bauer DF. 1972. Constructing confidence sets using rank statistics. Journal of the American Statistical
Association 67, 687-690.
Beattie KA, Kaya K, Codd GA. 2000. The cyanobacterium Nodularia PCC7804, of freshwater origin,
produces [L-Har2]nodularin. Phytochem 54, 57-61.
Bednarska A, Łoś J, Dawidowicz P. 2011. Temperature-dependent effect of filamentous cyanobacteria
on Daphnia magna life history traits. J Limnol 70, 353-358.
Beketov MA, Liess M. 2008. Acute and delayed effects of the neonicotinoid insecticide thiacloprid on
seven freshwater arthropods. Environ Toxicol Chem 27, 461-470.
References
191
Beketov MA, Speranza A, Liess M. 2011. Ultraviolet radiation increases sensitivity to pesticides:
synergistic effects on population growth rate of Daphnia magna at low concentrations. Bull
Environ Contam Toxicol 87, 231-237.
Belden JB, Lydy MJ. 2006. Joint toxicity of chlorpyrifos and esfenvalerate to fathead minnows and
midge larvae. Environ Toxicol Chem 25, 623-629.
Benjamini Y, Hochberg Y. 1995. Controlling the false discovery rate - a practical and powerful
approach to multiple testing. J R Stat Soc Ser B 57, 289-300.
Berenbaum MC. 1989. What is synergy. Pharmacol. Rev 41, 93-141.
Bernatowicz P, Pijanowska J. 2011. Daphnia response to biotic stress is modified by PCBs. Ecotoxicol
Environ Safe 74, 711-718.
Bliss CI. 1939. The toxicity of poisons applied jointly. Ann Appl Biol 26, 585-615.
Blyth S. 1980. Palm Island mystery disease. Med J Aust 2, 40-42.
Boedeker W, Altenburger R, Faust M, Grimme LH. 1992. Synopsis of concepts and models for the
quantitative analysis of combination effects: from biometrics to ecotoxicology. Arch Complex
Environ Studies 4, 45-53.
Bolch CJS, Orr PT, Jones GJ, Blackburn SI. 1999. Genetic, morphological and toxicological variation
among globally distributed strains of Nodularia (cyanobacteria). J Phycol 35, 339-355.
Borgert CJ, Quill TF, McCarty LS, Mason AM. 2004. Can mode of action predict mixture toxicity for
risk assessment? Toxicol Appl Pharmacol 201, 85-96.
Bradshaw AD, Hardwick K. 1989. Evolution and stress - genotypic and phenotypic components. Biol J
Linnean Soc 37, 137-155.
Brett MT, Müller-Navarra DC, Ballantyne AP, Ravet JL, Goldnan CR. 2006. Daphnia fatty acid
composition reflects that of their diet. Limnol Oceanogrp 51, 2428-2437.
Brown MPS, Grundy WN, Lin D, Cristianini N, Walsh C, Furey TS, Ares MJ, Haussler D. 2000.
Knowledge-based analysis of microarray gene expression data by using support vector
machines. Proc Natl Acad Sci USA 97, 262-267.
Buijse AD, Van Eerden MR, Dekker W, Van Densen WLT. 1993. Elements of a trophic model for
IJsselmeer (The Netherlands), a shallow euthropic lake. In: Trophic models for Aquatic
ecosystems. Christensen V and Pauly D, Eds. International Center for Living Aquatic Resource
Management. 390p.
Burch, M.D. 2008. Chapter 36: Effective doses, guidelines and regulations. In Cyanobacterial Harmful
Algal Blooms: State of the Science and Research Needs. H.K. Hudnell (ed.). 950p.
http://www.epa.gov/cyano_habs_symposium/monograph/Ch36.pdf

References
192
Cadel-Six S, Dauga C, Castets AM, Ripka R, Bouchier C, Tandeau de Marsac N, Welker M. 2008.
Halogenase genes in nonribosomal peptide synthetase gene clusters of Microcystis
(Cyanobacteria): Sporadic distribution and evolution. Mol Biol Evol 25, 2031-2041.
Calow P. 1989. Proximate and ultimate responses to stress in biological systems. boil J Linnean Soc
37, 173-181.
Campos A, Vasconcelos V. 2010. Molecular mechanisms of microcystin toxicity in animal cells. Int J
Mol Sci 11, 268-287.
Carmichael WW. 2001. Health effects of toxin-producing cyanobacteria, “The CyanoHabs”. Hum Ecol
Risk Assessement 7, 1393-1407.
Carmichael WW. 2008. A world overview-one-hundred-twenty-seven years of research on toxic
cyanobacteria--Where do we go from here? In Cyanobacterial Harmful Algal Blooms: State of the
Science Research Needs; Advances in Experimental Medicine and Biology, Vol. 619; Hudnell, K.
H., Ed.; Springer: New York, p 43-103.
Carmichael WW, Jones CLA, Mahmood NA, Theiss WC. 1985. Algal toxins and water-based
diseases. CRC Crit Rev Envir Control 15, 275-313.
Carpenter SR, Fisher SG, Grimm NB, Kitchell JF. 1992. Global change and freshwater ecosystems.
Annu Rev Ecol Syst 23, 119-139.
Cedergreen N, Christensen AM, Kamper A, Kudsk P, Mathiassen SK, Streibig JC, Sorensen H. 2008.
A review of indepdent action compared to concentration addition as reference models for
mixtures of compounds with different molecular target sites. Environ Toxicol Chem 27, 1621-
1632.
Cedergreen N, Kudsk P, Mathiassen SK, Sorensen H, Streibig JC. 2009. Reproducibility of binary-
mixture toxicity studies. Environ Toxicol Chem 26, 149-156.
Cedrgreen N, Streibig JC. 2005. Can the choice of endpoint lead to contradictory results of mixture-
toxicity experiments? Environ Toxicol Chem 24, 1676-1683.
Cerbin S, Kraak MHS, de Voogt P, Visser PM, Van Donk E. 2010. Combined and single effects of
pesticide carbaryl and toxic Microcystis aeruginosa on the life history of Daphnia pulicaria.
Hydrobiologia 643, 129-138.
Chang ES, Bruce MJ, Tamone SL. 1993. Regulation of crustacean molting: A multi-hormone system.
Am Zool 33, 324-329.
Chen W, Song L, Ou D, Gan G. 2005. Chronic toxicity and responses of several important enzymes in
Daphnia magna on exposure to sublethal microcystin-LR. Environ Toxicol 20, 323-330.
Chorus I (ed). 2001. Cyanotoxins: occurrence, causes, consequences. Springer-Verlag, Berlin, 357 p.
Chomova M, Racay P. 2010. Mitochondrial complex I in the network of known and unknown facts.
Gen Physopm Biophys 29, 3-11.
References
193
Chow-Fraser P, Sprules GW. 1986. Inhibitory effect of Anabaena sp. on in situ filtering rate of
Daphnia. Can J Zool 64, 1831-1834.
Cline MS, Smoot M, Cerami E, Kuchinsky A, Landys N, et al. 2007. Integration of biological networks
and gene expression data using Cytoscape. Nat. Protoc. 2, 2366-2382.
Codd GA. 1995. Cyanobacterial toxins: Occurrence, properties and biological significance. Water Sci
Technol 32, 149-156.
Codd, G.A., Morrison, L.F., Metcalf, J.S. 2005. Cyanobacterial toxins: risk management for health
protection. Toxicol. Appl. Pharmacol. 203, 264-272.
Colbourne JK, Pfrender ME, Gilbert D, Thomas WK, Tucker A et al. 2011. The ecoresponsive genome
of Daphnia pulex. Science 331, 555-561.
Colbourne JK, Singan VR, Gilbert DG. 2005. wFleaBase: the Daphnia genome database. BMC
Bioinformatics, 6:45.
Collins FS, Gray GM, Bucher JR. 2008. Transforming environmental health protection. Science 319,
906-907.
Cook CM, Vardaka E, Lanaras T. 2004. Toxic cyanobacteria in Greek freshwaters, 1987-2000:
Occurence, toxicity and impacts in the Mediterranean region. Acta Hydrochim Hydrobiol 32, 107-
124.
Coors A, De Meester L. 2008. Synergistic, antagonistic and additive effects of multiple stressors:
predation threat, parasitism and pesticide exposure in Daphnia magna. J Appl Ecol 45, 1820-
1828.
Croes D, Couche F, Wodak SJ, van Helden J. 2006. Inferring meaningful pathways in weighted
metabolic networks. J Mol Biol 356, 222-236.
Cronberg G. 1999. Qualitative and quantitative investigations of phytoplankton in Lake Ringsjön,
Senia, Sweden. Hydrobiologia 404, 27-40.
Czarnecki O, Henning M, Lippert I, Welker M. 2006. Identification of peptide metabolites of Microcystis
(Cyanobacteria) that inhibit trypsin-like activity in planktonic herbivorous Daphnia (Cladocera).
Environ Micorbiol 8, 77-87.
Daam MA, Cerejeira MJ, Van den Brink PJ, Brock TCM. 2011. Is it possible to extrapolate results of
aquatic microcosm and mesocosm experiments with pesticides between climate zones in
Europe? Environ Sci Pollut Res 18, 123-126.
David RM, Dakic V, Williams TD, Winter MJ, Chipman KJ. 2011. Transcriptional responses in neonate
and adult Daphnia magna in relation to relative susceptibility to genetoxicants. Aquat Toxicol 104,
192-204.
Day K, Kaushik NK. 1987. An assessment of the chronic toxicity of the synthetic pyrethroid,
fenvalerate, to Daphnia galeata mendotae, using life tables. Environ Pollut 44, 13-26.

References
194
De Coninck DIM, Asselman J, Glaholt S, Janssen CR, Colbourne JK, Shaw JR, De Schamphelaere
KAC. 2014. Genome-wide transcription profiles provide insights in genotype-dependent
mechanisms of tolerance to two interacting stressors in Daphnia. Accepeted in Environmental
Science and Technology.
De Coninck DIM, De Schamphelaere KAC, Jansen M, De Meester L, Janssen CR. 2013a. Interactive
effects of a bacterial parasite and the insecticide carbaryl to life-history and physiology of two
Daphnia magna clones differing in carbaryl sensitivity. Aquat Tox 130-131, 149-159
De Coninck DIM, Janssen CR, De Schamphelaere KAC. 2013b. An investigation of the inter-clonal
variation of the interactive effects of cadmium nd Microcystis aeruginosa on the reproductive
performance of Daphnia magna. Aquat Toxicol 140-141, 425-431.
De Laender F, Janssen CR, De Schamphelaere KAC. 2009. Non-simultaneous ecotoxicity testing of
single chemicals and their mixture results in erroneous conclusions about the joint action of the
mixture. Chemosphere 76, 428-432.
Dehn M.1930 Untersuchungen über die Verdauung bei Daphnien. Zeitschrift für vergleichende
Physiologie 13, 334-358.
DeMott WR, Müller-Navarra D. 1997. The importance of highly unsaturated fatty acids in zooplankton
nutrition: evidence from experiments with Daphnia, a cyanobacterium and lipid emulsions.
Freshwater Biol 38, 649-664.
DeMott WR, Zhang QX, Carmichael WW. 1991. Effects of toxic cyanobacteria and purified toxins on
the survival and feeding of a copepod and three species of Daphnia. Limnol Oceanogr 36, 1346-
1357.
Deneer JW. 2000. Toxicity of mixtures of pesticides in aquatic systems. Pest Manage Sci 56:516-520.
De Schamphelaere KAC, Forrez I, Dierckens K, Sorgeloos P, Janssen CR. 2007. Chronic toxicity to
dietary copper to Daphnia magna. Aquat Toxicol 81, 409-418.
De Schamphelaere KAC, Glaholt S, Asselman J, Messiaen M, De Coninck D, Janssen CR, Colbourne
JK, Shaw JR. 2011. Will genetic adaptation of natural populations to chemical pollution result in
lower or higher tolerance to future climate change? Integr Environ Assess Manag 7, 141-143.
de Senerpont Domis LN, Bartosiewicz M, Davis C, Cerbin S. 2013. The effect of small doses of toxic
cyanobacterial food on the temperature response of Daphnia galeata: is bigger better? Fresh Biol
58, 560-572.
Dias da Silva D, Silva E, Carvalho F, Carmo H. 2013. Mixtures of 3,4-methylene-
dioxymethamphetamine (ectasy) and its major human metabolites act additively to induce
significant toxicity to liver cells when combined at low, non-cytotoxic concentrations. J Appl
Toxicol, DOI: 10.1002/jat.2885
Ding WX, Shen HM, Zhu HG, Ong CN. 1998. Studies on oxidative damage induced by cyanobacteria
extract in primary cultured rat hepatocytes. Environ Res 78, 12-18.

References
195
Dom N, Vergauwen L, Vandenbrouck T, Jansen M, Blust R, Knapen D. 2012. Physiological and
molecular effect assessment versus physico-chemistry based mode of action schemes: Daphnia
magna exposed to narcotics and polar narcotics. Environ Sci Technol 46, 10-18.
Downing JA, Watson JB, McCauley E. 2001. Predicting cyanobacterial dominance in lakes. Canadian
Journal of Fisheries and Aquatic Sciences 58, 1905-1908.
Dresher K, Boedeker W, 1995. Assessment of the combined effects of substances: the relationship
between concentration addition and independent action. Biometrics 51, 716-730.
Duy TN, Lam PKS, Shaw G, Connell DW. 2000. Toxicology and risk assessment of freshwater
cyanobacterial (bluegreen algal) toxins in water. Rev Environ Contam Toxicol 163, 113-186.
Ebert D. 2005. Ecology, Epidemiology, and Evolution of Parasitism in Daphnia. Bethesda (MD):
National Center for Biotechnology Information (US); Available from:
http://www.ncbi.nlm.nih.gov/books/NBK2036/
Ebert D. 2011. A genome for the environment. Science 331, 539-540.
Edler L, Fernö S, Lind MG, Lundberg R, Nilsson PO. 1985. Mortality of dogs associated with a bloom
of the cyanobacterium Nodularia spumigena in the Baltic Sea. Ophelia 24, 103-109.
Edwards C, Beatti KA, Scrimgeour CM, Codd GA. 1992. Identification of anatoxin-A in benthic
cyanobacteria (blue-green algae) and in associated dog poisonings at Loch Insch, Scotland.
Toxicon 30, 1165-1175.
Ekman-Ekebom M, Kauppi M, Sivonen K, Niemi M, Lepistö L. 1992. Toxic cyanobacteria in some
finnish lakes. Env Toxic Water 7, 201-213.
Emler S, Scholze M, Kortenkamp A. 2011. The suitability of concentration addition for predicting the
effects of multi-component mixtures of up to 17 anti-androgens zith varied structural features in
an in vitro AR antagonist assay. Toxicol Appl Pharmacol 257, 189-197.
Ersmark K, Del Valle JR, Hanessian S. 2008. Chemistry and biology of the aeruginosin family of
serine protease inhibitors. Angew Chem Int Ed Engl 47, 1202-1223.
EPA US: Methods for Measuring the Acute Toxicity of Effluents and Receiving Waters to Freshwater
and Marine Organisms, 5th addition. Washington, DC: U.S. EPA, Office of Water; 2002:275.
European Comission. 2006. Directive 2006/7/EC of the European Parliament and of the Council of 15
February 2006 concerning the management of bathing water quality and repealing Directive
76/160/EEC.
European Comission. 2012. Environment: A new approach to assessing toxic chemical mixtures.
European Comission IP/12/541. http://europa.eu/rapid/press-release_IP-12-541_en.htm
Eurostat. 2007. The use of plant protection products in the European Union, Data 1992-2003.
Eurostat, Statistical Books, 215p.

References
196
Falconer IR. 2001. Toxic cyanobacterial bloom problems in Australian waters: risks and impacts on
human health. Phycologia 40, 228-233.
Faust M, Altenburger R, Backhaus T, Blanck H, Boedeker W, Gramatica P, Hamer V, Scholze M,
Vighli M, Grimme LH. 2003. Joint algal toxicity of 16 dissimilarly acting chemicals is predictable
by the concept of independent action. Aquat toxicol 63, 43-63.
Faust, M., Scholze, M. 2004 Competing concepts for the prediction of mixture toxicity: Do the
differences matter for regulatory purposes? EVKI-CT-1999-00012, European Union project
BEAM, final. European Commission, Brussels, Belgium.
Ferrari A, Venturino A, Pechén de D'Angelo AM. 2007. Effects of carbaryl and zinphos methyl on
juvenile rainbow trout (Oncorhynchus mykiss) detoxifying enzymes. Pestic Biochem Physiol 88,
134-142.
Fisher RA. 1922. On the interpretation of χ² from contingency tables, and the calculation of P. J R Stat
Soc 85, 87-94.
Fin WG. 2007. Diagnostic pathology and laboratory medicine in the age of “omics”: a paper from the
2006 William Beaumont Hospital Symposium on Molecular Pathology. J Mol Diagn 9, 431-436.
Finney DJ. 1971. Probit analysis. Cambridge, Cambridge University Press. 272p.
Fitzgerald DJ, Cunliffe DA, Burch MD. 1999. Development of health alerts for cyanobacteria and
related toxins in drinking water in South Australia. Environ Tox 14, 203-209.
Fleischmann RD, Adams MD, White O, Clayton RA, Kirkness EF, Kerlavage AR, Bult CJ, Tomb JF,
Dougherty BA, Merrick JM and et al. 1995. Whole-genome random sequencing and assessmbly
of Haemophilus influenzae Rd. Science 269, 496-512.
Fox J. 2008. Applied Regression Analysis and Generalized Linear Models, Second Edition. Sage.
688p.
Fristachi A, Sinclair JL. 2008. Occurrence of cyanobacterial harmful algal blooms. In Cyanobacterial
Harmful Algal Blooms: State of the Science Research Needs Series: Advances in Experimental
Medicine and Biology, Vol 619, Hudnell KH, Ed., Springer: New York 2008; 43-105.
Fukuto TR, 1990. Mechanism of action of organophosphorus and carbamates insecticides. Environ
Health Perspect 87, 245-254.
Garcia-Reyero N, Escalon BL, Loh P., Laird JG, Kennedy AJ, Berger B, Perkins EJ. 2012.
Assessment of chemical mixtures and groundwater effects on Daphnia magna transcriptomics.
Environ Sci Technol 46, 42-50.
Garcia-Reyero N, Kroll KJ, Liu L, Orlando EF, Watanabe KH, Sepulveda MS, Villeneuve DL, Perkins
EJ, Ankley GT, Denslow ND. 2009. Gene expression responses in male fathead minnows
exposed to binary mixtures of an estrogen and antieestrogen. BMC Genomics 10, 308-325.
Gene Expression Omnibus. 2014. http://www.ncbi.nlm.nih.gov/geo/

References
197
Gentleman RC, Carey VJ, Bates DM, Bolstad B et al. 2004. Bioconductor: open software development
for computational biology and bioinformatics. Genome Biology 5: R80.
Gerwick WH, Tan LT, Sitachitta N. 2001. Nitrogen-containing metabolites from marine cyanobacteria.
In:Cordell GA (ed) lkaloids: Chemistry and Biology,Vol. 57 Academic Press, NY, 75-184.
Gilbert JJ, Durand MW. 1990. Effect of Anabaena flos-aqua on the abilities of Daphnia and Keratella
to feed and reproduce on unicellular algae. Freshwater Biol 24, 577-596.
Ghazalpour A, Doss S, Zhang B, Wang S, Plaisier C, Castellanos R, Brozell A, Schadt EE, Drake TA,
Lusis AJ, Horvath S. 2006. Integrating genetic and network analysis to characterize genes related
to mouse weight. Plos Genet 2:e130.
Griffitt RJ, Hyndman K, Denslow ND, Barber DS. 2009. Comparison of molecular and histological
changes in zebrafish gills exposed to metallic nanopartciles. Toxicol Sci 107, 404-415.
Gugger M, Lyra C, Henriksen P, Couté A, Humber J, Sivonen K. 2002. Phylogenetic comparison of
the cyanobacterial genera Anabaena and Aphanizomenon. IJSEM 52, 1867-1880.
Gugger M, Lyra C, Suominen I, Tsitko I, Humbert J, Salkinoja-Salonen MS, Sivonen K. 2002. Cellular
fatty acids as chemotaxonomic markers of the genera Anabaena, Aphanizomenon, Microcystis,
Nostoc and Planktothrix (cyanobacteria). Int J Syst Evol Microbiol 52, 1007-1015.
Gustafsson S, Hansson L-A. 2004. Development of tolerance against toxic cyanobacteria in Daphnia.
Aquatic Ecology 38, 37-44.
Habib K, Kumar S, Manikar N, Zutshi S, Fatma T. 2011. Biochemical effect of carbaryl on oxidative
stress, antioxidant enzymes and osmolytes of cyanobacterium Calothirx brevissima. Bull Environ
Contam Toxicol 87, 615-620.
Hampton TH, Stanton BA. 2010. A novel approach to analyze gene expression data demonstrates
that the ΔF508 mutation in CFTR downregulates the antigen presentation pathway. Am J Physiol-
Lung C 298, 473-482.
Hanazato T, Dodson SI. 1995. Synergistic effects of low-oxygen concentration,predator kairomone,
and a pesticide on the cladoceran Daphnia pulex. Limnol Oceanogr 40, 700-709.
Haney JF, Forsyth DJ, James MR. 1994. Inhibition of zooplankton filtering rates by dissolved inhibitors
produced by naturally occurring cyanobacteria. Arch Hydrobiol 132, 1-13.
Haney JF, Sasner JJ, Ikawa M. 1995. Effects of products released by Aphanizomenon flos-aquae and
purified saxitoxin on the movements of Daphnia carinata feeding appendages. Limnol Oceanogr
40, 263-272.
Hapeman CJ, Dionigi CP, Zimba PV, McConnell LL. 2002. Agrochemical and nutrient impacts on
estuaries and other aquatic ecosystems. J Agric Food Chem 50, 4382-4384.
Hayes KP, Burch MD 1989. Odorous compounds associated with algal blooms in south australian
waters. Water Res 23, 115-121.

References
198
Heckmann L-H, Sibly RM, Connon R, Hooper HL, Hutchinson TH, Maund SJ, Hill CJ, Bouetard A,
Callaghan A. 2008. Systems biology meets stress ecology: linking molecular and organismal
stress responses in Daphnia magna. Genome Biol 9:R40.
Heisler J, Glibert PM, Burkholder JM, Anderson DM, Cochlan W, Dennison WC, Dortch Q, Gobler CJ,
Heil CA, Humphries E, Lewitus A, Magnien R, Marshall HG, Sellner K, Stockwell DA, Stoecker
DK, Suddleson M. 2008. Eutrophication and harmful algal blooms: A scientific consensus,
Harmful Algae 8, 3-13.
Henriksen P, Carmichael WW, Am J, Moestrup ø. 1997. Detection of an anatoxin-a(s)-like
anticholinesterase in natural blooms and cultures of cyanobacteria/blue-green algae from danish
lakes and in the stomach contents of poisoned birds. Toxicon 35, 901-913.
Heugens EH, Hendriks AJ, Dekker T, Van Straalen NM, Admiraal W. 2001. A review of the effects of
multiple stressors on aquatic organisms and analysis of uncertainty factors for use in risk
assessment. Crit Rev Toxicol 31, 247-284.
Heugens EH, Jager T, Creyghton R, Kraak MH, Hendriks AJ, van Straalen NM, Admiraal W. 2003.
Temperature-dependent effects of cadmium on Daphnia magna: accumulation versus sensitivity.
Environ Sci Technol 37, 2145-2151.
Hietala J, Lauron-Maatta C, Walls M. 1997. Life history responses of Daphnia clones to toxic
Microcystis at different food levels. J Plankt Res 19, 917-926.
Hietala J, Reinikainen M, Walls M. 1995. Variation in life history responses of Daphnia to toxic
Microcystis aeruginosa. J Plankton Res 17, 2307-2318.
Holmstrup M, Bindesbøl A-M, Oostingh GJ, Duschl A, Scheil V, Köhler H-R, Loureiro S, Soares
AMVM, Ferreira ALG, Kienle C, Gerhardt A, Laskowski R, Kramarz PE, Bayley M, Svendsen C,
Spurgeon DJ. 2010. Interactions between effects of environmental chemicals and natural
stressors: A review. Sci Total Environ 408, 3746-3762.
Hook SE, Skillman AD, Gopalan B, Small JA, Schultz IR. 2008. Gene expression profiles in rainbow
trout, Onchorynchus mykiss, exposed to a simple chemical mixture. Toxicol Sci 102, 42-60.
Hooper MJ, Ankley GT, Cristol DA, Maryoung LA, Noyes PD, Pinkerton KE. 2013. Interactions
between chemical and climate stressors: A role for mechanistic toxicology in assessing climate
change risks. Environ Toxicol Chem 32, 32-48.
Husmeier D. 2003. Sensitivity and specificity of inferring genetic regulatory interactions from
microarray experiments with dynamic Bayesian networks. Bioinformatics 19, 2271-2282.
Illumina. 2014. http://www.illumina.com/systems/hiseq-x-sequencing-system.ilmn
Insecticide Resistance Action Committee (IRAC), 2009. Mode of Action Classification. Available
online:
http://www.irac-online.org/wpcontent/uploads/2009/09/pp_moa_structure_poster_v2.7_16oct09.pdf

References
199
Ishida K, Okita Y, Matsuda H, Okino T, Murakami M. 1999. Aeruginosins, protease inhibitors from the
cyanobacterium Microcystis aeruginosa. Tetrahedron 55, 10971-10988.
Jager T, Heugens EHW, Kooijman SALM. 2006. Making sense of ecotoxicological test results:
towards application of precess-based models. Ecotoxicology 15, 305-314.
Jager T, Vandenbrouck T, Baas J, De Coen WM, Kooijman ALM. 2010. A biology-based approach for
mixture toxicity of multiple endpoints over the life cycle. Ecotoxicology 19, 351-361.
Jankowski T, Livingstone DM, Buhrer H, Forster R, Niederhauser P. 2006. Consequences of the 2003
European heat wave for lake temperature profiles, thermal stability, and hypolimnetic oxygen
depletion: Implications for a warmer world. Limnol Oceanogr 51, 815-819.
Jansen M, Vergauwen L, Vandenbrouck T, Knapen D, Dom N, Spanier Ki, Cielen A, De Meester L.
2013. Gene expression profiling of three different stressors in the water flea Daphnia magna.
Ecotoxicology 22, 900-914.
Jöhnk KD, Huisman J, Sharples J, Sommeijer B, Visser PM, Stroom JM. 2008. Summer heatwaves
promote blooms of harmful cyanobacteria. Global Change Biol 14, 495-512.
Jonker MJ, Svendsen C, Bedeaux JJM, Bongers M, Kammenga JE. 2005. Significance testing of
synergistic/antagonistic, dose level-dependent, or dose ratio-dependent effects in mixture dose-
response analysis. Environ Toxicol Chem 24, 2701-2713.
Kanehisa M, Goto S, Furumichi M, Tanabe M, Hirakawa M. 2010. KEGG for representation and
analysis of molecular networks involving diseases and drugs. Nucleic Acids Res. 38, 355-360.
Kirk KL, Gilbert JJ. 1992. Variation in herbivore response to chemical defenses: zooplankton foraging
on toxic cyanobacteria. Ecology 73, 2208-2217.
Koehn RK, Bayne BL. 1989. Towards a physiological and genetical understanding of the energetics of
the stress response. Biol J Linnean Soc 37, 151-171.
Korade Z, Mirnics K. 2011. Wnt signaling as a potential therapeutic target for frontotemporal dementia.
Neuron 71, 955-957.
Koski M, Engström J, Viitasalo M. 1999. Reproduction and survival of the calanoid copepod
Eurytemora affinis fed with toxic and non-toxic cyanobacteria. Mar Ecol Prog Ser 186, 187-197.
Kotai J. 1972. Instructions for preparation of modified nutrient solution Z8 for algae. Norwegian
Institute for Water Research, Oslo.
Kozlowsky-Suzuki B, Karjalainen M, Lehtiniemi M, Engström-Öst J, Koski M, Carlsson P. 2003.
Feeding, reproduction and toxin accumulation by the copepods Acartia bifilosa and Eurytemora
affinis in the presence of the toxic cyanobacterium Nodularia spumigena. Mar ecol Prog Ser 249,
237-249.
Kramer VJ, Etterson MA, Hecker M, Murphy CA, Roesijadi G, Spade DJ, Spromberg JA, Wang M,
Ankley GT. 2011. Adverse outcome pathways and ecological risk assessment: Bridging to
population-level effects. Environ Toxicol Chem 30, 64-76.

References
200
Lampert W. 1981. Inhibitory and toxic effects of blue-green algae on Daphnia. Internationale Revue
der gesamten Hydrobiologie 66, 285-298.
Lampert W. 1987. Laboratory studies on zooplankton‐cyanobacteria interactions. New Zealand
Journal of Marine and Freshwater Research 21, 483-490.
Lampert W. 2006. Daphnia: Model herbivore, predator and prey. Pol J Ecol 54, 607-620.
Lampert W. 2011. Daphnia: Development of a model organism in ecology and evolution. In: Kinne O.
(Ed.), Excellence in ecology, Book 21. International Ecology Institute, Oldendorf/Luhe.
Lampert W, Lampert KP, Larsson P. 2012. Induction of male production in clones of Daphnia pulex by
the juvenoid hormone methyl farnesoate under short photoperiod. Comp Biochem Physiol, Part
C: Toxicol Pharmacol 156, 130-133.
Landis WG, Durda JL, Brooks ML, Chapman PM, Menzie CA, Stahl RG, Stauber JL. 2013. Ecological
risk assessment in the context of global climate change. Environ Toxicol Chem 32, 79-92.
Langfelder P, Horvath S. 2008. WGCNA: an R package for weighted correlation network analysis.
BMC Bioinformatics 9:559.
Langridge P, Fleury D. 2011. Making the most of ‘omics’ for crop breeding. Trends Biotechnol 2 , -
40.
La-Salete R, Oliveira MM, Palmeira CA, Almeida J, Peixoto FP. 2008. Mitochondria a key role in
microcystin-LR kidney intoxication. J Appl Toxicol 28, 55-62.
Laskowski R, Bednarska AJ, Kramarz PE, oureiro S, Scheil V, Kudłek J, Holmstrup M. 2010.
Interactions between toxic chemicals and natural environmental factors: A meta-analysis and
case studies. Sci Total Environ 408, 3763-3774.
Latta LC, Weider LJ, Colbourne JK, Pfrender ME. 2012. The evolution of salinity tolerance in Daphnia:
a functional genomics approach. Ecol Lett 15, 794-802.
Leblanc GA. 2006. Crustacean endocrine toxicology: a review. Ecotoxicology, 16, 61-81.
Lethonen KK, Kankaanpää H, Leiniö S, Sipiä VO, Pflugmacher S, Sandberg-Kilpi E. 2003.
Accumulation of nodularin-like compounds from the cyanobacterium Nodularia spumigena and
changes in acetylcholinesterase activity in the clam Macoma balthica during short-term laboratory
exposure. Aquat Toxicol 64, 461-476.
Li L, Xie P, Chen J. 2005. In vivo studies on toxin accumulation in liver and ultrastructural changes of
hepatocytes of the phytoplanktivorous bighead carp i.p.-injected with extracted microcystins.
Toxicon 46, 533-545.
Li S, Tan Y. 2011. Hormetic response of cholinesterase from Daphnia magna in chronic exposure to
triaszophos and chlorpyrifos. J Environ Sci 23, 852-859.
Lock K, Janssen CR. 2002. Mixture Toxicity of Zinc, Cadmium, Copper, and Lead to the Potworm
Enchytraeus albidus. Ecotox Environ Saf 52,1-7.
References
201
Loewe S. 1928. Die quantitativen probleme der pharmakologie. Ergebn Physiol 27, 47-187.
Lopez JA, Colbourne JK Technical Report; The Center for Genomics and Bioinformatics, Indiana
University, Bloomington, Indiana, 2011. DOI http://dx.doi.org/10.2506/cgbtr-201102
Loureiro S, Svendsen C, Ferreira ALG, Pinheiro C, Ribeiro F, Soares AMVM. 2010. Toxicity of three
binary mixtures to Daphnia magna: comparing chemical modes of action and deviations from
conceptual models. Environ Toxicol Chem 29, 1716-1726.
rling M. 200 . Effects of microcystin-free and microcystin-containing strains of the cyanobacterium
Microcystis aeruginosa on growth of the grazer Daphnia magna. Environ Toxicol 18, 202-210.
rling M, Beekman W. 200 . Growth of Daphnia magna males and females fed with the
cyanobacterium Microcystis aeruginosa and the green alga Scenedesmus obliquus in different
proportions. Acta Hydrochim. Hydrobiol 34, 375-382.
Mahmood NA, Carmichael WW. 1986. Paralytic shellfish poisons produced by the freshwater
cyanobacterium Aphanizomenon flos-aqua NH-5. Toxicon 24, 175-186.
Miller RG. 1981 Simultaneous Statistical Inference. Springer. 272p.
MIRA Milieu- en natuurrapport Vlaanderen. Achtergronddocument 2007. Verspreiding van
bestrijdingsmiddelen. Claeys S, Steurbaut W, Theuns I, De Cooman W, De Wulf E, Eppinger R,
D’hont D, Dierckxens C, Goemans G, Belpaire C, Wustenberghs H, den Hond E, Peeters B,
Overloop S. Vlaamse Milieumaatschappij, www.milieurapport.be
Moe SJ, De Schamphelaere KAC, Clements WH, Sorensen MT, Van den Brink PJ, Liess M. 2013.
Combined andinteracting effects of global climate change and toxicants on populations and
communities. Environ Tox Chem 32, 49-61.
Moriya Y, Itoh M, Okuda S, Yoshizawa A, Kanehisa M. 2007. KAAS: an automatic genome annotation
and pathway reconstruction server. Nucleic Acids Res. 35, 182-185.
Mur L, Skulberg OM, Utkilen H. Cyanobacteria in the environment, in: Chorus I and Bartram J (Eds),
Toxic Cyanobacteria in Water. A Guide to Their Public Health Consequences, Monitoring and
Management, E & FN Spon on behalf of WHO, London 1999, 15-40.
Murray KE, Thomas SM, Bodourt AA. 2010. Prioritizing research for trace pollutants and emerging
contaminants in the freshwater environment. Environ Pollut 158, 3462-3471.
Hollander M, Wolfe DA. 1973. Nonparametric Statistical Methods. New York: John Wiley & Sons.
Pages 115-120.
National Center for Biotechnology Information. 2014. http://www.ncbi.nlm.nih.gov/genome/browse/
National Institutes for Health. 2014. http://www.nih.gov/science/models/
Neilan BA, Saker ML, Fastner J, Törökné A, Burns BP. 2003. Phylogeography of the invasive
cyanobacterium Cylindrospermopsis raciborskii. Mol Ecol 12, 133-140.
References
202
Nehring S. 1993. Mortality of dogs associated with a mass development of Nodularia spumigena
(Cyanophyceae) in a brackish lake at the German North Sea coast. J Plankton Res 15, 867-872.
Nizan S, Dimentman C, Shilo M, 1986. Acute toxic effects of the cyanobacterium Micocystis
aeruginosa on Daphnia magna. Limnol Oceanogr 31, 497-502.
Nogueira ICG, Lobo-da-Cunha A, Vasconcelos VM. 2006. Effects of Cylindrospermopsis raciborskii
and Aphanizomenon ovalisporum (cyanobacteria) ingestion on Daphnia magna midgut and
associated diverticula epithelium. Aquat Toxicol 80, 194-203.
Nogueira ICG, Pereira P, Dias E, Pflugmacher S, Wiegand C, Franca S, Vasconcelos VM. 2004a.
Accumulation of paralytic shellfish toxins (PST) from cyanobacterium Aphanizomenon
issatschenkoi by the cladoceran Daphnia magna. Toxicon 44, 773-780.
Noguiera ICG, Saker ML, Pflugmacher S, Wiegand C, Vasconcelos VM. 2004. Toxicity of the
cyanobacterium Cylindrospermopsis raciborskii to Daphnia magna. Environ Toxicol 19, 453-159.
Nota B, Van Straalen NM, Ylstra B, Roelofs D. 2010. Gene expression microarray analysis of heat
stress in the soil invertebrate Folsomia candida. Insect Mol Biol 19, 315-322.
OECD. 2014a. Lists of projects on the AOP development programme workplan.
http://www.oecd.org/env/ehs/testing/listsofprojectsontheaopdevelopmentprogrammeworkplan.htm
OECD. 2014b. http://www.oecd.org/chemicalsafety/testing/adverse-outcome-pathways-molecular-
screening-and-toxicogenomics.htm#AOP_wiki
OECD. 2013.Guidance document on developping and assessing adverse outcome pathways.
OECD. 2008. Guidelines for testing of chemicals, Daphnia magna reproduction test.
OECD. 1984. Guidelines for testing of chemicals, Daphnia sp, acute immobolisation and reproduction
test.
Ojaveer E, Simm M, Balode M, Purina I, Suursaar U. 2003. Effect of Microcystis aeruginosa and
Nodularia spumigena on survival of Eurytemora affinis and the embryonic and larval development
of the Baltic herring Clupea harengus membras. Environ Toxicol 18, 236-242.
Olmstead AW, LeBlanc GA. 2003. Insecticidal juvenile hormone analogs stimulate the production of
male offspring in the crustacean Daphnia magna. Environ Health Perspect 111, 919-924.
O’Neil JM, Davis TW, Burford MA, Gobler CJ. 2012. The rise of harmful cyanobacteria blooms: The
potential roles of eutrophication and climate change. Harmful Algae 14, 313-334.
Onodera H, Ohsima Y, Henriksen P, Yasumoto T. 1997. Confirmation of anatoxin-a(s), in the
cyanobacterium Anabaena lemmermannii as the cause of bird kills in Danish lakes. Toxicon 35,
1645-1648.
Orsini L, Schwenk K, De Meester L, Colbourne JK, Pfrender ME, Weider LJ. 2013. The evolutionary
time machine: using dormant propagules to forecast how populations can adapt to changing
environments. Trends Ecol Evol 28, 274-282.

References
203
Padisák J. 1997. Cylindrospermopsis raciborskii Woloszyńska Seenaya et Subba uja, an
expanding, highly adaptive cyanobacterium: worldwide distribution and review of its ecology
Archiv Hydrobiologie 107, 563-593.
Paerl, H.W., Fulton III, R.S., Moisander, P.H., Dyble, J. 2001. Harmful Freshwater Algal Blooms, With
an Emphasis on Cyanobacteria,” The Scientific World Journal, 1, 7 -113.
Paerl HW, Huisman J. 2008. Blooms like it hot. Science 320, 57-58.
Paerl HW, Huisman J. 2009. Climate change: a catalyst for global expansion of harmful cyanobacterial
blooms. Environ Microbiol Rep 1, 27-37.
Panosso R, Lürling M. 2010. Daphnia magna feeding on Cylindrospermopsis raciborskii: the role of
food composition, filament length and body size. J Plankton Res 32, 1393-1404.
Pavlopoulos GA, Secrier M, Moschopoulos C, Soldatos TG, Kossida S, Aerts J, Schneider R, Bagos
PG. 2011. Using graph theory to analyze biological networks. BioData Mining 4:10.
Pawiton Y, Michiels S, Koscielny S, Gusnanto A, Ploner A. 2005. False discovery rate, sensitivity and
sample size for microarray studies. Bioinformatics 21, 3017-3024.
Pattinson KR, Havel JE, Rhodes RG. 2003. Invasibility of a reservoir to exotic Daphnia lumholtzi:
experimental assessment of diet selection and life history responses to cyanobacteria.
Freshwater Biol 48, 223-246.
Paul VJ. 2008. Global warming and cyanobacterial harmful algal blooms. In Cyanobacterial Harmful
Algal Blooms: State of the Science and Research Needs; Advances in Experimental Medicine
and Biology, Vol. 619; Hudnell, H. K., Ed.; Springer: New York; 239-257.
Pearson LA, Hisbergues M, Börner T, Dittmann E, Neilan BA. 2004. Inactivation of an ABC
Transporter Gene, mcyH, results in loss of microcystin production in the cyanobacterium
Microcystis aeruginosa PCC7806. Appl Environ Microbiol 70, 6370-6378.
Peperzak L. 2003. Climate change and harmful algal blooms in the North Sea. Acta Oecol 24, 139-
144.
Pereira JL, Hill CJ, Sibly RM, Bolshakov VN, Goncalves F, Heckmann LH, Callaghan A. 2010. Gene
transcription in Daphnia magna: Effects of acute exposure to a carbamate insecticide and an
acetanilide herbicide. Aquat Toxicol 97, 268-276.
Pereira P, Onodera H, Andrinolo D, Franca S, Araújo F, Lagos N, Oshima Y. 2000. Paralytic shellfish
toxins in the freshwater cyanobacterium Aphanizomenon flos-aqua, isolated from Montargil
reservoir Portugal. Toxicon 38, 1689-1702.
Perschbacher PW. 2005. Temperature effects on acute copper toxicity to juvenile channel catfish
Ictalurus punctatus. Aquaculture 243, 225-228.
Pfaffl MW. 2001. A new mathematical model for relative quantification in real-time RT-PCR. Nucleic
Acids Res. 29, e45, DOI 10.1093/nar/29.9.e45.

References
204
Pires LMD, Sarpe D, Brehm M, Ibelings BW. 2011. Potential synergistic effects of microcystins on
bacterial lipopolysaccharides on life history traits of Daphnia galeata raised on low and high food
levels. Aquat Toxicol 104, 230-242.
Piorreck M, Baasch KH, Pohl P. 1984. Biomass production, total protein, chlorophylls, lipids and fatty
acids of freshwater green and blue-green algae under different nitrogen regimes. Phytochemistry
23, 207-216.
Pöch G. 1993. Combined effects of drugs and toxic agents. In: Modern Evaluation in Theory and
Practice. Springer, Wien.
Pope CN. 1999. Organophosphorus pesticides: do they all have the same mechanism of toxicity. J
Toxicol Environ Health Part B: Crit Rev 2, 161-181.
Pope, C., Karanth, S., Liu, J. 2005. Pharmacology and toxicology of cholinesterase inhibitors: uses
and misuses of a common mechanism of action. Environ Toxicol Pharmacol 19, 433-446.
Poynton HC, Lazorchak J, Impellitteri C, Blalock B, Smith ME, Struewing K, Unrine J, Roose D. 2013.
Toxicity and transcriptomic analysis in Hyalella Azteca suggest increased exposure and
susceptibility of epibenthic organisms to zinc oxide nanoparticles. Environ Sci Technol 47, 9453-
9460.
Poynton HC, Lazorchak J, Impellitteri C, Smith ME, Rogers K, Patra M, Hammer K, Allen J, Vulpe C.
2011. Differential gene expression in Daphnia magna suggests distinct modes of action and
bioavailability for ZnO nanoparticles and Zn ions. Environ Sci Technol 45, 762-768.
Poynton HC, Loguinov AV, Varshavsky JR, Chan S, Perkins EJ, Vulpe CD. 2008. Gene expression
profiling in Daphnia magna Part I: Concentration-dependent profiles provide support for the No
Observed Transcriptional Effect Level. Environ Sci Technol 42, 6250-6256.
Poynton HC, Varshavsky JR, Chang B, Cavigiolio G, Chan S, Holman PS, Loguinov AV, Bauer DJ,
Komachi K, Theil EC, Perkins EJ, Hughes O, Vulpe CD. 2007. Daphnia magna
ecotoxicogenomics provides mechanistic insights into metal toxicity. Environ Sci Technol 41,
1044-1050.
Poynton HC, Vulpe CD. 2009. Ecotoxicogenomics: Emerging technologies for emerging contaminants.
J American Water Resources Association 45, 83-96.
Qi S, Wang C, Chen X, Qin Z, Li X, Wang C. 2013. Toxicity assessments with Daphnia magna of
Guadipyr, a new neonicotinoid insecticide and studies of its effect on acetylcholinesterase
(AChE), glutathione S-transferase (GST), catalase (CAT) and chitobiase activities. Ecotox
Environ Saf 98, 339-344.
Qui T, Xie P, Liu Y, Li G, Xiong Q, Hao L, Li H. 2009. The profound effects of microcystin on cardiac
antioxidant enzymes, mitochondrial function and cardiac toxicity in rat. Toxicol. 257, 86-94.
Rao SD, Banack SA, Cox PA, Weiss JH. 2001. BMAA selectively injures motor neurons via
AMPA/kainite receptor activation. Experimental Neurology 20, 224-252.

References
205
R Developmental Core Team. 2005. R: A language and environment for statistical computing,
Reference index Version 2.12.2. R Foundation for Statistical Computing, Vienna. http://www.R-
project.orgRelyea R, Hoverman J. 2006. Assessing the ecology in ecotoxicology: a review and
synthesis in freshwater systems. Ecol Lett 9, 1157-1171.
Relyea RA, Mills N. 2001. Predator-induced stress makes the pesticide carbaryl more deadly to gray
treefrog tadpoles (Hyla versicolor). Proc Natl Acad Sci 98, 2194-2196.
Relyea RA. 2004. Synergistic impacts of malathion and predatory stress on six species of North
American tadpoles. Environ Toxicol Chem 23, 1080-1084.
Repka S. 1996. Inter- and intraspecific differences in Daphnia life histories in response to two food
sources: the green alga Scenedesmus and the filamentous cyanobacterium Oscillatoria. J
Plankton Res 18, 1213-1223.
Repka S. 1997. Effects of food type on the life history of Daphnia clones from lakes differing in trophic
state. II. Daphnia cucullata feeding on mixed diets. Freshwater Biol 38, 685-692.
Ritz, C., Streibig, J. C. 2005. Bioassay analysis using R. J Stat Softw 12, 1-22.
ohrlack T, Dittmann E, Henning M, B rner T, Kohl J. 1 . ole of microcystins in poisoning and
food ingestion inhibition of Daphnia galeata caused by the cyanobacterium Microcystis
aeruginosa. Appl Environ Microbiol 65, 737-739.
Rohrlack T, Christoffersen K, Kaebernick M, Neilan BA. 2004. Cyanobacterial protease inhibitor
microviridin J causes a lethal molting disruption in Daphnia pulicaria. Appl Environ Microbiol 70,
5047-5050.
Royston P. 1982. An extension of Shapiro and Wilk's W test for normality to large samples. Appl Stat,
31, 115-124.
Saelens X, Festjens N, Vande Walle L, van Gurp L, van Loo G, Vandenabeele P. 2004. Toxic proteins
released from mitochondria in cell death. Oncogene 23, 2861-2874.
Sandler B, Murakami M, Clardy J. 1998. Atomic structure of the trypsin -aeruginosin 98-B complex J.
Am. Chem. Soc. 120, 595-596.
Sano T, Beattie KA, Codd GA, Kaya K. 1998. Two-(Z)-dehydrobutyrine-containing microcystins from a
hepatotoxic bloom of Oscillatoria agardhii from Soulseat Loch, Scotland. J Nat Prod 61, 851-853.
SCHER, SCCS, SCENIHR. Opinion on the toxicity and assessment of chemical mixtures, 2012.
Schiedek D, Sundelin B, Readman JW, Macdonald RW. 2007. Interactions between climate change
and contaminants. Mar Pollut Bull 54, 1845-1856.
Schirmer K, Fischer BB, Madureira DJ, Pillai S. 2010. Transcriptomics in ecotoxicology. Anal Bioanal
Chem 397, 917-923.
Schopf JW. 2000. The fossil record: tracing the roots of the cyanobacterial lineage. In: Whitton BA,
Potts M (eds) The ecology of cyanobacteria. Kluwer Academic Publishers, Dordrecht, 13-35.

References
206
Schwarzenberger A, Zitt A, Kroth P, Mueller S, Von Elert E. 2010. Gene expression and activity of
digestive proteases in Daphnia: effects of cyanobacterial protease inhibitors. BMC Physiol 10:6.
Sellner, K.G. 1997. Physiology, ecology, and toxic properties of marine cyanobacteria blooms. Limnol.
Oceanogr. 42, 1089-1104.
Sen B, Mahadevan B, DeMarini DM. 2007. Transcriptional responses to complex mixtures - a review.
Mut Res/Rev in Mut Res 636, 144-177.
Shaw GR, Sukenik A, Livne A, Chiswell RK, Smith MJ, Seawright AA, Norris RL, Eaglesham GK,
Moore MR. 1999. Blooms of the cylindrospermopsin containg cyanobacterium, Aphanizomenon
ovalisporum (Forti), in newly constructed lakes, Queensland, Australia. Environ Toxicol 14, 167-
177.
Shaw JR, Colbourne JK, Davey JC, Glaholt SP, Hampton TH, Chen CY, Folt CL, Hamilton JW. 2007.
Gene response profiles for Daphnia pulex exposed to the environmental stressor cadmium
reveals novel crustacean metallothioneins. BMC Genomics 8:477.
Shaw JR, Pfrender ME, Eads BD, Klaper R, Callaghan A, Sibly RM, Colson I, Jansen B, Gilbert D,
Colbourne JK. 2008. Daphnia as an emerging model for toxicological genomics. Adv Experiment
Biol 2, 165-219.
Sherer, T.B., Richardson, J.R., Testa, C.M., Seo, B.B., Panov, A.V., Yagi, T., Matsuno-Yagi, A., Miller,
G.W., Greenamyre, J.T., 2006. Mechanism of toxicity of pesticides acting at complex I: relevance
to environmental etiologies of Parkinsons’s disease. J Neurochem 100, 14 -1479.
Sibly RM, Calow P. 1989. A life-cycle theory of responses to stress. Biol J Linnean Soc 37, 101-116.
Sigma Aldrich. 2014. http://www.sigmaaldrich.com
Sivonen K, Kononen K, Carmichael WW, Dahlem AM, Rinehart KL, Kiviranta J, Niemelä SI. 1989.
Occurrence of the hepatotoxic cyanobacterium Nodularia spumigena in the Baltic Sea and
structure of the toxin. Appl Environ Microbiol 55, 1990-1995.
Sivonen K, Namikoshi M, Evans WR, Carmichael WW, Sun F, Rouhiainen L, Luukkainen R, Rinehart
KL. 1992. Isolation and characterization of a variety of microcystins from seven strains of the
cyanobacterial genus Anabaena. Appl Environ Microbiol 58, 2495-2500.
Sivonen K, Niemelä SI, Niemi RM, Lepistö L, Luoma TH, Räsänen LA. 1990. Toxic cyanobacteria
(blue-green algae) in Finnish fresh and coastal waters. Hydrobiologia 190, 267-275.
Smyth GK. 2004. Linear models and empirical Bayes methods for assessing differential expression in
microarray experiments. Stat. Appl. Genet. Mol. Biol. 3, 1; DOI 10.2202/1544-6115.1027.
Smyth GK, Altman NS. 2013. Separate-channel analysis of two-channel microarrays: recovering inter-
spot information. BMC Informatics 14:165.
Soares MCS, Lürling M, Panosso R, Huszar V. 2009. Effects of the cyanobacterium
Cylindrospermopsis raciborskii on feeding and life-history characteristics of the grazer Daphnia
magna. Ecotoxicol Environ Safe 72, 1183-1189.

References
207
Soetaert A, Vandenbrouck T, van der Ven K, Maras M, van Remortel P, Blust R, De Coen WM. 2007.
Molecular responses during cadmium-induced stress in Daphnia magna: Integration of differential
gene expression with higher-level effects. Aquatic Toxicol 83, 212-222.
Sondergaard, M., S. E. Larsen, T. B. Jorgensen, and E. Jeppesen. 2011. Using chlorophyll a and
cyanobacteria in the ecological classification of lakes. Ecol. Indic. 11:1403-1412.
Stanier RY, Kunisawa R, Nadel M, Cohen-Bizarre G. 1971. Purification and properties of unicellular
blue-green algae (order Chroococcales). Bacteriol Rev 35, 171-205.
Stanley JK, Perkins EJ, Habib T, Sims JG, Chappel P, Escalon L, Wilbanks M, Garcia-Reyero N.
2013. The good, the bad, and the toxic: approaching hormesis in Daphnia magna exposed to an
energetic compound. Environ Sci Technol 47, 9424-9433.
Stork T, Thomas S, Rodrigues F, Silies M, Naffin E, Wenderdel S, Klambt C. 2009. Drosophila
neurexin IV stabilizes neuron-glia interactions at the CNS midline by binding to Wrapper.
Development 136, 1251-1261.
Sun H, Lü K, Minter EJA, Chen Y, Yang Z, Montagnes DJS. 2012. Combined effects of ammonia and
microcystin on survival, growth, antioxidant responses, and lipid peroxidiation of bighead carp
Hypophthalymythys nobilis larvae. J Harzar Mater 221-222, 213-219.
Tatarazako N, Oda S. 2007. The water flea Daphnia magna (Crustacea, Cladocera) as a test species
for screening and evaluation of chemicals with endocrine disrupting effects on crustaceans.
Ecotoxicology 16, 197-203.
Tatusov R, Fedorova N, Jackson J, Jacobs A, Kiryutin B et al. 2003. The COG database: an updated
version includes eukaryotes. BMC Bioinf. 4: 41.
Tillmanns, A. R., A. E. Wilson, F. R. Pick, Sarnelle, O. 2008. Meta-analysis of cyanobacterial effects
on zooplankton population growth rate: species-specific responses. Fund. Appl. Limnol. 171, 285-
295.
Toumi H, Boumaiza M, Millet M, Radetski CM, Felten V, Fouque C, Férard JF. 2013. Effects of
deltamethrin (pyrethroid insecticide) on growth, reproduction, embryonic development and sex
differentiation in two strains of Daphnia magna (Crustacea, Cladocera). Sci Total Environ 458-
460, 47-53.
Turja R, Guimarães L, Nevala A, Kankaanpää H, Korpinen S, Lehtonen KK. 2013. Cumulative effects
of exposure to cyanobacteria bloom extracts and benzo[a]pyrene on antioxidant defence
biomarkers in Gammarus oceanicus (Crustacea: Amphipoda). Toxicon 78, 68-77.
Ulén B, Bechmann M, Fölster J, Jarvie HP, Tunney H. 2007. Agriculture as a phosphorus source for
eutrophication in the north-west European countries, Norway, Sweden, United Kingdom and
Ireland: a review. Soil Use Manage 23, 5-15.
United States Environmental Protection Agency. 1996. Ecological Effects Test Guidelines OPPTS
850.1300 Daphnid Chronic Toxicity Test. US EPA, 12p.

References
208
Van Aggelen, G, Ankley T, Baldwin WS, Baerden DW et al. 2010. Integrating omic technologies into
aquatic ecological risk assessment and environmental monitoring: hurdles, achievements and
future outlook. Environ Health Perspect 118, 1-5.
van Apeldoorn ME, van Egmond HP, Speijers GJA, Bakker HJI. 2007. Toxins of cyanobacteria. Mol
Nutr Food Res 51, 7-60.
Vandegehuchte MB, Vandenbrouck T, De Coninck D, De Coen WM, Janssens CR. 2010. Gene
transcription and higher-level effects of multigenerational Zn exposure in Daphnia magna.
Chemosphere 80, 1014-1020.
Vandenbrouck T, Jones OAH, Dom N, Griffin JL, De Coen W. 2010. Mixtures of similarly acting
compounds in Daphnia magna: From gene to metanolite and beyond. Environ Int 36, 254-268.
Vandenbrouck T, Soetaert A, van der Ven K, Blust R, De Coen W. 2009. Nickel and binary metal
mixture responses in Daphnia magna: molecular fingerprints and suborganismal effects. Aquat
Toxicol 92, 18-29.
Van Gestel CAM, Hensbergen PJ. 2009. Interaction of Cd and Zn toxicity for Folsomia candida Willem
(Collembola: Isotomidaa) in relation to bioavailability in soil. Environ Toxicol Chem 16, 1177-
1186.
Van Gestel CAM, Jonker M, Kammenga JE, Laskowski R, Svendsen C. 2010. Mixture toxicity: Linking
approaches from ecological and human toxicology. First ed., CRC Press, Florida.
Van Halderen A, Harding WR, Wessels JC, Schneider DJ, Heine EW, Van der Merwe J, Fourie JM.
1995. Cyanobacterial (blue-green algae) poisoning of livestock in the western Cape Province of
South Africa. J S Afr Vet Assoc 66, 260-264.
Van Straalen NM, Feder ME. 2012. Ecological and Evolutionary Functional Genomics - how can it
contribute to the risk assessment of chemicals? Environ Sci Technol 46, 3-9.
Vega MP, Pizarro RA. 2000. Oxidative stress and defence mechanisms of the freshwater cladoceran
Daphnia longispina exposed to UV radiation. J. Photochem. Photobiol. B 54, 121-125.
Villaroel MJ, Ferrando MD, Sancho E, Andreu E. 1999. Daphnia magna feeding behavior after
exposure to tetradifon and recovery from intoxication. Ecotox Environ Saf 44, 40-46.
Villaroel MJ, Ferrando MD, Sancho E, Andreu E. 2008. Population dynamics in Daphnia Magna as
modified by chronic tetradifon stress. J Environ Sci Health, Part B 35, 221-227.
Villaroel MJ, Sancho E, Andreu-Moliner E, Ferrando MD. 2009. Biochemical stress response in
tetradifon exposed Daphnia magna and its relationship to individual growth and reproduction. Sci
Total Environ 407, 5537-5542.
Villeneuve DL, Garcia-Reyero N. 2011. A vision and strategy for predictive ecotoxicology testing in the
21st century. Environ Toxicol Chem 30, 1-8.

References
209
von Elert, E. 2004. Food quality constraints in Daphnia: interspecific differences in the response to the
absence of a long chain polyunsaturated fatty acid in the food source. Hydrobiologia 526, 187-
196.
Von Elert E, Martin-Creuzburg D, Le Coz JR. 2003. Absence of sterols constrains carbon transfer
between cyanobacteria and a freshwater herbivore (Daphnia galeata). Proc R Soc Lond B 270,
1209-1214.
Wagner, C., Adrian, R. 2011. Consequences of changes in thermal regime for plankton diversity and
trait composition in a polymictic lake: a matter of temporal scale. Freshwater Biol. 56, 1949-1961.
Walter P, Ron D. 2011. The unfolded protein response: From stress pathway to homeostatic
regulation. Science 334, 1081-1086.
Wang L, Tang H, Thayanithy V, Subramanian S, Oberg LA, Cunnignham LM, Cerhan JR, Steer CJ,
Thibodeau SN. 2009. Gene networks and microRNAs implicated in aggressive prostate cancer.
Cancer Res 69:9490.
Warne MSTJ, Hawker DW. 1995. The number of componets in a mixture determines whether
synergistic and antagonistic or additive toxicity predominate: the funnel hypothesis. Ecotox
Environ Saf 31, 23-28.
Weaver JMJ, Ross-Innes C.S. Fitzgerald R.C. 2014. The –omics revolution and oesophageal
adenocarcinoma. Nat Rev Gastroenterol Hepatol 11, 19-27.
Weismann A. 1880. Beiträge zur Naturgeschichte der Daphnoiden. Zeitschrift für wissenschaftliche
Zoologie 33, 55-70.
Wiegand C, Pflugmacher S. 2005. Ecotoxicological effects of selected cyanobacterial secondary
metabolites a short review. Toxicol Appl Pharmacol 203, 201-218.
Wiedner C, Rücker J, Brüggeman R, Nixdorf B. 2007. Climate change affects timing and size of
populations of an invasive cyanobacterium in temperate regions. Oecologia 152, 473-484.
Wilson AE, Sarnelle O, Tillmanns AR. 2006. Effects of cyanobacterial toxicity and morphology on the
population growth of freshwater zooplankton: Meta-analyses of laboratory experiments. Limnol
Oceanogr 51, 1915-1924.
World Health Organization. 2005. Guidelines for safe recreational water environments Volume 1:
coastal and fresh waters. 253p.
Yang Z, Xiang F, Minter EJA, Lü K, Chen Y, Montagnes DJS. 2011. The interactive effects of
microcystin and nitrite on life-history parameters of the cladoceran Daphnia obtuse. J Hazar
Mater 190, 113-118.
Yang Z, Lü K, Chen Y, DJS Montagnes. 2012. The interactive effects of ammonia and microcystins on
life-history traits of the cladoceran Daphnia magna: Synergistic or antagonistic? PLOS One 7,
e32285.

References
210
Zhang H, Zhang J, Chen Y, Zhu Y. 2007. Influence of intracellular Ca2+, mitochondria membrane
potential, reactive oxygen species, and intracellular ATP on the mechanism of microcystin-LR
induced apoptosis in Carassius auratus lymphocytes in vitro. Environ Toxicol 22, 559-564.
Zhang B, Horvath S: A General Framework for Weighted Gene Co-expression Network Analysis. Stat
Appl Genet Mol Biol 2005, 4: Article 17.
Zhao Y, Xie P, Tanga R, Zhang X, Li L, Li D. 2008. In vivo studies on the toxic effects of microcystins
on mitochondrial electron transport chain and ion regulation in liver and heart of rabbit. Comp
Biochem Physiol C 148, 204-210.
Zinke I, Schütz CS, Katzenberger JD, Bauer M, Pankratz MJ. 2002 Nutrient control of gene expression
in Drosophila microarray analyis of starvation and suger-dependent response. The EMBO Journal
21, 6162-6173.
Zou E, Fingerman M. 1997. Synthetic estrogenic agents do not interfere with sex differentiation but do
inhibit molting of the cladoceran Daphnia magna. Bull Environ Contam Toxicol 58, 596-602.

Summary


Summary
213
Aquatic ecosystems are complex environments where organisms interact with a heterogeneous group
of stressors from anthropogenic and natural origin. Yet, current risk assessment practices fail to
include these combined effects of stressors and their potential interaction as they primarily use a
chemical-by-chemical approach. The lack of sufficient comprehensive data in literature and the lack of
predictive models further impede the incorporation of combined and interaction effect in environmental
regulation.
Combined and interaction effects are likely to increase significantly in the future. Anthropogenic factors
and climate change conditions stimulate bloom formation of potential toxic cyanobacteria. These
organisms are an emerging concern for both environmental and public health. Although effects on
mammals are well documented and understood, the mechanisms driving adverse effects on
zooplankton species remain unclear and research is largely biased towards effects of Microcystis.
Therefore, chapter two has focused on the effect of six cyanobacteria species, representing six main
genera, on the life history of the Daphnia. Effects of cyanobacteria were studied across the full
concentration response curve and compared with each other and with a starvation response. Daphnia
were exposed to cells of cyanobacteria rather than cyanobacterial toxins to more closely adhere to
environmental reality. The concentration response curves remained conserved across the six studied
cyanobacteria and were not significantly different from starvation treatments. This indicated a potential
common lack of nutritional quality across all cyanobacteria similarly affecting the fitness of D. pulex
rather than effects of different cyanobacterial toxins.
Cyanobacteria are likely to occur in environments with other stressors leading to multiple stress
conditions and altered responses of Daphnia exposed to cyanobacteria under such multiple stress
conditions. Indeed, the eutrophication of water bodies, known to enhance bloom formation, often
occurs in agricultural areas, which may give rise to unknown interaction effects with plant protection
products. In particular, insecticides can severely affect aquatic invertebrates and two studies have
shown interaction between insecticides and cyanobacteria on Daphnia. Given that each study focused
on specific combinations of stressors, conclusions cannot be generalized across different
cyanobacteria or insecticides and the potential interaction effects for insecticides and cyanobacteria in
general remain largely unknown. In chapter 3, these potential interaction effects were studied by
exposing Daphnia to binary combinations of a selection of cyanobacteria and insecticides. Combined
and interaction effects were evaluated within defined statistical frameworks with the two conceptual

Summary
214
models, i.e. concentration addition and independent action, under standard conditions of 21 day
exposure. Different interaction patterns were observed for insecticides with different molecular targets
when combined with Microcystis. In contrast, different cyanobacteria showed similar interaction
patterns when combined with carbaryl. Four out of eight combinations showed antagonistic deviations
patterns, three showed no interaction patterns whereas one yielded different patterns dependent on
the conceptual model. Independent action concluded synergistic deviations from non-interaction
whereas concentration addition concluded no significant deviations from non-interaction. Chapter 3
clearly highlighted that interaction effects cannot be generalized across modes of actions of
insecticides whereas results may potentially be generalized across different cyanobacteria combined
with the same insecticide. In agreement with general literature, the concentration addition conceptual
model provided more conservative predictions of effects than independent action from a risk
assessment point view.
Twenty-one day exposure experiments are however labor intensive and time consuming. Chapter 4
therefore focused on studying the effects on life history of a comprehensive set of 48 binary
combinations of insecticides and cyanobacteria under a shorter exposure time and with reduced
experimental design. Statistical evaluation of the effects is therefore only possible within the
independent action framework. This approach was however evaluated by comparing the results of
chapters 3 and 4 for those combinations that were repeated. The results in chapter 4 indicated the
occurrence of interaction effects to be a complex mechanism dependent upon several factors.
Conclusions regarding interaction effects were significantly altered by exposure concentration and
exposure design. As a consequence, studies on life history level without further mechanistic research
seem to be insufficient to attain a clear insight in the dynamics and processes leading to interactions.
The evolution of high throughput molecular technologies has enhanced the mechanistic understanding
of organismal responses under stress. Mechanistic understanding is not only crucial to identify the
driving factors of stress response but may also aid in building predictive models. Chapter 5 identified
the potential of these technologies by studying the stress response of Daphnia pulex to Microcystis
aeruginosa with high throughput microarrays. A comprehensive set of bioinformatics tools was
developed specifically taken into account the unique Daphnia genome within chapter 5 to identify
crucial pathways and gene networks involved in response to Microcystis. The stress response pattern
upon exposure to Microcystis consisted of four major pathways or gene networks as well as eight

Summary
215
paralogous gene families. Moreover, chapter 5 underlined the need to take into account the specific
and unique D. pulex genome structure in expression studies, which may influence conclusions drawn.
This genomic structure is characterized by among others, a high number of lineage specific or
unknown genes. Chapter 5 also highlighted how these genes can be functionally annotated to
environmentally relevant conditions.
Chapter 6 further applied microarray technology to study the response of Daphnia to the five other
studied cyanobacteria in chapter 2. The bioinformatics tools developed in chapter 5 were used to
compare similarities and differences across stress responses to each of these cyanobacteria at
different levels of molecular organization. Both mechanisms that were specific to a cyanobacterial
stressor as well as mechanisms that were conserved across the cyanobacterial stressors were
identified. The similarities and differences between these patterns depended upon the level of
biological organization. The observed discrepancy between these levels underlined the necessity of
such a research approach. Furthermore, the incorporation of the unique features of the genome under
study in the analysis benefitted the integration of these different levels of organization in a true
systems biology approach. Overall, cyanobacterial stress targeted mainly similar mechanisms
regardless of the cyanobacterial species yet the effects on these mechanisms are species-specific at
both the gene and organismal level.
In chapter 7, the molecular responses of animals to the 48 binary combinations, used in chapter 4,
were studied. Transcriptomics have been used to study interaction effects but often lack statistical
frameworks and a priori defined hypotheses. Chapter 7 put forward and applied three different
approaches and two different measures of deviation. Overall, filtering the data based upon no
overlapping 95% confidence intervals between observations and predictions and then calculating the
sum of M-values of all genes with significant deviations from non-interaction was the most consistent
approach allowing identification of statistical and biological significant genes. Genes with a significant
interaction effect across all combinations showed a diverse pattern of expression in both synergistic
and antagonistic directions. However, the general accepted terminology of synergism and antagonism
at the life history level was insufficient to explain the possible combinations and patterns of genes
demonstrating an interaction effect in terms of clear synergism or antagonisms. Functional analysis of
these genes revealed a diverse set of metabolic functions and pathways which indicated that
interaction effects trigger a complex general stress response in the organism.

Summary
216
Molecular high throughput technologies are increasingly used in research yet clear and direct links
between molecular and biological effects remain difficult to establish. Therefore, Chapter 8 integrated
all data from chapters 4 and 7 by building comprehensive gene networks on different parts of the
transcriptomic data generated in chapter 7. The modules of these gene networks were then in turn
correlated with life history parameters and interaction parameters at both the life history level, defined
in chapter 4, and the molecular level, defined in chapter 7. Significant correlations between modules
and deviation from non-interaction could only be identified when using both single and mixture
expression profiles. The absence of single expression profiles resulted in no significant correlations
with interaction at the life history level, which confirms the importance of including effects of single
stressors. Functional analysis of gene modules identified pathways such as hormone biosynthesis and
amino acid metabolism as well as significant proportion of lineage specific genes. Interaction effects
were also characterized by specific gene functions present in the significantly correlated modules such
as trypsins and neurexins IV. Overall, modules describing interaction effects were more diverse in
terms of module structure and connectivity than models describing reproduction effects which
underlined the complexity of interaction effects.
Finally, Chapter 9 gave an overview of the main conclusions reached throughout this dissertation and
how they have answered the concerns and research gaps put forward in the introduction. It has also
addressed the challenges that environmental research will still need to face in the future.

Samenvatting


Samenvatting
219
Aquatische ecosystemen zijn complexe omgevingen waar organismen interageren met een
heterogene groep stressoren van zowel antropogene als natuurlijke oorsprong. Echter, de huidige
richtlijnen voor risicoschattingen slagen er niet in deze gecombineerde effecten van stressoren en de
mogelijke interacties op te nemen en maken voornamelijk gebruik van een enkelvoudige benadering
waarin iedere chemische stof apart wordt beoordeeld. Het ontbreken van voldoende uitvoerige
gegevens in de literatuur en het gebrek aan voorspellende modellen belemmeren verder de
incorporatie van zowel gecombineerde effecten als interactie effecten in de milieuwetgeving.
Gecombineerde effecten en interactie effecten zullen waarschijnlijk in de toekomst sterk toenemen.
Antropogene factoren en toekomstige klimaatsveranderingen stimuleren de bloei vorming van
potentieel toxische cyanobacteriën. Deze organismen zijn een opkomende bedreiging voor zowel het
milieu als de volksgezondheid. Hoewel de effecten van cyanobacteriën op zoogdieren goed begrepen
en gedocumenteerd zijn, blijven de mechanismen achter de effecten op zoöplankton soorten
onduidelijk. Bovendien is onderzoek gebaseerd op de effecten van Microcystis. Daarom heeft
hoofdstuk 2 zich gericht op het effect van zes soorten cyanobacteriën, representatief voor de zes
belangrijkste genera, op de reproductie van Daphnia. Effecten van cyanobacteriën werden bestudeerd
op basis van een volledige concentratie responscurve en vergeleken met elkaar en met de respons op
uithongering. Daphnia werden blootgesteld aan cellen van cyanobacteriën in plaats van
cyanobacteriële toxinen om nauwer aan te sluiten bij de ecologische realiteit. De concentratie respons
curves waren gelijk tussen de zes onderzochte cyanobacteriën en waren dus niet significant
verschillend van de uithongerings-respons. Dit duidt op een mogelijk gemeenschappelijke gebrek aan
voedingswaarde in alle cyanobacteriën dat dan zo ook de reproductie van Daphnia pulex beïnvloedde
eerder dan effecten van verschillende cyanobacteriële toxines.
Cyanobacteriën komen ook voor in omgevingen met andere stressoren wat kan leiden tot
meervoudige stress en dus ook andere reacties van Daphnia die worden blootgesteld aan
cyanobacteriën in combinatie met mogelijke andere stressoren. Inderdaad, de eutrofiëring van vijvers
en meren, een factor die bloei vorming stimuleert, komt vaak voor in agrarische gebieden, die
aanleiding kunnen geven tot onbekende interactie effecten met gewasbeschermingsmiddelen. In het
bijzonder kunnen insecticiden ernstige gevolgen hebben op aquatische invertrebraten. Twee studies
hebben al interacties tussen insecticiden en cyanobacteriën op Daphnia aangetoond. Aangezien elk
van deze onderzoeken gericht is op specifieke combinaties van stressoren, kunnen conclusies niet

Samenvatting
220
veralgemeend worden. Dus blijven ook de mogelijke interactie effecten van combinaties van
insecticiden en cyanobacteriën in het algemeen nog grotendeels onbekend. In hoofdstuk 3, werden
deze mogelijke interactie effecten bestudeerd door het blootstellen van Daphnia aan binaire
combinaties van een selectie van cyanobacteriën en insecticiden. Gecombineerde effecten en
interactie effecten werden geëvalueerd binnen gedefinieerde statistische modellen, op basis van twee
conceptuele beschrijvingen: concentratie additie en onafhankelijke actie, onder standaard condities
van 21 dagen blootstelling. Verschillende interactiepatronen werden waargenomen voor insecticiden
met verschillende moleculaire targets in combinatie met Microcystis. Echter verschillende
cyanobacteriën vertoonden vergelijkbare interactie patronen in combinatie met carbaryl. Vier van de
acht combinaties vertoonden antagonistische afwijkingen, drie vertoonden geen interactie patronen
terwijl voor één het interactie patroon afhankelijk was van het conceptuele model. Het onafhankelijk
actie model besloot synergisme terwijl het concentratie additie model geen afwijkingen concludeerde.
Hoofdstuk 3 gaf dus duidelijk aan dat de interactie effecten niet veralgemeend kunnen worden over
werkingsmechanismen van insecticiden heen, terwijl de resultaten potentieel kunnen worden
veralgemeend over verschillende cyanobacteriën heen gecombineerd met hetzelfde insecticide. In
overeenstemming met de algemene literatuur, leverde het concentratie additie conceptueel model
meer conservatieve voorspellingen van effecten op dan het onafhankelijke actie conceptueel model
vanuit een risicoschattings-perspectief.
Eenentwintig dagen blootstellingexperimenten zijn echter arbeidsintensief en tijdrovend. Hoofdstuk 4
richtte zich daarom op het bestuderen van de effecten op de reproductie van Daphnia van een
uitgebreide set van 48 binaire combinaties van insecticiden en cyanobacteriën onder een kortere
blootstellingstijd en met beperkte experimentele opzet. Statistische evaluatie van de effecten was dus
alleen mogelijk met het onafhankelijke actie model. Deze aanpak werd echter geëvalueerd door de
resultaten van hoofdstuk 3 en 4 voor de combinaties die werden herhaald te vergelijken. De resultaten
in hoofdstuk 4, toonden aan dat het optreden van interactie effecten een complex mechanisme is
afhankelijk van verschillende factoren. Conclusies ten aanzien van interactie effecten waren significant
gewijzigd door concentratie en de blootstellingstijd. Bijgevolg lijken studies op organismaal niveau
zonder verder mechanistische onderzoek onvoldoende om een inzicht te krijgen in de dynamiek en
processen die leiden tot interacties.

Samenvatting
221
De evolutie van high throughput moleculaire technologieën hebben de mechanistische kennis van
organismale responsen onder stress versterkt. Mechanistische kennis is niet alleen cruciaal voor de
drijvende factoren van stress respons te identificeren, maar kan ook helpen bij het bouwen van
voorspellende modellen. In hoofdstuk 5 werden de mogelijkheden van deze technologieën onderzocht
door het bestuderen van de stress respons van Daphnia pulex aan Microcystis aeruginosa met high
throughput microarrays. Een uitgebreide set van bioinformatica tools werd ontwikkeld in hoofdstuk 5
op maat van het unieke Daphnia genoom met als doel cruciale pathways en netwerken van genen
betrokken bij de reactie op Microcystis te identificeren. De reactie op stress bij blootstelling aan
Microcystis bestaat uit vier belangrijke pathways of gen- netwerken, alsook acht paraloge gen families.
Bovendien, onderstreept hoofdstuk 5 de noodzaak om rekening te houden met de specifieke en
unieke D. pulex genoomstructuur in expressie studies, gezien dit de gemaakte conclusies kan
beïnvloeden. De genomische structuur wordt gekenmerkt door onder andere een groot aantal
daphnia-specifieke of onbekende genen. Hoofdstuk 5 ging dieper in op hoe deze genen functioneel
kunnen geannoteerd worden binnen een milieurelevante context.
Hoofdstuk 6 gebruikte microarray technologie om de respons van Daphnia aan de vijf andere
onderzochte cyanobacteriën in hoofdstuk 2 te bestuderen. De ontwikkelde bioinformatica tools in
hoofdstuk 5 werden gebruikt om gelijkenissen en verschillen tussen stress responsen te vergelijken
met elk van deze cyanobacteriën op verschillende niveaus van de moleculaire organisatie. Zowel
mechanismen die specifiek zijn voor een cyanobacteriële stressor als mechanismen die gelijk zijn voor
de cyanobacteriële stressoren werden geïdentificeerd. De overeenkomsten en verschillen tussen deze
patronen hing af van de niveaus van biologische organisatie. De waargenomen verschillen tussen
deze niveaus benadrukte de noodzaak van een dergelijke onderzoeksaanpak. Bovendien werd de
analyse positief beïnvloed door de integratie van de unieke kenmerken van het genoom binnen deze
verschillende niveaus van organisatie in een echte sytems biology benadering. Cyanobacteriële stress
was dus overwegend gericht op soortgelijke mechanismen onafhankelijk van de cyanobacteriën
soorten echter de effecten op deze mechanismen zijn soort specifiek gezien deze mechanismen
gereguleerd worden door verschillende genen bij blootstelling aan verschillende cyanobacteriën.
In hoofdstuk 7 werden de moleculaire profielen van de daphnias bij blootstelling aan 48 binaire
combinaties van insecticiden en cyanobacteriën, die in hoofdstuk 4 getest werden, bestudeerd.
Transcriptomics worden gebruikt om interactie-effecten te bestuderen maar missen vaak statistische

Samenvatting
222
modellen en a priori gedefinieerde hypotheses. Hoofdstuk 7 stelde voor en implementeerde drie
verschillende benaderingen om data te filteren en twee mogelijke predictors van deviatie van non-
interactie. Het filteren van de data op basis van geen overlappende 95% betrouwbaarheidsintervallen
tussen observaties en predicties was over de hele lijn de meest consistente aanpak. De som van alle
M-waarden van alle genen met een significante deviatie van non-interactie was de meest consistente
aanpak die toeliet om statistisch en biologisch significante genen te identificeren. Genen met
significante interactie effecten over alle combinaties heen vertoonden een zeer diverse expressie
patroon met zowel synergistische als antagonistische effecten. De huidige terminologie om
synergismen en antagonismen te beschrijven was echter ontoereikend om de verschillende patronen
van genen met een interactie effect te beschrijven. Functionele analyse van deze genen wees op een
divers set van metabolische functies en pathways wat suggereerde dat interactie effecten kunnen
leiden tot een complexe algemene reactie op stress in het organisme.
Moleculaire highthroughput technologieën worden steeds vaker gebruikt in het onderzoek maar het
blijk echter nog steeds moeilijk om duidelijk en directe verbindingen tussen de moleculaire en
biologische effecten te maken. Daarom integreerde hoofdstuk 8 alle gegevens van de hoofdstukken 4
en 7 door de constructie van uitgebreide netwerken van genen op verschillende delen van de
transcriptomics gegevens die in hoofdstuk 7 gegenereerd werden. De modules van deze gen-
netwerken werden dan op hun beurt gecorreleerd met organismale parameters en interactie
parameters op zowel de organismaal niveau, parameters uit hoofdstuk 4, als het moleculaire niveau,
beschreven in hoofdstuk 7. Significante correlaties tussen modules en deviatie van non-interactie
konden enkel geïdentificeerd worden wanneer zowel expressieprofielen na blootstelling aan
enkelvoudige stress als expressieprofielen na blootstelling aan mengsels beschouwd werden. Het
weglaten van deze expressieprofielen na blootstelling aan enkelvoudige stress leidde tot geen
significante correlaties met interactie op het organismale niveau. Dit bevestigde het belang om
effecten van enkelvoudige stress in rekening te brengen. Functionele analyse van de modules
identificeerde verscheidene pathways waaronder de hormoon biosynthese en het aminozuur
metabolisme alsook een significant aandeel aan daphnia specifieke genen. Interactie effecten werden
ook gekarakteriseerd door specifieke gen functies zoals trypsines en neurexines. Modules die
correleren met interactie effecten waren in het algemeen meer diverse in zowel de structuur van de

Samenvatting
223
module als de connectiviteit binnen de module in vergelijking met modules die significant correleren
met effecten op reproductie. Dit benadrukt de complexiteit van interactie effecten.
Tot slot gaf hoofdstuk 9 een overzicht van de belangrijkste conclusies in dit proefschrift en hoe zij
hebben geantwoord op bepaalde problemen en onderzoek hiaten naar voren gebracht in de inleiding.
Verder werd er ook aandacht besteed aan de uitdagingen die milieuonderzoek nog te wachten staan.


Curriculum Vitae

Curriculum Vitae
227
Personalia
Name: Jana Asselman
Date of birth: October 8th, 1987
Place of birth: Dendermonde
Postal address: Krevelstraat 10, 9000 Gent
Mobile phone: +32 499 23 54 09
E-mail: [email protected]
Education
2010 - present PhD student in Bio-science Engineering
Ghent University, Belgium
PhD-dissertation: “Transcriptomic profiles and fitness of Daphnia exposed to
cyanobacteria and interactions with insecticides.” (Promotor: Prof. Dr. ir. Karel De
Schamphelaere)
2008 - 2010 Master of Science in Bioscience Engineering, Cell- and genebiotechnology
Ghent University, Belgium
Master-thesis: “Ecotoxicological and molecular characterization of metallothionein
genes in Daphnia pulex” (Promotors: Prof. Dr. ir. Karel De Schamphelaere and
Prof. Dr. Colin Janssen)
2005 - 2008 Bachelor in Bioscience Engineering, Cell- and genebiotchenology
Ghent University, Belgium
1999 - 2005 Secondary school degree in Mathematics & Sciences
Sint-Vincentius à Paulo Instituut, Gijzegem, Belgium
Curriculum Vitae
228
Professional employment
2010 - present Scientific researcher at the Laboratory of Environmental Toxicology
Faculty of Bioscience Engineering, Ghent University, Belgium
Publications
Peer-reviewed papers (A1)
[1] De Coninck DIM*, Asselman J*, Glaholt S, Janssen CR, Colbourne JK, Shaw JR, De
Schamphelaere KAC. 2014. Genome-wide transcription profiles provide insights in genotype-
dependent mechanisms of tolerance to two interacting stressors in Daphnia. Accepted in Environ
Sci Technol. *These authors contributed equally
[2] Asselman J*, Hochmuth JD*, De Schamphelaere KAC. 2014. A comparison of the sensitivities of
Daphnia magna and Daphnia pulex to six different cyanobacteria species. Accepted in Harmful
Algae. *These authors contributed equally.
[3] Hochmuth JD, Asselman J, De Schamphelaere KAC. 2014. Are interactive effects of harmful
algal blooms and copper pollution a concern for water quality management? Water Research: in
Press.
[4] Asselman J, Janssen CR, Smagghe G, De Schamphelaere, KAC. 2014. Ecotoxicity of binary
mixtures of Microcystis aeruginosa and insecticides to Daphnia pulex. Environ Pollut 188, 56-63.
[5] Asselman J, Shaw JR, Glaholt SP, Colbourne JK, De Schamphelaere KAC. 2013. Transcription
patterns of four metallothionein homologis in Daphnia pulex exposed to copper and cadmium are
time- and homolog-dependent. Aquat Toxicol 142-143, 422-430
[6] Asselman J, Meys J, Waegeman W, De Baets B, De Schamphelaere KAC. 2013. Combined
exposure to cyanobacteria and carbaryl results in antagonistic effects on the reproduction of
Daphnia pulex. Environmental Toxicology and Chemistry 32, 2153-2158.
[7] Asselman J, De Coninck DIM, Glaholt S, Colbourne JK, Janssen CR, Shaw JR, De
Schamphelare KAC. 2012. Identification of pathways, gene networks, and paralogous gene

Curriculum Vitae
229
families in Daphnia pulex responding to exposure to the toxic cyanobacterium Microcystis
aeruginosa. Environmental Science & Technology 46:8448-8457.
[8] Asselman J, Glaholt SP, Smith Z, Smagghe G, Janssen CR, Colbourne JK, Shaw JR, De
Schamphelaere KAC. 2012. Functional characterization of four metallothionein genes in Daphnia
pulex exposed to environmental stressors. Aquatic Toxicology 110-111, 54-65.
Non-peer-reviewed papers (A4)
[9] De Schamphelaere KA, Glaholt S, Asselman J, Messiaen M, De Coninck D, Janssen CR,
Colbourne JK, Shaw JR. 2011. Will genetic adaptation of natural populations to chemical pollution
result in lower or higher tolerance to future climate change? Integrated Environmental
Assessment and Management 7:141-143.
Platform presentations (presenting author)
[1] Asselman J, Pfernder M, Lopez J, Shaw J, Stock M, De Baets B, De Schamphelaere K.
TRanscriptomics and multiple stress: can gene expression elucidateinteracting effects in response
to multiple stressors? EMBO Conference on The mighty daphnia past present and future, 19-22
January 2014. Birmingham, UK.
[2] Asselman J, Pfrender M, Shaw J, Lopez J, Meys J, Waegeman W, De Baets B, De
Schamphelaere K. Studying combined exposure of cyanobacteria and carbaryl on Daphnia pulex
at both the life-history level and the molecular level. SETAC North America 34th Annual Meeting,
17-21 November 2013, Nashville, USA.
[3] Asselman J, De Coninck D, Pfrender M, Shaw J, Colbourne J, Lopez J, Glaholt S, Janssen C,
De Schamphelaere K. Integrating Genomics into ecotoxicology. Artemia Genome Day,
September 1st 2013, Ghent, Belgium.
[4] Asselman J, Pfrender M, Lopez J, Shaw J, De Schamphelaere K. Unraveling mode of actions
and toxin profiles with high throughput microarrays: a case study in Daphnia exposed to different
cyanobacterial stressors. 9th International Symposium on Toxic Cyanobacteria, 11-16
th August
2013, Pilaneseberg, South Africa.

Curriculum Vitae
230
[5] Vandegehuchte M, De Coninck D, Asselman J, Jansen M, Vandenbussche J, Vanhaecke L,
Decaestecker E, De Schamphelaere K, Janssen C. Global DNA methylation in Daphnia magna is
influenced by genotype and a wide variety of environmental stressors. 17th Pollutant Responses
in Marine Organisms (PRIMO) conference, 5-8 May 2013, Faro, Portugal.
[6] Asselman J, Pfrender M, Lopez J, Shaw J, De Schamphelaere K. Unraveling mode of actions
and toxin profiles with high throughput microarrays: a case study in Daphnia exposed to different
cyanobacterial stressors. SETAC Europe 23rd
Annual Meeting, 16-20 May 2013, Glasgow, UK.
[7] De Coninck D, Asselman J, Glaholt S, Colbourne J, Janssen C, Shaw J, De Schamphelaere K.
What transcriptomic mechanisms cause a cadmium-adapted Daphnia pulex genotype to be more
tolerant to cyanobacterial stress than a non-adapted genotype? SETAC Europe 23rd
Annual
Meeting, 16-20 May 2013, Glasgow, UK.
[8] Asselman J, Pfrender M, Lopez J, Shaw J, De Schamphelaere K. Unraveling mode of actions
and toxin profiles with high throughput microarrays: a case study in Daphnia exposed to different
cyanobacterial stressors. 18th National Symposium on Applied Biological Sciences, February 8
2013, Ghent, Belgium.
[9] Asselman J, Pfrender M, Lopez J, Shaw J, De Schamphelaere K. Unraveling mode of actions
and toxin profiles with high throughput microarrays: a case study in Daphnia exposed to different
cyanobacterial stressors. 18th National Symposium on Applied Biological Sciences, February 8
2013, Ghent, Belgium.
[10] De Coninck D, Asselman J, Glaholt S, Colbourne J, Janssen C, Shaw J, De Schamphelaere K.
Genomic mechanisms of co-tolerance of cadmium-adapted Daphnia pulex populations to
cyanobacterial stress. SETAC Europe 22nd
Annual Meeting, 20-24 May 2012, Berlin, Germany.
[11] Vandegehuchte M, De Coninck D, Asselman J, Jansen M, Trenti I, Vandenbussche J,
Vanhaecke L, Decaestecker E, De Schamphelaere K, Janssen C. Global DNA methylation in
Daphnia magna is influenced by genotype and a wide variety of environmental stressors. SETAC
Europe 22nd
Annual Meeting, 20-24 May 2012, Berlin, Germany.

Curriculum Vitae
231
[12] Asselman J,Smagghe G, Janssen CR, De Schamphelaere, KAC.interacting mixture toxicity
effects of a cyanobacterial stressor and insecticides may be partly grouped according to insect
mode of action. SETAC Europe 22nd
Annual Meeting, 20-24 May 2012. Berlin, Germany.
[13] Asselman J, De Coninck D, Glaholt S, Colbourne J, Janssen C, Shaw J, De Schamphelaere K.
Using the model organism Daphnia pulex to delineate molecular pathways responding to
environmental stress. SETAC North America 32nd
Annual Meeting, 13-17 November 2011,
Boston, USA.
[14] De Schamphelaere K, Asselman J, Glaholt S, Colbourne J, Janssen C, Shaw J.Unravelling the
genomic basis of the cross-tolerance fo Cd-adapted Daphnia pulex to cyanobacterial stress.
SETAC North America 31st Annual Meeting, 7-11 November 2010, Portland, USA.
[15] De Schamphelaere K, Asselman J, Glaholt S, Colbourne J, Janssen C, Shaw J. Will genetic
adaptation of Daphnia pulex to chemical stress result in lower or higher tolerance to climate
change. SETAC Europe 20th Annual Meeting, 23-27 May 2010, Sevilla, Spain.
[16] De Schamphelaere K, Asselman J, Glaholt S, Choi J, Colbourne J, Janssen C, Shaw J. Daphnia
that have genetically adapted to Cd stress are also tolerant to toxic cyanobacteria. SETAC North
America 30th Annual Meeting, 19-23 November 2009, New Orleans, USA.
Poster presentations (presenting author)
[1] Asselman J, Pfrender M, Lopez J, Shaw J, De Schamphelaere KAC. Unraveling mode of actions
and toxin profiles with high throughput microarrays: a case study in Daphnia exposed to different
cyanobacteria. 3rd
Nucleotides2Networks Symposium, 24th September 2013, Ghent, Belgium.
[2] Asselman J, Pfrender M, Lopez J, Shaw J, De Schamphelaere KAC. Unraveling mode of actions
and toxin profiles with high throughput microarrays: a case study in Daphnia exposed to different
cyanobacteria. EUROCORES Program Ecological and Evolutionary Functional Genomics
Conference, 26-30 May 2013, Noorwijkerhout, the Netherlands.
[3] De Coninck D, Asselman J, Glaholt S, Janssen CR, Shaw JR, De Schamphelaere KAC. Are
metal adapted Daphnia pulex populations better armed against future climate change stressors

Curriculum Vitae
232
than non-adapted populations? SETAC Europe 23rd
Annual Meeting, 16-20 May 2013, Glasgow,
UK.
[4] De Coninck D, Asselman J, Glaholt S, Colbourne J, Janssen CR, Shaw JR, De Schamphelaere
KAC. Genomic mechanisms of cross-tolerance between cadmium and cyanobacterial stress in
the waterflea. 18th National Symposium on Applied Biological Sciences, 8 Feb 2013, Gent,
Belgium.
[5] Asselman J, De Laender F, Janssen CR, De Schamphelaere K. Increasing the number of design
points does not necesserarily reduce the chance of falsely classifying additive mixtures as
synergisms or antagonisms in mixture toxicity experiments. SETAC Europe 22nd
Annual Meeting,
20-24 May, 2012, Berlin, Germany.
[6] Asselman J, Janssen CR, De Schamphelaere K.interacting effects of combined chemical and
natural stressors on Daphnia pulex. SETAC Europe 22nd
Annual Meeting, 20-24 May 2012,
Berlin, Germany.
[7] De Coninck D, Fisher M, Glaholt S, Asselman J, Janssen CR, Shaw J, De Schamphelaere KAC.
Conseauences of metal adaptation on sensitivity to future climate change stressors in Daphnia
pulex populations. SETAC Europe 22nd
Annual Meeting, 20-24 May 2012, Berlin, Germany.
[8] Hochmuth J, Asselman J, De Schamphelaere KAC. Do mixture effects of metal stress (Cu) and
natural stress (cyanobacteria) add up in Daphnia magna. SETAC Europe 22nd
Annual Meeting,
20-24 May 2012, Berlin, Germany.
[9] Trenti IT, Vandegehuchte MV, Asselman J, Janssen C, De Meyer T, De Schanphelaere KAC. Is
there a functional role of DNA methylation in the stress response? SETAC Europe 22nd
Annual
Meeting, 20-24 May 2012, Berlin, Germany.
[10] De Coninck D, Asselman J, Glaholt S, Colbourne J, Janssen CR, Shaw JR, De Schamphelaere
KAC. Challenges in genomic analyses with Daphnia pulex: A case study on cyanobacterial
stress. 2nd
Nucleotide2Networks Symposium, 5 Sept 2012, Gent, Belgium.

Curriculum Vitae
233
[11] Asselman J, Smagghe G, Janssen CR, De Schamphelaere, KAC. Effects of climate change on
risk assessments: toxicity of binary mixtures of harmful cyanobacteria and insecticides on
Daphnia pulex. Poster presentation at the 63rd International Symposium on Crop Protection, May
24, 2011, Ghent, Belgium
[12] Asselman J, De Coninck D, Glaholt S, Colbourne JK, Janssen CR, Shaw JR, De
Schamphelaere K. Comparison of the transcriptomic response of a Cd-sensitive and a Cd-
tolerant Daphnia pulex isolate to cyanobacterial stress. SETAC Europe 21st Annual Meeting, 15-
19 May 2011, Milan, Italy.
[13] Asselman J, De Baets B, De Schamphelaere KAC. microarrays in support vector regression to
predict the toxicity of mixtures in the aquatic environment. Kick-Off meeting Nucleotide2Networks
Symposium, 5 May 2011, Gent, Belgium
[14] Asselman J, Glaholt S, Smith Z, De Geyter E, Smagghe G, Janssen CR, Colbourne JK, Shaw
JR, De Schamphelaere KAC. Functional characterization of four metallothionein genes in
Daphnia pulex exposed to environmental stressors. Poster Presentation at SETAC North America
31th Annual Meeting, 7-11 November, 2010, Portland, USA.
[15] Asselman J, Glaholt S, Colbourne JK, Janssen CJ, Shaw JR, De Schamphelaere KAC.
Metallothionein expression in Daphnia pulex under stress: functional characterization of a gene
with high ecotoxicological relevance. Poster Presentation at the Daphnia Genomics Consortium
Meeting, 26-30 March, 2010, Leuven, Belgium.
Foreign study visits
10 August 2012 - 15 December 2012: Research visit at the Shaw Lab and the Center for Genomics
and Bioinformatics, Indiana University, Bloomington, Indiana, USA. Travel grant awarded by the
Research Fund Flanders (FWO).
Attended conferences and workshops
[1] EMBO Conference on "The mighty daphnia: past present and future", 19-22 January 2014,
Birmingham, UK.
[2] MDIBL-NERC Environmental Genomics Course, 17-18 January 2014, Birmingham, UK.

Curriculum Vitae
234
[3] Society of Environmental Toxicology and Chemistry - North America (SETAC-North America),
34th annual meeting, 17-21 November 2013, Nashville, TN, USA
[4] 3rd
Nucleotide2Networks Symposium, 24th September 2013, Ghent, Belgium
[5] Artemia Genome Workshop, 2 September, Ghent, Belgium.
[6] International Conference on Toxic Cyanobacteria, 11-16 August, 2013, Pilaneseberg, South
Africa
[7] EUROCORES Program Ecological and Evolutionary Functional Genomics Conference, 26-30
May 2013, Noorwijkerhout, the Netherlands.
[8] Society of Environmental Toxicology and Chemistry - Europe (SETAC-Europe), 23rd
annual
meeting, 16-20 May 2013, Glasgow, UK.
[9] 18th National Symposium on Applied Biological Sciences, 8 Feb 2013, Gent, Belgium.
[10] Society of Environmental Toxicology and Chemistry - Europe (SETAC-Europe), 22nd
annual
meeting, 20-24 May 2012, Berlin, Germany.
[11] Society of Environmental Toxicology and Chemistry - Europe (SETAC-Europe), 22nd annual
meeting, 20-24 May 2012, Berlin Germany: Short course in Statistical methods in ecotoxicology
using R.
[12] Pharmaceutical Bioinformatics course, Uppsala University, August-October 2011.
[13] Environmental Genomics Short Course, 20-27 August 2011, Mount Desert Island Biological
Laboratory, Salisbury Cove, Maine, USA. (Assiting staff)
[14] International Symposium on Crop Protection, 24 May, 2011, Ghent, Belgium
[15] Society of Environmental Toxicology and Chemistry - Europe (SETAC-Europe), 21th annual
meeting, 15-19 May 2011, Milan, Italy.
[16] Kick-Off meeting Nucleotide2Networks Symposium, 5 May 2011, Gent, Belgium.

Curriculum Vitae
235
[17] Environmental Genomics Short Course, 21-29 August 2010, Mount Desert Island Biological
Laboratory, Salisbury Cove, Maine, USA.
[18] Daphnia Genomics Consortium Meeting, 26-30 March 2010, Leuven, Belgium.
Membership of professional organizations
2010 - present Member of the Society of Environmental Toxicology and Chemistry (SETAC)
2010 - present Member of the Daphnia Genomics Consortium
Awards and Prizes
Best Student Presentation, International Conference on Toxic Cyanobacteria, Pilanseberg, South Africa, 11-15
August 2013.
Best Poster Award, EUROCORES Program Ecological and Evolutionary Functional Genomics Conference 26-30 May 2013, Noorwijkerhout, the Netherlands.


Appendix A
Supplementary material for Chapter 2


Supplementary material for Chapter 2
239
A.1 Figures
1.1 1.2
2.1 2.2 % of cyanobacteria in the diet % of cyanobacteria in the diet
% of cyanobacteria in the diet % of cyanobacteria in the diet

Appendix A
240
3.2 3.1
4.1 4.2 % of cyanobacteria in the diet % of cyanobacteria in the diet
% of cyanobacteria in the diet % of cyanobacteria in the diet

Supplementary material for Chapter 2
241
5.1 5.2
6.2 6.1 % of cyanobacteria in the diet % of cyanobacteria in the diet
% of cyanobacteria in the diet % of cyanobacteria in the diet

Appendix A
242
Figure A.1 Concentration reponse data (circles) and fitted concentration response curves for all cyanobacteria: Anabaena (1), Aphanizonmenon (2),
Cylindroserpmopsis (3), Microcystis (4), Nodularia (5), Oscillatoria (6) and the starvation treatment (7). Numbers .1 and .2 denote repeated experiments. Circles
represent observed total reproduction per organism for each treatment.
7.1 7.2
% of starvation relative to control diet % of starvation relative to control diet
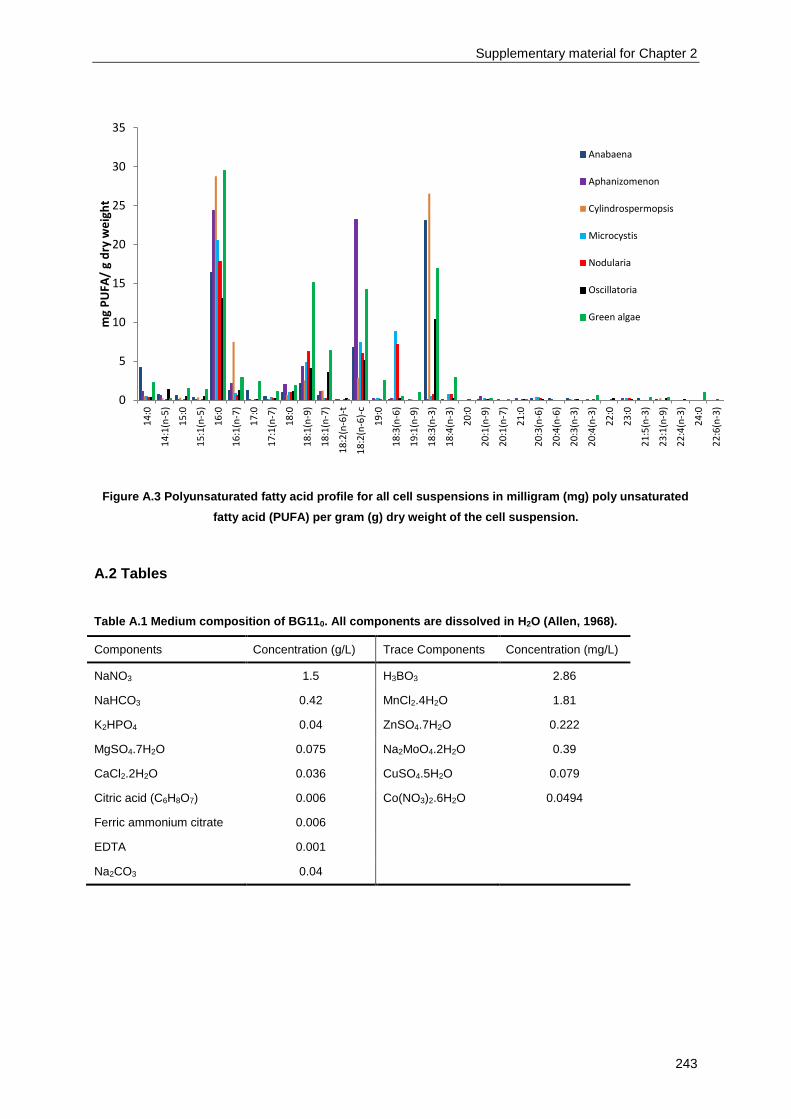
Supplementary material for Chapter 2
243
Figure A.3 Polyunsaturated fatty acid profile for all cell suspensions in milligram (mg) poly unsaturated
fatty acid (PUFA) per gram (g) dry weight of the cell suspension.
A.2 Tables
Table A.1 Medium composition of BG110. All components are dissolved in H2O (Allen, 1968).
Components Concentration (g/L) Trace Components Concentration (mg/L)
NaNO3 1.5 H3BO3 2.86
NaHCO3 0.42 MnCl2.4H2O 1.81
K2HPO4 0.04 ZnSO4.7H2O 0.222
MgSO4.7H2O 0.075 Na2MoO4.2H2O 0.39
CaCl2.2H2O 0.036 CuSO4.5H2O 0.079
Citric acid (C6H8O7) 0.006 Co(NO3)2.6H2O 0.0494
Ferric ammonium citrate 0.006
EDTA 0.001
Na2CO3 0.04
0
5
10
15
20
25
30
35
14
:0
14
:1(n
-5)
15
:0
15
:1(n
-5)
16
:0
16
:1(n
-7)
17
:0
17
:1(n
-7)
18
:0
18
:1(n
-9)
18
:1(n
-7)
18
:2(n
-6)-
t
18
:2(n
-6)-
c
19
:0
18
:3(n
-6)
19
:1(n
-9)
18
:3(n
-3)
18
:4(n
-3)
20
:0
20
:1(n
-9)
20
:1(n
-7)
21
:0
20
:3(n
-6)
20
:4(n
-6)
20
:3(n
-3)
20
:4(n
-3)
22
:0
23
:0
21
:5(n
-3)
23
:1(n
-9)
22
:4(n
-3)
24
:0
22
:6(n
-3)
mg
PU
FA/
g d
ry w
eig
ht
Anabaena
Aphanizomenon
Cylindrospermopsis
Microcystis
Nodularia
Oscillatoria
Green algae

Appendix A
244
Table A.2 Medium composition of BG11. All components are dissolved in H2O (Allen 1968).
Components Concentration (g/L) Trace Components Concentration (mg/L)
NaNO3 1.5 H3BO3 2.86
K2HPO4 0.04 MnCl2.4H2O 1.81
MgSO4.7H2O 0.075 ZnSO4.7H2O 0.222
CaCl2.2H2O 0.036 Na2MoO4.2H2O 0.39
Citric acid (C6H8O7) 0.006 CuSO4.5H2O 0.079
Ferric ammonium citrate 0.006 Co(NO3)2.6H2O 0.0494
EDTA 0.001
Na2CO3 0.04
Table A.3 Medium Composition of Z8. All components are dissolved in H2O unless stated otherwise (Kotai
1972).
Components Concentration (g/L) Components Concentration (mg/L)
NaNO3 a 0.467 (NH4)6.Mo7O24.4H2O
d 0.0088
MgSO4.7H2O a 0.025 KBr
d 0.012
Ca(NO3)2.4H2O a 0.059 KI
d 0.04083
K2HPO4 b 0.031 ZnSO4
d 0.0287
Na2CO3 b
0.021 Co(NO3)2.6H2O d
0.0146
FeCl3.6H2O c*
0.00281 CuSO4.5H2O
d 0.0125
EDTA-Na2 c*
0.00372 H3BO3
d 3.1
Components with the same letter in superscript can be combined in one stock solution. * 2.80 g FeCl • H2O dissolved in 100 m 0.1 N HCl to make an Fe-solution and 3.90 g EDTA-Na2 dissolved in 100 mL 0.1 N NaOH to make an EDTA-solution. 10 mL of the Fe-solution are dissolved in circa 900 mL deionized H2O to which 9.5 mL of the EDTA-solution is added, and fill up to one litre. Of this diluted combined Fe-solution and EDTA-solution 10mL is added per each L of Z8 medium.

Appendix B
Supplementary material for Chapter 3

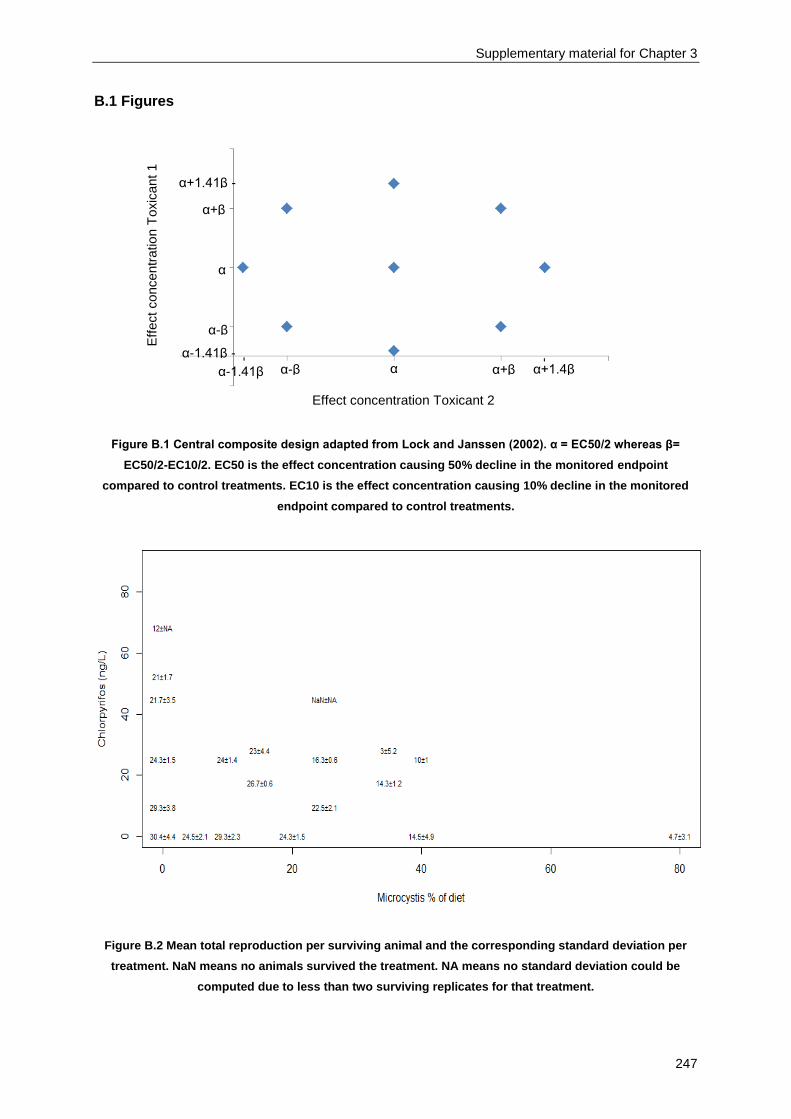
Supplementary material for Chapter 3
247
B.1 Figures
Figure B.1 Central composite design adapted from Lock and Janssen (2002). α = EC50/2 whereas β=
EC50/2-EC10/2. EC50 is the effect concentration causing 50% decline in the monitored endpoint
compared to control treatments. EC10 is the effect concentration causing 10% decline in the monitored
endpoint compared to control treatments.
Figure B.2 Mean total reproduction per surviving animal and the corresponding standard deviation per
treatment. NaN means no animals survived the treatment. NA means no standard deviation could be
computed due to less than two surviving replicates for that treatment.
-
α
α α+β
-
α-β α+1.4β
1β
α-1.41β
α-1.41β -
α+1.41β -
α-β
α+β
Eff
ect concentr
atio
n T
oxic
ant 1
Effect concentration Toxicant 2
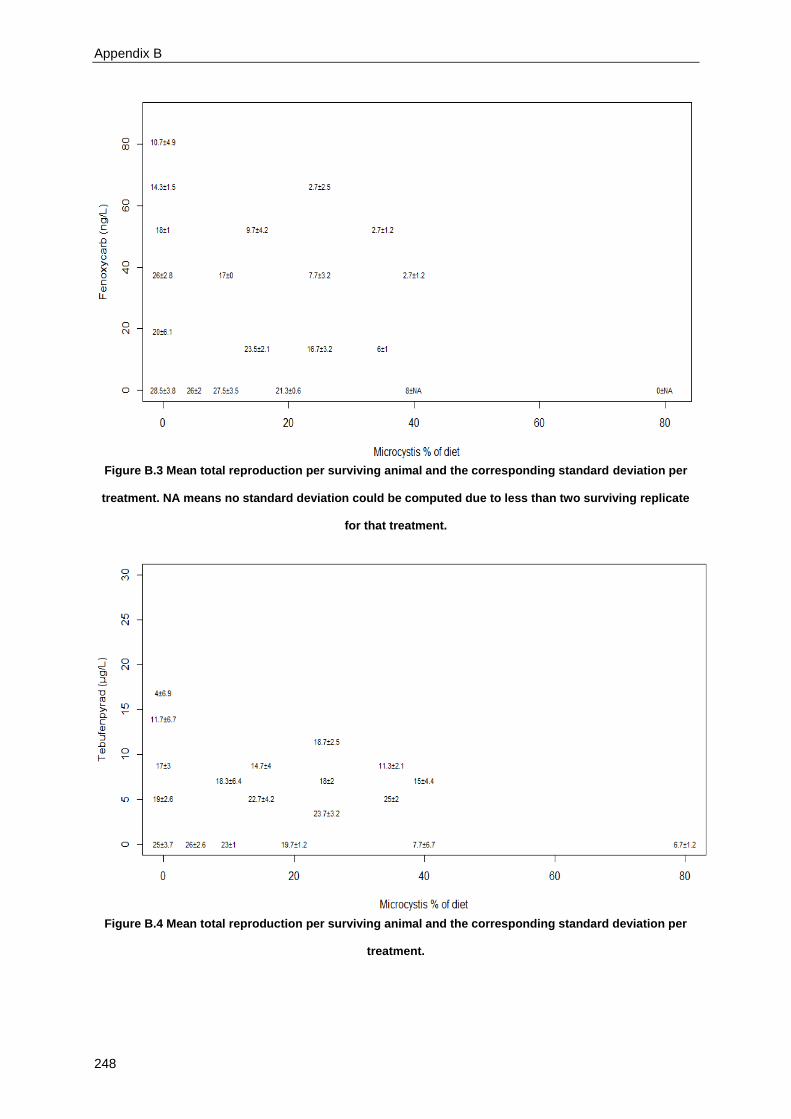
Appendix B
248
Figure B.3 Mean total reproduction per surviving animal and the corresponding standard deviation per
treatment. NA means no standard deviation could be computed due to less than two surviving replicate
for that treatment.
Figure B.4 Mean total reproduction per surviving animal and the corresponding standard deviation per
treatment.

Supplementary material for Chapter 3
249
Figure B.5 Mean total reproduction per surviving animal and the corresponding standard deviation per
treatment. NA means no standard deviation could be computed due less than two surviving replicates for
that treatment.
Figure B.6 Mean total reproduction per surviving animal and the corresponding standard deviation per
treatment. NA means no standard deviation could be computed due to less than two surviving replicates
for that treatment.

Appendix B
250
Figure B.7 Mean total reproduction per surviving animal and the corresponding standard deviation per
treatment. NA means no standard deviation could be computed due to less than two surviving replicates
for that treatment.
Figure B.8 Mean total reproduction per surviving animal and the corresponding standard deviation per
treatment. NA means no standard deviation could be computed due to less than two surviving replicates
for that treatment.
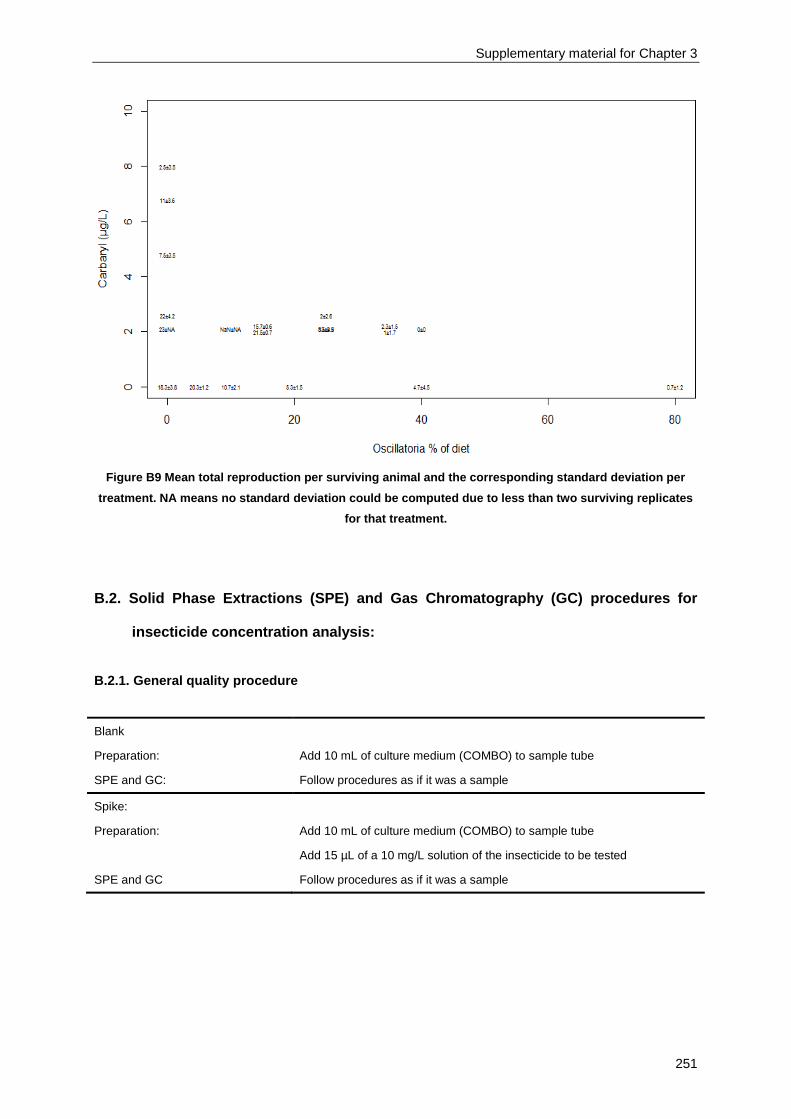
Supplementary material for Chapter 3
251
Figure B9 Mean total reproduction per surviving animal and the corresponding standard deviation per
treatment. NA means no standard deviation could be computed due to less than two surviving replicates
for that treatment.
B.2. Solid Phase Extractions (SPE) and Gas Chromatography (GC) procedures for
insecticide concentration analysis:
B.2.1. General quality procedure
Blank
Preparation: Add 10 mL of culture medium (COMBO) to sample tube
SPE and GC: Follow procedures as if it was a sample
Spike:
Preparation: Add 10 mL of culture medium (COMBO) to sample tube
Add 15 µL of a 10 mg/L solution of the insecticide to be tested
SPE and GC Follow procedures as if it was a sample

Appendix B
252
B.2.2: Acetamiprid
Type SPE Column: 100mg/3mL
Preparation: Weigh volume of sample
Add internal standard (Propoxur): 10 µL of 10 mg/L solution
SPE: Condition by adding 3 ml MTBE on column
Rinse by adding 3 ml MeOH on column
Equilibrate by filling column completely with H2O
Add sample on column
Rinse sample bottles with MeOH/H2O 5/95
Rinse column with 3 mL MeOH/H2O 5/95 and dry 5 minutes under vacuum
Place elution tubes under columns and elute with 3 ml MeOH/MTBE 10/90
GC Preparation: Add MTBE to elution tubes to a final volume of 1 mL
Remove H2O by adding Na2SO4
Add 750 µL from elution tube to a GC tube
Add 7.5 µL of 10 mg/L reference standard
Weigh empty sample bottle
Store GC tubes in the dark at 4°C until GC analysis
B.2.3: Carbaryl
Type SPE Column: 30mg/3mL
Preparation: Weigh volume of sample
Add internal standard (Propoxur): 8 µL of 15 mg/L solution
SPE: Condition by adding 1 ml MTBE on column
Rinse by adding 1 ml MeOH on column
Equilibrate by filling column completely with H2O
Add sample on column
Rinse sample bottles with MeOH/H2O 5/95
Rinse column with 1 mL MeOH/H2O 5/95 and dry 5 minutes under vacuum
Place elution tubes under columns and elute with 1 ml MeOH/MTBE 10/90
GC Preparation: Add MTBE to elution tubes to a final volume of 1 mL
Remove H2O by adding Na2SO4
Add 750 µL from elution tube to a GC tube
Add 7.5 µL of 10 mg/L reference standard
Weigh empty sample bottle
Store GC tubes in the dark at 4°C until GC analysis

Supplementary material for Chapter 3
253
B.2.4: Chlorpyrifos
Type SPE Column: 100mg/3mL
Preparation: Weigh volume of sample
Add internal standard (fenthion): 10 µL of 0.5 mg/L solution
SPE: Condition by adding 3 ml MTBE on column
Rinse by adding 3 ml MeOH on column
Equilibrate by filling column completely with H2O
Add sample on column
Rinse sample bottles with MeOH/H2O 5/95
Rinse column with 3 mL MeOH/H2O 5/95 and dry 5 minutes under vacuum
Place elution tubes under columns and elute with 5 ml MeOH/MTBE 10/90
GC Preparation: Add MTBE to elution tubes to a final volume of 1 mL
Remove H2O by adding Na2SO4
Add 750 µL from elution tube to a GC tube
Add 7.5 µL of 10 mg/L reference standard
Weigh empty sample bottle
Store GC tubes in the dark at 4°C until GC analysis
B.2.5: Deltamethrin
Type SPE Column: 100mg/3mL
Preparation: Weigh volume of sample
Add internal standard (mirex): 10 µL of 0.5 mg/L solution
SPE: Condition by adding 3 ml MTBE on column
Rinse by adding 3 ml MeOH on column
Equilibrate by filling column completely with H2O
Add sample on column
Rinse sample bottles with MeOH/H2O 5/95
Rinse column with 3 mL MeOH/H2O 5/95 and dry 5 minutes under vacuum
Place elution tubes under columns and elute with 5 ml MeOH/MTBE 10/90
GC Preparation: Add MTBE to elution tubes to a final volume of 1 mL
Remove H2O by adding Na2SO4
Add 750 µL from elution tube to a GC tube
Add 7.5 µL of 10 mg/L reference standard
Weigh empty sample bottle
Store GC tubes in the dark at 4°C until GC analysis
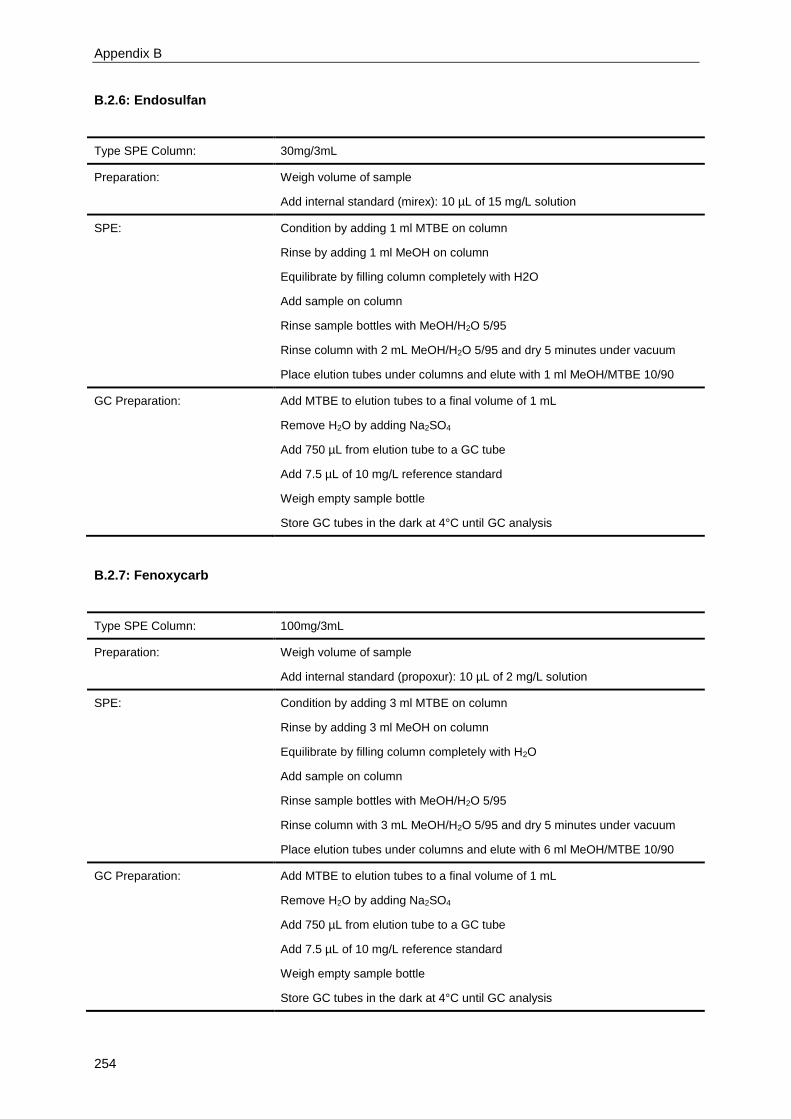
Appendix B
254
B.2.6: Endosulfan
Type SPE Column: 30mg/3mL
Preparation: Weigh volume of sample
Add internal standard (mirex): 10 µL of 15 mg/L solution
SPE: Condition by adding 1 ml MTBE on column
Rinse by adding 1 ml MeOH on column
Equilibrate by filling column completely with H2O
Add sample on column
Rinse sample bottles with MeOH/H2O 5/95
Rinse column with 2 mL MeOH/H2O 5/95 and dry 5 minutes under vacuum
Place elution tubes under columns and elute with 1 ml MeOH/MTBE 10/90
GC Preparation: Add MTBE to elution tubes to a final volume of 1 mL
Remove H2O by adding Na2SO4
Add 750 µL from elution tube to a GC tube
Add 7.5 µL of 10 mg/L reference standard
Weigh empty sample bottle
Store GC tubes in the dark at 4°C until GC analysis
B.2.7: Fenoxycarb
Type SPE Column: 100mg/3mL
Preparation: Weigh volume of sample
Add internal standard (propoxur): 10 µL of 2 mg/L solution
SPE: Condition by adding 3 ml MTBE on column
Rinse by adding 3 ml MeOH on column
Equilibrate by filling column completely with H2O
Add sample on column
Rinse sample bottles with MeOH/H2O 5/95
Rinse column with 3 mL MeOH/H2O 5/95 and dry 5 minutes under vacuum
Place elution tubes under columns and elute with 6 ml MeOH/MTBE 10/90
GC Preparation: Add MTBE to elution tubes to a final volume of 1 mL
Remove H2O by adding Na2SO4
Add 750 µL from elution tube to a GC tube
Add 7.5 µL of 10 mg/L reference standard
Weigh empty sample bottle
Store GC tubes in the dark at 4°C until GC analysis

Supplementary material for Chapter 3
255
B.2.8: Tebufenpyrad
Type SPE Column: 30mg/3mL
Preparation: Weigh volume of sample
Add internal standard (propoxur): 10 µL of 10 mg/L solution
SPE: Condition by adding 1 ml MTBE on column
Rinse by adding 1 ml MeOH on column
Equilibrate by filling column completely with H2O
Add sample on column
Rinse sample bottles with MeOH/H2O 5/95
Rinse column with 2 mL MeOH/H2O 5/95 and dry 5 minutes under vacuum
Place elution tubes under columns and elute with 1 ml MTBE
GC Preparation: Add MTBE to elution tubes to a final volume of 1 mL
Remove H2O by adding Na2SO4
Add 750 µL from elution tube to a GC tube
Add 7.5 µL of 10 mg/L reference standard
Weigh empty sample bottle
Store GC tubes in the dark at 4°C until GC analysis
B.2.9: Tetradifon
Type SPE Column: 30mg/3mL
Preparation: Weigh volume of sample
Add internal standard (fention): 10 µL of 10 mg/L solution
SPE: Condition by adding 3 ml MTBE on column
Rinse by adding 3 ml MeOH on column
Equilibrate by filling column completely with H2O
Add sample on column
Rinse sample bottles with MeOH/H2O 5/95
Rinse column with 3 mL MeOH/H2O 5/95 and dry 5 minutes under vacuum
Place elution tubes under columns and elute with 3 ml MeOH/MTBE 10/90
GC Preparation: Add MTBE to elution tubes to a final volume of 1 mL
Remove H2O by adding Na2SO4
Add 750 µL from elution tube to a GC tube
Add 7.5 µL of 10 mg/L reference standard
Weigh empty sample bottle
Store GC tubes in the dark at 4°C until GC analysis

Appendix B
256
B.3 R-code:
# Load in necessary libraries
library(nortest)
library(drc)
library(lattice)
### Data input ### File Input example below
Data<-read.table("Datafile.txt", header=TRUE, na.strings=NA,sep="\t",dec=".")
Datamean<-read.table("Datafile.txt",header=FALSE,na.strings=NA,sep="\t",dec=".")
### INDEPENDENT ACTION MODEL = IA ####
### CONCENTRATION ADDITION MODEL = CA ###
# Control observation are excluded as they will result in NAs
# E.g. dividing by 0 as for ((Insecticide/EI)+(Cyano/EC))^(-2)
# both Insecticide and Cyano are 0 in control terms, resulting in a final zero in denominator
# Although this is only for the deviation models, we still do is for standard model as well
# Otherwise the deviation and standard model will be fitted to other datasets
# Then statistical comparison is not so straightforward.
# Fit model only to single stressor data, no mixture data included
ModelIAsingle<-nls(Daphnia ~ mean(Data[1:19,3])*1/((1+(Insecticide/EI)^BI)*(1+(Cyano/EC)^BC)),
data = Data[20:49,], start= list(BI= 1, BC=1,EI= 4, EC = 50),
trace=TRUE, na.action=na.omit)
ModelCAsingle<-nls(Daphnia~ (mean(Data[1:19,3]))/(((Insecticide*EC+Cyano*EI)/(EI*EC))^B+1),
data = Data[20:49,], start= list(B= 1, EI= 4, EC = 50),
trace=TRUE, na.action=na.omit)
# Fit standard model to all data including mixtures
ModelIA<-nls(Daphnia~ mean(Data[1:19,3])*1/((1+(Insecticide/EI)^BI)*(1+(Cyano/EC)^BC)),
data = Data[20:76,], start= list(BI= 1, BC=1,EI= 4, EC = 50),trace=TRUE, na.action=na.omit)
ModelCA<-nls(Daphnia~ (mean(Data[1:19,3]))/(((Insecticide*EC+Cyano*EI)/(EI*EC))^B+1),
data = Data[20:76,], start= list(B= 1, EI= 4, EC = 50), trace=TRUE, na.action=na.omit)
# Synergism-Antagonism Model
ModelIAS<- nls(Daphnia~mean(Data[1:19,3])*pnorm(qnorm(1/((1+(Insecticide/EI)^BI)*(1+(Cyano/EC)^BC)))+ (a*(Insecticide/EI)*( Cyano/EC)*((Insecticide/EI)+(Cyano/EC))^(-2))), data = Data[20:76,], start= list(BI= 0.8, BC=2,EI= 4.15, EC = 65.90, a=0), trace=TRUE, na.action=na.omit)
ModelCAS<-nls(Daphnia~ (mean(Data[1:19,3]))/((((Insecticide*EC+Cyano*EI)/(EI*EC))/exp(a*(Insecticide/EI)* (Cyano/EC)*((Insecticide/EI)+(Cyano/EC))^(-2)))^B+1), data = Data[20:76,], start= list(B= 1, EI= 4, EC = 50, a=0), trace=TRUE, na.action=na.omit)
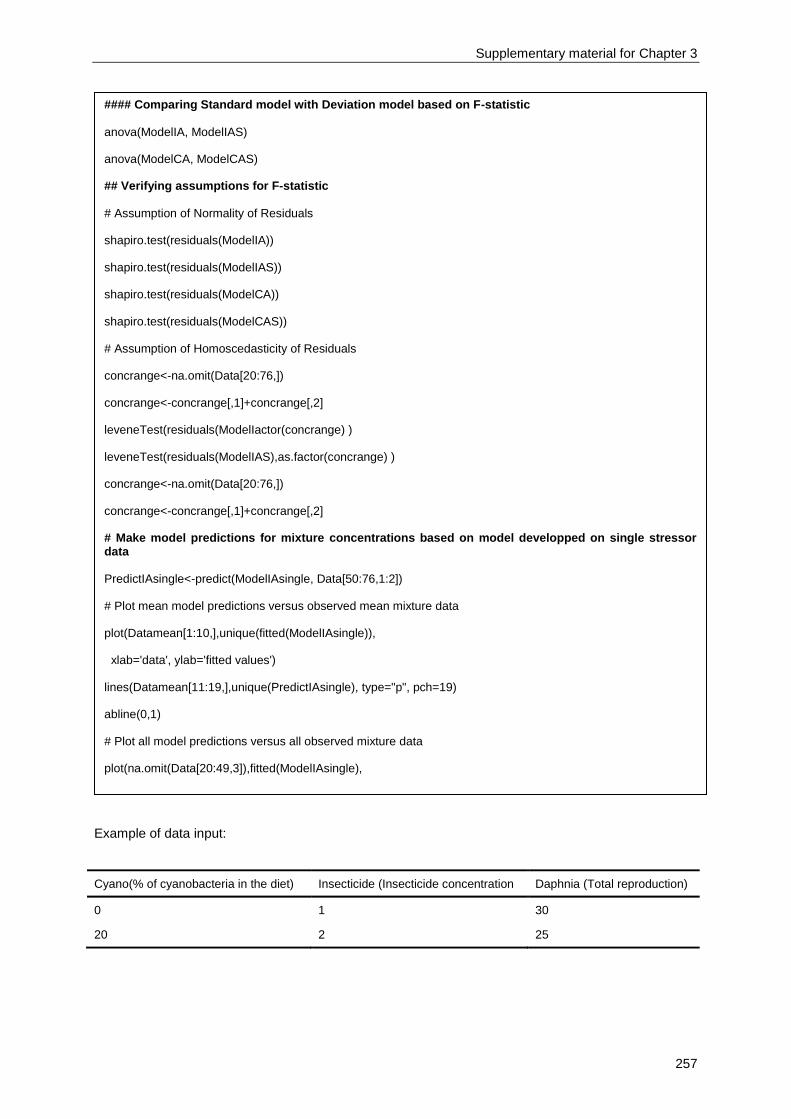
Supplementary material for Chapter 3
257
Example of data input:
Cyano(% of cyanobacteria in the diet) Insecticide (Insecticide concentration Daphnia (Total reproduction)
0 1 30
20 2 25
#### Comparing Standard model with Deviation model based on F-statistic
anova(ModelIA, ModelIAS)
anova(ModelCA, ModelCAS)
## Verifying assumptions for F-statistic
# Assumption of Normality of Residuals
shapiro.test(residuals(ModelIA))
shapiro.test(residuals(ModelIAS))
shapiro.test(residuals(ModelCA))
shapiro.test(residuals(ModelCAS))
# Assumption of Homoscedasticity of Residuals
concrange<-na.omit(Data[20:76,])
concrange<-concrange[,1]+concrange[,2]
leveneTest(residuals(ModelIactor(concrange) )
leveneTest(residuals(ModelIAS),as.factor(concrange) )
concrange<-na.omit(Data[20:76,])
concrange<-concrange[,1]+concrange[,2]
# Make model predictions for mixture concentrations based on model developped on single stressor data
PredictIAsingle<-predict(ModelIAsingle, Data[50:76,1:2])
# Plot mean model predictions versus observed mean mixture data
plot(Datamean[1:10,],unique(fitted(ModelIAsingle)),
xlab='data', ylab='fitted values')
lines(Datamean[11:19,],unique(PredictIAsingle), type="p", pch=19)
abline(0,1)
# Plot all model predictions versus all observed mixture data
plot(na.omit(Data[20:49,3]),fitted(ModelIAsingle),
xlab='data', ylab='fitted values')
lines(Data[50:76,3],PredictIAsingle, type="p", pch=19)
abline(0,1)

Appendix B
258
B.4: Tables
Table B.1 P-values for concentration addition (CA)/ independent action (IA) when leaving one design point out. Insecticide concentrations are represented as effect
concentrations (EC) based upon the general central composite design in Fig. S1. Cyanobacteria concentrations are given in % of the diet. α = EC50/2 whereas β=
EC50/2-EC10/2. EC50 is the effect concentration causing 50% decline in the monitored endpoint compared to control treatments. EC10 is the effect concentration
causing 10% decline in the monitored endpoint compared to control treatments.
Design points P-values
Insecticide EC (Fig. S1)
Cyano (% of diet) (Fig.1-4)
Chlorpyrifos x Microcystis
Fenoxycarb x Microcystis
Tebufenpyrad x Microcystis
Tetradifon x Microcystis
Carbaryl x Microcystis
Carbaryl x Aphanizomenon
Carbaryl x Cylindroserpmopsis
Carbaryl x Oscillatoria
α - 1.41β 25 0.136/0.266 0.488/0.003 <0.001/<0.001 0.312/0.560 0.014/<0.001 0.013/0.006 0.126/0.136 <0.001/<0.001
α - β 15 0.104/0.430 0.638/0.002 <0.001/<0.001 0.314/0.461 0.045/<0.001 0.009/0.003 0.102/0.050 <0.001/<0.001
α - β 35 0.099/0.298 0.663/0.002 0.001/<0.001 0.211/0.449 0.015/<0.001 0.007/0.002 0.111/0.081 <0.001/<0.001
α 10 0.115/0.271 0.435/0.003 <0.001/<0.001 0.378/0.590 0.012/<0.001 0.013/0.007 0.105/.069 <0.001/<0.001
α 25 0.131/0.363 0.487/0.003 <0.001/<0.001 0.158/0.318 0.007/<0.001 0.012/0.004 0.057/0.214 <0.001/<0.001
α 40 0.087/0.342 0.503/0.002 <0.001/<0.001 0.263/0.512 0.015/<0.001 0.003/0.001 0.279/0.181 <0.001/<0.001
α + β 15 0.064/0.564 0.542/0.009 <0.001/<0.001 0.788/0.963 0.019/<0.001 0.017/0.008 0.088/0.063 <0.001/<0.001
α + β 35 0.603/0.135 0.491/0.003 <0.001/<0.001 0.281/0.479 0.015/<0.001 0.036/0.011 0.078/0.051 <0.001/<0.001
α + 1.41β 25 0.103/0.285 0.498/0.003 <0.001/<0.001 0.267/0.439 0.004/<0.001 0.037/0.010 0.099/0.070 0.004/<0.001

Appendix C
Supplementary material for Chapter 4

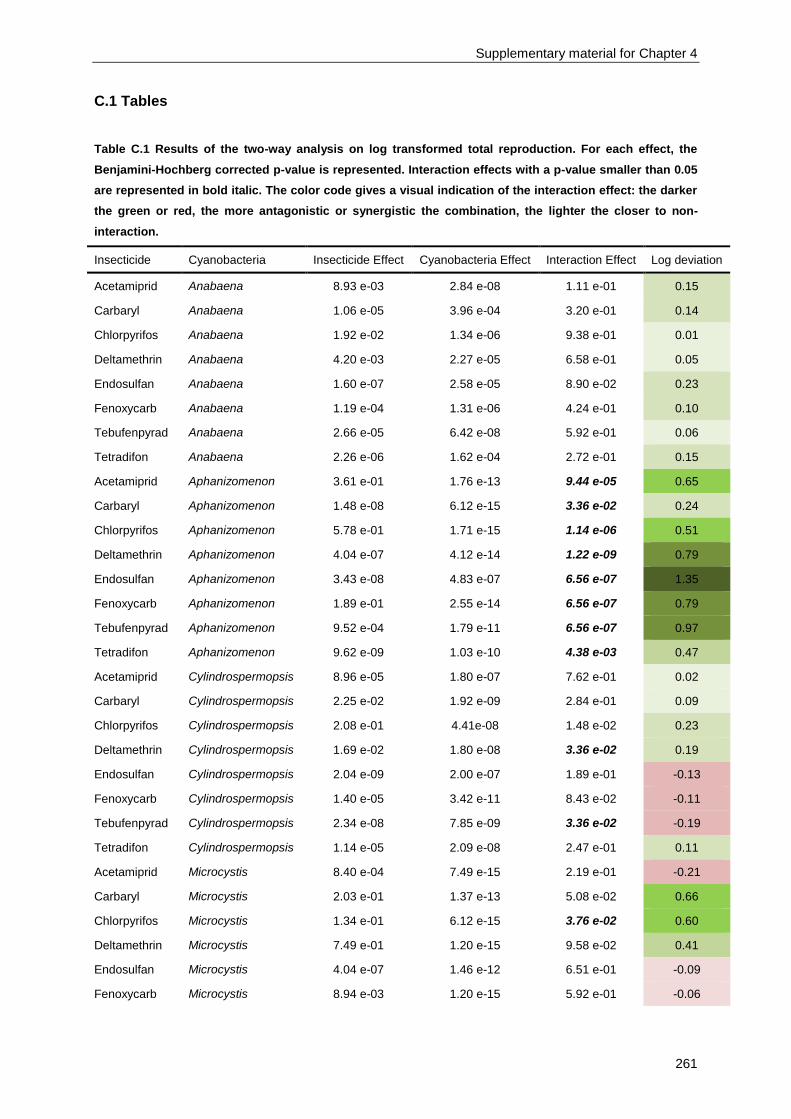
Supplementary material for Chapter 4
261
C.1 Tables
Table C.1 Results of the two-way analysis on log transformed total reproduction. For each effect, the
Benjamini-Hochberg corrected p-value is represented. Interaction effects with a p-value smaller than 0.05
are represented in bold italic. The color code gives a visual indication of the interaction effect: the darker
the green or red, the more antagonistic or synergistic the combination, the lighter the closer to non-
interaction.
Insecticide Cyanobacteria Insecticide Effect Cyanobacteria Effect Interaction Effect Log deviation
Acetamiprid Anabaena 8.93 e-03 2.84 e-08 1.11 e-01 0.15
Carbaryl Anabaena 1.06 e-05 3.96 e-04 3.20 e-01 0.14
Chlorpyrifos Anabaena 1.92 e-02 1.34 e-06 9.38 e-01 0.01
Deltamethrin Anabaena 4.20 e-03 2.27 e-05 6.58 e-01 0.05
Endosulfan Anabaena 1.60 e-07 2.58 e-05 8.90 e-02 0.23
Fenoxycarb Anabaena 1.19 e-04 1.31 e-06 4.24 e-01 0.10
Tebufenpyrad Anabaena 2.66 e-05 6.42 e-08 5.92 e-01 0.06
Tetradifon Anabaena 2.26 e-06 1.62 e-04 2.72 e-01 0.15
Acetamiprid Aphanizomenon 3.61 e-01 1.76 e-13 9.44 e-05 0.65
Carbaryl Aphanizomenon 1.48 e-08 6.12 e-15 3.36 e-02 0.24
Chlorpyrifos Aphanizomenon 5.78 e-01 1.71 e-15 1.14 e-06 0.51
Deltamethrin Aphanizomenon 4.04 e-07 4.12 e-14 1.22 e-09 0.79
Endosulfan Aphanizomenon 3.43 e-08 4.83 e-07 6.56 e-07 1.35
Fenoxycarb Aphanizomenon 1.89 e-01 2.55 e-14 6.56 e-07 0.79
Tebufenpyrad Aphanizomenon 9.52 e-04 1.79 e-11 6.56 e-07 0.97
Tetradifon Aphanizomenon 9.62 e-09 1.03 e-10 4.38 e-03 0.47
Acetamiprid Cylindrospermopsis 8.96 e-05 1.80 e-07 7.62 e-01 0.02
Carbaryl Cylindrospermopsis 2.25 e-02 1.92 e-09 2.84 e-01 0.09
Chlorpyrifos Cylindrospermopsis 2.08 e-01 4.41e-08 1.48 e-02 0.23
Deltamethrin Cylindrospermopsis 1.69 e-02 1.80 e-08 3.36 e-02 0.19
Endosulfan Cylindrospermopsis 2.04 e-09 2.00 e-07 1.89 e-01 -0.13
Fenoxycarb Cylindrospermopsis 1.40 e-05 3.42 e-11 8.43 e-02 -0.11
Tebufenpyrad Cylindrospermopsis 2.34 e-08 7.85 e-09 3.36 e-02 -0.19
Tetradifon Cylindrospermopsis 1.14 e-05 2.09 e-08 2.47 e-01 0.11
Acetamiprid Microcystis 8.40 e-04 7.49 e-15 2.19 e-01 -0.21
Carbaryl Microcystis 2.03 e-01 1.37 e-13 5.08 e-02 0.66
Chlorpyrifos Microcystis 1.34 e-01 6.12 e-15 3.76 e-02 0.60
Deltamethrin Microcystis 7.49 e-01 1.20 e-15 9.58 e-02 0.41
Endosulfan Microcystis 4.04 e-07 1.46 e-12 6.51 e-01 -0.09
Fenoxycarb Microcystis 8.94 e-03 1.20 e-15 5.92 e-01 -0.06

Appendix C
262
Insecticide (Table C.1 cont.)
Cyanobacteria Insecticide Effect Cyanobacteria Effect Interaction Effect Log deviation
Tebufenpyrad Microcystis 7.33 e-02 1.20 e-15 3.68 e-02 0.31
Tetradifon Microcystis 1.19 e-04 1.20 e-15 5.92 e-01 0.13
Acetamiprid Nodularia 3.19 e-02 1.20 e-15 3.36 e-02 0.16
Carbaryl Nodularia 9.32 e-03 6.17 e-15 2.27 e-01 0.14
Chlorpyrifos Nodularia 9.99 e-02 6.51 e-14 1.89 e-01 0.17
Deltamethrin Nodularia 9.49 e-02 4.02 e-15 5.89 e-01 0.06
Endosulfan Nodularia 2.79 e-07 1.20 e-15 2.54 e-02 0.16
Fenoxycarb Nodularia 1.40 e-02 1.20 e-15 1.89 e-01 0.10
Tebufenpyrad Nodularia 2.38 e-04 1.20 e-15 3.36 e-02 0.16
Tetradifon Nodularia 5.09 e-02 2.75 e-14 1.05 e-01 0.20
Acetamiprid Oscillatoria 1.66 e-02 6.48 e-14 1.16 e-01 0.13
Carbaryl Oscillatoria 6.93 e-02 2.22 e-11 2.06 e-01 0.10
Chlorpyrifos Oscillatoria 1.09 e-01 3.18 e-12 8.43 e-02 0.13
Deltamethrin Oscillatoria 1.37 e-02 4.70 e-12 4.60 e-01 0.06
Endosulfan Oscillatoria 9.55 e-11 1.49 e-13 1.94 e-04 0.31
Fenoxycarb Oscillatoria 1.45 e-01 1.59 e-14 3.58 e-04 0.27
Tebufenpyrad Oscillatoria 1.43 e-06 6.17 e-15 5.57 e-01 0.05
Tetradifon Oscillatoria 3.43 e-08 2.07 e-12 5.05 e-01 0.05
Table C.2 Estimated value and standard error for each parameter of equation 2.1, i.e. maximum response k,
median effect concentration (EC50) and slope parameter s, for the concentration response data after
fourteen days of exposure represented per cyanobacteria. Numbers denote repeated experiments.
Maximum response k EC50 Slope parameter s
Anabaena 1 19.89 ± 3.56 27.72 ± 17.38 1.00 ± 0.68
Anabaena 2 14.61 ± 1.15 63.89 ± 12.94 5.51 ± 4.51
Aphanizomenon 1 10.82 ± 1.10 94.34 ± 48.91 1.16 ± 0.64
Aphanizomenon 2 20.69 ± 3.39 42.66 ± 28.944 0.65 ± 0.46
Cylindrospermopsis 1 9.44 ± 1.22 19.15 ± 5.65 2.54 ± 1.08
Cylindrospermopsis 2 15.89 ± 1.76 49.20 ± 11.10 2.42 ± 2.17
Microcystis 1 13.42 ± 0.76 51.96 ± 7.45 6.28 ± 3.21
Microcystis 2 17.81 ± 1.18 50.89 ± 40.98 12.57 ± 4.35
Nodularia 1 9.98 ± 1.41 27.43 ± 10.34 1.78 ± 0.79
Nodularia 2 11.56 ± 1.14 43.44 ± 41.46 15.23 ± 7.43
Oscillatoria 1 18.39 ± 1.62 33.09 ± 6.75 2.84 ± 1.20
Oscillatoria 2 11.17 ± 1.15 21.21 ± 17.63 15.75 ± 12.39
Starvation 1 10.43 ± 0.89 46.31 ± 37.49 10.08 ± 5.87
Starvation 2 20.63 ± 1.52 51.06 ± 8.71 6.04 ± 4.32

Supplementary material for Chapter 4
263
Table C.3 Benjamini-Hochberg corrected p-values for pairwise correlation between deviations parameters
for all insecticides. P-values smaller than 0.05 are represented in bold italic. Chlor=chlorpyrifos,
Del=deltamethrin, Teb=tebufenpyrad, Tetra=tetradifon.
Acetamiprid Carbaryl Chlor Del Endosulfan Fenoxycarb Teb Tetra
Acetamiprid 0.54 0.96 0.45 0.06 0.08 0.23 0.52
Carbaryl 0.54 0.13 0.52 0.86 0.86 0.66 0.95
Chlor 0.96 0.13 0.12 0.73 0.73 0.29 0.53
Del 0.45 0.52 0.12 0.23 0.27 0.09 0.11
Endosulfan 0.06 0.86 0.73 0.23 0.004 0.09 0.09
Fenoxycarb 0.08 0.86 0.73 0.27 0.004 0.11 0.12
Teb 0.23 0.66 0.29 0.09 0.09 0.11 0.09
Tetra 0.52 0.95 0.53 0.11 0.09 0.12 0.09
Table C.4 Benjamini-Hochberg corrected p-values for pairwise correlation between deviations parameters
for all insecticides. P-values smaller than 0.05 are represented in bold italic.
Anabaena Aphanizomenon Cylindrospermopsis Microcystis Nodularia Oscillatoria
Anabaena 0.46 0.31 0.12 0.45 0.22
Aphanizomenon 0.46 0.07 0.17 0.76 0.15
Cylindrospermopsis 0.31 0.07 0.15 0.84 0.25
Microcystis 0.12 0.17 0.15 0.80 0.17
Nodularia 0.45 0.76 0.84 0.80 0.88
Oscillatoria 0.22 0.15 0.25 0.17 0.88
Table C.5 Estimated model parameters and their standard error after 14 days of exposure: EC50 (50%
effect concentration), s (slope parameter), and a (deviation parameter to quantify mixture interaction) for
each of the different steps: IA (independent action, Eq. 3.2) or CA (concentration addition, Eq. 3.1)-model
step 1 (reference model based on data from single stressors treatments only), IA or CA-model step 2
(reference model based on data from all treatments), IA or CA-model step 3 (reference model including
the deviation parameter a to quantify mixture interaction, Eq.3.3) per cyanobacteria. The reported p value
is for the F-test that compared the nested models from step 2 and step 3. P <0.05 indicates a significant
deviation from the reference model (i.e. aninteracting effect). EC50 of the insecticide has SI units of µg L-1
for tebufenpyrad and tetradifon and ng L-1
for chlorpyrifos and fenoxycarb.
Chlorpyrifos Fenoxycarb Tebufenpyrad Tetradifon
Slope parameter (s) Insecticide:
IA: step 1 1.52 ± 0.51 1.26 ± 0.10 2.60 ± 0.60 1.00 ± 0.26
IA: step 2 1.42 ± 0.36 1.43 ± 0.32 2.87 ± 0.61 0.93 ± 0.23
IA: step 3 1.65 ± 0.48 1.85 ± 0.40 2.23 ± 0.52 0.99 ± 0.24
CA: step 1 1.98 ± 0.30 2.28 ± 0.47 2.16 ± 0.37 1.85 ± 0.37
CA: step 2 2.38 ± 0.29 3.09 ± 0.34 2.58 ± 0.60 1.81 ± 0.27
CA: step 3 2.34 ± 0.28 3.11 ± 0.36 2.11 ± 0.37 1.75 ± 0.29

Appendix C
264
Table C.5 cont. Chlorpyrifos Fenoxycarb Tebufenpyrad Tetradifon
Slope parameter (s) Microcystis:
IA: step 1 2.13 ± 0.37 3.01 ± 1.03 1.78 ± 0.45 2.89 ± 0.76
IA: step 2 2.41 ± 0.34 3.38 ± 0.64 3.02 ± 0.85 2.48 ± 0.57
IA: step 3 2.57 ± 0.39 3.79 ± 0.68 1.74 ± 0.48 2.55 ± 0.63
CA: step 1 1.98 ± 0.30 2.28 ± 0.49 2.16 ± 0.37 1.85 ± 0.37
CA: step 2 2.38 ± 0.29 3.09 ± 0.34 2.58 ± 0.60 1.81 ± 0.27
CA: step 3 2.34 ± 0.28 3.11 ± 0.36 2.11 ± 0.37 1.75 ± 0.29
EC50 (Insecticide):
IA: step 1 75.52 ± 14.65 69.84 ± 10.66 10.98 ± 0.99 11.23 ± 2.00
IA: step 2 74.86 ± 13.52 56.44 ± 5.36 11.93 ± 0.89 9.18 ± 1.45
IA: step 3 72.37 ± 11.71 66.28 ± 5.50 10.03 ± 1.04 10.59 ± 1.94
CA: step 1 68.23 ± 6.69 66.13 ± 5.47 10.63 ± 1.07 12.19 ± 1.75
CA: step 2 68.14 ± 5.46 65.49 ± 3.21 14.22 ± 1.39 10.86 ± 1.28
CA: step 3 64.87 ± 5.18 65.24 ± 3.51 9.99 ± 1.05 11.55 ± 1.56
EC50 (Microcystis) (% of diet):
IA: step 1 37.61 ± 3.56 27.91 ± 3.27 39.46 ± 6.16 30.44 ± 3.14
IA: step 2 36.25 ± 2.09 25.73 ± 1.43 54.76 ± 6.40 31.51 ± 2.83
IA: step 3 37.95 ± 2.67 29.94 ± 1.95 44.84 ± 7.07 33.17 ± 3.49
CA: step 1 37.66 ± 3.66 29.78 ± 3.95 38.52 ± 5.46 33.62 ± 5.49
CA: step 2 42.42 ± 2.53 30.43 ± 1.82 79.03 ± 12.29 32.87 ± 3.92
CA: step 3 38.23 ± 3.10 30.15 ± 2.55 43.96 ± 6.34 34.54 ± 5.27
Deviation parameter a:
IA: step 3 -0.71 ± 0.69 -2.27 ± 0.62 2.97 ± 0.85 -0.74 ± 0.67
CA: step 3 0.60 ± 0.35 0.07 ± 0.35 3.25 ± 0.65 -0.44 ± 0.64
Conclusion IA: Non-interaction Synergism Antagonism Non-interaction
P-value (IA: step 2 / IA: step 3) 0.30 6.05 e-04 0.003 0.28
Conclusion CA: Non-interaction Non-interaction Antagonism Non-interaction
P-value (CA: step 2 / CA: step 3) 0.09 0.87 1.35 e-07 0.48
Table C.6 Estimated model parameters and their standard error after fourteen days of exposure: EC50
(50% effect concentration), s (slope parameter), and a (deviation parameter to quantify mixture
interaction) for each of the different steps: IA (independent action, Eq. 3.2) or CA (concentration addition,
Eq. 3.1)-model step 1 (reference model based on data from single stressors treatments only), IA or CA-
model step 2 (reference model based on data from all treatments), IA or CA-model step 3 (reference
model including the deviation parameter a to quantify mixture interaction, Eq. 3.3) per cyanobacteria. The
reported p value is for the F-test that compared the nested models from step 2 and step 3. P <0.05
indicates a significant deviation from the reference model (i.e. aninteracting effect). Aph=Aphanizomenon,
Cyl=Cylindrospermopsis, MC=Microcystis, Osl=Oscillatoria.

Supplementary material for Chapter 4
265
Aph Cyl MC Osl
Slope parameter (s) Carbaryl:
IA: step 1 0.26 ± 0.48 0.51 ± 0.48 3.12 ± 2.41 1.86 ± 1.03
IA: step 2 0.91 ± 0.37 0.71 ± 0.40 3.54 ± 3.13 3.91 ± 1.63
IA: step 3 0.15 ± 0.27 0.45 ± 0.50 3.08 ± 2.59 0.73 ± 0.26
CA: step 1 1.01 ± 0.22 0.97 ± 0.34 2.49 ± 1.01 0.65 ± 0.20
CA: step 2 0.80 ± 0.15 0.75 ± 0.32 2.28 ± 0.99 0.54 ± 0.17
CA: step 3 0.90 ± 0.15 0.81 ± 0.31 3.16 ± 1.05 0.59 ± 0.13
Slope parameter (s) Cyanobacteria:
IA: step 1 1.17 ± 0.26 2.09 ± 0.85 1.92 ± 0.88 0.55 ± 0.19
IA: step 2 1.06 ± 0.24 2.74 ± 1.11 2.86 ± 1.14 0.34 ± 0.16
IA: step 3 1.14 ± 0.21 1.91 ± 0.90 3.16 ± 1.21 0.51 ± 0.16
CA: step 1 1.01 ± 0.22 0.97 ± 0.34 2.49 ± 1.01 0.65 ± 0.20
CA: step 2 0.80 ± 0.15 0.75 ± 0.32 2.28 ± 0.99 0.54 ± 0.17
CA: step 3 0.90 ± 0.15 0.81 ± 0.31 3.16 ± 1.05 0.59 ± 0.13
EC50 (Carbaryl) (µg L-1
):
IA: step 1 3.34 ± 3.61 6.09 ± 3.76 6.87 ± 1.13 1.42 ± 0.47
IA: step 2 7.35 ± 2.95 4.82 ± 2.68 6.87 ± 1.16 2.20 ± 0.19
IA: step 3 2.43 ± 1.08 6.16 ± 2.93 6.89 ± 1.24 0.50 ± 0.22
CA: step 1 3.62 ± 1.09 5.05 ± 1.37 7.13 ± 1.38 0.41 ± 0.35
CA: step 2 5.92 ± 1.44 6.35 ± 2.09 8.79 ± 2.64 0.98 ± 0.54
CA: step 3 2.06 ± 0.86 4.90 ± 1.60 6.86 ± 1.15 0.33 ± 0.13
EC50 (Cyanobacteria) (% of diet):
IA: step 1 39.17 ± 6.68 60.48 ± 11.07 16.58 ± 4.02 16.42 ± 5.52
IA: step 2 55.53 ± 10.39 67.33 ± 10.86 24.15 ± 2.93 35.48 ± 17.21
IA: step 3 40.51 ± 6.05 67.49 ± 14.51 14.66 ± 2.94 18.02 ± 5.42
CA: step 1 41.48 ± 8.39 78.63 ± 31.34 15.28 ± 3.13 16.78 ± 5.05
CA: step 2 57.18 ± 11.21 121.22 ± 70.51 29.76 ± 5.50 29.74 ± 10.44
CA: step 3 43.72 ± 7.66 95.03 ± 48.06 14.39 ± 2.79 17.03 ± 4.56
Deviation parameter a:
IA-model 3 2.99 ± 0.52 1.49 ±1.12 8.08 ± 4.66 4.86 ± 0.86
CA-model 3 2.06 ± 0.86 1.70 ± 1.60 5.75 ± 2.27 9.11 ± 2.63
Conclusion IA: Antagonism Non interaction Antagonism Antagonism
P-value (IA: step 2 / IA: step 3) 8.56 e-05 0.28 0.024 3.22 e-04
Conclusion CA: Antagonism Non interaction Antagonism Antagonism
P-value (CA: step 2 / CA: step 3) 0.03 0.27 0.001 5.38 e-06


Appendix D
Supplementary material for Chapter 5

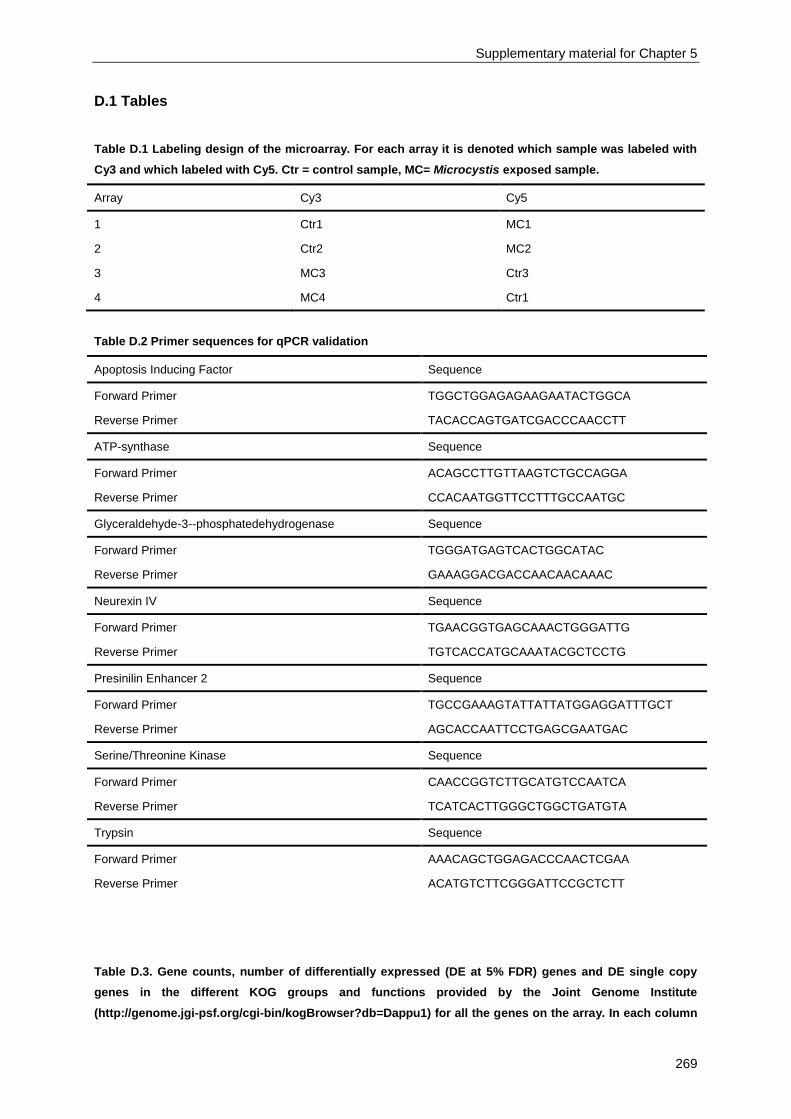
Supplementary material for Chapter 5
269
D.1 Tables
Table D.1 Labeling design of the microarray. For each array it is denoted which sample was labeled with
Cy3 and which labeled with Cy5. Ctr = control sample, MC= Microcystis exposed sample.
Array Cy3 Cy5
1 Ctr1 MC1
2 Ctr2 MC2
3 MC3 Ctr3
4 MC4 Ctr1
Table D.2 Primer sequences for qPCR validation
Apoptosis Inducing Factor Sequence
Forward Primer TGGCTGGAGAGAAGAATACTGGCA
Reverse Primer TACACCAGTGATCGACCCAACCTT
ATP-synthase Sequence
Forward Primer ACAGCCTTGTTAAGTCTGCCAGGA
Reverse Primer CCACAATGGTTCCTTTGCCAATGC
Glyceraldehyde-3--phosphatedehydrogenase Sequence
Forward Primer TGGGATGAGTCACTGGCATAC
Reverse Primer GAAAGGACGACCAACAACAAAC
Neurexin IV Sequence
Forward Primer TGAACGGTGAGCAAACTGGGATTG
Reverse Primer TGTCACCATGCAAATACGCTCCTG
Presinilin Enhancer 2 Sequence
Forward Primer TGCCGAAAGTATTATTATGGAGGATTTGCT
Reverse Primer AGCACCAATTCCTGAGCGAATGAC
Serine/Threonine Kinase Sequence
Forward Primer CAACCGGTCTTGCATGTCCAATCA
Reverse Primer TCATCACTTGGGCTGGCTGATGTA
Trypsin Sequence
Forward Primer AAACAGCTGGAGACCCAACTCGAA
Reverse Primer ACATGTCTTCGGGATTCCGCTCTT
Table D.3. Gene counts, number of differentially expressed (DE at 5% FDR) genes and DE single copy
genes in the different KOG groups and functions provided by the Joint Genome Institute
(http://genome.jgi-psf.org/cgi-bin/kogBrowser?db=Dappu1) for all the genes on the array. In each column
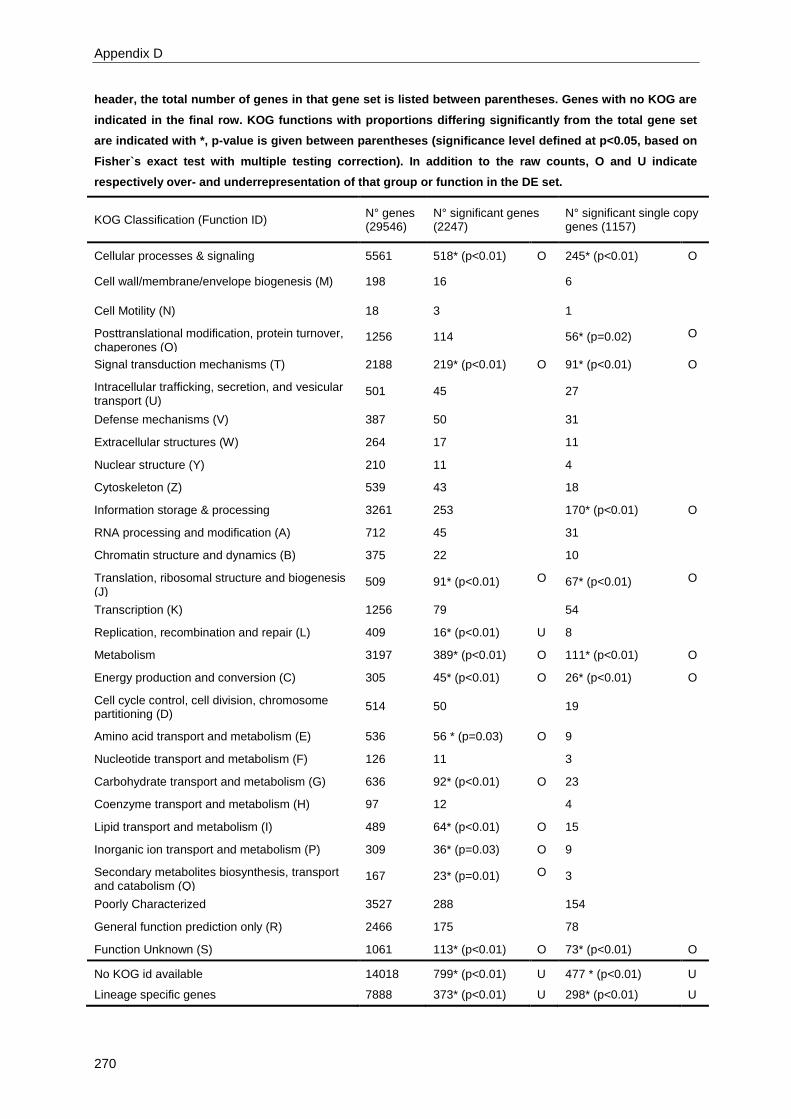
Appendix D
270
header, the total number of genes in that gene set is listed between parentheses. Genes with no KOG are
indicated in the final row. KOG functions with proportions differing significantly from the total gene set
are indicated with *, p-value is given between parentheses (significance level defined at p<0.05, based on
Fisher`s exact test with multiple testing correction). In addition to the raw counts, O and U indicate
respectively over- and underrepresentation of that group or function in the DE set.
KOG Classification (Function ID) N° genes (29546)
N° significant genes (2247)
N° significant single copy genes (1157)
Cellular processes & signaling 5561 518* (p<0.01) O 245* (p<0.01) O
Cell wall/membrane/envelope biogenesis (M) 198 16 6
Cell Motility (N) 18 3 1
Posttranslational modification, protein turnover, chaperones (O)
1256 114 56* (p=0.02) O
Signal transduction mechanisms (T) 2188 219* (p<0.01) O 91* (p<0.01) O
Intracellular trafficking, secretion, and vesicular transport (U)
501 45 27
Defense mechanisms (V) 387 50 31
Extracellular structures (W) 264 17 11
Nuclear structure (Y) 210 11 4
Cytoskeleton (Z) 539 43 18
Information storage & processing 3261 253 170* (p<0.01) O
RNA processing and modification (A) 712 45 31
Chromatin structure and dynamics (B) 375 22 10
Translation, ribosomal structure and biogenesis (J)
509 91* (p<0.01) O 67* (p<0.01) O
Transcription (K) 1256 79 54
Replication, recombination and repair (L) 409 16* (p<0.01) U 8
Metabolism 3197 389* (p<0.01) O 111* (p<0.01) O
Energy production and conversion (C) 305 45* (p<0.01) O 26* (p<0.01) O
Cell cycle control, cell division, chromosome partitioning (D)
514 50
19
Amino acid transport and metabolism (E) 536 56 * (p=0.03) O 9
Nucleotide transport and metabolism (F) 126 11 3
Carbohydrate transport and metabolism (G) 636 92* (p<0.01) O 23
Coenzyme transport and metabolism (H) 97 12 4
Lipid transport and metabolism (I) 489 64* (p<0.01) O 15
Inorganic ion transport and metabolism (P) 309 36* (p=0.03) O 9
Secondary metabolites biosynthesis, transport and catabolism (Q)
167 23* (p=0.01) O 3
Poorly Characterized 3527 288 154
General function prediction only (R) 2466 175 78
Function Unknown (S) 1061 113* (p<0.01) O 73* (p<0.01) O
No KOG id available 14018 799* (p<0.01) U 477 * (p<0.01) U
Lineage specific genes 7888 373* (p<0.01) U 298* (p<0.01) U

Supplementary material for Chapter 5
271
Table D.4 Representation of all significant genes encoding serine/threonine protein kinases with their
gene id, M-value and q-value.
Gene_id M Q
Dappudraft_260025 -1.167838252 0.004636829
Dappudraft_333324 -1.084448257 0.00546086
Dappudraft_222058 1.146186673 0.012547633
Dappudraft_259603 -0.861809389 0.013005852
Dappudraft_300401 -0.879055652 0.013043623
Dappudraft_327929 -0.867523257 0.014294608
Dappudraft_117153 -0.849548753 0.014982355
Dappudraft_102851 -0.847891239 0.015544494
Dappudraft_331153 -0.941185423 0.022081304
Dappudraft_103157 -0.805855252 0.024829462
Dappudraft_330244 -0.678801296 0.03467279
Dappudraft_35627 -0.924324297 0.01702005
Dappudraft_35689 -0.775677997 0.022135239
Table D.5 Representation of all significant genes encoding 40S ribosomal proteins with their gene id, M-
value and q-value.
Gene_id M Q
Dappudraft_230714 -0.860191318 0.03358461
Dappudraft_308825 -0.660300638 0.037136694
Dappudraft_230521 -0.654487776 0.030334904
Dappudraft_129273 -0.91000268 0.01385579
Dappudraft_301703 -0.756584257 0.025632432
Dappudraft_306294 -0.645223001 0.03392859
Dappudraft_300540 -0.874099939 0.019719688
Dappudraft_309158 -1.228715997 0.019382698
Dappudraft_230600 -1.115467193 0.007737106
Dappudraft_230652 -0.836630087 0.013574141
Dappudraft_310174 -0.772921638 0.0291236
Dappudraft_92111 -0.96033012 0.008937795
Dappudraft_308217 -0.878130721 0.021520822
Dappudraft_128589 -1.035264907 0.022921808
Dappudraft_231413 -1.324992298 0.021561447
Dappudraft_230667 -0.641106828 0.039525013
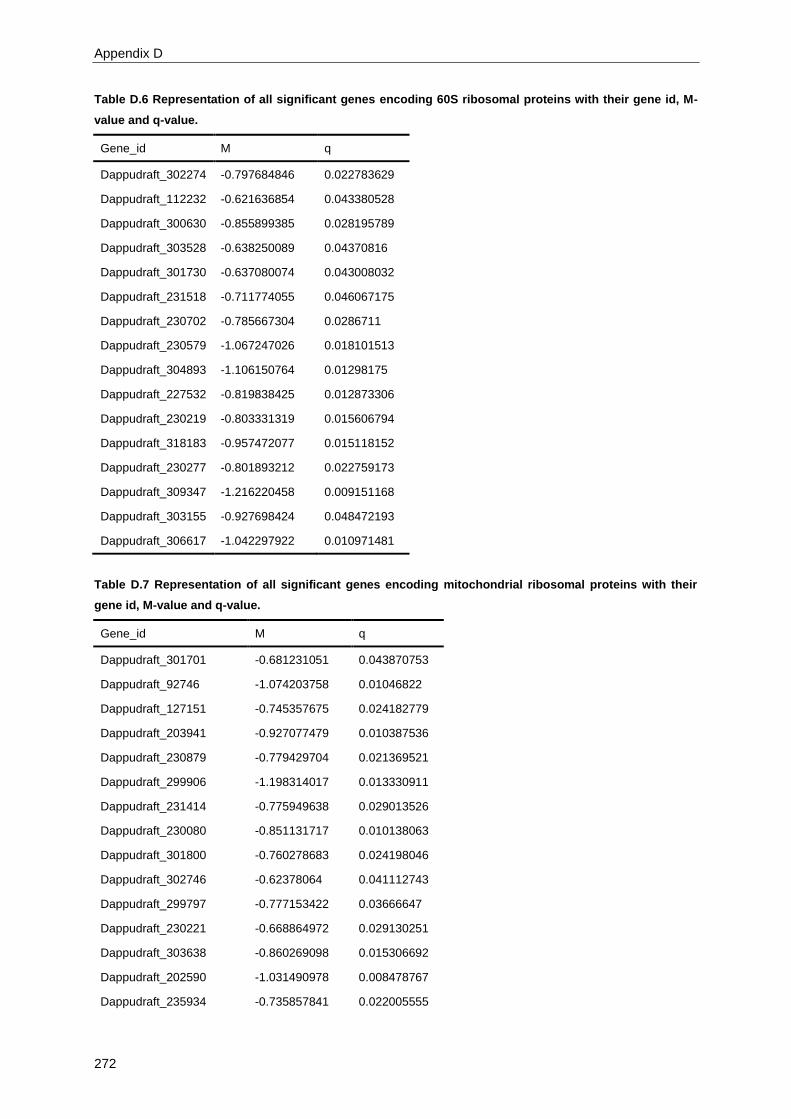
Appendix D
272
Table D.6 Representation of all significant genes encoding 60S ribosomal proteins with their gene id, M-
value and q-value.
Gene_id M q
Dappudraft_302274 -0.797684846 0.022783629
Dappudraft_112232 -0.621636854 0.043380528
Dappudraft_300630 -0.855899385 0.028195789
Dappudraft_303528 -0.638250089 0.04370816
Dappudraft_301730 -0.637080074 0.043008032
Dappudraft_231518 -0.711774055 0.046067175
Dappudraft_230702 -0.785667304 0.0286711
Dappudraft_230579 -1.067247026 0.018101513
Dappudraft_304893 -1.106150764 0.01298175
Dappudraft_227532 -0.819838425 0.012873306
Dappudraft_230219 -0.803331319 0.015606794
Dappudraft_318183 -0.957472077 0.015118152
Dappudraft_230277 -0.801893212 0.022759173
Dappudraft_309347 -1.216220458 0.009151168
Dappudraft_303155 -0.927698424 0.048472193
Dappudraft_306617 -1.042297922 0.010971481
Table D.7 Representation of all significant genes encoding mitochondrial ribosomal proteins with their
gene id, M-value and q-value.
Gene_id M q
Dappudraft_301701 -0.681231051 0.043870753
Dappudraft_92746 -1.074203758 0.01046822
Dappudraft_127151 -0.745357675 0.024182779
Dappudraft_203941 -0.927077479 0.010387536
Dappudraft_230879 -0.779429704 0.021369521
Dappudraft_299906 -1.198314017 0.013330911
Dappudraft_231414 -0.775949638 0.029013526
Dappudraft_230080 -0.851131717 0.010138063
Dappudraft_301800 -0.760278683 0.024198046
Dappudraft_302746 -0.62378064 0.041112743
Dappudraft_299797 -0.777153422 0.03666647
Dappudraft_230221 -0.668864972 0.029130251
Dappudraft_303638 -0.860269098 0.015306692
Dappudraft_202590 -1.031490978 0.008478767
Dappudraft_235934 -0.735857841 0.022005555

Supplementary material for Chapter 5
273
Table D.8 Representation of all significant genes encoding NADH:ubiquinone oxidoreductases with their
gene id, M-value and q-value.
Gene_id M q
Dappudraft_304291 -0.858995744 0.025536468
Dappudraft_299813 -0.94309662 0.018969062
Dappudraft_230517 -0.769376597 0.047371208
Dappudraft_231213 -0.819761192 0.026740597
Dappudraft_300905 -0.862170724 0.030811829
Dappudraft_57515 -0.665131598 0.04114799
Dappudraft_230160 -0.705074892 0.035607725
Dappudraft_301888 -0.765291003 0.016817111
Dappudraft_329128 -1.038609843 0.014654532
Dappudraft_319968 -0.956596337 0.010058282
Dappudraft_230203 -0.747899746 0.018330543
Gene_id (Table D.7 cont.) M q
Dappudraft_308640 -0.857987823 0.016257231
Dappudraft_306295 -0.697098988 0.044635538
Dappudraft_304054 -0.796991413 0.020647025
Dappudraft_45963 -0.696473533 0.044843598
Dappudraft_92874 -0.704764805 0.041172091
Dappudraft_212601 -0.95004552 0.011364121
Dappudraft_301505 -1.006761256 0.009119092
Dappudraft_52198 -0.627335103 0.046665881
Dappudraft_54066 -0.924111396 0.022350937
Dappudraft_49671 -0.934347924 0.025547143
Dappudraft_47251 -1.061919222 0.011809093
Dappudraft_230842 -0.713552469 0.039346196
Dappudraft_308808 -0.874164157 0.013278267
Dappudraft_304832 -0.746501906 0.017715883
Dappudraft_201511 -0.958025435 0.019341063
Dappudraft_300200 -0.823671114 0.012529798

Appendix D
274
Table D.9 Representation of all significant genes encoding Neurexin IV proteins with their gene id, M-
value and q-value.
Gene_id M q
Dappudraft_112805 2.057113146 0.001458643
Dappudraft_15938 1.442465531 0.024437146
Dappudraft_18957 1.226031077 0.023267106
Dappudraft_19082 0.736019375 0.025239532
Dappudraft_224995 1.862206383 0.001978969
Dappudraft_227614 -1.276953909 0.016298837
Dappudraft_241573 0.849641647 0.028920004
Dappudraft_254743 -1.405455401 0.003987622
Dappudraft_25868 1.181945327 0.037356416
Dappudraft_27377 1.246886822 0.019353378
Dappudraft_28846 1.625758842 0.021475498
Dappudraft_307670 0.742128388 0.048094669
Dappudraft_316232 0.968238448 0.031815929
Dappudraft_316370 0.920783984 0.034623099
Dappudraft_316536 1.01333875 0.027158434
Table D.10 Representation of all significant genes encoding apoptosis inducing factors with their gene id,
M-value and q-value.
Gene_id M q
Dappudraft_101684 0.761409017 0.021088559
Dappudraft_110393 0.785333634 0.022529325
Dappudraft_114576 0.784084611 0.027761704
Dappudraft_241495 0.737738857 0.03511398
Dappudraft_241532 0.839590203 0.029226648
Dappudraft_244863 0.871002662 0.017093582
Dappudraft_254132 0.7096745 0.032287331
Dappudraft_273989 0.683210292 0.046739127
Dappudraft_319562 0.630629594 0.040974695
Dappudraft_43230 0.665554843 0.035756202
Dappudraft_67988 0.635347866 0.036722419
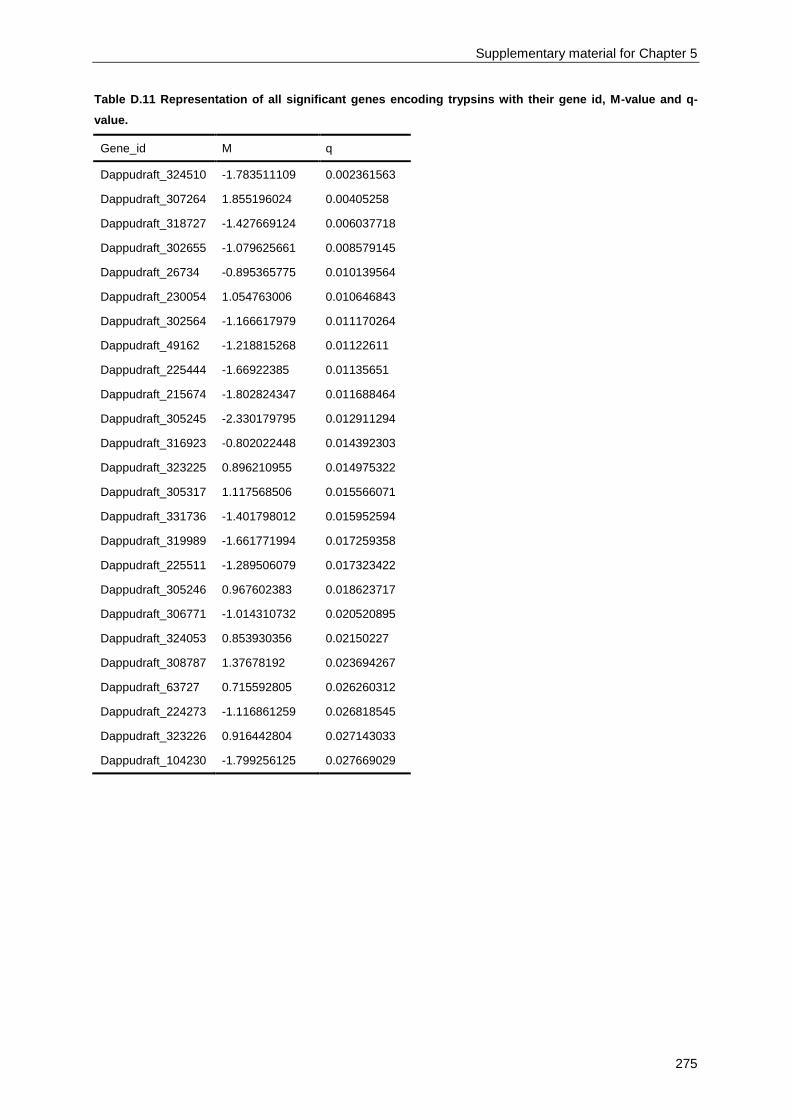
Supplementary material for Chapter 5
275
Table D.11 Representation of all significant genes encoding trypsins with their gene id, M-value and q-
value.
Gene_id M q
Dappudraft_324510 -1.783511109 0.002361563
Dappudraft_307264 1.855196024 0.00405258
Dappudraft_318727 -1.427669124 0.006037718
Dappudraft_302655 -1.079625661 0.008579145
Dappudraft_26734 -0.895365775 0.010139564
Dappudraft_230054 1.054763006 0.010646843
Dappudraft_302564 -1.166617979 0.011170264
Dappudraft_49162 -1.218815268 0.01122611
Dappudraft_225444 -1.66922385 0.01135651
Dappudraft_215674 -1.802824347 0.011688464
Dappudraft_305245 -2.330179795 0.012911294
Dappudraft_316923 -0.802022448 0.014392303
Dappudraft_323225 0.896210955 0.014975322
Dappudraft_305317 1.117568506 0.015566071
Dappudraft_331736 -1.401798012 0.015952594
Dappudraft_319989 -1.661771994 0.017259358
Dappudraft_225511 -1.289506079 0.017323422
Dappudraft_305246 0.967602383 0.018623717
Dappudraft_306771 -1.014310732 0.020520895
Dappudraft_324053 0.853930356 0.02150227
Dappudraft_308787 1.37678192 0.023694267
Dappudraft_63727 0.715592805 0.026260312
Dappudraft_224273 -1.116861259 0.026818545
Dappudraft_323226 0.916442804 0.027143033
Dappudraft_104230 -1.799256125 0.027669029

Appendix D
276
Table D.12 Representation of all significant genes encoding glutathione-S-transferases with their gene id,
M-value, q-value and KOG ID.
Gene ID M-value q-value KOG ID
Dappudraft_15523 0,761329759 0,03099197 KOG0868
Dappudraft_205726 0,597296387 0,090511183 KOG1695
Dappudraft_196080 0,446879652 0,174472064 KOG0867
Dappudraft_95675 -0,341370785 0,219083444 KOG0867
Dappudraft_318232 -0,31463263 0,376413789 KOG0867
Dappudraft_200523 0,270482358 0,390270386 KOG0867
Dappudraft_219884 -0,2290158 0,432623386 KOG1695
Dappudraft_230826 -0,167060446 0,446883927 KOG0867
Dappudraft_230303 0,199841112 0,50924953 KOG1695
Dappudraft_255502 -0,399724484 0,641746293 KOG1695
Dappudraft_230650 -0,017844763 0,820711729 KOG1695
Dappudraft_230761 0,027026499 0,853910691 KOG1695
Table D.13 Representation of all significant genes encoding Bcl2, Bax and apoptosis inhibitors (IAP) with
their gene id, M-value and q-value.
Gene ID M-value q-value
Dappudraft_319285 0,114322393 0,77278252
Dappudraft_329424 0,409667089 0,268325843
Dappudraft_306240 -0,952840551 0,014317754
Dappudraft _58422 -0,601298823 0,044295316
Dappudraft_307098 0,435279121 0,277481019
Dappudraft_204003 0,286216464 0,451265164
Dappudraft_256692 -0,238987239 0,58031401
Dappudraft _95322 -0,185334088 0,696223287

Appendix E
Supplementary material for Chapter 6

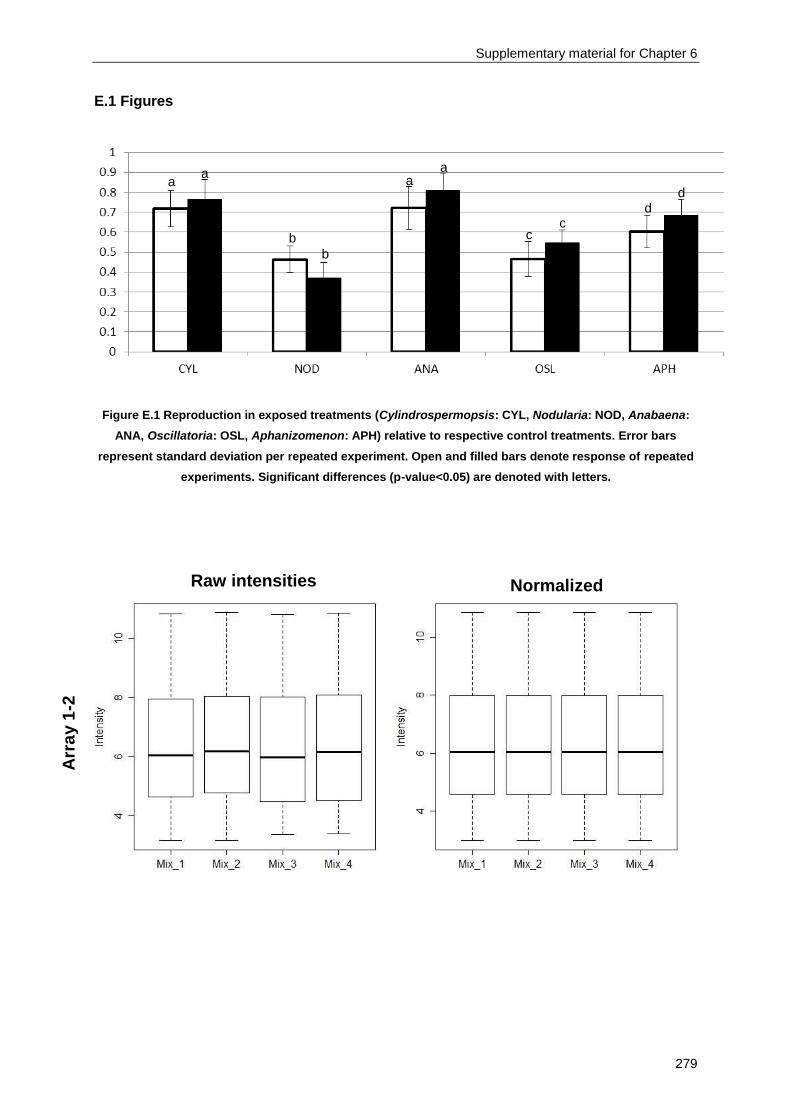
Supplementary material for Chapter 6
279
E.1 Figures
Figure E.1 Reproduction in exposed treatments (Cylindrospermopsis: CYL, Nodularia: NOD, Anabaena:
ANA, Oscillatoria: OSL, Aphanizomenon: APH) relative to respective control treatments. Error bars
represent standard deviation per repeated experiment. Open and filled bars denote response of repeated
experiments. Significant differences (p-value<0.05) are denoted with letters.
a a
a a
b
b
c c
d d
Raw intensities Normalized
intensities
Arr
ay 1
-2
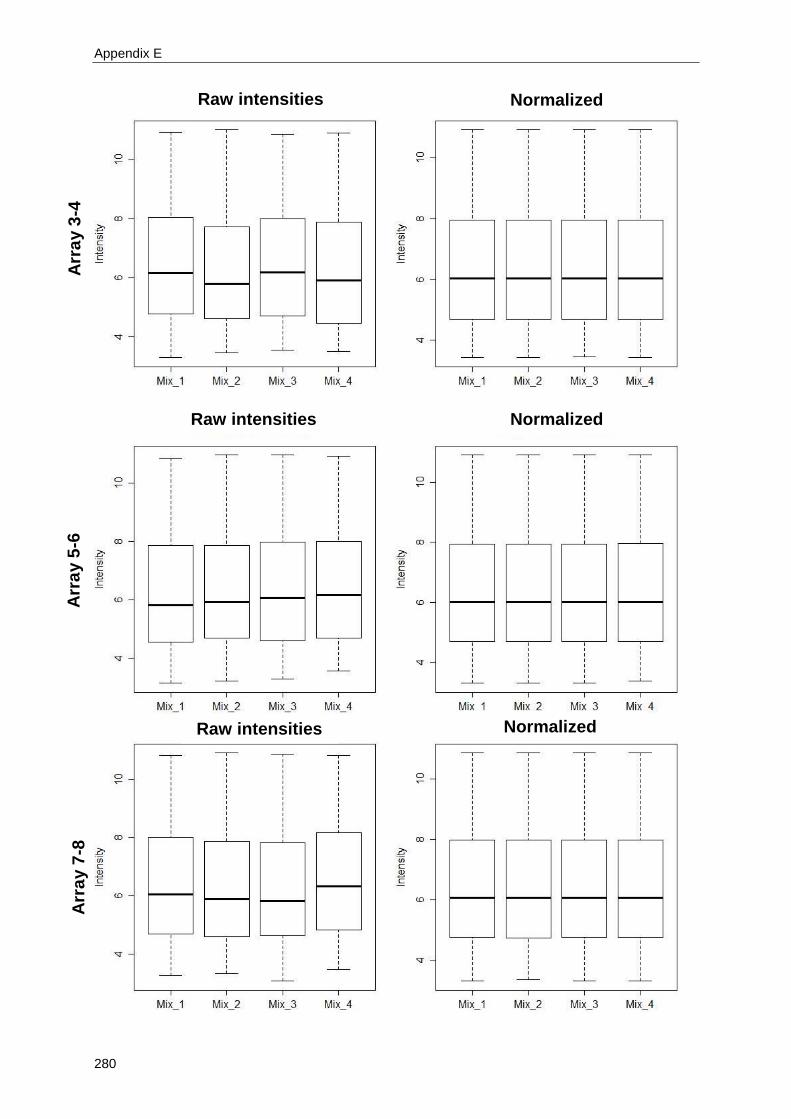
Appendix E
280
Raw intensities
Raw intensities
Raw intensities Normalized
intensities
Normalized
intensities
Normalized
intensities
Arr
ay 7
-8
Arr
ay 5
-6
Arr
ay 3
-4

Supplementary material for Chapter 6
281
Raw intensities
Raw intensities
Raw intensities
Normalized
intensities
Normalized
intensities
Normalized
intensities
Arr
ay 1
3-1
4
Arr
ay 1
1-1
2
Arr
ay 9
-10
A
rra
y 1
1-1
2

Appendix E
282
Raw intensities
Raw intensities
Raw intensities
Normalized
intensities
Normalized
intensities
Normalized
intensities
Arr
ay 1
9-2
0
Arr
ay 1
7-1
8
Arr
ay 1
5-1
6

Supplementary material for Chapter 6
283
Raw intensities
Raw intensities
Raw intensities
Normalized
intensities
Normalized
intensities
Normalized
intensities
Arr
ay 2
5-2
6
Arr
ay 2
3-2
4
Arr
ay 2
1-2
2

Appendix E
284
Raw intensities
Raw intensities
Raw intensities Normalized
intensities
Normalized
intensities
Normalized
intensities
Arr
ay 3
1-3
2
Arr
ay 2
9-3
0
Arr
ay 2
7-2
8
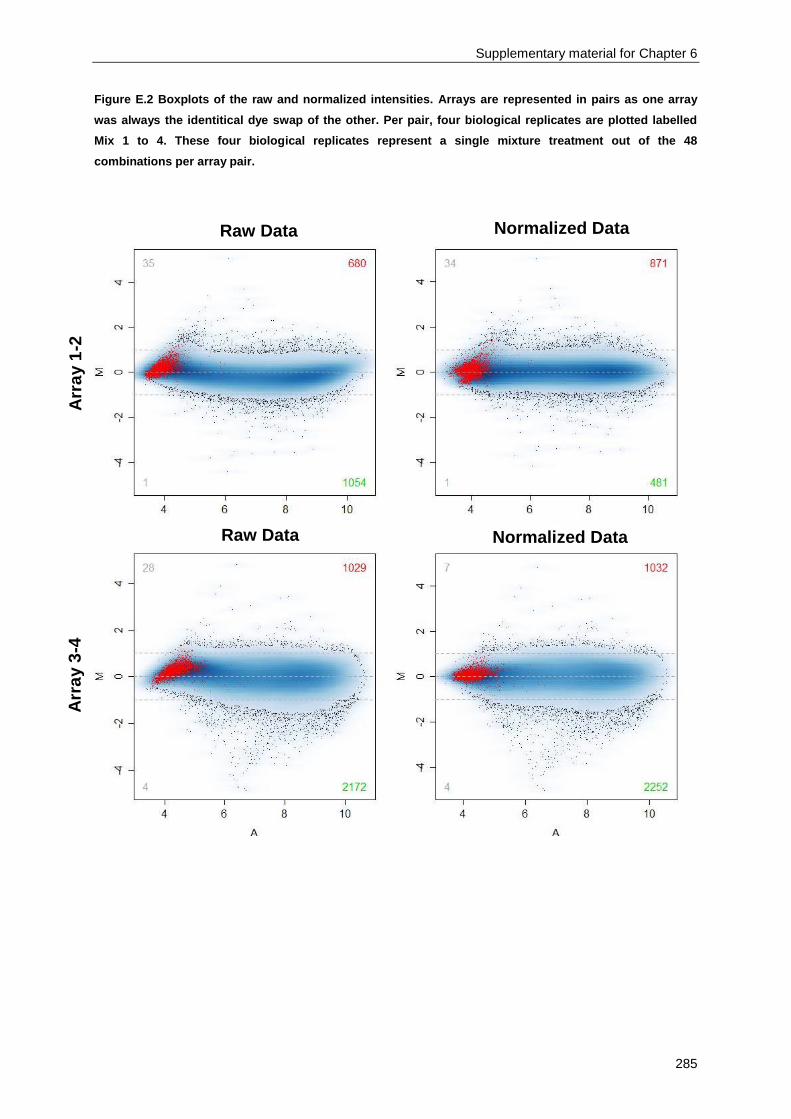
Supplementary material for Chapter 6
285
Figure E.2 Boxplots of the raw and normalized intensities. Arrays are represented in pairs as one array
was always the identitical dye swap of the other. Per pair, four biological replicates are plotted labelled
Mix 1 to 4. These four biological replicates represent a single mixture treatment out of the 48
combinations per array pair.
Raw Data
Raw Data Normalized Data
Normalized Data
Arr
ay 1
-2
Arr
ay 3
-4

Appendix E
286
Raw Data
Raw Data
Raw Data Normalized Data
Normalized Data
Normalized Data A
rra
y 5
-6
Arr
ay 7
-8
Arr
ay 9
-10
~ ~--------------------------------,
19 2404 25 1586
N
3 1113 ~ 4--,,-------,--------.--------.---~
4 6 8 10 4 6 8 10
~ ~--------------------------------~
21 1503 24 1875
9 1849 9 1022 ~ ,_--.--------.-------.--------.---~
4 6 8 10 4 6 8 10
A A
~ ,---------------------------------, 21 1599 27 1999
2 2375 2 1093 ~ ,_---.-------,,-------.--------.--~
4 6 8 10 4 6 8 10
A A
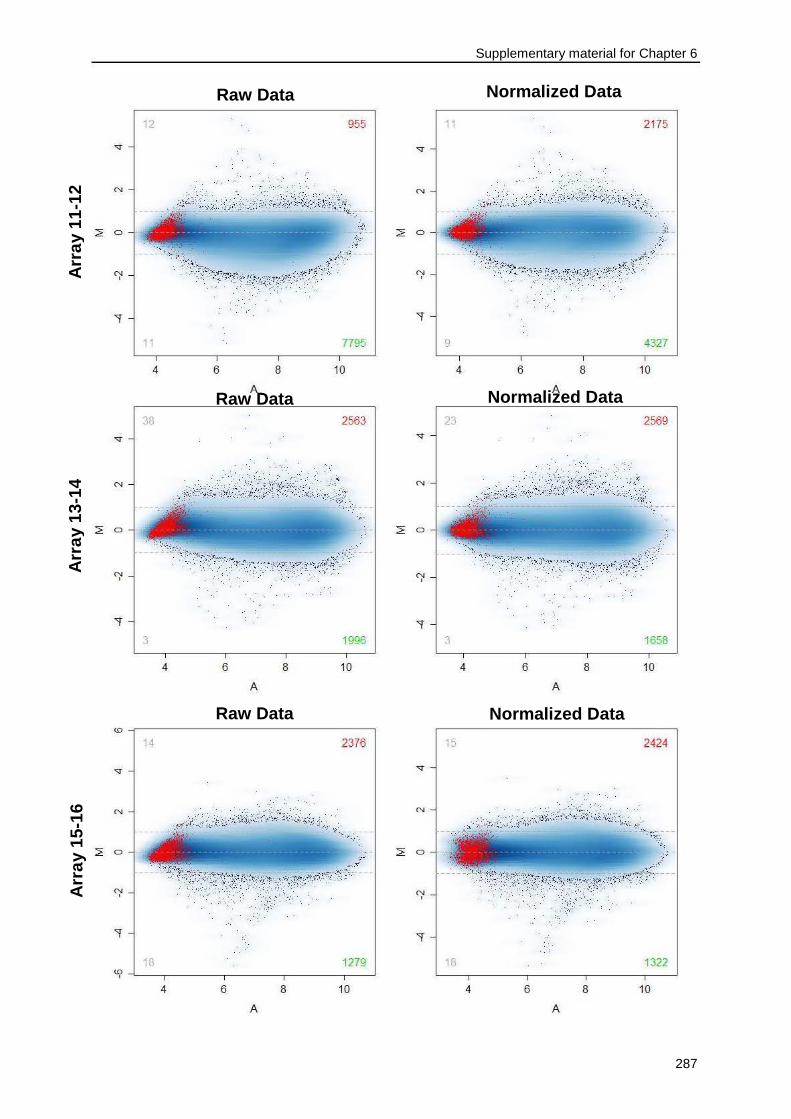
Supplementary material for Chapter 6
287
Raw Data
Raw Data
Raw Data Normalized Data
Normalized Data
Normalized Data A
rra
y 1
1-1
2
Arr
ay 1
3-1
4
Arr
ay 1
5-1
6
12 955 11 2175
11 7795 9 4327
4 6 8 10 4 6 8 10
A A
38 2563 23 2569 '<t
N
~ 0
N I
~
3 1996 3 1658
4 6 8 10 4 6 8 10
A A
<D
14 2376 15 2424
'<t
N
~ 0
N I
~
18 1279 18 1322 '9
4 6 8 10 4 6 8 10
A A

Appendix E
288
Raw Data
Raw Data
Raw Data Normalized Data
Normalized Data
Normalized Data A
rra
y 1
7-1
8
Arr
ay 1
9-2
0
Arr
ay 2
1-2
2
8 2211 12 2242
"' "'
N N
:t· ., ~ 0 ~ 0 -;.~ -
i '!-·::
N I N
I
,. ,. 0 906 0 907
4 6 8 10 4 6 8 10
A A
38 3532
7 1445 10 1664
4 6 8 10 4 6 8 10
14 1065 .. .. . .
"' :·' .. "'
N N
~ 0 ~ 0
~ N I
,. ,. 3 1784 3 1525
4 5 6 7 8 9 10 11 4 6 8 10
A A

Supplementary material for Chapter 6
289
Raw Data
Raw Data
Raw Data Normalized Data
Normalized Data
Normalized Data
Arr
ay 2
3-2
4
Arr
ay 2
5-2
6
Arr
ay 2
7-2
8
22 505 30 640
"' "'
N
~ 0
~
'f 'f
12 2076 8 1489
4 6 8 10 4 6 8 10
A A
44 593 26 398
"' "'
N
~ 0
N I
·:· ~
'f 14 740 14 858
4 6 8 10 4 6 8 10
7 11 26 23 1073
"' "'
N N
~ 0 ~ 0 --
N I
N I ...
... : ..
... , 'f 'f
8 876 13 929
4 5 6 7 8 9 10 11 4 6 8 10
A A
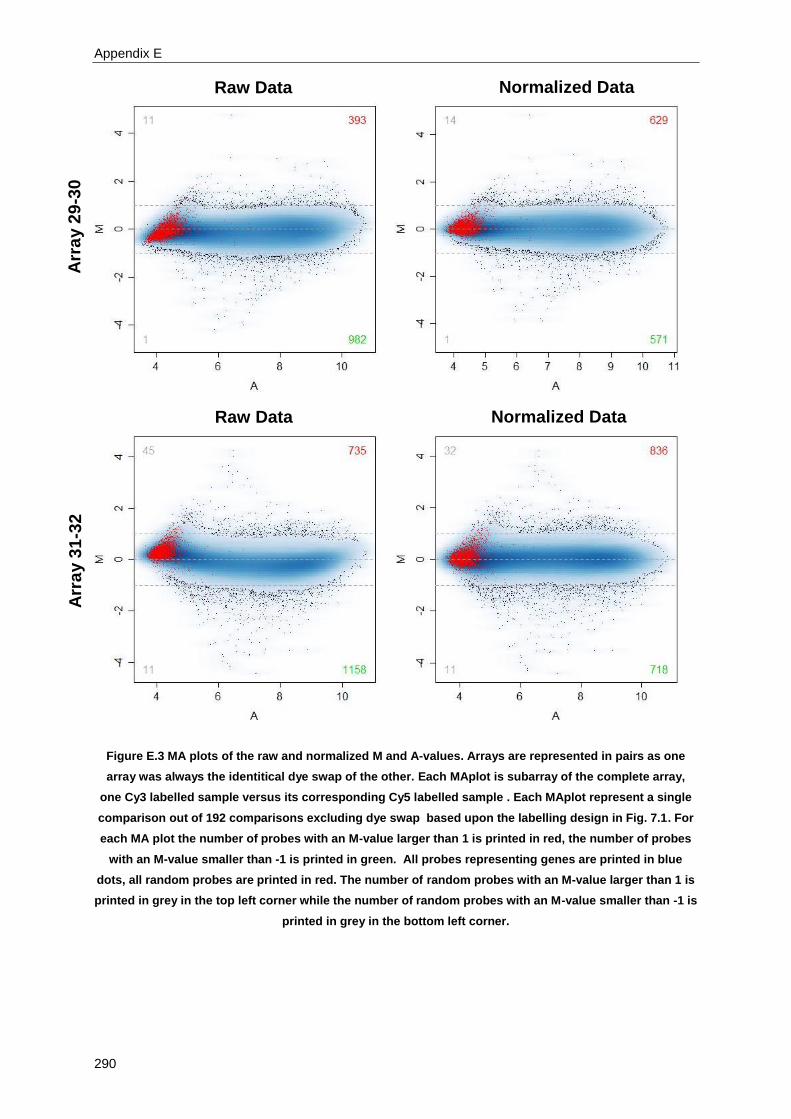
Appendix E
290
Figure E.3 MA plots of the raw and normalized M and A-values. Arrays are represented in pairs as one
array was always the identitical dye swap of the other. Each MAplot is subarray of the complete array,
one Cy3 labelled sample versus its corresponding Cy5 labelled sample . Each MAplot represent a single
comparison out of 192 comparisons excluding dye swap based upon the labelling design in Fig. 7.1. For
each MA plot the number of probes with an M-value larger than 1 is printed in red, the number of probes
with an M-value smaller than -1 is printed in green. All probes representing genes are printed in blue
dots, all random probes are printed in red. The number of random probes with an M-value larger than 1 is
printed in grey in the top left corner while the number of random probes with an M-value smaller than -1 is
printed in grey in the bottom left corner.
Raw Data
Raw Data Normalized Data
Normalized Data A
rra
y 2
9-3
0
Arr
ay 3
1-3
2
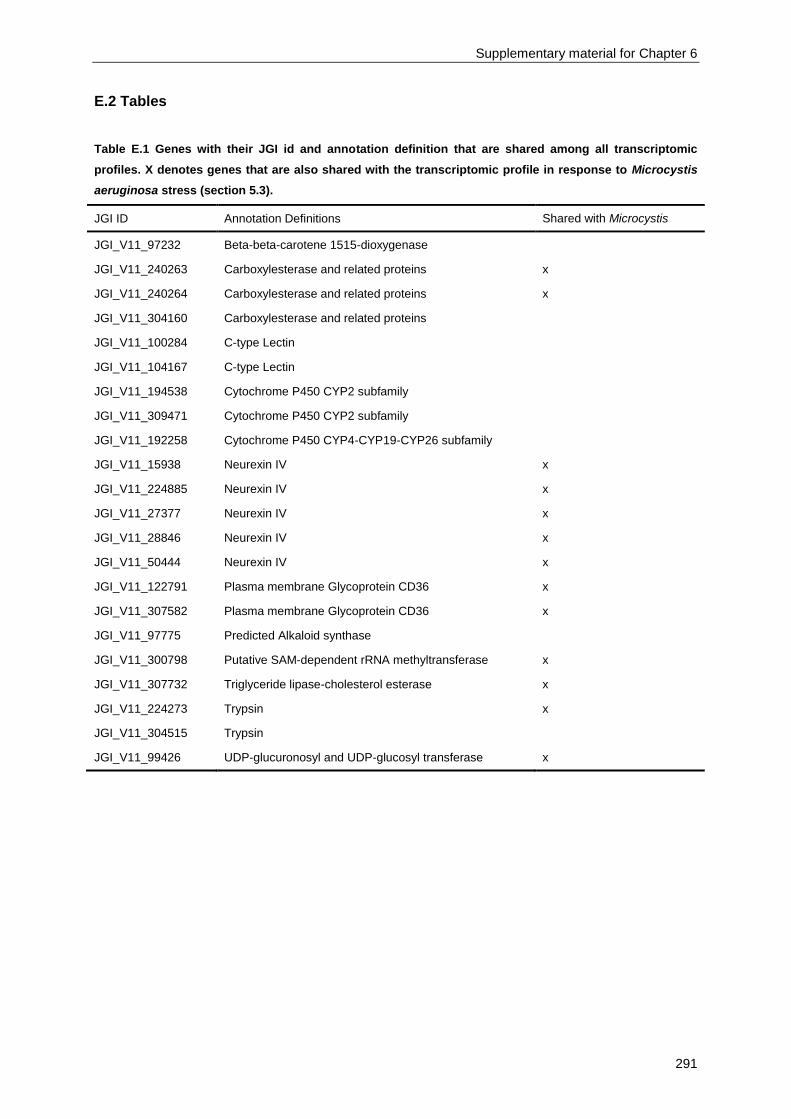
Supplementary material for Chapter 6
291
E.2 Tables
Table E.1 Genes with their JGI id and annotation definition that are shared among all transcriptomic
profiles. X denotes genes that are also shared with the transcriptomic profile in response to Microcystis
aeruginosa stress (section 5.3).
JGI ID Annotation Definitions Shared with Microcystis
JGI_V11_97232 Beta-beta-carotene 1515-dioxygenase
JGI_V11_240263 Carboxylesterase and related proteins x
JGI_V11_240264 Carboxylesterase and related proteins x
JGI_V11_304160 Carboxylesterase and related proteins
JGI_V11_100284 C-type Lectin
JGI_V11_104167 C-type Lectin
JGI_V11_194538 Cytochrome P450 CYP2 subfamily
JGI_V11_309471 Cytochrome P450 CYP2 subfamily
JGI_V11_192258 Cytochrome P450 CYP4-CYP19-CYP26 subfamily
JGI_V11_15938 Neurexin IV x
JGI_V11_224885 Neurexin IV x
JGI_V11_27377 Neurexin IV x
JGI_V11_28846 Neurexin IV x
JGI_V11_50444 Neurexin IV x
JGI_V11_122791 Plasma membrane Glycoprotein CD36 x
JGI_V11_307582 Plasma membrane Glycoprotein CD36 x
JGI_V11_97775 Predicted Alkaloid synthase
JGI_V11_300798 Putative SAM-dependent rRNA methyltransferase x
JGI_V11_307732 Triglyceride lipase-cholesterol esterase x
JGI_V11_224273 Trypsin x
JGI_V11_304515 Trypsin
JGI_V11_99426 UDP-glucuronosyl and UDP-glucosyl transferase x

Appendix E
292
Table E.2 Number of significant genes for each transcriptomic profile for each functional annotation.
APH= Aphanizomenon, ANA=Anabaena¸CYL=Cylindrospermopsis, NOD=Nodularia, OSL=Oscillatoria.
Annotation Definitions APH ANA CYL NOD OSL
Actin and associated proteins 1 9 1 15 1
Acyl-CoA synthetase 1 9 7 17 7
Alkaline phosphatase 1 3 3 4 2
Alpha-amylase 2 5 4 7 4
Anaphase promoting complex 1 3 1 5 1
Ankyrin 1 10 4 11 1
Aromatic-L-amino-acid-L-histidine decarboxylase 1 2 2 2 2
Beta-glucosidase lactase phlorizinhydrolase and related proteins 1 1 1 2 1
Beta beta-carotene 1515-dioxygenase and related enzymes 1 1 1 2 1
C-type lectin 12 11 15 49 7
Carbonic anhydrase 1 3 2 7 2
Carboxylesterase and related proteins 7 16 7 17 8
Chitinase 7 18 9 47 6
Collagens -type IV and type XIII- and related proteins 29 26 11 51 3
Conserved Zn-finger protein 3 3 1 14 1
Cytochrome P450 CYP11-CYP12-CYP24-CYP27 subfamilies 1 1 1 1 1
Cytochrome P450 CYP2 subfamily 4 8 6 8 5
Cytochrome P450 CYP3-CYP5-CYP6-CYP9 subfamilies 1 1 2 5 3
Cytochrome P450 CYP4-CYP19-CYP26 subfamilies 4 3 6 4 5
Fasciclin and related adhesion glycoproteins 1 4 1 10 5
FKBP-type peptidyl-prolyl cis-trans isomerase 1 3 1 3 1
FOG 7 transmembrane receptor 2 41 4 24 1
FOG Immunoglobulin C-2 Type-fibronectin type III domains 4 14 3 10 1
FOG Leucine rich repeat 2 13 6 16 3
FOG Zn-finger 4 27 5 45 1
Fucosyltransferase 3 6 4 30 1
Galactosyltransferases 2 3 2 14 2
Glutamate-gated kainate-type ion channel receptor subunit GluR5 and related subunits 1 5 1 28 1
Glutathione S-transferase 2 5 2 14 4
Heterogeneous nuclear ribonucleoprotein R -RRM superfamily- 1 1 1 1 1
Lipid exporter ABCA1 and related proteins ABC superfamily 3 4 1 3 1
Meprin A metalloprotease 1 1 6 13 4
Monocarboxylate transporter 1 3 1 6 1
Neurexin IV 15 24 23 23 21

Supplementary material for Chapter 6
293
Annotation Definitions (Table E.2 cont.) APH ANA CYL NOD OSL
Permease of the major facilitator superfamily 3 1 2 9 1
Peroxidase-oxygenase 1 12 4 15 4
Phosphatidylinositol transfer protein SEC14 and related proteins 5 6 15 17 3
Plasma membrane glycoprotein CD36 and related membrane receptors 5 3 4 3 2
Predicted alkaloid synthase-Surface mucin Hemomucin 3 1 2 7 2
Predicted E3 ubiquitin ligase 3 12 5 38 1
Predicted lipoprotein 1 2 4 4 1
Predicted membrane protein contains DoH and Cytochrome b-561-ferric reductase transmembrane domains 2 5 8 14 1
Predicted transporter 1 2 1 5 1
Putative SAM-dependent rRNA methyltransferase SPB1 1 1 1 1 1
Renal dipeptidase 3 3 2 3 3
RNA polymerase II 10 20 2 31 1
Serine-threonine protein kinase 2 13 1 21 1
Serine-threonine protein kinase and endoribonuclease ERN1-IRE1 sensor of the unfolded protein response pathway 3 12 2 22 3
Serine proteinase inhibitor -KU family- 2 3 2 8 1
Transcription initiation factor TFIID 1 5 1 12 1
Triglyceride lipase-cholesterol esterase 1 1 2 5 1
Trypsin 24 32 40 108 18
Type I phosphodiesterase-nucleotide pyrophosphatase 1 1 1 1 1
UDP-glucuronosyl and UDP-glucosyl transferase 3 9 12 10 6
von Willebrand factor and related coagulation proteins 4 29 8 48 2
Zinc carboxypeptidase 6 12 6 18 7
Table E.3 List of Gene Ontology terms shared by all transcriptomic profiles
Gene Ontology (GO) Term
GO:0000151/C:ubiquitin ligase complex
GO:0000166/F:nucleotide binding
GO:0001584/F:rhodopsin-like receptor activity
GO:0003676/F:nucleic acid binding
GO:0003677/F:DNA binding
GO:0003700/F:transcription factor activity
GO:0003723/F:RNA binding
GO:0003824/F:catalytic activity
GO:0004089/F:carbonate dehydratase activity
GO:0004180/F:carboxypeptidase activity

Appendix E
294
Gene Ontology (GO) Term (Table E.3 cont.)
GO:0004182/F:carboxypeptidase A activity
GO:0004237/F:membrane dipeptidase activity
GO:0004263/F:chymotrypsin activity
GO:0004289/F:subtilase activity
GO:0004295/F:trypsin activity
GO:0004364/F:glutathione transferase activity
GO:0004386/F:helicase activity
GO:0004497/F:monooxygenase activity
GO:0004553/F:hydrolase activity. hydrolyzing O-glycosyl compounds
GO:0004556/F:alpha-amylase activity
GO:0004601/F:peroxidase activity
GO:0004672/F:protein kinase activity
GO:0004674/F:protein serine/threonine kinase activity
GO:0004713/F:protein-tyrosine kinase activity
GO:0004714/F:transmembrane receptor protein tyrosine kinase activity
GO:0004842/F:ubiquitin-protein ligase activity
GO:0005201/F:extracellular matrix structural constituent
GO:0005215/F:transporter activity
GO:0005319/F:lipid transporter activity
GO:0005506/F:iron ion binding
GO:0005509/F:calcium ion binding
GO:0005515/F:protein binding
GO:0005524/F:ATP binding
GO:0005529/F:sugar binding
GO:0005576/C:extracellular region
GO:0005581/C:collagen
GO:0005622/C:intracellular
GO:0005634/C:nucleus
GO:0005975/P:carbohydrate metabolism
GO:0006030/P:chitin metabolism
GO:0006118/P:electron transport
GO:0006355/P:regulation of transcription. DNA-dependent
GO:0006396/P:RNA processing
GO:0006457/P:protein folding
GO:0006468/P:protein amino acid phosphorylation
GO:0006486/P:protein amino acid glycosylation
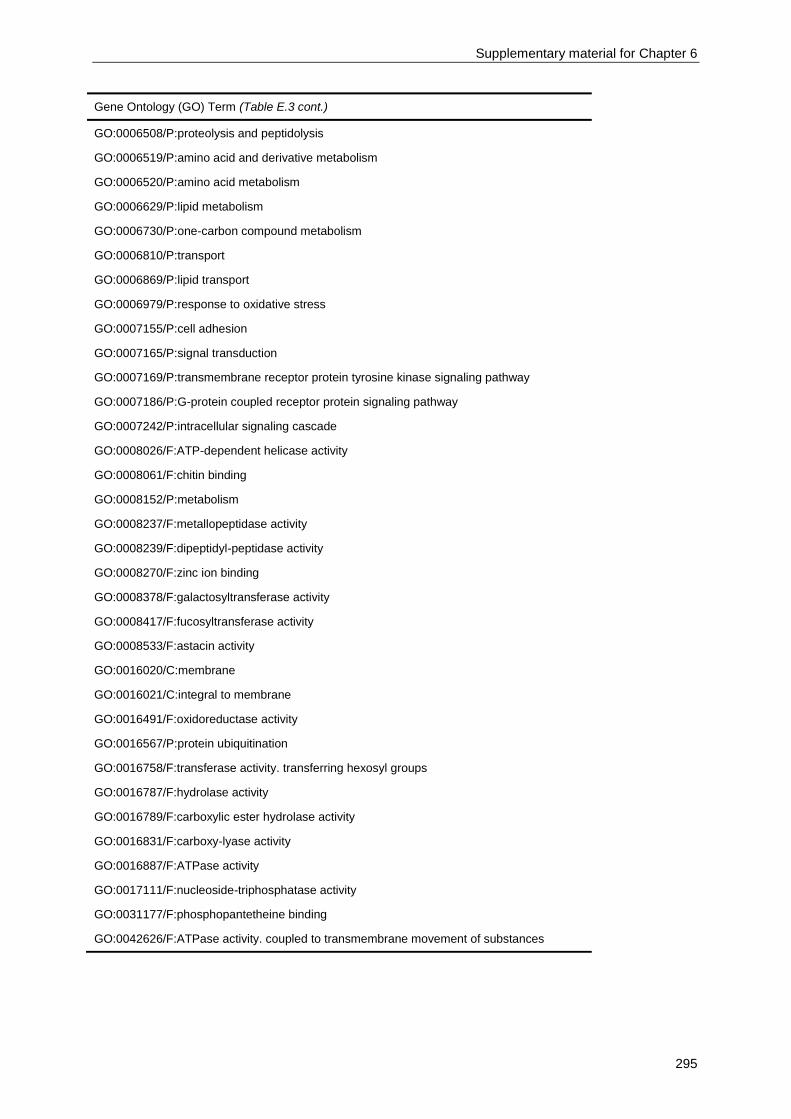
Supplementary material for Chapter 6
295
Gene Ontology (GO) Term (Table E.3 cont.)
GO:0006508/P:proteolysis and peptidolysis
GO:0006519/P:amino acid and derivative metabolism
GO:0006520/P:amino acid metabolism
GO:0006629/P:lipid metabolism
GO:0006730/P:one-carbon compound metabolism
GO:0006810/P:transport
GO:0006869/P:lipid transport
GO:0006979/P:response to oxidative stress
GO:0007155/P:cell adhesion
GO:0007165/P:signal transduction
GO:0007169/P:transmembrane receptor protein tyrosine kinase signaling pathway
GO:0007186/P:G-protein coupled receptor protein signaling pathway
GO:0007242/P:intracellular signaling cascade
GO:0008026/F:ATP-dependent helicase activity
GO:0008061/F:chitin binding
GO:0008152/P:metabolism
GO:0008237/F:metallopeptidase activity
GO:0008239/F:dipeptidyl-peptidase activity
GO:0008270/F:zinc ion binding
GO:0008378/F:galactosyltransferase activity
GO:0008417/F:fucosyltransferase activity
GO:0008533/F:astacin activity
GO:0016020/C:membrane
GO:0016021/C:integral to membrane
GO:0016491/F:oxidoreductase activity
GO:0016567/P:protein ubiquitination
GO:0016758/F:transferase activity. transferring hexosyl groups
GO:0016787/F:hydrolase activity
GO:0016789/F:carboxylic ester hydrolase activity
GO:0016831/F:carboxy-lyase activity
GO:0016887/F:ATPase activity
GO:0017111/F:nucleoside-triphosphatase activity
GO:0031177/F:phosphopantetheine binding
GO:0042626/F:ATPase activity. coupled to transmembrane movement of substances
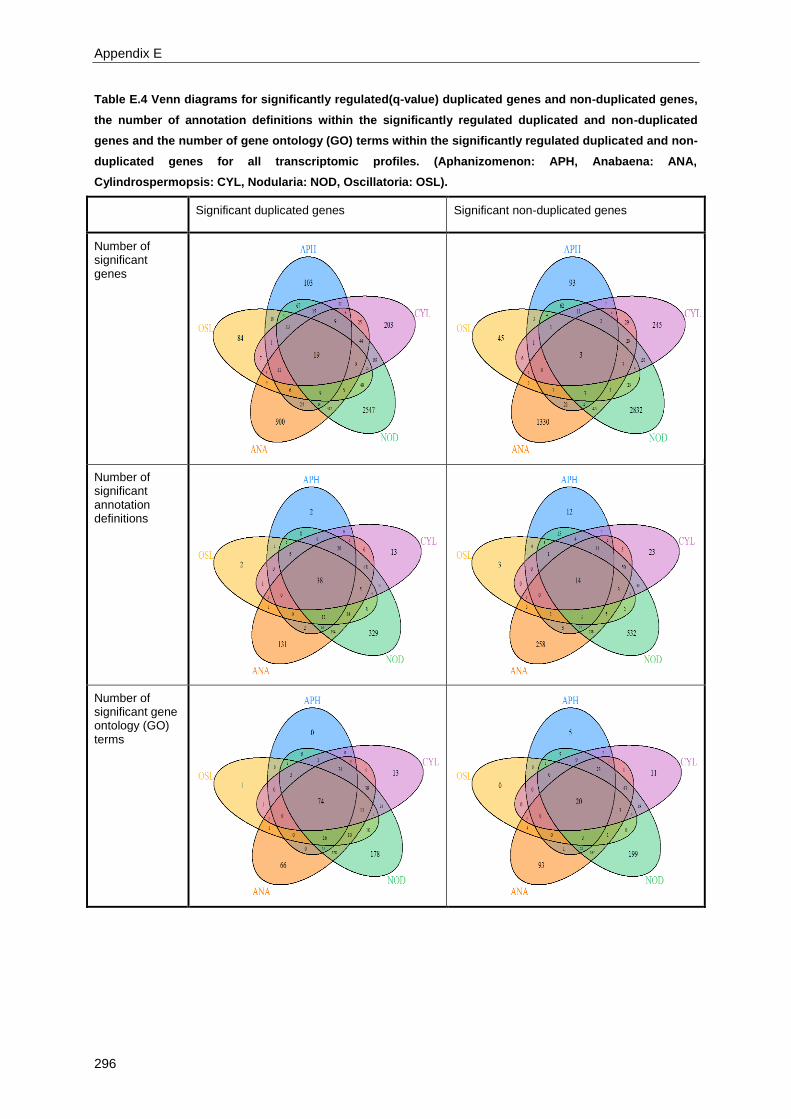
Appendix E
296
Table E.4 Venn diagrams for significantly regulated(q-value) duplicated genes and non-duplicated genes,
the number of annotation definitions within the significantly regulated duplicated and non-duplicated
genes and the number of gene ontology (GO) terms within the significantly regulated duplicated and non-
duplicated genes for all transcriptomic profiles. (Aphanizomenon: APH, Anabaena: ANA,
Cylindrospermopsis: CYL, Nodularia: NOD, Oscillatoria: OSL).
Significant duplicated genes Significant non-duplicated genes
Number of significant genes
Number of significant annotation definitions
Number of significant gene ontology (GO) terms

Supplementary material for Chapter 6
297
Table E.5 Venn diagrams for significantly regulated(q-value) duplicated genes and tandem-duplicated
genes, the number of annotation definitions within the significantly regulated duplicated and tandem-
duplicated genes and the number of gene ontology (GO) terms within the significantly regulated
duplicated and tandem-duplicated genes for all transcriptomic profiles. (Aphanizomenon: APH,
Anabaena: ANA, Cylindrospermopsis: CYL, Nodularia: NOD, Oscillatoria: OSL).
Significant duplicated genes Significant tandem-duplicated genes
Number of significant genes
Number of significant annotation definitions
Number of significant gene ontology (GO) terms
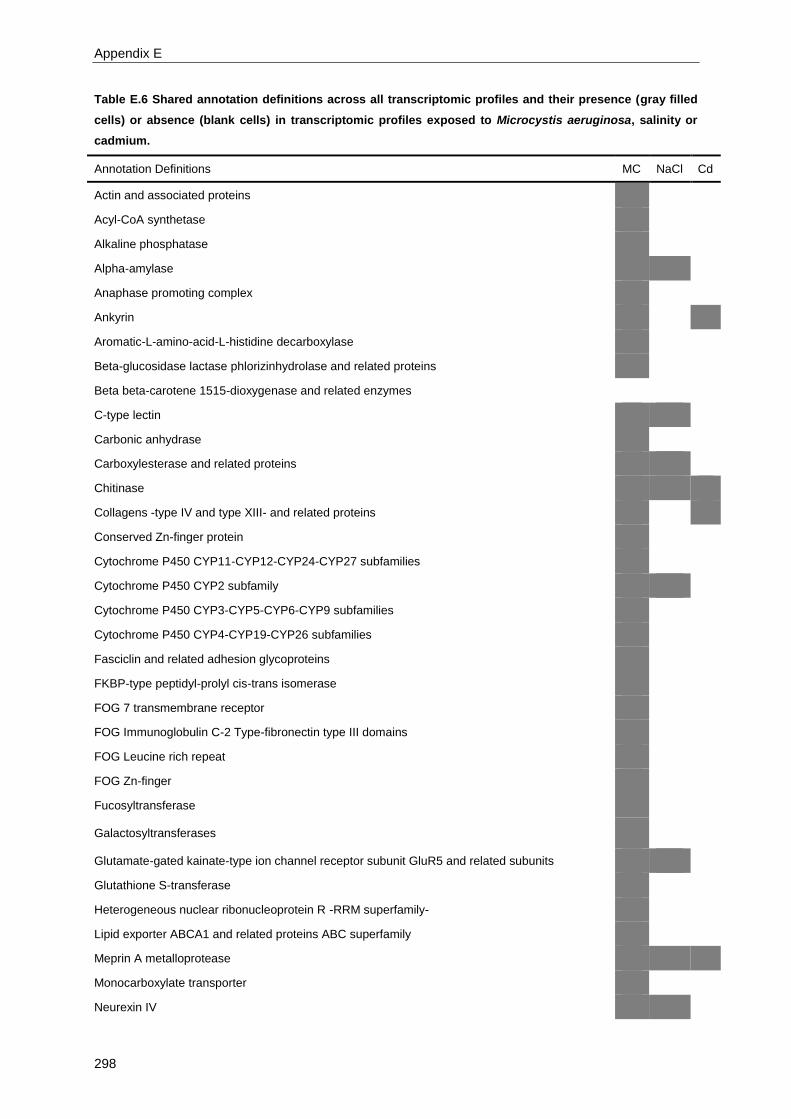
Appendix E
298
Table E.6 Shared annotation definitions across all transcriptomic profiles and their presence (gray filled
cells) or absence (blank cells) in transcriptomic profiles exposed to Microcystis aeruginosa, salinity or
cadmium.
Annotation Definitions MC NaCl Cd
Actin and associated proteins
Acyl-CoA synthetase
Alkaline phosphatase
Alpha-amylase
Anaphase promoting complex
Ankyrin
Aromatic-L-amino-acid-L-histidine decarboxylase
Beta-glucosidase lactase phlorizinhydrolase and related proteins
Beta beta-carotene 1515-dioxygenase and related enzymes
C-type lectin
Carbonic anhydrase
Carboxylesterase and related proteins
Chitinase
Collagens -type IV and type XIII- and related proteins
Conserved Zn-finger protein
Cytochrome P450 CYP11-CYP12-CYP24-CYP27 subfamilies
Cytochrome P450 CYP2 subfamily
Cytochrome P450 CYP3-CYP5-CYP6-CYP9 subfamilies
Cytochrome P450 CYP4-CYP19-CYP26 subfamilies
Fasciclin and related adhesion glycoproteins
FKBP-type peptidyl-prolyl cis-trans isomerase
FOG 7 transmembrane receptor
FOG Immunoglobulin C-2 Type-fibronectin type III domains
FOG Leucine rich repeat
FOG Zn-finger
Fucosyltransferase
Galactosyltransferases
Glutamate-gated kainate-type ion channel receptor subunit GluR5 and related subunits
Glutathione S-transferase
Heterogeneous nuclear ribonucleoprotein R -RRM superfamily-
Lipid exporter ABCA1 and related proteins ABC superfamily
Meprin A metalloprotease
Monocarboxylate transporter
Neurexin IV
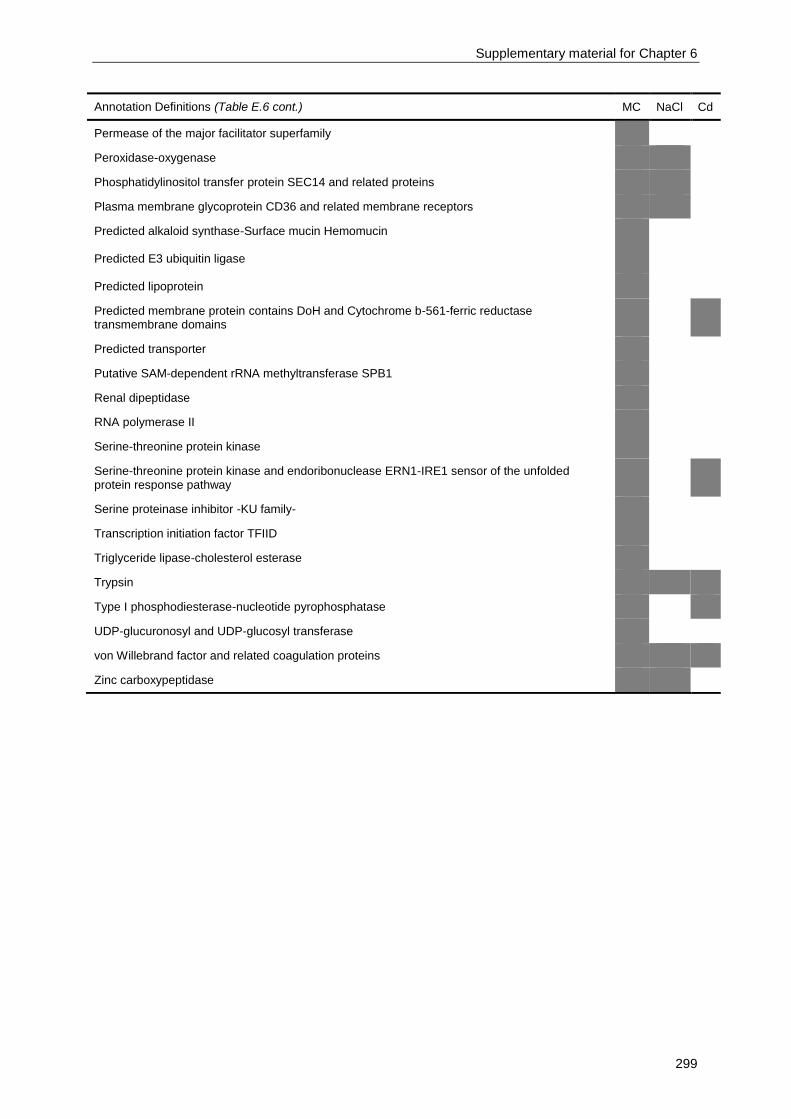
Supplementary material for Chapter 6
299
Annotation Definitions (Table E.6 cont.) MC NaCl Cd
Permease of the major facilitator superfamily
Peroxidase-oxygenase
Phosphatidylinositol transfer protein SEC14 and related proteins
Plasma membrane glycoprotein CD36 and related membrane receptors
Predicted alkaloid synthase-Surface mucin Hemomucin
Predicted E3 ubiquitin ligase
Predicted lipoprotein
Predicted membrane protein contains DoH and Cytochrome b-561-ferric reductase transmembrane domains
Predicted transporter
Putative SAM-dependent rRNA methyltransferase SPB1
Renal dipeptidase
RNA polymerase II
Serine-threonine protein kinase
Serine-threonine protein kinase and endoribonuclease ERN1-IRE1 sensor of the unfolded protein response pathway
Serine proteinase inhibitor -KU family-
Transcription initiation factor TFIID
Triglyceride lipase-cholesterol esterase
Trypsin
Type I phosphodiesterase-nucleotide pyrophosphatase
UDP-glucuronosyl and UDP-glucosyl transferase
von Willebrand factor and related coagulation proteins
Zinc carboxypeptidase


Appendix F
Supplementary material for Chapter 7

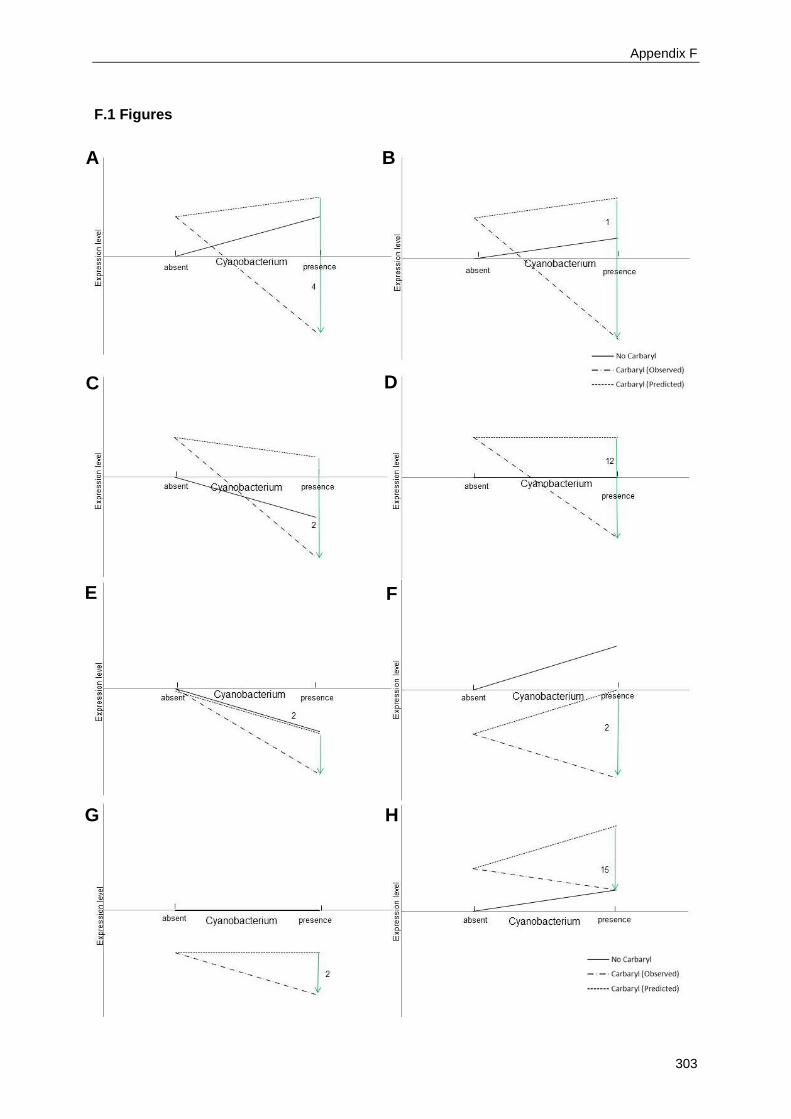
Appendix F
303
F.1 Figures
A B
C D
E F
G H
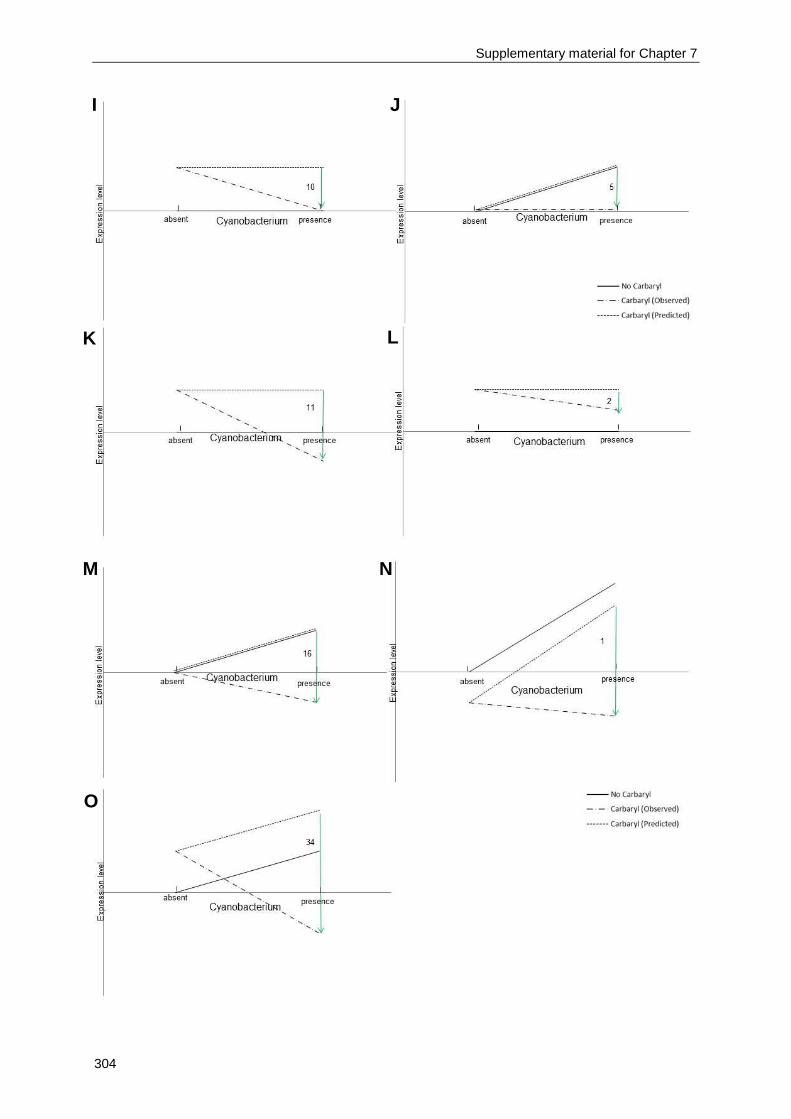
Supplementary material for Chapter 7
304
I J
K L
M N
O

Appendix F
305
Figure F.1 Reaction norms for antagonistic interacting genes upon cyanobacterium exposure (presence
vs. absence) under no carbaryl (solid line), addition of carbaryl (dash-dot line) and predicted addition of
carbaryl (dashed line). Green arrows indicate the difference in expression level between observed and
predicted expression of the interacting genes. Horizontal axis intersects vertical axis at no differential
expression. Numbers indicate the number of genes showing the particular expression pattern.
A B
C D
E F

Supplementary material for Chapter 7
306
Figure F.2 Reaction norms for synergistic interacting genes upon cyanobacterium exposure (presence
vs. absence) under no carbaryl (solid line), addition of carbaryl (dash-dot line) and predicted addition of
carbaryl (dashed line). Red arrows indicate the difference in expression level between observed and
predicted expression of the interacting genes. Horizontal axis intersects vertical axis at no differential
expression. Numbers indicate the number of genes showing the particular expression pattern.
G H
I

Appendix F
307
F.2 Tables
Table F.1 Results of the two-way analysis on log transformed total reproduction. For each effect, the
number of genes with a Benjamini-Hochberg corrected p-value smaller than 0.05 for the interaction effect
are represented.
Anabaena Aphanizomenon Cylindrospermopsis Microcystis Nodularia Oscillatoria
Acetamiprid 16 0 558 676 5 1825
Carbaryl 6786 188 978 12 0 15
Chlorpyrifos 3786 24 5 0 0 0
Deltamethrin 0 647 115 0 0 0
Endosulfan 0 14 261 0 4789 53
Fenoxycarb 4 0 59 4 2369 1067
Tebufenpyrad 107 1 55 0 2971 70
Tetradifon 5 17 153 2417 9 514
Table F.2 Results of the two-way analysis on log transformed total reproduction. For each effect, the
number of genes with p-value smaller than 0.05 for the interaction effect and with no overlap between the
95% confidence intervals of observed M-value and of the predicted M-value are represented.
Anabaena Aphanizomenon Cylindrospermopsis Microcystis Nodularia Oscillatoria
Acetamiprid 7 0 26 13 3 52
Carbaryl 48 19 35 2 2 24
Chlorpyrifos 22 6 6 2 0 14
Deltamethrin 0 13 11 1 0 7
Endosulfan 0 9 31 2 35 18
Fenoxycarb 3 2 12 9 14 157
Tebufenpyrad 14 7 18 0 12 17
Tetradifon 4 17 14 35 8 52
Table F.3 Results of the two-way analysis on log transformed total reproduction. For each effect, the
number of genes with p-value smaller than 0.05 for the interaction effect and with no overlap between the
90% confidence intervals of observed M-value and of the predicted M-value are represented.
Anabaena Aphanizomenon Cylindrospermopsis Microcystis Nodularia Oscillatoria
Acetamiprid 16 6 74 59 13 152
Carbaryl 286 43 130 6 10 56
Chlorpyrifos 77 16 24 8 0 38
Deltamethrin 3 67 32 7 6 31
Endosulfan 3 17 59 11 111 36
Fenoxycarb 6 3 31 38 67 327
Tebufenpyrad 43 16 42 5 39 90
Tetradifon 9 43 35 192 19 112

Supplementary material for Chapter 7
308
Table F.4 Results of the two-way analysis on log transformed total reproduction. For each effect, the
number of genes with p-value smaller than 0.05 for the interaction effect and with an absolute M-value
larger than 1 are represented.
Anabaena Aphanizomenon Cylindrospermopsis Microcystis Nodularia Oscillatoria
Acetamiprid 291 119 731 830 506 1110
Carbaryl 5253 305 804 348 563 229
Chlorpyrifos 2022 232 445 158 486 250
Deltamethrin 890 524 756 341 152 211
Endosulfan 287 171 510 405 1987 190
Fenoxycarb 274 100 462 772 1732 861
Tebufenpyrad 438 114 421 160 2560 550
Tetradifon 552 737 536 2765 458 392
Table F.5 Results of the two-way analysis on log transformed total reproduction. For each effect, the
number of genes with p-value smaller than 0.05 for the interaction effect and with an absolute M-value
larger than 2 are represented.
Anabaena Aphanizomenon Cylindrospermopsis Microcystis Nodularia Oscillatoria
Acetamiprid 19 7 33 21 26 45
Carbaryl 329 18 72 6 12 27
Chlorpyrifos 55 11 7 7 12 18
Deltamethrin 13 16 38 8 3 7
Endosulfan 10 24 55 4 145 25
Fenoxycarb 9 0 37 25 82 112
Tebufenpyrad 29 11 36 1 248 20
Tetradifon 30 24 37 70 18 36
Table F.6 Results of the two-way analysis on log transformed total reproduction. For each effect, the
number of genes with p-value smaller than 0.05 for the interaction effect and with an absolute M-value
larger than 3 are represented.
Anabaena Aphanizomenon Cylindrospermopsis Microcystis Nodularia Oscillatoria
Acetamiprid 2 0 4 2 0 6
Carbaryl 3 3 4 0 3 1
Chlorpyrifos 5 3 0 0 0 1
Deltamethrin 0 0 2 1 0 2
Endosulfan 3 1 9 0 6 5
Fenoxycarb 1 0 5 3 4 10
Tebufenpyrad 2 0 7 0 20 4
Tetradifon 1 3 3 1 1 4

Appendix F
309
Table F.7 Deviation from non-interaction as defined by equation 7.3, i.e. log of the number of antagonistic
genes divided by the number of synergistic genes. Significance at the gene level was determined by the
p-value, i.e. smaller than 0.05 for the interaction effect, and no overlap between the 95% confidence
intervals of observed and predicted M-values.
Anabaena Aphanizomenon Cylindrospermopsis Microcystis Nodularia Oscillatoria
Acetamiprid 1.32 0 0.68 0.68 1.58 -0.33
Carbaryl -3.91 -0.15 0.25 0 1 4.58
Chlorpyrifos 3.32 -2.32 1.58 0 0 3.81
Deltamethrin 0 1.74 -0.26 0 0 -2.81
Endosulfan 0 1 4.95 0 0.76 -1.81
Fenoxycarb 1.58 0 0.26 3 0.85 -5.26
Tebufenpyrad -1.87 0.42 4.09 0 3.46 0.54
Tetradifon 0 1.7 2.58 -0.94 0.74 5.67
Table F.8 Deviation from non-interaction as defined by equation 7.4, i.e. sum of the M-values of the
significant genes deviaiting from non-interaction. Significance at the gene level was determined by the p-
value, i.e. smaller than 0.05 for the interaction effect, and no overlap between the 95% confidence
intervals of observed and predicted M-values.
Anabaena Aphanizomenon Cylindrospermopsis Microcystis Nodularia Oscillatoria
Acetamiprid -10.6 0 -28.2 -10.6 -7.17 9.21
Carbaryl 99.4 -1.23 -16.8 0.07 -5.45 -57.4
Chlorpyrifos -52.7 8.57 -1.10 0.71 0 -35.0
Deltamethrin 0 -16.9 1.84 -3.29 0 17.5
Endosulfan 0 -9.61 -91.2 -0.68 -32.4 21.6
Fenoxycarb -8.12 3.83 -4.45 -19.1 -14.5 302
Tebufenpyrad 14.8 -1.90 -45.9 0 -32.9 -7.53
Tetradifon -0.05 -26.7 -28.2 23.9 -7.59 -115
Table F.9 Deviation from non-interaction as defined by equation 7.3, i.e. log of the number of antagonistic
genes divided by the number of synergistic genes. Significance at the gene level was determined by the
p-value, i.e. smaller than 0.05 for the interaction effect, and no overlap between the 90% confidence
intervals of observed and predicted M-values.
Anabaena Aphanizomenon Cylindrospermopsis Microcystis Nodularia Oscillatoria
Acetamiprid 0 0 0.08 1.07 3.7 0.19
Carbaryl -3.2 0.07 1.28 2.32 3 5.67
Chlorpyrifos 0.11 -2.81 3.32 -0.74 0 4.39
Deltamethrin 0 1.56 -0.55 2.32 0 -4.52
Endosulfan 0 0.17 5.88 -0.26 0.34 -1
Fenoxycarb 2 0 0.66 1.69 -0.13 -3.11
Tebufenpyrad -2.62 0.74 5.25 0 1.54 -0.32
Tetradifon 1.81 -1.05 2.58 -1.03 -0.46 6.77

Supplementary material for Chapter 7
310
Table F.10 Deviation from non-interaction as defined by equation 7.4, i.e. sum of the M-values of the
significant genes deviaiting from non-interaction. Significance at the gene level was determined by the p-
value, i.e. smaller than 0.05 for the interaction effect, and no overlap between the 90% confidence
intervals of observed and predicted M-values.
Anabaena Aphanizomenon Cylindrospermopsis Microcystis Nodularia Oscillatoria
Acetamiprid -4.46 -12.9 -30.6 -45.5 -28.5 -26.1
Carbaryl 483 -6.63 -125 -8.30 -13.9 -95.8
Chlorpyrifos -26.5 22.2 1.99 5.49 0 -17.0
Deltamethrin -2.58 -57.5 10.0 -8.27 12.3 30.1
Endosulfan -3.90 -7.91 -150 0.19 -58.8 20.2
Fenoxycarb -5.53 1.83 -17.3 -46.9 -11.4 478
Tebufenpyrad 59.9 -8.73 -87.3 4.79 -66.0 15.8
Tetradifon -12.1 18.4 -60.4 126 3.28 -207
Table F.11 Deviation from non-interaction as defined by equation 7.3, i.e. log of the number of
antagonistic genes divided by the number of synergistic genes. Significance at the gene level was
determined by the p-value, i.e. smaller than 0.05 for the interaction effect, and the absolute M-value, i.e
larger than 2.
Anabaena Aphanizomenon Cylindrospermopsis Microcystis Nodularia Oscillatoria
Acetamiprid 0.15 2.81 2.49 1.68 4.7 0.32
Carbaryl -1.22 0.32 2.81 2.32 3.58 4.7
Chlorpyrifos 1.04 -0.26 2.81 -1.32 3.46 2.32
Deltamethrin 0.22 0.36 1.12 0.74 -1.58 -2.58
Endosulfan 0 1 5.78 0 2.91 0.12
Fenoxycarb -1 0 0.88 2.87 3.42 -5.78
Tebufenpyrad -2.64 0.81 5.17 0 5.6 -0.58
Tetradifon 3.81 0.24 2.37 -1.22 0.32 5.17
Table F.12 Deviation from non-interaction as defined by equation 7.4, i.e. sum of the M-values of the
significant genes deviaiting from non-interaction. Significance at the gene level was determined by the p-
value, i.e. smaller than 0.05 for the interaction effect, and the absolute M-value, i.e larger than 2.
Anabaena Aphanizomenon Cylindrospermopsis Microcystis Nodularia Oscillatoria
Acetamiprid -3.74 -16.9 -63.2 -28.5 -59.9 -13.4
Carbaryl 283 -8.79 -129 -9.11 -29.6 -60.8
Chlorpyrifos -56.9 1.58 -15.6 6.97 -22.7 -29.8
Deltamethrin -3.18 -4.59 -32.2 -6.11 6.89 13.9
Endosulfan -2.19 -22.0 -144 -0.64 -269 -4.70
Fenoxycarb 6.71 0 -25.8 -44.0 -162 265
Tebufenpyrad 45.7 -7.13 -92.9 2.03 -578 11.3
Tetradifon -58.8 -10.8 -61.8 59.8 -7.67 -90.9

Appendix F
311
Table F13 Genes represented by their JGI id and the number of combinations in which each gene was
determinedinteracting, for genes with a frequence higher than 4.
Gene ID Frequence
JGI_V11_104169 10
JGI_V11_108530 7
JGI_V11_16207 7
JGI_V11_236269 5
JGI_V11_263306 5
JGI_V11_274020 7
JGI_V11_308504 13
JGI_V11_313056 5
JGI_V11_314387 5
JGI_V11_320123 7
JGI_V11_328955 5
JGI_V11_43964 5
JGI_V11_97780 6
JGI_V11_104169 10
JGI_V11_108530 7
JGI_V11_16207 7
JGI_V11_236269 5
JGI_V11_263306 5
JGI_V11_274020 7
JGI_V11_308504 13
JGI_V11_313056 5

Supplementary material for Chapter 7
312
Table F14 Gene IDs of the genes that demonstrated both antagonistic and synergistic interaction in
different combinations as well as the number of times a gene was defined as antagonistic or synergistic.
Gene ID Antagonistic Synergistic
JGI_V11_103668 1 1
JGI_V11_106059 1 3
JGI_V11_114507 1 1
JGI_V11_17148 1 1
JGI_V11_204027 1 2
JGI_V11_231626 1 1
JGI_V11_236269 1 4
JGI_V11_241311 1 1
JGI_V11_242681 1 1
JGI_V11_251597 1 1
JGI_V11_263306 3 2
JGI_V11_300401 2 1
JGI_V11_301410 1 1
JGI_V11_301602 3 2
JGI_V11_30204 1 1
JGI_V11_303449 1 1
JGI_V11_304104 3 1
JGI_V11_304311 1 1
JGI_V11_306630 1 1
JGI_V11_306763 2 1
JGI_V11_308504 12 1
JGI_V11_308817 1 1
JGI_V11_310452 1 1
JGI_V11_313112 2 1
JGI_V11_315160 1 1
JGI_V11_315713 1 2
JGI_V11_317504 3 1
JGI_V11_318090 1 1
JGI_V11_325284 1 1
JGI_V11_326128 2 1
JGI_V11_327371 1 1
JGI_V11_328069 1 1
JGI_V11_328955 1 4
JGI_V11_336639 1 2
JGI_V11_43964 1 4
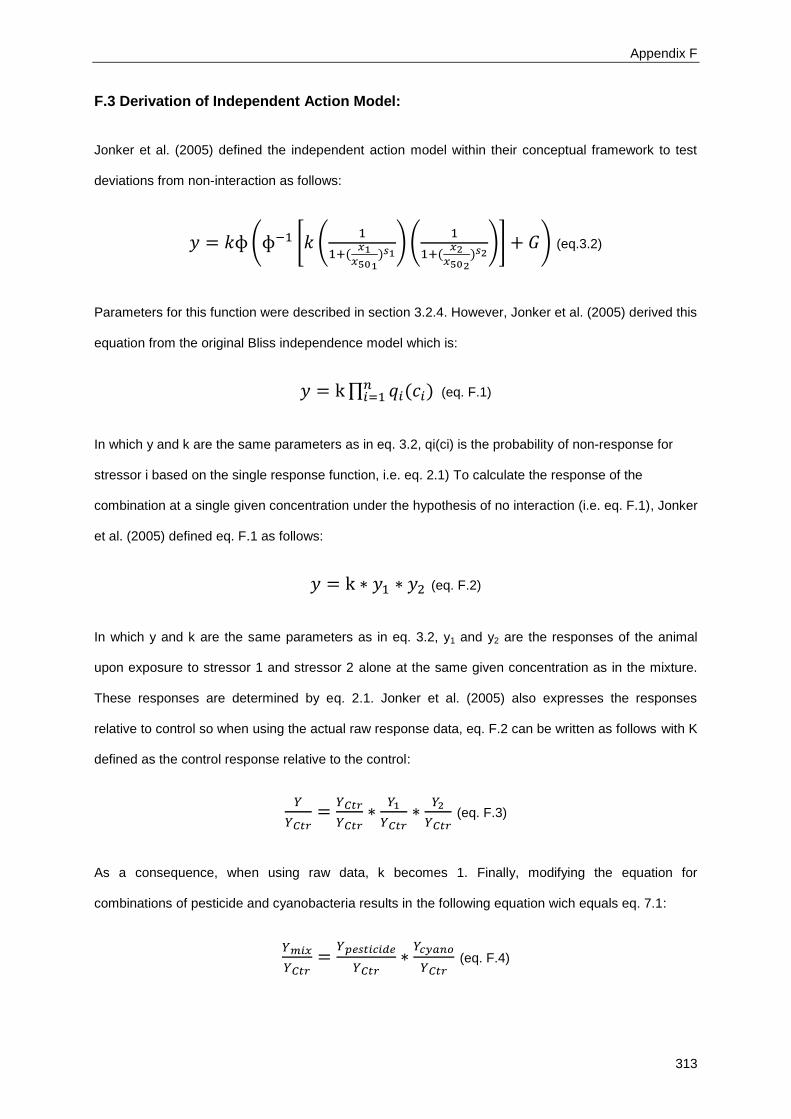
Appendix F
313
F.3 Derivation of Independent Action Model:
Jonker et al. (2005) defined the independent action model within their conceptual framework to test
deviations from non-interaction as follows:
( [ (
(
) )(
(
) )] ) (eq.3.2)
Parameters for this function were described in section 3.2.4. However, Jonker et al. (2005) derived this
equation from the original Bliss independence model which is:
∏ ( ) (eq. F.1)
In which y and k are the same parameters as in eq. 3.2, qi(ci) is the probability of non-response for
stressor i based on the single response function, i.e. eq. 2.1) To calculate the response of the
combination at a single given concentration under the hypothesis of no interaction (i.e. eq. F.1), Jonker
et al. (2005) defined eq. F.1 as follows:
(eq. F.2)
In which y and k are the same parameters as in eq. 3.2, y1 and y2 are the responses of the animal
upon exposure to stressor 1 and stressor 2 alone at the same given concentration as in the mixture.
These responses are determined by eq. 2.1. Jonker et al. (2005) also expresses the responses
relative to control so when using the actual raw response data, eq. F.2 can be written as follows with K
defined as the control response relative to the control:
(eq. F.3)
As a consequence, when using raw data, k becomes 1. Finally, modifying the equation for
combinations of pesticide and cyanobacteria results in the following equation wich equals eq. 7.1:
(eq. F.4)