Embed Size (px)
Citation preview

Nearshore mixing and nutrient delivery along the westernAntarctic Peninsula
D. REIDE CORBETT1,2, JARED CRENSHAW1, KIMBERLY NULL1,3, RICHARD N. PETERSON4,LEIGHA E. PETERSON4 and W. BERRY LYONS5
1East Carolina University, Greenville, NC 27858, USA2University of North Carolina Coastal Studies Institute, Wanchese, NC 27981, USA
3Current address: Moss Landing Marine Laboratories, Moss Landing, CA 95039, USA4Department of Coastal and Marine Systems Science, Coastal Carolina University, Conway, SC 29526, USA
5School of Earth Sciences and Byrd Polar and Climate Research Center, Ohio State University, Columbus, OH 43210, [email protected]
Abstract:The surfacewaters of the SouthernOcean play a key role in the global climate and carbon cycles bypromoting growth of some of the world’s largest phytoplankton blooms. Several studies have emphasized theimportance of glacial and sediment inputs of Fe that fuel the primary production of the Fe-limited SouthernOcean. Although the fertile surface waters along the shelf of the western Antarctic Peninsula (WAP) areinfluenced by large inputs of freshwater, this freshwater may take multiple pathways (e.g. calving, streams,groundwater discharge) with different degrees of water-rock interactions leading to variable Fe flux to coastalwaters. During the summers of 2012–13 and 2013–14, seawater samples were collected along theWAP, nearAnvers Island, to observe water column dynamics in nearshore and offshore waters. Tracers (223,224Ra,222Rn, 18O, 2H) were used to evaluate the source and transport of water and nutrients in coastal fjords andacross the shelf. Coastal waters are compared across two field seasons, with increased freshwater observedduring 2014. Horizontal mixing rates of water masses along the WAP ranged from 110–3600m2 s-1. Thesemixing rates suggest a rapid transport mechanism for moving meltwater offshore.
Received 4 April 2016, accepted 24 February 2017, first published online 10 May 2017
Key words: horizontal eddy diffusivity, land–ocean interface, meltwater, radium isotopes
Introduction
Over the past one hundred years, average globaltemperatures have been increasing. The most drasticwarming has taken place in climate-sensitive regions athigh latitudes, including the western Antarctic Peninsula(WAP; Schofield et al. 2010; Fig. 1) where annual meanatmospheric temperatures have increased by ~ 3°C over thepast 60 years (King 1994, Turner et al. 2005). Due to recentwarming, glaciers between 64°S and 66°S are currentlyreceding at an average rate of ~ 57±25m y-1 (Cook et al.2005). Warming air temperatures have been concurrentwith sea ice reduction, with many glaciers having near-frontal surface lowering of 0.28±0.03m y-1 over the past40 years (Kunz et al. 2012). This in turn has increasedglacial melt inputs that have the potential to impact salinityand temperature dynamics in surface waters along theshoreline (Ducklow et al. 2012). The input of glacial meltcan also lead to increases in many biogeochemicallyimportant elements (e.g. N, P, C, Si, Fe) into the coastalocean (Wadham et al. 2013). Surface waters of theSouthern Ocean play a key role in global climate and
carbon cycles by hosting some of the world’s largestphytoplankton blooms, which sequester up to one billionmetric tons of CO2 per year (Takahashi et al. 2012).
Continentally derived freshwater inputs often entercoastal waters during meltwater pulses along the WAP.This meltwater can enter the nearshore coastal zone throughcalving, periglacial stream flow, basal melt and subglacialmelt, which passes over or through sediments or othergeologic material before reaching the ocean. These pulsescreate large freshwater lenses that can extend as deep as50m into the water column, and as far as 100km offshore(Dierssen et al. 2002).Meltwater pulses have the potential todevelop density gradients that can drive surface currents,resulting in the lateral transport of continentally derivednutrients and micronutrients (e.g. Fe) offshore (Dierssenet al. 2002, Moffat et al. 2008). Dierssen et al. (2002) foundthat > 70% of phytoplankton blooms observed offshore ofAnvers Island occurred shortly after pulses of meltwaterdischarged from local glaciers into the surface ocean.
Recent studies (Bhatia et al. 2013, Hawkings et al. 2014,Lyons et al. 2015) have emphasized the potential importanceof direct and indirect glacial inputs to Fe budgets in polar
Antarctic Science 29(5), 397–409 (2017) © Antarctic Science Ltd 2017. This is anOpen Access article, distributed under the terms of the Creative Commons Attribution licence(http://creativecommons.org/licenses/by/4.0/), which permits unrestricted re-use, distribution,and reproduction in any medium, provided the original work is properly cited. doi:10.1017/S095410201700013X
397
https://doi.org/10.1017/S095410201700013XDownloaded from https://www.cambridge.org/core, IP address: 65.21.228.167, on subject to the Cambridge Core terms of use, available at https://www.cambridge.org/core/terms.

regions, and how these inputs may fuel primary productivityin Fe-limited environments such as the Southern Ocean(Takahashi et al. 2012). Fertile surface waters along the shelfof the WAP are influenced by large inputs of glacial meltfrom the peninsula (Dierssen et al. 2002). The objective ofthis study was to evaluate the transport of nutrient-richmeltwaters from the Antarctic continent into the biologicallyproductive coastal waters along the WAP utilizing a suite ofnaturally occurring stable- and radioisotopes as tracers ofterrestrially derived water masses.
Study area
The WAP extends northward from the western Antarcticcontinent. This region is the warmest in the Antarctic andone of the most rapidly warming regions in the world
(Vaughan et al. 2003, Steig et al. 2009). The ruggedtopography and warmer maritime climate of the peninsuladifferentiates the WAP from other regions of the continent.Air temperatures along the western coast of the WAP aredominated by the influence of the Bellingshausen Sea,causing air temperatures to be ~ 7°C warmer than theeastern coast of the peninsula, which is influenced by thecooler Weddell Sea (Morris & Vaughan 2003). This regionhas seen an increase in July (i.e. midwinter) temperaturesof 7.2°C from 1951–2008 (0.124±0.044°Cyr-1; Ducklowet al. 2012).
The continental shelf of the WAP is ~ 200km wide nearAnvers Island and has an average depth of ~ 450m. Theaforementioned depth excludes many of the deep canyonsthat incise the continental shelf, such as the PalmerDeep that reaches a maximum depth of ~ 1500m. Several
Fig. 1. Sample collection sites and transects (dashed line) during the 2012 (blue squares; T1, 2, 3) and 2014 (red circles; T4, 5, 6)cruises offshore of the western Antarctic Peninsula. Dotted line represents the delineation of nearshore versus offshore samples.Box encompassing sites within Flandres Bay and the T2,T5 line were used to produce the density cross-section (see Fig. 4).Yellow triangle denotes the approximate location of Palmer Station.
398 D. REIDE CORBETT et al.
https://doi.org/10.1017/S095410201700013XDownloaded from https://www.cambridge.org/core, IP address: 65.21.228.167, on subject to the Cambridge Core terms of use, available at https://www.cambridge.org/core/terms.
glacially carved fjords line the coast of the WAP and werealso sampled as part of this research. Flandres Bay isprotected from the open ocean by Anvers Island andseveral smaller islands. The 16km wide fjord is flanked bymountains on both sides and reaches depths> 600m. Themouth of Flandres Bay opens to the Gerlache Strait.Barilari Bay and Beascochea Bay are both similarlyflanked by rugged mountains, and open to the GrandidierChannel (Fig. 1).
Surface water characteristics along the WAP varywidely on a seasonal basis. During the summer, AntarcticSurface Water (AASW) found above the permanentthermocline (~ 150m), ranges in temperature from-1.5–1.0°C and in salinity from 33.0–33.7 (Klinck et al.2004). During the winter, a relatively cooler and saltierwater mass develops near the surface (Winter Water),generally cooler than -1.8°C with a salinity of ~ 34.1(Klinck et al. 2004). Subpycnocline waters are classified asCircumpolar Deep Water (CDW), subdivided into upperCDW and lower CDW. CDW ranges in temperature
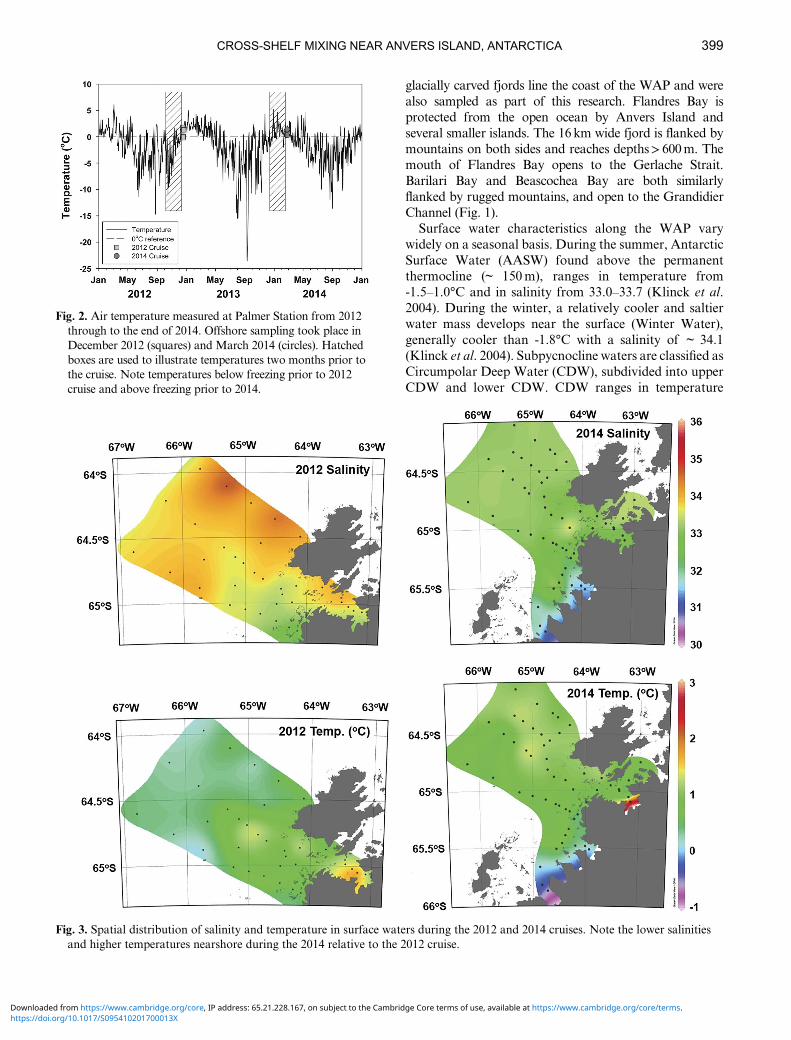
Fig. 3. Spatial distribution of salinity and temperature in surface waters during the 2012 and 2014 cruises. Note the lower salinitiesand higher temperatures nearshore during the 2014 relative to the 2012 cruise.
Fig. 2. Air temperature measured at Palmer Station from 2012through to the end of 2014. Offshore sampling took place inDecember 2012 (squares) and March 2014 (circles). Hatchedboxes are used to illustrate temperatures two months prior tothe cruise. Note temperatures below freezing prior to 2012cruise and above freezing prior to 2014.
CROSS-SHELF MIXING NEAR ANVERS ISLAND, ANTARCTICA 399
https://doi.org/10.1017/S095410201700013XDownloaded from https://www.cambridge.org/core, IP address: 65.21.228.167, on subject to the Cambridge Core terms of use, available at https://www.cambridge.org/core/terms.
from 1.0–2.0°C and has salinities of 34.6–34.7. UpperCDW has frequent incursions into coastal waters alongthe continental shelf, mixing with surface waters (Klincket al. 2004, Meredith et al. 2013).
Cyclonic circulation patterns along the WAP wereidentified in early oceanographic studies, and furtherdescribed by Savidge & Amft (2009). Long-term in situmeasurements along the peninsula suggest that a cycloniccell rotates around Anvers Island. Surface watersoffshore of Anvers Island flow south and form part of theAntarctic PeninsulaCoastal Current (APCC), an along-shore
surface current that occurs on the west coast of thepeninsula during the summer months (Moffat et al. 2008).The development of the APCC is thought to be initiated bymeltwater inputs along the peninsula, although the originof these waters is poorly understood. The APCC has beenobserved as far north as Brabant and Anvers islands(Savidge & Amft 2009) and flows southward, eventuallymaking its way into Marguerite Bay and farther south(Moffat et al. 2008). In the Gerlache Strait, surface currentshave been observed moving north toward the BransfieldStrait (Savidge & Amft 2009).
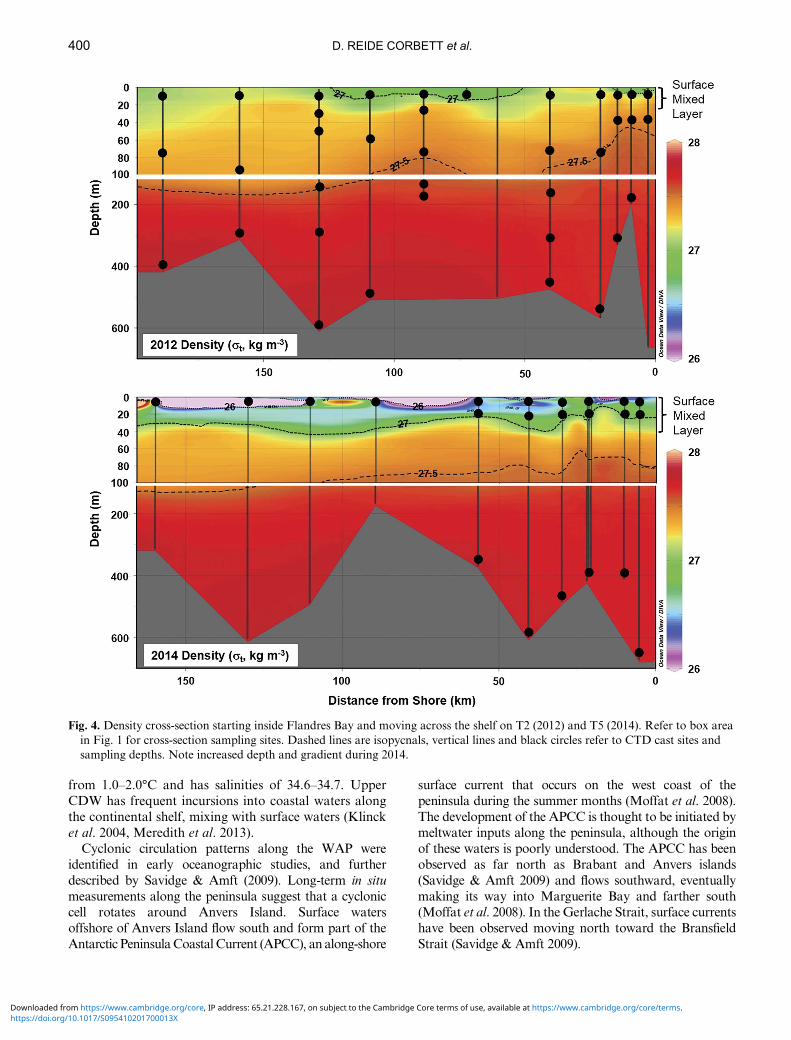
Fig. 4. Density cross-section starting inside Flandres Bay and moving across the shelf on T2 (2012) and T5 (2014). Refer to box areain Fig. 1 for cross-section sampling sites. Dashed lines are isopycnals, vertical lines and black circles refer to CTD cast sites andsampling depths. Note increased depth and gradient during 2014.
400 D. REIDE CORBETT et al.
https://doi.org/10.1017/S095410201700013XDownloaded from https://www.cambridge.org/core, IP address: 65.21.228.167, on subject to the Cambridge Core terms of use, available at https://www.cambridge.org/core/terms.
Methods
Sample collection
During the summers of 2012–13 and 2013–14 (14–19December 2012 and 19–24 February 2014, respectively;Fig. 2), large volume seawater samples (280–360 l) werecollected along the WAP aboard the RV Laurence M.Gould to observe water column and tracer dynamicsin nearshore and offshore environments (Fig. 1).Groundwater and surface runoff from glacial melt (e.g.streams) samples (20–150 l) were collected while at PalmerStation following similar shipboard measurements. Duringeach field season, offshore and nearshore seawater wascollected from one to three depths (surface, mid-depth andbottom) along three transects (2012: T1, T2, T3; 2014: T4,T5, T6) and within glacial fjords. Due to limited ship timein 2014, sample collection was focused on surface watercollection. Surface water samples were collected in theupper 10m of the water column. Mid-depth and bottomwater samples were collected just above the pycnocline(30–60m) and ~ 10m above the bottom, respectively.
Groundwaters were collected using a custom drive-pointpiezometer lined with Teflon tubing. Surface runoff wascollected from several different streams via a peristalticpump near Palmer Station prior to discharge into surfacewaters. Samples were analysed for a suite of parameters,including radium isotopes (223,224Ra), 222Rn, δ18O and δD,and nutrient and trace metal concentrations (NO3
-+NO2-,
NH4+, HPO4
2-, H4SiO4, total dissolved Fe).At each nearshore and offshore site, the CTD-rosette
(Seabird SBE911) was lowered multiple times from theship to within a few metres of the sea floor. Temperature(SBE3), salinity (SBE4), density, beam transmission(Wet Labs C-Star), oxygen (SBE43) and fluorescence(Wet Labs ECO) were recorded. Along the cruise trackduring each field season, a hull mounted acoustic dopplercurrent profiler (ADCP) was used to measure currentvelocities throughout the water column.
Radium isotopes
Radium was quantitatively concentrated from watersamples by gravity filtering (rate of < 1 lmin-1) ontoMnO2-coated acrylic fibre (i.e. Mn fibres). Fibres werethen rinsed with radium-free water, partially dried withcompressed air and immediately analysed for total 223Raand 224Ra using a radium delayed coincidence counter(RaDeCC; Moore & Arnold 1996). At least four weeks(eight half-lives of 224Ra) after this initial count, fibreswere recounted via the RaDeCC for 224Ra supported by228Th sorbed to the fibres. Excess, or unsupported 224Ra(presented herein), is taken as the difference between theinitial count (total) and the second measurement(supported). 223Ra is presented as total, not correctedfor 227Ac (negligible in most instances). Detectorefficiencies and analytical precision (0.08 dpm m-3 for223Ra and 0.15 dpm m-3 for 224Ra) were determined frommultiple analyses of prepared standard solutions(acquired from the National Physical Laboratory) and
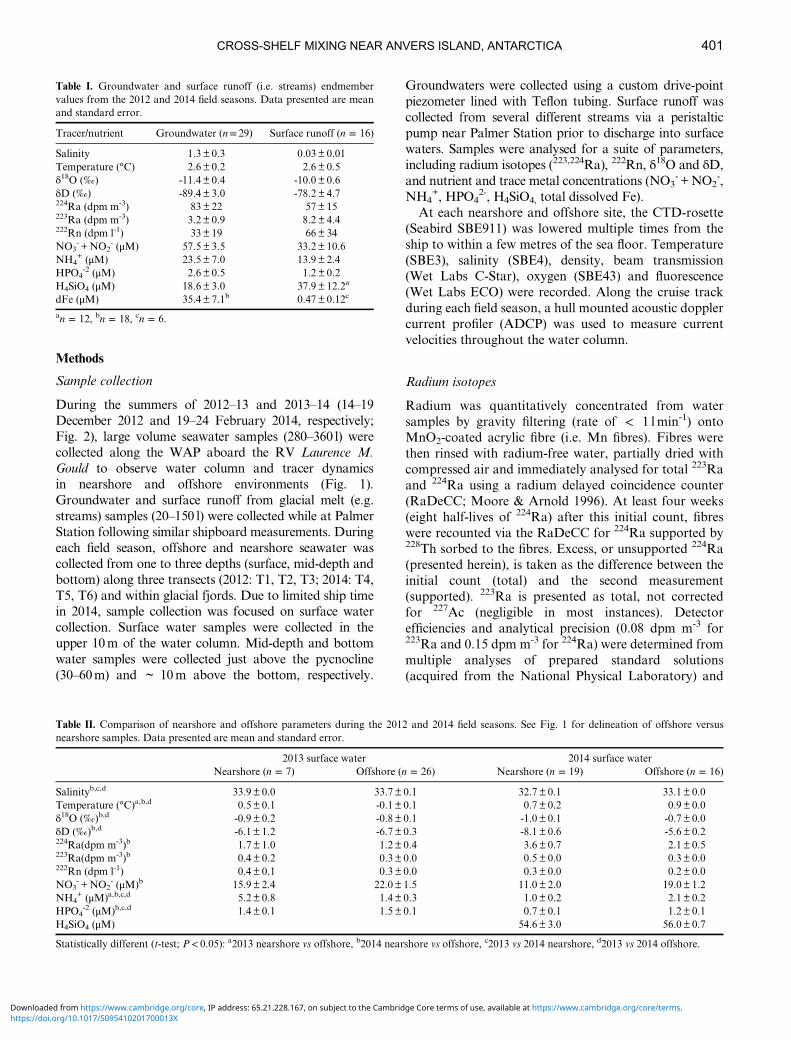
Table I. Groundwater and surface runoff (i.e. streams) endmembervalues from the 2012 and 2014 field seasons. Data presented are meanand standard error.
Tracer/nutrient Groundwater (n= 29) Surface runoff (n = 16)
Salinity 1.3± 0.3 0.03± 0.01Temperature (°C) 2.6± 0.2 2.6 ± 0.5δ18O (‰) -11.4± 0.4 -10.0± 0.6δD (‰) -89.4± 3.0 -78.2± 4.7224Ra (dpm m-3) 83± 22 57± 15223Ra (dpm m-3) 3.2± 0.9 8.2 ± 4.4222Rn (dpm l-1) 33± 19 66± 34NO3
- +NO2- (μM) 57.5± 3.5 33.2± 10.6
NH4+ (μM) 23.5± 7.0 13.9± 2.4
HPO4-2 (μM) 2.6± 0.5 1.2 ± 0.2
H4SiO4 (μM) 18.6± 3.0 37.9± 12.2a
dFe (μM) 35.4± 7.1b 0.47± 0.12c
an = 12, bn = 18, cn = 6.
Table II. Comparison of nearshore and offshore parameters during the 2012 and 2014 field seasons. See Fig. 1 for delineation of offshore versusnearshore samples. Data presented are mean and standard error.
2013 surface water 2014 surface waterNearshore (n = 7) Offshore (n = 26) Nearshore (n = 19) Offshore (n = 16)
Salinityb,c,d 33.9± 0.0 33.7± 0.1 32.7± 0.1 33.1± 0.0Temperature (°C)a,b,d 0.5± 0.1 -0.1± 0.1 0.7 ± 0.2 0.9± 0.0δ18O (‰)b,d -0.9 ± 0.2 -0.8± 0.1 -1.0 ± 0.1 -0.7 ± 0.0δD (‰)b,d -6.1 ± 1.2 -6.7± 0.3 -8.1 ± 0.6 -5.6 ± 0.2224Ra(dpm m-3)b 1.7± 1.0 1.2± 0.4 3.6 ± 0.7 2.1± 0.5223Ra(dpm m-3)b 0.4± 0.2 0.3± 0.0 0.5 ± 0.0 0.3± 0.0222Rn (dpm l-1) 0.4± 0.1 0.3± 0.0 0.3 ± 0.0 0.2± 0.0NO3
- +NO2- (μM)b 15.9± 2.4 22.0± 1.5 11.0± 2.0 19.0± 1.2
NH4+ (μM)a,b,c,d 5.2± 0.8 1.4± 0.3 1.0 ± 0.2 2.1± 0.2
HPO4-2 (μM)b,c,d 1.4± 0.1 1.5± 0.1 0.7 ± 0.1 1.2± 0.1
H4SiO4 (μM) 54.6± 3.0 56.0± 0.7
Statistically different (t-test; P< 0.05): a2013 nearshore vs offshore, b2014 nearshore vs offshore, c2013 vs 2014 nearshore, d2013 vs 2014 offshore.
CROSS-SHELF MIXING NEAR ANVERS ISLAND, ANTARCTICA 401
https://doi.org/10.1017/S095410201700013XDownloaded from https://www.cambridge.org/core, IP address: 65.21.228.167, on subject to the Cambridge Core terms of use, available at https://www.cambridge.org/core/terms.
intercalibrated among laboratories participating inGEOTRACES using a similar standard prepared froman International Atomic Energy Agency solution.Analytical uncertainty for individual samples werebased on propagated counting statistics, and averaged7% and 21% for 224Ra and 223Ra, respectively.
Radon
Radon analyses were completed by collecting 6 l of waterat each location and depth prior to any other samplecollection to avoid potential degassing from the Niskinbottles. Seawater was siphoned into a 6 l Nalgene bottle
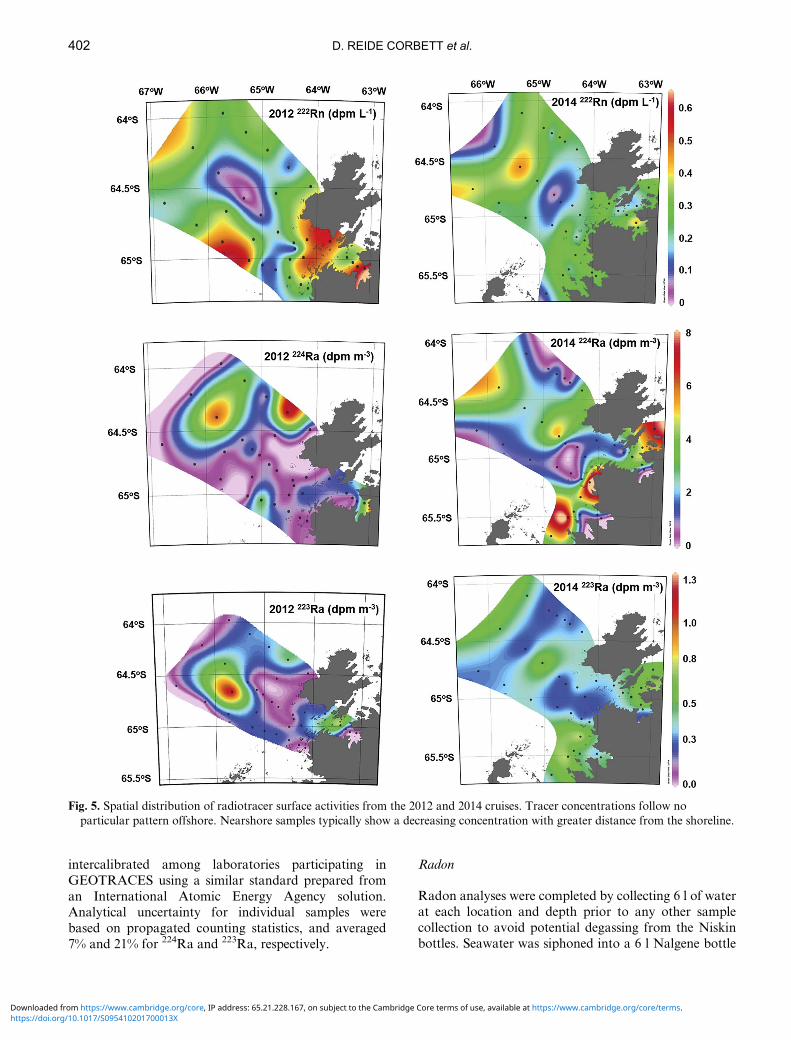
Fig. 5. Spatial distribution of radiotracer surface activities from the 2012 and 2014 cruises. Tracer concentrations follow noparticular pattern offshore. Nearshore samples typically show a decreasing concentration with greater distance from the shoreline.
402 D. REIDE CORBETT et al.
https://doi.org/10.1017/S095410201700013XDownloaded from https://www.cambridge.org/core, IP address: 65.21.228.167, on subject to the Cambridge Core terms of use, available at https://www.cambridge.org/core/terms.

with a filling–venting cap to minimize radon evasion.Each seawater sample was analysed with a RAD-7 radon-in-air monitor (Durridge) via procedures outlined in Lee& Kim (2006). The RAD-7 uses a silicon semiconductorat ground potential to measure the short-lived Po isotopesemitted by 222Rn decay.
Nutrients, δ18O and δD
A 60ml seawater sample was collected at each samplinglocation and depth for nutrient analyses (NO3
-+NO2-,
NH4+, HPO4
2-, H4SiO4). Each sample was syringefiltered on-site through a 0.45µm filter into a 60mlpolypropylene bottle. All sampling materials and bottleswere acid-cleaned prior to use. Samples collected were storedat -20°C until analysis on aLachatQuickchemAutoanalyser.
Dissolved iron (dFe) was sampled from freshwaterendmembers using acid-cleaned material and trace metalclean protocols. Samples were pumped immediately from
source waters (e.g. groundwater, stream, etc.) through aninline 0.2μm membrane filter into a polyethylene samplebottle using a peristaltic pump to avoid exposure to air. Allsampling materials and bottles were acid-cleaned priorto use. Sampleswere preservedwithOptima ultrapure nitricacid and shipped to Skidaway Institute of Oceanographyfor analysis on a Perkin Elmer NexION 300D ICP-MS.
Water isotope samples were collected at the same timeas nutrient samples. To minimize degassing, water wasallowed to overflow a 20ml scintillation vial for > 10 sec.After the scintillation vial was completely filled withseawater with no head space, vials were capped, sealedwith parafilm and stored inverted at 4°C. Samples wereshipped to Ohio State University for analysis on a PicarroL2130 Wavelength Scanned-Cavity Ring DownSpectrometer water isotope analyser. Calculated valuesare relative to Vienna Standard Mean Ocean Water(VSMOW) with precision of 0.03‰ and 0.1‰ for δ18Oand δD, respectively.
Fig. 6. Spatial distribution of water isotope (δO18, δD) surface water concentrations from the 2012 and 2014 cruises. All surfacesamples are reported, including those that are probably outliers leading to a shelf ‘bullseye’ in 2012. Note more depleted isotopicsignatures nearshore during the 2014 cruise.
CROSS-SHELF MIXING NEAR ANVERS ISLAND, ANTARCTICA 403
https://doi.org/10.1017/S095410201700013XDownloaded from https://www.cambridge.org/core, IP address: 65.21.228.167, on subject to the Cambridge Core terms of use, available at https://www.cambridge.org/core/terms.
Results
Physical parameters
Air temperature measured at Palmer Station providescontext for differences observed between the two cruises.Average air temperature for one and two months prior
to the 2012 cruise (Fig. 2, hatched area) were -0.3±1.3°Cand -2.2± 3.2°C, respectively. Average air temperature forone and two months prior to the 2014 cruise(Fig. 2, hatched area) were 1.1± 1.1°C and 1.1± 1.4°C,respectively. Generally, air temperatures were belowfreezing and more variable prior to the 2012 cruise, and
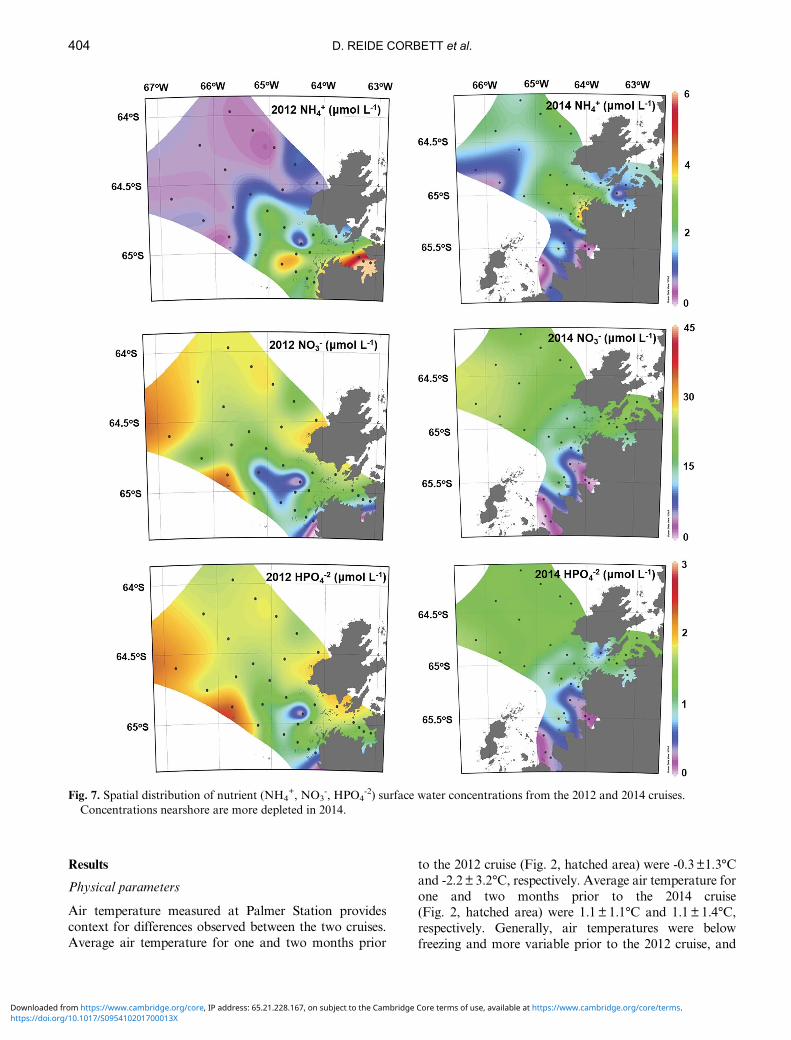
Fig. 7. Spatial distribution of nutrient (NH4+, NO3
-, HPO4-2) surface water concentrations from the 2012 and 2014 cruises.
Concentrations nearshore are more depleted in 2014.
404 D. REIDE CORBETT et al.
https://doi.org/10.1017/S095410201700013XDownloaded from https://www.cambridge.org/core, IP address: 65.21.228.167, on subject to the Cambridge Core terms of use, available at https://www.cambridge.org/core/terms.
above freezing and less variable prior to the 2014 cruise(Fig. 2). Temperatures were significantly higher (P< 0.01)during the 2014 cruise.
During the cruises, surface water temperatures variedfrom -1.5–2.8°C, with an average of 0.5°C. The warmestwaters were observed in Flandres Bay and regions closerto shore. The coldest surface temperatures were measuredalong T3 in 2012 and in Barilari Bay during the February2014 cruise (Fig. 3). Temperature minima (-2°C) existedduring both field seasons throughout the study area at50–100m depth. These temperature minima were notpresent closer to the shoreline, where density gradientswere less prevalent across the permanent pycnocline at adepth of ~ 100–150m (Fig. 4). Surface salinities rangedfrom 31.2–34.1 with an average of 33.2. Fresher waterswere found closest to shore in Flandres Bay, BeascocheaBay and Barilari Bay (Fig. 3). The surface mixed layer didnot extend below ~ 40m depth throughout the studyregion (Fig. 4). Deep waters (> 60m) within the studyarea ranged in temperature from -0.5–1.6°C, with anaverage of 1.1°C. Salinities in deep waters ranged from34.2–34.7, with an average of 34.6.
Isotopic tracers
During the 2012 and 2014 field campaigns, short-livedisotopes (i.e. Ra, Rn) were measured in groundwatersand streams near Palmer Station. In addition, surfacewaters offshore of Anvers Island and in nearshore fjordswere sampled aboard the RV Laurence M. Gould.Groundwater and stream waters had elevated activitiesof all radiotracers (Table I) relative to nearshore andoffshore surface water (Table II). Activities of thesefreshwater endmembers were as much as three orders ofmagnitude higher than nearby surface waters.
Surface 223,224Ra activities ranged from 0.1–1.0 dpm m-3
and 0.1–12.8 dpm m-3, respectively (Fig. 5). Similarly, deepwater 223,224Ra activities ranged from 0.2–1.7 dpm m-3 and0.2–16.1 dpm m-3, respectively. Surface 222Rn activitiesranged from 0.3–0.8 dpm l-1, while deeper watersranged from 0.1–1.1 dpm l-1. Surface waters were foundto be enriched in short-lived Rn and Ra isotopesin the vicinity of Anvers Island and Flandres Bay in2012, and nearshore in Barilari and Flandres Bays in2014 (Fig. 5).
Deuterium values in surface and deep waters rangedfrom -12.1 – -3.7‰ and -11.2 – -0.5‰, respectively. 18Ovalues in surface and deep waters ranged from -1.9–0.4‰and -1.36–0.02‰, respectively. The distribution of δ18Oand δD co-vary. Generally, surface samples nearshore weremore depleted relative to stations offshore (Fig. 6, Table II).Gradients in surface water δ18O and δD were mostprominent in the fjords (Fig. 6). Offshore surface samplesshowed high variability in the isotopic values, probably anindication of advective mixing.
Nutrients
Orthophosphate concentrations in surface waters rangedfrom 0.12–2.3 μM. Nitrate/nitrite concentrations insurface waters ranged from 4.0–32 μM. Nitrate/nitriteand phosphate concentrations showed similar patterns(Fig. 7). Generally, bottom water concentrations werehigher than surface water values, and surface waterconcentrations along the coast were lower than offshorewaters. Deep water orthophosphate and nitrate/nitriteconcentrations ranged from 1.8–2.4 μM and 16.8–37 μM,respectively.
Ammonium concentrations in surface waters rangedfrom below detection to 6.5μM (Fig. 7). In deeper waters,ammonium concentrations range from below detection to1.6μM. Patterns in the distribution of ammonium differfrom patterns observed in orthophosphate and nitrate/nitrite, although ammonium was similarly depleted insome areas (Beascochea and Barilari bays). Increasedammonium concentrations in surface waters wereobserved in the vicinity of Grandidier Channel and inFlandres Bay. Silicate concentrations in surface watersvaried from 38–88μM (Fig. 7). Surface waters in FlandresBay and in the Gerlache Channel were enriched relative tooffshore surface waters and fjords to the south. In deeperwaters, silicate concentrations range from 87–108μM.
Discussion
Tracer signatures of freshwater sources
Along the shoreline of the WAP and nearby islands,fresher water masses were observed in the upper layers ofthe water column (Figs 3 & 4). These salinity differencesin the upper parts of the water column co-varied withphysical and geochemical parameters that have beenused to identify glacial melt, such as δ18O and ourradiotracers (Figs 5 & 6). The light isotopic signature ofglacial ice has been used previously to trace meltwaterpulses along the Antarctic continental shelf (Schlosseret al. 1990, Weppernig et al. 1996, Meredith et al. 2008).Groundwaters and surface runoff from glacial melt(i.e. streams) had an average δ18O signature of -11.4‰and -10‰, respectively, while the average δDwas -89.4‰and -78.2‰, respectively (Table I).
Groundwaters and streams were enriched in Ra and Rnrelative to seawater, and depleted in 18O. Groundwatersamples from Anvers Island had average activities of 3.2and 83 dpm m-3 for 223Ra and 224Ra, respectively, whichare high relative to average surface water values observedoffshore (Tables I & II, Fig. 5). Streams were alsoenriched in Ra isotopes relative to surface waters alongthe WAP. On average, streams had activities of 8.2 and57 dpm m-3 for 223Ra and 224Ra, respectively (Table I).Similarly, Rn was enriched in groundwaters and streams
CROSS-SHELF MIXING NEAR ANVERS ISLAND, ANTARCTICA 405
https://doi.org/10.1017/S095410201700013XDownloaded from https://www.cambridge.org/core, IP address: 65.21.228.167, on subject to the Cambridge Core terms of use, available at https://www.cambridge.org/core/terms.
relative to nearshore and offshore surface waters (Tables I& II). The relative enrichment of Ra and Rn interrestrially derived waters can be used to identify andevaluate the freshwater (e.g. meltwater) inputs observedalong the WAP, assuming other potential sources(e.g. bottom sediments) are taken into account.However, this study has focused on surface watersabove the pycnocline in water depths (200–600m) thatfar exceed the surface mixed layer (~ 30m) thereforelimiting the potential inputs of these short-lived tracersfrom bottom sediments or deep water sources.
Tracer variability with proximity to the shoreline
Changes in surface salinity, temperature and traceractivities vary with the amount of meltwater entering thenearshore environment. These parameters and otherschange with the progression of the summer as moremeltwater enters the nearshore environment. The averagesof surface temperature and salinity values (Table II) remainwithin the limits of AASW defined by Klinck et al. (2004)with the exception of nearshore salinity in 2014 (32.7±0.1).These waters were significantly fresher on average thanAASW and the other waters measured during this study,which suggests that local glacial melt inputs are mixingwith nearshore surface waters. Data from the December2012 cruise suggest little change in surface seawatercharacteristics with distance from the shoreline. Thiscruise took place during the early weeks of the summerwhen the melt season was just beginning. A notabledifference is that offshore waters were much cooler thansurface waters nearshore. Glacial melt signals were not asprominent across the shelf compared to gradients innearshore waters. The 2014 cruise took place during thelatter phases of the summer. At this point in the season,there were notable differences in the physical andgeochemical characteristics of surface seawater nearshorerelative to offshore waters. Nearshore surface waters hadlower salinity, temperature, δ18O and δDvalues, and higher223,224Ra activities relative to offshore surface waters. Thesechanges probably document an increased meltwaterinfluence with the progression of the summer and theutility of these geochemical tracers in identifying meltwaterinput. The location and intensity of meltwater inputs canimpact and influence the prolific phytoplankton bloomsthat take place along the WAP (Dierssen et al. 2002). Inorder to gain an understanding of how quickly these watermasses can be distributed along the WAP, mixing modelswere employed to evaluate coastal and cross-shelf mixing.
Nearshore mixing
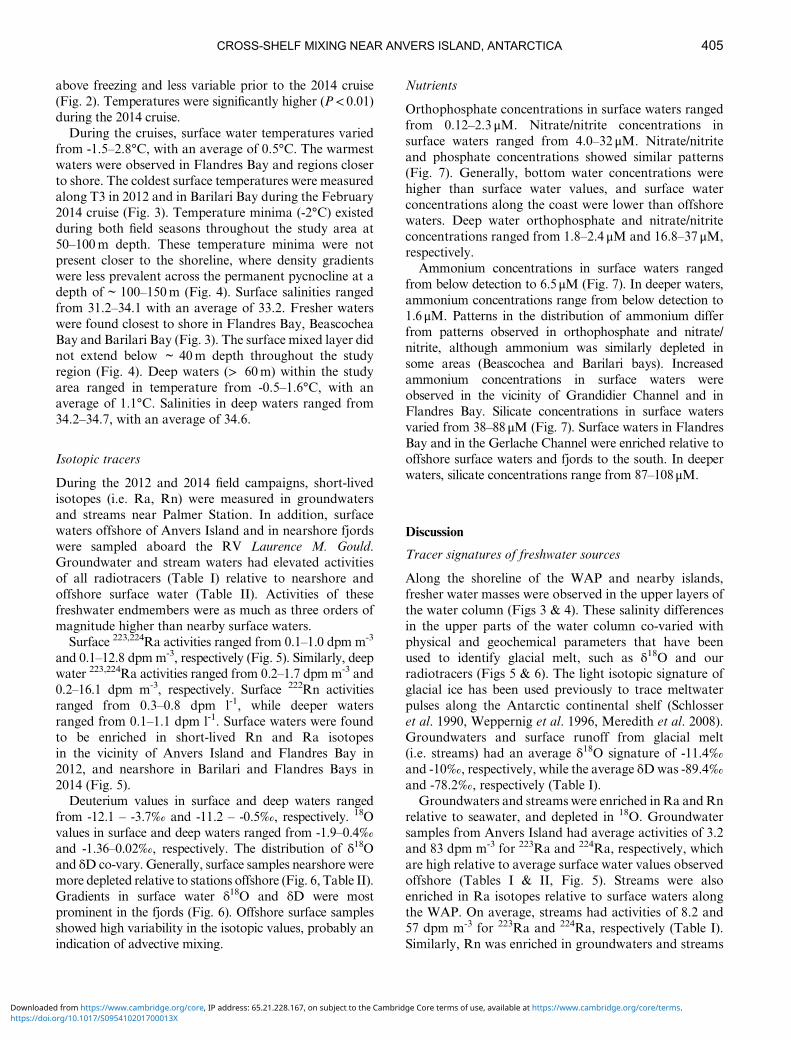
Radon and short-lived Ra were used to estimate mixing innearshore waters. Assuming the source of these tracers isnearshore (e.g. meltwater) and changes in activity are a
function of mixing with offshore water of lower activityand radioactive decay, then the change in activity can bemodelled via:
Ax=Aoe�x
ffiffiffiffiffiffiffiffiffiλ=Kh
q; (1)
where Ax is the activity at distance x from the coast, A0 isthe activity at the coast (x = 0), Kh is the mixingcoefficient and λ is the decay constant (Moore 2000).Additional assumptions include: i) the system is at steadystate, ii) a constant source of tracer only at the landwardboundary (A0) and iii) advection is not significant acrossthe distance modelled. We are confident in theseassumptions given that no influence of advection wasobserved (i.e. no deviation from the linear trend of ln(tracer) with distance) and the water depth (200–600m)far exceeds the surface mixed layer (~ 30m) limiting newtracer inputs from bottom sediments. Although short-lived Ra isotopes have typically been employed with thismethod (Moore 2000, Annett et al. 2013), assuming
Fig. 8. The a. ln222Rn and b. ln224Ra profiles from Flandres Bayin 2012 and 2014, and well as Beascochea Bay in 2014. Linesrepresent the best-fit trend line used to calculate mixing ratesfor each tracer during each sampling year.
406 D. REIDE CORBETT et al.
https://doi.org/10.1017/S095410201700013XDownloaded from https://www.cambridge.org/core, IP address: 65.21.228.167, on subject to the Cambridge Core terms of use, available at https://www.cambridge.org/core/terms.
atmospheric evasion is minimal, radon should providesimilar results as the source of the tracers is assumed to bethe same (e.g. meltwater). Mixing rates were estimatedwithin two fjords (i.e. Flandres and Beascochea bays)where degassing was reduced (< 0.1 dpm m-2 min-1) dueto low winds (< 5m s-1) based on the calculated flux ofRn from the sea surface to the atmosphere for the24 hours prior to sample collection.
In Flandres Bay, 222Rn-derived mixing rates were1020± 300 and 570± 160m2 s-1 for the 2012 and 2014cruises, respectively, while 224Ra-derived mixing rateswere 570± 60 and 110± 20m2 s-1, respectively, for thesame period (Fig. 8). Both tracers show a decreasedmixing rate during 2014 and may represent seasonalvariability. Mixing in Beascochea Bay was estimated at3600± 200m2 s-1 (Fig. 8) using measurements spanning adistance of ~ 31 km. Similar to Flandres Bay, BeascocheaBay is flanked by glaciers but opens to the relativelyunprotected Grandidier Channel at its mouth.
Calculated mixing rates were within the range of otherrates calculated along the WAP to the north whereDulaiova et al. (2009) estimated mixing rates via Raisotopes along the South Shetland Islands of 596–63000m2 s-1 in open ocean waters. This location is where theAntarctic Circumpolar Current approaches the northernedge of the peninsula. However, south of our study area,Annett et al. (2013) calculated mixing rates using Raisotopes within Marguerite Bay of 0.13–1.0m2 s-1, whichare several orders of magnitude lower than thosecalculated in this study and probably reflect the low-velocity circulation dynamics of the more protectedembayment of Marguerite Bay.
Estimating cross-shelf mixing via 223,224Ra and 222Rnproved to be more problematic. Mixing models usingterrestrially derived tracers assume that there is a singlesource of tracer emanating from the continental marginand that vertical and lateral (e.g. along-shelf) advectivetransport is negligible. Surface currents and circulationdynamics across the continental margin are much morecomplex than the models used here to evaluate them.The ADCP data collected as part of this study andcomposite data presented by Savidge & Amft (2009) showthat circulation patterns are complicated, and vary overdifferent timescales. Recent surface current measurementsvia high-frequency radar demonstrates the spatial andtemporal complexity of currents in this region, with largeshort-term areas of convergence and divergence, intermixedwith cross-shelf and along-shelf advection (Kohutet al. 2016). However, unlike the shelf, the fjords providean area where the assumptions essential for this typeof unidirectional circulation model are more plausible.Because the offshore areas are more susceptible to advectivemixing in the along- and cross-shore directions, mixing ratesare probably much higher than those estimated here for thefjords.
Seasonal variability: nutrient transport and shelfproductivity
As noted previously, the December 2012 survey wasconducted at the beginning of the summer when the surfacewaters ranged in salinity from 32.6–34.8 with amean of 33.7.Radium values in surface waters averaged 1.5 dpmm-3. Theaverage atmospheric temperature for November andDecember 2012 was -2.22°C (Fig. 2). The 2014 cruise tookplace during the latter part of February, as the summerseason was coming to an end. Surface waters ranged insalinity from 31.2–33.6 and averaged 32.9. For surfacewaters in 2014, Ra values averaged 3.03 dpm m-3. Januaryand February 2014 atmospheric temperatures at PalmerStation averaged 1.1°C (Fig. 2). As the season progresses, airtemperatures > 0°C are more common and there are fewerhours of darkness. The increased temperatures and exposureto sunlight enhance glacial melting, progressively releasingvast quantities of meltwater into the surface ocean.
The highest fluorescence values (6–8mg m-3) reported inthis study were measured in the Grandidier Channelseaward of Barilari Bay. These waters were enriched in222Rn, 223Ra and 224Ra relative to surface waters offshorewhere fluorescence (e.g. primary productivity) was lower(0–2mg m-3). These nearshore waters were clearly fresher,colder, and depleted in 18O and D relative to adjacentsurface waters (Fig. 6), suggesting that glacial meltcomprises a higher percentage of surface waters in theGrandidier Channel near Barilari Bay. Given the highermacro and micronutrient concentrations measuredin these terrestrially derived waters, it is hypothesized thatnutrient transport via glacial melt plays a role in fuelling theobserved primary productivity (e.g. higher fluorescence).
Several studies (Moore 1996, Dierssen et al. 2002,Windom et al. 2006) have linked the terrestrialenvironment and primary productivity in the surface oceanthrough submarine groundwater discharge with respect tomacro and micronutrients. Unlike the temperate andtropical environments where groundwater discharge studieshave focused, the WAP is quite different in that it has a vastreservoir of frozen water covering the majority of the landsurface that partially melts during summer months. Thisstudy suggests that primary productivity along the WAPcould be linked to nutrients provided by these seasonalmeltwater inputs following different delivery pathways.Mixing rates in the surface waters observed in nearbyBeascochea Bay and within Flandres Bay are within therange of those calculated along the northern reaches of theWAP (Dulaiova et al. 2009), and higher than thosecalculated in the more isolated Marguerite Bay (Annettet al. 2013). Althoughmixing rates are probablymuch higheracross the shelf proper, nutrients appear to be quicklytaken-up nearshore prior to export offshelf, with potentialcross-shelf transport via particulate organic forms ratherthan dissolved inorganic forms of those nutrient species.
CROSS-SHELF MIXING NEAR ANVERS ISLAND, ANTARCTICA 407
https://doi.org/10.1017/S095410201700013XDownloaded from https://www.cambridge.org/core, IP address: 65.21.228.167, on subject to the Cambridge Core terms of use, available at https://www.cambridge.org/core/terms.
Our analysis indicates that the nitrate, ammonium andorthophosphate concentrations are statistically differentbetween the nearshore and offshore samples in 2014, withthe offshore samples having higher concentrations(Table II and Fig. 7; Fig. 1 dotted line representsnearshore/offshore delineation). This may suggest eitherenhanced glacial flux from more far afield, nearshorebiological uptake or the influence of upwelled, morenutrient-rich water added offshore. The 2014 nearshorewaters have a DIN:P:Si molar ratio of 17:1:78, while theoffshore waters have 18:1:47. There has been little researchon either subaerial or subglacial melt geochemistry.Surface runoff from glacial melt from Livingston Islandto the north of the study area at 62o40'S has DIN:P:Simolar ratios of 5.3:1:54 (Toro et al. 2007), while the onlyother subglacial water analysis from theWest Antarctic IceSheet has a ratio of 1.1:1:41 (Christner et al. 2014,Michaud et al. 2016). In comparison, surface runoff fromglacial melt collected near Palmer Station has an averageDIN:P:Si molar ratio of 39:1:32, while groundwater is31:1:7 (Table I). Clearly, our surface water data are muchmore DIN depleted relative to both P and Si of thegroundwaters and stream waters around Palmer Station.Whether this suggests preferential uptake of N in thesewaters or just significant geochemical variabilities in glacialmelt requires further investigation. Given the observationthat the means of the N:P for both the nearshore andoffshore waters are close to the Redfield ratio of 16:1, thesewaters have probably been modified by biologicalprocesses even in close proximity to the glacial sources.
In this study, higher surface fluorescence values(2–8mg m-3) were observed close to the shoreline whereisotopic tracers suggest glacial melt inputs are present.Farther offshore, surface fluorescence values were lower(0–2mg m-3). Given this spatial distribution, it is possiblethat the extent and location of phytoplankton blooms arecontrolled by the location, intensity and mixing ofmeltwater inputs along the coast. Circulation dynamics,especially those that control the distribution of meltwater,are impacted by changes in surface water temperature andsalinity. As atmospheric and oceanic temperatures alongthe WAP rise, the volume of meltwater that enters thesurface ocean will certainly increase. This change inmeltwater dynamics with respect to the duration ofwarmer atmospheric temperatures is observed in thisstudy over the changing seasons, although the sameconcepts could be applied over longer time scales.
Conclusions
Terrestrially derived water masses introduce and transportmacro and micronutrients along and across the shelf of theWAP. As atmospheric temperatures along the WAP rise,the increasing frequency and intensity of meltwater pulsesalong the WAP have the potential to profoundly impact
global carbon and climate cycles. Similar to other coastalsystems around the globe, terrestrial water can be identifiedvia natural tracer concentrations (223,224Ra, 222Rn, δ18O,δD). Groundwater and surface runoff from glacialmeltwaters were significantly enriched in Ra and Rnrelative to seawater, and depleted in 18O and D.
These tracers should vary in concentration as afunction of meltwater delivery to coastal waters. Giventhe difference in season between the two cruises (earlysummer in 2012 and late summer in 2014), the higheractivities in Ra and Rn observed nearshore in 2014are attributed to an increase in meltwater productionand discharge. This increased freshwater delivery wasalso seen in the salinity and water isotopes nearshorecompared to the offshore values in 2014.
Calculated horizontal mixing rates of water masses withinglacial fjords along the WAP via 224Ra and 222Rn rangedfrom 110–3600m2 s-1. Mixing rates estimated here werewithin the range of other rates calculated along theWAPandsuggest a rapid transport mechanism for moving meltwateroffshore. Based on data collected offshore of Anvers Islandduring the 2012–13 and 2013–14 summers, the flux of bio-limiting nutrients from the Antarctic continent across thecontinental shelf was evaluated. More work is needed tofurther evaluate the flux and important biogeochemicalelements such as Fe to the surface waters along the WAP togain a true understanding of how continental inputs play arole in this globally important ecological system.
Acknowledgements
We would like to thank the captain and crew of the RVLaurence M. Gould, the scientists and support staff ofPalmer Station, the US Antarctic Program, and the manygraduate students who not only assisted in sample analysesat ECU and CCU but devoted significant amounts of timeto assist with field efforts in the Antarctic. We thank SueWelch, Kelsey Dailey and Elsa Saelens for their help in thelaboratory analysis at Ohio State University. This researchwas funded by the National Science Foundation, grantnumber ANT-1142090 (DRC/KN) and ANT-1142059(WBL). The authors appreciate the support of theUniversity of Wisconsin-Madison Automatic WeatherStation Program for the dataset, data display andinformation, NSF grant number ANT-1245663. J.P.Walsh and two anonymous reviewers are acknowledgedfor suggestions that improved the manuscript.
Author contributions
DRCandKN conceived the project and led field efforts. JC,RNP and LEP managed the radionuclide analysis in thefield and at their respective universities. WBL analyseddeuterium and 18O of all water samples at Ohio StateUniversity. All authors contributed to the discussion ofresults and writing of the manuscript.
408 D. REIDE CORBETT et al.
https://doi.org/10.1017/S095410201700013XDownloaded from https://www.cambridge.org/core, IP address: 65.21.228.167, on subject to the Cambridge Core terms of use, available at https://www.cambridge.org/core/terms.
References
ANNETT, A., HENLEY, S., VAN BEEK, P., SOUHAUT, M., GANESHRAM, R.,VENABLES, H., MEREDITH, M. & GEIBERT, W. 2013. Use of radiumisotopes to estimate mixing rates and trace sediment inputs to surfacewaters in northern Marguerite Bay, Antarctic Peninsula. AntarcticScience, 25, 445–456.
BHATIA, M., KUJAWINSKI, E., DAS, S., BREIER, F., HENDERSON, P. &CHARETTE, M. 2013. Greenland meltwater as a significant andpotentially bioavailable source of iron to the ocean. NatureGeoscience, 6, 274–278.
CHRISTNER, B.C., PRISCU, J.C., ACHBERGER, A.M., BARBANTE, C.,CARTER, S.P., CHRISTIANSON, K., MICHAUD, A.B., MIKUCKI, J.A,MITCHELL, A.C., SKIDMORE, M.L. & VICK-MAJORS, T.J.; WISSARDSci Team 2014. A microbial ecosystem beneath the West AntarcticIce Sheet. Nature, 512, 310–313.
COOK, A.J., FOX, A.J., VAUGHAN, D.G. & FERRIGNO, J.G. 2005.Retreating glacier fronts on the Antarctic Peninsula over the pasthalf-century. Science, 308, 541–544.
DIERSSEN, H., SMITH, R. & VERNET, M. 2002. Glacial meltwaterdynamics in coastal waters west of the Antarctic Peninsula.Proceedings of the National Academy of Science of the United Statesof America, 99, 1790–1795.
DUCKLOW, H.W., CLARKE, A., DICKHUT, R., DONEY, S.C., GEISE, H.,HUANG, K., MARTINSON, D.G., MEREDITH, M.P., MOELLER, H.V.,MONTES-HUGO, M., SCHOFIELD, O., STAMMERJOHN, S.E., STEINBERG, D.& FRASER, W. 2012. The marine system of the Western AntarcticPeninsula. In ROGERS, A.D., JOHNSTON, N.M., MURPHY, E.J. &CLARKE, A., eds. Antarctic ecosystems: an extreme environment in achanging world. Chichester: Wiley-Blackwell, 121–159.
DULAIOVA, H., ARLDELAN, M.V., HENDERSON, P.V. & CHARETTE, M.A.2009. Shelf-derived iron inputs drive biological productivity in thesouthern Drake Passage. Global Biogeochemical Cycles, 10.1029/2008GB003406.
HAWKINGS, J.R., WADHAM, J.L., TRANTER, M., RAISWELL, R., BENNING, L.G., STATHAM, P.J., TEDSTONE, A., NIENOW, P., LEE, K. & TELLING, J.2014. Ice sheets as a significant source of highly reactive nanoparticulateiron to the oceans. Nature Communications, 10.1038/ncomms4929.
KING, J.C. 1994. Recent climate variability in the vicinity of the AntarcticPeninsula. International Journal of Climatology, 14, 357–369.
KLINCK, J.M., HOFMANN, E.E., BEARDSLEY, R.C., SALIHOGLU, B. &HOWARD, S. 2004. Water-mass properties and circulation on the westAntarctic Peninsula continental shelf in austral fall and winter 2001.Deep-Sea Research - Topical Studies in Oceanography, 51, 1925–1946.
KOHUT, J., MILES, T., BERNARD, K., FRASER, W., PATTERSON-FRASER,D., OLIVER, M., CIMINO, M., WINSOR, P., STATSCEWICH, H. & FREDJ,E. 2016. Project CONVERGE: impacts of local oceanographicprocesses on Adélie penguin foraging ecology. OCEANS 2016 MTS/IEEE Monterey, 10.1109/OCEANS.2016.7761152.
KUNZ, M., KING, M.A., MILLS, J.P., MILLER, P.E., FOX, A.J.,VAUGHAN, D.G. & MARSH, S.H. 2012. Multi-decadal glacier surfacelowering in the Antarctic Peninsula. Geophysical Research Letters,10.1029/2012GL052823.
LEE, J.M. & KIM, G. 2006. A simple and rapid method for analyzingradon in coastal and ground waters using a radon-in-air monitor.Journal of Environmental Radioactivity, 89, 219–228.
LYONS, W.B., DAILEY, K.R., WELCH, K.A., DEUERLING, K.M., WELCH,S.A. & MCKNIGHT, D.M. 2015. Antarctic streams as a potentialsource of iron for the Southern Ocean. Geology, 43, 1003–1006.
MEREDITH, M.P., BRANDON, M.A., WALLACE, M.I., CLARKE, A.,LENG, M.J., RENFREW, I.A., VAN LIPZIG, N.P.M. & KING, J.C. 2008.Variability in the freshwater balance of northern Marguerite Bay,Antarctic Peninsula: results from δ18O. Deep-Sea Research - TopicalStudies in Oceanography, 55, 309–322.
MEREDITH, M.P., VENABLES, H.J., CLARKE, A., DUCKLOW, H.W.,ERICKSON, M., LENG, M.J., LENAERTS, J.T.M. & VAN DEN BROEKE,M.R. 2013. The freshwater system west of the Antarctic Peninsula:spatial and temporal changes. Journal of Climate, 26, 1669–1684.
MICHAUD, A.B., SKIDMORE, M.L., MITCHELL, A.C., VICK-MAJORS, T.J.,BARBANTE, C., TURETTA, C., VANGELDER, W. & PRISCU, J.C. 2016.Solute sources and geochemical processes in Subglacial LakeWhillans, West Antarctica. Geology, 44, 347–350.
MOFFAT, C., BEARDSLEY, R.C., OWENS, B. & VAN LIPZIG, N. 2008. A firstdescription of the Antarctic Peninsula coastal current. Deep-SeaResearch - Topical Studies in Oceanography, 55, 277–293.
MOORE, W.S. 1996. Large groundwater inputs to coastal waters revealedby 226Ra enrichments. Nature, 380, 612–614.
MOORE, W.S. 2000. Determining coastal mixing rates using radiumisotopes. Continental Shelf Research, 20, 1993–2007.
MOORE, W.S. & ARNOLD, R. 1996. Measurement of 223Ra and 224Ra incoastal waters using a delayed coincidence counter. Journal ofGeophysical Research - Oceans, 101, 1321–1329.
MORRIS, E.M. & VAUGHAN, D.G. 2003. Spatial and temporal variationof surface temperature on the Antarctic Peninsula and the limit ofviability of ice shelves. Antarctic Research Series, 79, 61–68.
SAVIDGE, D.K. & AMFT, J.A. 2009. Circulation on the West AntarcticPeninsula derived from 6 years of shipboard ADCP transects.Deep-Sea Research - Oceanographic Research Papers, 56, 1633–1655.
SCHLOSSER, P., BAYER, R., FOLDVIK, A., GAMMELSRØD, T., ROHARDT, G.& MÜNNICH, K.O. 1990. Oxygen 18 and helium as tracers of ice shelfwater and water/ice interaction in the Weddell Sea. Journal ofGeophysical Research - Oceans, 95, 3253–3263.
SCHOFIELD, O., DUCKLOW, H., MARTINSON, D., MEREDITH, M.P.,MOLINE, M. & FRASER, W.R. 2010. How do polar marineecosystems respond to rapid climate change? Science, 328, 1520–1523.
STEIG, E.J., SCHNEIDER,D.P., RUTHERFORD, S.D.,MANN,M.E., COMISO, J.C.& SHINDELL, D.T. 2009. Warming of the Antarctic ice sheet surface sincethe 1957 International Geophysical Year. Nature, 457, 459–463.
TAKAHASHI, T., SWEENEY, C., HALES, B., CHIPMAN, D.W., NEWBERGER, T.,GODDARD, J.G., IANNNUZZI, R.A. & SUTHERLAND, S.C. 2012. Thechanging carbon cycle in the Southern Ocean. Oceanography, 25,26–37.
TORO, M., CAMACHO, A., ROCHERA, C., RICO, E., BANON, M.,FERNANDEZ-VALIENTE, E., MARCO, E., JUSTEL, A., AVENDANO, M.C.,ARIOSA, Y., VINCENT, W.F. & QUESADA, A. 2007. Limnologicalcharacteristics of the freshwater ecosystems of Bayers Peninsula,Livingston Island, in Maritime Antarctica. Polar Biology, 30,635–649.
TURNER, J., COLWELL, S.R., MARSHALL, G.J., LACHLAN-COPE, T.A.,CARLETON, A.M., JONES, P.D., LAGUN, V., REID, P.A. & IAGOVKINA, S.2005. Antarctic climate change during the last 50 years. InternationalJournal of Climatology, 25, 279–294.
VAUGHAN, D.G., MARSHALL, G.J., CONNOLLY, W.M., PARKINSON, C.L.,MULVANEY, R., HODGSON, D.A., KING, J.C., PUDSEY, C.J. & TURNER, J.2003. Recent rapid regional climate warming on the Antarctic Peninsula.Climatic Change, 60, 243–274.
WADHAM, J., DE’ATH, R., MONTEIRO, F.M., TRANTER, M., RIDGWELL, A.,RAISWELL, R. & TULACZYK, S. 2013. The potential role of the Antarcticice sheet in global biogeochemical cycles. Earth and EnvironmentalScience Transactions of the Royal Society of Edinburgh, 104, 55–67.
WEPPERNIG, R., SCHLOSSER, P., KHATIWALA, S. & FAIRBANKS, R.G. 1996.Isotope data from Ice Station Weddell: implications for deep waterformation in the Weddell Sea. Journal of Geophysical Research -Oceans, 101, 25 723–25 739.
WINDOM, H., MOORE, W.S., NIENCHESKI, L.F. & JAHRIKE, R. 2006.Submarine groundwater discharge: a large, previously unrecognizedsource of dissolved iron to the South Atlantic Ocean. MarineChemistry, 102, 252–256.
CROSS-SHELF MIXING NEAR ANVERS ISLAND, ANTARCTICA 409
https://doi.org/10.1017/S095410201700013XDownloaded from https://www.cambridge.org/core, IP address: 65.21.228.167, on subject to the Cambridge Core terms of use, available at https://www.cambridge.org/core/terms.