Embed Size (px)
Citation preview

The 31st International Electric Propulsion Conference, University of Michigan, USA
September 20 – 24, 2009
1
Near-Wall Plasma Characterization of a 6-kW Hall Thruster
IEPC-2009-133
Presented at the 31st International Electric Propulsion Conference, University of Michigan • Ann Arbor, Michigan • USA
September 20 – 24, 2009
Rohit Shastry1, and Alec D. Gallimore2
Richard R. Hofer
Plasmadynamics and Electric Propulsion Laboratory, University of Michigan, Ann Arbor, MI 48109
and
3
Nomenclature
Jet Propulsion Laboratory, California Institute of Technology, Pasadena, CA 91109
Abstract: In preparation for in-depth internal wall measurements for erosion and electron mobility studies, a flush-mounted Langmuir probe and emissive probe were used to characterize the near-wall region near the exit plane of a 6-kW Hall thruster. Various plasma properties and electron energy distribution functions were measured at discharge voltages of 150 and 300 V, and anode mass flow rates of 10, 20, and 30 mg/s, as well as at 600 V and 10 mg/s. It was found that this region is characterized by a lower number density and plasma potential than expected, while the electron temperature is relatively consistent with previous internal measurements. The electron energy distribution function was found to be highly non-Maxwellian, possibly due to the presence of a large radial drift velocity that is of the same order as the calculated E × B drift velocity. Incident ion power deposition and implications of the structure of the distribution function are discussed.
Ap = Langmuir probe area, m2
As = sheath area, m2
C = total particle speed, m/s c = average electron speed, m/s cs = ion Bohm speed, m/s e = elementary charge, C Ie = collected electron current, A Ie,s = electron saturation current, A Ii,s = ion saturation current, A k = Boltzmann constant, J/K me = electron mass, kg mXe = xenon atom mass, kg ne = electron number density, m-3
ni = ion number density, m-3
rp
1 Ph.D. Candidate, Plasmadynamics and Electric Propulsion Laboratory, [email protected]. 2 Arthur F. Thurnau Professor of Aerospace Engineering, Director of the Plasmadynamics and Electric Propulsion Laboratory, [email protected]. 3 Senior Engineer, Electric Propulsion Group, 4800 Oak Grove Dr., MS 125-109, Pasadena, CA 91109, [email protected].
= Langmuir probe radius, m

The 31st International Electric Propulsion Conference, University of Michigan, USA
September 20 – 24, 2009
2
Te
⊥iu
= electron temperature, eV = incident ion beam velocity normal to probe surface, m/s
Vbias = Langmuir probe voltage bias, V Vcg = cathode-to-ground voltage, V Vd = discharge voltage, V Vf = floating potential, V Vp = plasma potential, V Vpeak = probe voltage at which peak in 2nd derivative is observed above plasma potential, V vx, vy, vz = particle velocity in the x, y, and z directions, m/s ε = total particle energy, J ε total
⊥ε = total incident ion beam energy, eV
= incident ion beam energy normal to probe surface, eV θ = incident ion beam angle with respect to thruster axis, deg λDe
I. Introduction
= electron Debye length, m
all thruster lifetime models currently in development aim to provide predictive tools that would eliminate or substantially reduce the need to perform long-duration, expensive life tests of flight articles.1-3 A critical part of
these modeling efforts is the need to understand and characterize the interaction between the plasma and the discharge channel walls. This interaction is composed of several complex processes that are not fully understood, and yet significantly affect thruster performance and lifetime. Several notable advances have been made in recent years in understanding plasma-wall interactions in Hall thrusters,4-6 but there is presently a noticeable lack of experimental validation. In particular, measurements of ion current and power incident on the ceramic walls as well as characterization of the electron energy spectrum would greatly contribute to the understanding of Hall thruster sheath physics, as well as provide validation and/or allow refinement of existing sheath models.7-10
As a preparatory study, plasma properties and electron energy distribution functions (EEDFs) were measured near the wall of a 6-kW Hall thruster. A boron nitride tab instrumented with a flush-mounted Langmuir probe was clamped in place downstream of the thruster exit plane, and data were taken over seven operating conditions at various discharge voltages and anode mass flow rates. Similarly, a swept emissive probe was used to provide an accurate, independent measurement of plasma potential under the same operating conditions. These data were then compared to internal measurements taken by Reid et al. using a high-speed axial reciprocating probe,11
II. Experimental Apparatus
in order to characterize any differences associated with the near-wall region.
The paper is organized as follows: Section II describes the experimental setup and data analysis techniques used in the study. Section III presents results of plasma potential, number density, electron temperature, and EEDFs for all operating conditions. Implications of the trends seen in ion power deposition, characterization of the local plasma, and features of the local EEDF are discussed in Section IV, while Section V summarizes the pertinent conclusions of the study.
A. Vacuum Facility Experiments were performed in the Large Vacuum Test Facility (LVTF) at the University of Michigan’s
Plasmadynamics and Electric Propulsion Laboratory (PEPL). The LVTF is a 6-m-diameter by 9-m-long cylindrical stainless steel chamber, equipped with seven CVI model TM-1200 cryopumps and liquid-nitrogen-cooled shrouds capable of providing a pumping speed of 245,000 l/s on xenon. Facility pressure was monitored with two commercially available hot-cathode ionization gauges, and a base pressure of 4 × 10⁻⁷ torr was routinely achieved. At a total mass flow rate of 21.4 mg/s, the facility pressure was 1.5 × 10⁻⁵
B. Hall Thruster
torr, corrected for xenon.
The test article for this study was a 6-kW laboratory Hall thruster with an approximate throttling range of 100-600 mN thrust and 1000-3000 s specific impulse. Research grade xenon propellant (99.999% pure) was supplied using commercially available controllers with ±1% full-scale accuracy. The controllers were calibrated before the experiment using a constant volume method that corrected for compressibility effects. The thruster is instrumented
H

The 31st International Electric Propulsion Conference, University of Michigan, USA
September 20 – 24, 2009
3
with a center-mounted LaB6
C. Langmuir Probe
hollow cathode, whose flow rate was maintained at 7% of the anode flow rate. The discharge was sustained with a 100-kW power supply capable of outputting 1000 V and 100 A. Separate supplies were used to power the magnets, along with the cathode heater and keeper.
A single Langmuir probe flush-mounted to a boron nitride wall was used to interrogate the near-wall region of the 6-kW Hall thruster. This probe was selected due to its simplicity and ability to measure several plasma properties such as number density, electron temperature, floating and plasma potentials, and EEDFs. However, the analysis of Langmuir probe data in order to obtain these properties can be complex due to various effects causing non-ideal behavior, leading to many different analysis techniques. Therefore, the following section will detail the data analysis used in this study. This will be followed by a description of the probe design and data acquisition.
1. Data Analysis Techniques
Most of the analysis methods used in this study follow simple Langmuir probe theory.12
pe
eepese A
meTenAcenIπ8
41
41
, ==
First, the floating potential was found by locating the voltage at which the collected current was zero. Next, the ion current was added to the collected current and a semilog plot of the resulting electron current was created from the I-V characteristic. A line was fit to the transition region of this plot, whose inverse slope corresponds to the electron temperature in eV.
Plasma potential was found using two different methods. First, a line was fit to the electron saturation region of the semilog plot. The intersection of this line and the line fit to the transition region corresponded to the plasma potential and the electron saturation current. Second, two derivatives were taken of a smoothed trace of the I-V characteristic. The voltage at which the second derivative is zero was taken as another measurement of plasma potential, and the current collected at this voltage was taken as the electron saturation current. Regardless of which technique was used, the electron saturation current was assumed to be from the thermal flux of electrons incident on the probe surface, given by
. (1)
With the electron saturation current and the electron temperature, the electron density can be determined. Ion number density was similarly determined from the ion saturation current. However, due to the size of the probe used, sheath expansion effects made it difficult to determine the proper saturation current. Due to the planar geometry of the probe, Sheridan’s model was used to quantify the sheath expansion effects and recover the proper ion saturation current.13
( )De
pppp
e
biaspp
bp
p
sr
baT
VVa
AA
λρρρηη ===
−=+= −− ,806.0,28.2,,1 0692.0749.0
This model provides empirical formulas (based on PIC simulations) for the area expansion based on the non-dimensional relative probe bias and probe radius:
. (2)
Thus, using the calculated plasma potential and electron temperature, the area expansion can be accounted for. Note that the model contains the electron Debye length, which in turn requires a plasma density. Use of this model is therefore an iterative process until a self-consistent solution is found. It should be noted that Sheridan’s model was derived for a non-flowing, thermal plasma. Thus, its application here is intended as a first order correction that does not account for the directed ion energy present in Hall thrusters. Figure 1 shows the effects of the model on the ion saturation branch. After the sheath area correction, the saturation branch becomes much flatter, allowing for a more straightforward determination of the proper current. The saturation current was taken as the average current between the lowest probe bias and one electron temperature below the floating potential. If this current is assumed to be the Bohm current, it can be used to determine ion number density:
pXe
eipsisi A
meT
enAcenI 61.061.0, == . (3)

The 31st International Electric Propulsion Conference, University of Michigan, USA
September 20 – 24, 2009
4
Figure 1. Comparison of the ion saturation branch of a Langmuir probe trace before and after correcting for sheath expansion effects using Sheridan's model. Note that after correction, the ion saturation region is much flatter.
However, in Hall thrusters the ion current towards the wall typically has a significant beam component that causes them to enter the sheath supersonically.2
., piisi AuenI⊥
=
If this occurs, the saturation current is dependent upon the beam velocity normal to the surface: (4) For a planar probe, the presence of ion beams can be detected and their energy estimated.12
Figure 2
Once the probe is biased sufficiently above the plasma potential, it will create a potential difference large enough to repel the ion beam. When this occurs, the ion beam forms a stagnation point within the sheath, generating a large space charge layer. This layer causes the sheath to expand and “bulge” out (see ), increasing the effective collection area of the probe, which manifests itself as a large increase in electron current. By detecting this increase in electron current, the normal ion beam energy may be estimated. This estimate was made by looking at the second derivative of the I-V characteristic (see Figure 3). A second peak can be detected above the plasma potential, whose maximum is taken as the location of the most probable normal ion energy: .ppeak VV −=⊥ε (5) The total ion energy can be estimated using the local plasma potential and assuming collisionless, electrostatic acceleration of ions from anode potential: ( ) .pcgdtotal VVV −−=ε (6) With the normal and total ion energies, the ion velocity direction with respect to thruster axis may be found:
.sin2
1
1
= ⊥−
totalεεθ (7)
It was found that after sheath expansion corrections, the calculated ion and electron densities were in excellent agreement.

The 31st International Electric Propulsion Conference, University of Michigan, USA
September 20 – 24, 2009
5
Probe
Ion BeamSheath
Boundary
Reflected Ion Beam
+ + + + + + + ++ + + + + + + +
ProbeProbeProbe
Ion BeamSheath
Boundary
Reflected Ion Beam
+ + + + + + + ++ + + + + + + +
ProbeProbe
Figure 2. Schematic showing the effects of an ion beam on a planar Langmuir probe. When the bias voltage becomes sufficiently high, the ion beam is repelled, causing the sheath to bulge out and expand.
Figure 3. Representative second derivative of a Langmuir probe I-V characteristic. The peak located above the plasma potential is an indication of an ion beam.
Electron energy distribution functions were calculated using the Druyvesteyn formula:14
( )
−=
2
221
2
22)(
bias
e
e
biasp
p
e
dVId
mVVe
AemEf
. (8)
The second derivative of a smoothed I-V characteristic was taken, and was used along with the plasma potential measurement to determine the local EEDF. It should be noted that integration of the above EEDF gives another calculation of plasma number density, and that an effective temperature can be calculated for the distribution, (2/3) <ε>, where <ε> is the average electron energy based on the EEDF (<ε> = ∫εf(ε)dε, where f(ε) is the normalized EEDF and the integral is taken from zero to infinity).
2. Probe Design
Since this particular study is a preparatory experiment for internal flush-mounted diagnostics, the probe design attempts to emulate such an environment in order to collect a representative data set. A 0.381-mm-diameter tungsten probe was fit through a 1.6-mm-diameter alumina tube. This assembly was then placed within a boron nitride tab such that the probe tip was flush with the tab surface (see Figure 4).

The 31st International Electric Propulsion Conference, University of Michigan, USA
September 20 – 24, 2009
6
6.4 mm
1.6 mm Ø
0.381 mm Ø
1.6 mm6.4 mm
Probe BN tabAlumina tube
6.4 mm
1.6 mm Ø
0.381 mm Ø
1.6 mm6.4 mm
Probe BN tabAlumina tube
Figure 4. Schematic drawing of flush-mounted Langmuir probe used in study. Note: note to scale.
The probe was then mounted onto the thruster face using a stainless steel mounting block and clamp, such that the flat portion of the tab lay adjacent to the outer wall exit plane. The final position of the probe was roughly 1.6 mm downstream of the exit plane and 1 mm radially away from the outer wall radius (plasma side, see Figure 5). It should be noted that this location is not completely representative of conditions at the channel walls, since directed ion energies will typically be higher while number densities and electron temperatures will be lower than those internal to the channel. However, this position was chosen because the magnetic field properties are representative of what can be found along the inner and outer channel walls, which was deemed more important due to its impact on the collected data.
Tab/probe Block/clampTab/probe Block/clamp
Tab/probe Block/clampTab/probe Block/clamp
Figure 5. Schematic of Langmuir probe placement with respect to the thruster body. Note: not to scale.
3. Data Acquisition
Probe current and voltage were collected and stored using a data acquisition system (DAQ) capable of a 500 kHz scan rate across all channels. Figure 6 shows a schematic of the measurement circuit used for the Langmuir probe. A function generator was connected to a bipolar power supply that supplied the desired voltage waveform to the probe. The current shunt was comprised of a single 100 Ω thin-film resistor, while the voltage divider used to measure the applied voltage was comprised of 8.18 MΩ and 0.24 MΩ thin-film resistors. The signals were isolated from the DAQ with voltage-following isolation amplifiers, each having a bandwidth of 20 kHz. Blocking diodes were placed in parallel with the current shunt in order to protect the isolation amplifier from large current spikes. The circuit was calibrated at DC prior to the study, and
Figure 6. Electrical diagram of Langmuir probe data collection circuit.
To DAQ (current) 100 Ω
Bipolar Power Supply
+ -
Function Generator
8.18 MΩ
0.24 MΩ To DAQ (voltage)
Langmuir Probe
Iso Amp
Iso Amp
Chamber wall

The 31st International Electric Propulsion Conference, University of Michigan, USA
September 20 – 24, 2009
7
displayed excellent linearity. The probe was biased using a symmetric triangle wave with a frequency of 20-30 Hz, well within the bandwidth of the isolation amplifiers. Each channel was scanned at 40-50 kHz, resulting in approximately 1000 points per I-V characteristic. Capacitive effects were characterized by taking data with no plasma present, and were subtracted out in post processing. Two hundred traces were taken at each operating condition and averaged before any data analysis was performed.
D. Emissive Probe While the single Langmuir probe offers the ability to measure several important plasma properties, its ability to
determine plasma potential accurately can be reduced substantially by non-ideal conditions. The presence of beams, magnetic fields, and significant plasma oscillations can all cause error in the determination of plasma potential.12 For this reason, an emissive probe was used as an additional measurement of plasma potential. The floating emissive probe has extensive heritage as a diagnostic for internal plasma potential measurements in Hall thrusters.11,
15, 16 Floating emissive probes rely on a hot filament to thermionically emit electrons, which raises the probe’s floating potential. As emission increases, the floating potential approaches the local plasma potential. However, space charge limitations on probe emission prevent the floating potential from properly reaching the plasma potential. This requires the use of a sheath model, which is dependent on the local electron temperature, to correct for space charge limitations. Thus, the floating emissive probe typically requires a Langmuir probe as a complementary diagnostic to measure plasma potential. Furthermore, uncertainties with the sheath model and its use in Hall thrusters create uncertainty in the measurement on the order of the local electron temperature.16
Since an independent measurement of plasma potential was desired, the swept emissive probe was utilized in this study. While this diagnostic is more time-consuming and difficult to implement than the floating emissive probe, the stationary nature of a near-wall probe allowed for its use with minimal added complexity. The swept emissive probe is run similarly to a Langmuir probe, except it has the ability to emit thermionic electrons. I-V characteristics are taken at various levels of electron emission; this emission shows up as increased ion current in the characteristic. However, once the probe is biased above the plasma potential, all emission should be reflected back to the probe surface, resulting in zero effective emission. Thus, the voltage at which all I-V characteristics begin to overlap is an accurate measurement of the local plasma potential.17
1. Probe Design
While this diagnostic is significantly more complex than the floating emissive probe, it allows for an independent, highly accurate measurement of plasma potential.
The emissive probe used in this study is based on the design primarily from Haas15 but augmented by Linnell and Reid.11, 16
Figure 7
A 0.127-mm-diameter filament made of 1% thoriated tungsten was placed within a 1.6-mm-diameter double-bored alumina tube. Thoriated tungsten was chosen as the filament material due to its higher emission capabilities; this translates to a lower operating temperature for the required emission currents, thus bringing the filament further away from its melting point. The filament was bent into a loop with a 0.5-mm radius of curvature, and brought into contact with 0.254-mm-diameter copper lead wires. Tungsten filler wires were then placed inside the tube to provide a tight fit between the filament and leads, as well as excellent electrical contact (see ). The probe was mounted to the thruster using a stainless steel block and clamp, similar to the Langmuir probe used in this study. The final position of the probe tip was approximately 1.4 mm from the outer wall radius, and 2.6 mm beyond the exit plane, which was within 1 mm of the location of the Langmuir probe.
1 mm
R 0.5 mm
Filament Fillers
Lead wires Probe body
1 mm
R 0.5 mm
Filament Fillers
Lead wires Probe body
Figure 7. Schematic drawing of emissive probe used in study. Note: note to scale.

The 31st International Electric Propulsion Conference, University of Michigan, USA
September 20 – 24, 2009
8
2. Data Acquisition Due to the nature of the swept emissive
probe, data were collected in a similar manner to the single Langmuir probe. Probe current and voltage were collected and stored using a data acquisition system (DAQ) that scanned each channel at 40 kHz. Figure 8 shows a schematic of the measurement circuit used for the swept emissive probe. The circuit was calibrated at DC prior to the study, and displayed excellent linearity. A floating power supply was used to provide the filament current required for thermionic emission. Current was slowly increased from zero while the filament was optically monitored. Once the probe showed noticeable signs of emission, I-V characteristics were taken at 2-3 different levels of emission current. A characteristic was taken at zero filament current as well. The probe was biased using a symmetric triangle wave with a frequency of 20 Hz, resulting in approximately 1000 points per I-V characteristic. The probe bias was applied in between a voltage divider placed in parallel with the filament. This voltage divider was comprised of two 215 Ω thin-film resistors, which was used to apply probe bias at the center of the filament where most emission should occur.17
III. Results
This was done to minimize uncertainties associated with the voltage drop across the filament. Capacitive effects were characterized by taking data with no plasma present, and were subtracted out in post processing. Furthermore, the voltage drop across the shunt was taken into account in data analysis when determining probe bias. While this correction is usually negligible, enough current was drawn by the probe to significantly affect a measurement that would otherwise have uncertainties of ~1-2 V. Two hundred traces were taken at each operating condition and averaged before any data analysis was performed.
Langmuir probe and emissive probe data were taken near the outer wall exit plane of a 6-kW Hall thruster over a wide range of discharge voltages and anode mass flow rates. Discharge voltages of 150 and 300 V, each at anode mass flow rates of 10, 20, and 30 mg/s, are presented, as well as 600 V and 10 mg/s. Emissive probe data at 300 V and 30 mg/s are not available due to probe failure at this operating condition. Since this study is in preparation for erosion and electron mobility investigations to be done inside the channel, properties relevant to these measurements will be presented here. In particular, plasma potential, as well as the sheath potential drop, incident ion current, density, beam energy, and EEDF measurements are discussed.
A. Plasma Potential The local plasma potential is an important measurement in this study, as it is necessary to determine the sheath
potential drop, to correct the ion saturation branch in Langmuir probe data using Sheridan’s model, to estimate the normal and total ion beam energies, and to determine the reference potential for the calculation of EEDFs. Due to its importance, the plasma potential was calculated using four methods. The line extrapolation and derivative methods for Langmuir probes, as well as the swept emissive probe, have already been discussed in Section II. The fourth method is to use the floating potential and shift it by an appropriate factor using the electron temperature:12
efp TVV ζ+=
. (9)
In simple Langmuir probe theory, ζ = 5.77 for xenon. While this is not the most robust method to determine plasma potential, it offers a rough estimate that can be compared to other measurements.
To DAQ (current) 100 Ω
Bipolar Power Supply
+ -
Function Generator
8.18 MΩ
0.24 MΩ To DAQ (voltage)
Floating Power Supply
Emissive Probe
215 Ω 215 Ω Iso Amp
Iso Amp
Chamber wall
Figure 8. Electrical diagram of the emissive probe data collection circuit.
The 31st International Electric Propulsion Conference, University of Michigan, USA
September 20 – 24, 2009
9
Figure 9 shows a typical result of the line extrapolation and derivative methods using Langmuir probe data taken at 300 V, 20 mg/s. These two methods usually agree with each other to within a volt for data taken in the far-field plume.18 However, it is evident from the figure that these two methods are not in good agreement, differing by approximately 30 V. Given the non-ideal environment of the interrogated region, it is not surprising to have such uncertainty in the plasma potential measurement of Langmuir probe data. This is further evidence of the need for a more robust, accurate determination of plasma potential, which is why the swept emissive probe was used. It should be noted that a distinct peak in the first derivative (or, equivalently, a zero in the second derivative) was usually not found, and in these cases the plasma potential was calculated by extrapolating the shape of the second derivative to its zero crossing.
Figure 9. Graphical comparison of the resulting plasma potentials from Langmuir probe data using two analysis methods. Differences between these methods ranged from 30 - 50 V, depending on operating condition.
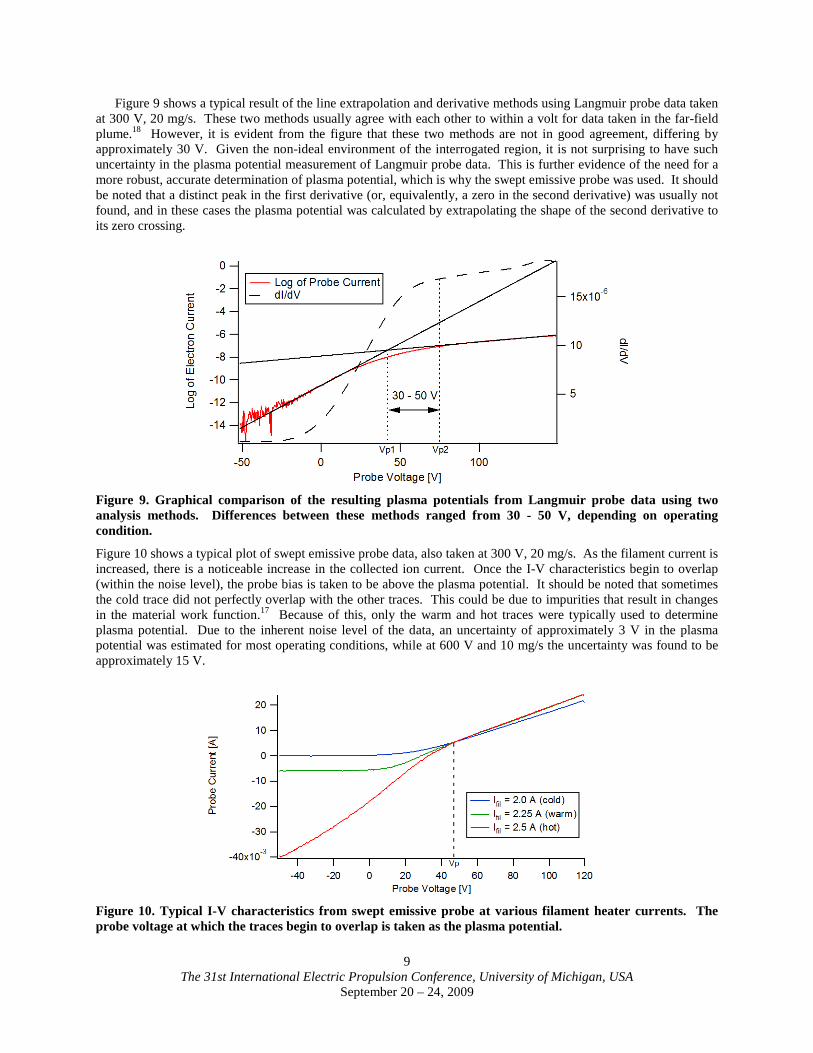
Figure 10 shows a typical plot of swept emissive probe data, also taken at 300 V, 20 mg/s. As the filament current is increased, there is a noticeable increase in the collected ion current. Once the I-V characteristics begin to overlap (within the noise level), the probe bias is taken to be above the plasma potential. It should be noted that sometimes the cold trace did not perfectly overlap with the other traces. This could be due to impurities that result in changes in the material work function.17 Because of this, only the warm and hot traces were typically used to determine plasma potential. Due to the inherent noise level of the data, an uncertainty of approximately 3 V in the plasma potential was estimated for most operating conditions, while at 600 V and 10 mg/s the uncertainty was found to be approximately 15 V.
Figure 10. Typical I-V characteristics from swept emissive probe at various filament heater currents. The probe voltage at which the traces begin to overlap is taken as the plasma potential.

The 31st International Electric Propulsion Conference, University of Michigan, USA
September 20 – 24, 2009
10
In order to compare this measurement with those from the Langmuir probe, the swept emissive probe data were corrected for the location difference between probes. While this location difference was kept within approximately 1 mm, this could create a potential difference of tens of volts if within the acceleration zone of the thruster. The location correction was done using the floating potential and electron temperature measured with the emissive probe at zero emission. Using Eq. (9) for both the Langmuir probe and emissive probe, while leaving ζ and Vp
( )2
1
2211
e
efpfp T
TVVVV −+=
for the Langmuir probe as variables, an estimate of the plasma potential at the location of the Langmuir probe could be calculated:
. (10)
In this equation, a subscript of “1” corresponds to the location of the Langmuir probe, while a subscript of “2” corresponds to the location of the emissive probe. Eq. (10) assumes that the two locations were close enough such that ζ was constant. Table 1 compares the four methods of determining plasma potential across all the operating conditions tested. Since the emissive probe is considered to be the most robust measurement of plasma potential, all other methods were compared to its data. On average, the linear extrapolation method had a relative difference of 49%, while the derivative method had a relative difference of only 12%. The shifted floating potential method had a relative difference of 13% when compared to the emissive probe data, making it comparable to the derivative method. When considering individual data sets, the derivative method was the most accurate method to determine plasma potential from Langmuir probe data, and will be used in subsequent Langmuir probe data analyses.
Table 1. Comparison of measured plasma potential using four measurement and analysis methods. Percent differences when compared to the corrected emissive probe data are given in parentheses.
Operating Condition
Corrected Emissive Probe Data [V]
Line Extrapolation Method [V]
Derivative Method [V]
Shifted Floating Potential Method [V]
150 V, 10 mg/s 63 34 (46%) 65 (4%) 55 (13%) 150 V, 20 mg/s 70 35 (50%) 65 (8%) 57 (19%) 150 V, 30 mg/s 63 34 (47%) 61 (3%) 48 (24%) 300 V, 10 mg/s 70 36 (49%) 88 (26%) 82 (16%) 300 V, 20 mg/s 84 42 (50%) 75 (11%) 76 (9%) 300 V, 30 mg/s N/A 44 83 82 600 V, 10 mg/s 154 71 (54%) 119 (23%) 154 (0%) Once the plasma potential was determined, the effective sheath potential drop between the plasma and the wall was found for each operating condition. The measured potential drop, Vp – Vf, was taken as the potential drop across the sheath on the adjacent boron nitride wall. While this assumption may be complicated by secondary electron emission (SEE) effects, kinetic simulations have shown that SEE may have little effect on the potential drop within the channel.19-21 Table 2 Thus, these effects will be neglected pending further analysis. shows this drop for all operating conditions tested, in units of volts and electron temperatures (only electron temperatures measured by the flush-mounted Langmuir probe were used).
Table 2. Calculated sheath potential drop, in units of volts and Te
Operating Condition
, for all operating conditions tested.
Sheath Potential [V]
Sheath Potential [Te
150 V, 10 mg/s ]
62 6.9 150 V, 20 mg/s 63 6.6 150 V, 30 mg/s 65 7.2 300 V, 10 mg/s 87 6.3 300 V, 20 mg/s 77 5.7 300 V, 30 mg/s 90 5.8 600 V, 10 mg/s 130 4.5
The 31st International Electric Propulsion Conference, University of Michigan, USA
September 20 – 24, 2009
11
It is evident from the table that as discharge voltage increases, the sheath potential drop, and thus the ion energy gained within the sheath, increases as well. This is expected based on the larger temperatures present at higher discharge voltages. However, when non-dimensionalizing the potential drop by the electron temperature, it is evident that the increase in potential drop is not as high as expected based on electron temperature alone, as the drop in units of Te
B. Incident Ion Properties
actually decreases with increasing discharge voltage. These trends will have important implications for the ion energy gained in the sheath and incident power deposition, which will be discussed in Section IV.
Langmuir probe data were taken at several operating conditions, and the ion saturation branch was used to determine incident ion current density and number density. Sheridan’s model13
Table 3
was used to correct for sheath expansion, and the resulting ion current as well as the measured normal ion energy were used to determine ion number density using Eq. (4). It should be noted that the normal ion beam energy is not available at 300 V and 10 mg/s since the probe voltage was not taken sufficiently high enough to detect it. Therefore, the saturation current was assumed to be equal to the Bohm current for this operating condition and the number density was found using Eq. (3). gives the results at all operating conditions tested.
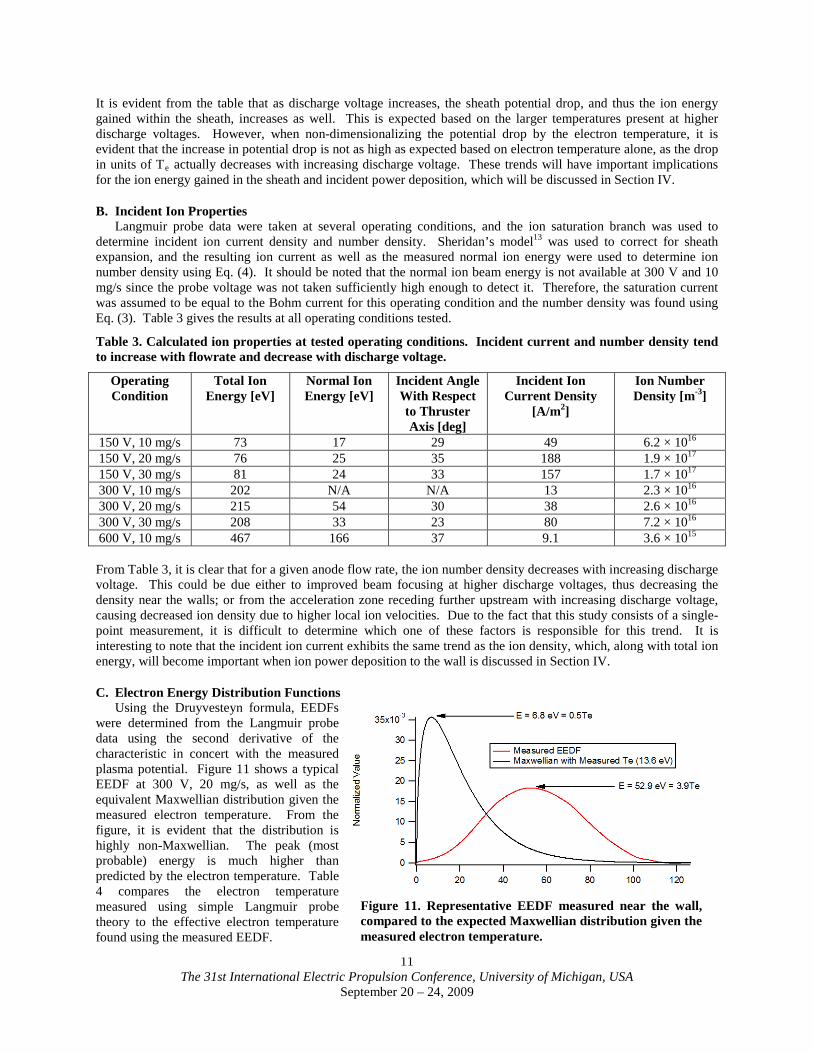
Table 3. Calculated ion properties at tested operating conditions. Incident current and number density tend to increase with flowrate and decrease with discharge voltage.
Operating Condition
Total Ion Energy [eV]
Normal Ion Energy [eV]
Incident Angle With Respect to Thruster Axis [deg]
Incident Ion Current Density
[A/m2
Ion Number Density [m
] -3
150 V, 10 mg/s
]
73 17 29 49 6.2 × 10150 V, 20 mg/s
16 76 25 35 188 1.9 × 10
150 V, 30 mg/s
17 81 24 33 157 1.7 × 10
300 V, 10 mg/s
17 202 N/A N/A 13 2.3 × 10
300 V, 20 mg/s
16
215 54 30 38 2.6 × 10300 V, 30 mg/s
16 208 33 23 80 7.2 × 10
600 V, 10 mg/s
16 467 166 37 9.1 3.6 × 10
15
From Table 3, it is clear that for a given anode flow rate, the ion number density decreases with increasing discharge voltage. This could be due either to improved beam focusing at higher discharge voltages, thus decreasing the density near the walls; or from the acceleration zone receding further upstream with increasing discharge voltage, causing decreased ion density due to higher local ion velocities. Due to the fact that this study consists of a single-point measurement, it is difficult to determine which one of these factors is responsible for this trend. It is interesting to note that the incident ion current exhibits the same trend as the ion density, which, along with total ion energy, will become important when ion power deposition to the wall is discussed in Section IV.
C. Electron Energy Distribution Functions Using the Druyvesteyn formula, EEDFs
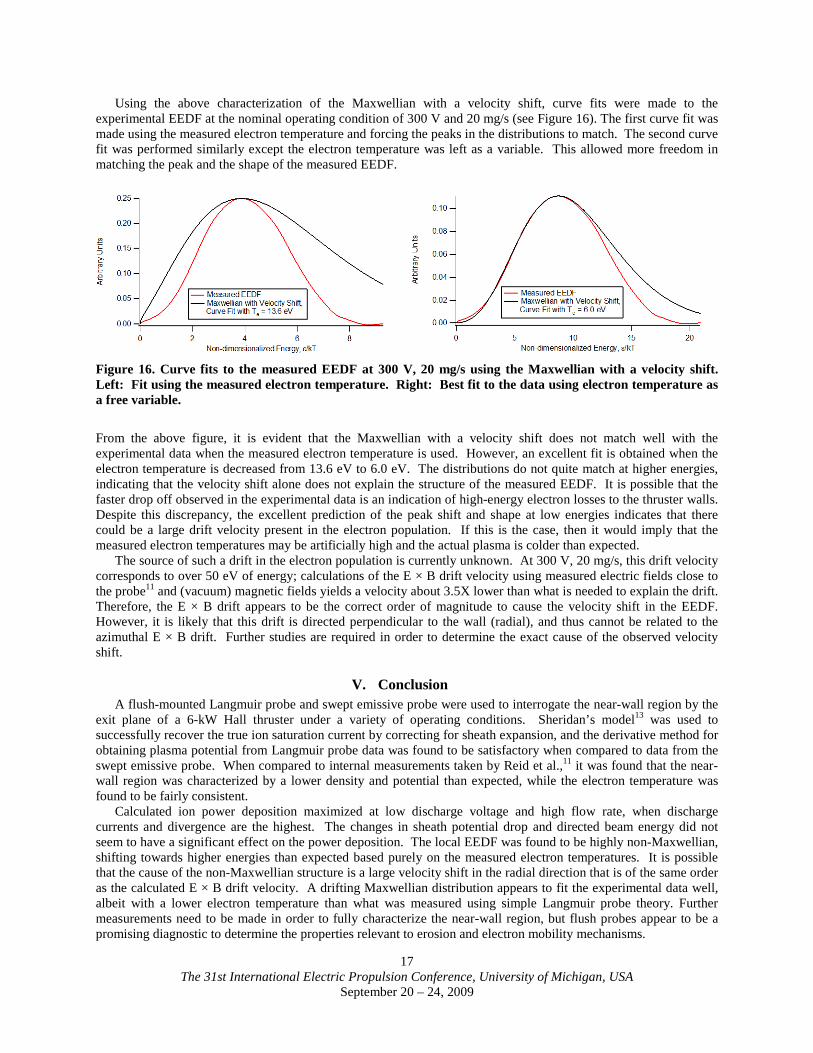
were determined from the Langmuir probe data using the second derivative of the characteristic in concert with the measured plasma potential. Figure 11 shows a typical EEDF at 300 V, 20 mg/s, as well as the equivalent Maxwellian distribution given the measured electron temperature. From the figure, it is evident that the distribution is highly non-Maxwellian. The peak (most probable) energy is much higher than predicted by the electron temperature. Table 4 compares the electron temperature measured using simple Langmuir probe theory to the effective electron temperature found using the measured EEDF.
Figure 11. Representative EEDF measured near the wall, compared to the expected Maxwellian distribution given the measured electron temperature.

The 31st International Electric Propulsion Conference, University of Michigan, USA
September 20 – 24, 2009
12
Table 4. Comparison of the measured electron temperature and calculated effective temperature based on the measured EEDF. Note that the effective temperature is approximately 3X higher than the measured temperature.
Operating Condition Te T [eV] e,eff150 V, 10 mg/s
[eV] 8.9 29
150 V, 20 mg/s 9.6 28 150 V, 30 mg/s 9.1 29 300 V, 10 mg/s 14 45 300 V, 20 mg/s 14 37 300 V, 30 mg/s 15 43 600 V, 10 mg/s 29 70
From Table 4, the effective electron temperature is roughly three times higher than the measured electron temperature. The reason for this discrepancy can be seen in Figure 12. The electron retarding branch of the Langmuir probe characteristic contains a linear region as well as a non-linear region. The linear region is indicative of, but not necessarily evidence of, a Maxwellian distribution. This linear region is the source of the measured electron temperature using simple Langmuir probe theory. However, this region does not continue all the way to the plasma potential as it would if the distribution were purely Maxwellian; less electron current is collected than expected based on the preceding Maxwellian distribution, shown by the extrapolation of the linear region. This indicates that a portion of the electron distribution may be Maxwellian described by the measured electron temperature, but the remaining distribution is not. Possible causes and implications of this non-Maxwellian distribution are discussed in more detail in Section IV.
Figure 12. Semi-log plot of electron current distinguishing sections of Maxwellian and non-Maxwellian electron collection. Extrapolation of the linear, Maxwellian region shows that less current is collected near the plasma potential than expected.
The electron energy distributions were also compared across discharge voltages and mass flow rates. Figure 13 shows the EEDFs at 10 mg/s and 150, 300, and 600 V, as well as at 300 V and 10, 20, and 30 mg/s. As expected, the overall distribution tends to get wider and the peak shifts towards higher energies as discharge voltage increases, but does not change significantly with flow rate. These trends are reflected in both the measured and effective electron temperatures.

The 31st International Electric Propulsion Conference, University of Michigan, USA
September 20 – 24, 2009
13
Figure 13. Comparison of EEDFs across operating conditions. Left: EEDF comparison at constant anode flow rate. Right: EEDF comparison at constant discharge voltage.
IV. Discussion Since this study was performed in preparation for internal measurements to aid understanding of erosion and
electron mobility mechanisms, quantities relevant to these phenomena are discussed here. In particular, incident ion power deposition to the wall is compared across operating conditions. Plasma properties are compared to internal data taken by Reid et al.11
A. Ion Power Deposition
in order to determine how the plasma discharge differs close to the wall. Finally, the structure of the local EEDF is discussed and implications are suggested.
Since erosion of the channel wall is directly related to the incident particle flux and energy, the ion power deposition is calculated and compared across all operating conditions tested. Simulations have shown that, depending on the position in the channel, a significant amount of the power deposition from ions can come from the ion beam energy.2
Table 5
Therefore, contributions from both the beam energy and sheath energy are included in the total power deposition density. The incident power per unit area from the sheath is simply the product of the ion current density and the sheath potential drop. Similarly, the incident power per unit area from the beam is the product of the beam energy (in eV) and the ion current density. gives these properties at each operating condition. It is worth noting that the measured power deposition densities are the same order of magnitude as the bulk power deposition found by Mazouffre et al. using thermal imaging techniques on a 5-kW Hall thruster.22
Table 5. Comparison of incident ion current density, incident ion beam energy, sheath potential drop, and calculated ion power deposition at all operating conditions tested. Note that changes in power deposition are dominated by changes in ion current density.
Operating Condition
Ion Current Density [A/m2
Incident Ion Energy [eV] ]
Sheath Potential Drop [V]
Power Deposition Density [W/m2
150 V, 10 mg/s ]
49 73 62 6.6 × 10150 V, 20 mg/s
3 188 76 63 2.6 × 10
150 V, 30 mg/s
4 157 81 65 2.3 × 10
300 V, 10 mg/s
4
13 202 87 3.7 × 10300 V, 20 mg/s
3 38 215 77 1.1 × 10
300 V, 30 mg/s
4
80 208 90 2.4 × 10600 V, 10 mg/s
4 9.1 467 130 5.4 × 10
3
While limited insight can be gained since measurements were taken at a single point, it is still evident from Table 5 that power deposition to the wall is maximized at low discharge voltages and high flow rates. This appears to be due mainly to the increased current density at the probe, possibly caused by larger beam divergences at lower discharge voltages. The trend in current density seems to dominate over any trends in sheath potential drop and incident ion beam energy, making anode flow rate, ionization efficiency, and beam divergence key factors in ion power deposition. Currently there is no clear trend between discharge power and the measured power deposition. However, conclusions cannot be drawn until a more complete spatial map of the incident ion density, energy, and power deposition is performed.

The 31st International Electric Propulsion Conference, University of Michigan, USA
September 20 – 24, 2009
14
B. Characterization of the Local Plasma Determining plasma properties close
to the channel wall and comparing them to properties closer to channel centerline is important in gaining insight into erosion and electron mobility phenomena. Plasma potential, electron temperature and ion number density are compared between this study and data taken by Reid et al.11 Internal measurements from Reid et al. are taken along the same magnetic field line as the Langmuir probe used in this study, and located at 10% the channel width (Lw Table 6) from the outer wall, the closest radial location interrogated in the study. shows the comparison at the nominal condition of 300 V and 20 mg/s. While there is relative agreement between the measured electron temperatures, Table 6 indicates a 34 V voltage drop between the two data sets, as well as a 98% reduction in number density. Due to the similarity in electron temperature, the Boltzmann equation was used to determine whether the plasma potential and number density trends were consistent:
=
eO Tnn φexp . (11)
Using an averaged electron temperature and the measured ion density ratio, the expected potential drop is 45 V, which is in reasonable agreement with the measured potential drop of ~ 34 V. This indicates that large density drops near the channel walls correlate to large radial potential drops, which are not as evident in data taken closer to the channel centerline.
C. Analysis of the Local EEDF Structure The local electron energy distribution function was measured using a flush-mounted Langmuir probe and the
Druyvesteyn formula over a wide range of discharge voltages and flow rates. It was found that the structure of the EEDF strongly deviated from a Maxwellian distribution given the measured electron temperature. In this section, three different distributions are derived and compared to the experimental data in order to determine a possible source of the non-Maxwellian nature of the EEDF. In particular, a Maxwellian distribution with an energy shift, a Maxwellian distribution with a velocity shift, and an anisotropic Maxwellian distribution are discussed below.
If a plasma initially with a Maxwellian distribution is subjected to a potential hill and remains collisionless, it will not re-thermalize and the distribution will contain an energy shift in the direction of the potential gradient. This scenario is possible close to the wall where the plasma density is low and radial electric fields are large. If the shift is in the z direction, then
( ) .222 vvv zzo
∆+= (12)
Since the number of particles with velocity vo should be the same as the number of particles with velocity v after the energy shift, and the number of particles is proportional to f(v)dv, then f(vo)dvo
( ) ( )( )( )
.2
exp2
exp2
),,(2
122
22222
3
zyx
z
zzyxzyxzyx dvdvdv
vv
vvvvkTm
kTvm
kTmdvdvdvvvvf
∆+
++−
∆−
=π
= f(v)dv in the z direction, and the velocity distribution function is
(13)
Converting to spherical coordinates and integrating over the angles gives the speed distribution function as
( ) ( )( ) .2
exp2
exp2
2)( 2122
2223
dCvvCkT
mCCkT
vmkT
mdCCf
∆−∆+
−
∆−
=π
π (14)
Given ε = ½mC2, and defining Δε = ½m(Δv)2
, the final energy distribution function becomes
At flush probe 10% Lw
Plasma Potential [V]
from outer wall
75 109 Electron Temperature [eV] 14 10 Ion Number Density [m-3 2.6 × 10] 1.1 × 10¹⁶
Table 6. Comparison of data taken near the wall to internal measurements taken by Reid et al.
18

The 31st International Electric Propulsion Conference, University of Michigan, USA
September 20 – 24, 2009
15
.exp11)(2
12
1
εεεεεεπ
εε dkTkTkTkT
df
∆−
∆+
∆+−= (15)
Electron movement can be highly complex due to the electromagnetic fields within a Hall thruster. One element of this movement is velocity drift of the guiding center of gyroscopic motion. If this drift velocity is assumed to be in the z direction, then the velocity distribution function can be written as
( ) .)(2
exp2
),( 2222
3
, zyxzyxzyxzyx dvdvdvvvvvkTm
kTmdvdvdvvvvf
∆+++−
=π
(16)
Converting to spherical coordinates and integrating over the angles gives the speed distribution:
.sinh2
exp2
)(exp2
2)(222
1
dCkT
vmCkT
mCCkT
vmkT
mv
dCCf
∆
−
∆−
∆=
π (17)
Given ε = ½mC2, and defining Δε = ½m(Δv)2
( ) .2sinhexp1)(2
121
εεεεεεπ
εε dkTkTkT
df
∆
∆+−
∆=
, the final energy distribution function becomes
(18)
Because electrons in the discharge typically gain energy from the axial electric field, the temperature normal to the magnetic fields lines is much higher than the temperature parallel to the lines, leading to strong anisotropy of the distribution function.19, 21
||,TT ζ=⊥
In order to keep a relatively simple analytical form while still investigating the effects of anisotropy, it is assumed that (19) where ζ is a proportionality constant. If the z direction is taken to be parallel to the magnetic field, then the velocity distribution function is
.2
)(2
exp22
),,(22
||
221
||zyx
yxzzyxzyx dvdvdv
kTvvm
kTmv
kTm
kTmdvdvdvvvvf
+−−
=
⊥⊥ππ (20)
Using Eq. (19) to eliminate the temperature normal to the field lines, the distribution function becomes
( ) .1112
exp2
1),,( 2222
||
23
||zyxzyxzzyxzyx dvdvdvvvvv
kTm
kTmdvdvdvvvvf
+++
−−
=
ζζπζ (21)
Converting to spherical coordinates and integrating over the angles gives the speed distribution as
( ) ,2
exp2
2)(||
22
23
||
dCerfTk
mCCkTmdCCf α
ζζα
−
= (22)
where α is defined as
−=ζ
α 112 ||
22
kTmC . (23)

The 31st International Electric Propulsion Conference, University of Michigan, USA
September 20 – 24, 2009
16
Given ε = ½mC2
.11exp1
11
1)(2
1
||||||2
1 εζ
εζε
ζζεε d
kTerf
TkkTdf
−
−
−
=
, the final energy distribution function becomes
(24)
Figure 14 compares the three derived distribution functions along with the Maxwellian distribution for reference. All distributions are normalized such that the integral over all energies is unity. For the Maxwellian distributions with energy and velocity shifts, Δε = 4kT, while for the anisotropic Maxwellian distribution ζ = 5 and T ||
Figure 11
= T. It is evident from the plot that the Maxwellian with a velocity shift most closely resembles the general structure of the measured EEDF shown in .
Figure 14. Comparison of various functions investigated as possible distributions of the local electron population near the wall. Note that the Maxwellian with a velocity shift appears to be the only distribution with similar structure to the measured EEDF.
In order to further investigate the structure of the Maxwellian with a velocity shift, the distribution is plotted and the location of the peak (the most probable energy) is calculated for several velocity shifts (see Figure 15). As the velocity shift increases, the peak in the distribution moves closer to the equivalent energy shift, and becomes effectively equal after Δε ≈ 1.5kT. Furthermore, the curvature at zero energy becomes more positive as the velocity shift increases, a feature that is present in the structure of the measured EEDFs.
Figure 15. Characterization of the Maxwellian distribution with a velocity shift. Left: Normalized distribution functions for various velocity shifts. Note the shift in peak and change in curvature at zero energy as the shift increases. Right: Most probable energy as a function of velocity shift. The most probable energy is the equivalent energy shift for shifts larger than ~ 1.5kT.
The 31st International Electric Propulsion Conference, University of Michigan, USA
September 20 – 24, 2009
17
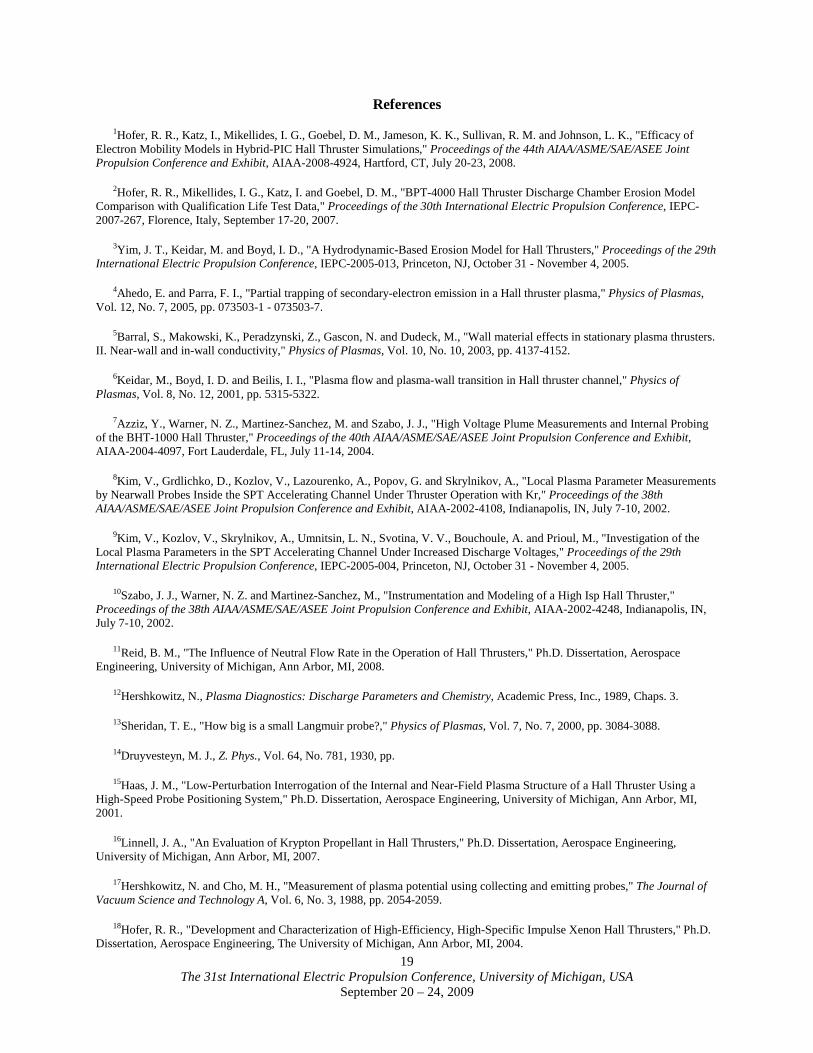
Using the above characterization of the Maxwellian with a velocity shift, curve fits were made to the experimental EEDF at the nominal operating condition of 300 V and 20 mg/s (see Figure 16). The first curve fit was made using the measured electron temperature and forcing the peaks in the distributions to match. The second curve fit was performed similarly except the electron temperature was left as a variable. This allowed more freedom in matching the peak and the shape of the measured EEDF.
Figure 16. Curve fits to the measured EEDF at 300 V, 20 mg/s using the Maxwellian with a velocity shift. Left: Fit using the measured electron temperature. Right: Best fit to the data using electron temperature as a free variable.
From the above figure, it is evident that the Maxwellian with a velocity shift does not match well with the experimental data when the measured electron temperature is used. However, an excellent fit is obtained when the electron temperature is decreased from 13.6 eV to 6.0 eV. The distributions do not quite match at higher energies, indicating that the velocity shift alone does not explain the structure of the measured EEDF. It is possible that the faster drop off observed in the experimental data is an indication of high-energy electron losses to the thruster walls. Despite this discrepancy, the excellent prediction of the peak shift and shape at low energies indicates that there could be a large drift velocity present in the electron population. If this is the case, then it would imply that the measured electron temperatures may be artificially high and the actual plasma is colder than expected. The source of such a drift in the electron population is currently unknown. At 300 V, 20 mg/s, this drift velocity corresponds to over 50 eV of energy; calculations of the E × B drift velocity using measured electric fields close to the probe11
V. Conclusion
and (vacuum) magnetic fields yields a velocity about 3.5X lower than what is needed to explain the drift. Therefore, the E × B drift appears to be the correct order of magnitude to cause the velocity shift in the EEDF. However, it is likely that this drift is directed perpendicular to the wall (radial), and thus cannot be related to the azimuthal E × B drift. Further studies are required in order to determine the exact cause of the observed velocity shift.
A flush-mounted Langmuir probe and swept emissive probe were used to interrogate the near-wall region by the exit plane of a 6-kW Hall thruster under a variety of operating conditions. Sheridan’s model13 was used to successfully recover the true ion saturation current by correcting for sheath expansion, and the derivative method for obtaining plasma potential from Langmuir probe data was found to be satisfactory when compared to data from the swept emissive probe. When compared to internal measurements taken by Reid et al.,11 it was found that the near-wall region was characterized by a lower density and potential than expected, while the electron temperature was found to be fairly consistent.
Calculated ion power deposition maximized at low discharge voltage and high flow rate, when discharge currents and divergence are the highest. The changes in sheath potential drop and directed beam energy did not seem to have a significant effect on the power deposition. The local EEDF was found to be highly non-Maxwellian, shifting towards higher energies than expected based purely on the measured electron temperatures. It is possible that the cause of the non-Maxwellian structure is a large velocity shift in the radial direction that is of the same order as the calculated E × B drift velocity. A drifting Maxwellian distribution appears to fit the experimental data well, albeit with a lower electron temperature than what was measured using simple Langmuir probe theory. Further measurements need to be made in order to fully characterize the near-wall region, but flush probes appear to be a promising diagnostic to determine the properties relevant to erosion and electron mobility mechanisms.

The 31st International Electric Propulsion Conference, University of Michigan, USA
September 20 – 24, 2009
18
Acknowledgments The authors would like to thank Drs. John Foster and Bryan Reid for fruitful discussion and invaluable input,
and David Huang for help in running the Hall thruster used in this study. The authors would also like to acknowledge and thank the Air Force Office of Scientific Research (AFOSR) for funding this research. Dr. Mitat Birkan is the Project Manager for Grant FA9550-06-1-0105. The lead author is supported under the Graduate Student Research Program through the National Aeronautics and Space Administration.
Portions of this research were carried out at the Jet Propulsion Laboratory, California Institute of Technology, under a contract with the National Aeronautics and Space Administration.
The 31st International Electric Propulsion Conference, University of Michigan, USA
September 20 – 24, 2009
19
References
1Hofer, R. R., Katz, I., Mikellides, I. G., Goebel, D. M., Jameson, K. K., Sullivan, R. M. and Johnson, L. K., "Efficacy of Electron Mobility Models in Hybrid-PIC Hall Thruster Simulations," Proceedings of the 44th AIAA/ASME/SAE/ASEE Joint Propulsion Conference and Exhibit, AIAA-2008-4924, Hartford, CT, July 20-23, 2008.
2Hofer, R. R., Mikellides, I. G., Katz, I. and Goebel, D. M., "BPT-4000 Hall Thruster Discharge Chamber Erosion Model Comparison with Qualification Life Test Data," Proceedings of the 30th International Electric Propulsion Conference, IEPC-2007-267, Florence, Italy, September 17-20, 2007.
3Yim, J. T., Keidar, M. and Boyd, I. D., "A Hydrodynamic-Based Erosion Model for Hall Thrusters," Proceedings of the 29th International Electric Propulsion Conference, IEPC-2005-013, Princeton, NJ, October 31 - November 4, 2005.
4Ahedo, E. and Parra, F. I., "Partial trapping of secondary-electron emission in a Hall thruster plasma," Physics of Plasmas, Vol. 12, No. 7, 2005, pp. 073503-1 - 073503-7.
5Barral, S., Makowski, K., Peradzynski, Z., Gascon, N. and Dudeck, M., "Wall material effects in stationary plasma thrusters. II. Near-wall and in-wall conductivity," Physics of Plasmas, Vol. 10, No. 10, 2003, pp. 4137-4152.
6Keidar, M., Boyd, I. D. and Beilis, I. I., "Plasma flow and plasma-wall transition in Hall thruster channel," Physics of Plasmas, Vol. 8, No. 12, 2001, pp. 5315-5322.
7Azziz, Y., Warner, N. Z., Martinez-Sanchez, M. and Szabo, J. J., "High Voltage Plume Measurements and Internal Probing of the BHT-1000 Hall Thruster," Proceedings of the 40th AIAA/ASME/SAE/ASEE Joint Propulsion Conference and Exhibit, AIAA-2004-4097, Fort Lauderdale, FL, July 11-14, 2004.
8Kim, V., Grdlichko, D., Kozlov, V., Lazourenko, A., Popov, G. and Skrylnikov, A., "Local Plasma Parameter Measurements by Nearwall Probes Inside the SPT Accelerating Channel Under Thruster Operation with Kr," Proceedings of the 38th AIAA/ASME/SAE/ASEE Joint Propulsion Conference and Exhibit, AIAA-2002-4108, Indianapolis, IN, July 7-10, 2002.
9Kim, V., Kozlov, V., Skrylnikov, A., Umnitsin, L. N., Svotina, V. V., Bouchoule, A. and Prioul, M., "Investigation of the Local Plasma Parameters in the SPT Accelerating Channel Under Increased Discharge Voltages," Proceedings of the 29th International Electric Propulsion Conference, IEPC-2005-004, Princeton, NJ, October 31 - November 4, 2005.
10Szabo, J. J., Warner, N. Z. and Martinez-Sanchez, M., "Instrumentation and Modeling of a High Isp Hall Thruster," Proceedings of the 38th AIAA/ASME/SAE/ASEE Joint Propulsion Conference and Exhibit, AIAA-2002-4248, Indianapolis, IN, July 7-10, 2002.
11Reid, B. M., "The Influence of Neutral Flow Rate in the Operation of Hall Thrusters," Ph.D. Dissertation, Aerospace Engineering, University of Michigan, Ann Arbor, MI, 2008.
12Hershkowitz, N., Plasma Diagnostics: Discharge Parameters and Chemistry, Academic Press, Inc., 1989, Chaps. 3.
13Sheridan, T. E., "How big is a small Langmuir probe?," Physics of Plasmas, Vol. 7, No. 7, 2000, pp. 3084-3088.
14Druyvesteyn, M. J., Z. Phys., Vol. 64, No. 781, 1930, pp.
15Haas, J. M., "Low-Perturbation Interrogation of the Internal and Near-Field Plasma Structure of a Hall Thruster Using a High-Speed Probe Positioning System," Ph.D. Dissertation, Aerospace Engineering, University of Michigan, Ann Arbor, MI, 2001.
16Linnell, J. A., "An Evaluation of Krypton Propellant in Hall Thrusters," Ph.D. Dissertation, Aerospace Engineering, University of Michigan, Ann Arbor, MI, 2007.
17Hershkowitz, N. and Cho, M. H., "Measurement of plasma potential using collecting and emitting probes," The Journal of Vacuum Science and Technology A, Vol. 6, No. 3, 1988, pp. 2054-2059.
18Hofer, R. R., "Development and Characterization of High-Efficiency, High-Specific Impulse Xenon Hall Thrusters," Ph.D. Dissertation, Aerospace Engineering, The University of Michigan, Ann Arbor, MI, 2004.

The 31st International Electric Propulsion Conference, University of Michigan, USA
September 20 – 24, 2009
20
19Sydorenko, D., Smolyakov, A., Kaganovich, I. and Raitses, Y., "Kinetic simulation of secondary electron emission effects in Hall thrusters," Physics of Plasmas, Vol. 13, No. 1, 2006, pp. 014501-1 - 014501-4.
20Sydorenko, D., Smolyakov, A., Kaganovich, I. and Raitses, Y., "Effects of non-Maxwellian electron velocity distribution function on two-stream instability in low-pressure discharges," Physics of Plasmas, Vol. 14, No. 1, 2007, pp. 013508-1 - 013508-8.
21Kaganovich, I., Raitses, Y., Sydorenko, D. and Smolyakov, A., "Kinetic effects in a Hall thruster discharge," Physics of Plasmas, Vol. 14, No. 5, 2007, pp. 057104-1 - 057104-11.
22
Mazouffre, S., Dannenmayer, K. and Perez-Luna, J., "Examination of plasma-wall interactions in Hall effect thrusters by means of calibrated thermal imaging," Journal of Applied Physics, Vol. 102, No. 2, 2007, pp. 023304-1 - 023304-10.