Embed Size (px)
Citation preview

BioOne sees sustainable scholarly publishing as an inherently collaborative enterprise connecting authors, nonprofit publishers, academic institutions, researchlibraries, and research funders in the common goal of maximizing access to critical research.
Near-Annual Fish Kills in Small Embayments: Casual vs. Causal FactorsAuthor(s): Allison Skinner McInnes and Antonietta QuiggSource: Journal of Coastal Research, Number 265:957-966. 2010.Published By: Coastal Education and Research FoundationDOI: http://dx.doi.org/10.2112/JCOASTRES-D-10-00006.1URL: http://www.bioone.org/doi/full/10.2112/JCOASTRES-D-10-00006.1
BioOne (www.bioone.org) is a nonprofit, online aggregation of core research in the biological, ecological, andenvironmental sciences. BioOne provides a sustainable online platform for over 170 journals and books publishedby nonprofit societies, associations, museums, institutions, and presses.
Your use of this PDF, the BioOne Web site, and all posted and associated content indicates your acceptance ofBioOne’s Terms of Use, available at www.bioone.org/page/terms_of_use.
Usage of BioOne content is strictly limited to personal, educational, and non-commercial use. Commercial inquiriesor rights and permissions requests should be directed to the individual publisher as copyright holder.

www.cerf-jcr.org
Near-Annual Fish Kills in Small Embayments: Casual vs.Causal Factors
Allison Skinner McInnes{ and Antonietta Quigg{{
{Department of OceanographyTexas A&M University3146 TAMUCollege Station, TX 77843, [email protected]
{Department of Marine BiologyTexas A&M University at Galveston5007 Avenue UGalveston, TX 77551, U.S.A.
ABSTRACT
McINNES, A.S. and QUIGG, A., 2010. Near-annual fish kills in small embayments: casual vs. causal factors. Journal ofCoastal Research, 26(5), 957–966. West Palm Beach (Florida), ISSN 0749-0208.
Fish kills are reported throughout the nation and a great deal of research is conducted in an attempt to determine thecause of these mortality events. Low dissolved oxygen concentrations, eutrophication, and/or harmful algal blooms aremost commonly cited as causative factors. Lake Madeline and Offatt’s Bayou on Texas’ upper coast have low mixingenvironments due to their relatively small areal size, deep basins, small tidal inlets, and restricted exchange with thenearby Galveston Bay estuary complex. These physical attributes, along with near annual fish kills, make them an idealstudy area for understanding the causes and effects of hypoxia and phytoplankton blooms on fish kills. We measuredphysical, chemical, and biological parameters twice weekly over the course of two summers. Fortuitously, a fish killoccurred in the summer of 2005 but not in 2006, which allowed us to narrow down the likely contributing factors that ledto the kill, consisting of .10,000 Brevoortia partonus (Gulf menhaden). Large amounts of detritus from a cyanobacterialbloom, in conjunction with the strong stratification and hypoxic bottom waters, led to the fish mortality event in 2005.While the system was also stratified during the summer of 2006, chlorophyll and phaeophytin concentrations were 15-fold lower and no fish kill was observed. The combination of factors that led to the observed fish kill demonstrates theimportance of interdisciplinary approaches to investigating the causes of ecological disturbances.
ADDITIONAL INDEX WORDS: Fish kill, cyanobacteria, hypoxia, Texas estuaries, stratification, Gulf menhaden(Brevoortia patronus).
INTRODUCTION
Fish kills are reported throughout the nation and much
research is conducted in an attempt to determine the cause of
these mortality events. The most common causes cited are low
dissolved oxygen (DO) concentrations (hypoxic waters,
,2 mg L21), eutrophication, harmful algal blooms (HABs),
and/or a combination of these factors (Diaz and Rosenberg,
1995; Graneli and Turner, 2006; Lowe et al., 1991; Reynolds-
Fleming and Luettich, 2004; Thronson and Quigg, 2008).
Beyond the obvious loss, large-scale fish kills are indications of
serious ecological disturbances. They are an apparent sign that
conditions within the affected water body have deteriorated to
such a degree that fish life is no longer supported. The
occurrence of a fish kill often affects other trophic levels,
resulting in mass ecosystem dysfunction, public health risk(s),
and in some cases, economic losses.
Hypoxic conditions are commonly reported as the primary
cause of fish kills. Many organisms are unable to cope with the
physiological stress associated with depleted oxygen conditions
(Eby et al., 2005; Ritter and Montagna, 1999; Thronson and
Quigg, 2008; Wannamaker and Rice, 2000). Hypoxia in
estuarine systems has been linked to water column stratifica-
tion (Paerl et al., 1998), with low DO concentrations typically
confined to deeper waters below the pycnocline, leaving the
waters above this density gradient well mixed and oxygenated.
The upper water column serves as a refuge for mobile fauna.
Hypoxia alone as a cause of mass mortality events of mobile
species seems unlikely. Reynolds-Fleming and Luettich (2004)
offered a possible mechanism to account for the death of pelagic
fishes due to hypoxic water, that is, one of wind-driven lateral
upwelling and downwelling. This mechanism was observed in
the Neuse River estuary, North Carolina, U.S.A. The sudden
inundation of hypoxic water to the refuge at the surface
trapped mobile fauna, leading to sufficient stress as to cause a
mass mortality event.
Eutrophication begins with an increase in nutrients and
dissolved organic matter loading, which leads to increases in
detritus throughout the water column. This detritus typically
originates from bacteria, phytoplankton, and zooplankton.
After an algal bloom, the amount of detritus may be of such
high concentrations that it cannot be diluted by the system’s
natural mechanisms (Paerl, 1996; Quigg et al., 2009). As excess
detritus sinks, it is degraded by bacteria; this degradation
process is the primary culprit in the depletion of DO in the water
column. Unless DO is resupplied by physical mixing processes,
this breakdown of detritus often leads to hypoxia and/or anoxia
(Gray, Wu, and Or, 2002; Wassmann and Olli, 2004).
DOI: 10.2112/JCOASTRES-D-10-00006.1 received 11 January 2010;accepted in revision 15 May 2010.Published Pre-print online 11 August 2010.’ Coastal Education & Research Foundation 2010
Journal of Coastal Research 26 5 957–966 West Palm Beach, Florida September 2010
Harmful algal blooms are those that cause a variety of
deleterious effects on aquatic ecosystems, including negative
aesthetic effects such as beach fouling and poisoning of various
organisms (Smayda, 1997). Direct effects include oxygen
depletion, nonchemical effects (clogging of fish gills, leading
to suffocation and oxygen starvation), and chemical effects
(from toxin producing species), which can all lead to fish kills
(Graneli and Turner, 2006; Smayda, 1997). HABs are typically
associated with toxin producing phytoplankton. The most
commonly reported effects are paralytic, diarrhetic, amnesic,
and neurotoxic shellfish poisoning (Graneli and Turner, 2006).
Such toxicity can cause shellfish intoxication (leading to
human fatalities) as well as vectoral intoxication (whereby
toxins are accumulated and transported through pelagic food
webs). The most common and well known culprits involved in
fish kills are the dinoflagellates Gambierdiscus toxicus,
Prorocentrum sp., Ostreopsis sp., Karenia brevis, Alexandrium
sp., and Pfiesteria sp. (Burkholder et al., 1992; Graneli and
Turner, 2006; Wassmann and Olli, 2004). Prymnesium par-
vum, a golden alga, produces toxins responsible for massive
fish and bivalve deaths in brackish water, particularly in Texas
(Roelke et al., 2007). Of the cyanobacteria, Microcystis spp. are
most commonly associated with human and livestock poisoning
as well as fish kills. Under optimal conditions (such as high
light, warm waters, and calm weather, usually in summer),
Microcystis spp. and other cyanobacteria form blooms that are
so dense they appear to form a mat on the surface of the water
(Graneli and Turner, 2006; Paerl, 1996). These blooms,
regardless of the phytoplankton species responsible, affect
water quality and human health.
A study conducted by the U.S. National Oceanic and
Atmospheric Administration (NOAA) compiled the causes
and locations of reported fish kills in the United States (Lowe
et al., 1991). Of the 22 coastal states in the United States, Texas
was ranked highly, not only for having the greatest number of
recorded fish kills, but also for total fish killed (Lowe et al.,
1991). In a study of 4500 fish kill records reported in Texas from
1951 to 2006, the majority of deaths were found to have
occurred in Galveston County, reporting approximately 141
million dead fish (Thronson and Quigg, 2008). A recent meta-
analysis of the Pollution Response Inventory and Species
Mortality (PRISM) database found that in Texas bays, the
majority of fish kills (57%) over a 55-year period were caused by
low levels of DO, while biotoxins such as those produced by
HABs accounted for 7% of deaths and temperature, typically
cold snaps, caused 13% of kills (Thronson and Quigg, 2008).
In many bays and bayous found in Galveston Bay, fish kills
occur annually. Bayous appear to be particularly susceptible
given their inherent sluggish nature and long water residence
times. Fish kill events in Dickinson Bayou (south of Houston,
Texas) are often observed, primarily associated with phyto-
plankton blooms and low water column DO, particularly in the
summer (Quigg et al., 2009). The fish most often affected is
Brevoortia patronus (Gulf menhaden). In the majority of
situations, however, studies are conducted after a fish kill
event, rather than before or during an event—leaving
scientists and resource managers to speculate and surmise on
the events and causal factors that were important in each fish
kill event.
Lake Madeline and the adjoining Offatt’s Bayou (LMOB;
Figure 1) are located in the lower portion of Galveston Bay
(south of Houston, Texas) as an embayment in Galveston
Island (population 57,247 according to the 2000 Census).
Although fish kills have been documented in these waterways
since the early 1960s, the causes remain largely unknown. Like
other bayous, LMOB provides an important habitat for many
finfish and shellfish. Offatt’s Bayou is, however, unique in that
it also serves as an important recreational area for nearby
residents and visitors. In this study we tested the hypothesis
that low DO concentrations are the primary causative factor of
the fish kills occurring during the late summer months in
LMOB. To test this hypothesis, a combination of physical,
chemical, and biological parameters were measured over the
course of two summers (2005 and 2006). The low mixing
environment of LMOB, because of its relatively deep basin,
small tidal inlet, and its restricted exchange with nearby
Galveston Bay estuary, made it an ideal study area for
understanding the causes and effects of hypoxia and phyto-
plankton blooms, both of which are thought to be significant
factors in the near annual fish kills observed in this system.
METHODS
Study Site
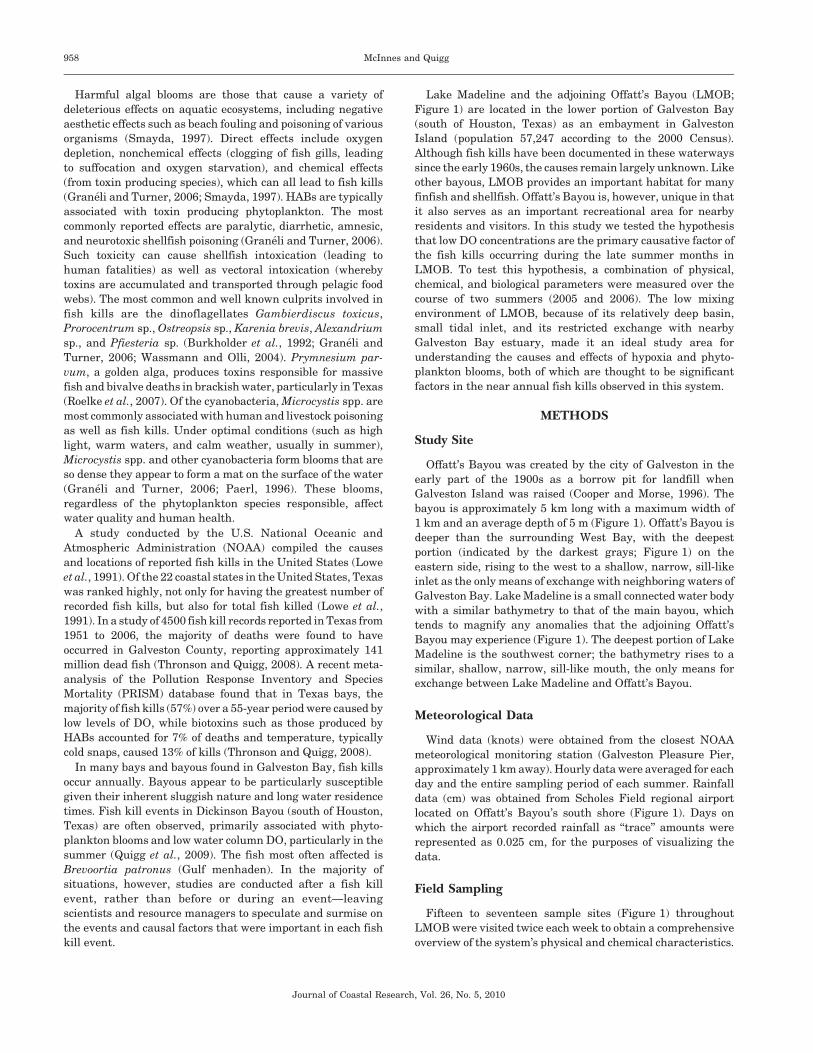
Offatt’s Bayou was created by the city of Galveston in the
early part of the 1900s as a borrow pit for landfill when
Galveston Island was raised (Cooper and Morse, 1996). The
bayou is approximately 5 km long with a maximum width of
1 km and an average depth of 5 m (Figure 1). Offatt’s Bayou is
deeper than the surrounding West Bay, with the deepest
portion (indicated by the darkest grays; Figure 1) on the
eastern side, rising to the west to a shallow, narrow, sill-like
inlet as the only means of exchange with neighboring waters of
Galveston Bay. Lake Madeline is a small connected water body
with a similar bathymetry to that of the main bayou, which
tends to magnify any anomalies that the adjoining Offatt’s
Bayou may experience (Figure 1). The deepest portion of Lake
Madeline is the southwest corner; the bathymetry rises to a
similar, shallow, narrow, sill-like mouth, the only means for
exchange between Lake Madeline and Offatt’s Bayou.
Meteorological Data
Wind data (knots) were obtained from the closest NOAA
meteorological monitoring station (Galveston Pleasure Pier,
approximately 1 km away). Hourly data were averaged for each
day and the entire sampling period of each summer. Rainfall
data (cm) was obtained from Scholes Field regional airport
located on Offatt’s Bayou’s south shore (Figure 1). Days on
which the airport recorded rainfall as ‘‘trace’’ amounts were
represented as 0.025 cm, for the purposes of visualizing the
data.
Field Sampling
Fifteen to seventeen sample sites (Figure 1) throughout
LMOB were visited twice each week to obtain a comprehensive
overview of the system’s physical and chemical characteristics.
958 McInnes and Quigg
Journal of Coastal Research, Vol. 26, No. 5, 2010
All trips were conducted between CST 0800–1200 hours unless
weather conditions did not permit. A Seabird 19 SBE
Conductivity Temperature and Depth instrument (CTD) was
used to measure water column profiles of temperature (uC),
salinity, and DO concentrations (mg L21). The CTD data were
downloaded and converted from binary code to ASCII format
using SBE software. These data were further processed by bin-
averaging pressure for every 0.25 m; this format was used in all
calculations and plots in subsequent postprocessing. Surface
water samples were collected (0–0.3 m) and immediately stored
on ice. Plankton tows (67 mm net) in surface waters were
transferred to 50-mL centrifuge tubes and stored on ice.
Plankton tows were collected from random, high turbidity
sites in 2005, but from predefined sites in 2006 (Stations 3, 4, 7,
10, 14, and 17; Figure 1). In 2006, additional samples were
collected when turbidity was high or other interesting
phenomena were observed.
Laboratory Measurements
Water samples were filtered onto 25-mm Whatman GF/F
filters and frozen immediately (220uC). Chlorophyll a (chl a)
and phaeophytin a (phae a) concentrations were measured
using a Turner 10-AU fluorometer. Calibration and measure-
ment techniques were performed according to Arar and Collins
(1997) with some modifications. Filters were extracted with a
50/50 solution of 90% acetone/DMSO and kept overnight in the
dark at 4uC. Filters were removed and samples centrifuged for
5 min to pellet any particulates. After measuring the initial
fluorescence, samples were acidified with 10% HCl and the
fluorescence was measured a second time.
Phytoplankton Identification
Plankton samples were preserved with formalin (final
solution 3%) and kept in a dark, cool place. Phytoplankton
Figure 1. Lake Madeline and Offatt’s Bayou (LMOB) with sites and bathymetry; squares indicate sites sampled both summers (2005 and 2006), circles
indicate sites sampled only in 2006. Darker gray indicates deeper portions while lighter grays represent shallow areas.
Near-Annual Fish Kills 959
Journal of Coastal Research, Vol. 26, No. 5, 2010
were identified to genus level using Tomas (1997). Preserved
plankton tows were allowed to settle before being examined. All
phytoplankton were identified to genus level; ,1% of phyto-
plankton could not be successfully identified. Simpson’s
diversity index and the Shannon index were calculated for
each sampling trip as well as for each summer.
Hypoxia Ratio
To estimate the extent of water column hypoxia at each
sampling site on each sampling trip, we calculated a hypoxia
ratio using the following equation:
Depth of water column { depth in water where hypoxiað
beganÞ=depth of water column:
The depth in water column where hypoxia began is defined by
the depth at which DO was ,2 mg L21. Ratios closer to 0
indicate less or no hypoxia while those nearer to 1 indicate
more hypoxia.
RESULTS
A fish kill was observed on August 26, 2005 (Julian Day 238)
in LMOB. Because of its proximity to campus (,5 min), we
were able to begin sampling while the kill was progressing. The
mortality event consisted of .10,000 fish confined predomi-
nately to Lake Madeline and the channel leading to Offatt’s
Bayou; however, no dead fish were found in Offatt’s Bayou.
This kill consisted of only Brevoortia partonus (Gulf Menha-
den), primarily fingerlings, approximately 6.5 cm in length.
The fish dying in the channel were older and/or larger (, 26 cm)
than those observed in Lake Madeline and not as abundant.
Fish were not collected for laboratory examination; however, a
visual inspection of the fish in the field revealed no external
lesions. While we arrived at LMOB midmorning of the fish kill
event, it was apparent that the fish kill had proceeded for some
time. Based on our observations and in discussions with LMOB
residents, the fish kill continued well into that evening (G.T.
Rowe, TAMUG, pers. comm.).
Meteorological Data
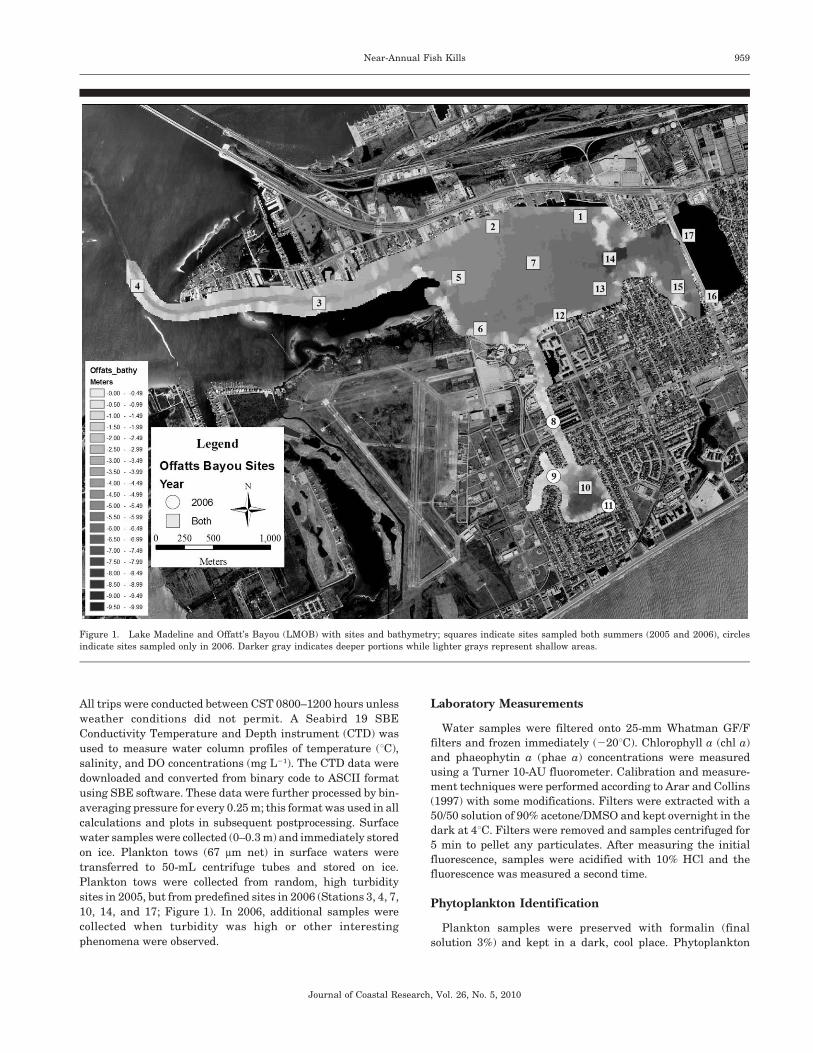
Rainfall was greater in 2006 than 2005 (Figures 2A and B);
total rainfall for the 2005 study period was 4.34 cm, in 2006
there was three times more rain (13.5 cm). Sporadic drizzles
were common in 2005 (Figure 2A) but uncommon in 2006.
Rainfall events in 2006 generally consisted of a more
significant amount of rain (.2 cm; Figure 2B); such episodes
were not observed in 2005.
The prevailing wind direction during both summers was
from the south-southeast (162u); from the south to the north
Figure 2. Daily average precipitation (cm) for (A) 2005 and(B) 2006 and daily average wind speeds (knots) for (C) 2005 and (D) 2006; daily averages for wind
speed are indicated by the solid black line; the dashed line shows the average wind speed for the study period.
960 McInnes and Quigg
Journal of Coastal Research, Vol. 26, No. 5, 2010
shore of the basin. The primary inlet for exchange with
Galveston Bay is on the western edge; thus the prevailing wind
direction is not likely to assist in exchange with nearby waters.
During the summer of 2005, daily averaged (July 21–August 30;
n 5 41) wind speeds ranged from 2.11 to 6.5 knots (Figure 2C).
On most days (n 5 27), wind speeds were 61.17 knots from the
average wind speed of 3.85 knots. The day of the fish kill was
preceded by several days of low wind (,3 knots). Such a
prolonged period of low average wind speeds was not observed
in 2006 (Figure 2D). Instead, daily averaged wind speeds
during the summer of 2006 (July 27–September 5; n 5 41)
ranged from 2.75 to 9.3 knots and were characteristically faster
on average, 4.92 6 1.58 knots (Figure 2D). On five occasions in
2006, wind speeds were .7 knots (Figure 2D), a daily average
wind speed not attained at all in the summer of 2005.
Physical and Chemical Parameters
Water temperature in the summer of 2005 ranged from
23.6uC to 39.9uC for the entire water column, with an average
temperature of 30.5uC 6 1.18uC (n 5 2631). The average
surface temperature (top 1 m) for the summer of 2005 was
31.5uC 6 1.14uC (n 5 302). The warmest day in 2005 was the
day of the observed fish kill, but it was not appreciably warmer
than other days at any point in the study. Water temperature
in the summer of 2006 ranged from 20.4uC to 32.3uC and had an
average temperature of 29.8uC 61.76uC (n 5 2969). The
average surface temperature (top 1 m) for the summer of
2006 was 30.5uC 6 0.69uC (n 5 369). Figures 3A and D clearly
show that water temperatures did not vary considerably from
one summer to the next.
Salinities during both summers were indicative of the
estuarine nature of LMOB. Water column salinities in 2005
ranged from 23.2 to 47.6 but did not vary substantially from the
mean of 30 6 1.61 (n 5 2631; Figure 3B). Average surface
salinity (top 1 m) in the summer of 2005 (29.2 6 1.81; n 5 302)
was close to the mean. Salinities were more variable in 2006,
with a range of 3.7 to 30.4; however, few values were less than
20. The water column average salinity for the summer of 2006
was 25.6 6 2.59 (n 5 2969) with a surface (top 1 m) average
salinity of 24.6 6 2.48 (n 5 369). Generally lower salinities in
2006 coincide with the greater rainfall that year and with wind
driven mixing events (Figure 2).
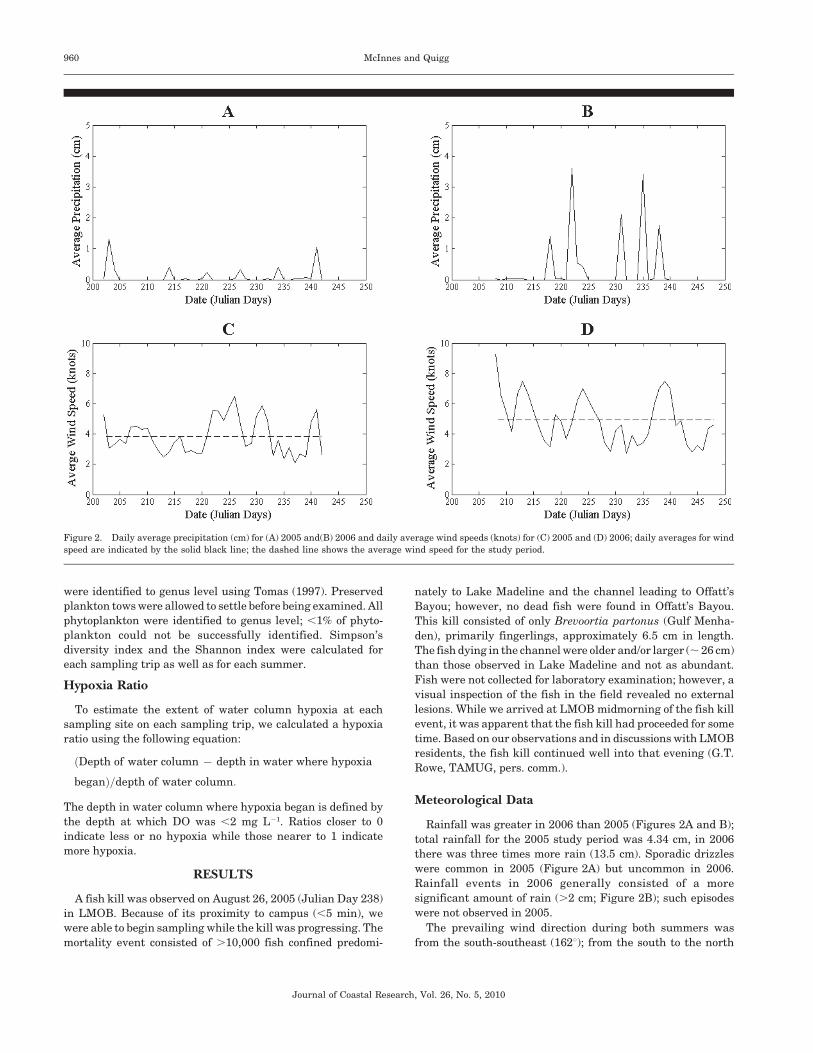
Bottom waters throughout LMOB are generally hypoxic
(Figure 3; Table 1). During the summer of 2005, DO through-
out the water column ranged from 0 to 10.6 mg L21, with an
average concentration of 2.9 6 2.36 mg L21 (n 5 2631). Surface
(top 1 m) DO concentrations remained relatively high (5.27 6
1.67 mg L21; n 5 302; Figure 3). During the summer of 2006
recorded average water column DO concentrations (Figure 3F)
were lower than those measured in 2005 (Figure 3C). The
average for the entire water column throughout the summer of
2006 was 2.32 6 2.3 mg L21 (n 5 2969), and the average surface
(top 1 m) concentrations were 3.88 6 2.24 mg L21 (n 5 369) in
2006. The basin did have a greater range of DO concentrations
during the summer of 2006, which was 0–16.5 mg L21
(Figure 3). The higher range of DO concentrations
(.10 mg L21) corresponds to the surface waters on days of
higher wind mixing.
By calculating a hypoxia ratio (Table 1), we were able to look
at trends in oxygen profiles across LMOB. In general, Stations
3 and 4, located at the opening of Offatt’s Bayou, experienced
Figure 3. DO (mg L21), temperature (uC), and salinity water column profiles for Offatt’s Bayou (top) and Lake Madeline (bottom). Black lines show the water
column measured on August 26, 2005 (the day of the fish kill), gray lines show 6 1 SD from the mean calculated from both years.
Near-Annual Fish Kills 961
Journal of Coastal Research, Vol. 26, No. 5, 2010

little or no hypoxia (ratio close to zero) because of tidal
exchange. In the most restricted corners of Offatt’s Bayou
(Stations 16 and 17) and in Lake Madeline (Stations 9, 10, and
11), the hypoxia ratio indicated that water column DO was low
and hypoxic conditions were present (ratio close to 1). Station
14, also known locally as the ‘‘black hole’’ for its year-round
hypoxic conditions, had hypoxic ratios between 0.43 and 0.68 in
2005 and 0.45 and 0.92 in 2006 (Table 1), which is consistent
with hypoxic water extending almost to the surface of the water
column. Hypoxia ratios for August 26, 2005, the day of the
observed fish kill, show the most restricted water column—
with hypoxia ratios for most stations higher than the sampling
effort either before or after (Table 1).
Based on water column DO profiles (Figure 3) and hypoxia
ratios (Table 1), there was greater overall bottom water
hypoxia late in the summer of 2005, which corresponded to
the shallowing of the pycnocline aligning with prolonged
periods of low wind mixing and small amounts of rainfall
(Figure 2). Conversely, during the summer of 2006, the year
without a fish kill, the water column was found to generally be
more hypoxic, with hypoxia ratios typically greater than 0.53,
especially in the more restricted parts of LMOB, and
particularly, Lake Madeline (Table 1). Because of the degree
of hypoxia below the pycnocline, the intermittent episodes of
degradation of the pycnocline from high wind forcing and
rainfall during the summer of 2006 resulted in hypoxic waters
reaching higher into the water column (Table 1).
The average surface water column temperatures, salinities,
and DO did not vary markedly from one summer to the next
(Figure 3), and the water column profiles of temperature and
DO indicate that the water column was generally well
stratified. A greater fraction of the water column was
oxygenated in 2005 than in 2006 (above 2.5 m compared with
above 1.5 m; Figure 3) in most parts of LMOB. At times of high
wind forcing and rainfall (Figure 2), the strong pycnocline was
broken in LMOB, resulting in mixing between surface and
bottom waters. This was observed in 2006 but not in 2005
(Figure 2; Table 1).
Biological Parameters
Chlorophyll a and Phaeophytin a Concentrations
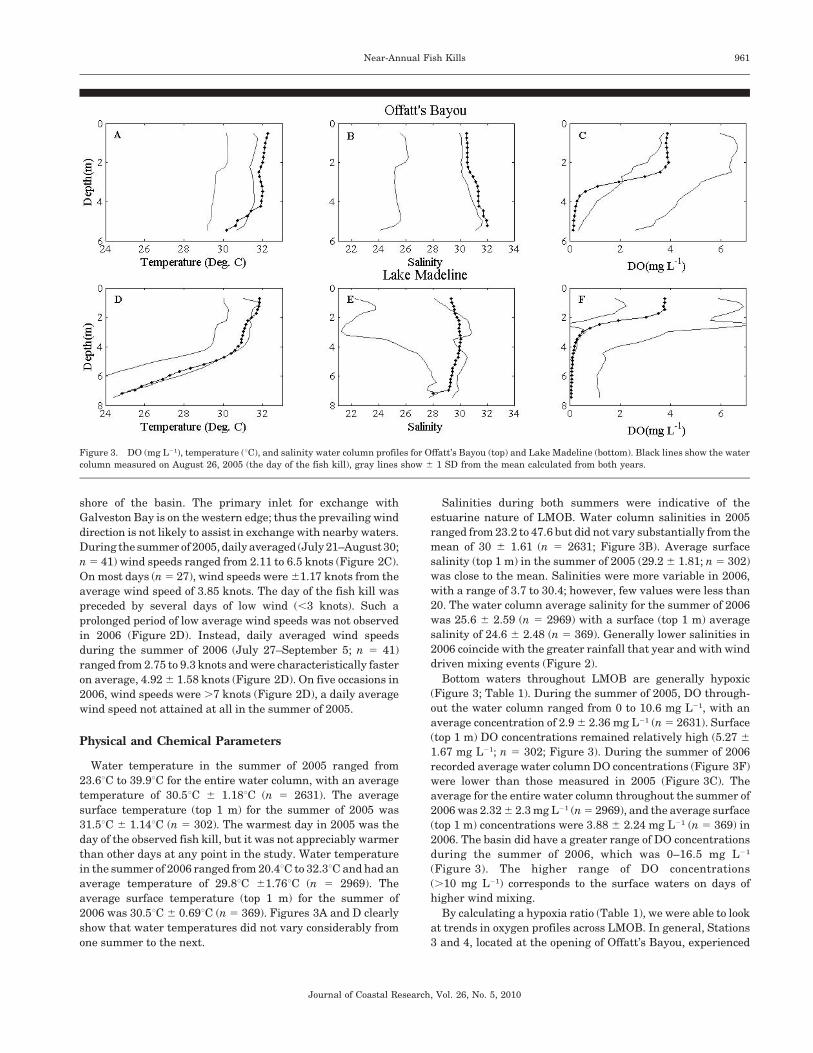
Low concentrations of chl a (,15 mg L21) and phae a
(,7 mg L21) were measured in LMOB in the summer of 2006
(Figures 4B and D). This was in contrast to the very high
Table 1. Hypoxia ratio calculated for each station visited in the summers of 2005 and 2006. Numbers closer to 0 indicate less hypoxia, numbers near 1
indicate more hypoxia, dash (—) indicate stations where no data was collected for that date.
Julian
Date
21-
Jul
25-
Jul
27-
Jul
28-
Jul
31-
Jul
1-
Aug
3-
Aug
7-
Aug
10-
Aug
11-
Aug
15-
Aug
17-
Aug
19-
Aug
22-
Aug
24-
Aug
26-
Aug
30-
Aug
31-
Aug
5-
Sep
202 206 208 209 212 213 215 219 222 223 227 229 231 234 236 238 242 243 248
2005 1 0.32 0.29 0.42 0.71 0.01 0.25 0.17 0.46 —
2 0.26 0.23 0.42 0.88 0 0.17 0 0.35 0.25
3 0 0 0.33 0.13 0 — 0 0.29 0.45
4 0 0 0 0 0 0 0 0 0
5 0 0.14 0.2 0.36 0 — 0.05 0.45 0.09
6 0.29 0.39 0.09 0.26 0.2 — 0.4 0.28 0.04
7 0.19 0.29 — 0.25 0.09 0.23 0.17 — —
8 — — — — — — — 0.4 —
9 — — — — — — — — —
10 0.69 0.48 0.55 0.73 0.52 — 0.52 0.7 0.79
11 0.81 — 0.36 — 0 — 0.45 0.25 —
12 0.3 0.33 0.27 0 0.22 0.22 0.36 0.67 0.44
13 — 0.56 0.31 0.33 0.13 0.37 0.33 0.56 0.35
14 0.54 0.68 0.51 0.55 0.47 0.63 0.43 0.63 0.53
15 0.41 0.54 0.31 0.5 0.13 0.56 0.44 0.44 0.58
16 0.65 0.33 0.12 0.53 0.27 0.56 0.69 0.45 0.6
17 0.67 0.5 0.01 0.62 0.58 0.35 0 0.53 0.6
2006 1 0 0.22 0.17 0.05 0.13 0.46 0.43 0.52 0.48 0.61
2 0 0.01 0.14 0.05 0.15 0.96 0.55 0.41 0.27 0.3
3 0 0 0.89 0 0 0 0 0 0.87 0.95
4 0 0 0.88 0 0 0 0 0 0.6 0
5 0 0.09 0 0.04 0.35 0.09 0.19 0.5 0.59 0
6 0.08 0.2 0.63 0.35 0.36 0.2 0.42 0.5 0.92 —
7 0 0.36 0.68 0.24 0.2 0.28 0.46 0.54 0.92 0.08
8 — — 0.64 0.5 0.01 0 0.01 0.4 0.57 0.8
9 — — 0.7 0 0 0.01 0 0.67 0.83 0.75
10 0.44 0.58 0.94 0.48 0 0.38 0.6 0.81 0.5 0.94
11 0.5 0.59 0.24 0.29 0 0 0.62 0.6 0 0.86
12 0 0.31 0.44 0.45 0.15 0 0.56 0.54 0 0.09
13 0.07 0.31 0.89 0.44 0.2 0.23 0.5 0.48 0.23 0.5
14 — 0.45 0.92 0.49 0.46 0.63 0.68 0.7 0.92 0.92
15 0.32 0.89 0.93 0.89 0.26 0.81 0.48 0.5 0.88 0.96
16 0.01 0.06 0.81 0.82 0.53 0.82 0.71 0.81 0.81 0.81
17 0.58 0.25 0.84 0.86 0.53 0.86 0.64 0.65 0.85 0.85
962 McInnes and Quigg
Journal of Coastal Research, Vol. 26, No. 5, 2010

concentrations of chl a and phae a (#260 and #143 mg L21,
respectively), measured in the summer of 2005 (Figures 4A
and C). The elevated chl a and phae a concentrations were
consistent with the presence of a bloom, particularly in Lake
Madeline—peaking on August 22 (Julian Day 234), four
days prior to the fish kill. The bloom had already begun to
decline by the day of the fish kill. Chl a concentrations on
August 26 (Julian Day 238) were nonetheless four times
higher in Lake Madeline (247 mg L21) than those in Offatt’s
Bayou (59 mg L21).
Phytoplankton Community Composition
Phytoplankton identification and counts were used to define
the dominant phytoplankton genera present in LMOB and also
enabled us to determine the presence or absence of potentially
harmful algae. In the summer of 2005, LMOB was dominated
by cyanobacteria (two species of Microcystis spp.), changing
toward the end of summer to a population dominated by
diatoms (primarily Coscinodiscus sp.) (Figure 5). There was a
large fluctuation in phytoplankton community composition on
August 15, 2005 (Julian day 227) corresponding to a period of
increased wind mixing and rainfall (Figure 2). Julian day 235
(August 23) corresponds to the Microcystis spp. bloom
(Figure 5). By August 26, the day of the fish kill (Julian day
238), LMOB was dominated by diatoms in surface waters, but
Microcystis spp. was still highly abundant.
Table 2 shows the Shannon and Simpson’s diversity indices
calculated for each sampling day as well as the entire summer
of 2005 and 2006. Simpson’s diversity index (supported by the
Figure 4. Daily average chl a (mg L21) (black bars) and phae a (mg L21) (white bars) concentrations for Offatt’s Bayou (A) 2005 and (B) 2006, and Lake
Madeline (C) 2005 and (D) 2006; error bars represent standard errors. (No error bars for Lake Madeline; replicates were not taken.)
Figure 5. Dominant phytoplankton taxa measured for the summer of (A)
2005 and (B) 2006. The percentage of Cyanobacteria (black), Bacillar-
iophyta (white), and Euglenophyta and Dinophyta (gray) in each plankton
tow was calculated.
Near-Annual Fish Kills 963
Journal of Coastal Research, Vol. 26, No. 5, 2010

Shannon index) showed a trend from a homogenous ecosystem
(in terms of phytoplankton taxa) early in the summer to one of a
more diverse heterogeneous system after the fish kill in 2005.
On August 23, four days prior to the fish kill, a low diversity of
phytoplankton was observed, consistent with dominance of
Microcystis spp. in surface plankton tows. This was also the day
the bloom peaked as indicated by the high amounts of chl a and
phae a (Figures 4A and C).
Unlike the summer of 2005, diatoms were present through-
out the summer of 2006 in large abundances (Figure 5) and in
more diverse assemblages (Table 2). The increased presence of
diatoms corresponded to periods of high wind mixing and
rainfall (Figure 2); Julian day 215 followed the period of
highest wind mixing while days 229 and 243 both follow periods
of high rainfall. The dominant cyanobacterium in 2006 was
again Microcystis spp. The dominant diatoms were Coscino-
discus sp., Chaetoceros sp.; all of which were also present in
higher abundances than in 2005 (Figure 5). Simpson’s diver-
sity index indicated that the phytoplankton assemblage
present in the summer of 2006 (Table 2) was consistently
heterogeneous, with no group dominating the system at any
time (this was supported by the Shannon index).
DISCUSSION
This study tested the hypothesis that low DO was the
primary causative factor of the fish kills occurring during the
late summer months in LMOB; given the strong water column
stratification in both summers and the greater preponderance
of hypoxia in 2006 relative to 2005 with no concurrent fish kill,
we rejected our hypothesis. Rather, we found that a complex
combination of physical, chemical, and biological parameters
led to the observed fish kill event. In particular, the declining
bloom of cyanobacteria (dominated by Microcystis spp.)
appears to have played the critical role in precipitating the
fish mortality event in an already stratified, hypoxic environ-
ment.
The most critical parameters affecting survival, movement,
and growth of fish are considered to be water temperature and
DO (Christie and Regier, 1988; Coutant, 1987). For this reason,
hypoxia is a critical parameter to consider when determining
the cause of a fish kill event. Hypoxia is a severe symptom of
eutrophication, the development of which is closely linked to
increased phytoplankton biomass in stratified estuarine
environments (Juhl and Murrell, 2005; Lee et al., 2005) as
well-established pycnoclines impede mixing and DO exchange
with overlying oxygenated waters (Paerl et al., 1998). Hypoxia
is a known culprit in many fish kills nationwide (Paerl et al.,
1998; Quigg et al., 2009; Thronson and Quigg, 2008; Wanna-
maker and Rice, 2000). While fish kills are the most visible of
the detrimental effects of hypoxia, it can have other, more
subtle, effects including reduction in growth rates of Atlantic
menhaden (McNatt and Rice, 2004) and disruption in the
ecology of affected estuaries (Diaz and Rosenberg, 1995; Eby et
al., 2005; Pihl, Baden, and Diaz, 1990).
Hypoxic bottom waters were observed during both summers
of this study. While our surveys were conducted each morning
(CST 0800–1200 hrs), based on other analogous investigations,
hypoxia persisted throughout the water column throughout the
day in LMOB, particularly at sites with restricted circulation
(Stations 16 and 17; Figure 1) and particularly in Lake
Madeline. In 2006, when no fish kill was observed, the bottom
water hypoxia was much more substantial, rising higher in the
water column (Table 1; Figure 3). Tolerances of hypoxia differ
among species and life stages of the same fish species
(Wannamaker and Rice, 2000). For example, Atlantic menha-
den (Brevoortia tyrannus) have a low sensitivity to hypoxia
having adapted to naturally reoccurring episodes over time
(McNatt and Rice, 2004). Many studies have shown that most
finfish are able to detect and avoid hypoxic conditions
(Breitburg, 1994; Renaud, 1986; Wannamaker and Rice,
2000), causing mobile fish to be restricted to oxygenated,
shallow, surface waters (Eby and Crowder, 2002). The greater
spatial extent of hypoxia during the summer of 2006, relative to
2005, allowed us to conclude that hypoxia alone was not the
primary cause of the fish kill observed in 2005. Importantly, it
did contribute by confining the fish to the narrow sanctuary of
oxygenated waters close the surface.
Increases in HABs have been related to the increasing
alterations in nutrient supplies and nutrient ratios in coastal
waters (Buskey, 1997; Nixon, 1995; Nixon et al., 2001). In the
context of this study, HABs are defined as algal blooms that
cause a variety of deleterious effects on aquatic ecosystems,
Table 2. Diversity indices for 2005 and 2006, includes Simpson’s diversity index and Shannon index for each trip and overall indices for the entire summer.
Julian Date
21-
Jul
25-
Jul
27-
Jul
28-
Jul
31-
Jul
1-
Aug
3-
Aug
7-
Aug
10-
Aug
11-
Aug
15-
Aug
17-
Aug
22-
Aug
23-
Aug
24-
Aug
26-
Aug
30-
Aug
31-
Aug
5-
Sep
Summer202 206 208 209 212 213 215 219 222 223 227 229 234 235 235 238 242 243 248
2005
Simpson’s 1.00 0.68 0.34 0.97 0.55 0.31 0.84 0.33 0.39 0.37
Shannon
(H9) 0.00 0.71 1.00 0.00 1.00 1.57 0.43 1.57 1.00 1.40
H9 max 0.00 2.19 2.57 0.69 2.49 2.49 2.64 2.89 1.95 3.26
Evenness 0.00 0.31 0.13 1.40 0.22 0.13 0.32 0.11 0.20 0.11
2006
Simpson’s 0.59 0.31 0.24 0.29 0.47 0.16 0.38 0.23 0.21 0.26 0.18
Shannon
(H9) 0.93 1.38 1.85 1.58 1.23 2.04 1.45 1.92 1.82 1.76 2.09
H9 max 2.57 2.71 2.83 3.09 2.77 2.83 2.77 2.77 2.71 3.43 3.61
Evenness 0.23 0.12 0.09 0.10 0.17 0.06 0.08 0.08 0.08 0.08 0.05
964 McInnes and Quigg
Journal of Coastal Research, Vol. 26, No. 5, 2010
including oxygen depletion, clogging of fish gills (leading to
suffocation), and starvation, and toxin production, which can
all lead to fish kills (Graneli and Turner, 2006; Lee et al., 2005;
Smayda, 1997). Significant amounts of chl a and phae a were
observed in the days prior to the fish kill in 2005, indicating
that a bloom was in progress (Figure 4). This was associated
with several species of Microcystis spp., which we found
dominated the phytoplankton assemblage. This bloom can be
termed a harmful algal bloom according to the definition set
forth by Smaya (1997) because it was the primary casual factor
in the fish kill. Cyanobacteria have been shown to be abundant
in warm water (Murrell and Lores, 2004) and bloom in aquatic
systems where temperatures exceed 20uC (Paerl, 1996).
Because cyanobacteria have relatively slow growth rates, long
periods of physical stability are essential for the development of
a bloom (Paerl, 1996). Such conditions—low wind mixing, little
rain fall (Figure 2) and warm water temperatures (Figure 3)—
were observed during the summer of 2005 in LMOB (but not in
2006). The actual biomass of Microcystis spp. in the water may
have exceeded that reported because normalizing cyanobacte-
ria concentrations to Chl a (as was done in this study) is likely
to underestimate their actual biomass (MacIntyre et al., 2002).
The bloom was ‘‘crashing’’ on the day of the fish kill as indicated
by the falling concentrations of chl a and phae a (Figure 4) in
surface waters. Blooms have been documented as causing
mortality events upon their collapse (Lee et al., 2005). The
crashing bloom likely loaded the upper water column with
detritus given the highly stratified nature of the water column
in LMOB. Further, Microcystis spp. blooms are known to
produce toxins that cause fish kills (Tango and Butler, 2008);
however, in the context of the current study, we were not able to
measure toxin production and thus cannot comment on
whether microcystin production was also involved in the 2005
fish kill. Because toxin production cannot be ruled out as a
causal factor, it is important to note that if it was present,
microcystin could be a causal factor of such a large scale fish
kill.
Adult menhaden are filter feeders and feed primarily on
phytoplankton (Vaughan et al., 2000). The distribution of
juvenile menhaden has been correlated to the distribution of
phytoplankton (Friedland, Ahrenholz, and Guthrie, 1989).
These fish have been shown to detect and avoid hypoxic waters
(Wannamaker and Rice, 2000) and thus would have been
restricted to the narrow sanctuary available at the surface (Eby
and Crowder, 2002) where the crashing bloom was concentrat-
ed. The large amount of detritus resulting from the breakdown
of the cyanobacteria bloom likely suffocated the fish (as the
primary causal factor to the studied fish kill); this has been
documented previously in other systems (Engstrom-Ost,
Karjalainen, and Viitasalo, 2006; Ochumba, 1990).
CONCLUSIONS
This study was unique in several respects: two summers of
physical, chemical, and biological data were collected on fine
spatial and temporal scales, and the phytoplankton community
was identified to genus level revealing the identity of the
bloom-forming species. The combination of a declining Micro-
cystis spp. bloom along with strong stratification of the water
column were the two most important causal factors leading to
this fish mortality event. Extensive hypoxia, in itself, did not
directly cause the fish kill event because there existed a narrow
(,2.5 m on average) sanctuary of oxygenated water close to the
surface of LMOB. However, the extensive hypoxia reduced the
viable habitat for tens of thousands of Brevoortia patronus,
representing the most important casual factor leading to the
mortality event observed. With the increasing anthropogenic
effects on coastal ecosystems (including divergence of rivers,
dredging, and increased nutrient input to surrounding waters),
fish kills like those observed in this study will likely continue to
increase in frequency. Many studies point to hypoxia as the
primary culprit of fish kills in coastal waters (Quigg et al., 2009;
Thronson and Quigg, 2008). However, this study clearly
demonstrates that while hypoxia was present during the fish
kill, the cause was a more complex combination of physical,
chemical, and biological factors. Thus determination of the
causes of fish kills requires a more encompassing view of the
affected system.
ACKNOWLEDGMENTS
Special thanks to Derek Shultz, Federico Alvarez, Mark
London, and Amanda Thronson for helping collect the data.
My appreciation also goes to Ayal Anis (TAMUG) for the use
of his CTD. Winston Denton (TPWD) helped in the initial
setup of this project. Recognition is also due to Keith Dupuis
and Gaurav Singhal for their assistance with MatLab. My
gratitude is also given to Andrew McInnes with the TAMUG
Coastal Geology Lab for his assistance in collecting and
processing the bathymetry data for the LMOB, as well as help
with data collection in the summer of 2006. A Texas Institute
of Oceanography fellowship was awarded offering support in
the latter stages of this study and in preparing the thesis and
manuscript.
LITERATURE CITED
Arar, E.J. and Collins, G.B., 1997. In Vitro Determination ofChlorophyll a and Pheophytin a in Marine and Freshwater Algaeby Fluorescence. Cincinnati, Ohio: U.S. Environmental ProtectionAgency, 22p.
Breitburg, D.L., 1994. Behavioral response of fish larvae to lowdissolved oxygen concentrations in a stratified water column.Marine Biology, 120, 615–625.
Burkholder, J.M.; Noga, E.J.; Hobbs, C.H., and Glasgow, H.B., Jr.,1992. New ‘phantom’ dinoflagellate is the causative agent of majorestuarine fish kills. Nature, 358, 407–410.
Buskey, E.J.; Montagna, P.A.; Amos, A.F., and Whitledge, T.E., 1997.Disruption of Grazer populations as a contributing factor to theinitiation of the Texas brown tide algal bloom. Limnology andOceanography, 42, 1215–1222.
Christie, C.G. and Regier, H.A., 1988. Measurements of optimalhabitat and their relationship to yields for four commercial fishspecies. Canadian Journal of Fisheries and Aquatic Sciences, 45,301–314.
Cooper, D.C. and Morse, J.W., 1996. The chemistry of Offatts Bayou,Texas: a seasonally highly sulfidic basin. Estuaries, 19, 595–611.
Coutant, C.C., 1987. Thermal preference: when does an asset becomea liability? Environmental Biology of Fishes, 18, 161–172.
Diaz, R.J. and Rosenberg, R., 1995. Marine benthic hypoxia: a reviewof its ecological effects and the behavioral responses of benthicmacrofauna. Oceanography and Marine Biology: An AnnualReview, 33, 245–303.
Near-Annual Fish Kills 965
Journal of Coastal Research, Vol. 26, No. 5, 2010
Eby, L.A. and Crowder, L.B., 2002. Hypoxia-based habitat compres-sion in the Neuse River Estuary: context-dependent shifts inbehavioral avoidance thresholds. Canadian Journal of Fisheriesand Aquatic Sciences, 59, 952–965.
Eby, L.A.; Crowder, L.B.; McClellan, C.M.; Peterson, C.H., andPowers, M.J., 2005. Habitat degradation from intermittent hypox-ia: impacts on demersal fishes. Marine Ecology Progress Series, 291,249–261.
Engstrom-Ost, J.; Karjalainen, M., and Viitasalo, M., 2006. Feedingand refuge use by small fish in the presence of cyanobacteriablooms. Environmental Biology of Fishes, 76, 109–117.
Friedland, K.D.; Ahrenholz, D.W., and Guthrie, J.F., 1989. Influenceof plankton on distribution patterns of the filter-feeder Brevoortiatyrannus (Pices: Clupeidae). Marine Ecology Progress Series, 54, 1–11.
Graneli, E. and Turner, J.T., 2006. An introduction to harmful algae.In: Graneli, E. and Turner, J.T. (eds.), Ecology of Harmful Algae.Berlin: Springer, pp. 3–7.
Gray, J.S.; Wu, R.S., and Or, Y.Y., 2002. Effects of hypoxia andorganic enrichment on the coastal marine environment. MarineEcology Progress Series, 238, 249–279.
Juhl, A.R. and Murrell, M.C., 2005. Interactions between nutrients,phytoplankton growth, and microzooplankton grazing in a Gulf ofMexico estuary. Aquatic Microbial Ecology, 38, 147–156.
Lee, J.H.W.; Hodgkiss, I.J.; Wong, K.T.M., and Lam, I.H.Y., 2005.Real time observations of coastal algal blooms by and early warningsystem. Estuarine, Coastal and Shelf Science, 65, 172–190.
Lowe, J.A.; Farrow, D.R.G.; Pait, A.S.; Arenstam, S.J., and Lavan,E.F., 1991. Fish Kills in Coastal Waters 1980–1989. Washington,D.C.: National Oceanic and Atmospheric Administration.
MacIntyre, H.L.; Kana, T.M.; Anning, T., and Geider, R.J., 2002.Photoacclimation of photosynthesis irradiance response curves andphotosynthetic pigments in microalgae and cyanobacteria. Journalof Phycology, 38, 17–38.
McNatt, R.A. and Rice, J.A., 2004. Hypoxia-induced growth ratereduction in two juvenile estuary-dependent fishes. Journal ofExperimental Marine Biology and Ecology, 311, 147–156.
Murrell, M.C. and Lores, E.M., 2004. Phytoplankton and zooplanktonseasonal dynamics in a subtropical estuary: importance of cyano-bacteria. Journal of Plankton Research, 26, 371–382.
Nixon, S.W., 1995. Coastal marine eutrophication: a definition, socialcauses and future concerns. Ophelia, 41, 199–219.
Nixon, S.W.; Buckley, B.; Granger, S., and Blintz, J., 2001. Responsesof very shallow marine ecosystems to nutrient enrichment. Humanand Ecological Risk Assessment, 7, 1457–1481.
Ochumba, P.B.O., 1990. Massive fish kills within the Nayanza Gulf ofLake Victoria, Kenya. Hydrobiologia, 208, 93–99.
Paerl, H.W., 1996. A comparison of cyanobacterial bloom dynamics infreshwater, estuarine and marine environments. Phycologia, 35,25–35.
Paerl, H.W.; Pickney, J.L.; Fear, J.M., and Peierls, B.L., 1998.Ecosystem responses to internal and watershed organic matterloading: consequences for hypoxia in the eutrophying Neuse RiverEstuary, North Carolina, USA. Marine Ecology Progress Series,166, 17–25.
Pihl, L.; Baden, S.P., and Diaz, R.J., 1990. Effects of periodic hypoxiaon distribution of demersal fish and crustaceans. Marine Biology,108, 349–360.
Quigg, A.; Broach, L.; Denton, W., and Miranda, R., 2009. Waterquality in the Dickinson Bayou watershed (Texas, Gulf of Mexico)and health issues. Marine Pollution Bulletin, 58, 896–904.
Renaud, M.L., 1986. Hypoxia in Louisiana coastal waters during1983: implications for fisheries. Fishery Bulletin, 84, 19–26.
Reynolds-Fleming, J.V. and Luettich, R.A., Jr., 2004. Wind-drivenlateral variability in a partially mixed estuary. Estuarine, Coastaland Shelf Science, 60, 395–407.
Ritter, C. and Montagna, P.A., 1999. Seasonal hypoxia and models ofbenthic response in a Texas Bay. Estuaries, 22, 7–20.
Roelke, D.L.; Errera, R.M.; Kiesling, R.; Brooks, B.W.; Grover, J.P.;Schwierzke, L.; Urena-Boeck, F.; Baker, J. and Pinckney, J.L.,2007. Effects of nutrient enrichment on Prymnesium parvumpopulation dynamics and toxicity: results from field experiments,Lake Possum Kingdom, USA. Aquatic Microbial Ecology, 46, 125–140.
Smayda, T.J., 1997. What is a bloom? A commentary. Limnology andOceanography, 52, 1132–1136.
Tango, P.J. and Butler, W., 2008. Cyanotoxins in tidal waters ofChesapeake Bay. Northeast Naturalist, 15,403–416.
Thronson, A. and Quigg, A., 2008. Fish kills in coastal Texas.Estuaries and Coasts, 31, 803–813.
Tomas, C.R., 1997. Identifying Marine Phytoplankton. San Diego,California: Academic Press, 858p.
Vaughan, D.S.; Smith, J.W., and Prager, M.H., 2000. PopulationCharacteristics of Gulf Menhaden, Brevoortia patronus. SeattleWashington: National Oceanic and Atmospheric Administration,Technical Report NMFS 149, 22p.
Wannamaker, C.M. and Rice, J.A., 2000. Effects of hypoxia onmovements and behavior of selected estuarine organisms from thesoutheastern United States. Journal of Experimental MarineBiology and Ecology, 249, 145–163.
Wassmann, P. and Olli, K., 2004. Drainage Basin Nutrient Inputs andEutrophication: An Integrated Approach. Tromsø, Norway: Univer-sity of Tromsø, 325p.
966 McInnes and Quigg
Journal of Coastal Research, Vol. 26, No. 5, 2010