Embed Size (px)
Citation preview

27112.0620.vn
FINANCIAL REPORTSSecretary-Treasurer | Independent Auditors
Presented to the Representative AssemblyJuly 2020
VIRTUAL RA
VIRTUAL RA

National Education Association
The National Education Association is the nation’s largest professional employee organization, representing 3 million elementary and secondary teachers, higher education faculty, education support professionals, school administrators, retired educators, and students preparing to become teachers.
NEA Executive Officers
Lily Eskelsen García, President
Rebecca S. Pringle, Vice President
Princess R. Moss, Secretary-Treasurer
Kim A. Anderson, Executive Director
Reproduction: No part of this report may be reproduced in any form without written permission from NEA, except by NEA affiliated associations and mem-bers. Address inquiries to NEA Executive Office, 1201 16th St., N.W., Washington, DC 20036-3290; (202) 822-7000.
Published June 2020
Copyright © June 2020 by the National Education Association
All Rights Reserved

CONTENTS
A Report from NEA Secretary-Treasurer Princess R. Moss . . . . . . . . . . . . . . . . . . . . . . . . . . . . . . . . . . . 1-3
Audit Report:
Report of Independent Auditors . . . . . . . . . . . . . . . . . . . . . . . . . . . . . . . . . . . . . . . . . . . . . . . . . . . . . . . 5-6
Consolidated Financial Statements:
Consolidated Statements of Financial Position as of August 31, 2019 and 2018 . . . . . . . . . . . . . . . . . . . . . . . . . . . . . . . . . . . . . . . . . . . . . . . . . . . . . . 8
Consolidated Statements of Activities and Changes in Net Assets for the Years Ended August 31, 2019 and 2018 . . . . . . . . . . . . . . . . . . . . . . . . . . . . . . . . . . . . . . . . . 9
Consolidated Statement of Functional Expenses for the Year Ended August 31, 2019 (with comparative totals for August 31, 2018) . . . . . . . . . . . . . . . . . . . . . . . . . . . . . . . . . . . . . . . . . 10-11
Consolidated Statements of Cash Flows for the Years Ended August 31, 2019 and 2018 . . . . . . . . . . . . . . . . . . . . . . . . . . . . . . . . . . . . . . . . . 12
Notes to Consolidated Financial Statements . . . . . . . . . . . . . . . . . . . . . . . . . . . . . . . . . . . . . . . . . . . . . 13-35
Supplemental Schedules:
Supplemental Schedule of Financial Position by Fund Information as of August 31, 2019 (with comparative totals as of August 31, 2018) . . . . . . . . . . . . . . . . . . . . . 36
Supplemental Schedule of Financial Position by Special Purpose Fund Information as of August 31, 2019 (with comparative totals as of August 31, 2018) . . . . . . . . . . . . . . . . . . . . . 37
General Operating Fund – Supplemental Schedule of Activities and Changes in Net Assets for the Year Ended August 31, 2019 . . . . . . . . . . . . . . . . . . . . . . . . . . . . . . 38-39
General Operating Fund – Supplemental Schedules of Expenses by Type for the Years Ended August 31, 2019 and 2018 . . . . . . . . . . . . . . . . . . . . . . . . . . . . . . . . . . . . . . . . . 40
Special Purpose Funds – Supplemental Schedules of Activities and Changes in Net Assets for the Years Ended August 31, 2019 and 2018 . . . . . . . . . . . . . . . . . . . . . 41
Interim Financial Statements:
General Operating and Capital Improvement Funds – Statements of Financial Position (unaudited) as of May 31, 2020 . . . . . . . . . . . . . . . . . . . . . . . . . 45
General Operating Fund – Statement of Activities and Changes in Net Assets (unaudited) for the Nine Months Ended May 31, 2020 . . . . . . . . . . . . . . . . . . . . . . . . . . . . . . . . . . . . . . . . . . . . . 46-47
General Operating Fund – Contingency Fund Expenditures as of May 31, 2020 . . . . . . . . . . . . . . . . . . . . . . . . . . . . . . . . . . . . . . . . . . . . . . . . . . . . . . . . . . . . . . . . . 48
Membership Comparison by State . . . . . . . . . . . . . . . . . . . . . . . . . . . . . . . . . . . . . . . . . . . . . . . . . . . . . . . . . 50-51

ii
This page has been left blank intentionally.

1
A REPORT FROMNEA SECRETARY-TREASURERPRINCESS R. MOSS
Don’t follow the path. Go where there is no path and begin the trail. When you start a new trail equipped with courage, strength and conviction, the only thing that can stop
you is you.” —Ruby Bridges, integrated an all-white elementary school in New Orleans in 1960
Sixty-five years ago, Brown v. Board of Education ruled that separate is never equal, and that the fundamental promise of public education—“perhaps the most important function of state and local governments”—must be provided equally to all .
Yet, 65 years after Brown, we’ve seen the challenge of inequity and segregated schools in this nation persist . The glaring disparities can be observed in schools, only a few miles apart . One school is state of the art where students are thriving . The other suffers from decades of neglect, disinvestment, and long-term austerity agendas born out of a reckless belief system that says tax cuts will pay for themselves .
These disparities and bad education policies form the root of what sparked the wave of nationwide walkouts last year . Recently, we heard Education Secretary Betsy Devos proclaim “Strikes hurt kids .” News flash: Ninety percent of all U .S . students attend public schools . Slashing billions from public education, and redirecting scarce public dollars from public to private schools, hurts these students far more than any strike . In fact, these strikes have helped to reprioritize the needs of our students and educators across the nation . The result? Our union and the public education movement are stronger .
Public education is one of the last institutions in this country that hasn’t been fully privatized . We must continue our work to save public education . And we will continue the fight to reach and support our most disadvantaged students because we know what happens when kids get what they need . We see the daily miracles that occur when students break the code of language for the first time—when they ace the Spelling Bee, win the county science fair, understand the beauty of a sonnet, prove a theorem, or simply become the very first person in their family to earn a bachelor’s degree .
We must demand that this nation do the right thing for all students and ensure that all public schools are as good as our best ones . If we don’t stand up for our students, who will?
THE AUDIT REPORT FOR 2018–2019
On pages 5-41, you will find a complete audit report as prepared by our independent certified public accounting firm, Calibre CPA Group, PLLC . NEA is required to present consolidated financial statements, which include all of the association’s various funds as well as our Member Benefits Corporation, NEA Properties, Inc ., and NEA360 LLC . The audit report is divided into four parts:
“

2
1 . Auditor’s opinion letter;
2 . Actual financial statements on which the audit is based;
3 . Footnotes to the financial statements, which help to explain some of the individual items; and
4 . Supplemental schedules showing additional detail by fund .
The auditor’s opinion letter states that their work was conducted in accordance with generally accepted auditing standards, and that the consolidated financial statements and the supplemental schedules fairly present the financial position and results of operations . It is a “clean opinion,” meaning it was issued without any qualifying comments . A “clean opinion” is the highest level of opinion given by an independent auditor .
The Consolidated Statements of Financial Position present the association’s assets, liabilities, and net assets as of August 31, 2019 and 2018 . One important indicator of an organization’s financial strength is its net assets (the difference between total assets and total liabilities) . Net assets should be a positive balance, sufficient to support future growth, and stabilize an organization in troubled times . NEA’s consolidated net assets carry a positive balance and are at an acceptable level, enabling the association to weather the current economic environment . In addition, NEA has a healthy current ratio . This means that we are in a solid position to meet our current obligations as they become due .
The accompanying footnotes provide supplemental information that gives a more detailed explanation of aspects of the financial statements presented . I encourage you to read them .
The supplemental schedules reflect a detailed breakdown of the general operations and special purpose funds that, taken together, represent the consolidated statements .
The General Operating Fund Supplemental Statement of Activities and Changes in Net Assets reflects total revenue and expenses by strategic objectives and enterprise operations .
Financial statements contained within the audit include:
1 . CONSOLIDATED STATEMENTS OF FINANCIAL POSITION as of August 31, 2019 and 2018 (p .8) . This statement shows total current assets of $282,644,589 and total current liabilities of $31,766,393 resulting in a healthy current ratio of 8 .90:1 . NEA’s consolidated Net Assets Without Donor Restrictions, which represents the difference between what it owns (total assets of $411,724,421) and what it owes (total liabilities of $56,308,897), is a positive $355,415,524 .
2 . CONSOLIDATED STATEMENTS OF ACTIVITIES AND CHANGES IN NET ASSETS for the years ended August 31, 2019 and 2018 (p .9) . This statement shows that the total revenue for the fiscal year 2018-19 was $427,100,284 and the total expenses, including the Change in Pension Obligation Other Than Net Periodic Pension Cost and Other Charges, were $405,799,795 . The excess of total revenue over total expenses resulted in a surplus of $21,300,489 .
3 . CONSOLIDATED STATEMENT OF FUNCTIONAL EXPENSES with Comparative Totals for August 31, 2018 (pp . 10–11) . This statement shows that the total program services expense for the fiscal year 2018-2019 was $251,395,197 and the total support services expense was $148,758,058 . The total functional expenses were $400,153,255 .

3
4 . CONSOLIDATED STATEMENTS OF CASH FLOWS for the years ended August 31, 2019 and 2018 (p .12) . These statements reflect the sources and uses of cash for the two fiscal years, and are designed to analyze the period-to-period fluctuations in key elements in the Consolidated Statements of Financial Position .
5 . NOTES TO CONSOLIDATED FINANCIAL STATEMENTS (pp . 13–35) . The notes to the financial statements discuss the significant accounting policies of the association and provide explanatory information on elements of the financial statements .
6 . SUPPLEMENTAL SCHEDULES (pp . 36–41) . The supplemental schedules provide additional details for the NEA General Operating Fund and Special Purpose Funds .
INTERIM FINANCIAL STATEMENTS FOR 2019–2020
On pages 45–47 you will find the General Operating and Capital Improvement Funds Statements of Financial Position (unaudited) as of May 31, 2020 and the General Operating Fund – Statement of Activities and Changes in Net Assets (unaudited) for the nine months ended May 31, 2020 .
On page 48, you will find a schedule indicating the original amount approved and authorized for the fiscal year 2019–2020 Contingency Fund adopted at last year’s Representative Assembly . It also identifies the dates, level of governance approval, and purposes for which allocations from the fund were made .
MEMBERSHIP COMPARISON BY STATE
Pages 50–51 contain a detailed schedule, arranged by state and membership category, reflecting an decrease in membership of 29,882 from fiscal year 2018 to 2019 . Membership is the lifeblood of our organization . Efforts to maintain our membership base and expand it are essential to our fiscal health .
I hope the information in this report is informative and provides you with a glimpse of the complex financial network that exists to meet the varied needs of our 3 million members and advance our vision of A Great Public School for Every Student.
Respectfully submitted,
Princess R . MossNEA Secretary-Treasurer

4
This page has been left blank intentionally.

5
Report of Independent Auditors
To the Executive Committee and Members of theNational Education Association of the United States
We have audited the accompanying consolidated financial statements of the National Education Association of the United States and its subsidiaries (NEA), which comprise the consolidated statements of financial position as of August 31, 2019 and 2018, and the related consolidated statements of activities and cash flows for the years then ended, the consolidated statement of functional expenses for the year ended August 31, 2019 and the related notes to the consolidated financial statements .
Management’s Responsibility for the Consolidated Financial Statements
Management is responsible for the preparation and fair presentation of these consolidated financial statements in accordance with accounting principles generally accepted in the United States of America; this includes the design, implementation, and maintenance of internal control relevant to the preparation and fair presentation of consolidated financial statements that are free from material misstatement, whether due to fraud or error .
Auditors’ Responsibility
Our responsibility is to express an opinion on these consolidated financial statements based on our audits . We conducted our audits in accordance with auditing standards generally accepted in the United States of America . Those standards require that we plan and perform the audits to obtain reasonable assurance about whether the consolidated financial statements are free from material misstatement .
An audit involves performing procedures to obtain audit evidence about the amounts and disclosures in the consolidated financial statements . The procedures selected depend on the auditors’ judgment, including the assessment of the risks of material misstatement of the consolidated financial statements, whether due to fraud or error . In making those risk assessments, the auditors consider internal control relevant to NEA’s preparation and fair presentation of the consolidated financial statements in order to design audit procedures that are appropriate in the circumstances, but not for the purpose of expressing an opinion on the effectiveness of NEA’s internal control . Accordingly, we express no such opinion . An audit also includes evaluating the appropriateness of accounting policies used and the reasonableness of significant accounting estimates made by management, as well as evaluating the overall presentation of the consolidated financial statements .
We believe that the audit evidence we have obtained is sufficient and appropriate to provide a basis for our audit opinion .

6
Opinion
In our opinion, the consolidated financial statements referred to above present fairly, in all material respects, the financial position of the National Education Association of the United States and its subsidiaries as of August 31, 2019 and 2018, and the changes in its net assets and its cash flows for the years then ended in accordance with accounting principles generally accepted in the United States of America .
Report on Summarized Comparative Information
We have previously audited the August 31, 2018 consolidated financial statements of the National Education Association of the United States and its subsidiaries, and we expressed an unmodified audit opinion on those consolidated audited financial statements in our report dated December 17, 2018 . In our opinion, the summarized comparative information presented herein as of and for the year ended August 31, 2018 is consistent, in all material respects, with the audited consolidated financial statements from which it has been derived .
Report on Supplemental Information
Our audits were conducted for the purpose of forming an opinion on the consolidated financial statements as a whole . The accompanying information included on pages 31 through 36 is presented for purposes of additional analysis and is not a required part of the financial statements . Such information is the responsibility of management and was derived from and relates directly to the underlying accounting and other records used to prepare the consolidated financial statements . The information, except for the budgeted amounts (which is unaudited), has been subjected to the auditing procedures applied in the audit of the consolidated financial statements and certain additional procedures, including comparing and reconciling such information directly to the underlying accounting and other records used to prepare the consolidated financial statements or to the consolidated financial statements themselves, and other additional procedures in accordance with auditing standards generally accepted in the United States of America . In our opinion, the information is fairly stated in all material respects in relation to the consolidated financial statements as a whole .
Bethesda, MDDecember 11, 2019

7
2018–2019CONSOLIDATED
FINANCIAL STATEMENTS

8
NATIONAL EDUCATION ASSOCIATION OF THE UNITED STATES AND SUBSIDIARIES
CONSOLIDATED STATEMENTS OF FINANCIAL POSITIONAUGUST 31, 2019 AND 2018
2019 2018
ASSETS
CURRENT ASSETS Cash and cash equivalents $ 197,824,043 $ 229,875,920 Short term investments 40,327,829 – Membership dues receivable – net 30,985,331 31,086,987 Amount due from affiliates and other organizations – net 1,305,515 1,075,655 Accounts receivable 7,174,967 7,452,647 Notes receivable 1,294,445 1,116,666 Prepaid expenses 3,360,852 5,115,601 Other current assets 371,607 337,884 Total current assets 282,644,589 276,061,360
LONG-TERM ASSETS Notes receivable – net 3,425,000 4,468,765 Deferred rent assets 327,251 245,461 Deferred leasing commission 281,749 311,181 Investments 49,710,273 44,669,010 Pension asset 14,533,797 18,561,562 Deferred income taxes 845,488 1,140,704 Property and equipment – net 59,956,274 62,835,116 Total long-term assets 129,079,832 132,231,799 Total assets $ 411,724,421 $ 408,293,159
LIABILITIES AND NET ASSETS
CURRENT LIABILITIES Accounts payable $ 11,309,716 $ 25,798,674 Income taxes payable 288,244 – Accrued liabilities 11,551,838 12,575,066 Deferred income 1,606,121 1,526,631 Notes payable 8,119 8,119 Accrued annual leave 6,041,673 5,620,396 Amount held for affiliates and other organizations 960,682 1,280,440 Total current liabilities 31,766,393 46,809,326
LONG-TERM LIABILITIES Notes payable 2,631 10,751 Accrued severance payable 5,498,711 5,805,317 Deferred income 15,332,687 16,048,910 Deferred income taxes 3,708,475 5,503,820 Total long-term liabilities 24,542,504 27,368,798 Total liabilities 56,308,897 74,178,124
NET ASSETS WITHOUT DONOR RESTRICTIONS Undesignated net assets 231,518,380 212,737,114 Designated net assets 123,897,144 121,377,921 Total net assets without donor restrictions 355,415,524 334,115,035 Total liabilities and net assets $ 411,724,421 $ 408,293,159
See accompanying notes to consolidated financial statements.

9
NATIONAL EDUCATION ASSOCIATION OF THE UNITED STATES AND SUBSIDIARIES
CONSOLIDATED STATEMENTS OF ACTIVITIES AND CHANGES IN NET ASSETSFOR THE YEARS ENDED AUGUST 31, 2019 AND 2018
2019 2018
OPERATING ACTIVITIES
REVENUE NEA programs: Dues $ 366,428,208 $ 369,928,472 Investment income – net 3,229,266 3,009,017 Other 1,141,450 848,089
Total NEA programs 370,798,924 373,785,578
Member Benefits programs: Program revenue – suppliers 53,665,652 53,779,831 Investment income – net 66,097 134,696 Other 113,021 109,476
Total Member Benefits programs 53,844,770 54,024,003
NEA 360 LLC License revenue 200,130 101,699
Total NEA 360 LLC 200,130 101,699
NEA Properties: Rental income 2,089,771 1,842,473 Other 166,689 191,157 Total NEA Properties 2,256,460 2,033,630
Total revenue 427,100,284 429,944,910
EXPENSES Program services 251,395,197 256,467,838 Support services 148,758,058 151,759,691
Total expenses 400,153,255 408,227,529
CHANGE IN NET ASSETS FROM OPERATIONS 26,947,029 21,717,381
NON-OPERATING ACTIVITIES
CHANGE IN PENSION OBLIGATION OTHER THAN NETPERIODIC PENSION COST AND OTHER CHARGES (5,646,540) (849,818)
CHANGE IN NET ASSETS 21,300,489 20,867,563
NET ASSETS WITHOUT DONOR RESTRICTIONS
Beginning of year 334,115,035 313,247,472
End of year $ 355,415,524 $ 334,115,035
See accompanying notes to consolidated financial statements.

10
NATIONAL EDUCATION ASSOCIATION OF THE UNITED STATES AND SUBSIDIARIES
CONSOLIDATED STATEMENT OF FUNCTIONAL EXPENSESFOR THE YEAR ENDED AUGUST 31, 2019 (WITH COMPARATIVE TOTALS FOR AUGUST 31, 2018)
Program Services
Member Benefits, NEA Properties New and Early Support Communication NEA 360 LLC Educator Career Racial Justice Professional Secure the Organizational and Other and Special Total Program Voice Educator in Education Excellence Environment Capacity Services Purpose Funds Services
Expenses
Salaries and benefits $ 5,362,234 $ 934,244 $ 6,389,352 $ 10,915,506 $ 16,028,369 $ 16,564,185 $ 9,505,949 $ 12,864,052 $ 78,563,891
Occupancy costs 355,178 30,079 438,870 792,730 1,028,582 1,008,652 689,637 624,495 4,968,223
Depreciation 125,461 14,344 153,192 271,865 367,198 366,639 236,587 2,256,571 3,791,857
Equipment purchases, rental and maintenance – – – – – – 5,565 2,348,146 2,353,711
Printing and supplies 55,879 60,435 26,660 29,278 – – 2,279,335 6,217,480 8,669,067
Office and administrative 19,566 17,141 40,492 97,679 27,173 89,997 3,566,837 5,594,234 9,453,119
Membership/dues 1,115 22 27,923 257,757 508,688 3,773,018 7,297 – 4,575,820
Computer services, software and upgrades 193,855 147,018 271,191 592,410 1,099,745 1,367,490 704,795 1,545,561 5,922,065
Grants and contributions 143,599 – 689,400 450,612 820,563 2,530,813 12,050 1,647,044 6,294,081
Insurance – – – – 11,499,694 – – 142,981 11,642,675
Professional services 383,471 72,034 1,404,748 1,982,506 2,262,660 1,372,448 979,738 8,256,726 16,714,331
Promotion/advertising – – 75,000 – – 154 12,766,633 2,969,309 15,811,096
Travel 880,502 225,958 1,421,655 1,657,588 843,274 3,217,697 257,555 1,704,115 10,208,344
Unified Legal Services Program – – – – 19,508,283 – – – 19,508,283
Assistance to state and local affiliates 1,491,560 164,718 1,237,400 7,876,383 24,980,966 5,894,730 3,619,660 3,760,078 49,025,495
Conferences and meetings 415,017 96,086 793,462 887,379 118,051 1,046,271 254,556 217,843 3,828,665
Real estate and other property taxes – – – – – – – 64,474 64,474
Provision for income taxes – – – – – – – – –
Total expenses $ 9,427,437 $ 1,762,079 $ 12,969,345 $ 25,811,693 $ 79,093,246 $ 37,232,094 $ 34,886,194 $ 50,213,109 $ 251,395,197
See accompanying notes to consolidated financial statements. (continued)

11
NATIONAL EDUCATION ASSOCIATION OF THE UNITED STATES AND SUBSIDIARIES
CONSOLIDATED STATEMENT OF FUNCTIONAL EXPENSESFOR THE YEAR ENDED AUGUST 31, 2019 (WITH COMPARATIVE TOTALS FOR AUGUST 31, 2018)
Support Services
Total Membership Management Support 2019 2018 Development and General Services Total Total
Expenses
Salaries and benefits $ 10,966,814 $ 40,967,141 $ 51,933,955 $ 130,497,846 $ 140,953,661
Occupancy costs 214,151 2,939,832 3,153,983 8,122,206 6,024,030
Depreciation 135,548 1,317,198 1,452,746 5,244,603 5,004,936
Equipment purchases, rental and maintenance – 98,405 98,405 2,452,116 3,804,327
Printing and supplies 96,737 172,650 269,387 8,938,454 8,850,290
Office and administrative 125,571 927,725 1,053,296 10,506,415 9,604,186
Membership/dues 2,010 30,883 32,893 4,608,713 4,680,939
Computer services, software and upgrades 543,865 2,685,319 3,229,184 9,151,249 7,076,346
Grants and contributions – 246,849 246,849 6,540,930 8,575,723
Insurance – 319,616 319,616 11,962,291 12,180,405
Professional services 716,203 4,580,999 5,297,202 22,011,533 24,031,256
Promotion/advertising – 2,425 2,425 15,813,521 17,755,481
Travel 2,300,451 4,045,865 6,346,316 16,554,660 16,238,656
Unified Legal Services Program – – – 19,508,283 20,553,371
Assistance to state and local affiliates 68,945,217 – 68,945,217 117,970,712 117,767,280
Conferences and meetings 543,286 5,326,112 5,869,398 9,698,063 6,011,250
Real estate and other property taxes – 183,263 183,263 247,737 247,779
Provision for income taxes – 323,923 323,923 323,923 (1,132,387)
Total expenses $ 84,589,853 $ 64,168,205 $ 148,758,058 $ 400,153,255 $ 408,227,529
See accompanying notes to consolidated financial statements. (concluded)

12
NATIONAL EDUCATION ASSOCIATION OF THE UNITED STATES AND SUBSIDIARIES
CONSOLIDATED STATEMENTS OF CASH FLOWSFOR THE YEARS ENDED AUGUST 31, 2019 AND 2018
2019 2018
CASH FLOWS FROM OPERATING ACTIVITIES Changes in net assets $ 21,300,489 $ 20,867,563 Adjustments to reconcile changes in net assets to net cash provided by operating activities Depreciation and amortization 5,244,603 5,004,936 Bad debt expense 1,138,046 658,442 Notes receivable allowance expense 349,319 – Net realized loss (gain) on investments 125 (778,389) Net unrealized gain on investments (768,994) (892,462) Adjusted basis (1,325) – (Gain) loss on disposal of property and equipment (5,705) 603 Changes in assets and liabilities: Membership dues receivable (1,036,390) (865,996) Amount due from affiliates and other organizations (229,860) 361,501 Accounts receivable 277,680 309,644 Prepaid expenses 1,754,749 1,781,673 Other current assets (33,723) (15,516) Deferred rent assets (81,790) 2,371 Deferred leasing commission 29,432 (89,337) Deferred income taxes (1,500,129) (339,952) Pension asset 4,027,765 (2,541,821) Accounts payable (14,488,958) 13,817,424 Accrued liabilities (1,023,228) 2,233,321 Accrued annual leave 421,277 (746,367) Notes payable (8,120) 18,870 Income taxes payable 288,244 – Amount held for affiliates and other organizations (319,758) 45,178 Accrued severance payable (306,606) (237,423) Deferred income (636,733) 141,645
Net cash provided by operating activities 14,390,410 38,735,908
CASH FLOWS FROM INVESTING ACTIVITIES Issuance of notes receivable (600,000) (1,200,000) Repayment of notes receivable 1,116,667 1,116,667 Purchases of investments (50,782,899) (14,350,009) Proceeds from sale of investments 6,184,000 13,097,238 Proceeds from sale of property and equipment 11,050 – Purchases of property and equipment (2,371,105) (3,729,969)
Net cash used in investing activities (46,442,287) (5,066,073)
NET CHANGE IN CASH AND CASH EQUIVALENTS (32,051,877) 33,669,835
CASH AND CASH EQUIVALENTS Beginning of year 229,875,920 196,206,085
End of year $ 197,824,043 $ 229,875,920
SUPPLEMENTAL DISCLOSURE OF CASH FLOW INFORMATION – CASH PAID DURING THE YEAR
Interest $ 307 $ 81
Income taxes $ 337,420 $ 410,787
See accompanying notes to consolidated financial statements.

13
NATIONAL EDUCATION ASSOCIATION OF THE UNITED STATES AND SUBSIDIARIES
NOTES TO CONSOLIDATED FINANCIAL STATEMENTSAS OF AND FOR THE YEARS ENDED AUGUST 31, 2019 AND 2018
NOTE 1. ORGANIZATION
The National Education Association of the United States (NEA) is a not-for-profit organization incorporated under an Act of the United States Congress . Its mission statement reads: “our mission is to advocate for education professionals and to unite our members and the nation to fulfill the promise of public education to prepare every student to succeed in a diverse and interdependent world .”
To help realize this mission, the NEA adopted a vision of “a great public school for every student .” To achieve our mission, and realize our vision of a great public school for every student, we, the NEA, will grow and strengthen our association and promote quality public education by:
• advancing opportunities that will identify, organize, and engage new and early career educators; amplify the voices of all educators; support our members’ professional growth; and promote social justice for our students, our communities, and our nation;
• securing a pro-public education environment for students, educators, and families; and
• building the capacity of the local, state, and national union to ensure the success of public education .
This vision guided NEA’s strategic plan and budget, which is organized around six Strategic Objectives and its Enterprise Operations .
Strategic Objectives
To grow and strengthen our union, we will organize our members around issues that impact teaching and learning and the lives of our students . In partnership with our affiliates, NEA will:
Increase Educator Voice, Influence, and Professional Authority: Develop and sustain effective structures, processes, and leaders to increase educator influence in decision-making at the worksite, district, state, and national levels .
Recruit and Engage New and Early Career Educators: Identify, recruit, support, and engage new educators in our association, and connect them with opportunities for professional learning, leadership, and advocacy .
Advance Racial Justice in Education: Support members in advancing racial justice in education and improving conditions for students, families, and communities through awareness, capacity-building, partnership, and individual and collective action .
Support Professional Excellence: Build a system of association-convened, educator-led professional learning and supports for all educators across their career continua to ensure student success .

14
NATIONAL EDUCATION ASSOCIATION OF THE UNITED STATES AND SUBSIDIARIES
NOTES TO CONSOLIDATED FINANCIAL STATEMENTSAS OF AND FOR THE YEARS ENDED AUGUST 31, 2019 AND 2018
NOTE 1. ORGANIZATION (CONTINUED)
Secure the Environment to Advance the Mission of the NEA and its Affiliates: Use all available means, including organizing, legal, legislative, electoral, and collective action, to secure the environment necessary to protect the rights of students and educators, and the future of public education .
Enhance Organizational Capacity: Develop and leverage the collective organizational capacity across our association that is necessary to advance the mission of the NEA and its affiliates, with particular focus on organizing, technology, fiscal health, leadership development, and internal and external partnerships .
Enterprise Operations
Ongoing functions across the enterprise that support the strategic objectives, build lasting strength, and sustain the organizational infrastructure .
NOTE 2. SUMMARY OF SIGNIFICANT ACCOUNTING POLICIES
Principles of Consolidation – The consolidated financial statements include the accounts of NEA and its wholly owned subsidiaries: NEA Properties, Inc . (NEAPI), NEA’s Member Benefits Corporation (MBC), and MBC’s wholly-owned subsidiary, the NEA Professional Services Corporation, NEA Advocacy Fund, NEA 360 LLC, and an affiliated entity, National Education Employees Assistance Fund, Inc . (NEEAF) . NEAPI’s primary purpose is to hold title to and manage certain commercial real property in Indiana, collect income from that property and periodically surrender the net proceeds derived to NEA . MBC serves as a contractor for NEA’s member benefits functions . The NEA Advocacy Fund was established as a separate segregated fund to engage in exempt function advocacy . The NEA Advocacy Fund is registered with the Federal Election Commission and files reports with the FEC as required . NEA 360 LLC is an entity that was established to finance and implement a new state-of-the-art membership management system (the NEA360 System) in furtherance of NEA’s mission of advancing public education and MBC’s mission to develop and promote member benefits . NEEAF is combined with the accounts of NEA due to common control and an economic interest . All intercompany accounts and transactions have been eliminated in consolidation .
Measure of Operations – NEA includes in its measure of operations all revenue and expenses that are integral to its continuing core program services with the key objective being predictability of indicated results . Non-operating income and expenses include defined benefit pension charges included in the change in pension obligation other than net periodic pension cost and other charges .
Basis of Presentation – Financial statement presentation follows the recommendations of U .S . generally accepted accounting principles in accordance with Financial Accounting Standards Board (FASB) Accounting Standards Codification, Not-for-Profit Entities – Presentation of Financial Statements. Under those principles, NEA is required to report information regarding its financial position and activities according to two classes of net assets—net assets without donor restrictions and net assets with donor restrictions .

15
NATIONAL EDUCATION ASSOCIATION OF THE UNITED STATES AND SUBSIDIARIES
NOTES TO CONSOLIDATED FINANCIAL STATEMENTSAS OF AND FOR THE YEARS ENDED AUGUST 31, 2019 AND 2018
NOTE 2. SUMMARY OF SIGNIFICANT ACCOUNTING POLICIES (CONTINUED)
Method of Accounting – The accompanying consolidated statements are prepared on the accrual basis of accounting . Accordingly, revenue is recognized when earned and expenses are recognized as incurred . To ensure observance of its bylaws, the resources of NEA are classified internally for accounting and reporting purposes into funds established according to their nature and purpose . The assets, liabilities, net assets, and changes in net assets are reported in the following two fund groups:
• General Operating Fund – The bylaws of NEA provide that the General Operating Fund shall comprise all income received in the form of dues, interest, dividends, fees, earnings from advertising, sales of NEA publications, payments for services, and funds received by gift, bequest, devise, or transfer to NEA, which are not specifically designated for deposit in the Capital Improvement Fund .
• Special Purpose Funds – The Special Purpose Funds are grouped for reporting purposes into Related Entity, Bylaw, and Other Special Purpose Funds . The Related Entity Special Purpose Funds are Member Benefits Corporation (MBC), NEA Properties, Inc . (NEAPI), NEA 360 LLC, NEA Advocacy Fund, and the National Education Employees Assistance Fund (NEEAF) . The Bylaw mandated Special Purpose Funds are the Capital Improvement Fund, Great Public Schools Fund, Special Dues Ballot Fund, Special Dues Media Fund and the UniServ Fund . The Other Special Purpose Funds are the Cash Stabilization, External Partnership Grants, Infrastructure Reserve Fund, National Issues Advancement Fund, Membership Organizing, Rising America Majority Fund and the NEA-Life Membership Fund .
Net Assets – Net assets are reported in two distinct classes as follows:
• Net assets without donor restrictions – These net assets are available to finance the general operations of NEA . The only limits on the use of net assets without donor restrictions are the broad limits resulting from the nature of NEA, the environment in which it operates, and the purposes specified in its organizing documents .
• Net assets with donor restrictions – These net assets result from contributions and other inflows of assets, the use of which by NEA is limited by donor-imposed time or purpose restrictions that are either temporary or perpetual .
As of August 31, 2019 and 2018, NEA did not have any net assets with donor restrictions .
Cash and Cash Equivalents – Cash and cash equivalents consist of amounts immediately available for withdrawal, interest-bearing deposits and securities with original maturity of less than three months when purchased and are recorded at cost, which approximates fair value .
Investments – Investments are carried at fair value . Fair value is the price that would be received to sell an asset or paid to transfer a liability in an orderly transaction between market participants at the measurement date . Purchases and sales of investments are recorded on a trade-date basis . Interest income is recorded on the accrual basis . Dividends are recorded on the ex-dividend date .

16
NATIONAL EDUCATION ASSOCIATION OF THE UNITED STATES AND SUBSIDIARIES
NOTES TO CONSOLIDATED FINANCIAL STATEMENTSAS OF AND FOR THE YEARS ENDED AUGUST 31, 2019 AND 2018
Property and Equipment – Property and equipment are recorded at cost . Depreciation is provided using the straight-line method over the estimated useful lives of the respective assets . The estimated useful lives range from 2 to 15 years for furniture, fixtures, and equipment and 25 to 40 years for buildings and leasehold improvements .
NEA capitalizes direct costs incurred during the application development and implementation stages for developing software for internal use . These software costs are depreciated using the straight-line method over the estimated useful life of the software, generally three to ten years . All costs incurred during the preliminary project stage are expensed as incurred .
Depreciation and amortization expense were $5,244,603 and $5,004,936 for the years ended August 31, 2019 and 2018, respectively, and is reflected in NEA’s support services expenses in the consolidated statements of activities and changes in net assets .
Accrued Severance Payable – NEA has a policy entitling employees with over 10 years of service to severance pay equal to 10 weeks of salary . NEA’s accrued severance pay has been calculated in accordance with Accounting Standards for Compensation-Nonretirement Postemployment Benefits .
NEA-Life Membership Fund (NEA-Life) – NEA offers life membership through a Special Purpose Fund known as the NEA-Life Membership Fund . NEA-Life dues qualify retired members for certain services provided to active members, as well as services designed specifically for retired persons . NEA-Life dues income is recorded as deferred income when received and amortized using the straight-line method over the estimated life expectancy of its members .
Membership Dues – Membership dues are recognized as income over the membership year, which is September 1 through August 31 . Dues are assessed to members as provided in the bylaws . An estimated provision for uncollectible receivables, write-offs, and cancellations is charged against membership dues revenues .
In accordance with the bylaws, a percentage of the membership dues is allocated to UniServ grants, which are included in NEA’s program services expenses, whereby NEA provides grants to state affiliates to assist in funding their staff representatives, whose responsibilities are to implement, improve, and coordinate programs of NEA and the state affiliates .
Program Revenue – MBC’s program revenue from suppliers represent fees from contracts with various program suppliers . Fees are recognized as revenue in the period in which they are earned . Revenue received in advance and not yet earned is deferred to the applicable period and included on the balance sheet as deferred revenue .
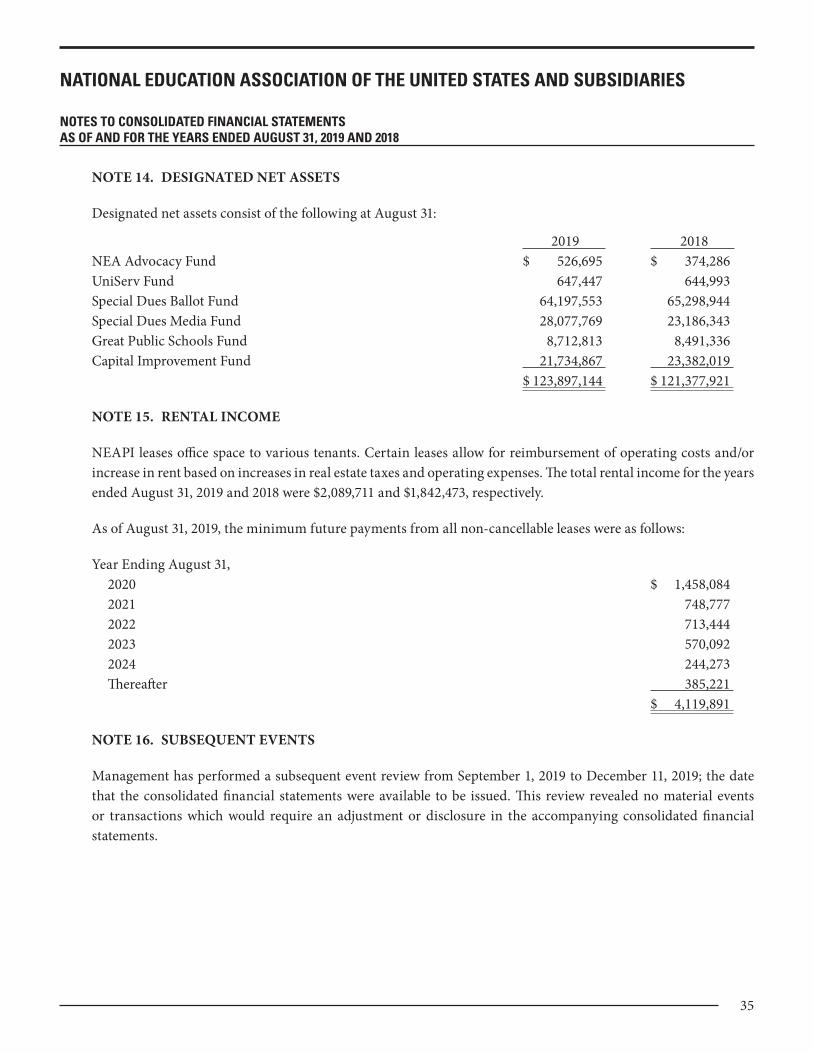
Rental Revenue – NEAPI leases office space to various tenants . Certain leases allow for reimbursement of operating costs and/or increase in rent based on increases in real estate taxes and operating expenses .

17
NATIONAL EDUCATION ASSOCIATION OF THE UNITED STATES AND SUBSIDIARIES
NOTES TO CONSOLIDATED FINANCIAL STATEMENTSAS OF AND FOR THE YEARS ENDED AUGUST 31, 2019 AND 2018
NOTE 2. SUMMARY OF SIGNIFICANT ACCOUNTING POLICIES (CONTINUED)
Income Taxes – NEA follows the authoritative guidance relating to accounting for uncertainty in income taxes included in the Accounting Standards Codification (ASC) Topic on Income Taxes . These provisions provide consistent guidance for the accounting for the uncertainty in income taxes recognized in an entity’s financial statements and prescribe a threshold of “more likely than not” for recognition and derecognition of tax positions taken or expected to be taken in a tax return . NEA believes that it has appropriate support for any tax positions taken and, as such, does not have any uncertain tax positions that are material to the financial statements .
Functional Allocation of Expenses – The costs of providing the various programs and support activities of NEA have been summarized on a functional basis in the consolidated statement of functional expenses . Costs that can be specifically identified with a final cost objective are charged directly to that activity . Other costs are allocated among the program and support services benefited based on management’s best estimates .
Concentration of Risks – Financial instruments that potentially subject NEA to significant concentrations of credit risk principally consist of cash, accounts receivable, and investments . NEA places its cash in a financial institution that is federally insured under the Federal Deposit Insurance Corporation (FDIC) . At August 31, 2019, the cash aggregate balances were in excess of the FDIC insurance limits by approximately $203,607,000 and therefore, bear some risk, since they were not collateralized . NEA has not experienced any losses on its cash to date related to FDIC insurance limits .
MBC had material revenue from two entities representing approximately 75% of revenue for the years ended August 31, 2019 and 2018 .
Estimates – The preparation of consolidated financial statements in conformity with accounting principles generally accepted in the United States of America requires management to make estimates and assumptions that affect the reported amounts of assets and liabilities and disclosure of contingent assets and liabilities at the date of the financial statements and the reported amounts of revenues and expenses during the reporting period . Significant items subject to such estimates and assumptions include the deferred income, useful life of fixed assets, pension asset, reserve for uncollectible receivables, reserve for contingent liabilities, and deferred income taxes . Actual results could differ materially, in the near term, from the amounts reported .

18
NATIONAL EDUCATION ASSOCIATION OF THE UNITED STATES AND SUBSIDIARIES
NOTES TO CONSOLIDATED FINANCIAL STATEMENTSAS OF AND FOR THE YEARS ENDED AUGUST 31, 2019 AND 2018
NOTE 2. SUMMARY OF SIGNIFICANT ACCOUNTING POLICIES (CONTINUED)
New Accounting Pronouncement Adopted – During the year ended August 31, 2019, NEA adopted the provisions of Accounting Standards Update 2016-14, Not-for-Profit Entities: Presentation of Financial Statements of Not-for-Profit Entities (the Update) . The Update amends the reporting model for not-for-profit organizations and enhances required disclosures . The major changes include: requiring the presentation of only two classes of net assets—those with donor restrictions and those without donor restrictions; requiring all not-for-profits to present an analysis of expenses by both function and nature in a single location, generally as a separate financial statement or by disclosure in the notes, and to provide additional information about the methods used to allocate costs across functional reporting categories; requiring disclosure of both quantitative and qualitative information about liquidity and the availability of financial resources; requiring the presentation of investment return net of all external and direct internal expenses . Certain amounts previously reported for the year ended August 31, 2018 were reclassified to conform with the 2019 presentation .
NOTE 3. LIQUIDITY AND AVAILABILITY OF FINANCIAL RESOURCES
As part of NEA’s liquidity management, it has a policy to structure its financial assets to be available as its general expenditures, liabilities, and other obligations come due . In addition, NEA invests cash in excess of its current requirements in a portfolio of investments designed to maximize long-term earnings with acceptable risk to investment principal . The following table represents NEA’s financial assets available to meet cash needs for general expenditures within one year of August 31, 2019 .
2019
Total assets at end of year $ 411,724,421 Less nonfinancial assets Prepaid expenses (3,360,852) Deferred income taxes (845,488) Property and equipment – net of accumulated depreciation (59,956,274) Deferred rent assets (327,251) Deferred leasing commission (281,749) Total nonfinancial assets (64,771,614)
Total 346,952,807
Less amounts not available to meet general expenditures Notes receivable – net of current portion (3,425,000) Pension asset (14,533,797)Financial assets available to meet general expenditures $ 328,994,010
19
NATIONAL EDUCATION ASSOCIATION OF THE UNITED STATES AND SUBSIDIARIES
NOTES TO CONSOLIDATED FINANCIAL STATEMENTSAS OF AND FOR THE YEARS ENDED AUGUST 31, 2019 AND 2018
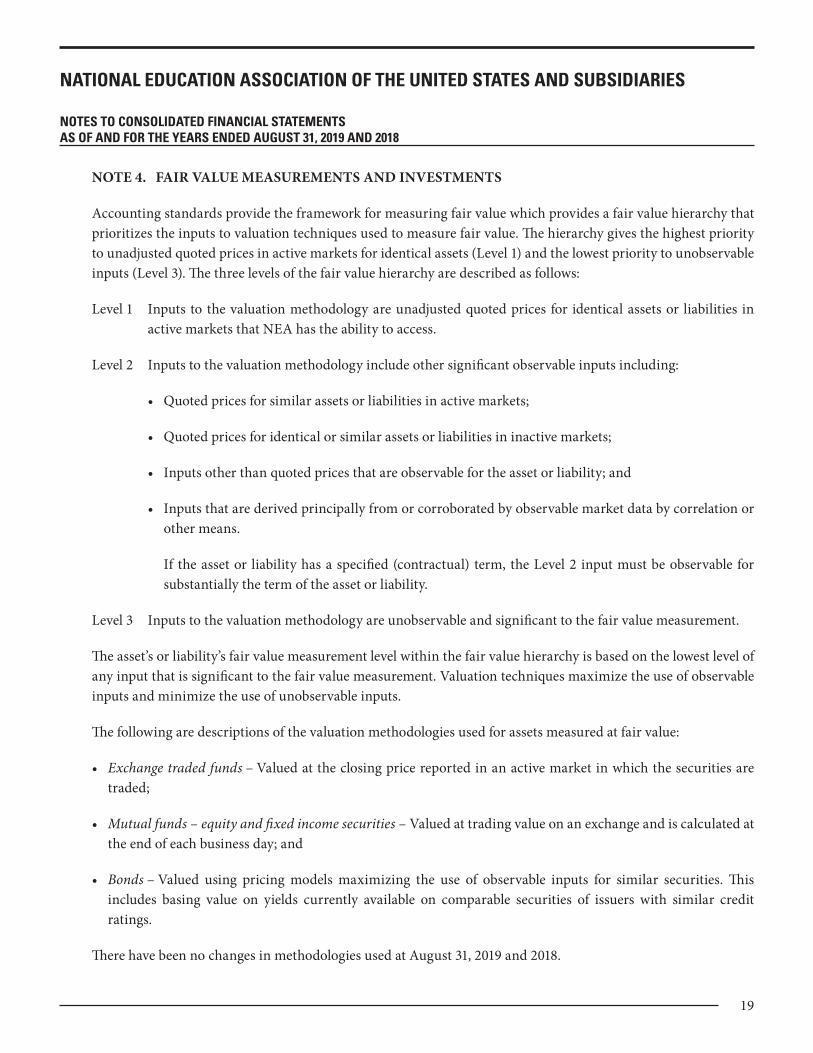
NOTE 4. FAIR VALUE MEASUREMENTS AND INVESTMENTS
Accounting standards provide the framework for measuring fair value which provides a fair value hierarchy that prioritizes the inputs to valuation techniques used to measure fair value . The hierarchy gives the highest priority to unadjusted quoted prices in active markets for identical assets (Level 1) and the lowest priority to unobservable inputs (Level 3) . The three levels of the fair value hierarchy are described as follows:
Level 1 Inputs to the valuation methodology are unadjusted quoted prices for identical assets or liabilities in active markets that NEA has the ability to access .
Level 2 Inputs to the valuation methodology include other significant observable inputs including:
• Quoted prices for similar assets or liabilities in active markets;
• Quoted prices for identical or similar assets or liabilities in inactive markets;
• Inputs other than quoted prices that are observable for the asset or liability; and
• Inputs that are derived principally from or corroborated by observable market data by correlation or other means .
If the asset or liability has a specified (contractual) term, the Level 2 input must be observable for substantially the term of the asset or liability .
Level 3 Inputs to the valuation methodology are unobservable and significant to the fair value measurement .
The asset’s or liability’s fair value measurement level within the fair value hierarchy is based on the lowest level of any input that is significant to the fair value measurement . Valuation techniques maximize the use of observable inputs and minimize the use of unobservable inputs .
The following are descriptions of the valuation methodologies used for assets measured at fair value:
• Exchange traded funds – Valued at the closing price reported in an active market in which the securities are traded;
• Mutual funds – equity and fixed income securities – Valued at trading value on an exchange and is calculated at the end of each business day; and
• Bonds – Valued using pricing models maximizing the use of observable inputs for similar securities . This includes basing value on yields currently available on comparable securities of issuers with similar credit ratings .
There have been no changes in methodologies used at August 31, 2019 and 2018 .

20
NATIONAL EDUCATION ASSOCIATION OF THE UNITED STATES AND SUBSIDIARIES
NOTES TO CONSOLIDATED FINANCIAL STATEMENTSAS OF AND FOR THE YEARS ENDED AUGUST 31, 2019 AND 2018
NOTE 4. FAIR VALUE MEASUREMENTS AND INVESTMENTS (CONTINUED)
The methods described above may produce a fair value calculation that may not be indicative of net realizable value or reflective of future fair values . Furthermore, while NEA believes its valuation methods are appropriate and consistent with other market participants, the use of different methodologies or assumptions to determine the fair value of certain financial instruments could result in a different fair value measurement at the reporting date .
The following tables set forth by level, within the fair value hierarchy, NEA’s assets at fair value as of August 31, 2019 and 2018: 2019 Fair Value Measurements at Reporting Date Using Quoted Prices Significant in Active Other Significant Markets for Observable Unobservable Identical Assets Inputs InputsAsset Class Total (Level 1) (Level 2) (Level 3) Exchange traded funds $ 6,952,700 $ 6,952,700 $ – $ – Mutual funds – equity securities Growth funds 7,392,361 7,392,361 – – Value funds 3,027,882 3,027,882 – – Blend funds 5,095,937 5,095,937 – – Mutual funds – fixed income securities 27,241,393 27,241,393 – – Bonds 40,327,829 – 40,327,829 –
$ 90,038,102 $ 49,710,273 $ 40,327,829 $ –
2018 Fair Value Measurements at Reporting Date Using Quoted Prices Significant in Active Other Significant Markets for Observable Unobservable Identical Assets Inputs InputsAsset Class Total (Level 1) (Level 2) (Level 3) Exchange traded funds $ 7,003,035 $ 7,003,035 $ – $ – Mutual funds – equity securities Growth funds 7,163,919 7,163,919 – – Value funds 3,116,892 3,116,892 – – Blend funds 5,055,149 5,055,149 – – Mutual funds – fixed income securities U .S . fixed income fund 22,330,015 22,330,015 – – $ 44,669,010 $ 44,669,010 $ – $ –

21
NATIONAL EDUCATION ASSOCIATION OF THE UNITED STATES AND SUBSIDIARIES
NOTES TO CONSOLIDATED FINANCIAL STATEMENTSAS OF AND FOR THE YEARS ENDED AUGUST 31, 2019 AND 2018
NOTE 5. NOTES RECEIVABLE
On May 16, 2009, NEA entered into a long-term promissory note agreement with the Indiana State Teachers Association (ISTA) to provide supplemental support and direct loans . The promissory note was unsecured and bore interest at one half of one percent above the London Interbank Offered Rate (LIBOR) per annum . On January 13, 2014, the promissory note was reduced to $15,000,000 and is payable in full on or before January 1, 2028 . The new loan bears a fixed interest rate of 2 .5% . ISTA will receive an annual discount equivalent to the annual interest accrued if all payments are received by due dates for the fiscal year . As of August 31, 2019 and 2018, the total outstanding note balance is $8,500,000 and $9,500,000, respectively . Due to the unsecure nature of the ISTA promissory note, NEA recognized an uncollectible allowance of $4,250,000 and $6,125,680 for fiscal years ended August 31, 2019 and 2018, respectively .
On March 1, 2016, NEA entered into a five-year promissory note agreement with National Board for Professional Teaching Standards (NBPTS) . The promissory note is secured and bears no interest . As of August 31, 2019 and 2018, the outstanding note balance is $850,000 and $900,000, respectively . Due to the unsecure nature of the NBPTS promissory note, NEA recognized an uncollectible allowance of $425,000 and $ - for fiscal years ended August 31, 2019 and 2018, respectively .
On February 7, 2017, NEA entered into a three-year promissory note agreement with Mississippi Association of Educators (MAE) . The promissory note is secured and bears an annual interest rate of 3 .5% . As of August 31, 2019 and 2018, the outstanding note balance is $44,445 and $111,111, respectively .
On February 28, 2018, NEA entered into a three-year loan agreement with Nevada State Education Association . The loan will bear a fixed rate of interest of 3 .5% . No interest shall be accrued prior to the conclusion of NSEA vs . CCEA Litigation . As of August 31, 2019 and 2018, the outstanding loan balance is $1,800,000 and $1,200,000, respectively . NEA recognized an uncollectible allowance of $1,800,000 and $ - for fiscal years ended August 31, 2019 and 2018, respectively .
The total outstanding note receivable balance at August 31, 2019 is reported at $4,719,445 in the accompanying financial statements, which represents the total note amount of $11,194,445, net of the allowance of $6,475,000 .

22
NATIONAL EDUCATION ASSOCIATION OF THE UNITED STATES AND SUBSIDIARIES
NOTES TO CONSOLIDATED FINANCIAL STATEMENTSAS OF AND FOR THE YEARS ENDED AUGUST 31, 2019 AND 2018
NOTE 6. PROPERTY AND EQUIPMENT
Property and equipment consist of the following at August 31:
2019 2018 Land NEA headquarters $ 1,753,777 $ 1,753,777 MBC headquarters 837,002 837,002 NEA Properties 1,943,982 1,943,982 Building improvements NEA headquarters 84,110,791 83,569,469 MBC headquarters 7,874,812 7,683,733 NEA Properties 17,473,813 16,922,186 Furniture, fixtures, and equipment 30,094,624 30,211,882 Software development costs NEA headquarters 49,606,241 49,606,241 NEA 360 LLC 15,403,123 15,403,123 209,098,165 207,931,395
Less: accumulated depreciation and amortization (149,141,891) (145,096,279)
Total property and equipment $ 59,956,274 $ 62,835,116
NOTE 7. COMMITMENTS AND CONTINGENCIES
MBC leases personal property under operating leases that expire over the next year . Personal property lease expense was $89,943 and $111,124 for the years ended August 31, 2019 and 2018, respectively .
Future minimum lease payments, under agreements classified as operating leases with noncancelable terms in excess of one year, are as follows:
Year Ended August 31, 2020 $ 82,459 2021 82,459 2022 100,460
Total future minimum lease payments $ 265,378

23
NATIONAL EDUCATION ASSOCIATION OF THE UNITED STATES AND SUBSIDIARIES
NOTES TO CONSOLIDATED FINANCIAL STATEMENTSAS OF AND FOR THE YEARS ENDED AUGUST 31, 2019 AND 2018
NOTE 8. RETIREMENT BENEFITS
Employees’ Retirement Plan of the National Education Association of the United States – NEA participates in a multiemployer, defined benefit retirement plan for NEA employees that covers substantially all permanent employees . On June 1, 2009, the plan was amended to require employee contributions at a rate of 3 .5% for employees hired by NEA on or after June 9, 2009 . NEA employs approximately 49 .8% of the employees covered under the plan; the remaining 50 .2% are employees of participating state and local affiliates of NEA .
NEA contributes to the multiemployer pension plan jointly administered by NEA’s management and union representatives . The risk of participating in U .S . multiemployer pension plans is different from single employer pension plans in the following aspects:
• Assets contributed to the multiemployer plan by one employer may be used to provide benefits of employment to other participating employers .
• If a participating employer stops contributing to the plan, the unfunded obligations of the plan may be borne by the remaining participating employers .
• If NEA stops participating in its multiemployer pension plan, it may be required to pay the plan an amount based on the underfunded status of the entire plan .
NEA’s participation in the above defined benefit plan for the years ended August 31, 2019 and 2018 is outlined in the following table . All information in the table is as of August 31 of the relevant year unless otherwise noted . The Plan Protection Act (“PPA”) zone status column ranks the funded status of multiemployer pension plans depending upon a plan’s current and projected funding . The zone status is based on information that the Company received from the plan . Among other factors, the plan is in the Red Zone (Critical) if it has a current funded percentage less than 65% . A plan is in the Yellow Zone (Endangered) or Orange Zone (Seriously Endangered) if it has a current funded percentage of less than 80%, or projects a credit balance deficit within seven years . A plan is in the Green Zone (Healthy) if it has a current funded percentage greater than 80% and does not have a projected credit balance deficit within seven years .
The following table contains information about NEA’s multiemployer pension plan for the years ended December 31, 2018 and 2017 .
Pension Protection Act Employer Expiration Date of EIN/Pension Zone Status December 31, Contributions from NEA Contributions (Y/N) Collective-Bargaining Pension Fund Plan Number 2018 2017 8/31/19 8/31/18 2018 2017 Agreement
Employees’ Retirement Plan of the National Education AFSE 6/1/2017 to 5/31/2020; Association of the United IUOE 2/1/2017 to 1/31/2019; States 53-0115260 Green Green $ 20,025,340 $ 21,455,200 Y Y NEASO 6/1/2018 to 5/31/2021

24
NATIONAL EDUCATION ASSOCIATION OF THE UNITED STATES AND SUBSIDIARIES
NOTES TO CONSOLIDATED FINANCIAL STATEMENTSAS OF AND FOR THE YEARS ENDED AUGUST 31, 2019 AND 2018
NOTE 8. RETIREMENT BENEFITS (CONTINUED)
For the years ended December 31, 2018 and 2017, NEA was listed on the Plan’s 5500 as providing more the five (5) percent of the total contribution for the Plan years . NEA currently has no intention of withdrawing from this multiemployer pension plan .
NEA – 401(k) Retirement Savings Plan – NEA’s employees are also eligible to participate in the 401(k) Retirement Savings Plan of the National Education Association (the Plan) in which the employee can make voluntary, tax-deferred contributions within specified limits . The Plan was established under the provisions of Internal Revenue Code Subsection 401(k) and has received a favorable determination as to its tax status . NEA’s contributions to the Plan amounted to $731,000 and $272,853 for the years ended August 31, 2019 and 2018, respectively .
NEA – Postretirement Benefit Plan – In addition to providing pension benefits, NEA provides certain healthcare and life insurance benefits to retirees . Prior to March 1, 2000, NEA provided these benefits under a single employer defined postretirement plan .
Effective March 1, 2000, NEA established and adopted the National Education Association and Affiliate Retiree Health Plan (the Plan) and Trust (the Trust) for the purpose of providing certain healthcare and life insurance benefits to eligible and retired employees of NEA and to participating affiliates . The Plan is a multiemployer postretirement benefits plan . The Internal Revenue Service has approved the Plan and the Trust .
As a result of the adoption of the multiemployer plan, the Trust assumed the responsibility for the payment of benefits and all future obligations under the Plan . NEA’s liability under the single employer plan as of March 1, 2000, which amounted to $29,427,901 was recognized as a non-operating charge in NEA’s consolidated statements of activities and changes in net assets . As of August 31, 2019 and 2018, none of NEA’s net assets were reserved for postretirement benefit obligation .
Postretirement benefit expense under the multiemployer plan was $15,262,600 and $18,603,900 for the years ended August 31, 2019 and 2018, respectively .
MBC – 401(k) Salary Deferral Plan – NEA’s Member Benefits Corporation (MBC) maintains a Section 401(k) cash or deferred plan in which the employee can make voluntary, tax-deferred contributions within specified limits . The plan was established under the provision of the Internal Revenue Code Subsection 401(k) and has received a favorable determination as to its tax status .
MBC’s contributions to the plan, based upon a set percentage of employee contributions, amounted to $282,923 and $285,057, for the years ended August 31, 2019 and 2018, respectively .
MBC – Defined Contribution Plan – MBC maintains a Defined Contribution Plan and Trust, which is noncontributory for MBC’s employees, and covers substantially all members of the NEA Staff Organization (NEASO) Collective Bargaining Unit . MBC contributes to the plan a percentage of compensation as set forth in a collective bargaining agreement with NEASO .

25
NATIONAL EDUCATION ASSOCIATION OF THE UNITED STATES AND SUBSIDIARIES
NOTES TO CONSOLIDATED FINANCIAL STATEMENTSAS OF AND FOR THE YEARS ENDED AUGUST 31, 2019 AND 2018
NOTE 8. RETIREMENT BENEFITS (CONTINUED)
MBC’s contributions to the plan during the years ended August 31, 2019 and 2018 were $875,856 and $761,557, respectively .
MBC – Defined Benefit Plan – MBC maintains a noncontributory defined benefit pension plan covering substantially all employees not covered by a collective bargaining agreement . MBC has an August 31 measurement date for its pension plan .
Benefit obligation, plan assets, and the funded status of the Plan at August 31, were as follows:
2019 2018 Benefit obligation $ 43,667,263 $ 36,251,180 Fair value of plan investments 58,201,060 54,812,742 Funded status of the plan 14,533,797 18,561,562
The discount rate used in the calculation of the benefit obligation decreased to 2 .75% from 4 .00% .
Contributions to the Plan and benefits paid for the year ended August 31, were as follows:
2019 2018 Employer contributions $ 3,000,000 $ 2,400,000 Benefits paid 923,174 725,213
Amounts recognized in the statements of financial position consisted of:
2019 2018 Non-current assets $ 14,533,797 $ 18,561,562
Amounts recognized in non-operating activities consisted of:
2019 2018 Net actuarial loss $ 17,641,448 $ 9,944,123 Prior service cost 452,623 894,783 Total (before tax effects) 18,094,071 10,838,906 Tax effects (4,564,534) (3,153,284) $ 13,529,537 $ 7,685,622
The accumulated benefit obligation is $40,436,171 and $33,672,495 at August 31, 2019 and 2018, respectively .
Net periodic cost (benefit) is ($227,400) and $168,078 for the years ended August 31, 2019 and 2018, respectively .

26
NATIONAL EDUCATION ASSOCIATION OF THE UNITED STATES AND SUBSIDIARIES
NOTES TO CONSOLIDATED FINANCIAL STATEMENTSAS OF AND FOR THE YEARS ENDED AUGUST 31, 2019 AND 2018
NOTE 8. RETIREMENT BENEFITS (CONTINUED)
Other changes in plan assets and benefit obligations recognized in non-operating (income) loss (before tax effects) were as follows:
2019 2018 Net loss $ 8,407,970 $ 1,127,155 Recognized gain (710,645) (742,655)Amortization of prior service cost (442,160) (694,399)Total recognized in other non-operating activities $ 7,255,165 $ (309,899)
Total recognized in net periodic benefit cost and other non-operating activities $ 7,027,765 $ (141,821)
Amounts expected to be recognized in net periodic cost in the coming year are as follows:
Recognized loss $ 1,651,025 Prior service cost recognition 374,283
Weighted-average assumptions used to determine benefit obligations at August 31, were as follows:
2019 2018 Discount rate 2 .75% 4 .00%Rate of salary increases 4 .00% 4 .00%
Weighted-average assumptions used to determine net periodic benefit cost for the years ended August 31 were as follows:
2019 2018 Discount rate 4 .00% 3 .75%Rate of salary increases 4 .00% 4 .00%Expected long-term rate of return on assets 8 .00% 8 .00%
MBC determines the long-term expected rate of return on plan assets by examining historic capital market returns, correlations between asset classes and the plan’s normal asset allocation . Current and near-term market factors such as inflation and interest rates are then evaluated to arrive at the expected return on plan assets . Peer group, or benchmarking data are also reviewed to ensure a reasonable and appropriate return assumption .

27
NATIONAL EDUCATION ASSOCIATION OF THE UNITED STATES AND SUBSIDIARIES
NOTES TO CONSOLIDATED FINANCIAL STATEMENTSAS OF AND FOR THE YEARS ENDED AUGUST 31, 2019 AND 2018
NOTE 8. RETIREMENT BENEFITS (CONTINUED)
MBC utilizes a total return investment approach based on modern portfolio theory . Multiple asset classes are implemented in order to obtain the benefits of diversification and maximize long-term total return for a given level of risk . Risk tolerance is developed by reviewing the funded status of the plan, duration of the plan liabilities, the income and liquidity requirements, legal constraints, and the financial condition of MBC . The investment portfolio is comprised of a diversified combination of equities, fixed income securities, alternative investments, and cash equivalents . MBC’s investment policy states that the target allocations for plan assets are 64% equity securities, 22% fixed income securities, 10% alternative investments, and 4% cash equivalents . The allocation among equities and fixed income securities is determined by prevailing market conditions and relative valuations between asset classes . The Plan’s financial condition is monitored on an ongoing basis by means of quarterly investment portfolio reviews, an annual independent actuarial valuation, and periodic asset/liability studies .
Pension plan allocations at August 31, were as follows:
2019 2018 Equities 56% 58%Fixed income securities 22% 23%Alternative investments 10% 10%Cash equivalents 12% 9%
Total 100% 100%
28
NATIONAL EDUCATION ASSOCIATION OF THE UNITED STATES AND SUBSIDIARIES
NOTES TO CONSOLIDATED FINANCIAL STATEMENTSAS OF AND FOR THE YEARS ENDED AUGUST 31, 2019 AND 2018
NOTE 8. RETIREMENT BENEFITS (CONTINUED)
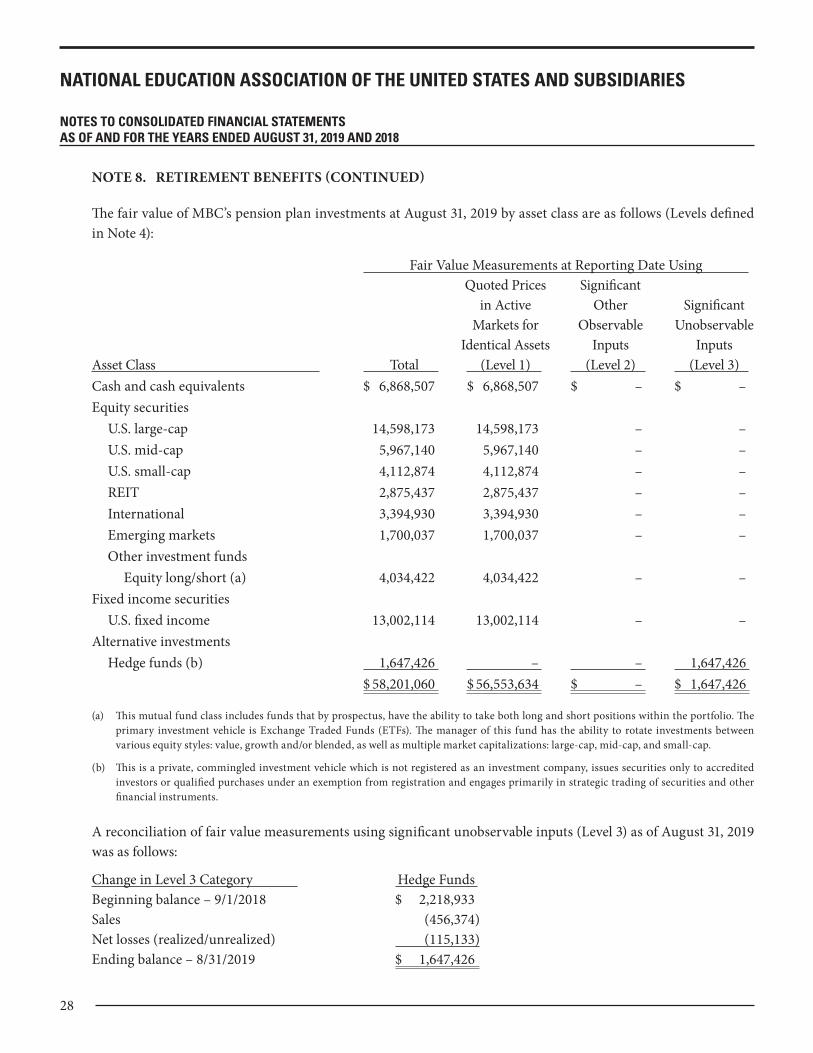
The fair value of MBC’s pension plan investments at August 31, 2019 by asset class are as follows (Levels defined in Note 4):
Fair Value Measurements at Reporting Date Using Quoted Prices Significant in Active Other Significant Markets for Observable Unobservable Identical Assets Inputs InputsAsset Class Total (Level 1) (Level 2) (Level 3) Cash and cash equivalents $ 6,868,507 $ 6,868,507 $ – $ – Equity securities U .S . large-cap 14,598,173 14,598,173 – – U .S . mid-cap 5,967,140 5,967,140 – – U .S . small-cap 4,112,874 4,112,874 – – REIT 2,875,437 2,875,437 – – International 3,394,930 3,394,930 – – Emerging markets 1,700,037 1,700,037 – – Other investment funds Equity long/short (a) 4,034,422 4,034,422 – – Fixed income securities U .S . fixed income 13,002,114 13,002,114 – – Alternative investments Hedge funds (b) 1,647,426 – – 1,647,426 $ 58,201,060 $ 56,553,634 $ – $ 1,647,426
(a) This mutual fund class includes funds that by prospectus, have the ability to take both long and short positions within the portfolio . The primary investment vehicle is Exchange Traded Funds (ETFs) . The manager of this fund has the ability to rotate investments between various equity styles: value, growth and/or blended, as well as multiple market capitalizations: large-cap, mid-cap, and small-cap .
(b) This is a private, commingled investment vehicle which is not registered as an investment company, issues securities only to accredited investors or qualified purchases under an exemption from registration and engages primarily in strategic trading of securities and other financial instruments .
A reconciliation of fair value measurements using significant unobservable inputs (Level 3) as of August 31, 2019 was as follows:
Change in Level 3 Category Hedge Funds Beginning balance – 9/1/2018 $ 2,218,933 Sales (456,374)Net losses (realized/unrealized) (115,133)Ending balance – 8/31/2019 $ 1,647,426

29
NATIONAL EDUCATION ASSOCIATION OF THE UNITED STATES AND SUBSIDIARIES
NOTES TO CONSOLIDATED FINANCIAL STATEMENTSAS OF AND FOR THE YEARS ENDED AUGUST 31, 2019 AND 2018
NOTE 8. RETIREMENT BENEFITS (CONTINUED)
The fair value of MBC’s pension plan assets at August 31, 2018 by asset class are as follows:
Fair Value Measurements at Reporting Date Using Quoted Prices Significant in Active Other Significant Markets for Observable Unobservable Identical Assets Inputs InputsAsset Class Total (Level 1) (Level 2) (Level 3) Cash and cash equivalents $ 4,696,287 $ 4,696,287 $ – $ – Equity securities U .S . large-cap 15,125,756 15,125,756 – – U .S . mid-cap 5,779,671 5,779,671 – – U .S . small-cap 2,882,513 2,882,513 – – REIT 2,509,628 2,509,628 – – International 4,285,348 4,285,348 – – Emerging markets 1,211,350 1,211,350 – – Other investment funds Equity long/short (a) 3,370,544 3,370,544 – – Fixed income securities U .S . fixed income 10,871,362 10,871,362 – – International fixed income 1,861,350 1,861,350 – – Alternative investments Hedge funds (b) 2,218,933 – – 2,218,933 $ 54,812,742 $ 52,593,809 $ – $ 2,218,933
(a) This mutual fund class includes funds that by prospectus, have the ability to take both long and short positions within the portfolio . The primary investment vehicle is Exchange Traded Funds (ETFs) . The manager of this fund has the ability to rotate investments between various equity styles: value, growth and/or blended, as well as multiple market capitalizations: large-cap, mid-cap, and small-cap .
(b) This is a private, commingled investment vehicle which is not registered as an investment company, issues securities only to accredited investors or qualified purchases under an exemption from registration and engages primarily in strategic trading of securities and other financial instruments .
A reconciliation of fair value measurements using significant unobservable inputs (Level 3) as of August 31, 2018 was as follows:
Change in Level 3 Category Hedge Funds Beginning balance – 9/1/2017 $ 3,555,793 Sales (1,528,139)Net gain (realized/unrealized) 191,279 Ending balance – 8/31/2018 $ 2,218,933

30
NATIONAL EDUCATION ASSOCIATION OF THE UNITED STATES AND SUBSIDIARIES
NOTES TO CONSOLIDATED FINANCIAL STATEMENTSAS OF AND FOR THE YEARS ENDED AUGUST 31, 2019 AND 2018
NOTE 8. RETIREMENT BENEFITS (CONTINUED)
The following estimates and assumptions were used to determine the fair value of each class of financial instruments listed above:
• Cash Equivalents – Cash equivalents include cash deposits in investment funds, money market funds, and short-term U .S . Treasury securities, which are actively traded . Cash equivalents are priced using independent market prices in the primary trading market and are classified as Level l based on the availability of quotes for identical assets .
• Equity Securities – Equity investments include stocks, separately held accounts, and mutual funds . These securities are valued daily based on the quoted market price at the end of the business day . These assets, which are grouped by investment objective, consist of publicly traded securities, diversified globally, and are classified as Level 1 .
• Fixed Income Securities – These assets include mutual funds with fixed income portfolios . These assets are valued using market prices, such as broker quotes, for the same instruments; as these securities typically trade in active markets, they are categorized as Level l .
• Alternative Investments – Valued based on information provided by Fund manager .
For the 2020 plan year, the MBC’s funding policy is to contribute at least the amount of the Funding Target Normal Cost for the fiscal year ending August 31, 2020 .
Benefit payments expected to be paid over the next five years and accumulated over the five years thereafter are as follows as of August 31:
2020 $ 1,143,976 2021 1,305,714 2022 1,461,386 2023 1,624,353 2024 1,744,078 2025–2029 10,621,385
NOTE 9. NATIONAL EDUCATION EMPLOYEES ASSISTANCE FUND, INC.
The National Education Employee Assistance Fund, Inc . (NEEAF) is a nonprofit corporation established to guarantee loans for members of the NEA and participating state affiliates during work stoppages through the pooling of credit of NEEAF and participating state affiliates . Participating state affiliates are required to secure either a letter of credit or designate cash as part of the guarantee . Loans are guaranteed for one year following the end of the work stoppage, unless approved by the NEEAF Board of Directors . Two-thirds of the interest on the loans is paid by the participating state affiliate while NEEAF, pays one-third of the interest . The participating state affiliate and NEEAF share one-half each of any unpaid principal on defaulted loans .

31
NATIONAL EDUCATION ASSOCIATION OF THE UNITED STATES AND SUBSIDIARIES
NOTES TO CONSOLIDATED FINANCIAL STATEMENTSAS OF AND FOR THE YEARS ENDED AUGUST 31, 2019 AND 2018
NOTE 9. NATIONAL EDUCATION EMPLOYEES ASSISTANCE FUND, INC. (CONTINUED)
At its annual meeting held on June 29, 2017, the members of NEEAF unanimously authorized the dissolution of NEEAF as an entity . As of August 31, 2018, all participating state affiliates withdrew their membership from NEEAF and, as a result, NEEAF ceased to exist as an entity . NEEAF is still obligated for its share of interest and defaulted loans on all outstanding loans as of August 31, 2018 through their maturity dates . The outstanding loans at year-end mature between October 2018 and April 2019 . NEAAF accrued $42,718 to fulfill its obligation for payment of any interest expense and defaulted loan principal for loans outstanding as of August 31, 2018 .
NOTE 10. THE NEA FOUNDATION FOR THE IMPROVEMENT OF EDUCATION
The NEA Foundation for the Improvement of Education (NFIE) was created in 1969 by NEA as a tax-exempt public charity to improve the quality of public education in the United States . The NFIE has a separate Board of Directors and operates independently of NEA . Accordingly, the accompanying financial statements do not include the activities of NFIE .
The NFIE empowers public education employees to innovate, take risks, and become agents for change to improve teaching and learning in our society .
During the years ended August 31, 2019 and 2018, payments totaling $1,815,131 and $1,844,132, respectively, were made to NFIE for an endowment that will help fund programs to meet critical needs of students and education employees in years to come . Such amounts are reflected as reductions in “NEA Programs – Dues” in the consolidated statements of activities and changes in net assets for the years ended August 31, 2019 and 2018 .
NOTE 11. NEA MEMBERS INSURANCE TRUST
The National Education Association Members Insurance Trust (NEA-MIT) was organized to provide certain employee welfare benefits to NEA members and their dependents, pursuant to the NEA Members Insurance Plan .
NEA is the sponsor and administrator of the welfare plans that NEA-MIT provides . NEA may appoint and remove the trustees of NEA-MIT . NEA-MIT maintains an agreement with MBC to provide administrative and promotional services for the programs .
NEA and NEA-MIT have an agreement whereby NEA provided systems administration, maintenance, software development and facilities management in the amount of $579,874 and $603,705 for the years ended August 31, 2019 and 2018, respectively .

32
NATIONAL EDUCATION ASSOCIATION OF THE UNITED STATES AND SUBSIDIARIES
NOTES TO CONSOLIDATED FINANCIAL STATEMENTSAS OF AND FOR THE YEARS ENDED AUGUST 31, 2019 AND 2018
NOTE 12. INCOME TAXES
Under provisions of Section 501(c) of the Internal Revenue Code and the applicable income tax regulations of the District of Columbia, NEA is exempt from taxes on income, other than taxes on unrelated business income .
MBC follows the liability method of accounting for income taxes as required by the FASB Accounting Standards Income Taxes . Income tax expense is recognized based on the amount of income taxes currently payable or refundable plus the net change during the year in the deferred tax liability or asset . The current or deferred tax consequences of all events that have been recognized in the consolidated financial statements are measured based on provisions of enacted tax law .
The provision (benefit) for Federal and State income taxes is included in support service expenses on the consolidated statements of activities and changes in net assets and consists of the following:
2019 2018 Current provision Federal $ 485,835 $ 240,935 State 64,912 34,394 550,747 275,329 Deferred provision (benefit) Federal (413,854) (1,481,778) State 187,030 74,395 (226,824) (1,407,383) Total $ 323,923 $ (1,132,054)
A reconciliation of income taxes at the statutory rate to the provision (benefit) for income taxes in the consolidated financial statements is as follows:
2019 2018 Federal income tax provision at the statutory rate $ 1,037,897 $ 755,822 State income tax expense, net of federal benefit 165,029 91,497 Permanent differences 33,361 42,797 Temporary differences (912,364) (2,022,170) Total $ 323,923 $ (1,132,054)

33
NATIONAL EDUCATION ASSOCIATION OF THE UNITED STATES AND SUBSIDIARIES
NOTES TO CONSOLIDATED FINANCIAL STATEMENTSAS OF AND FOR THE YEARS ENDED AUGUST 31, 2019 AND 2018
NOTE 12. INCOME TAXES (CONTINUED)
At August 31, 2019 and 2018, the deferred tax assets and liabilities represent the tax effects of the following temporary differences:
2019 2018 Assets Deferred income $ 304,444 $ 440,804 Accrued vacation 226,947 274,263 State taxes 271,558 280,212 Other 42,539 145,425 Gross deferred tax assets 845,488 1,140,704 Liabilities Pension costs (3,666,394) (5,461,852) Other (42,081) (41,968) Gross deferred tax liabilities (3,708,475) (5,503,820) Total $ (2,862,987) $ (4,363,116)

34
NATIONAL EDUCATION ASSOCIATION OF THE UNITED STATES AND SUBSIDIARIES
NOTES TO CONSOLIDATED FINANCIAL STATEMENTSAS OF AND FOR THE YEARS ENDED AUGUST 31, 2019 AND 2018
NOTE 13. CHANGE IN PENSION OBLIGATION OTHER THAN NET PERIODIC PENSION COST
The tax effects allocated to each component of the change in actuarial gain (loss) from the MBC defined benefit plan for the years ended August 31, 2019 and 2018 are:
2019 Tax Before-Tax (Expense) Net-Tax Amount or Benefit Amount Defined Benefit Pension Plan Net gain (loss) arising during period $ (8,407,970) $ 1,593,619 $ (6,814,351) Recognized gain (loss) 710,645 (134,693) 575,952 Less: amortization of prior service cost included in net periodic pension cost 442,160 (83,806) 358,354 Total pension related other non-operating income (loss) (7,255,165) 1,375,120 (5,880,045)Unrealized gain (loss) from investments Unrealized holding gain (loss) arising during period 335,320 (101,815) 233,505 Other non-operating income (loss) $ (6,919,845) $ 1,273,305 $ (5,646,540)
2018 Tax Before-Tax (Expense) Net-Tax Amount or Benefit Amount Defined Benefit Pension Plan Net gain (loss) arising during period $ (1,127,155) $ 3,880,008 $ 2,752,853 Recognized gain (loss) 742,655 (2,556,443) (1,813,788) Less: amortization of prior service cost included in net periodic pension cost 694,399 (2,390,331) (1,695,932) Total pension related other non-operating income (loss) 309,899 (1,066,766) (756,867)Unrealized loss from investments: Unrealized holding loss arising during period (92,286) (665) (92,951)Other non-operating income (loss) $ 217,613 $ (1,067,431) $ (849,818)
35
NATIONAL EDUCATION ASSOCIATION OF THE UNITED STATES AND SUBSIDIARIES
NOTES TO CONSOLIDATED FINANCIAL STATEMENTSAS OF AND FOR THE YEARS ENDED AUGUST 31, 2019 AND 2018
NOTE 14. DESIGNATED NET ASSETS
Designated net assets consist of the following at August 31:
2019 2018 NEA Advocacy Fund $ 526,695 $ 374,286 UniServ Fund 647,447 644,993 Special Dues Ballot Fund 64,197,553 65,298,944 Special Dues Media Fund 28,077,769 23,186,343 Great Public Schools Fund 8,712,813 8,491,336 Capital Improvement Fund 21,734,867 23,382,019 $ 123,897,144 $ 121,377,921
NOTE 15. RENTAL INCOME
NEAPI leases office space to various tenants . Certain leases allow for reimbursement of operating costs and/or increase in rent based on increases in real estate taxes and operating expenses . The total rental income for the years ended August 31, 2019 and 2018 were $2,089,711 and $1,842,473, respectively .
As of August 31, 2019, the minimum future payments from all non-cancellable leases were as follows:
Year Ending August 31, 2020 $ 1,458,084 2021 748,777 2022 713,444 2023 570,092 2024 244,273 Thereafter 385,221 $ 4,119,891
NOTE 16. SUBSEQUENT EVENTS
Management has performed a subsequent event review from September 1, 2019 to December 11, 2019; the date that the consolidated financial statements were available to be issued . This review revealed no material events or transactions which would require an adjustment or disclosure in the accompanying consolidated financial statements .

36
NATIONAL EDUCATION ASSOCIATION OF THE UNITED STATES AND SUBSIDIARIES
SUPPLEMENTAL SCHEDULE OF FINANCIAL POSITION BY FUND INFORMATIONAS OF AUGUST 31, 2019 (WITH COMPARATIVE TOTALS AS OF AUGUST 31, 2018)
General Special 2019 2018 Operating Purpose Consolidating Total Total Fund Funds Entries Funds Funds ASSETS
CURRENT ASSETS Cash and cash equivalents $ 78,915,395 $ 118,237,104 $ 671,544 $ 197,824,043 $ 229,875,920 Short term investments 40,327,829 – – 40,327,829 – Membership dues receivable – net 30,985,331 – – 30,985,331 31,086,987 Amount due from affiliates and other organizations – net 2,722,491 – (1,416,976) 1,305,515 1,075,655 Accounts receivable 331,948 6,857,624 (14,605) 7,174,967 7,452,647 Notes receivable 1,294,445 – – 1,294,445 1,116,666 Prepaid expenses 2,394,381 966,471 – 3,360,852 5,115,601 Amount due from other funds – 54,350,325 (54,350,325) – – Other current assets 371,607 – – 371,607 337,884 Total current assets 157,343,427 180,411,524 (55,110,362) 282,644,589 276,061,360
LONG-TERM ASSETS Notes receivable – net 3,425,000 – – 3,425,000 4,468,765 Deferred rent assets – 327,251 – 327,251 245,461 Deferred leasing commission – 281,749 – 281,749 311,181 Investments – 49,710,273 – 49,710,273 44,669,010 Pension asset – 14,533,797 – 14,533,797 18,561,562 Deferred income taxes – 845,488 – 845,488 1,140,704 Property and equipment – net 4,995,851 54,960,423 – 59,956,274 62,835,116 Total long-term assets 8,420,851 120,658,981 – 129,079,832 132,231,799
TOTAL ASSETS $ 165,764,278 $ 301,070,505 $ (55,110,362) $ 411,724,421 $ 408,293,159
LIABILITIES AND NET ASSETS
CURRENT LIABILITIES Accounts payable $ 8,116,936 $ 3,246,466 $ (53,686) $ 11,309,716 $ 25,798,674 Income taxes payable – 288,244 – 288,244 – Accrued liabilities 6,788,401 4,763,437 – 11,551,838 12,575,066 Deferred income – 1,606,121 – 1,606,121 1,526,631 Notes payable – 8,119 – 8,119 8,119 Accrued annual leave 6,041,673 – – 6,041,673 5,620,396 Amount due to other funds 53,906,158 – (53,906,158) – – Amount due to general fund – 1,150,518 (1,150,518) – – Amount held for affiliates and other organizations 960,682 – – 960,682 1,280,440 Total current liabilities 75,813,850 11,062,905 (55,110,362) 31,766,393 46,809,326
LONG-TERM LIABILITIES Notes Payable – 2,631 – 2,631 10,751 Accrued severance payable 5,498,711 – – 5,498,711 5,805,317 Deferred income – 15,332,687 – 15,332,687 16,048,910 Deferred income taxes – 3,708,475 – 3,708,475 5,503,820 Total long-term liabilities 5,498,711 19,043,793 – 24,542,504 27,368,798
TOTAL LIABILITIES 81,312,561 30,106,698 (55,110,362) 56,308,897 74,178,124
NET ASSETS WITHOUT DONOR RESTRICTIONS Undesignated net assets 84,451,717 147,066,663 – 231,518,380 212,737,114 Designated net assets – 123,897,144 – 123,897,144 121,377,921 Total net assets without donor restrictions 84,451,717 270,963,807 – 355,415,524 334,115,035
TOTAL LIABILITIES AND NET ASSETS $ 165,764,278 $ 301,070,505 $ (55,110,362) $ 411,724,421 $ 408,293,159

37
NATIONAL EDUCATION ASSOCIATION OF THE UNITED STATES AND SUBSIDIARIES
SUPPLEMENTAL SCHEDULE OF FINANCIAL POSITION BY SPECIAL PURPOSE FUND INFORMATIONAS OF AUGUST 31, 2019 (WITH COMPARATIVE TOTALS AS OF AUGUST 31, 2018)
Related Entity Bylaw Other 2019 2018 Special Special Special Total Total Purpose Funds Purpose Funds Purpose Funds Funds Funds ASSETS
CURRENT ASSETS Cash and cash equivalents $ 11,603,060 $ 79,366,745 $ 27,267,299 $ 118,237,104 $ 125,414,729 Accounts receivable 6,829,726 – 27,898 6,857,624 8,360,651 Prepaid expenses 966,471 – – 966,471 1,314,759 Amount due from general fund 52,470 24,998,469 29,299,386 54,350,325 28,324,965 Total current assets 19,451,727 104,365,214 56,594,583 180,411,524 163,415,104
LONG-TERM ASSETS Deferred rent assets 327,251 – – 327,251 245,461 Deferred leasing commission 281,749 – – 281,749 311,181 Investments 9,507,942 – 40,202,331 49,710,273 44,669,010 Pension asset 14,533,797 – – 14,533,797 18,561,562 Deferred income taxes 845,488 – – 845,488 1,140,704 Property and equipment – net 33,225,556 21,734,867 – 54,960,423 58,310,296 Total long-term assets 58,721,783 21,734,867 40,202,331 120,658,981 123,238,214
TOTAL ASSETS $ 78,173,510 $ 126,100,081 $ 96,796,914 $ 301,070,505 $ 286,653,318
LIABILITIES AND NET ASSETS
CURRENT LIABILITIES Accounts payable $ 3,111,863 $ 75,314 $ 59,289 $ 3,246,466 $ 7,114,155 Income taxes payable 288,244 – – 288,244 – Accrued liabilities 1,857,206 2,654,318 251,913 4,763,437 2,208,413 Deferred income 557,158 – 1,048,963 1,606,121 1,526,631 Notes Payabe 8,119 – – 8,119 8,119 Amount due to general fund 758,821 – 391,697 1,150,518 101,664 Total current liabilities 6,581,411 2,729,632 1,751,862 11,062,905 10,958,982
LONG-TERM LIABILITIES Notes payable 2,631 – – 2,631 10,751 Deferred income 923,927 – 14,408,760 15,332,687 16,048,910 Deferred income taxes 3,708,475 – – 3,708,475 5,503,820 Total long-term liabilities 4,635,033 – 14,408,760 19,043,793 21,563,481 Total liabilities 11,216,444 2,729,632 16,160,622 30,106,698 32,522,463
NET ASSETS WITHOUT DONOR RESTRICTIONS Undesignated net assets 66,430,371 – 80,636,292 147,066,663 132,752,934 Designated net assets 526,695 123,370,449 – 123,897,144 121,377,921 Total net assets without donor restrictions 66,957,066 123,370,449 80,636,292 270,963,807 254,130,855
TOTAL LIABILITIES AND NET ASSETS $ 78,173,510 $ 126,100,081 $ 96,796,914 $ 301,070,505 $ 286,653,318

38
NATIONAL EDUCATION ASSOCIATION OF THE UNITED STATES
GENERAL OPERATING FUND – SUPPLEMENTAL SCHEDULE OF ACTIVITIES AND CHANGES IN NET ASSETSFOR THE YEAR ENDED AUGUST 31, 2019
Budget (Unaudited) Actual REVENUES Membership income $ 339,574,275 $ 368,408,605 Other income 620,000 856,162 NFIE endowment allocation (1,711,875) (1,815,131)TOTAL REVENUES 338,482,400 367,449,636
EXPENSES BY STRATEGIC OBJECTIVES AND ENTERPRISE OPERATIONS
Strategic Objective 1: Increase Educator Voice, Influence, and Professional Authority 1. Develop and sustain effective structures, processes, and leaders to increase educator
influence in decision-making at the worksite, district, state, and national levels. 9,374,537 10,217,729 Total Strategic Objective 1: Increase Educator Voice, Influence, and Professional Authority 9,374,537 10,217,729
Strategic Objective 2: Recruit and Engage New and Early Career Educators 1. Identify, recruit, support, and engage new educators in our Association, and connect
them with opportunities for professional learning, leadership, and advocacy. 9,604,153 8,119,100 Total Strategic Objective 2: Recruit and Engage New and Early Career Educators 9,604,153 8,119,100
Strategic Objective 3: Advance Racial Justice in Education 1. Support members in advancing racial justice in education and improving conditions for
students, families, and communities through awareness, capacity-building, partnership, and individual and collective action. 13,528,355 12,788,345
Total Strategic Objective 3: Advance Racial Justice in Education 13,528,355 12,788,345
Strategic Objective 4: Support Professional Excellence 1. Develop and test new professional supports in collaboration with members and affiliates.
Identify and cultivate promising professional supports developed by affiliates and external organizations. 10,752,083 11,982,544
2. Create and maintain a robust and sustainable system to track and disseminate professional supports developed by members, affiliates, and partner organizations. 6,370,277 6,355,120
3. Support and engage in activities that promote a system that establishes the value of a quality, professionalized educator workforce and the role of the Association in creating and sustaining a system of professional supports. 6,557,599 5,452,163
Total Strategic Objective 4: Support Professional Excellence 23,679,959 23,789,827
Strategic Objective 5: Secure the Environment to Advance the Mission of the NEA and its Affiliates 1. Use all available means, including organizing, legal, legislative, electoral, and collective
action, to secure the environment necessary to protect the rights of students and educators, and the future of public education. 73,957,165 83,818,230
Total Strategic Objective 5: Secure the Environment to Advance the Mission of the NEA and its Affiliates 73,957,165 83,818,230
(continued)

39
NATIONAL EDUCATION ASSOCIATION OF THE UNITED STATES
GENERAL OPERATING FUND – SUPPLEMENTAL SCHEDULE OF ACTIVITIES AND CHANGES IN NET ASSETSFOR THE YEAR ENDED AUGUST 31, 2019
Budget (Unaudited) Actual
Strategic Objective 6: Enhance Organizational Capacity 1. Partner with state and local affiliates to develop and expand their organizing capacity
and enhance their effectiveness to grow membership and develop leaders and staff to thrive as organizers. $ 88,996,751 $ 90,466,485
2. Partner with affiliates to develop and enhance their capacity to adopt, implement, and apply technology tools to support their plans and goals. Develop plans to improve NEA’s ability to gather and analyze data about their members, to communicate effectively, and to support their business practices. 7,024,191 11,359,791
3. Partner with affiliates to achieve financial stability and sustainable fiscal health, improve the effectiveness of accounting and operating controls, and design and deliver effective financial training for staff, management, and leaders at all levels of the Association. 980,402 955,861
4. In partnership with governance and affiliates, develop and enhance members’ capacity to lead relevant and thriving Associations and measurably advance the organization’s Strategic Objectives by effectively expanding the use of NEA’s Leadership Competency Framework. 4,805,942 4,543,323
5. Improve the Association’s ability to have optimal impact, reach, and influence through its external partnerships. 7,479,632 13,274,611
Total Strategic Objective 6: Enhance Organizational Capacity 109,286,918 120,600,071
Enterprise Operations 1. Leadership Services 19,083,530 21,358,030 2. Business and Financial Services 34,737,887 36,397,868 3. Information Technology Services 16,211,058 15,298,717 4. Enterprise Communications Services 25,515,374 28,673,282 5. Infrastructure 1,854,419 1,920,900 Total Enterprise Operations 97,402,268 103,648,797
Total Operating Fund Expenses 336,833,355 362,982,099
CHANGES IN NET ASSETS $ 1,649,045 4,467,537
NET ASSETS WITHOUT DONOR RESTRICTIONS BEGINNING OF YEAR 79,984,180 END OF YEAR $ 84,451,717
(concluded)

40
NATIONAL EDUCATION ASSOCIATION OF THE UNITED STATES
GENERAL OPERATING FUND – SUPPLEMENTAL SCHEDULES OF EXPENSES BY TYPEFOR THE YEARS ENDED AUGUST 31, 2019 AND 2018
2019 2018
Salaries and benefits $ 114,112,866 $ 122,332,105
Grants to, and joint projects with, state and local associations 114,200,348 113,950,202
Kate Frank/DuShane Unified Legal Services Program 19,508,283 20,553,371
Travel 16,022,581 15,671,280
Publication costs, net of advertising income 1,247,991 1,656,865
Outside services (including Educators Employment Liability Insurance, Media Program, consultants) 40,905,496 39,729,834
Conference and meetings 9,256,969 9,145,933
Machinery rentals, repairs, materials and supplies 7,127,541 4,220,037
Office and administrative 40,600,024 40,305,167
TOTAL EXPENSES BY TYPE $ 362,982,099 $ 367,564,794

41
NATIONAL EDUCATION ASSOCIATION OF THE UNITED STATES
SPECIAL PURPOSE FUNDS – SUPPLEMENTAL SCHEDULES OF ACTIVITIES AND CHANGES IN NET ASSETSFOR THE YEARS ENDED AUGUST 31, 2019 AND 2018
Related Entity Bylaw Other Special Special Special Purpose Funds Purpose Funds Purpose Funds Total
NET ASSETS WITHOUT DONOR RESTRICTIONS September 01, 2017 $ 68,199,265 $ 121,926,937 $ 46,267,764 $ 236,393,966
Revenue NEA Appropriation 3,000,000 102,282,030 19,275,000 124,557,030 MBC Program revenue 54,024,003 – – 54,024,003 Other 2,135,500 – 4,459,118 6,594,618
Expenses (60,400,651) (103,205,332) (2,982,961) (166,588,944)
Change in pension obligations other than net periodic pension cost and other charge (849,818) – – (849,818)
Investments in NEA360 LLC 4,000,000 – (4,000,000) –
NET ASSETS WITHOUT DONOR RESTRICTIONS August 31, 2018 70,108,299 121,003,635 63,018,921 254,130,855
Revenue NEA Appropriation 12,500,000 108,231,597 21,334,734 142,066,331 MBC Program revenue 53,665,652 – – 53,665,652 NEAPI Rental income 2,089,771 – – 2,089,771 NEA 360 LLC Revenue 1,400,130 – (1,200,000) 200,130 Investment income 9,219 544,186 1,822,999 2,376,404 Other 362,143 – 2,376,251 2,738,394
Expenses (67,531,608) (106,408,969) (6,716,613) (180,657,190)
Change in pension obligations other than net periodic pension cost and other charge (5,646,540) – – (5,646,540)
NET ASSETS WITHOUT DONOR RESTRICTIONS August 31, 2019 $ 66,957,066 $ 123,370,449 $ 80,636,292 $ 270,963,807

42
This page has been left blank intentionally.

43
2019–2020INTERIM
FINANCIAL STATEMENTS(UNAUDITED)

44
This page has been left blank intentionally.

45
NATIONAL EDUCATION ASSOCIATION OF THE UNITED STATES
GENERAL OPERATING AND CAPITAL IMPROVEMENT FUNDSSTATEMENTS OF FINANCIAL POSITION (UNAUDITED)AS OF MAY 31, 2020
General Capital Operating Improvement Fund Fund
ASSETS
CURRENT ASSETS Cash and cash equivalents $ 54,299,076 $ – Cash held for Special Purpose Funds 44,625,591 – Short term investments 56,433,713 – Membership dues receivable – net 114,041,943 – Amount due from affiliates and other organizations – net 1,371,776 – Notes receivable 1,250,000 – Prepaid expenses 3,302,325 – Other current assets 1,668,131 –
Total current assets 276,992,555 –
LONG-TERM ASSETS Notes receivable – net 2,675,000 – Equipment – net 4,724,324 – Land – 1,753,777 Building – net – 18,745,726
Total long-term assets 7,399,324 20,499,503
Total Assets $ 284,391,879 $ 20,499,503
LIABILITIES & NET ASSETS
CURRENT LIABILITIES Deferred membership dues $ 93,590,051 $ – Accounts payable 930,537 – Accrued liabilities 2,594,853 – Accrued annual leave 6,885,896 – Amount held for affiliates and other organizations 791,379 – Amount due to other funds 44,625,591 –
Total current liabilities 149,418,307 –
LONG-TERM LIABILITIES Accrued severance payable 5,417,757 –
Total long-term liabilities 5,417,757 –
Total liabilities 154,836,064 –
NET ASSETS WITHOUT DONOR RESTRICTIONS Undesignated net assets 128,534,565 – Undesignated net assets held for ULSP stabilization 1,021,250 – Designated net assets – 20,499,503
Total net assets without donor restrictions 129,555,815 20,499,503
Total Liabilities and Net Assets $ 284,391,879 $ 20,499,503

46
NATIONAL EDUCATION ASSOCIATION OF THE UNITED STATES
GENERAL OPERATING FUND – STATEMENT OF ACTIVITIES AND CHANGES IN NET ASSETS (UNAUDITED)FOR THE NINE MONTHS ENDED MAY 31, 2020 % of Annual Year to Date Budget Budget Actual Remaining
REVENUES Membership dues $ 351,500,050 $ 375,767,531 -6.90% Less: Dues deferred for remainder of the year – (93,590,051) Membership income 351,500,050 282,177,480 19.72% Other income 620,000 1,640,067 -164.53% NFIE endowment allocation (1,734,875) (1,301,156) 25.00%
TOTAL REVENUES 350,385,175 282,516,391 19.37%
EXPENSES BY STRATEGIC OBJECTIVES AND ENTERPRISE OPERATIONS Strategic Objective 1: Increase Educator Voice, Influence, and Professional Authority 1. Develop and sustain effective structures, processes, and leaders to increase educator voice
and influence in decision-making at worksite, district, state, and national levels. 9,203,950 5,419,529 41.12%
Total Strategic Objective 1: Increase Educator Voice, Influence, and Professional Authority 9,203,950 5,419,529 41.12%
Strategic Objective 2: Recruit and Engage New and Early Career Educators 1. Identify, recruit, support, and engage new educators in our association, and connect them with
opportunities for professional learning, leadership, and advocacy. 8,290,933 4,254,732 48.68%
Total Strategic Objective 2: Recruit and Engage New and Early Career Educators 8,290,933 4,254,732 48.68%
Strategic Objective 3: Advance Racial Justice in Education 1. Support members in advancing racial justice in education and improving conditions for students,
families, and communities through awareness, capacity-building, partnership, and individual and collective action. 13,710,529 5,481,510 60.02%
Total Strategic Objective 3: Advance Racial Justice in Education 13,710,529 5,481,510 60.02%
Strategic Objective 4: Provide Professional Supports 1. Develop and test new professional supports in collaboration with members and affiliates. Identify
and cultivate promising professional supports developed by affiliates and external organizations. 11,387,855 8,442,963 25.86%
2. Create and maintain a robust and sustainable system to track and disseminate professional supports developed by members, affiliates, and partner organizations. 5,431,175 3,496,678 35.62%
3. Support and engage in activities that promote a system that establishes the value of a quality, professionalized educator workforce and the role of the association in creating and sustaining a system of professional supports. 6,419,023 4,084,529 36.37%
Total Strategic Objective 4: Provide Professional Supports 23,238,053 16,024,170 31.04%
Strategic Objective 5: Secure the Environment to Advance the Mission of the NEA and its Affiliates 1. Use all available means, including organizing, legal, legislative, electoral, and collective action,
to secure the environment necessary to protect the rights of students and educators, and the future of public education. 76,924,060 55,426,287 27.95%
Total Strategic Objective 5: Secure the Environment to Advance the Mission of the NEA and its Affiliates 76,924,060 55,426,287 27.95%
(continued)

47
NATIONAL EDUCATION ASSOCIATION OF THE UNITED STATES
GENERAL OPERATING FUND – STATEMENT OF ACTIVITIES AND CHANGES IN NET ASSETS (UNAUDITED)FOR THE NINE MONTHS ENDED MAY 31, 2020 % of Annual Year to Date Budget Budget Actual Remaining
Strategic Objective 6: Enhance Organizational Capacity 1. Partner with state and local affiliates to develop and expand their organizing capacity and
enhance their effectiveness to grow membership and develop leaders and staff to thrive as organizers. $ 91,690,020 $ 65,806,486 28.23%
2. Partner with affiliates to develop and enhance their capacity to adopt, implement, and apply technology tools to support their plans and goals. Develop plans to improve NEA’s ability to gather and analyze data about their members, to communicate effectively, and to support their business practices. 10,179,479 5,185,954 49.05%
3. Partner with affiliates to achieve financial stability and sustainable fiscal health, improve the effectiveness of accounting and operating controls, and design and deliver effective financial training for staff, management, and leaders at all levels of the association. 1,204,628 556,454 53.81%
4. In partnership with governance and affiliates, develop and enhance members’ capacity to lead relevant and thriving associations and measurably advance the organization’s Strategic Objectives by effectively expanding the use of NEA’s Leadership Competency Framework. 5,242,035 3,354,532 36.01%
5. Improve the association’s ability to have optimal impact, reach, and influence through its external partnerships. 9,743,673 6,022,985 38.19%
Total Strategic Objective 6: Enhance Organizational Capacity 118,059,835 80,926,411 31.45%
Enterprise Operations 1. Leadership Services 20,820,401 10,942,040 47.45%
2. Business and Financial Services 33,677,606 25,959,517 22.92%
3. Information Technology Services 16,174,631 11,601,240 28.28%
4. Enterprise Communications Services 26,848,033 20,236,652 24.63%
5. Infrastructure 1,937,169 1,140,205 41.14%
Total Enterprise Operations 99,457,840 69,879,654 29.74%
Total Operating Fund Expenses 348,885,200 237,412,293 31.95%
CHANGES IN NET ASSETS $ 1,499,975 45,104,098
NET ASSETS WITHOUT DONOR RESTRICTIONS BEGINNING OF YEAR 84,451,717 END OF YEAR $ 129,555,815
(concluded)

48
NATIONAL EDUCATION ASSOCIATION OF THE UNITED STATES
GENERAL OPERATING FUND – CONTINGENCY FUND EXPENDITURESAS OF MAY 31, 2020
Amount Governance Approval Purpose
$ 3,000,000 Beginning Balance
(1,500,025) Approved at the September Board of Directors’ To fund the implementation of 2019 Representative Meeting Assembly New Business Items
$ 1,499,975 Available Balance
49
MEMBERSHIP COMPARISON BY STATE

50
ACTIVEProfessional, ESP and Life
OTHERMemberships*
TOTALMemberships
Increase Increase Increase STATE 2018–2019 2017–2018 (Decrease) 2018–2019 2017–2018 (Decrease) 2018–2019 2017–2018 (Decrease)
ALABAMA 55,139 54,372 767 25,404 26,062 (658) 80,543 80,434 109
ALASKA 10,624 11,277 (653) 1,865 1,814 51 12,489 13,091 (602)
ARIZONA 17,741 17,510 231 2,712 2,708 4 20,453 20,218 235
ARKANSAS 8,002 8,288 (286) 2,346 2,436 (90) 10,348 10,724 (376)
CALIFORNIA 302,495 326,141 (23,646) 20,386 19,495 891 322,881 345,636 (22,755)
COLORADO 33,648 32,068 1,580 4,334 4,320 14 37,982 36,388 1,594
CONNECTICUT 37,436 37,609 (173) 6,034 6,144 (110) 43,470 43,753 (283)
DELAWARE 12,418 12,155 263 1,436 1,430 6 13,854 13,585 269
DISTRICT OF COLUMBIA 269 275 (6) 1,239 1,110 129 1,508 1,385 123
FEDERAL 5,190 5,206 (16) 656 615 41 5,846 5,821 25
FLORIDA 134,720 133,418 1,302 5,518 5,425 93 140,238 138,843 1,395
GEORGIA 19,254 20,867 (1,613) 5,375 5,527 (152) 24,629 26,394 (1,765)
HAWAII 13,385 12,979 406 6,617 6,720 (103) 20,002 19,699 303
IDAHO 9,088 8,719 369 2,217 2,113 104 11,305 10,832 473
ILLINOIS 129,352 129,797 (445) 12,561 12,289 272 141,913 142,086 (173)
INDIANA 34,080 34,121 (41) 6,038 5,817 221 40,118 39,938 180
IOWA 30,943 32,209 (1,266) 2,625 2,615 10 33,568 34,824 (1,256)
KANSAS 19,875 20,511 (636) 4,089 3,587 502 23,964 24,098 (134)
KENTUCKY 27,543 28,009 (466) 16,743 16,076 667 44,286 44,085 201
LOUISIANA 8,442 9,626 (1,184) 1,130 994 136 9,572 10,620 (1,048)
MAINE 18,247 18,142 105 5,418 5,454 (36) 23,665 23,596 69
MARYLAND 71,340 71,185 155 3,630 3,570 60 74,970 74,755 215
MASSACHUSETTS 104,865 105,021 (156) 10,732 10,863 (131) 115,597 115,884 (287)
MICHIGAN 81,258 86,912 (5,654) 37,065 36,563 502 118,323 123,475 (5,152)
MINNESOTA 79,023 79,659 (636) 14,331 13,622 709 93,354 93,281 73
MISSISSIPPI 4,788 4,561 227 2,400 2,479 (79) 7,188 7,040 148
MISSOURI 24,116 25,151 (1,035) 5,989 6,134 (145) 30,105 31,285 (1,180)
MONTANA 21,614 16,713 4,901 1,610 1,727 (117) 23,224 18,440 4,784
NEBRASKA 20,345 20,494 (149) 7,016 7,100 (84) 27,361 27,594 (233)
NEVADA 10,475 11,137 (662) 1,838 1,766 72 12,313 12,903 (590)

51
ACTIVEProfessional, ESP and Life
OTHERMemberships*
TOTALMemberships
Increase Increase Increase STATE 2018–2019 2017–2018 (Decrease) 2018–2019 2017–2018 (Decrease) 2018–2019 2017–2018 (Decrease)
NEW HAMPSHIRE 14,771 14,967 (196) 2,053 1,957 96 16,824 16,924 (100)
NEW JERSEY 172,430 173,529 (1,099) 28,547 28,733 (186) 200,977 202,262 (1,285)
NEW MEXICO 6,797 6,841 (44) 1,285 1,315 (30) 8,082 8,156 (74)
NEW YORK 425,571 420,538 5,033 5,693 5,623 70 431,264 426,161 5,103
NORTH CAROLINA 17,580 18,380 (800) 10,139 10,345 (206) 27,719 28,725 (1,006)
NORTH DAKOTA 8,528 8,512 16 2,462 2,416 46 10,990 10,928 62
OHIO 111,739 113,508 (1,769) 9,486 9,482 4 121,225 122,990 (1,765)
OKLAHOMA 16,214 16,384 (170) 2,412 2,341 71 18,626 18,725 (99)
OREGON 42,900 43,965 (1,065) 3,026 3,022 4 45,926 46,987 (1,061)
PENNSYLVANIA 142,571 144,211 (1,640) 36,052 35,629 423 178,623 179,840 (1,217)
RHODE ISLAND 9,941 9,654 287 2,380 2,348 32 12,321 12,002 319
SOUTH CAROLINA 5,320 5,875 (555) 2,334 2,334 0 7,654 8,209 (555)
SOUTH DAKOTA 4,867 4,902 (35) 1,583 1,620 (37) 6,450 6,522 (72)
TENNESSEE 26,097 26,275 (178) 11,985 11,988 (3) 38,082 38,263 (181)
TEXAS 36,514 37,841 (1,327) 3,305 3,525 (220) 39,819 41,366 (1,547)
UTAH 15,716 15,599 117 2,420 2,384 36 18,136 17,983 153
UTAH-USEA 3,703 3,875 (172) 98 81 17 3,801 3,956 (155)
VERMONT 12,427 13,035 (608) 1,422 1,374 48 13,849 14,409 (560)
VIRGINIA 39,062 39,556 (494) 5,561 5,726 (165) 44,623 45,282 (659)
WASHINGTON 91,560 90,638 922 7,886 7,831 55 99,446 98,469 977
WEST VIRGINIA 8,165 8,257 (92) 1,409 1,450 (41) 9,574 9,707 (133)
WISCONSIN 30,512 31,105 (593) 12,895 12,920 (25) 43,407 44,025 (618)
WYOMING 4,742 4,636 106 1,338 1,211 127 6,080 5,847 233
DIRECT** 1 1 0 18 22 (4) 19 23 (4)
TOTALS 2,593,443 2,626,216 (32,773) 375,143 372,252 2,891 2,968,586 2,998,468 (29,882)
* Includes Substitute, Staff, Reserve, Student and Retired Memberships (Pre-Retired excluded)
** In general, this category refers to those members ineligible for state membership such as administrators, private schools, etc., who join NEA directly, not through a local affiliate.


27112 0620 hls

National Education Association
The National Education Association is the nation’s largest professional employee organization, representing 3 million elementary and secondary teachers, higher education faculty, education support professionals, school administrators, retired educators, and students preparing to become teachers.
NEA Executive Officers
Lily Eskelsen García, President
Rebecca S. Pringle, Vice President
Princess R. Moss, Secretary-Treasurer, New/Early Career Educator Organizing Lead Officer
Kim Anderson, Executive Director
Reproduction: No part of this report may be reproduced in any form without written permission from NEA, except by NEA affiliated associations and mem-bers. Address inquiries to NEA Executive Office, 1201 16th St., N.W., Washington, DC 20036-3290; (202) 822-7000.
Published June 2020
Copyright © June 2020 by the National Education Association
All Rights Reserved

27112.0620.vn
FINANCIAL REPORTSSecretary-Treasurer | Independent Auditors
Presented to the Representative AssemblyJuly 2020
VIRTUAL RA
VIRTUAL RA