Embed Size (px)
Citation preview

72nd Annual Report2016-17
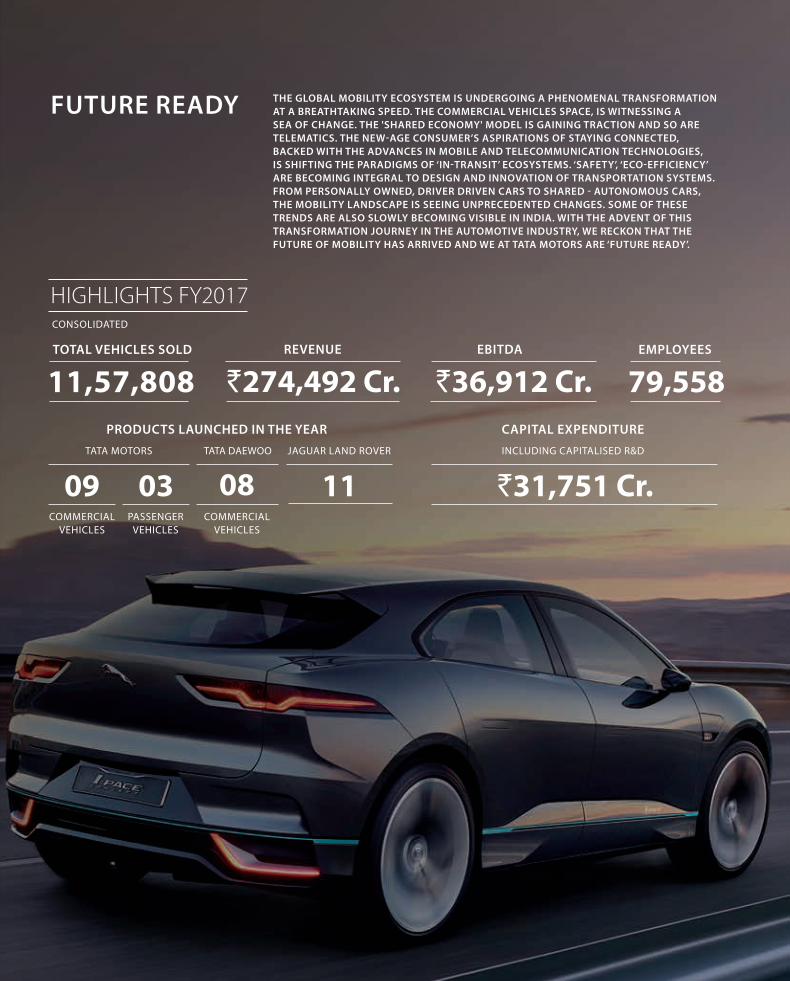
FUTURE READY THE GLOBAL MOBILITY ECOSYSTEM IS UNDERGOING A PHENOMENAL TRANSFORMATION AT A BREATHTAKING SPEED. THE COMMERCIAL VEHICLES SPACE, IS WITNESSING A SEA OF CHANGE. THE 'SHARED ECONOMY' MODEL IS GAINING TRACTION AND SO ARE TELEMATICS. THE NEW-AGE CONSUMER’S ASPIRATIONS OF STAYING CONNECTED, BACKED WITH THE ADVANCES IN MOBILE AND TELECOMMUNICATION TECHNOLOGIES, IS SHIFTING THE PARADIGMS OF ‘IN-TRANSIT’ ECOSYSTEMS. ‘SAFETY’, ‘ECO-EFFICIENCY’ ARE BECOMING INTEGRAL TO DESIGN AND INNOVATION OF TRANSPORTATION SYSTEMS. FROM PERSONALLY OWNED, DRIVER DRIVEN CARS TO SHARED - AUTONOMOUS CARS, THE MOBILITY LANDSCAPE IS SEEING UNPRECEDENTED CHANGES. SOME OF THESE TRENDS ARE ALSO SLOWLY BECOMING VISIBLE IN INDIA. WITH THE ADVENT OF THIS TRANSFORMATION JOURNEY IN THE AUTOMOTIVE INDUSTRY, WE RECKON THAT THE FUTURE OF MOBILITY HAS ARRIVED AND WE AT TATA MOTORS ARE ‘FUTURE READY’.
11,57,808TOTAL VEHICLES SOLD
`274,492 Cr.REVENUE
`36,912 Cr.EBITDA
79,558EMPLOYEES
CONSOLIDATED
HIGHLIGHTS FY2017
PRODUCTS LAUNCHED IN THE YEAR CAPITAL EXPENDITURE
09 0803 11TATA MOTORS TATA DAEWOO JAGUAR LAND ROVER INCLUDING CAPITALISED R&D
COMMERCIAL VEHICLES
COMMERCIAL VEHICLES
PASSENGER VEHICLES
`31,751 Cr.

0172nd Annual Report 2016-17SUBJECT
CORPORATE OVERVIEW
INTRODUCING TATA MOTORS 02
AN EXCITING AND EVENTFUL YEAR 06
KEY PERFORMANCE INDICATORS 08
CHAIRMAN’S MESSAGE 10
TML MD'S MESSAGE 12
JLR CEO’S MESSAGE 13
BOARD OF DIRECTORS 14
GLOBAL FOOTPRINT 18
PRODUCT PORTFOLIO 20
BUSINESS MODEL 24
STRATEGIC PRIORITIES 26
RISKS AND OPPORTUNITIES 28
WHAT MAKES TML FUTURE READY? 32
FUTURE-FOCUSED PRODUCTS 36
INNOVATION IS FUTURE PREPAREDNESS 38
ACHIEVING A HIGHER EFFICIENCY CURVE 40
ENGINE ENHANCEMENTS AND GREEN TECHNOLOGIES
42
NURTURING HOLISTIC RELATIONSHIPS 46
RELATIONSHIP WITH SUPPLY CHAIN PARTNERS
49
A COMMITMENT TO SUSTAINABILITY 50
PEOPLE DRIVE US 54
AWARDS AND RECOGNITION 56
CORPORATE INFORMATION 57
SUMMARISED STATEMENT OF ASSETS & LIABILITIES (CONSOLIDATED)
58
SUMMARISED STATEMENT OF PROFIT AND LOSS (CONSOLIDATED)
59
SUMMARISED STATEMENT OF ASSETS & LIABILITIES (STANDALONE)
60
SUMMARISED STATEMENT OF PROFIT AND LOSS (STANDALONE)
61
FINANCIAL STATISTICS 62
STATUTORY REPORTS
NOTICE 65
BOARD’S REPORT 81
MANAGEMENT DISCUSSION & ANALYSIS 118
CORPORATE GOVERNANCE REPORT 170
BUSINESS RESPONSIBILITY REPORT 191
FINANCIAL STATEMENTS
STANDALONE FINANCIAL STATEMENTS
INDEPENDENT AUDITORS’ REPORT F-1
BALANCE SHEET F-8
STATEMENT OF PROFIT AND LOSS F-9
CASH FLOW STATEMENT F-10
STATEMENT OF CHANGES IN EQUITY F-11
NOTES TO ACCOUNTS F-13
CONSOLIDATED FINANCIAL STATEMENTS
INDEPENDENT AUDITORS’ REPORT F-69
BALANCE SHEET F-74
STATEMENT OF PROFIT AND LOSS F-75
CASH FLOW STATEMENT F-76
STATEMENT OF CHANGES IN EQUITY F-78
NOTES TO ACCOUNTS F-80
SUBSIDIARY COMPANIES FINANCIAL HIGHLIGHTS 2016-17
F-156
CONTENTS
About This ReportThis Annual Report is aimed at meeting the information requirements of all our shareholders to help them take informed decisions regarding the Tata Motors Group. It also informs all our stakeholders, including customers, suppliers, employees, contractors, competitors, press, analysts, government and others, about the Company’s value creation process.
Materiality This Report includes information which is material to our stakeholders and it presents an overview of our businesses and associated activities that help in short, medium and long-term value creation. We have listed the material financial and non-financial issues for the Company and have presented information around our strategic approach towards these issues.
Scope of the Report We have presented the information on the Tata Motors Group including our major subsidiary Jaguar Land Rover in a fair, balanced and understandable manner. To ensure optimal disclosure on strategic overview, performance, governance oversight and risk management and control, the contents of this Report have been reviewed by our Senior Management. The information is reported for the period FY 2016-17 while being presented with comparative figures for the previous year, providing a holistic view to stakeholders.
Reporting Principle Through this Report, we have attempted to enhance our disclosures and have made efforts to align the communication with the Integrated Reporting <IR> framework by International Integrated Reporting Council (IIRC) and the Companies Act, 2013, as well as, the Securities Exchange Board of India (SEBI) guidelines. The Report tries to communicate a clear, concise, integrated story that explains how all our resources are put together in creating value for the business and its stakeholders.
Annual General Meeting
Date Tuesday, August 22, 2017
Time 3.00 p.m.
Venue Birla Matushri Sabhagar, 19, Sir Vithaldas Thackersey Marg, Mumbai 400 020

02 CORPORATE OVERVIEW
Tata Motors Limited (TML), a $42 billion organisation, is India’s largest automobile company and is a leading global manufacturer of cars, utility vehicles, buses, trucks and defence vehicles. Incorporated in India in the year 1945, Tata Motors is a part of the over $100 billion Tata Group founded by Jamsetji Tata in 1868. Recognised for its world-class quality, originality, engineering and design excellence, the Company is on the path of shaping the future of mobility in India. Sustainability and the spirit of ‘giving back to society’ is our guiding philosophy and good corporate citizenship is strongly embedded in our DNA.
With a large global footprint, the Company has consolidated its position as the Tata Motors Group through mergers and acquisitions. It has a network of 76 subsidiaries in India and internationally, which provide a host of engineering and automotive solutions.
Some of the world’s most iconic brands, including Jaguar Land Rover in the UK and Tata Daewoo in South Korea form part of the automotive operations of the Group.
Information Technology
Services
Machine Tools & Factory
Automation Services
Tata Daewoo Commercial Vehicles Tata Motors Finance Limited
Jaguar Land Rover
Tata and other brands
Tata Motors Group
INTRODUCING TATA MOTORS
AUTOMOTIVE OPERATIONS
OTHER OPERATIONS

0372nd Annual Report 2016-17
Tata Daewoo Commercial Vehicle Company (TDCV) is South Korea’s second largest manufacturer of medium and heavy-duty trucks. Formerly part of the Daewoo Group, the Company was acquired by Tata Motors in March 2004. TDCV is actively pioneering overseas markets by exporting products to about 60 countries.
TATA DAEWOO COMMERCIAL VEHICLES
TATA MOTORS
Tata Motors Finance Limited (TMFL) was incorporated on June 1, 2006, with the objective of becoming a preferred financing provider for the customers of TML's dealers. TMFL is registered with the RBI as a Non-Deposit Taking Non-Banking Financial Company (NBFC) and is classified as an Asset Finance Company under the RBI’s regulation on NBFCs.
TATA MOTORS FINANCE LIMITED
Among the top 3 in Global CV and Domestic PV
We innovate mobility solutions with passion to enhance quality of life
Achieving Sustainable Financial Performance
Delivering Exciting Innovations
As a High-Performance Organisation, we are, by FY 2019
Vision
Mission
TATA AND OTHER BRANDS
Tata Motors has a remarkable portfolio of both passenger and commercial vehicles and have been leading India’s commercial vehicles space for several years. The Company operates six principal automotive manufacturing facilities in India: at Jamshedpur in the state of Jharkhand, at Pune in the state of Maharashtra, at Lucknow in the state of Uttar Pradesh, at Pantnagar in the state of Uttarakhand, at Sanand in the state of Gujarat and at Dharwad in the state of Karnataka. Tata Motor’s Operating Philosophy is reflected in its Vision, Mission and Values.
IntegrityTeamworkAccountabilityCustomer FocusExcellenceSpeed
Values
2nd LargestMANUFACTURER OF MEDIUM AND
HEAVY-DUTY TRUCKS IN SOUTH KOREA

04 CORPORATE OVERVIEW
Jaguar Land Rover (JLR) is Britain’s largest automotive manufacturer which designs, manufactures and sells some of the world’s best known premium cars. The two iconic brands of JLR include Jaguar, with a range of luxury sedans, sports cars and luxury performance SUVs and Land Rover, which encompasses a portfolio of premium all-terrain vehicles. Tata Motors acquired JLR in 2008.
JLR has four principal automotive manufacturing facilities in the United Kingdom at Solihull, Castle Bromwich, Halewood and the Engine Manufacturing Centre at Wolverhampton. It also has two product development facilities in the United Kingdom at Gaydon and Whitley. Jaguar Land Rover also owns a joint venture manufacturing plant under its China Joint Venture, in Changshu, near Shanghai. Expanding its footprint, the firm opened a new manufacturing facility in Brazil and is currently building manufacturing facilities in Slovakia and tied up a contract manufacturing with Magna Steyr in Austria. Jaguar Land Rover is known for its hallmark quality and excellence, strong global distribution network, path-breaking product development and engineering capabilities.
JAGUAR LAND ROVER
PRODUCT AWARDS IN 2017
BRITAIN’S BIGGEST CAR MANUFACTURER
213
#1
Vision
'We are entering the largest, fastest industrial revolution ever, driven by decarbonisation, air quality, digitisation, connectivity, automation and technology. Against this backdrop we see endless exciting opportunities to create a world in which we will live safer, better, more connected and mobile lives.'
EXPERIENCES PEOPLE LOVE,
FOR LIFE
GREAT PRODUCTS
GLOBAL GROW TH
CREATING THE BEST QUALIT Y CUSTOMER EXPERIENCES
ALWAYS BEING BE T TER AT WHAT WE DO
TARGE TING NEW GROW TH SEGMENTS
INVESTING IN NEW TECHNOLOGIES, SKILLS & SERVICES
PIONEERING INTEGRIT Y EXCELLENCE UNIT Y RESPONSIBILIT Y
TRANSFORMED COST STRUC TURE
AND BUSINESS EXCELLENCE
ENGAGED AND PASSIONATE
PEOPLETECHNOLOGY
FOR GOOD
CUSTOMER FIRST
ENVIRONMENTAL INNOVATION
JLR’S BLUEPRINT FOR SUCCESS
JLR’S VALUES
JLR’S STRATEGIC PRIORITIES 'Our strategic priorities act as a road map towards delivering on our vision and blueprint. They guide the actions we need to
take around resources, investment, innovation and product creation.'
JLR’s PURPOSEBusiness Blueprint

0572nd Annual Report 2016-17
JAGUAR LAND ROVER – INMOTION VENTURETATA MOTORS – TAMO
New technologies, new business models and new partnerships are fast emerging across the world. Both Tata Motors and Jaguar Land Rover are enhancing customer experiences, while being able to deal with the discontinuity and disruption in the market, which comes from new technologies, competition and evolving customer behaviour.
Our subsidiary, Jaguar Land Rover, through its subsidiary InMotion, offers new digital solutions and on-demand services that meet modern travel and transport challenges of today’s consumers. Its long-term ambition is to remain at the forefront of customer-first innovation by creating visionary premium products that respond to changing lifestyles and mobility trends.
Pioneering Connected Autonomous Vehicles Jaguar Land Rover is working towards global leadership in Connected Autonomous Vehicles. Unrivalled driving experiences and vehicle performance and capability remain central to its strategy. Jaguar Land Rover’s Advanced Driver Assistance Systems, including autonomous emergency braking and park assist, are its stepping stones to full autonomy. Through technologies like CloudCar and Connected Car diagnostics, Jaguar Land Rover is pioneering the use of real-time data from its vehicles.
Innovating for a Greener, Smarter Tomorrow Jaguar Land Rover is introducing a range of alternative powertrains for 2018 and beyond. This includes full electric, hybrid and mild hybrid solutions. By 2020 half of its range will be available with an alternative power option to meet the differing needs of the customers. Jaguar Land Rover is working towards integrating connected and autonomous technology with low-carbon ecosystems. In partnership with Governments and academia, Jaguar Land Rover is also exploring innovations such as car-to-home charging, car-to-grid, and battery storage solutions to respond to an increase in electric vehicle sales.
We believe in delivering innovation that improves the quality of life for our customers. With the objective of foraying into future mobility solutions, we introduced a sub-brand - TAMO - as a core element of our transformation journey, ‘FutuReady’. The first innovation from TAMO will be to redefine connected and personalised driving experiences for Indian customers.
Leveraging Expertise for Connectivity TAMO will operate as an agile, ring-fenced vertical, in the first step on a low volume, low investment model to provide fast-tracked proves of technologies and concepts.
It will act as an open platform to network with global startups and leading tech companies to get access to trends, innovations and solutions, for the design of exciting future products and services.
For the rapidly changing automotive environment, TAMO will transform the experience of interfacing and interacting with customers and the wider community. We are collaborating with Microsoft to leverage its connected vehicle technologies.
TATA MOTORS GROUP – EMBRACING THE FUTURE OF MOBILITY
CORPORATE OVERVIEW06AN EXCITING AND EVENTFUL YEAR
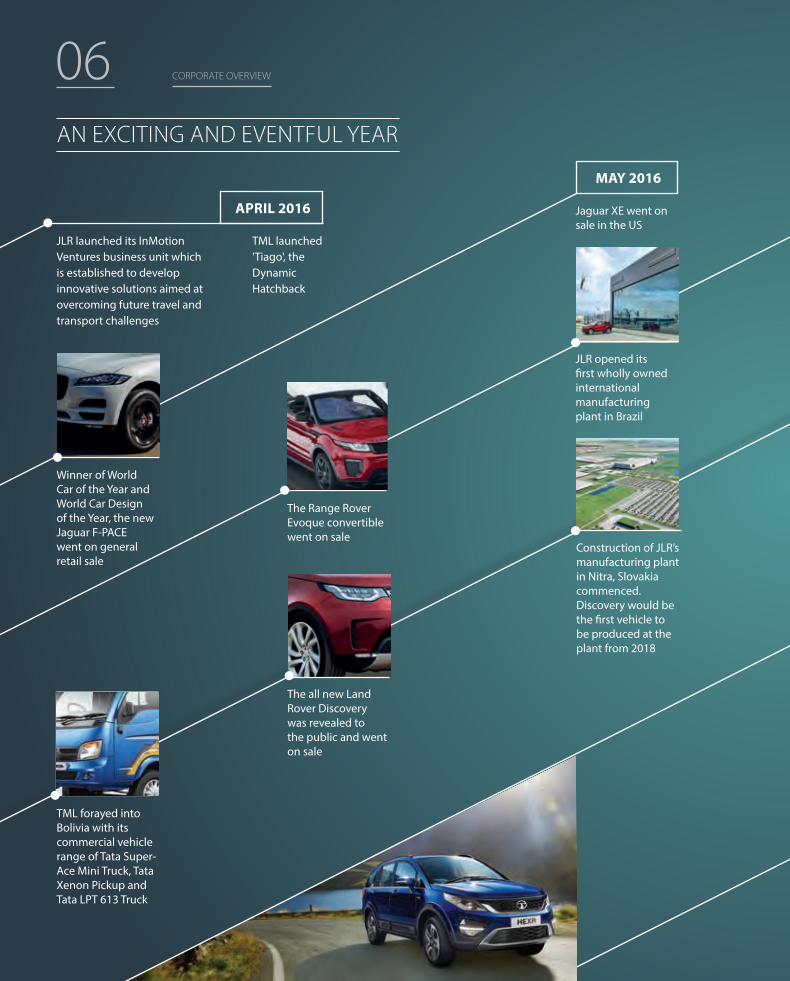
APRIL 2016
MAY 2016
JLR launched its InMotion Ventures business unit which is established to develop innovative solutions aimed at overcoming future travel and transport challenges
TML launched 'Tiago', the Dynamic Hatchback
Jaguar XE went on sale in the US
The Range Rover Evoque convertible went on sale
Construction of JLR’s manufacturing plant in Nitra, Slovakia commenced. Discovery would be the first vehicle to be produced at the plant from 2018
The all new Land Rover Discovery was revealed to the public and went on sale
TML forayed into Bolivia with its commercial vehicle range of Tata Super-Ace Mini Truck, Tata Xenon Pickup and Tata LPT 613 Truck
JLR opened its first wholly owned international manufacturing plant in Brazil
Winner of World Car of the Year and World Car Design of the Year, the new Jaguar F-PACE went on general retail sale
CORPORATE OVERVIEW

JUNE 2016SEPTEMBER 2016
OCTOBER 2016
JANUARY 2017
MARCH 2017
NOVEMBER 2016
FEBRUARY 2017
TML’s contemporary SUV Hexa was launched
Jaguar XF won the Auto Express Golden Steering Wheel award for best saloon car of 2016
JLR revealed the Range Rover Velar to the public. It is the 4th Range Rover model positioned between the Range Rover Evoque and the Range Rover Sport
TML introduced its new sub-brand – TAMO
TML launched the subcompact sedan Tigor
Production of the new long wheel base Jaguar XFL commenced at the China Joint Venture and went on sale locally
Production of JLR’s in-house 4 cylinder Ingenium Petrol Engine commenced at the Engine Manufacturing Centre in Wolverhampton in the UK
TML recognised as per the J.D. Power study among the most improved brand in its customer service levels with an increase of 39 points, from 2015
TML launched the ‘ULTRA’ business utility vehicles in Kenya
The Jaguar I-PACE concept, JLR’s first battery electric vehicle, was revealed to the public which will go on sale in 2018
0772nd Annual Report 2016-17

08 CORPORATE OVERVIEW
TOTAL INCOME
TOTAL DEBT
2014 -15
2014 -15
2016 -17
2016 -17
2015 -16
2015 -16
264,058
72,711
278,546
69,360
275,247
78,604
(` in crores)
(` in crores)
NET PROFIT (AFTER MINORITY INTEREST)
2014 -15
2014 -15
2016 -17
2016 -17
2015 -16
2015 -16
13,986
0.49:1
11,678
0.25:1
7,557
0.47:1
(` in crores)
NET CASH FROM OPERATIONS
2014 -15
2016 -17
2015 -16
35,531
37,900
30,199
(` in crores)
*Figures for 2014-15 are as per IGAAP. 2015-16 and 2016-17 figures are as per Ind AS.
NET DEBT / EQUITY RATIO
OPERATING PROFITS
2014 -15
2016 -17
2015 -16
42,114
41,776
36,912
(` in crores)
EARNINGS PER SHARE (ORDINARY SHARE)
2014 -15
2016 -17
2015 -16
42.98
34.25
21.94
(`)
BASIC
FINANCIAL KPIs (Consolidated)*
KEY PERFORMANCE INDICATORS

0972nd Annual Report 2016-17
CHINA OVERSEAS TOTAL JLR RETAIL SALES
2014 -15 2014 -15 2014 -15
2016 -17 2016 -17 2016 -17
2015 -16 2015 -16 2015 -16
115,969 93,255 462,209
95,167 94,693 521,571
125,207 89,477 604,009
R&D EXPENDITURE TML
R&D EXPENDITURE JLR
2014 -15 2014 -15
2016 -17 2016 -17
2015 -16 2015 -16
2,204 1,411
2,217 1,560
2,100 1,794
(` in crores) (GBP in Millions)
MARKET SHARE (STANDALONE)
COMMERCIAL VEHICLES PASSENGER VEHICLES
TATA MOTORS LIMITED (INDIA)
2016 -17
5.2%
2015 -16
4.6%
2014 -15
5.3%
2016 -17
44.4%
2015 -16
46.2%
2014 -15
49.4%
JLR RETAIL SALES
% Growth in FY 17 vs FY 16 % Growth in FY 17 vs FY 16 % Growth in FY 17 vs FY 16
+32% -6% +16%
JLR: DIVERSIFIED AND BALANCED REGION-WISE SALES (in No.)
UK
2014 -15
2016 -17
2015 -16
86,750
107,371
124,755
% Growth in FY 17 vs FY 16
+16%
NORTH AMERICA
2014 -15
2016 -17
2015 -16
78,372
99,606
123,527
% Growth in FY 17 vs FY 16
+24%
EUROPE
2014 -15
2016 -17
2015 -16
87,863
124,734
141,043
% Growth in FY 17 vs FY 16
+13%
STRATEGIC KPIs

10 CORPORATE OVERVIEW
CHAIRMAN’S MESSAGE
Dear Shareholders,
It is my honour and privilege to interact with you as the Chairman of the Board at Tata Motors and its British subsidiary Jaguar Land Rover.
The automotive industry is going through multiple changes from different dimensions – changing regulatory and environmental standards as well as technological disruptions and the industry is also witnessing increased competition.
From your Company’s point of view JLR has posted an excellent performance but the performance of the domestic segment has been a major concern. The commercial vehicle segment has witnessed a continued decline in market share and the passenger car performance has been muted.
Our consolidated net revenues declined by 1.2% to `269,850 crore for the 12 months to March 31st, 2017 and our consolidated profit before tax for the year fell sharply to `9,315 crore, compared with `14,126 crore in the prior year. Our standalone net revenues increased by 3.7% to
`44,477 crore for the 12 months to March 31st, 2017 and our standalone loss before tax for the year fell to `2,421 crore, compared with `67 crore in the prior year.
Jaguar Land Rover represents world-class quality, reliability and performance through its exceptional product range. The Company delivered a 9.2% increase in full year revenues to GBP 24.3 billion in the last financial year, and reported pre-tax profits up 3.4% at GBP 1.6 billion.
In the domestic market, the market share in both the Commercial Vehicles and Passenger Vehicles have declined significantly. The market share for CV segment has fallen to 44.4% from a high of 59.4% in FY 2011-12, while market share for PV declined to 5.2% from 13.1% in the same period. Overall, delays in new product launches as well as lack of adequate responsiveness to the competitive environment and an unsustainable cost structure have contributed to this performance.
In the domestic business segment, business turnaround is the need of the hour and management is working
We have to bring a renewed focus and energy to improve our market share, reduce our cost base, streamline our supply chain and ensure timely
delivery of new products to market.

1172nd Annual Report 2016-17
I am confident that the series of actions being taken by the management team will succeed and show an improved performance in both the commercial vehicle and passenger vehicle segments in India and deliver better financial results.
with renewed focus and energy to improve our market share, reduce our cost base, streamline the supply chain and ensure launch of products on time to delight our customers.
I am confident that the series of actions being taken by the management team will succeed and show an improved performance in both the commercial vehicle and passenger vehicle segments in India and deliver better financial results.
I would like to thank our employees as well as our extended partners, including dealers, suppliers and other stakeholders for their hard work and commitment in this critical phase of Tata Motors.
Finally, I thank you for your continued trust, confidence and support.
Best Regards, N Chandrasekaran Mumbai, May 23, 2017

12 CORPORATE OVERVIEW
Dear Shareholders,
When I joined almost a year and a half ago, there was an immediate need to launch a transformation journey, setting the long-term priorities for the organisation, redefining the MVV (Mission, Values, and Vision), laying down the blueprint for CV & PV business strategy till 2020, and launching our strategic game plan with high impact projects for bottom-line/ top-line improvement – all leading to a robust business plan for the FY 16-17. With this background, we set ourselves towards aspirational targets in terms of market share and financials.
On June 20, 2016, we kick-started our transformation journey to be 'FUTUREADY', to instill a sense of the ‘very purpose’ for the organisation’s existence, which immediately caught up with the organisation. The ImpACT (Improvement by Action) projects with full time senior leaders and dedicated teams having ownership at ExCom level helped us focus on four angles of attack – intense top-line focus, cost optimisation, customer centricity and structural improvements in processes. These projects have started to payback and have created a great change of momentum in the entire organisation. We have built a very strong savings potential with positive effects in FY 17-18 and the years to come.
One of the most important initiatives in FY 16-17 was the Organisational Effectiveness (OE) exercise, with the objective of bringing the much needed empowerment and accountability within the BUs, strong functional oversight based on the key principles of speed, simplicity and agility. Due to its magnitude and complexity, the transition of the new management
TML MD'S MESSAGE
structure w.e.f. April 01, 2017 faced some challenges, which in the meanwhile are getting addressed on a case-to-case basis.
Due to the unexpected and unprecedented changes in the market, we faced a rather hostile business cycle with headwinds in the form of demonetisation and the famous Supreme Court ruling on BS IV transition. As a matter of fact, it was not only the market volatility which affected our performance, but mainly our sluggishness in reading the market in time, as we were effectively late to respond.
While we have made great progress as far as the transformation journey in terms of setting the missing direction for the organisation, we are cognisant of the misses on the operational side where we have delivered significantly below our expectations. There is an immediate need for action in order to refocus the organisation on regaining market share in commercial vehicles and bringing accelerated efforts in cost reduction in order to drive business profitability. I would like to take this opportunity to commit to a stretched plan in FY 17-18 thereby compensating on
our poor performance in FY 16-17 with a promise of a better year. Our immediate priority now is on execution - to address the top concerns of supply constraints, to advance the launch time of some of our new products. In full alignment with the board, we have finalised a business turnaround plan through which we take upon ourselves to deliver a robust bottom-line improvement in FY 17-18.
In conclusion, I would say that we have immense opportunities, and we are optimistic about the outlook for Tata Motors. We will keep you posted on our progress along the journey in this crucial year.
Looking forward to your continued support, as we put in our best to meet your expectations!
Best Regards, Guenter Butschek Mumbai, May 23, 2017

1372nd Annual Report 2016-17
JLR CEO’S MESSAGEDear Shareholders,
Our customers are at the heart of everything we do. Our passion and our purpose is to meet and exceed their aspirations; to delight them with experiences they will love for life.
We do not do ordinary. We do create spectacular, outstanding products.
Jaguar Land Rover is an innovative technology company. We are shaping the mobility revolution as we move from ‘ICE to ACE’ – from the internal combustion engine to autonomous, connected and electrified vehicles.
SUSTAINABLE, PROFITABLE GROWTH Our vehicles are in high demand. This fiscal year marks our seventh successive year of growth. We reported retails of 604,009 units, a 16 per cent increase year-on-year with revenues of GBP 24.3 billion and profit before tax of GBP 1.6 billion.
PRODUCT PORTFOLIO The compelling character of our products with the best British design and engineering integrity has won 213 awards this year. The Jaguar F-PACE won both the World Car of the Year and the World Car Design of the Year award while Jaguar XF won the Golden Steering Wheel award in Germany.
In FY 16-17 we introduced the Jaguar F-PACE and launched the Jaguar XE in the US and the all-new long wheelbase Jaguar XFL for China. In November 2016 we revealed the Jaguar I-PACE, our Battery Electric Vehicle (BEV) which will be available from next year.
Land Rover Discovery went on sale in February 2017 - the world’s most capable and most versatile SUV. In March 2017, we launched the Range Rover Velar, the fourth Range Rover model, which defines
design excellence, modernity and elegance combined with innovative inner values like the “Blade” system.
BUSINESS = PEOPLE It is the passion, imagination and engagement of our people that drives our future. At the end of the fiscal year Jaguar Land Rover employed 40,265 people.
We encourage our people to advance their skills. More than 30 per cent take advantage of what is already the best range of lifelong education schemes offered by the Jaguar Land Rover Academy and supported by Warwick Manufacturing Group and other renowned universities.
I want to take the opportunity to thank all our employees, dealers and business partners for their contribution and commitment.
My special thanks go to Mr Ratan Tata for the confidence he has placed in us and the supervisory board, chaired by Mr Natarajan Chandrasekaran.
BREXIT AND GEOPOLITICAL LANDSCAPEWe are a British company with global reach. We can continue to be the beating heart of British manufacturing, the epicentre of premium car production.
To deliver maximum efficiency and effectiveness, the UK needs competitive political and economic conditions. It is free and fair trade, access to the best talents globally and removing red tape that lead to greater national prosperity. The EU is a business opportunity. There is no credible alternative.
THE FUTUREWith significant global economic growth forecasts for the coming years, we are cautiously optimistic that we can exploit the growing premium demand.
At Jaguar Land Rover, we are committed to growing our business responsibly and in ways that benefit broader society. Creating our own future in the world we want to live in.
The pace of change has never been greater. Our aim is to set it. This is a time of great change.
Time for Jaguar Land Rover.
Best Regards, Ralf Speth Mumbai, May 23, 2017

14 CORPORATE OVERVIEW
BOARD OF DIRECTORS
Mr Natarajan Chandrasekaran, is the Chairman of the Board of Tata Sons, the holding company and/or promoter of more than 100 Tata operating companies with aggregate annual revenues of more than US $100 billion.
Mr Chandrasekaran also chairs the Boards of several group operating companies, including Tata Steel, Tata Power, Indian Hotels, and Tata Consultancy Services (TCS) – of which he was Chief Executive from 2009-17. His appointment as Chairman followed a 30-year stint at TCS, where he was responsible for consolidating TCS as the
Mr Natarajan Chandrasekaran Non-Executive Director and Chairman
27
Dr Raghunath Mashelkar Non-Executive, Independent Director
Dr Raghunath Mashelkar is an eminent chemical engineering scientist, and an ex-Director General of the Council of Scientific and Industrial Research. He is the President of Indian National Science Academy (INSA), National Innovation Foundation, Institution of Chemical Engineers, UK and Global Research Alliance. Honoured by the President of India with the Padma Shri (1991), the Padma Bhushan (2000) and the Padma Vibhushan (2014), Dr Mashelkar holds a Ph.D in Chemical Engineering from the Bombay University.
He was appointed as an Independent Director of the Company w.e.f. August 28, 2007.
21
346
largest private sector employer in India and the country’s most valuable company.
He was awarded several honorary doctorates by leading universities in India and internationally. Mr Chandrasekaran attended the Regional Engineering College, Trichy, Tamil Nadu, where he completed a Master’s degree in Computer Applications.
Mr Chandrasekaran was appointed as an Additional Director and Chairman of the Board of Directors of the Company w.e.f. January 17, 2017.
STATUTORY COMMITTEES OF THE BOARD
2NOMINATION & REMUNERATION COMMITTEE
CORPORATE SOCIAL RESPONSIBILITY COMMITTEE
3STAKEHOLDERS RELATIONSHIP COMMITTEE
RISK MANAGEMENT COMMITTEE
541AUDIT COMMITTEE

1572nd Annual Report 2016-17
Mr Nasser Munjee served with HDFC for over 20 years at various positions including as its Executive Director. He was the Managing Director of Infrastructure Development Finance Co. Ltd. (IDFC) up to March 2004. Presently he is the Chairman of Development Credit Bank (DCB) since June 2005 and is also on the Board of various Multinational Companies and Trusts.
Mr Munjee is a Technical Advisor on the World Bank-Public Private Partnership Infrastructure and Advisory Fund. Mr Munjee holds a Bachelor’s degree and a Master’s degree from the London School of Economics, UK.
He was appointed as an Independent Director of the Company w.e.f. June 27, 2008.
Mr Nasser MunjeeNon-Executive, Independent Director
1247
1456
Mr Vinesh Jairath served as the Principal Secretary (Industries), Government of Maharashtra and has over 25 years of experience in public administration, rural development, poverty alleviation, infrastructure, finance, industry, urban development, environmental management and a touch of the private sector occupying various important positions in the Government of India and the State Government of Maharashtra.
Mr Jairath holds a Bachelor of Arts Degree in Public Administration and a Bachelor of Law Degree, both from the Punjab University . A Masters in Economics from the University of Manchester, UK, he joined the Indian Administrative Service in 1982.
He was appointed as an Independent Director of the Company w.e.f. March 31, 2009.
Mr Vinesh Jairath Non-Executive, Independent Director
6 7CHAIRMAN
MEMBER
NON-STATUTORY COMMITTEES OF THE BOARD
SAFETY, HEALTH & ENVIRONMENT COMMITTEE
EXECUTIVE COMMITTEE OF THE BOARD

16 CORPORATE OVERVIEW
Dr Ralf Speth has been serving as the Chief Executive Officer at Jaguar Land Rover since February 18, 2010 and is on the Board of Jaguar Land Rover Automobile PLC, UK. Having served BMW for 20 years, Dr Speth joined Ford Motor Company’s Premier Automotive Group as Director of Production, Quality and Product Planning. Dr Speth earned a degree in Engineering from Rosenheim University, Germany and is a Doctorate of Engineering in Mechanical Engineering and Business Administration from Warwick University.
He was appointed as a Director of the Company w.e.f. November 10, 2010.
Dr Ralf SpethNon-Executive Director
1345
Ms Falguni Nayar has spent over 19 years with the Kotak Mahindra Bank of which she spent the last 6 years as Managing Director and CEO of Kotak Investment Bank. She is currently the founder and CEO of Nykaa.com, an online shopping website for beauty and wellness products and also offers an online magazine, expert advice and virtual makeover tools.
She was recognised as the ‘Top Business Woman’ by Business Today in 2009 and 2011 and has received the FICCI Ladies Organisation award for ‘Top Woman Achiever’ in the field of banking in 2008. She holds a B.Com degree from the Mumbai University and a PGDM from IIM, Ahmedabad.
She was appointed as an Independent Director of the Company w.e.f. May 29, 2013.
Ms Falguni Nayar Non-Executive, Independent Director
STATUTORY COMMITTEES OF THE BOARD
2NOMINATION & REMUNERATION COMMITTEE
CORPORATE SOCIAL RESPONSIBILITY COMMITTEE
3STAKEHOLDERS RELATIONSHIP COMMITTEE
RISK MANAGEMENT COMMITTEE
541AUDIT COMMITTEE
Mr Om Prakash Bhatt is a banker, having served as Chairman, State Bank Group in his last assignment till 2011, which includes State Bank of India (SBI), India’s largest commercial bank, among other Indian and overseas banks and subsidiaries. Under his leadership, SBI rose on the global list of Fortune 500.
Among other business forums, Mr Bhatt has served as the Chairman of Indian Banks’ Association, the apex body of Indian. He serves as an Independent Director on several Boards including Standard Chartered Bank plc, Tata Consultancy Services, Tata Steel and Hindustan Unilever. Mr Bhatt is a graduate in Science and a post graduate in English Literature (Gold Medallist).
He was appointed as Additional and Independent Director of the Company w.e.f. May 9, 2017.
2
Mr Om Prakash Bhatt Non-Executive, Independent Director

1772nd Annual Report 2016-17
Mr Ravindra Pisharody is the Executive Director (Commercial Vehicles) since 2012 having joined Tata Motors as Vice President Commercial Vehicles (Sales & Marketing), in 2007. He is also on the board of various Tata Motors Group Companies. Before joining Tata Motors, he worked with Castrol Ltd., a subsidiary of BP, and with Philips India, a subsidiary of the Dutch company in various roles. Mr Pisharody is an alumnus of IIT, Kharagpur and IIM, Kolkata.
Mr Pisharody has submitted his resignation to the Board of Directors of the Company on June 5, 2017.
67
Mr Ravindra Pisharody Executive Director (Commercial Vehicles)
Mr Satish Borwankar started his career with Tata Motors in 1974, as a Graduate Engineer Trainee and is the Executive Director since, 2012. On May 31, 2017, he was re-appointed as Executive Director and designated as Chief Operating Officer. He has worked in various executive positions, for overseeing and implementing product development, manufacturing operations and quality control initiatives of the Commercial Vehicles Business Unit. He has played a significant role in setting up Greenfield projects of the Company. Mr Borwankar is a Mechanical Engineer from IIT, Kanpur.
367
Mr Satish Borwankar Executive Director and Chief Operating Officer
Mr Guenter Butschek is the Chief Executive Officer & Managing Director of the Company.
Mr Butschek’s last assignment was with Airbus Group where he served as Chief Operating Officer and Member of the Group Executive Committee. Prior to Airbus, Mr Butschek worked at Daimler AG, where he gained more than 25 years of experience in international automotive management, holding functions like production, industrialisation and procurement. He has a rich global experience of growing organisations and developing new markets. Mr Butschek is a graduate in Business Administration and Economics with a diploma from the University of Cooperative Education Stuttgart, Germany.
He was appointed as Chief Executive Officer and Managing Director of the Company w.e.f. February 15, 2016.
Mr Guenter Butschek CEO and Managing Director
3567
6 7CHAIRMAN
MEMBER
NON-STATUTORY COMMITTEES OF THE BOARD
SAFETY, HEALTH & ENVIRONMENT COMMITTEE
EXECUTIVE COMMITTEE OF THE BOARD

18GLOBAL FOOTPRINT
Tata Motors Group is present in over 170 countries, with a worldwide network comprising of over 6,600 touch points of Tata Motors and 2,726 retailers of JLR.
Jamshedpur, Jharkhand
Pune, Maharashtra
Lucknow, Uttar Pradesh
Pantnagar, Uttarakhand
Sanand, Gujarat
Dharwad, Karnataka
Solihull
Castle Bromwich
Halewood
The Engine Manufacturing Centre at Wolverhampton
Tata Motors operates six principal automotive manufacturing facilities in India
JLR has four principal automotive manufacturing facilities in the United Kingdom
01
01
02
02
03
03
03
04
04
04
05
06
01
02
03
04
05
06
0102
CORPORATE OVERVIEW

01
02
0304
1972nd Annual Report 2016-17
Automotive operations Others Total*
Tata and other brand vehicles Jaguar Land Rover Total*
272,692.41 3,184.06
274,492.12
56,448.78 216,388.82 272,692.41
Changshu, China (JV)
Rio de Janeiro, Brazil
Nitra (under construction), Slovakia
Graz (operational 2018)), Austria*
01
02
03
04
GEOGRAPHY-WISE REVENUES FY16-17 SEGMENT-WISE REVENUES FY16-17
REVENUES – AUTOMOTIVE OPERATIONS FY16-17
(₹ IN CRORES) (₹ IN CRORES)
(₹ IN CRORES)17.2%
16.5%
15.1%
18.4%
15.6%
17.2%
India
China
United Kingdom
United States
Rest of Europe
Rest of World
47,10141,369
47,123
50,5
88
45,3
76
42,935
2,16,222 3,19,6381,79,875 4,42,073
TOTAL GROUP SALES IN THE COMMERCIAL VEHICLES SEGMENT TOTAL GROUP SALES IN THE PASSENGER VEHICLES SEGMENT
LIGHT COMMERCIAL VEHICLES
PASSENGER CARS* MEDIUM AND HEAVY
COMMERCIAL VEHICLESUTILITY VEHICLES*
*Contract Manufacturing
* Includes JLR Vehicles
*After intra-segment elimination
*After inter-segment elimination
Jaguar Land Rover global manufacturing plants

20 CORPORATE OVERVIEW
CARGO TRUCKS PEOPLE CARRIERS SPECIAL APPLICATIONS
Our commercial vehicles portfolio comprises trucks from sub 1-tonne to 49-tonne mass movers, and passenger transporters that range from 5-seater mini vans to 81-seater buses.
Our passenger vehicles portfolio includes compact cars, mid-sized sedans, SUVs, utility vehicles, hatchbacks and crossover cars.
PRODUCT PORTFOLIO
SIGNA range of new M&HCV trucks
Ace Zip
Super Ace
Prima range of trucks
TATA AND OTHER BRANDS
Magic Iris Xenon
Prima Tipper
Cement Mixer
Magic
Tata Marcopolo School Bus
Starbus Ultra LPT 1618 Refuse Compactor

2172nd Annual Report 2016-17
Bolt
PASSENGER VEHICLES DEFENCE & HOMELAND SECURITY
Nano
Indica
Tiago
Sumo
Hexa
Indigo
Zest
Tigor
Safari Storme
Tata GS800 4x4 Hard Top
Combat Support 6x6
Tata Kestrel/WHAP
Tata Light Armoured Troop Carrier
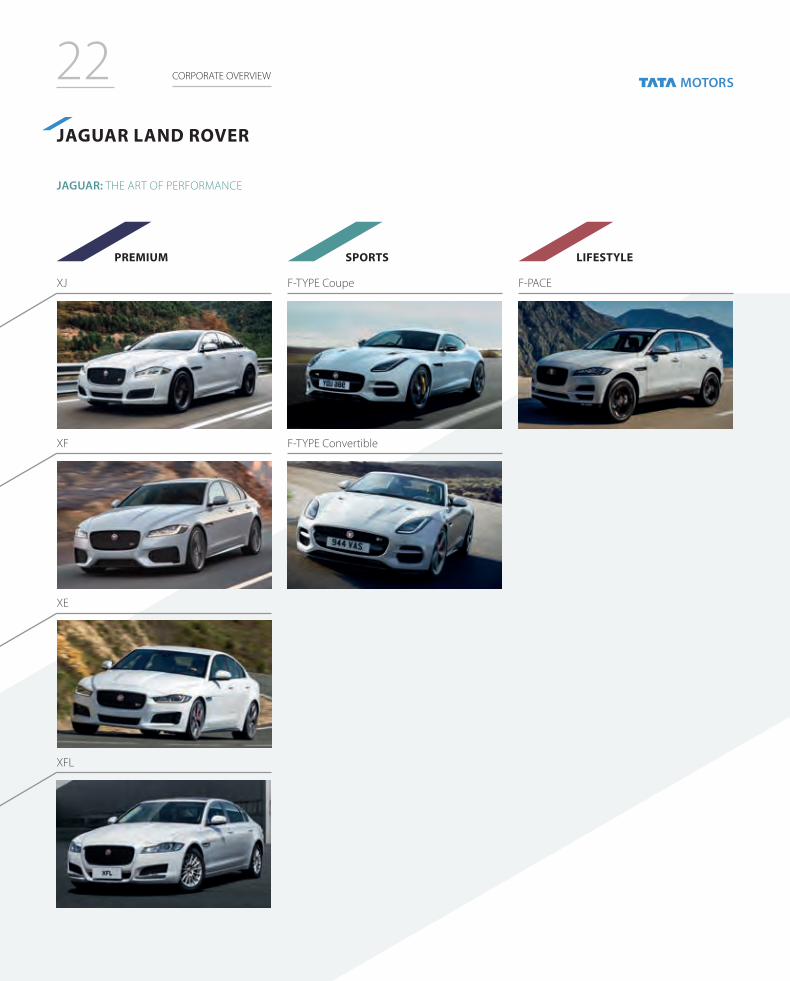
22 CORPORATE OVERVIEW
PREMIUM SPORTS LIFESTYLE
JAGUAR LAND ROVER
XJ
XF
XE
XFL
F-TYPE Coupe
F-TYPE Convertible
F-PACE
JAGUAR: THE ART OF PERFORMANCE

2372nd Annual Report 2016-17
PREMIUM LEISURE DUAL-PURPOSE
Range Rover
Range Rover Evoque
Range Rover Evoque Convertible
Range Rover Sport
Land Rover Discovery Land Rover Defender
Land Rover Discovery Sport
LAND ROVER: ABOVE AND BEYOND

24BUSINESS MODEL
Consumption of Raw Materials and Components (Consolidated) B 160,147.12 crores
Energy Usage:TML (2017): 5.2 GJ/vehicle (including acetylene use) JLR (2015-16): 2.30 MWh/ vehicle
Energy Conservation: TML: • Investment of B 9.24 crores in
energy conservation• Tata Motors is one of the
signatories of RE100 (a global collaborative initiative of
Tata Motors Works India
JamshedpurPuneLucknowPantnagarSanandDharwad
JLR Manufacturing Plants UK :• Halewood • Solihull • Castle Bromwich • Wolverhampton (Engine
Manufacturing Center)• CHINA (JV), Changshu • BRAZIL, Rio de Janeiro • INDIA, Pune (Vehicle Assembly)
Capital Expenditure (2016-17)B 31,750.74 crores
influencing business committed to 100% renewable electricity by 2030)
JLR :• Transition to cleaner, sustainable sources of
energy• Sourcing 100% of the electricity to power the
facilities from renewables
Resource Management : JLR & TML : Focus on Life Cycle Assessment of the products TML: Specific water consumption per vehicle in TML is 11.3m3
Natural Capital
The automotive business is dependent on multiple natural resource based raw materials. At the same time, there are several impacts of the business activities on the natural environment
Intellectual Capital
R&D, innovation, design and engineering which form the basis of our product development efforts
Manufactured Capital
The production facilities and equipment for designing, prototyping and manufacturing vehicles
Financial Capital
The funds and monetary resources needed to establish and operate the business. The business raises funds through a mix of debt and equity and optimises its debt based on market conditions
Spend on R&DTML: B 2,100 crores JLR: GBP 1,794 million
Patent Applications - TML: 80Patent Applications - JLR: 528Design Applications - TML: 52Design Applications - JLR: 367
Social & Relationship Capital
Stable and sustainable relationships with value-chain partners and customers are indispensable for business continuity. Our relations with communities ensure Social License to Operate
CSR spendTML: B 25.94 crores JLR: GBP 10.23 million
Employee Volunteering (number of hours): TML: ~70000 Man Hours JLR: 10000 Man Hours
TML: • Engagement with dealers through
periodic dealer conferences at national and regional levels
• In 2016-17, around 105 suppliers engaged for Environmental, Social and Governance related data and 52 suppliers assessed onsite
JLR: • Personalised Learning and Development to
support all retailers• Participation in Carbon Disclosure Project
(CDP) Supply Chain programme - a global platform for engaging with suppliers to help businesses decarbonise
• Customer Experience Insight Programme in 124 countries and 53 languages
Human Capital
The collective skills, experience and expertise of our people, which drive our production process.
Number of employees (Consolidated): 79558
Employee Benefits & Wages (Consolidated): B 28,332.89 crores
TML: • Training on safety, diversity Human Rights
Policies and concerns, over and above functional training
• Conducting Sessions like SAFE20
JLR’s spend on training: More than GBP 100 million a year into training, education and skills
INPUTS

SUBJECT 25
TML: Lost Time Injury Frequency Rate (LTIFR) 0.17, reduction of 11.8 % from 2015-16 JLR: Lost Time Case performance in an improving trend of around 6%Y-o-Y, against increased volumesand headcount. Zero lost time accidents at many sitesTML:• 67% of employees trained on
Human Rights
TML has CSR projects in 4 areas:1. Arogya (Health)2. Vidyadhanam (Education)3. Kaushalya (Employability)4. Vasundhara (Environment)
TML: Social Return on Investment For every rupee invested by TML in the Skill Development Programme at RKM, B 3.1 of social value attributable to TML is created as on 2014. Will increase to B 4.1 by 2024JLR: Lives impactedAlmost 6 million in over 25 countries
GHG emissionsTML: 0.741 tCO2e/vehicleJLR:• 32% reduction in its European
fleet’s average tailpipe CO2 emissions in eight years
• 38% improvement in its operational CO2 emissions
• Tail Pipe Emissions of European Fleet to reduce further by 25% by 2020
• 950 women employees trained on Women's Safety Awareness
• 1000+ employees engaged in Safe20 programme
JLR: • Female graduate and apprentice intake :
up by 30% • Women joining graduate programme make
up 29% of total hires• 10000 employees have undergone further
education and talent development
TML:• Ranked second in the J.D. Power Asia Pacific
2016 India Customer Service Index • No incidents of labour and human rights
violations and non-compliance with environmental and social regulations among TML suppliers
JLR:• Trained an audience of ~55000 retailer staff, with
training that is developed in 13 core languages• Participation rate of suppliers in the CDP Supply
Chain survey 2015-16 at 72% compared with average of 51%
• Implemented advisory boards to provide “always on” feedback- Customers’ Insights inform product planning team
Resource ManagementTML: Total Hazardous waste generation - 5361.76 MT JLR: Through REALCAR (Recycled Aluminium Car) project, in one year (to April 2016) alone, JLR was able to reclaim and recycle more than 50000 tonnes of aluminium wasteJLR: Achieved a 39% reduction in water use per vehicle since 2007
New Products Developed - TML: • Commercial Vehicles - 9 • Passenger Vehicles - 3 JLR: 11 Key R&D HighlightsTML : Tata Starbus Hybrid, Tata Ultra Electric, Fuel cell bus and India’s first LNG bus
JLR: Jaguar I-pace – first 5-seater battery electric crossover, on sale in 2018. Plug-in hybrids on Range Rover and Range Rover Sports to debut shortlyPatents Granted - TML: 22Patents Granted - JLR: 292Designs Registered - TML: 26Designs Registered - JLR: 412
Total Income (Consolidated Net of Excise Duty) B 269,850 crores
INPU
TS
REDUCING ENVIRONMENTAL IMPACT
STRONGER COMMUNITIES
SUSTAINABLY PROFITABLE GROWTH
WH
AT W
E D
O
Premium quality
customer experiences
Innovation, Research and Technology
Design and Engineering
Designing and creating desirable products
Manufacturing Operations
LogisticsMarketing
Sales Network
Financial Services
OU
TPU
TS
Number of vehicles sold (Consolidated): 11,57,808
EBITDA (Consolidated) B 36,912 crores
Net Profit (Consolidated) B 7,557 crores
RAW MATERIALS
SUPPLIERS
CUSTOMER INSIGHTS
SKILLS AND PEOPLE
INVESTMENT
OUTPUTS

26 CORPORATE OVERVIEW
STRATEGIC PRIORITIES
FOCUS ON NEW PRODUCT DEVELOPMENT
PROGRESS MADE
INVESTMENT IN TECHNOLOGY AND INNOVATION
CUSTOMER FOCUS
COMMERCIAL VEHICLES
Several product launches (CV); capture higher payload and better TCO (total cost to ownership) requirements.
2017-18 launches: • 10 product launches
in medium, heavy and
• Extensive in-house research and development activities, which is further supported by research and development facilities at subsidiaries, such as TMETC, TDCV, TTL, and Trilix, together with the two advanced engineering and design centres
• The Company runs several innovation projects in the
• TML monitors quality performance and implements corrections to improve product performance, thereby improving customer satisfaction
• Focused initiatives at both sales and service touch points to enhance best-in-class customer experience
intermediate commercial vehicles
• XL family in SCV, Yodha Range in 4*4 pickups
• Wide range of transport solutions
PASSENGER VEHICLES
• With the launch of Nexon SUV in the compact SUV segment,
opportunities of the premium market, including developing sustainable technologies
• Jaguar Land Rover currently offers hybrid technology on some of its models such as the Range Rover and Range Rover Sports
• Jaguar Land Rover is also developing more efficient powertrains and other alternative propulsion technologies. This includes smaller and more efficient 2.0-litre diesel and gasoline
• Moved to the second ranking in J.D. Power Asia Pacific 2016 India Customer Service Index (CSI) Study score
• Rolling out JLR Corporate Identity Programme to almost 900 of its retailers in the next 12 months
• Presenting a consistent image and premium customer experience in existing stores,
addressable market grows from 60% to 75%
• Launch of products from Advance Modular Platform
• Reduction in platforms (from 6 to 2)
JLR
• To launch Range Rover Velar, XF Sportbrake, and major facelifts on Range Rover and Range Rover Sports; Jaguar E-Pace,
engines (now available across the majority of model range), stop start, mild and plug-in hybrids as well as battery electric vehicles
the Company will also be opening new Jaguar Land Rover Boutiques
• JLR’s customers across 1500 retailers in 85 countries can use ‘virtual reality’ to see new products before their arrival
• JLR online customer advisory board allow it to interact directly with the customers on the improvements in products and services
Planned K 400 billion in capacity expansion, new products launches and technology adoptions for FY 2017-18
domains of light weighting, xEVs and Hybrids, Connected vehicles and ADAS features
• Company is gearing up to be ready with the upcoming Bharat Stage VI regulations in India
• Jaguar Land Rover is committed to investments in new technologies to develop products that meet the challenges and
Jaguar I-Pace (Battery Electric SUV) among others
• By 2020, half of JLR’s models will have the option of electrification

2772nd Annual Report 2016-17
On the way to achieving our vision, we have identified our strategic priorities. We have already made significant progress on several aspects and our action plan will be aimed at further strengthening our future readiness.
MITIGATING CYCLICALITY
ORGANISATION EFFICIENCY AND COST MANAGEMENT
EXPANDING INTERNATIONAL BUSINESS
• The Company plans to further strengthen its market share and increase its scale across diverse segments which are less cyclical
• TML continues to strengthen its other business operations (vehicle financing, spare part sales, service and maintenance contracts, sales of aggregates for non-vehicle businesses, among others) to reduce the impact of industry cyclicality
ORGANISATIONAL EFFECTIVENESS
• TML has undertaken a structure change exercise with key guiding principles of Empowerment to the Business Units with clear accountability for business results
• Delayered the organisation to 5 managerial levels
• TML is growing market share across Kenya, Nigeria, Tanzania, Saudi Arabia, United Arab Emirates and Qatar
• Dominant market position across Bangladesh, Nepal and Sri Lanka
• Identified transactional roles for transition to shared services, and thereby focusing on core activities
COST MANAGEMENT INITIATIVES
• TML focuses on technology sharing among different businesses. Indica’s diesel engines were modified for use in the Ace platform to reduce project cost
• Focused on Australia and ASEAN countries; in the preceding two years the Company entered Indonesia, Malaysia and the Philippines
• Primarily with operations in the UK, JLR is also expanding its global footprint in Brazil, China and India
• Platform sharing for the manufacture of pickup trucks and UVs, reducing capital investment
• Reduction of labour costs and rationalisation of other fixed costs
• JLR is streamlining purchasing processes and building on its strong relationships with suppliers, while increasing employee deployment and flexibility across sites
• A new facility is coming up in Slovakia
• Tied up with Magna Steyr for contract manufacturing in Austria
• JLR continues to increase its use of new modular aluminium architecture across vehicle platforms

RISKSThe table below enumerates the key risks, their impact on our capitals and the mitigation measures that we have adopted. For details of all risks, please refer to the Risk Factors in the Management Discussion & Analysis section.
CONTEXT The Company (including JLR) has initiated several programmes to optimise its operating efficiencies and implements its strategic roadmap.
These programmes may not deliver projected efficiencies and anticipated benefits may not accrue as expected.
JLR’s expanding global presence increases its exposure to multiple geopolitical challenges which may impact its business.
India’s automotive industry may be affected by the general economic conditions nationally and internationally.
The Company (including JLR) is subject to a rapidly evolving regulatory landscape around environmental issues such as, CO2 emissions and fuel economy. These developments impact all our products as well as the manufacturing facilities.
The Company has to migrate to BS VI in India from April 1, 2020. This entails challenges in the adaptation of technologies, innovations relating to manufacturing, testing and validation to the new standards.
The global automotive industry (including India) is highly competitive and competition is likely to further intensify following the continuing globalisation and consolidation.
Brand positioning is becoming increasingly challenging as the dynamics of the automotive market (i.e. automated driving, electrification, digital connectivity) and the competitive pressures from existing automotive manufacturers and new disruptive entrants evolve.
The fast pace of technological development together with scarcity of specialist resources could result in a significant change in the automotive industry and increase the risk of delivering superior products demanded by current and future customers.
New and emerging technologies bring unprecedented threats to internet connected devices including vehicles and recent global hacking incidents impacting the geopolitical environment indicate an increase in the motivation to instigate cyber attacks.
CAPITALS IMPACTED
MITIGA-TION
The Company (including JLR) has launched certain initiatives to reduce product and business complexity and to benefit from economies of scale. Its robust project management processes ensure set targets are met.
JLR continues to expand its international footprint and maintains a balanced retail sales profile across key sales regions.
The Company (including JLR) continues to closely monitor global geopolitical and macroeconomic developments.
JLR has invested substantially in the development of lightweight architecture, its in-house four-cylinder engines and electrification technologies, including mild and plug-in hybrid as well as battery electric vehicles.
The Company is making technological and other investments along with its partners such as Cummins to get itself ready with appropriate BS VI solutions across its products.
Recent successful model launches at JLR has broadened its product range to existing and new customers in established and emerging segments.
The Company has also laid down a clear strategic roadmap for its future product and business strategy in India to mitigate the effect of increased competition.
Besides, the Company (including JLR) regularly monitors the perception of its brands to quickly identify and address emerging risks and opportunities.
The Company (including JLR) continues to invest substantially in R&D and also continues its strategic focus on key technology areas including autonomy, connectivity and electrification to outsmart competition.
The Company (including JLR) strives to implement consistent security policies and procedures as well as educating staff, vendors and suppliers to embed best practices by implementing internal tools to detect and mitigate the current and emerging cyber security threats.
Business Strategy and Operating Efficiencies
Volatile Global Economic and Geopolitical Environment
Environmental Regulations and Compliances
CORPORATE OVERVIEW28

2972nd Annual Report 2016-17
CONTEXT The Company (including JLR) has initiated several programmes to optimise its operating efficiencies and implements its strategic roadmap.
These programmes may not deliver projected efficiencies and anticipated benefits may not accrue as expected.
JLR’s expanding global presence increases its exposure to multiple geopolitical challenges which may impact its business.
India’s automotive industry may be affected by the general economic conditions nationally and internationally.
The Company (including JLR) is subject to a rapidly evolving regulatory landscape around environmental issues such as, CO2 emissions and fuel economy. These developments impact all our products as well as the manufacturing facilities.
The Company has to migrate to BS VI in India from April 1, 2020. This entails challenges in the adaptation of technologies, innovations relating to manufacturing, testing and validation to the new standards.
The global automotive industry (including India) is highly competitive and competition is likely to further intensify following the continuing globalisation and consolidation.
Brand positioning is becoming increasingly challenging as the dynamics of the automotive market (i.e. automated driving, electrification, digital connectivity) and the competitive pressures from existing automotive manufacturers and new disruptive entrants evolve.
The fast pace of technological development together with scarcity of specialist resources could result in a significant change in the automotive industry and increase the risk of delivering superior products demanded by current and future customers.
New and emerging technologies bring unprecedented threats to internet connected devices including vehicles and recent global hacking incidents impacting the geopolitical environment indicate an increase in the motivation to instigate cyber attacks.
CAPITALS IMPACTED
MITIGA-TION
The Company (including JLR) has launched certain initiatives to reduce product and business complexity and to benefit from economies of scale. Its robust project management processes ensure set targets are met.
JLR continues to expand its international footprint and maintains a balanced retail sales profile across key sales regions.
The Company (including JLR) continues to closely monitor global geopolitical and macroeconomic developments.
JLR has invested substantially in the development of lightweight architecture, its in-house four-cylinder engines and electrification technologies, including mild and plug-in hybrid as well as battery electric vehicles.
The Company is making technological and other investments along with its partners such as Cummins to get itself ready with appropriate BS VI solutions across its products.
Recent successful model launches at JLR has broadened its product range to existing and new customers in established and emerging segments.
The Company has also laid down a clear strategic roadmap for its future product and business strategy in India to mitigate the effect of increased competition.
Besides, the Company (including JLR) regularly monitors the perception of its brands to quickly identify and address emerging risks and opportunities.
The Company (including JLR) continues to invest substantially in R&D and also continues its strategic focus on key technology areas including autonomy, connectivity and electrification to outsmart competition.
The Company (including JLR) strives to implement consistent security policies and procedures as well as educating staff, vendors and suppliers to embed best practices by implementing internal tools to detect and mitigate the current and emerging cyber security threats.
Intensifying Competition and Brand Positioning
Technological Disruption
Information and Cyber Security
2972nd Annual Report 2016-17

CONTEXT The Company’s operations are subject to risks arising from fluctuations in exchange rates with reference to countries in which it operates. The Company imports capital equipment, raw materials and components from, manufacture vehicles in, and sell vehicles into, various countries, and therefore, its revenues and costs have significant exposure to the relative movements of currencies of those countries.
Also, the Company has an outstanding foreign currency denominated debt and is sensitive to fluctuations in foreign currency exchange rates.
The Company (including JLR) is subjected to risks and costs associated with product liability, warranties and recalls in connection with performance, compliance or safety-related issues affecting the Company’s products which may, in turn, cause the Company’s customers to question the safety or reliability of its vehicles and thus result in a materially adverse effect on its business.
International expansion exposes the Company and its subsidiaries to increased diversity and complexity of legal and other frameworks in a variety of jurisdictions. Therefore, the Company and its subsidiaries become subject to maintaining legal and ethical standards globally.
The Company’s and its subsidiaries’ substantial R&D investment generates IP and the protection of this IP is necessary to prevent its unauthorised third-party use.
Conversely, the Company and its subsidiaries need to ensure that it does not infringe the IP of third parties.
CAPITALS IMPACTED
MITIGA-TION
Currency transaction risk is managed with financial derivatives in line with the hedging policy approved by the Company’s and its respective subsidiaries’ Board.
Also, JLR aims to align its sourcing base with its global sales profile and the revaluation of some of its US Dollar debt provides a natural offset to its US Dollar receivables.
Further, the Company hedges its foreign currency debt as per its hedging policy.
The Company (including JLR) regularly monitor the service data of its vehicles to proactively manage recalls and minimise warranty claims.Jaguar Land Rover also issues technical updates to its dealer network to manage identified faults and defects.
The Company’s code of conduct sets out the behaviours that the Company expects of its staff, including conforming to the highest moral and ethical standards and complying with applicable laws, including anti-bribery, corruption and competition laws, sanctions and export controls.
TML and its subsidiaries have in-house specialists, who manage matters relating to IP and ensure that robust processes are followed by means of patents, registered designs, trademarks and copyrights.
Exchange Rate Volatility
Product Liability, Warranties and Recalls
Unethical and Prohibited Business Practices
CORPORATE OVERVIEW30

3172nd Annual Report 2016-17
CONTEXT The Company’s operations are subject to risks arising from fluctuations in exchange rates with reference to countries in which it operates. The Company imports capital equipment, raw materials and components from, manufacture vehicles in, and sell vehicles into, various countries, and therefore, its revenues and costs have significant exposure to the relative movements of currencies of those countries.
Also, the Company has an outstanding foreign currency denominated debt and is sensitive to fluctuations in foreign currency exchange rates.
The Company (including JLR) is subjected to risks and costs associated with product liability, warranties and recalls in connection with performance, compliance or safety-related issues affecting the Company’s products which may, in turn, cause the Company’s customers to question the safety or reliability of its vehicles and thus result in a materially adverse effect on its business.
International expansion exposes the Company and its subsidiaries to increased diversity and complexity of legal and other frameworks in a variety of jurisdictions. Therefore, the Company and its subsidiaries become subject to maintaining legal and ethical standards globally.
The Company’s and its subsidiaries’ substantial R&D investment generates IP and the protection of this IP is necessary to prevent its unauthorised third-party use.
Conversely, the Company and its subsidiaries need to ensure that it does not infringe the IP of third parties.
CAPITALS IMPACTED
MITIGA-TION
Currency transaction risk is managed with financial derivatives in line with the hedging policy approved by the Company’s and its respective subsidiaries’ Board.
Also, JLR aims to align its sourcing base with its global sales profile and the revaluation of some of its US Dollar debt provides a natural offset to its US Dollar receivables.
Further, the Company hedges its foreign currency debt as per its hedging policy.
The Company (including JLR) regularly monitor the service data of its vehicles to proactively manage recalls and minimise warranty claims.Jaguar Land Rover also issues technical updates to its dealer network to manage identified faults and defects.
The Company’s code of conduct sets out the behaviours that the Company expects of its staff, including conforming to the highest moral and ethical standards and complying with applicable laws, including anti-bribery, corruption and competition laws, sanctions and export controls.
TML and its subsidiaries have in-house specialists, who manage matters relating to IP and ensure that robust processes are followed by means of patents, registered designs, trademarks and copyrights.
Inability to Protect or Preserve the Company’s Patents and Intellectual Property(IP)
OPPORTUNITIESTML JLR
Technological DisruptionsSubstantial market changes (e.g. automation, connectivity and electrification) enable us to focus on launching industry-leading products ahead of competition. We are also strengthening partnerships with global technological organisations and leading academic research teams.
Brand PositioningWe strengthen our brands by creating greater brand association through innovation and technological advancement into our expanding product portfolio and services.
Growth AvenuesGlobal economic growth in developed and emerging markets present opportunities to extend sales. Opportunities both in new and existing geographical markets as well as in new and existing segments.
Expansion in the Commercial Vehicles space Huge opportunities lie in front of us to significantly expand our commercial vehicles market share by leveraging our leadership position in CVs, addressing the product gaps in white spaces, further strengthening our dealership and distribution network and expanding our international footprint with the new-generation products in commercial vehicles.
Regulations on Bus Body code, focus on fully built vehicles, government thrust on road infrastructure, ‘Swachh Bharat’ campaign and the big advantage through improved logistics/supply chain efficiencies under the new GST regime are some of the enablers to new opportunities. The Concept of ‘Smart Cities’ and programmes like NEMMP will ease the implementation of AMP vision and support mass electrification of public transport.
Defence SolutionsWith the Government’s push for 'Make in India' initiative, TAFP (Technology Acquisition Fund Programme), enhanced focus on import substitution for Defence equipment and the opening of
the defence sector for private sector participation, there is a huge opportunity to tap in the Defence sector. The Company aims to establish itself as a full range Defence solutions provider.
Expansion of the volumes and market share in the Passenger Vehicle segment Considering the strong outlook for the Indian economy and resulting increase in the private consumption and per capita income, with the low penetration levels (~30 Cars per 1000 people), Indian passenger vehicle industry has a potential to show
a significant jump in volumes in the medium to long-term. Given this background, there is a huge opportunity to increase market share on the back of new product launches and meeting regulations at par with global standards. Moreover, a large customer base will become addressable due to the changing trends and segmental shifts.

What Makes TML Future Ready?The crafting of our mission, vision and values marked the beginning of our transformation journey.
TIGOR
Another remarkable product, the Tata TIGOR with its break-free design dynamics is India’s first ‘Styleback’ car.
With HEXA we have reached out to today’s dynamic next-gen customers with an emphasis on design, premium comfort and drivability, personifying Tata Motors passenger vehicle business unit’s newly defined IMPACT design language and enhanced digital capabilities.
HEXA
This smart pick-up is available in multiple variants – 4×2 & 4×4 and in single and double cab options. Powered by a common rail diesel engine, it delivers high power and torque, for varied business requirements.
XENON YODHA MAGIC MANTRA
A four-wheeler last mile public transport vehicle, this features a powerful 30 kW (40 hp) engine, a torque of 100 Nm for better pickup with a higher fuel efficiency of 21.4 km/l, powered by a BS IV compliant state-of-the-art 800 cc DiCOR engine.

The year 2016-17 has been a landmark year when we launched several commercial and passenger vehicles, which exemplified our product innovation, advanced design and technology excellence.
Similarly, our subsidiary JLR is leading the transformation from Internal Combustion Engine (ICE) to Automated Connected and Electrified (ACE) vehicles.
Officially the world’s best and most beautiful car after double success at the 2017 World Car Awards, has received the prestigious World Car of Year and World Car Design of the Year titles.
The Jaguar XFL is designed exclusively for China and built at the state-of-the-art Chery Jaguar Land Rover plant in Changshu, the car is fitted with region-specific technology such as the air ionisation function that makes the air inside the car cleaner and more comfortable.
JAGUAR F-PACE
JAGUAR XFL
With Touch Pro Duo, a dual Touchscreen system, lighter, more fuel efficient and powerful Ingenium engine, light weight aluminium body designed for safety and dynamic stability control, Velar leads the way in progressive design, and innovative technology.
The Land Rover Discovery earned a five-star safety rating from Euro NCAP among many awards; recognised for its refreshing design, increased versatility and cutting-edge technology.
LAND ROVER DISCOVERY
RANGE ROVER VELAR

34 CORPORATE OVERVIEW
Our product launches demonstrate our relentless efforts towards taking a great leap in our transformation journey. Our efforts of being Future Ready have some key building blocks, some of which we have already started laying the foundations for.
EXPLORING OPPORTUNITIES IN MOBILITY
We introduced our sub brand – ‘TAMO’, as a core element of our transformation journey ‘FutuReady’. TAMO showcased RaceMo, our new connected sports coupe, at the Geneva Motor Show 2017. With 'Impact Design', the tech-enabled heart of the car is getting contemporary styling.
JLR’s ambition is to be a global leader in Connected Autonomous Vehicles. Its Advanced Driver Assistance Systems, including autonomous emergency braking and park assist, are already stepping stones to full autonomy. JLR envisages the development of an intelligent vehicle in another 10 years, which will be cleaner and safer, with greater car-to-car and car-to-infrastructure connectivity.
JLR’s mobility services arm, InMotion Ventures invests in high-growth companies in the mobility and smart transportation sector. Through this arm, JLR offers new digital solutions and on demand services that meet modern travel and transport challenges.
ENRICHING OFFERINGS IN LINE WITH CUSTOMER ASPIRATIONS
Taking an outside-in approach to observe how aspirations of consumers are getting shaped, we evaluated how India’s different customer segments are getting influenced by global advancements in technology, design and environmental issues.
In FY 2017, the focus was on strengthening our product portfolio to address key gaps in existing markets by embracing new technologies, fostering higher platform efficiency and offering solutions that connect with customer aspirations.
For passenger vehicles, the focus is on differentiated design, great driving experience and remarkable features. For commercial vehicles, in addition to design, the focus areas are enhancing occupant comfort, reducing ownership cost, leading in fuel efficiency and delivering high performance and reliable products.
Accessing real-time data from vehicles is one of JLR’s pioneering initiatives. With the Connected Car diagnostics and technologies like CloudCar, valuable insights can be gained, which not only enable enhanced product development and more efficient processes, but also deliver services before customers even know they need them.

3572nd Annual Report 2016-17
Now, the Company is working to lead in electrification, to achieve the scale required to remain competitive globally. The driving force of this transformation is the organisation’s culture of innovation.
JLR is introducing its standardised framework to overseas sites as a way of directing cross-functional collaboration and ensuring the deployment of the right capabilities needed to manufacture our products.
SPEARHEADING INDIGENOUS DEFENCE TECHNOLOGY
Tata Motors’ Defence Solutions offers its customers a wide range of vehicles in the light, medium and heavy category. These include Logistics, Tactical, Armoured and Specialist vehicles, with lowest life-cycle maintenance cost, supported by the Company’s vast pan-India service network, ensuring maximum operational readiness. At TML, we are leading a consortium that is bidding for the ‘future infantry combat vehicle’ (FICV) project worth $10-billion. Tata Motors, Bharat Forge and General Dynamics Land Systems have come together for this initiative.
BUILDING A NEW ROADMAP IN THE CV SPACE
A comprehensive strategy has been developed in CVs to build on the leadership position. This involves :
• Investments planned across product segments leading to regular and class-leading product interventions.
• Accelerate front line sales efforts to gain market share.
• Customer-centric, judicial mix of EGR (Exhaust Gas Recirculation) & SCR (Selective Catalytic Reduction) technology offerings.
• Structural initiatives to improve capacity utilisation and productivity.
• Establishing TML as a full-range defence solutions provider.
• Working on the road map prepared for 20% topline contribution from exports.
REVAMPING THE MANUFACTURING PROCESS
The change in the manufacturing approach primarily concerns two aspects - achieving commonality in the bill of materials across PVs and shifting to an advanced modular platform where the same line can be used to make multiple products. The cost-structure analysis is being driven internally by ImpACT projects.
At JLR, the first phase of transformation is complete, with costs reduced across the business through process excellence and architecture efficiencies.

CORPORATE OVERVIEW
The future is always evolving. Therefore, it demands time-critical innovation, backed by deep understanding of industry dynamics and changing customer aspirations.
Future-focused Products
SMART BUSES
TATA MOTORS’ RANGE OF SMART BUSES INCLUDES – STARBUS LNG, STARBUS, BRTS, FUEL CELL BUS, STARBUS HYBRID AND STARBUS ELECTRIC (9M AND 12M). THE SMART BUSES AIM AT MAKING THE CITY CLEAN AND GREEN.
STARBUS FUEL CELL IS INDIA’S FIRST ZERO EMISSION HYDROGEN CELL POWERED BUS, DEVELOPED IN PARTNERSHIP WITH ISRO (INDIAN SPACE RESEARCH ORGANISATION)
PASSENGER VEHICLES
• Product portfolio will include brand-enhancing products and products aligned to rising aspirations of customer segments.
• Our architectural approach will be to reduce complexity, adopt emerging technologies and ensure global relevance.
• We have mapped technology solutions in key areas, such as powertrain systems, ADAS and enhanced connectivity to our future product portfolio and have defined the application framework.
COMMERCIAL VEHICLES
• Sustainability fuels our innovation programme. Intensive work is continuing on alternate fuels. At TML, we have developed hydrogen fuel cell technology that powers both
passenger and commercial vehicles to reduce dependence on fossil fuels. This technology was developed with support from the Government of India’s Department of Scientific and Industrial Research.
• We have developed next-gen clean, green fuel based commercial vehicles, such as the Magic Iris Electric, a zero-emission commercial passenger vehicle, which uses solar energy for supplementary charging.
• Our efforts to reform our manufacturing approach will enable the delivery of smarter products.

3772nd Annual Report 2016-17
JAGUAR I-PACE
With the I-PACE Concept, unveiled this year, JLR has created a vehicle with supercar inspired aesthetics, sports car performance and SUV space, in one electric package. Going on sale in 2018, I-PACE is far more than a concept. It is a preview of JLR’s first production battery-powered car, and demonstrates the Company’s on-going commitment to create exciting and desirable electric vehicles.
FUTURE OF MANUFACTURING JLR’S NEW FACILITY AT SLOVAKIA
JLR began constructing the new GBP 1 billion facility in Nitra, Slovakia, in 2016. Some of its key features include:
• The factory will be at the forefront of aluminium manufacturing and engineering expertise.
• Designed with the flexibility to enable smart and connected technologies that ensure improved process efficiency and delivery.
• Europe’s first plant to use Kuka’s Pulse carrier system, 30% faster than conventional conveyance systems.
With focus on decarbonisation, digitisation, connectivity and automation, our subsidiary Jaguar Land Rover (JLR) continued innovating new products and launched 11 major model innovations. It offered new levels new levels of digital connectivity, with the InControl Touch Pro information system, which can be tailored to drivers’ preferences.
UNIQUE & POWERFUL SOLUTIONS
To support the growing demand for cleaner, safer and smarter vehicles, and build a globally competitive business in the changing automotive landscape, JLR will continue to increase the number of
manufacturing operations. Each of JLR’s manufacturing sites is catering to specific customer requirements across geographies:• China’s first all-aluminium body shop has
been established to support production of the Jaguar XFL.
• In Brazil, a new manufacturing plant has been launched.
• In Austria, as part of the manufacturing partnership with Magna Steyr, JLR’s first electric vehicle Jaguar I-PACE is being built.
• The Company has also pledged that by 2020, half of its models will have the option of electrification.
• The paint shop will also feature highly automated processes to deliver quality and minimise environmental impact.
• Land Rover Discovery will be the first vehicle to be manufactured in Slovakia, complementing existing production in Solihull, England.

Innovation is Future PreparednessInnovation, backed by meticulous R&D and design engineering, is one of our strategic priorities to remain ahead of the curve in a hyper-competitive market scenario.
WE ARE WORKING TOWARDS AN AUTONOMOUS, BETTER CONNECTED AND ELECTRIFIED FUTURE, IN WHICH
CUSTOMERS HAVE THE BROADEST RANGE OF CHOICES, FROM ULTRA-CLEAN PETROL
ENGINES TO HYBRIDS AND FULL ELECTRIC VEHICLES.
We believe, to gain market share and strengthen our financial position, we need to drive our innovation efforts more aggressively.
We have around 4500 engineers, scientists and technicians, who are driving innovation at Tata Motors. Aiming to be a global leader in the technology domain, our R&D centres span multiple geographies, including Pune (India), UK and South Korea. Under the TAMO brand, we are instituting Innovation Hubs in Europe and the US. We are also
collaborating with international partners such as Vibracoustic, Bosch, Goodyear, Randle Engineering Services and ILJIN, among many others, for forward-looking technologies.
In India, we are investing significantly towards technology upgrades for meeting the upcoming BS VI requirements for all our products over the next two to three years.
Some of TML’s futuristic technology programmes comprise:
M-Flex MMS Technology for modular car platform
FUTURISTIC TECHNOLOGY
Internet of Things (IoT) and associated technologies on connectivity such as apps, telematics, diagnostics, analytics, among many others
Adaptive Ride Control with Advanced Suspension Dual Stage Damper Technology with Electronics Switches for City and Power modes
Next generation infotainment system with 6.5” TFT touch screen with advanced features like Google Android Auto, Apple Car Play, in-car voice alerts, premium acoustic experience with 8 speakers has been delivered for the Osprey platform
Focusing on technology to combine automotive and consumer grade products. Wearable vehicle authentication key with health monitoring is an example
Selective ADAS technologies for market specific implementation like Forward Collision Warning with Camera - Pedestrian, 2-Wheeler, 4-Wheeler detection (day and night detection), seat belt reminder using ODS (occupant detection sensor) sensor, among others
Focus on vehicle level noise reduction to enhance customer comfort
Development of electro-viscous fan control on M&HCV trucks, which improve fuel economy by reduced fan duty cycle
Development of indigenous Li-Ion battery packs for hybrid and electric buses
Enhancing the effectiveness of regenerative braking by optimally blending it with conventional brake systems
Indigenous development of fuel cell systems and accessories
OUR CONCEPT CARS AND AWARD-WINNING
ENGINES BEAR TESTIMONY TO OUR R&D
EFFORTS.

39
TATA MOTORS (FY 2017) JAGUAR LAND ROVER (FY 2017)
80 52822 36726 412292FILING AND GRANT DETAILS INCLUDE NATIONAL AND INTERNATIONAL JURISDICTIONS
52
A sharp focus on design, technology, research and engineering are key to JLR’s product development. It also incorporates the evolving customer expectations.
JLR’s innovation and research are targeted towards making cars:
Smarter With the introduction of the InControl Touch Pro infotainment system, JLR is offering new levels of digital connectivity, which can be tailored to drivers’ preferences; and is revolutionising the way in which customers interact with their vehicles. The Company is focusing on next-gen technologies, based on machine-learning techniques, thereby learning drivers’ preferences and developing vehicle intelligence, as cars become part of the connected digital ecosystems.
Safer Keeping customer safety at the forefront, the cars transmit location and vehicle diagnostic data to accelerate recovery services at the time of break-downs. In case of serious incidents, the cars have in-built SOS systems, which transmit messages to emergency services. In the external environment too, drivers can use tablets or phones to check fuel levels, record journeys and remotely ensure doors and windows are locked. The InControl Touch Pro system is also aiding the in-car control systems, ensuring customer safety.
With its advanced Driver Assistance Systems, including autonomous emergency braking and park assist, the Company is aiming to be a global leader in Complete Autonomous Systems.
Cleaner To reduce environmental impact at every possible stage of a vehicle’s life cycle, the Company is focusing on both, its operations and the fleet average tailpipe CO2 emissions.
Through a series of initiatives including the Real Car project and the innovative closed loop process, the Company aims to make its manufacturing operations carbon neutral by 2020 and reduce its European fleet average tailpipe CO2 emissions by a further 25% by 2020.
Stylish Focusing on futuristic designs, the Company has been collaborating with students from the Royal College of Art, since 2000, to get insights into Generation Y’s preference for future cars.
JLR is opening the National Automotive Innovation Centre (NAIC) in Spring 2018. A sum of GBP 150 million is being invested in building the NAIC capital and its research initiatives.
JAGUAR LAND ROVER
PATENT APPLICATIONS
DESIGN APPLICATIONS
DESIGNS REGISTERED
PATENTS GRANTED
PATENT APPLICATIONS
PATENTS GRANTED
DESIGNS REGISTERED
DESIGN APPLICATIONS
Cooperative Adaptive Cruise Control JLR is using the latest vehicle-to-vehicle communications technology to develop ways for future connected cars to work together autonomously to make lane changing and crossing junctions easier and safer.
SOME OF OUR RESEARCH PROJECTS
Mind Sense A research project to see if a car could effectively read the brainwaves that indicate a driver is beginning to daydream, or feeling sleepy, while driving.
Driver Wellness Monitoring JLR is assessing how a vehicle could monitor the well-being of the driver using a medical-grade sensor embedded in the seat of a Jaguar XJ.
Predictive Infotainment Screen Prototype Cameras embedded in the car are used to track the driver’s hand movements, enabling the system to predict which button the driver intends to press, allowing button selection in mid-air and less time with eyes off the road.
Haptic Accelerator Pedal JLR is exploring the use of haptics (applying touch sensation to interactions with computer applications) to help the driver increase the speed of their response and take the correct action.
Over the Horizon Warning This is part of a research project testing in-vehicle communication devices that can transmit data from vehicle in order to warn drivers of hazards and obstacles over the horizon or around blind bends.
Roadwork Assist Currently investigating advanced driver assistance to guide the vehicle to the centre of narrow roadwork lanes, reducing driver workload and stress.
Safe Pullaway The use of stereo camera technology to scan the area immediately in front of the vehicle. If objects such as vehicles or walls are detected, the brakes are automatically applied and the driver receives an audible warning.
72nd Annual Report 2016-17

40 CORPORATE OVERVIEW
Achieving A Higher Efficiency CurveOur strong focus on excellence in manufacturing ensures that all our facilities, including design, production and assembly, maintain high quality and efficiency standards.

4172nd Annual Report 2016-17
Our plants are certified for world-class manufacturing and quality standards, with high-end automation and technology.
Transformation Journey As part of our transformation journey, we are focused on implementing next-generation advanced modular platform for all our Future Passenger Vehicles , enabling a faster time-to-market approach. With this transformation, we aim to roll out more nameplates per platform and reduce complexities of our production process. Our strategy is to deliver 7-8 product variants from two platforms for greater coverage and sizable economies of scale.
We have several initiatives for technology upgrades, including ERP, CRM and Data Analytics for Supplier Relationship Management, IT interventions on the shop floor e.g. Project Tantra for Poka-Yoke and implementation of Theory of Constraints in Spare Parts.
Moreover, as part of the Future Ready transformation journey, we have identified 27 ImpACT projects, which will pivot our Strategic Game Plan. There will be a dedicated team led by ExCom members working for these mission-critical projects.
Similarly, Jaguar Land Rover aims to achieve the ‘operational excellence’ goals and optimise business efficiency through a major business transformation. To improve our efficiency and quality, our manufacturing strategy focuses on:
• Building flexibility across lines
• Integrating sales and production plan to better demand management
• Productivity Improvement/ DIFTR
• World-class Quality
• Control on manufacturing cost
• Team competence and capability building
While implementing state-of-the-art facilities and new technologies for increasing efficiency and effectiveness across the Company, JLR builds process excellence using ‘The Jaguar Land Rover Way’ and the 'Tata Business Excellence Model' (TBEM).
To implement improvements in processes and procedures, JLR encourages the ‘go-look-see’ approach, based on cross-functional involvement of its employees and a centralised governance system to experiment with innovative solutions. For driving cost-savings further, the Company is adopting big data analytics which will enable it to be agile and adapt quickly to challenges and business drivers.
JLR’S APPROACH TOWARDS TRANSFORMED COST STRUCTURES
Thrust on InnovationTHE COMPANY ENCOURAGES ITS EMPLOYEES TO SHARE
IDEAS ON RESOURCE EFFICIENCY, WASTE MINIMISATION AND STREAMLINING PROCESSES. THE RESULTS OF IMPLEMENTING IDEAS GENERATED BY EMPLOYEE ‘INNOVATION CIRCLES’ HAVE
RESULTED IN GBP 5.3 MILLION IN SAVINGS.

42 CORPORATE OVERVIEW
Engine Enhancements and Green TechnologiesWe believe the key to staying competitive in the automotive industry will be a faster integration of eco-friendly technologies and enhancing preparedness for upcoming environmental regulations.

4372nd Annual Report 2016-17
Ingenium EnginesBY INCREASING THE USE OF ALUMINIUM ACROSS MODELS AND ENHANCING THE USE OF ITS OWN INGENIUM RANGE OF EFFICIENT ENGINES, JLR IS REDUCING THE EMISSIONS
ASSOCIATED WITH ITS LIGHTWEIGHT VEHICLES.
ALREADY, THE 2.0-LITRE, FOUR-CYLINDER TURBODIESEL ENGINE HAS BEEN INTRODUCED TO JLR’S XF AND XE MODELS, AND WILL
EVENTUALLY FEATURE IN MOST CURRENT AND NEW MODELS. THE INGENIUM ENGINES ACHIEVE JUST 99G/KM OF CO2 IN THE
JAGUAR XE AND 104G/KM OF CO2 IN THE JAGUAR XF.
THE ENGINES, WILL NOT ONLY MINIMISE EMISSIONS BUT ALSO WILL BRING DOWN THE RUNNING COSTS OF THE CARS AND BE
MORE EFFICIENT.
COMPLYING WITH EU LEGISLATION, THE STATE-OF-THE-ART ENGINE CAN BE ADAPTED TO INTEGRATE FUTURE TECHNOLOGY
ADVANCES AND REGULATION CHANGES.
THE PRODUCTION OF 2.0-LITRE, FOUR-CYLINDER INGENIUM PETROL ENGINE HAS STARTED FROM APRIL 2017. THIS WILL
DEBUT IN JLR VEHICLES IN THE SUMMER.
TATA MOTORS' MAJOR INNOVATIONS IN ENGINE TECHNOLOGIES
Next Gen DICR Engines These engines, available in 3L and 5L capacities, offer best-in-class fuel economy, excellent performance lower total cost of ownership, better reliability and durability. These engines are BS IV compliant and are design protected to meet future emission requirements (BS VI).
Tata Cummins Engines As a part of our collaboration with Cummins, we have manufactured a wide spectrum of best-in-class engines that deliver high value propositions like fuel economy, reliability and durability.
Revotron This next-gen aluminium body, light-weight engine has a stiffened crank case with smart electronic control, which minimises noise and vibration and ensures precise control. With the unique multi-drive mode feature, this engine guarantees best economy and driving pleasure.
Revotorq Tata Motors’ Revotorq 1.05L diesel engine made its debut with the Tiago. The engine has been globally benchmarked on various parameters such as performance, economy and refinement.
With environmental innovation embedded in its product development strategy, Jaguar Land Rover is focusing on vehicle light-weighting, powertrain right-sizing and increasing the application of electrification in its propulsion systems.

44 CORPORATE OVERVIEW
Along with these-next generation engine technologies, Tata Motors is working to create futuristic transmission solutions that offer best-in-class driving experiences, fuel efficiency, performance and value proposition to customers. Some of our evolved transmission technologies are:
Intelligent Gear Shift Indicator This prompts the operator to select the gear, which ensures the best balance of fuel economy and driving performance.
6L50 Automatic Transmission Launched in Hexa and Xenon, this transmission is six-speed, electronically controlled with two overdrive ratio gears.
Easy Shift Technology on Passenger Cars Compared to conventional ATS, it is designed to deliver an optimum combination of driving comfort, coupled with performance, fuel economy and better affordability.
G550 Automated Manual Transmission (‘EasyShift’ on CVs)
This AMT solution has been developed on New Gen 6-speed. It has been launched on Ultra bus with New Gen 3 litre engine. Its full potential can be leveraged with the advent of Hybrid.
JLR also continues to invest significantly in the development of new powertrain technologies with plans to introduce Mild Hybrids (MHEVs), Plug-in Hybrids (PHEVs) and Battery Electric Vehicles (BEVs) into its product range. It currently offers diesel hybrid variants of the Range Rover and Range Rover Sport.
Partly funded by the British Government, JLR’s TRANSCEND programme aims to rebuild the UK’s transmission production through investment in processes to develop lighter components as well as more energy-efficient manufacturing production. This is an advanced research project that aims to create lightweight, eight-speed transmission with an ultra-wide ratio spread of 20, which is more than double that of a conventional eight-speed automatic. Weighing around 20 kgs less than existing eight-speed automatics, TRANSCEND could be used in longitudinal rear-wheel drive and all-wheel drive vehicles.
Since 2008, the Company is investing heavily in the development of ultra-clean petrol and diesel engines. It has been constantly reducing NOx emissions with every new model year vehicle. The Company’s latest EU6 diesel engines are among the cleanest in the world, comparable with petrol engines, but with up to 20% lower CO2 emissions. JLR is also introducing a range of alternative powertrains from 2018 and beyond. This includes full electric, hybrid and mild hybrid solutions. It aims that by 2020, half of its range will be available with an alternative power option, suiting different customer needs.

4572nd Annual Report 2016-17
Tata Motors is also introducing zero-emission, clean drivelines into its mainstream product line. Continuing with our commitment towards the development of low-emission technologies, we introduced our fuel-cell bus for zero-emission sustainable urban transport for future cities. The bus is developed on the same platform as the series of hybrid bus.
Some of our key initiatives in this direction are:
Fully Electric Fully electric vehicles ranging from small commercial vehicle to 12m buses, driven by a powerful, high efficiency permanent magnet motor and high energy lithium-ion battery packs.
Engine Downsizing Fuel efficiency improvement in diesel passenger car by engine downsizing (30% engine displacement reduction), friction reduction in piston ring pack and implementing multiple drive modes.
Fuel Control Fuel efficiency improvement in diesel small commercial vehicles by the implementation of fuel control unit based FIE system on twin-cylinder turbo diesel engine.
Motorised EGR System Better emission control by motorised EGR system for small commercial vehicles employing two-cylinder NA common rail BS IV engine.
Hybrid Bus Series hybrid bus with New Gen 5L BS IV diesel engine developed and serialised; the vehicle has substantially superior fuel economy over baseline diesel vehicle.
Better Fuel Economy Multi operation mode (economy and normal torque mode) for better fuel economy and drive ability on commercial vehicles fuelled with CNG.
Build and Testing Fleet of fuel cell bus under build and testing.
The Range Rover Hybrid Pushing the Boundaries of Electrification COMBINING ENVIRONMENTAL CREDENTIALS WITH A
GREAT DRIVE EXPERIENCE
THIS IS THE FIRST DIESEL HYBRID SUV OF ITS KIND IN THE WORLD WHICH COMBINES THE BENEFITS OF BOTH AN ELECTRIC MOTOR
AND CONVENTIONAL POWERTRAIN. WITH THIS INNOVATIVE TECHNOLOGY, ENERGY FLOWS SEAMLESSLY BETWEEN BATTERY
AND ENGINE. THE 3.0L SDV6 DIESEL ENGINE WITH A 35KW ELECTRIC MOTOR DELIVERS 14% LOWER (27G/ KM LESS) CO2
EMISSIONS COMPARED TO THE TDV6 ENGINE AT 169G/KM.
WITH RETURN TO RACING IN AUTUMN 2016 SEASON OF THE FIA FORMULA E CHAMPIONSHIP, WHICH PROVIDES A REAL-WORLD,
FAST-TRACK TEST-BED FOR FUTURE JAGUAR LAND ROVER ELECTRIFICATION TECHNOLOGY, TRANSFERRING INNOVATION
FROM TRACK TO ROAD.
JAGUAR I-PACE IS A PREVIEW OF JLR’S FIRST PRODUCTION BATTERY-POWERED CAR, AND DEMONSTRATES ITS COMMITMENT TO CREATE
EXCITING AND DESIRABLE ELECTRIC VEHICLES.
45ANNUAL REPORT 2016-17

46 CORPORATE OVERVIEW
NURTURING HOLISTIC RELATIONSHIPS
HEALTH
Building sustainable relationships with all our stakeholders and creating shared value are key to our corporate philosophy.
Outreach through the Health Programme
362,000 peopleOutcome 88% of severely and moderately malnourished children are now under normal category
This programme focuses on malnutrition treatment and prevention by enhancing health of infants, adolescent girls, pregnant women and lactating mothers. Moreover, through Sumant Moolgaokar Development Foundation (a Company promoted trust) we facilitate sustainable drinking water solutions across our manufacturing locations.
The guiding philosophy for our CSR initiatives is 'More from Less for More People'. It implies achieving greater impacts, outcomes and outputs with strategic CSR investments, and the efficient deployment of financial and human resources.
Our CSR initiatives envisage meeting the existing and emerging needs of the community through the development of customised programmes and adopt an entire life-cycle approach.
Through our Affirmative Action programme, we reach out to the historically marginalised groups and 40% of our CSR budget is earmarked for programmes towards their upliftment. This is done through education, employability, employment and entrepreneurship.
We create value for our communities through multiple initiatives as part of our CSR programmes; and by partnering with other stakeholders like suppliers and dealers. They are critically linked to our manufacturing business.
KEY CSR PROGRAMMES FOCUS AREAS - TML
CORPORATE SOCIAL RESPONSIBILITY

4772nd Annual Report 2016-17
EDUCATION EMPLOYMENT / SKILL DEVELOPMENT ENVIRONMENT
VOLUNTEERING
Outreach through education Programme
86,900 studentsOutcome Improving pass percentage of Mumbai Municipal School students who appeared in Class X board exams from 71% to 79% in two years
Number of youth trained in different marketable vocational skills
87,750Outcome Over 80% youth who underwent a year-long motor vehicle mechanic course found ready employment within one month of completion of their training
People participating in environmental awareness programme
43,500Number of saplings planted
100,000Outcome Ensured survival of 70% saplings after a year of plantation
This programme aims to improve the accessibility and quality of secondary school education. We also provide financial assistance and scholarships to deserving students. Special coaching classes are also conducted to help students excel in competitive examinations.
This programme seeks to enhance the employability of youth by training them in automotive (driver and motor mechanic courses) and non-automotive (community members are offered agriculture and allied training) trades.
Community members, school students and employees are engaged in plantation and cleanliness drive – raising environmental consciousness. Community members are also encouraged to use renewable energy products, which reduce carbon emissions.
In FY 2017, 11130 TML employees participated as volunteers.

48 CORPORATE OVERVIEW
JAGUAR LAND ROVER – USING TECHNOLOGY FOR GOOD
Jaguar Land Rover uses its technology expertise to benefit local communities. It has undertaken several initiatives in the health and well-being space, using specific technologies in its vehicles, as well as, in promoting education and developing talent.
JLR’s Global CSR programme applies its design and technology expertise for social good and has supported almost six million disadvantaged people in over 25 countries. The company was awarded the ‘Best International Sustainability Programme’ in the UK at the National CSR Awards.
EMPLOYEE VOLUNTEERING
JLR’s volunteering programmes are designed to leverage the skills of its employees to find solutions for the society. More employees volunteered to work in local communities and support education programmes during work hours, this year. It rose from 7774 in 2015-16 to nearly 10000 in 2016-17.
In 2016, JLR’s volunteering initiatives included:
1. Collaboration with Remap, a charity that matches skilled volunteers, including engineers and technicians, with individuals affected by disability.
2. Working for Countrymen’s Club, a charity that supports people suffering from dementia, Parkinson’s and depression, among other diseases.
3. JLR’s apprentice engineers used their expertise to develop a tractor simulator that enables retired farmers to once again experience something they loved.
Jaguar Land Rover (in partnership with ClimateCare) designed an activity that used smart technology to deliver safe water to schools. The programme is bringing award-winning LifeStraw water purification technology to 375 schools across western Kenya – giving over 220,000 school children access to safe water at school and the chance of a better education and future.
JLR’s apprentice engineers helped equestrian rider and MS sufferer Julie Payne by designing a set of lightweight folding steps that allow her to mount her horse unaided.

4972nd Annual Report 2016-17
RELATIONSHIP WITH SUPPLY CHAIN PARTNERS
Initiatives on building sustainable relationships with our supply chain partners
Jaguar Land Rover’s supply chain is complex and growing in line with our international expansion
In FY 2017, TML has engaged with 105 top suppliers who have reported on their environmental, social and governance performance. In addition, we conducted site assessment of 52 suppliers and the combined performance is given below:
Our ‘Project Sankalp’ benefits bottom-of-the-pyramid supplier partners in the areas of quality, productivity and profitability through capability building, elimination of waste (rework, rejections, transit damages, etc.) conservation of resources and a better work environment thereby ensuring business continuity.
Automobile companies have a complex supply chain. The automobile supply chains can be broadly classified into - Direct Material Suppliers (auto components fitted on vehicle) and Indirect Material Suppliers (consumables such as paint, pre-treatment chemicals gases, etc. used in the manufacturing process as well as other materials required for supporting processes).
The other key component of the automobile value chain includes sales & marketing
and after sales service to ensure a superior customer experience through dealers and service touch points.
We engage with our channel partners as well as suppliers very closely. We believe partnering with our suppliers and dealers for sharing knowledge and developing capacity, will add to our cost efficiency and ensure an enhanced customer experience.
27ISO 14001 compliant
23OHSAS 18001 compliant
8ISO 14001- In process
5OHSAS 18001 - In process
540322.54 GJTotal energy consumption
95315.82 tCO2eScope 1 & Scope 2 emission
12 Lost Time Injury (LTI)
0 Fatalities
3 Suppliers using renewable energy
288980.26 m3 Water consumption
83086.31 MTWaste
7.5% female workersGender diversity
2Incidents of non-compliance (Legal compliance)
7 Employee unions at suppliers
25 supplierswith near-miss monitoring
Around 72% of JLR’s suppliers participated in the CDP Supply Chain survey in 2015-16, which compares well with the CDP average of 51%. The Carbon Disclosure Project (CDP) Supply Chain programme is an important global platform for engaging with suppliers to help businesses decarbonise and strengthen their own resilience.
JLR's UK supply chain has grown strongly, matching its growth story. UK-sourced components have increased to 50%, creating GBP 3.5 billion per annum of additional UK contracts, supporting 200,000 jobs and taking its total annual manufacturing spend with UK suppliers to more than GBP 6.5 billion. In the last five years, JLR's investment has generated more than 60,000 new jobs in the UK supply chain.

50 CORPORATE OVERVIEW
A COMMITMENT TO SUSTAINABILITY
Conservation of natural resources has always been a priority for Tata Motors. We strive to minimise the impact of our operations on the natural environment. Depending upon stakeholder engagement outcomes and materiality assessment, we formulate our Sustainability Strategy and prioritise actions towards addressing the Material Environmental Issues. Our efforts on environmental conservation are governed by the Board-level Safety, Health and Environment (SHE) Committee, which monitors and reviews our environmental performance.
The key environmental issues which we prioritise and act upon are:
RESOURCE CONSERVATION Resource optimisation is of prime importance. There are multiple financial and non-financial benefits, which are associated with resource optimisation. Not only does it lead to reduction in vehicular weight, fuel efficiency and generated waste, it leads to significant cost savings.
At TML, we achieved a significant reduction in steel and ferrous alloy consumption in FY 2016-17, compared to FY 2015-16, even though there has been an increase in production by 0.28%. We are continuously seeking to optimise material usage and recycling to avoid virgin material consumption through initiatives, such as using high-strength steel and alternate engineering plastic.
Through Tata OK and Tata Assured initiative and our reconditioning business, Prolife, we are extending the life of our products, while ensuring optimum operational performance and minimising the usage of virgin materials.
14,058Number of vehicles refurbished and sold
JAGUAR LAND ROVER
Closed Loop Process
Continuing its efforts of building closed-loop systems, JLR has changed the way it works by collecting the surplus aluminium from its body-stamping process and reusing it to make new vehicles. This has helped in achieving Zero Waste to Landfill by 2016.
CIRCULAR ECONOMY While we are complying with waste management laws in our respective geographies, we are actively working towards adopting the principles of ‘Circular Economy’. This initiative will help us transform our approach towards waste management. It will build synergies among different functions such as design, materials sciences, engine technologies; and also present opportunities from new business streams.
44,069 Total volume of product recycled/reused in take-back programme
In one year alone, JLR reclaimed 50,000+ tonnes of press shop aluminium waste which was enough to make around 200,000 Jaguar XE body shells. The company is now applying this process to other materials.
Natural or sustainable materials
As a member of the Lightweight And Sound consortium (LANDS), JLR has been involved in a three-year project to find material
replacements that use recycled content and that are suitable for current production methods. The work JLR is doing with its LANDS partners has confirmed that natural or sustainable materials can meet current automotive standards and be manufactured successfully – an important step towards further environmental improvements across the vehicle life cycle.

5172nd Annual Report 2016-17
Water consumption has been identified as one of our key sustainability issues. The water demand at nearly all our operational locations is significant owing to several water intensive processes. Besides, large quantity of water is used for non-industrial activities owing to our large workforce. Water productivity is also one of the key criteria for selecting any new technology.
Currently, all TML manufacturing sites and subsidiaries, have achieved Zero Liquid Discharge status, except TML Jamshedpur where treated wastewater is partly reused.
The Jaguar Land Rover operations, too, are focused on reducing water use per vehicle. Since 2007, the Company has reduced water use per vehicle by 39%, through the 'water switch-off' initiative between vehicles on the production line.
Maximising the use of treated effluent through filtration, Ultra Filtration, Reverse Osmosis
Use of low-flow faucets to reduce water consumption
To reduce our fresh water intake, we have taken up rainwater harvesting across all our manufacturing plants
Some of our key conservation initiatives comprise:
We have achieved a significant reduction in surface water withdrawal due to rainwater harvesting and storage.
Specific water consumption per vehicle produced (m3/vehicle)
Year
2014-15 11.76
2015-16 10.01
2016-17 11.31
Variable frequency drive for optimisation of pump operation
WATER CONSERVATION

52 CORPORATE OVERVIEW
With a flurry of in-house manufacturing activities such as pressing / stamping, fabrication, painting, machining, assembly and testing of aggregates to final assembly of vehicles, the waste-burden generated is huge. However, we are committed to diverting hazardous wastes away from destructive disposal practices and hence we are exploring multiple recycling options.
Some initiatives comprise energy recovery from high calorific value wastes through co-processing route with cement industries, solidification / stabilisation of ETP sludge as pavers and conversion of paint sludge into industrial primer.
Although our Indian manufacturing facilities are not located within the vicinity of any identified or notified bio-diversity hotspots or protected water bodies, the extended positive impacts of our water conservation efforts are evident with the variety of avian fauna seen at our water harvesting ponds.
Progressing with 'Zero Waste' target by 2020, Jaguar Land Rover has set the interim target of zero waste to landfill from its manufacturing and product creation sites. Some of the key milestones for achieving the target include:
• No waste sent direct to landfill from vehicle operations
• 95% avoidance of landfill at second tier
The Company decided against sending the waste to off-site facilities for processing, which may already have an ongoing contribution to landfill.
During 2016-17, TML has taken multiple initiatives towards our journey to achieve 'Zero waste to common waste disposal site' and have reduced hazardous waste disposal to landfill and incineration. We significantly increased hazardous waste co-processing for energy recovery and material recovery at our various manufacturing sites as well as material recovery through recycling.
WASTE MANAGEMENT
BIODIVERSITY

5372nd Annual Report 2016-17
In line with the Tata Group Policy on Climate Change, Tata Motors has articulated its Climate Change Policy, which articulates a three-pronged approach to our carbon emissions mitigation strategy:
JLR achieved a 32% reduction in its European fleet’s average tailpipe CO2
emissions in just eight years. In the same period, it has driven a 38% improvement in its operational CO2 emissions. Through a combination of low-emission technologies and electrification, JLR’s target is to reduce its European fleet’s average tailpipe CO2
emissions by a further 25% by 2020.
Through REALCAR (Recycled Aluminium Car) project, in one year alone, JLR reclaimed and recycled 50,000+ tonnes of aluminium waste, feeding it back into its manufacturing process; and preventing the associated CO2 from being released into the atmosphere.
SETTING NEW BENCHMARKSJLR continues to set new benchmarks for the sector. Targeting emissions reduction, both for the manufacturing process and during the vehicles’ operations, JLR has undertaken multiple initiatives:
Product Development Minimising tail-pipe emissions, creating products dependent on alternative energy sources
Manufacturing Process Improving energy efficiency and maximising use of renewable energy sources, thereby minimising emissions
Supply Chain Minimising emissions with the life-cycle approach
2014-15
2015-16
2016-17
Energy Consumption in GJ within TML
961,203
1,002,630
1,052,171
DirectIndirect
1,463,371
1,540,706
1,667,912
2014-15
2015-16
2016-17
Scope 1 and Scope 2 emission (tCO2e)
336,494
Scope 1 Scope 2
323,833
317,836
61,604
64,418
68,042
• UK manufacturing facilities, product creation sites and most of the satellite sites purchase 100% renewable electricity from electricity providers.
• Installing solar panels, LED lighting, combined heat and power, building management systems, voltage optimisation, insulation and energy mapping are all initiatives taken to ensure carbon neutrality by 2020.
• With an investment of GBP 23 million, the Company has implemented over 60 energy-saving projects over past few years, which has led to the savings of 57,000 tonnes of CO2 equivalent. With this accomplishment, JLR's specific emissions per vehicle has reduced by almost 38%, compared to what it was a decade ago.
TML is the second Indian company which is committed to RE100, a global collaborative initiative of the world’s most influential companies aspiring to source 100% renewable power.
Currently, TML has obtained around 9% of electricity from renewables and has its own captive wind power project of 21.95 MW capacity.
There are numerous energy conservation initiatives undertaken by TML at its manufacturing facilities. Some of these include:
• Using infrared sensors and timers for on-off control of industrial equipment like fans/ pumps/ motors, among others.
• Installing Waste Heat Recovery System to recover waste heat from exhaust flue gases.
• Installing LED lighting in all offices and other common areas.
• Installing variable frequency drives.
ENERGY AND GHG EMISSIONS

54 CORPORATE OVERVIEW
PEOPLE DRIVE US
At TML, our strategies are fuelled by our people. Employee welfare, health and happiness are the key focus areas of our business. We believe that nurturing a high-performance culture is an imperative.
Our priority is worker safety and we follow globally recognised standards to ensure safe working conditions for our employees and contract workers.
ORGANISATIONAL EFFECTIVENESS
After embarking on our transformation journey and coining our Mission, Vision and Values, we prepared our corporate Balanced Score Card (BSC), which was translated into an Annual Business Plan. Based on this our Company’s Key Performance Indicators (KPIs) have been subsequently cascaded to BU/ Functions and eventually to employees' Goal Sheet.
At TML, we initiated an organisation effectiveness (OE) project as a companywide major transformation exercise, aiming to create a leaner organisation and enhance efficiency.
We employed Accenture to study the current structure, strategy and people, and benchmark against the world’s most competitive companies.
The most significant change in the structure was the creation of a new vertical called Product Line function within the CV and PV business, aiming to have an end-to-end P&L responsibility with an entire value chain of business.
RECRUITMENT
TML has put in place a structured recruitment process to hire workforce in both white and blue-collar categories. Operational initiatives for pre-recruitment and post-recruitment are outsourced to a Recruitment Process Outsourcing (RPO) Partner. We ensure that Tata Motors brand is built as an employer at campuses through systematic periodic interventions.
NEW PERFORMANCE MANAGEMENT SYSTEM
For embracing a high-performance culture and achieving the vision we have set, our new leadership and performance management system, LOOP was institutionalised.
LOOP is the foundation of a transformation journey and comprises three primary pillars: a) Objective setting based on corporate and business unit and balanced score card; b) Integrated performance and leadership behaviour appraisal wherein performance is measured vis-à-vis target achievement and leadership behaviour; c) Performance based reward system, which takes into account TML’s and the individual’s performance.
CAPACITY BUILDING
As part of this restructuring, the upgraded product and technology roadmaps have been used to arrive at future capability requirement and accordingly competency gaps have been identified. A Product Leadership Academy framework has been put in place to address the competency needs across divisions. The training models encompass knowledge and capability enhancement, management development programmes and Fundamental Skills Training, catering to training needs across levels.
Average training person hours at TML
Category of employment Training person hours
Males Females Total Average
Senior management 47010 1341 48351 46.81
Middle management 399812 26690 426502 53.87
Junior management 121405 10888 132293 43.53
Non-management (permanent blue-collar workforce)
88327 941 89267 6.36

5572nd Annual Report 2016-17
DIVERSITY
As a part of the Tata Group, we uphold the Group’s core values and provide equal growth opportunities to people from different social segments. To enhance workplace diversity, we increased the intake of blue-collared women workers on the shop floor across the company in FY 2016-17. We also focused our campus hiring efforts to target women graduates.
For JLR:
• Female graduate and apprentice intake : up by 30%
• Women joining graduate programme make up 29 per cent of total hires
LEADERSHIP COMMUNICATION
Town halls are conducted every quarter by the ExCom at different locations to update on business and OE exercise. After the town halls, group discussions are held by each ExCom with employees at that location.
OCCUPATIONAL HEALTH AND SAFETY
Providing our employees, a safe and healthy work environment is a key priority of our people’s policy. A companywide Occupational Health and Safety policy is the guiding mantra for our safety initiatives. The Board-level SHE (Safety, Health and Environment) committee oversees and directs our safety initiatives. We have institutionalised Safety Committee across our CV and PV businesses.
There are multiple initiatives like safety drills and trainings which are undertaken. We also focus on contractor safety management and evaluation prior to awarding contract. Besides, audits, reward and recognition are conducted on field safety.
We have significantly increased our scope of Safety Awareness Building Campaigns (like road safety week, national safety month, among others) for engaging our channel partners and supplier fraternity as well. We engage in continuous communication and awareness on lifestyle/ wellness, health promotional activities for our white-collared employees as well.
FULFILLING THE SKILLS SHORTAGE
To fulfil the skills shortage faced by the UK’s automotive industry, the Company has established its Jaguar Land Rover Academy and spends over GBP 100 million each year. With this, the Company wants to develop the present workforce and inspire future engineers.
JLR is continuing its efforts by reaching out to untapped talent through multiple education schemes. Many of its employees who have been through these programmes have gone on to be award-winning engineers.
Further efforts in this direction include programmes supporting award-winning STEM (science, technology, engineering and mathematics) education schemes for young children. The Company wants to increase these inspirational outreach programmes to align with the future skill needs.
Some of the areas in which JLR wants to attract future talent are:
• Virtual Modelling
• Data Analysis
• Hardware Design
• Software Design
• Programme Delivery for highest- calibre project management
To help address industry shortages, in the last four years Jaguar Land Rover has reached out to over 2.5 million young people to inspire them to consider an automotive career.
Our subsidiary, JLR’s goal is 'Zero Harm'.Destination Zero is the campaign which gets everyone at JLR to understand their safety responsibilities.
JLR's Lost Time Case performance had an improving trend of ~6% Y-o-Y.
At JLR, the guiding philosophy is 'Engaged, passionate people delivering experiences the customers love, for life'.
At TML, Lost Time Injury Frequency rate (LTI-FR) has reduced from 0.17 to 0.15 - an overall reduction of 11.8%, compared to our 2015-16 safety performance. Similarly, Total Recordable Case Frequency rate (TCR-FR) has reduced from 1.49 to 1.41 - an improvement in performance by 5.36%.

56 CORPORATE OVERVIEW
AWARDS AND RECOGNITION
TATA MOTORS WON Business Today
‘Best Companies to Work For’ Award, 2017
HUMAN RESOURCES
ENVIRONMENTAL PERFORMANCE
MANUFACTURING EXCELLENCE
UPKEEPING THE HIGHEST STANDARDS OF ENVIRONMENTAL PERFORMANCE
TATA MARCOPOLO MOTORS LIMITED WON 17th Annual Greentech
Environment Award
JAGUAR LAND ROVER NAMED AS THE 'Largest Automobile Manufacturer in Britain'
FOR THE SECOND TIME IN JANUARY 2017
JLR’S HALEWOOD PLANT WON 13 awards in 5 years
MAKING IT JLR’S MOST AWARDED PLANT
JLR’S ENGINE MANUFACTURING CENTRE RECEIVED ITS FIRST AWARD
‘The Manufacturing Champion’ AT THE EXPRESS AND STAR BUSINESS AWARDS
TATA MOTORS DHARWAD COMMERCIAL VEHICLE PLANT ACHIEVED
WCQ Level 3
TATA MOTORS LUCKNOW, JAMSHEDPUR AND PANTNAGAR PLANTS ACHIEVED
WCQ Level 2TML DRIVELINES PLANT
A SUBSIDIARY OF TATA MOTORS ACHIEVED WCQ Level 3
TATA MOTORS LIMITED (INDIA OPERATIONS) WON Golden Peacock
NATIONAL QUALITY AWARDS
2016-17
PRODUCT EXCELLENCE
JAGUAR LAND ROVER HAS RECEIVED APPROXIMATELY 213 Awards
MAJOR AWARDS RECEIVED
JAGUAR XF NAMED Best Saloon Car
AT THE GOLDEN STEERING WHEEL AWARDS, GERMANY
JAGUAR F-TYPE WON Auto Motor &
Sport Auto AWARDS, GERMANY
ALL-NEW JAGUAR F-PACE WON THE
World Car of the Year World Car Design
of the Year & Women’s Car of the Year
AWARDS
TATA TIAGO WON ‘Compact Car of the Year’
AT THE 17th CNBC TV18 OVERDRIVE AWARDS 2016 IN ADDITION TO 17 OTHER AWARDS
TATA MOTORS ALSO WON SEVERAL AWARDS AT THE APOLLO CV AWARDS IN FEBRUARY 2017:
TATA ARMORED PERSONAL CARRIER WON Special CV Application of the Year
PRIMA 2528.K WON
MCV Tipper of the Year
SIGNA 4923.S TRACTOR WON HCV Tractor Cargo Carrier of the Year
TATA DOUBLE DECK TRACTOR TRAILER WON
CV Application Builder of the Year
THE RANGE ROVER VOGUE SE TOOK Whatcar’s 2017
Best Luxury SUVAWARD
THE NEW DISCOVERY TOOK THE SUV of the Year
TITLE AT THE ORIENT AUTO AWARDS
THE RANGE ROVER EVOQUE WAS NAMED
Industry Pioneer AT THE MIDDLE EAST
CAR OF THE YEAR AWARDS

5772nd Annual Report 2016-17
CHAIRMAN EMERITUS Mr Ratan N Tata
CORPORATE INFORMATION
SHARE REGISTRARS TSR Darashaw Limited 6-10, Haji Moosa Patrawala Industrial Estate, 20 Dr E Moses Road, Mahalaxmi, Mumbai - 400 011 Tel: +91-22-66568484 Fax: +91-22-66568494 Email: [email protected] Website: www.tsrdarashaw.com
AUDITORS Deloitte Haskins & Sells LLP (Registration No. 117366W/W-100018)
ExCOM Mr Guenter Butschek CEO and Managing Director
Mr Satish Borwankar Executive Director and Chief Operating Officer
Mr C Ramakrishnan Group Chief Financial Officer
Mr Girish Wagh Head - Commercial Vehicles Business Unit
Mr Mayank Pareek Head - Passenger Vehicles Business Unit
Dr Timothy Leverton Chief Technology Officer
Mr Gajendra Chandel Chief Human Resource Officer
Mr Shailesh Chandra Head - Corporate Strategy and Business Transformation
Mr Thomas Flack Chief Purchasing Officer
BOARD OF DIRECTORS Mr N Chandrasekaran Non Executive Director and Chairman
Dr R A Mashelkar Non Executive, Independent Director
Mr N Munjee Non Executive, Independent Director
Mr V K Jairath Non Executive, Independent Director
Ms Falguni Nayar Non Executive, Independent Director
Mr O P Bhatt Non Executive, Independent Director
Dr Ralf Speth Non Executive Director
Mr Guenter Butschek CEO and Managing Director
Mr Satish Borwankar Executive Director and Chief Operating Officer
Mr Ravindra Pisharody Executive Director (Commercial Vehicles)
COMPANY SECRETARY Mr H K Sethna

58 CORPORATE OVERVIEW
(` in crores) As at As at As at
31 March 2017 31 March 2016 1 April 2015WHAT THE COMPANY OWNED (1) Property, plant and equipment and Other intangible assets 128,969.60 132,390.90 116,180.99 (2) Goodwill 673.32 759.80 731.95 (3) Non-current Investments 5,296.77 4,533.98 3,942.51 (4) Non-current Finance receivables 10,753.13 9,671.55 9,606.60 (5) Deferred tax assets (net) 4,717.54 5,222.84 4,996.86 (6) Other non-current assets 6,512.14 4,638.41 3,127.95 (7) Current assets 116,831.86 109,923.67 99,556.86
TOTAL ASSETS 273,754.36 267,141.15 238,143.72
(` in crores) As at As at As at
31 March 2017 31 March 2016 1 April 2015WHAT THE COMPANY OWED(1) Net worth
Equity share capital 679.22 679.18 643.78 Other equity 57,382.67 78,273.23 54,628.80
(2) Non-controlling interests 453.17 432.84 429.75 (3) Non-current borrowings 60,629.18 50,510.39 54,607.14 (4) Non-current provisions 9,004.46 7,891.01 6,938.27 (5) Deferred tax liabilities (net) 1,174.00 4,474.78 2,559.49 (6) Other non-current liabilities 28,802.14 17,830.29 18,942.85 (7) Current liabilities 115,629.52 107,049.43 99,393.64
TOTAL LIABILITIES 273,754.36 267,141.15 238,143.72
SUMMARISED STATEMENT OF ASSETS AND LIABILITIES (CONSOLIDATED)

5972nd Annual Report 2016-17
(` in crores)
2016-2017 2015-20161 INCOME
Income from operations 274,492.12 277,660.59 Other income 754.54 885.35 Total 275,246.66 278,545.94
2 EXPENDITURECost of materials consumed 159,369.55 153,292.49 Purchase of products for sale 13,924.53 12,841.52 Changes in inventories of finished goods, work-in-progress and products for sale (7,399.92) (2,750.99)Excise duty 4,799.61 4,614.99 Employee benefits expense 28,332.89 28,880.89 Finance costs 4,238.01 4,889.08 Foreign exchange (gain)/loss (net) 3,910.10 1,616.88 Depreciation and amortisation expense 17,904.99 16,710.78 Product development/Engineering expenses 3,413.57 3,468.77 Other expenses 55,430.06 55,683.75 Amount capitalised (16,876.96) (16,678.34)Total Expenses 267,046.43 262,569.82 Profit/(loss) before exceptional items and tax 8,200.23 15,976.12 Employee separation cost 67.61 32.72 Others (1,182.17) 1,817.63
3 PROFIT BEFORE TAX FROM CONTINUING OPERATIONS 9,314.79 14,125.77 4 Tax expense (net) 3,251.23 3,025.05 5 PROFIT AFTER TAX FROM CONTINUING OPERATIONS (3-4) 6,063.56 11,100.72 6 Share of profit of joint ventures and associates (net) 1,493.00 577.47 7 PROFIT FOR THE YEAR 7,556.56 11,678.19 8 TOTAL OTHER COMPREHENSIVE INCOME/(LOSS) (27,494.57) 3,157.46 9 TOTAL COMPREHENSIVE INCOME/(LOSS) FOR THE YEAR (19,938.01) 14,835.65
SUMMARISED STATEMENT OF PROFIT AND LOSS (CONSOLIDATED)

60 CORPORATE OVERVIEW
(` in crores) As at As at As at
31 March 2017 31 March 2016 1 April 2015WHAT THE COMPANY OWNED (1) Property, plant and equipment and Other intangible assets 27,375.42 26,663.25 25,969.26 (2) Goodwill 99.09 99.09 99.09 (3) Non-current Investments 15,307.24 15,217.48 15,208.16 (4) Deferred tax assets (net) 724.58 799.63 647.24 (5) Other non-current assets 2,442.21 2,034.86 2,082.09 (6) Current assets 12,588.06 11,861.69 9,474.06
TOTAL ASSETS 58,536.60 56,676.00 53,479.90
(` in crores) As at As at As at
31 March 2017 31 March 2016 1 April 2015WHAT THE COMPANY OWED(1) Net worth
Equity share capital 679.22 679.18 643.78 Other equity 20,129.93 22,582.93 14,505.58
(2) Non-current borrowings 13,686.09 10,599.96 12,234.88 (3) Non-current provisions 850.71 750.89 711.54 (4) Deferred tax liabilities (net) 97.95 71.39 66.34 (5) Other non-current liabilities 1,444.90 3,289.91 4,130.62 (6) Current liabilities 21,647.80 18,701.74 21,187.16
TOTAL LIABILITIES 58,536.60 56,676.00 53,479.90
SUMMARISED STATEMENT OF ASSETS AND LIABILITIES (STANDALONE)

61
(` in crores)
2016-2017 2015-20161 INCOME
Income from operations 49,100.41 47,383.61 Other income 978.84 1,402.31 Total 50,079.25 48,785.92
2 EXPENDITURECost of materials consumed 27,654.40 24,997.40 Purchase of products for sale 3,945.97 4,101.97 Changes in inventories of finished goods, work-in-progress and products for sale (251.43) 10.05 Excise duty 4,736.41 4,538.14 Employee benefits expense 3,558.52 3,188.97 Finance costs 1,590.15 1,592.00 Foreign exchange (gain)/loss (net) (252.45) 222.91 Depreciation and amortisation expense 2,969.39 2,329.22 Product development/Engineering expenses 454.48 418.27 Other expenses 8,697.42 8,216.65 Amount capitalised (941.55) (1,034.40)Total Expenses 52,161.31 48,581.18 Profit/(loss) before exceptional items and tax (2,082.06) 204.74 Employee separation cost 67.61 10.04 Others 271.10 261.80
3 PROFIT BEFORE TAX FROM CONTINUING OPERATIONS (2,420.77) (67.10)4 Tax expense (net) 59.22 (4.80)5 PROFIT AFTER TAX FROM CONTINUING OPERATIONS (3-4) (2,479.99) (62.30)6 TOTAL OTHER COMPREHENSIVE INCOME/(LOSS) 95.48 85.47 7 TOTAL COMPREHENSIVE INCOME/(LOSS) FOR THE YEAR (2,384.51) 23.17
SUMMARISED STATEMENT OF PROFIT AND LOSS (STANDALONE)
72nd Annual Report 2016-17

62 CORPORATE OVERVIEW
CAPITAL ACCOUNTS (` in lakhs) REVENUE ACCOUNTS (` in lakhs) RATIOS
Year Capital Reserves
and Surplus
Borrowings Gross Block
(including
CWIP)
Depreciation Net Block Turnover Depreciation Profit/ (Loss)
Before
Taxes
Taxes Profit/ (Loss)
After Taxes
Dividend
including
tax
PAT to
Sales
Earnings Per Share
(Basic)* (`)
Dividend Per
Share*(#)
Net Worth
Per Share*
(`)
Ordinary
Share
'A'
Ordinary
Share
Ordinary
Share
'A'
Ordinary
Share
1945-46 100 1 - 31 2 29 12 2 1 - 1 - 8.3% 0.07 - - - 10
1949-50 200 11 94 233 44 189 167 15 11 5 6 - 3.6% 0.03 - - - 10
1953-54 500 27 412 731 270 461 321 97 3 - 3 - 0.9% 0.11 - - - 11
1954-55 627 27 481 792 303 489 445 35 - - - - 0.0% 0.00 - - - 11
1955-56 658 120 812 1,010 407 603 1,198 105 125 32 93 59 7.8% 1.32 - 0.60 - 12
1956-57 700 149 1,382 1,352 474 878 2,145 70 116 27 89 44 4.1% 1.64 - 0.80 - 13
1957-58 700 117 1,551 1,675 668 1,007 2,694 129 99 6 93 52 3.5% 1.72 - 0.90 - 12
1958-59 1,000 206 1,245 2,050 780 1,270 2,645 113 155 13 142 56 5.4% 1.68 - 0.90 - 12
1959-60 1,000 282 1,014 2,201 940 1,261 2,825 161 222 93 129 108 4.6% 1.50 - 1.25 - 13
1960-61 1,000 367 1,263 2,593 1,118 1,475 3,735 180 313 122 191 126 5.1% 2.26 - 1.45 - 14
1961-62 1,000 432 1,471 2,954 1,336 1,618 4,164 220 378 188 190 124 4.6% 2.28 - 1.45 - 15
1962-63 1,000 450 1,758 3,281 1,550 1,731 4,364 223 327 185 142 124 3.3% 1.68 - 1.45 - 15
1963-64 1,198 630 2,470 3,920 1,802 2,118 5,151 260 404 200 204 144 4.0% 1.97 - 1.45 - 16
1964-65 1,297 787 3,275 4,789 2,144 2,645 6,613 345 479 208 271 157 4.1% 2.39 - 1.45 - 17
1965-66 1,640 995 3,541 5,432 2,540 2,892 7,938 398 477 189 288 191 3.6% 2.20 - 1.45 - 18
1966-67 1,845 1,027 4,299 6,841 3,039 3,802 9,065 505 620 192 428 235 4.7% 2.80 - 1.45+ - 17
1967-68 1,845 1,121 5,350 7,697 3,608 4,089 9,499 572 395 66 329 235 3.5% 2.10 - 1.45 - 18
1968-69 1,845 1,295 5,856 8,584 4,236 4,348 10,590 630 582 173 409 235 3.9% 2.66 - 1.45 - 19
1969-70 1,845 1,333 6,543 9,242 4,886 4,356 9,935 662 274 - 274 221 2.8% 1.72 - 1.35 - 19
1970-71 1,845 1,516 6,048 10,060 5,620 4,440 13,624 749 673 270 403 251 3.0% 2.49 - 1.45 - 20
1971-72 1,949 2,020 6,019 10,931 6,487 4,444 15,849 758 885 379 506 273 3.2% 3.04 - 1.50 - 23
1972-73 1,949 2,194 5,324 12,227 7,491 4,736 15,653 820 832 360 472 266 3.0% 2.87 - 1.50 - 24
1973-74 1,949 2,394 6,434 13,497 8,471 5,026 16,290 902 1,007 450 557 180 3.4% 3.43 - 0.93 - 26
1974-75 1,949 2,827 9,196 15,838 9,593 6,245 22,510 1,134 677 136 541 266 2.4% 3.32 - 1.50 - 28
1975-76 2,013 3,691 9,399 18,642 10,625 8,017 27,003 1,054 855 91 764 276 2.8% 4.60 - 1.50 - 33
1976-77 2,328 3,833 11,816 20,709 11,685 9,024 28,250 1,145 1,056 - 1,056 323 3.7% 5.38 - 1.50+ - 30
1977-78 2,118 4,721 11,986 22,430 12,723 9,707 28,105 1,101 1,044 - 1,044 313 3.7% 5.37 - 1.50 - 35
1978-79 3,151 5,106 11,033 24,900 13,895 11,005 37,486 1,200 1,514 - 1,514 467 4.0% 5.36 - 1.60+ - 27
1979-80 3,151 6,263 17,739 28,405 15,099 13,306 44,827 1,300 1,762 - 1,762 605 3.9% 5.96 - 2.00 - 31
1980-81 3,151 8,095 15,773 33,055 16,496 16,559 60,965 1,616 2,437 - 2,437 605 4.0% 8.27 - 2.00 - 38
1981-82 4,320 10,275 25,476 38,819 18,244 20,575 79,244 1,993 4,188 - 4,188 839 5.3% 10.18 - 2.00+ - 35@
1982-83 4,226 12,458 23,361 43,191 20,219 22,972 86,522 2,187 3,481 460 3,021 827 3.5% 7.34 - 2.00 - 40
1983-84 5,421 14,103 25,473 46,838 23,078 23,760 85,624 2,923 2,163 235 1,928 923 2.3% 3.61 - 2.00 - 37@
1984-85 5,442 15,188 30,226 52,819 26,826 25,993 93,353 3,895 2,703 390 2,313 1,241 2.5% 4.32 - 2.30 - 39
1985-86 5,452 16,551 44,651 61,943 29,030 32,913 102,597 3,399 1,832 215 1,617 1,243 1.6% 3.00 - 2.30 - 41
1986-87 5,452 15,886 53,476 68,352 30,914 37,438 119,689 2,157 293 - 293 552 0.2% 0.51 - 1.00 - 40
1987-88 6,431 17,491 44,406 75,712 34,620 41,092 140,255 3,822 3,205 510 2,695 1,356 1.9% 4.25 - 2.30 - 38@
1988-89 10,501 30,740 32,396 83,455 38,460 44,995 167,642 4,315 8,513 1,510 7,003 2,444 4.2% 6.74 - 2.50 - 40@
FINANCIAL STATISTICSCOMPANY (STANDALONE)

63
Notes :
@ On increased capital base due to conversion of Bonds / Convertible Debentures / Warrants / FCCN into shares.
$ On increased capital base due to issue of Bonus Shares. Net Worth excludes ordinary dividends.
* To a face value of `10/- per share upto 2011-12.
# Includes Interim Dividend where applicable.
+ Including on Bonus Shares issued during the year.
! Includes a special dividend of `2.50 per share for the Diamond Jubilee Year.
++ On increased capital base due to Rights issue and conversion of FCCN into shares.
^ On increased capital base due to GDS issue and conversion of FCCN into shares.
^^ On increased capital base due to QIP issue and conversion of FCCN into shares.
** Consequent to sub-division of shares, figures for previous years are not comparable.
## Includes reversal of dividend distribution tax of earlier year.
+++ On increased capital base due to Rights issue.
^^^ The figures of FY 2016-17 is as per Ind AS with Joint operation
FINANCIAL STATISTICSCOMPANY (STANDALONE)
72nd Annual Report 2016-17
CAPITAL ACCOUNTS (` in lakhs) REVENUE ACCOUNTS (` in lakhs) RATIOS
Year Capital Reserves
and Surplus
Borrowings Gross Block Depreciation Net Block Turnover Depreciation Profit/ (Loss)
Before
Taxes
Taxes Profit/ (Loss)
After Taxes
Dividend
including
tax
PAT to
Sales
Earnings Per Share
(Basic)* (`)
Dividend Per
Share*(#)
Net Worth
Per Share*
(`)Ordinary
Share
'A'
Ordinary
Share
Ordinary
Share
'A'
Ordinary
Share
1989-90 10,444 37,870 48,883 91,488 43,070 48,418 196,910 4,891 14,829 4,575 10,254 3,126 5.2% 9.87 - 3.00 - 47
1990-91 10,387 47,921 48,323 100,894 48,219 52,675 259,599 5,426 23,455 9,250 14,205 4,154 5.5% 13.69 - 4.00 - 56
1991-92 11,765 61,863 105,168 123,100 54,609 68,491 317,965 6,475 20,884 7,800 13,084 4,389 4.1% 12.45 - 4.00 - 67@
1992-93 12,510 64,207 144,145 153,612 61,710 91,902 309,156 7,456 3,030 26 3,004 3,642 1.0% 2.47 - 3.00 - 63
1993-94 12,867 70,745 141,320 177,824 70,285 107,539 374,786 9,410 10,195 20 10,175 5,020 2.7% 7.91 - 4.00 - 65
1994-95 13,694 128,338 115,569 217,084 81,595 135,489 568,312 11,967 45,141 13,246 31,895 8,068 5.6% 23.29 - 6.00 - 104
1995-96 24,182 217,400 128,097 294,239 96,980 197,259 790,967 16,444 76,072 23,070 53,002 14,300 6.7% 21.92 - 6.00 - 100
1996-97 25,588 339,169 253,717 385,116 117,009 268,107 1,012,843 20,924 100,046 23,810 76,236 22,067 7.5% 30.40 - 8.00 - 143
1997-98 25,588 349,930 330,874 487,073 141,899 345,174 736,279 25,924 32,880 3,414 29,466 15,484 4.0% 11.51 - 5.50 - 147
1998-99 25,590 350,505 344,523 569,865 165,334 404,531 659,395 28,132 10,716 970 9,746 8,520 1.5% 3.81 - 3.00 - 147
1999-00 25,590 349,822 300,426 581,233 182,818 398,415 896,114 34,261 7,520 400 7,120 7,803 0.8% 2.78 - 2.50 - 147
2000-01 25,590 299,788 299,888 591,427 209,067 382,360 816,422 34,737 (50,034) - (50,034) - - (18.45) - - - 127
2001-02 31,982 214,524 230,772 591,006 243,172 347,834 891,806 35,468 (10,921) (5,548) (5,373) - - (1.98) - - - 77@
2002-03 31,983 227,733 145,831 608,114 271,307 336,807 1,085,874 36,213 51,037 21,026 30,011 14,430 2.8% 9.38 - 4.00 - 81
2003-04 35,683 323,677 125,977 627,149 302,369 324,780 1,555,242 38,260 129,234 48,200 81,034 31,825 5.2% 24.68 - 8.00 - 102@
2004-05 36,179 374,960 249,542 715,079 345,428 369,651 2,064,866 45,016 165,190 41,495 123,695 51,715 6.0% 34.38 - 12.50! - 114@
2005-06 38,287 515,420 293,684 892,274 440,151 452,123 2,429,052 52,094 205,338 52,450 152,888 56,778 6.3% 40.57 - 13.00 - 145@
2006-07 38,541 648,434 400,914 1,128,912 489,454 639,458 3,206,467 58,629 257,318 65,972 191,346 67,639 6.0% 49.76 - 15.00 - 178 @
2007-08 38,554 745,396 628,052 1,589,579 544,352 1,045,227 3,357,711 65,231 257,647 54,755 202,892 65,968 6.0% 52.64 - 15.00 - 203 @
2008-09 51,405 1,171,610 1,316,556 2,085,206 625,990 1,459,216 2,949,418 87,454 101,376 1,250 100,126 34,570 3.4% 22.70 23.20 6.00 6.50 238++
2009-10 57,060 1,439,487 1,659,454 2,364,896 721,292 1,643,604 4,021,755 103,387 282,954 58,946 224,008 99,194 5.6% 42.37 42.87 15.00 15.50 262^
2010-11 63,771 1,937,559 1,591,543 2,568,235 846,625 1,721,610 5,160,692 136,077 219,652 38,470 181,182 146,703 3.5% 30.28 30.78 20.00 20.50 315^^
2011-12 63,475 1,899,126 1,588,057 2,902,206 996,587 1,905,619 5,979,502 160,674 134,103 9,880 124,223 146,372 2.5% 3.90** 4.00** 4.00** 4.10** 62
2012-13 63,807 1,849,677 1,679,895 3,181,998 1,161,144 2,020,854 5,140,793 181,762 17,493 (12,688) 30,181 72,423 0.6% 0.93 1.03 2.00 2.10 60@
2013-14 64,378 1,853,287 1,505,280 3,514,652 1,355,088 2,159,564 4,159,103 207,030 (102,580) (136,032) 33,452 66,627## 0.8% 1.03 1.13 2.00 2.10 60@
2014-15 64,378 1,421,881 2,113,441 3,785,500 1,603,098 2,182,402 4,141,264 260,322 (397,472) 76,423 (473,895) (9,340)## - (14.72) (14.72) - - 46
2015-16 67,918 2,168,890 1,588,725 4,077,235 1,852,749 2,224,486 4,877,959 245,375 15,039 (8,384) 23,423 7,300 0.5% 0.68 0.78 0.20 0.30 66+++
2016-17 67,922 2,012,993 1,957,398 4,591,464 1,853,922 2,737,542 5,007,925 296,939 (242,077) 5,922 (247,999) - -5.0% (7.30) (7.30) - - 61^^^

64 CORPORATE OVERVIEW
Notes :
@ On increased capital base due to conversion of Bonds / Convertible Debentures / Warrants / FCCN into shares.
* To a face value of `10/- per share upto 2011-12.
# Includes Interim Dividend where applicable.
! Includes a special dividend of `2.50 per share for the Diamond Jubilee Year.
++ On increased capital base due to Rights issue and conversion of FCCN into shares.
^ On increased capital base due to GDS issue and conversion of FCCN into shares.
^^ On increased capital base due to QIP issue and conversion of FCCN into shares.
** Consequent to sub-division of shares, figures for previous years are not comparable.
## Includes reversal of dividend distribution tax of earlier year.
+++ On increased capital base due to Rights issue.
^^^ The figures of FY 2016-17 is as per Ind AS
CAPITAL ACCOUNTS (` in lakhs) REVENUE ACCOUNTS (` in lakhs) RATIOS
Year Capital Reserves
and Surplus
Borrowings Gross Block
(including
CWIP)
Accumulated
Depreciation
Net Block Turnover Depreciation Profit/ (Loss)
Before
Taxes
Taxes Profit/ (Loss)
After Taxes
Dividend
including tax
(including
group’s share
of Subsidiaries
dividend tax)
PAT to
Sales
Earnings Per Share
(Basic)* (`)
Dividend Per
Share*# (`)
Net Worth
Per Share*
(`)Ordinary
Share
‘A’
Ordinary
Share
Ordinary
Share
‘A’
Ordinary
Share
2001-02 31,982 183,617 282,031 634,984 252,475 382,509 932,220 39,222 (18,015) (6,740) (10,719) 45 -1.1% (3.95) - - - 66@
2002-03 31,983 190,018 178,965 648,959 284,038 364,921 1,144,801 40,190 54,350 22,640 29,712 14,497 2.6% 9.29 - 4.00 - 66
2003-04 35,683 329,884 169,842 728,468 323,749 404,719 1,634,104 42,556 144,487 53,077 91,529 32,099 5.6% 27.88 - 8.00 - 104@
2004-05 36,179 403,537 271,420 834,162 375,933 458,229 2,284,217 53,101 184,809 49,062 138,534 52,346 6.1% 38.50 - 12.50! - 121@
2005-06 38,287 574,860 337,914 1,027,949 484,356 543,593 2,750,725 62,331 234,898 64,000 172,809 58,439 6.3% 45.86 - 13.00 - 160@
2006-07 38,541 733,626 730,190 1,294,083 542,665 751,418 3,707,579 68,809 308,800 88,321 216,999 68,822 5.9% 56.43 - 15.00 - 200@
2007-08 38,554 831,198 1,158,487 1,892,393 606,049 1,286,344 4,060,827 78,207 308,629 85,154 216,770 67,674 5.3% 56.24 - 15.00 - 225@
2008-09 51,405 542,659 3,497,385 6,900,238 3,326,905 3,573,333 7,489,227 250,677 (212,925) 33,575 (250,525) 36,458 -3.3% (56.88) (56.88) 6.00 6.50 114++
2009-10 57,060 763,588 3,519,236 7,291,985 3,441,352 3,850,633 9,736,054 388,713 352,264 100,575 257,106 100,185 2.6% 48.64 49.14 15.00 15.50 144^
2010-11 63,771 1,853,376 3,281,055 8,291,975 3,969,870 4,322,105 12,684,370 465,551 1,043,717 121,638 927,362 148,130 7.3% 155.25 155.75 20.00 20.50 302^^
2011-12 63,475 3,206,375 4,714,896 10,572,497 4,951,247 5,621,250 17,133,935 562,538 1,353,387 (4,004) 1,351,650 148,862 7.9% 42.58** 42.68** 4.00** 4.10** 103
2012-13 63,807 3,699,923 53,71,571 121,58,556 5,172,265 6,986,291 19,451,406 760,128 1,364,733 377,666 989,261 75,614 5.1% 31.02 31.12 2.00 2.10 118@
2013-14 64,378 6,495,967 6,064,228 16,619,078 6,881,538 9,737,540 23,745,502 1,107,816 1,886,897 476,479 1,399,102 69,008## 5.9% 43.51 43.61 2.00 2.10 204@
2014-15 64,378 5,561,814 7,361,039 18,684,665 7,442,406 11,242,259 26,760,664 1,338,863 2,170,256 764,291 1,398,629 (3,319)## 5.2% 43.44 43.54 - - 175
2015-16 67,918 8,010,349 7,046,849 21,639,756 8,754,689 12,885,067 28,107,844 1,701,418 1,398,087 287,260 1,102,375 11,052 3.9% 32.61 32.71 0.20 0.30 238+++
2016-17 67,922 5,738,267 7,860,398 19,653,773 6,756,813 12,896,960 27,524,666 1,790,499 931,479 325,123 745,436 - 2.7% 21.94 22.04 - - 171
FINANCIAL STATISTICSCOMPANY (CONSOLIDATED)

(PURSUANT TO SECTION 101 OF THE COMPANIES ACT, 2013)
Dear Member,
NOTICE IS HEREBY GIVEN THAT THE SEVENTY SECOND ANNUAL GENERAL MEETING OF TATA MOTORS LIMITED will be held on Tuesday, August 22, 2017, at 3.00 p.m. at Birla Matushri Sabhagar, 19, Sir Vithaldas Thackersey Marg, Mumbai 400 020 to transact the following business:
ORDINARY BUSINESS1. To receive, consider and adopt
(a) the Audited Financial Statement of the Company for the Financial Year ended March 31, 2017 together with the Board’s Report and the Auditors’ Report thereon; and
(b) the Audited Consolidated Financial Statement of the Company for the Financial Year ended March 31, 2017 together with the Auditors’ Report thereon.
2. To appoint a Director in place of Dr Ralf Speth (DIN: 03318908), who retires by rotation and being eligible, offers himself for re-appointment.
3. Appointment of Auditors To consider and if thought fit, to pass, the following resolution as
an Ordinary Resolution:
“RESOLVED that pursuant to the provisions of Sections 139, 142, 143 and other applicable provisions, if any, of the Companies Act, 2013 (“the Act”) and the Companies (Audit and Auditors) Rules, 2014, as amended from time to time, B S R & Co. LLP, Chartered Accountants (Firm Registration No.101248W/W – 100022) be and is hereby appointed as Auditors of the Company to hold office from the conclusion of this Annual General Meeting (“AGM”) till the conclusion of Seventy-Seventh AGM of the Company to be held in the year 2022 (subject to ratification of their appointment at every AGM if so required under the Act), at such remuneration, as may be mutually agreed upon between the Board of Directors of the Company and the Auditors.”
SPECIAL BUSINESS4. Appointment of Mr Natarajan Chandrasekaran as a
Director To consider and if thought fit, to pass, the following resolution as
an Ordinary Resolution:
“RESOLVED that Mr Natarajan Chandrasekaran (DIN: 00121863), who was appointed by the Board of Directors as an Additional Director of the Company with effect from January 17, 2017 and who holds office upto the date of this Annual General Meeting of the Company under Section 161 of the Companies Act, 2013 (“the Act”) and Article 132 of the Articles of Association of the Company, but who is eligible for appointment and in respect of whom the Company has received a notice in writing from a Member under Section 160(1) of the Act read with the Companies (Appointment and Qualifications of Directors) Rules,
2014, proposing his candidature for the office of Director of the Company, be and is hereby appointed as a Director of the Company and is liable to retire by rotation.”
5. Appointment of Mr Om Prakash Bhatt as an Independent Director
To consider and if thought fit, to pass, the following resolution as an Ordinary Resolution:
“RESOLVED that Mr Om Prakash Bhatt (DIN: 00548091) who was appointed by the Board of Directors as an Additional Director of the Company with effect from May 9, 2017 and who holds office upto the date of this Annual General Meeting of the Company in terms of Section 161 of the Companies Act, 2013 (“the Act”) and Article 132 of Articles of Association of the Company but who is eligible for appointment and has consented to act as a Director of the Company and in respect of whom the Company has received a notice in writing from a Member under Section 160 of the Act proposing his candidature for the office of Director of the Company, be and is hereby appointed a Director of the Company.”
“RESOLVED FURTHER that pursuant to the provisions of Sections 149, 152 and other applicable provisions, if any, of the Act, and the Companies (Appointment and Qualifications of Directors) Rules, 2014, read with Schedule IV of the Act, as amended from time to time, the appointment of Mr Om Prakash Bhatt who has submitted a declaration that he meets the criteria for independence as provided in Section 149(6) of the Act and who is eligible for appointment as an Independent Director of the Company, not liable to retire by rotation, for a term of five years commencing with effect from May 9, 2017 to May 8, 2022, be and is hereby approved.”
6. Re-appointment of Mr Satish Borwankar as Executive Director and Chief Operating Officer and payment of remuneration
To consider and if thought fit, to pass, the following resolution as a Special Resolution:
“RESOLVED that pursuant to the provisions of Sections 196, 197, 203 and other applicable provisions, if any, read along with Schedule V of the Companies Act, 2013 (“the Act”), and the Companies (Appointment and Remuneration of Managerial Personnel) Rules, 2014, as amended from time to time, the Company do hereby accord their approval for the re-appointment and terms of remuneration of Mr Satish Borwankar (DIN: 01793948) as the Executive Director and Chief Operating Officer of the Company with effect from July 16, 2017 to July 15, 2019 upon the following terms and conditions, including the remuneration to be paid in the event of loss or inadequacy of profits in any financial year during his said tenure, with liberty to the Board of Directors [which term shall include the Nomination and Remuneration Committee (“NRC”)] to alter and vary the terms and conditions of the said re-appointment as it may deem fit.
NOTICE
Notice Board’s Report Management Discussion & Analysis Corporate Governance Report Business Responsibility Report
65

I. NATURE OF DUTIES: The Executive Director shall, devote his whole time and attention to the business and operations of the Company and carry out such duties as may be entrusted to him by the Managing Director and the Board from time to time and separately communicated to him and exercise such powers as may be assigned to him, subject to superintendence, control and directions of the Board in connection with and in the best interests of the business of the Company and the business of any one or more of its subsidiaries and/or associated companies, including performing duties as assigned by the Board from time to time by serving on the boards of such companies or any other executive body or any committee of such a company.
II. REMUNERATION: a. Basic Salary: `5,06,000/- per month, upto a maximum
of `8,00,000/- per month.
The annual increment which will be effective from 1st April each year, will be decided by the Board based on the recommendation of the NRC in consonance with the individual performance and the performance of the Company, within the aforementioned maximum Basic Salary limit. The said annual increment, would be limited upto an amount not exceeding 20% of the Basic Salary as may be decided by the Board in the above manner.
b. Benefits, Perquisites and Allowances:
Details of Benefits, Perquisites and Allowances are as follows:
i. Rent-free residential accommodation (furnished or otherwise) with the Company bearing the cost of repairs, maintenance, society charges and utilities (e.g. gas, electricity and water charges) for the said accommodation.
OR
House Rent and Maintenance Allowance (in case residential accommodation is not provided by the Company) of 85% of Basic Salary.
ii. Reimbursement of hospitalization and major medical expenses incurred as per rules of the Company (this includes mediclaim insurance premium).
iii. Car facility as per rules of the Company.
iv. Telecommunication facility as per rules of the Company, including broadband, internet and fax.
v. Other perquisites and allowance given below subject to a maximum of 55% of Basic Salary, which includes:
Medical allowance Leave Travel Concession/Allowance Other Allowances Personal Accident Insurance Premium Annual Club Membership fees
vi. Retirement benefits: Contribution to Provident Fund, Superannuation Fund or Annuity Fund and Gratuity Fund as per rules of the Company. Provision of Special Retirement Benefits viz. Pension and Medical Benefits upon his superannuation, only if he continues with the Company or any Tata Company till that time. The Special Retirement Benefits are discretionary and can be withdrawn by the Board in case of conviction by the judicial authorities for any offences and include clauses on non-compete after superannuation.
vii. Leave and encashment of unavailed leave as per rules of the Company.
c. Commission: Such remuneration by way of profit linked commission,
in addition to the salary, perquisites and allowances payable, calculated with reference to the net profits of the Company in a particular financial year, as may be determined by the Board of the Company at the end of each financial year, subject to the overall ceilings stipulated in Section 197 of the Act, but in any case will not exceed 400% of the Basic Salary.
d. Incentive Remuneration: In case where the net profits of the Company are
inadequate for payment of profit-linked commission in any financial year, an incentive remuneration may be paid upto an amount not exceeding 200% of Basic Salary paid at the discretion of the Board. This incentive remuneration would be payable subject to the achievement of certain performance criteria and such other parameters as may be considered appropriate from time to time by the Board.
An indicative list of factors that may be considered for determining the extent of commission/incentive remuneration, by the Board which will be payable annually after the Annual Accounts have been approved, are:
Company performance on certain defined qualitative and quantitative parameters as may be decided by the Board from time to time.
Industry benchmarks of remuneration. Performance of the individual.
III. MINIMUM REMUNERATION: Notwithstanding anything to the contrary herein contained,
wherein any financial year during the currency of the tenure of the Executive Director, the Company has no profits or its profits are inadequate, the Company will pay remuneration by way of Basic Salary, benefits, perquisites and allowances, incentive remuneration and retirement benefits as specified above.
IV. OTHER TERMS OF APPOINTMENT: i. The terms and conditions of the said re-appointment may be
altered and varied from time to time by the Board as it may,
Corporate Overview Financial StatementsStatutory Reports
66 72nd Annual Report 2016-17

in its discretion deem fit, irrespective of the limits stipulated under Schedule V of the Act or any amendments made hereafter in this regard, in such manner as may be agreed to between the Board and the Executive Director, subject to such approvals as may be required.
ii. The Executive Director shall not become interested or otherwise concerned, directly or through his spouse and/ or children, in any selling agency of the Company.
iii. This appointment may be terminated by either party by giving to the other party six months’ notice of such termination or the Company paying six months’ remuneration in lieu of the notice.
iv. The employment of the Executive Director may be terminated by the Company without notice or payment in lieu of notice:
if the Executive Director, is found guilty of any gross negligence, default or misconduct in connection with or affecting the business of the Company or any subsidiary or associate company to which he is required by the Agreement to render services; or
in the event of any serious repeated or continuing breach (after prior warning) or non-observance by the Executive Director, of any of the stipulations contained in the Agreement to be executed between the Company and the Executive Director; or
in the event the Board expresses its loss of confidence in the Executive Director.
v. In the event the Executive Director is not in a position to discharge his official duties due to any physical or mental incapacity, the Board shall be entitled to terminate his contract on such terms as the Board may consider appropriate in the circumstances.
vi. Upon the termination by whatever means of employment of the Executive Director:
the Executive Director shall immediately cease to hold office held by him in any subsidiaries or associate companies without claim for compensation for loss of office by virtue of Section 167(1)(h) of the Act and shall resign as trustee of any trust connected with the Company.
the Executive Director shall not without the consent of the Company at any time thereafter represent himself as connected with the Company or any of its subsidiaries or associate companies.
vii. All Personnel Policies of the Company and the related rules which are applicable to other employees of the Company shall also be applicable to the Executive Director, unless specifically provided otherwise.
viii. If and when the Agreement expires or is terminated for any reason whatsoever, the appointee will cease to be the Chief Operating Officer and Executive Director and also cease to
be a Director. If at any time, the appointee ceases to be a Director of the Company for any reason whatsoever, he shall cease to be the Chief Operating Officer and Executive Director and the Agreement shall forthwith terminate. If at any time, the appointee ceases to be in the employment of the Company for any reason whatsoever, he shall cease to be a Director, Chief Operating Officer and Executive Director of the Company.
ix The terms and conditions of re-appointment with the Executive Director also include clauses pertaining to adherence with the Tata Code of Conduct, no conflict of interest with the Company, protection and use of Intellectual Properties, non-solicitation post termination of agreement and maintenance of confidentiality.”
“RESOLVED FURTHER that the Board of Directors, be and is hereby authorized to take such steps as may be necessary for obtaining necessary approvals - statutory, contractual or otherwise, in relation to the above and to settle all matters arising out of and incidental thereto and to sign and execute deeds, applications, documents and writings that may be required, on behalf of the Company and generally to do all such other acts, deeds, matters and things as may be necessary, proper, expedient or incidental for giving effect to this Resolution.”
7. Payment of Remuneration to the Cost Auditor To consider and if thought fit, to pass the following resolution as
an Ordinary Resolution:
“RESOLVED that pursuant to the provisions of Section 148 and such other applicable provisions, if any, of the Companies Act, 2013 and the Companies (Audit and Auditors) Rules, 2014, as amended from time to time, the remuneration of `5,00,000/- (Rupees Five Lakhs), as recommended by the Audit Committee and approved by the Board of Directors payable to M/s Mani & Co., Cost Accountants (Firm Registration No. 000004) as Cost Auditors to conduct the audit of the relevant Cost records of the Company as prescribed under the Companies (Cost Records and Audit) Rules, 2014 as amended from time to time, for the financial year ending March 31, 2018 be and is hereby ratified and confirmed.”
“RESOLVED FURTHER that the Board of Directors of the Company be and is hereby authorised to do all acts, deeds and things and take all such steps as may be necessary, proper or expedient to give effect to this Resolution.”
8. Offer or invite for Subscription of Non-Convertible Debentures on private placement basis
To consider and, if thought fit, to pass the following resolution as a Special Resolution:
“RESOLVED that pursuant to the provisions of Sections 23, 42, 71 and such other applicable provisions, if any, of the Companies
Notice Board’s Report Management Discussion & Analysis Corporate Governance Report Business Responsibility Report
67

Act, 2013 (“the Act”) read together with the Companies (Prospectus and Allotment of Securities) Rules, 2014 and the Companies (Share Capital and Debentures) Rules, 2014, the Securities Exchange Board of India (“SEBI”) (Listing Obligations and Disclosure Requirements) Regulations, 2015, SEBI (Issue and Listing of Debt Securities) Regulations, 2008 and such other regulations prescribed by SEBI (“SEBI Regulations”), guidelines, notifications and circulars issued by the Reserve Bank of India, as may be amended from time to time, such other applicable laws, the Memorandum of Association and the Articles of Association of the Company, and subject to such approvals, consents and permissions as may be required by any authority or stock exchanges and subject to such conditions and/or modifications as may be prescribed or imposed by them while granting the same, which may be agreed to by the Board of Directors of the Company, subject to total borrowings of the Company not exceeding the borrowing powers approved by the Members from time to time under Section 180(1)(c) of the Act, consent of the members be and is hereby accorded to the Company to offer, invite for subscription, issue and allot from time to time, in one or more tranches and/or series, whether secured or unsecured, cumulative or non cumulative, listed or unlisted, redeemable Non-Convertible Debentures, including but not limited to bonds and/or other debt securities, denominated in Indian Rupees or any foreign currency (“NCDs”) on a private placement basis, such that the aggregate amount does not exceed `3,000 crores (Rupees Three Thousand Crores) or its equivalent.”
“RESOLVED FURTHER that the Board of Directors be and is hereby on behalf of the Company be authorized to determine the terms of issue including, time, the number of NCDs, tranches, issue price, tenor, interest rate, premium/ discount, class of investors, listing (in India or overseas) and for the purpose to delegate all or any other powers conferred herein to any committee, directors or executives of the Company and to do all such acts, deeds, matters and things, take all such steps as may be necessary and to sign and execute any deeds/ documents/ undertakings/ agreements/ papers/ writings for the purpose of giving effect to this Resolution and to resolve and settle all questions and difficulties that may arise from time to time.”
By Order of the Board of Directors H K SETHNAMumbai Company SecretaryJune 5, 2017 FCS No.: 3507
Registered Office:Bombay House, 24, Homi Mody Street, Mumbai 400 001Tel: +91 22 6665 8282; Fax: +91 22 6665 7799 Email: [email protected]; Website: www.tatamotors.com CIN - L28920MH1945PLC004520
NOTES:
1. The Explanatory Statement pursuant to Section 102 of the Companies Act, 2013 (“the Act”) in respect of the business under Item Nos. 3 to 8 set out above and details as required under SEBI (Listing Obligations and Disclosure Requirements) Regulations, 2015 (“SEBI Listing Regulations”) in respect of Directors seeking appointment and re-appointment at this Annual General Meeting (“AGM” “the meeting”) are annexed hereto.
2. A MEMBER ENTITLED TO ATTEND AND VOTE IS ENTITLED TO APPOINT A PROXY TO ATTEND AND VOTE INSTEAD OF HIMSELF AND THE PROXY NEED NOT BE A MEMBER. The instrument appointing Proxy as per the format included in the Annual Report should be returned to the Registered Office of the Company not less than FORTY-EIGHT HOURS before the time for holding the AGM. A Proxy Form is annexed to this notice. Proxies submitted on behalf of limited companies, societies, partnership firms, etc. must be supported by appropriate resolution/authority, as applicable, issued by the Member organization.
A person can act as a proxy on behalf of Members (not exceeding 50 Members) and holding in the aggregate not more than 10% of the total share capital of the Company carrying voting rights. A Member holding more than 10% of the total share capital of the Company carrying voting rights may appoint a single person as proxy and such person shall not act as a proxy for any other person or Member.
3. Corporate Members intending to send their authorised representatives to attend the AGM are requested to send to the Company, a certified copy of the Board Resolution authorising their representative to attend and vote on their behalf at the AGM.
4. Only registered Members (including the holders of ‘A’ Ordinary Shares) of the Company may attend and vote at the AGM. The holders of the American Depositary Receipts (the “ADRs”) of the Company shall not be entitled to attend the said AGM. However, the ADR holders are entitled to give instructions for exercise of voting rights at the said Meeting through the Depositary, to give or withhold such consent, to receive such notice or to otherwise take action to exercise their rights with respect to such underlying shares represented by each such ADR. A brief statement as to the manner in which such voting instructions may be given is being sent to the ADR holders by the Depositary.
5. In case of joint holders attending the AGM, only such joint holder who is senior by the order in which the names stands in the register of members will be entitled to vote.
6. Relevant documents referred to in the Notice and the accompanying statement are open for inspection by the Members at the Registered Office of the Company on all working days, except Saturdays, during business hours up to the date of the Meeting.
Corporate Overview Financial StatementsStatutory Reports
68 72nd Annual Report 2016-17

7. Members who hold shares in single name and physical form are advised to make nomination in respect of their shareholding in the Company.
8. Non-Resident Indian Members are requested to inform the Company’s Registrars and Transfer Agents, immediately of:
a) Change in their residential status on return to India for permanent settlement.
b) Particulars of their bank account maintained in India with complete name, branch, account type, account number and address of the bank with pin code number, if not furnished earlier.
9. Members holding shares in dematerialised mode are requested to intimate all changes pertaining to their bank details, NECS, mandates, nominations, power of attorney, change of address/name, PAN details, etc. to their Depository Participant only and not to the Company’s Registrars and Transfer Agents. Changes intimated to the Depository Participant will then be automatically reflected in the Company’s records which will help the Company and its Registrars and Transfer Agents to provide efficient and better service to the Members. In case of Members holding shares in physical form, such information is required to be provided to the Company’s Registrars and Transfer Agents.
10. Members attention is particularly drawn to the “Corporate Governance” section in respect of unclaimed and unpaid dividends and Shares pertaining thereto.
11. Members desiring any information as regards the Accounts are requested to write to the Company at an early date so as to enable the Management to keep the information ready at the Meeting.
12. As an austerity measure, copies of the Annual Report will not be distributed at the AGM. Members are requested to bring their attendance slip alongwith a copy of Annual Report to the Meeting.
13. To support the ‘Green Initiative’, the Members who have not registered their email addresses are requested to register the same with Company’s Registrars and Transfer Agents/Depositories. In other cases, an Abridged Annual Report is being sent to the members. The members who are desirous of receiving the full Annual Report may write to the Company’s Registrar for a copy of the same.
14. VOTING BY MEMBERS: A. In compliance with provisions of Section 108 the Act and the
rules framed thereunder and Regulation 44 of the SEBI Listing Regulations, the Company is pleased to provide Members the facility to exercise their right to vote on resolutions proposed to be considered at the AGM by electronic means either by (a) remote e-voting (by using an electronic voting system provided by NSDL as explained in the Remote e-voting at ‘para F’ herein below) or (b) Electronic Ballot at the AGM venue, (as provided
in Voting at AGM for electronic ballot voting at ‘para F(d)‘ herein below for) below. Resolution(s) passed by Members through e-voting is/are deemed to have been passed as if they have been passed at the AGM.
B. The voting rights of the Ordinary Shareholders shall be in the same proportion to the paid up Ordinary share capital and in case of voting rights on the ‘A’ Ordinary shares, the holder shall be entitled to one vote for every ten ‘A’ Ordinary shares held as on the cut-off date. A person, whose name is recorded in the Register of Members or in the Register of Beneficial Owners maintained by the depositories as on the cut-off date only shall be entitled to avail the facility of remote e-voting as well as voting through electronic ballot at the meeting.
C. In this regard, the member’s demat account/folio number as on August 15, 2017 i.e. cut-off date has been enrolled by the Company for participation in voting on resolutions placed by the Company on the voting system.
D. The members can opt for only one mode of voting, i.e., either by remote e-voting or electronic ballot at the meeting. The members attending the meeting who have not already cast their vote by remote e-voting shall be able to exercise their right at the meeting through electronic ballot. The Members who have cast their vote by remote e-voting are eligible to attend the meeting but shall not be entitled to cast their vote again.
E. The Board of Directors have appointed Mr P N Parikh of M/s Parikh & Associates, Practicing Company Secretaries (Membership No. FCS327) as the Scrutinizer to scrutinize the remote e-voting and electronic ballot process at the venue, in a fair and transparent manner.
F. INSTRUCTIONS FOR REMOTE E-VOTING: Any person, who acquires shares of the Company and becomes
a member of the Company after dispatch of the Notice and holding shares as of cut-off date, may obtain his/her login ID and password by sending a request at [email protected]. However, if you are already registered with NSDL for remote e-voting then you can use your existing user ID and password for casting your vote. If you have forgotten your “User details/password”, you can reset it by using “Forgot User Details/Password?” or “Physical User Reset Password?” option available on www.evoting.nsdl.com or contact NSDL at the following Toll Free No.: 1800-222-990 or email at: [email protected]
The period for remote e-voting starts on Saturday, August 19, 2017 (9.00 a.m.) and ends on Monday, August 21, 2017 (5.00 p.m). Remote e-voting shall be disabled by NSDL at 5:00 p.m. on August 21, 2017 and members shall not be allowed to vote through remote e-voting thereafter. Any person who is not a member as on the cut-off date i.e. August 15, 2017 should treat this Notice for information purposes only.
Notice Board’s Report Management Discussion & Analysis Corporate Governance Report Business Responsibility Report
69

a. In case the Member receives an e-mail from NSDL (for members whose email IDs are registered with the Company/ Depository Participants):
(i) Open e- mail and open PDF file viz; “TML e-voting.pdf” with your Client ID or Folio no. as password. The said pdf file contains your user ID and password/PIN for remote e-voting. Please note that the password is an initial password. If you are already registered with NSDL for remote e-voting then you can use your existing user ID and password.
(ii) Launch internet browser by typing the following URL: https://www.evoting.nsdl.com/
(iii) Click on “shareholders- Login”.
(iv) Enter your User ID and password as initial password noted in step (a) (i) above and Click “Login”.
(v) Password change menu appears. Change the password with new password of your choice with minimum 8 digits/characters or combination thereof. Note new password. It is strongly recommended not to share your password with any other person and take utmost care to keep your password confidential.
(vi) Home page of “e-voting” opens. Click on “e-voting: Active E-voting Cycles.”
(vii) Select “EVEN” (Electronic Voting Event Number) of Tata Motors Limited. Kindly note that there are separate EVEN for Ordinary Shares (ISIN - INE155A01022) and for “A” Ordinary Shares (ISIN - IN9155A01020). In case you are holding both classes of shares, please complete your voting for one EVEN and then cast your vote for another EVEN.
(viii) Now you are ready for e-Voting as “Cast Vote” page opens.
(ix) Cast your vote by selecting appropriate option and click on “Submit” and also click on “Confirm” when prompted.
(x) Upon confirmation, the message “Vote cast successfully” will be displayed.
(xi) Once you have voted on the resolution, you will not be allowed to modify your vote.
(xii) For the votes to be considered valid, the corporate and institutional shareholders (companies, trusts, societies, etc.) are required to send a scanned copy (PDF/JPG format) of the relevant Board Resolution/ Appropriate Authorization etc. together with attested specimen signature of the duly authorized signatory (ies), to the Scrutinizer through e-mail at [email protected] with a copy marked to [email protected].
b. If you are already registered with NSDL for e-voting then you can use your existing user ID and password for Login to cast your vote.
NOTE : Shareholders who forgot the User Details/ Password can use “Forgot User Details/Password?” or “Physical User
Reset Password?” option available on www.evoting.nsdl.com.
In case shareholders are holding shares in demat mode, USER-ID is the combination of DPID +Client ID.
In case shareholders are holding shares in physical mode, USER-ID is the combination of EVEN No + Folio No.
c. In case you have any queries, you may refer to the ‘Frequently Asked Questions’ (FAQs) for Shareholders and e-voting user manual for Shareholders available at the downloads section of NSDL’s E-Voting website: www.evoting.nsdl.com. You can also send your queries / grievances relating to e-voting at:-
Name and Designation: Mr Rajiv Ranjan, Asst. Manager Address: Trade World, A wing, 4th & 5th Floors, Kamala Mills Compound, Lower Parel, Mumbai - 400013 Email Id and Phone Number(s): [email protected]; 7506682280/ 022-24994738; Toll free no: 1800222990
d. VOTING AT AGM: The Chairman at the AGM, shall at the end of the discussion
on the resolution, on which voting is to be held, allow voting with the assistance of Scrutinizer, by the use of electronic ballot system for all the Members who are present at the AGM but have not cast their vote by availing the remote e-voting facility.
15. DECLARATION OF RESULTS ON THE RESOLUTIONS:
The scrutinizer shall, immediately after the conclusion of voting at the AGM, count the votes cast at the meeting, thereafter unblock the votes cast through remote e-voting in the presence of at least two witnesses not in the employment of the Company and make, not later than 48 hours from conclusion of the meeting, a consolidated Scrutinizer’s report of the total votes cast in favour or against the resolution, invalid votes, if any and whether the Resolution(s) has/have been carried or not, to the Chairman or a person authorized by him in writing who shall countersign the same.
The results declared along with the Scrutinizer’s Report shall be placed on the Company’s website www.tatamotors.com and on the website of NSDL immediately after the result is declared. The Company shall simultaneously forward the results to BSE Limited and National Stock Exchange of India Ltd., where the securities of the Company are listed. The results shall also be displayed on the notice board at the registered office of the Company
Subject to the receipt of requisite number of votes, the Resolutions shall be deemed to be passed on the date of Meeting i.e. August 22, 2017.
Corporate Overview Financial StatementsStatutory Reports
70 72nd Annual Report 2016-17

(PURSUANT TO SECTION 102 OF THE COMPANIES ACT, 2013)EXPLANATORY STATEMENT
The Explanatory Statement pursuant to Section 102 of the Companies Act, 2013 (“the Act”), given hereunder sets out all material facts relating to the special business mentioned at Item Nos. 4 to 8 of the accompanying Notice dated June 5, 2017. As additional information, the Explanatory Statement also contains material facts pertaining to ordinary business mentioned at Item No. 3 of the said Notice:
Item No.3
This explanatory statement is provided though statutorily not required as per Section 102 of the Act.
Deloitte Haskins & Sells, LLP, Chartered Accountants (ICAI Firm Registration No.117366W/W-100018) (“DHS”), had been the Auditors of the Company since FY2006-07 and at the Sixty Ninth Annual General Meeting (“AGM”) held on July 31, 2014 the Company appointed DHS as the Auditors of the Company to hold office from the conclusion of the Sixty Ninth AGM till the conclusion of the Seventy Second AGM of the Company to be held in the year 2017, subject to the ratification of their appointment at every AGM by the Members.
As per the provision of Section 139(2) of the Companies Act, 2013 (“the Act”) read with Rule 6 of the Companies (Audit and Auditors) Rules, 2014 (“Rules”), no listed company can appoint or re-appoint an audit firm as auditor for more than two terms of five consecutive years. Section 139 of the Act has also provided the Companies a period of three years from the date of commencement of the Act i.e. April 1, 2014 to comply with this requirement.
In view of the above, it is proposed to appoint B S R & Co. LLP, Chartered Accountants, (Firm Registration No.101248W/W- 100022) (“BSR”), as the Auditors of the Company for a period of five years commencing from the conclusion of the Seventy Second AGM till the conclusion of the Seventy Seventh AGM to be held in the year 2022, subject to ratification of their appointment at each AGM to be held after the Seventy Second AGM, if so required under the Act.
As per the requirement of the Act, BSR have confirmed that the appointment if made would be within the limits specified under Section 141(3)(g) of the Act and they are not disqualified to be appointed as Auditor in terms of the provisions of Section 139 and 141 of the Act and the Rules.
In view of the above and pursuant to the Rule 3 of the Companies (Audit and Auditors) Rules, 2014, BSR being eligible to act as Auditors of the Company and based on the recommendation of the Audit Committee at its Meeting held on April 18, 2017, the Board recommends the Resolution set forth at Item No. 3 for approval by the Members.
The Company has in place a Policy for pre-approval of services to be rendered by the Auditors across its subsidiaries by the Audit Committee to ensure that the Auditors function in an independent manner. Members’ attention is drawn to the details on fees paid to
the Auditors for services rendered by them in the Notes forming part of the Financial Statement.
None of the Directors, Key Managerial Personnel or their relatives are concerned or interested, financially or otherwise in the Resolution at Item No. 3 of the Notice.
Item No. 4
In accordance with the past practice of appointing the Tata Sons Limited Chairman as a Director and Chairman of the Company and based on the letter of Tata Sons Limited dated January 13, 2017, the Board of Directors (‘the Board’) has appointed Mr Natarajan Chandrasekaran as an Additional Director and Chairman of the Company on January 17, 2017. Pursuant to the provisions of Section 161 of the Act, and the rules framed thereunder and the Articles of Association of the Company, Mr Chandrasekaran would cease to hold office at the ensuing AGM but would be eligible for appointment as a Director. Notice under Section 160 of the Act has been received from a Member signifying his intention to propose Mr Chandrasekaran’s appointment as a Director.
Mr. Chandrasekaran (aged 54 years) holds a Bachelors’ Degree in Applied Science and Masters’ degree in Computer Applications from Regional Engineering College, Tamil Nadu. He joined Tata Consultancy Services (“TCS”) on January 27, 1987 and was Chief Executive Officer and Managing Director from 2009-17. He has over 30 years of experience in the software industry and business operations. Mr Chandrasekaran rose through the ranks at TCS to become CEO and Managing Director. Under his leadership, the TCS has maintained its industry leadership position and TCS generated total revenues of US$16.5 billion in 2015-16 and consolidated its position as the largest private sector employer in India and the country’s most valuable Company. TCS has also been placed among the “Big 4” most valuable IT services brands worldwide, ranked as one of the World’s Most Innovative Companies by Forbes and recognized as a Global Top Employer by the Top Employers Institute across 24 countries.
In addition to his professional career at Tata, Mr Chandrasekaran was also appointed as a Director on the Board of India’s Central Bank, the Reserve Bank of India in 2016. He has also served as the Chairperson of the Information and Communication Technology Industry Governors at the World Economic Forum, Davos in 2015-16.
Mr Chandrasekaran is recipient of several awards and recognition in business and academics communities. He was awarded as “Business leader of the year” at the ET awards for Corporate Excellence in the year 2016. In 2014-15, he was voted as one of CNBC TV 18 - ‘Indian Business Icons’, awarded CNN- IBN Indian of the Year 2014 in business category and the “Best CEO for 2014” by Business Today for the second consecutive year. He was also voted as Best CEO 2010-15 by Institutional Investor’s Annual All-Asia Executive Team rankings. He
Notice Board’s Report Management Discussion & Analysis Corporate Governance Report Business Responsibility Report
71

was conferred with the Honorary Doctorate by JNTU, Hyderabad, India (2014). He was also conferred with the Honorary Doctorate from Nyenrode Business University, Netherland’s top private business school in 2013. Mr. Chandrasekaran has also been conferred honorary degrees by many Indian universities such as the Gitam University, Vishakapatnam, Andhra Pradesh (2013), KIIT University, Bhubaneswar, Odisha (2012) and the SRM University, Chennai, Tamil Nadu (2010).
He joined the Board of Tata Sons Limited in October 2016 and was appointed Chairman in January 2017. Mr Chandrasekaran also chairs the Board of several group operating companies, including Tata Steel, Tata Power, Indian Hotels, and Tata Consultancy Services (TCS). Mr Chandrasekaran is an active member of India’s bilateral business forums including USA, UK, Australia and Japan. He also served as the Chairman of NASSCOM, the apex trade body for IT services firms in India in 2012-13. Brief Information of Mr Chandrasekaran is given in the Annexure attached to the Notice.
Mr Chandrasekaran is eligible to be appointed as a Director in terms of Section 164 of the Act. A declaration to this effect and his consent to act as Director has been received from Mr Chandrasekaran. Mr Chandrasekaran, once appointed, will be liable to retire by rotation and will be subject to Tata Group Policy on Retirement of Directors adopted by the Company. The Board considers it desirable that the Company should continue to avail of the services of Mr Chandrasekaran and accordingly commends the Resolution at Item No. 4 for approval by the Members.
Mr Chandrasekaran is not related to any other Director of the Company. Except for Mr Chandrasekaran no other Director, Key Managerial Personnel or their relatives are concerned or interested in Item No. 4 of the Notice.
Item No.5
The Board of Directors (“the Board”), based on recommendation of Nomination and Remuneration Committee (“NRC”), have appointed Mr Om Prakash Bhatt as an Additional Director as also an Independent Director of the Company on May 9, 2017.
Mr Bhatt has given his declaration to the Board that he meets the criteria of independence as provided under Section 149(6) of the Act and is eligible to be appointed as an Independent Director in terms of Section 164 of the Act. He has also given his consent to act as Director.
Mr Bhatt (aged 66 years) is a graduate in Science and a post graduate in English Literature. He has served as Chairman, State Bank Group, which includes State Bank of India (SBI), India’s largest commercial bank; five associate banks in India; five overseas banks; SBI Life, the country’s largest private life insurer; SBI Capital Markets, India’s leading investment bank; SBI Fund Management; and other subsidiaries spanning diverse activities, from general insurance to custodial services. Mr. Bhatt led SBI during challenging times. Under his leadership, SBI rose on the global list rankings of Fortune 500. He was also Chairman of Indian Banks’ Association, the apex body of Indian banks and has served as India’s economic diplomacy as government’s nominee on the India-US CEO Forum, Indo-French
CEO Forum and Indo-Russia CEO Forum, forging links with a cross section of the world’s business leaders. He was nominated Banker of the Year by Business Standard and Indian of the Year for Business in 2007 by CNN-IBN.
In the opinion of the Board, Mr Bhatt, fulfills the conditions specified in the Act and the Rules made thereunder for appointment as Independent Director and he is independent of the management.
The terms and conditions of appointment of Independent Director shall be open for inspection by the Members at the Registered Office of the Company on all working days, except Saturdays, during business hours upto the date of the Meeting.
The Board considers it desirable that the Company should continue to avail of the services of Mr Bhatt and accordingly commends the Resolution at Item No. 5 for approval by the Members.
Mr Bhatt is not related to any other Director of the Company. Except for Mr Bhatt not other Director, Key Managerial Personnel or their relatives are concerned or interested in Item No. 5 of the Notice.
Item No.6
The Members at the 71st Annual General Meeting held on Tuesday, August 9, 2016 had vide Special Resolution No. 8 approved the appointment of Mr Satish Borwankar, Executive Director (Quality) of the Company for a period commencing from July 1, 2016 to July 15, 2017, including the terms of remuneration payable to him.
Based on the recommendation of the NRC, the Board of Directors at its Meeting held on May 31, 2017 approved of the re-appointment of Mr Borwankar as Executive Director and designated him as Chief Operating Officer and extended his term of Executive Directorship for a period of two years i.e. from July 16, 2017 to July 15, 2019, subject to shareholders approval. In view of his past performance in his role as Executive Director (Quality) the Board of Directors have enhanced his role by designating him as the Executive Director and Chief Operating Officer and will now be accountable to ensure an end to end view on the entire operations of the Company, focusing on quality improvement, supply chain performance, cost reduction and management of new product launches. This would enable the Company to unleash its sales potential and successfully manage the turnaround plan which is so critical to the Company’s growth and sustainability. The proposed remuneration payable to Mr Borwankar during his extended tenure of 2 years is similar in all respects to the approval by the shareholders as mentioned above, except for the increase in salary scale from `7,00,000/- per month to `8,00,000/- per month to enable the Company to increase salary annually with an increment limited to 20% of the Basic Salary as per the approved terms.
Considering the various business cycles wherein the Company may have a situation of inadequate profits as calculated under the provisions of Section 198 of the Act in any financial year during a period of 2 years w.e.f. July 16, 2017, the approval for the payment of remuneration being sought would include the payment of minimum remuneration as per the terms stated in the Resolution No. 6 of the Notice.
Corporate Overview Financial StatementsStatutory Reports
72 72nd Annual Report 2016-17

Pursuant to the provisions of Section 197 of the Act, the remuneration payable to any one managing director or whole time director shall not exceed 5% of its profits as calculated under Section 198 of the Act and if there is more than one such director then the remuneration to them shall not exceed 10% of such profits. In case of loss or inadequacy of profits as per Section 198 of the Act, a company may pay remuneration within the limits prescribed under Schedule V of the Act based on its effective capital, subject to shareholders’ approval vide Special Resolution which would be valid for a period of 3 years. Further, any sums paid in excess of the statutory limits become refundable to the Company and is held in trust for the Company by the said director, unless the Company waives the recovery of the said amount by way of a Special Resolution passed by the members and such waiver is approved by the Central Government.
The Company recorded a net profit of `7,556.56 crores on a consolidated basis and recorded a loss of `2,479.99 crores on a standalone basis for the financial year ended March 31, 2017. Further, as per the provisions of Section 198 of the Act, the Company on a standalone basis, had a loss of `2,564.03 crores for the said financial year. Whilst the Company has taken several initiatives to turnaround and improve its performance in FY2017-18, it may be likely that the Company may have a scenario wherein there are inadequacy of profits under the said provisions of the Act in any of the financial years during the 2 years’ period from the date of his re-appointment. As a matter of abundant caution Members’ approval is being sought for payment of minimum remuneration as defined in the said Resolution. For details pertaining to the reasons for losses in its Standalone Financial statement for FY2016-17 and steps taken to improve the performance of the Company, please refer to Point Nos.
1 and 2 of Item III on ‘Other Information’ in the Statement containing Additional Information as required under Schedule V of the Act provided below.
Based on the Company’s Effective Capital of ` 14,253.13 crores as at March 31, 2017, the Company is permitted to pay, on an individual basis, the Executive Director a maximum remuneration of `5.20 crores for FY 2017-18 in case if the Company has inadequate profits in the financial year. The Executive Directors’ remuneration would be within the said limits in case of no/inadequacy of profits during their said tenure.
THE STATEMENT CONTAINING ADDITIONAL INFORMATION AS REQUIRED UNDER SCHEDULE V OF THE ACT
I. GENERAL INFORMATION 1. Nature of Industry:
The Company is mainly engaged in the business of manufacture, assembly and sale of automobile products consisting of all types of commercial and passenger vehicles, including spare parts.
2. Date or expected date of commencement of commercial production:
The Company was incorporated on September 1, 1945 and Commencement of Business Certificate was granted on November 20, 1945. The Company had since commenced its business.
3. In case of new companies, expected date of commencement of activities as per project approved by financial institutions appearing in the prospectus:
Not Applicable
4. Financial Performance based on given indicators:
(` in crores)
Particulars FY 2016-17 FY 2015-16 FY 2014-15 FY 2013-14 FY 2012-13
Consolidated Revenue from Operations (Gross) 274,492.12 277,660.59 266,707.90 236,820.78 193,559.01
Standalone Revenue from Operations (Gross) 49,100.41 47,383.61 39,531.23 37,764.64 49,319.66
Consolidated Profit for the period 7,556.56 11,678.19 13,986.29 13,991.02 9,892.61
Standalone Profit/(Loss) for the period (2,479.99) (62.30) (4,738.95) 334.52 301.81
Standalone Net Profit/(Loss) under Section 198 of the Act (2,564.03) (464.10) (3,981.54) (2,570.99) 449.31
Note: Previous year figures have been regrouped wherever necessary to correspond with the current year classification.Financial statement of the Company for the financial year 2016 & 2017 are prepared in accordance with IND AS 110 issued by the Institute of Chartered Accountants of India.
5. Foreign Investment or collaborations, if any:
The Company has not entered into any material foreign collaboration and no direct capital investment has been made in the Company. Foreign investors, mainly comprising FIIs and ADR holders, are investors in the Company on account of past issuances of securities and secondary market purchases.
II. INFORMATION ABOUT THE APPOINTEE - Mr Satish Borwankar, Executive Director and Chief Operating Officer:
1. Background details:
Aged 64, Mr Borwankar is a B.Tech (Hons). Mech, with wide experience in automobile industry, particularly in manufacturing and quality functions. Mr Borwankar has been the Executive
Notice Board’s Report Management Discussion & Analysis Corporate Governance Report Business Responsibility Report
73

Director of the Company since June 21, 2012 and prior to June 5, 2017 was responsible for the quality function of the Company for both commercial and passenger vehicles. Having started his career with the Company in 1974 as a Graduate Engineer Trainee, he has worked in various executive positions, for overseeing and
implementing product development, manufacturing operations and quality control initiatives of the commercial vehicle business unit of the Company. He has played a significant role in setting up Greenfield projects of the Company.
2. Past remuneration:
(` in Lakhs)FY 2012-13
($- 9 months)FY 2013-14 FY 2014-15 FY 2015-16 FY 2016-17
Basic Salary 33.13 45.12 49.20 52.68 57.00
Benefits, Perquisites and Allowances 47.02 @123.69* 71.36* 76.45* 82.27*
Commission/Incentive Remuneration 85.00 75.00 80.00 100.00 60.00
Retirement Benefits # 8.95 12.18 13.28 14.22 15.39
Total Remuneration 174.10 255.99 213.84 243.35 214.66
Less: Permissible Deductions under relevant Schedule XIII/Schedule V
N.A (6.41) (6.90) (7.32) (7.84)
Total Remuneration under relevant Schedule XIII/Schedule V
174.10 249.58 206.94 236.03 206.82
$ Appointed as Executive Director on June 21, 2012 and Remuneration paid is for the period upto March 31, 2013, approximately 9.5 months.@ Includes long term cash award pertaining to performance for FY2010-11 which on vesting was paid in FY2013-14 * Includes leave encashment# Excludes provision for special retirement benefits in view of his eligibility under the applicable guidelines, but is payable at the discretion of the Board for FY2012-13 - `497.32 lakhs; FY2013-14- `26.79 lakhs; FY2014-15 - credit of `47.90 lakhs, FY2015-16 – ` 41.54 lakhs and FY2016-17 - `79.32 lakhs.
It may be noted that in view of the financial performance of the Company on a standalone basis for the past few years, the Company had significantly reduced the variable portion of the remuneration, viz. incentive remuneration. The salary increments were decided based on industry benchmarks, the Company’s growth plans and with a view to retain talent. For further information, please refer to point No. 5 Pertaining to ‘Comparative Remuneration Profile’ of Item No. II on information about the appointee. The Company does not have an Employee Stock Option Scheme for any of its employees or directors.
3. Job profile and suitability:
In Mr Borwankar’s role as Executive Director and Chief Operating Officer w.e.f June 5, 2017, he will be accountable to ensure an end-to-end view on the entire operations of the Company, focusing on quality improvement, supply chain performance, meet the S&OP plan, cost reduction and management, timely launch of flawless new products. This would enable the Company to unleash its sales potential and successfully manage the turnaround plan which is so critical to the Company’s growth and sustainability.
He also shoulders responsibility for reviewing and overseeing the implementation of Safety, Health and Environment related practices of the Company and the Tata Business Excellence Model (TBEM) guidelines. As a Director, nominated on the Board of certain subsidiary companies, he provides valued direction and insight. Also “Sankalp” a sheet metal part suppliers’
quality improvement project has been mentored by him and has transformed the Company’s sheet metal suppliers’ quality standards. It is worthy to note that, the Company or these subsidiaries do not additionally compensate him, in any manner, for these additional activities undertaken by him, except in certain subsidiaries in his capacity as a Non-Executive Director. Mr Borwankar, an engineer from lIT Kanpur, with several years of multi-functional experience spanning across the Company’s value chain and has consistently delivered exceptional results throughout his career. Taking into consideration Mr Borwankar’s background the Board believes that he is an ideal candidate to help fructify the vision of achieving par-excellence in his new role as an Executive Director and Chief Operating Officer, as envisioned by the Company.
Achievements and Performance Highlights during last two years:
Initiated steps to achieve World Class Quality (WCQ). During FY 2016, Dharwad, Pantnagar, Lucknow & Jamshedpur plants achieved WCQ Level 2, whereas subsidiaries/division like Prolife & TMLDL achieved WCQ Level 1. During FY 2017 TMLDL Jsr, PVBU Pune and Dharward operations achieved WCQ Level 3 in Q4 FY 2017. Prolife Lucknow operations achieved WCQ Level 2 in in Q4 FY 2017. New Sustenance Assessment Concept rolled out for reinforcing the WCQ journey.
Corporate Overview Financial StatementsStatutory Reports
74 72nd Annual Report 2016-17

Introduced forward model quality and quality assessment processes for the first time in Tata Motors in 13-14, which has now matured. This approach has helped in launching defect free product launch like Bolt, Zest, Tiago, Hexa, Tigor in PVs and Ultra and Prima variants in CVs.
Reduction in rework and inspection activities as a part of ‘Cost of Quality’ initiatives resulting in reduction of around 2,000 temporary workforce – an 80% reduction in rework manpower and 33% reduction in inspection manpower. Under the Impact initiative of cost reduction through lower ‘Cost of Quality’, Quality teams have achieved a cost reduction of `56 crores through appraisal cost, internal and external failure cost reduction. In FY 2016, Dealer PDI time for rework & rectification has been significantly reduced from 2 days to same day delivery within few hours.
Perceived vehicle quality has taken a quantum leap of improvement after the introduction of CPA and Craftsmanship audits at all plants.
The 3 MIS warranty failure incidences have significantly reduced - by 37% in CVBU and 41% in PVBU over last financial year resulting in substantial reduction of warranty expenses. In May 2017 Dealer Conference, the Company’s products were appreciated for significant improvement in quality, reliability & durability including noteworthy reduction in warranty failures and expenses.
Introduced initiative of ‘Zero Aggregate failure’ within 50,000 kms. Substantial reduction in replacement of critical components, such as engines, axles, transmissions both in commercial and passenger vehicle businesses.
Gear shift quality improvements and gear shift effort reduction undertaken in M&HCV 6 speed gear box which are better than benchmarks.
Significant improvement in accuracy of bill of materials for bulk and non bulk parts particularly for BS-IV vehicles.
Concepts like ‘Do It First Time Right’ (“DIFTR”) and ‘No touch DRR’ rolled out in all vehicle assembly lines, with concrete parameters. Implementation of process Pokayokes (around 5,000 Pokayokes identified and more than 4,500 installed) to support the DIFTR initiative.
Introduced a new initiative to improve cabins for entire CV portfolio and PV portfolio. With all improvements in place, the shower testing has been discontinued in almost all models resulting in substantial cost savings.
Made substantial progress on the Supplier Quality improvement through ‘Project Sankalp’ and ‘Supplier Quality Improvement Initiative’ (“SQIT”) introduced in the previous year resulting in significant improvement of selected suppliers on safety, quality and cost front.
Ipsos Survey initiated for commercial vehicles to improve product reliability and durability.
IT enablement has strengthened various processes like FIFO dispatch system at RSOs and storage yards as also product quality through initiatives like Project Tantra & DDMS.
Proactive field, customer and dealer visits by plant teams are continuing with rigor to understand the opportunities for improvement to improve the customer satisfaction.
JDP IQS performance: TML PV products performance improved from 13th rank, (which was at the bottom of the chart till previous year) to move up to 8th rank in the 2015-16 IQS results. The TML performance improved by 37 PPH while the overall industry improved by 3 PPH in 2015, but in 2016 the IQS course have been deteriorated by 25 PPH over 2015 IQS course.
Nano stood second rank in the entry compact segment at 91 PPH, the best performance by Nano so far in the JDP IQS in 2015. In 2016 Nano ranked 3rd with 103 PPH.
Tata Motors Limited (India Operations) has been conferred the ‘Golden Peacock National Quality Award’ for the year 2016 for its significant improvement in product & process Quality.
Taking into consideration the qualifications, achievements and varied experience, the Board continues to bestow upon Mr Borwankar new role and responsibilities of Executive Director and Chief Operating Officer.
4. Remuneration proposed:
Details on remuneration have been stated in the Resolution at Item No. 6 of the Notice.
5. Comparative remuneration profile with respect to industry, size of the company, profile of the position and person (in case of expatriates the relevant details would be with respect to the country of his origin):
In view of the financial performance of the Company on a standalone basis for the past few years, the Company had significantly reduced the variable portion of the remuneration, viz. incentive remuneration. The salary increment to the Executive Director for FY2017-18 of 6.5% (previous year: 8%) was decided based on industry benchmarks, the Company’s performance and growth plans, his enhanced roles and responsibilities as Chief Operating Officer and with a view to retain talent. The metrics used by the NRC while deciding the salary increase of 6.5% for FY2017-18 were inter alia based on a survey conducted by Aon Hewitt, an independent consultant, depicting an average salary increase in India averaging around 9.5% and the Indian automotive manufacturing industry the salary increment was around 10.3%.
Remuneration paid/payable to Mr Borwankar, is commensurate with industry standards and Board level positions held in similar sized domestic companies, taking into consideration the responsibilities shouldered by him. The table below illustrates the requisite comparative data:
Notice Board’s Report Management Discussion & Analysis Corporate Governance Report Business Responsibility Report
75

(` in Lakhs)Percentile 10th 25th Median 75th 90th
289 372 410 553 681(Data Source: Aon Hewitt – COO Compensation Benchmarking Study, July 2017 with Revenues in excess of ` 10,000 crores in FY 2016-17. The value represented above refers to Cost to Company, which includes basic salary, all allowances, benefits valuations, performance bonuses / commissions and Long term incentives.)Note: A percentile is a measure used in statistics, indicating the value under which a given percentage of observations in a group of observations fall. For example, the 25th percentile is the value (or score) under which 25% of the observations may be found.
6. Pecuniary relationship directly or indirectly with the Company, or relationship with the managerial personnel, if any:
Besides the remuneration paid/payable to Mr Borwankar, there is no other pecuniary relationship with the Company or with the managerial personnel of the Company.
7. Recognition or Awards:
Some of the significant Awards and Recognitions received by the Company during the year are given below:
Plants:
Jamshedpur:
World Class Quality Level II.
Ranked 1st in the Industry category for environmental initiatives by Jharkhand State Pollution Control Board.
CII-GreenCo ‘Gold Rating’ Best Practices Award 2016 for its Innovative Project on water conservation.
Pune:
Excellent Energy Efficient Unit Award in the Automobile Manufacturing category at the 17th National Awards for Excellence in Energy Management organised by CII.
First runner - up in the Automotive Sector, Mega Large Business category at the Frost & Sullivan - India Manufacturing Excellence Awards 2016.
Lucknow:
The Srishti Good Green Governance Award 2016.
Social Return on Investment Award by KPMG.
Certification of GreenCo “Silver rating” during Green Co Summit 2016 by CII.
Apprentices’ Training Excellence Award by Govt. of UP.
III. OTHER INFORMATION 1. Reasons of loss or inadequate profits:
For Fiscal 2017 the Consolidated Revenue from operations and Profit After Tax was `2,74,492 crores and `6,064 crores respectively as against `2,77,661 crores and `11,101 crores respectively in the previous year. The Standalone Revenue from operations and Profit/Loss After Tax was `49,100 crores and (`2,480) crores respectively as against `47,384 crores and (`62) crores respectively for the previous year. The loss as calculated under Section 198 of the Act
for FY 2016-17 was `2,564 crores (previous year: loss of `464 crores).
The Indian economic in Fiscal 2017, on a macro – economic level stayed fairly robust and stable. Automotive Industry in India, grew in Fiscal 2017 by 8.3% over the previous year, as against the growth of 6.0% in the Company’s vehicles sales resulting in the Company’s market share decreasing to 12.8% in the Indian automotive industry from 13.1% in the previous year. The Company was more severely impacted in view of certain sectors performing more adversely, which impacted segments in which the Company had larger volumes and higher market shares. The volatile domestic demand for commercial vehicles throughout the year, was a result of Government and regulatory announcements - e.g. Goods and Service Tax (GST), Demonetization, emissions change from BS-III to BS-IV etc. Within the domestic market, the Company sold 324,175 commercial vehicles, a marginal fall of 0.8% from Fiscal 2016. The Company’s passenger vehicles sales were higher by 23.5% at 157,020 vehicles, registering a 5.2% market share. The Company sold 137,175 cars (higher by 28.4%) and 19,845 utility vehicles and vans, (lower by 2.2%).
Whilst the Company has significantly improved its income from operations of `49,100 crores in Fiscal 2017, which is 3.6% higher from `47,384 crores in the previous year, muted demand of M&HCV and LCV due to demonetization, weak replacement demand, subdued freight demand from industrial segment, and lower than expected pre-buying ahead of the implementation of BS-IV. This resulted in lower EBITDA margins of 3.5% as against 7.1% in the previous year.
2. Steps taken or proposed to be taken for improvement:
The Company has taken various initiatives, to maintain its leadership, improve market share and financial performance. It has been aggressively pursuing and implementing its strategies to improve volumes and reduce costs through improving operational efficiencies, timely launch of new products, refreshing products, building brand strengths, improving dealer effectiveness and restructuring customer facing functions thereby enhancing sales and service experience and improved working capital management. The Company has also expanded its new look, stylish, tech savvy, best-in-class flagship passenger vehicle showrooms, for superior customer experience.
Short term strategy: Based on the recommendation of the NRC, the Board at its recently held meetings held on May 23, 2017 and May 31, 2017 critically reviewed the performance for the financial year 2016-17 and have made major leadership and organisational changes as also set the tone for a turnaround plan with emphasis on the main business of the Company – the domestic commercial vehicle business, by bringing focus on sales and service, cost control, rigor in capital allocation with careful calibration and rebuilding the credibility with customers, dealers and investors.
Corporate Overview Financial StatementsStatutory Reports
76 72nd Annual Report 2016-17

Mr Borwankar is part of a core team (ExCom) and alongwith the MD & CEO is leading the Company in a major strategic and operational transformation for significant and sustained improvement in the overall business and financial performance. This transformation initiative under their leadership will comprehensively cover all areas of the Company’s operations - Company strategy, platform and product strategy, manufacturing, supply chain, employee and managerial productivity, cost reduction & efficiency improvements, improved effectiveness in sales & marketing and customer satisfaction / relationships and breakthrough improvements in achieving world class quality standards.
The Board proposes to review the agreed actions pertaining to the turnaround plan on a monthly basis with the management monitoring the same at various levels on a daily basis. These are expected to result in substantially improving the Company’s financial performance – both in terms of revenues and profitability as also, market share in various sub segments of the automotive industry. These steps are being seen by the management as only a beginning in a deeper and long term strategy for growth and a sustainable future.
Long term strategy: As has been reported in the previous year the Company has embarked upon a transformation journey which is expected to take another 1 or 2 years which will help the Company achieve significant growth, improve market share in all our segments, be amongst the top in India in terms of quality through cost efficient operations and a highly motivated and engaged team.
i. Enhancing the brand perception of Tata Motors- A comprehensive exercise is being initiated to develop the brand purpose and positioning of Tata Motors as a brand. This will be then executed seamlessly across the value chain to provide consistent and credible experience to the stakeholders aligned to the Company’s brand promise.
ii. Providing unique and delightful customer experience- Multiple initiatives right from pre-sales stage to after sales have been identified to deliver high customer satisfaction performance.
iii. Excellence in delivery of new products- The initiatives under this imperative focus on benchmarking with world class new product development processes in order to ensure consistency and adherence to the planned time, cost and quality.
iv. Delivering reliable and high quality products with focus on world-class quality processes- There are several projects initiated to deliver high quality products by improving internal process capabilities and supplier processes.
v. World-class manufacturing – This stream’s focus is to improve the productivity performance and delivery versus schedule. There are additional projects undertaken to reduce
manufacturing related costs and yield improvement. The Company believes that this initiative will enable it to support and strengthen the ‘Make in India Campaign’, for encouraging India to become a key center for global manufacturing.
vi. Agile and Cost-effective Supply Chain- This stream’s focus will be to improve the supply-chain processes like Material Requirement Planning, strengthen relationship with Strategic suppliers, rationalize the supplier base for agility, improve manufacturing and quality processes and information systems. Considering the size and scale of the Company’s operations and the vast supply chain relationships, this will again strengthen and support the Government’s aim under the ‘Make in India Campaign’.
vii. Cost competitiveness – There are more than 50 initiatives, addressing each and every cost element for cost competitiveness, with clear targets in cost areas like Direct Material, Marketing, Fixed Cost, Variable Conversion Cost, Product Development Costs, etc. These projects will help in significantly reducing the Company’s cost structure. It will be relevant to add that this cost reduction initiative will help not only the Company, but the entire value chain, including hundreds of vendors and other partners, providing further strength and support to the ‘Make in India Campaign’.
viii. People processes and organization structure- In this initiative, projects have been undertaken to drive high- performance culture, improve functional competencies, improve employee engagement, achieve benchmark levels of employee productivity and build a pipeline of talented workforce.
It will be worthwhile to note that under the above eight pillars, the Company has over a 100 individual initiatives on which various cross functional teams of high performers across the organization have been identified and deployed. To support the Company in the pursuit of above initiatives, the leadership team is also drawing upon and will be drawing upon Mr Borwankar’s vast experience and expertise in leading transformational programs.
3. Expected increase in productivity and profits in measurable terms:
With the various initiatives taken to improve performance, particularly on cost reduction and sales enhancement as under the Company is confident that with effective implementation of its turnaround strategy there would be substantial increase in productivity and profitability to turnaround the Company within the next 2 years:
Cost reduction: Focused approached on reduced direct material cost, renegotiating commodity price increases, major cost reduction drive review of fixed marketing expenses with the view to drop avoidable events, review of engineering expenses, improve spares revenue and
Notice Board’s Report Management Discussion & Analysis Corporate Governance Report Business Responsibility Report
77

other cost tightening measures, such as crowdsourcing, travel expenses, etc.
Sales enhancement: Improving market share particularly in all the sub segments of the commercial vehicle business, filling product gaps already identified, ensuring meeting the demand without any supply constraints, improving market intelligence with respect to competition, pricing and sales realization, better customer financing, offering customized solutions for various applications, product training to sales force and dealer network, timely product launches and interventions, strengthening the dealer network and viability, Incentivization of dealers, rigor on variable marketing expenses, bundling the value added services and increasing the revenues from spares and annual maintenance contracts.
With Mr Borwankar alongwith the Senior Leadership Team’s broad functional, general management skills and wide international experience, they would provide Tata Motors with profound knowledge in complex restructuring/turnaround programmes, provide inputs on robust world-class process know-how in operations and accelerate transformation to a high performance culture by onboarding employees and creating ownership in the organization. The Board is of the view, that this leadership creates international, multinational teams and fosters a culture of cross-functional teamwork, agility and accountability.
The NRC currently comprising of three independent directors [viz. Mr Nasser Munjee (as Chairman of the Committee), Dr Raghunath Mashelkar and Mr Om Prakash Bhatt] and Mr Natarajan Chandrasekaran, Non-Executive Chairman of the Board, reviews and recommends the changes in the remuneration on a yearly basis. This review is based on the Balance Score Card that includes the performances of the Company and the individual director on certain defined qualitative and quantitative parameters such as volumes, EBITDA, cash flows, cost reduction initiatives, safety, strategic initiatives and special projects as decided by the Board vis-à-vis targets set in the beginning of the year. This review also takes into consideration the benchmark study undertaken by reputed independent HR agencies on comparative industry remuneration and practices. The decisions taken at the NRC and the Board are within the broad framework of remuneration as approved by the Members.
The Company remains committed to pursue the long term interest of all stakeholders, including the Company’s Members and employees. It is necessary to balance this with recruiting and retaining industry proven management team through the long term. This involves ensuring that the Company’s leadership and talent base is appropriately remunerated, notwithstanding cyclical phases. This is particularly important
when the Company has ongoing significant turnaround and growth strategies under execution.
Taking into consideration the above and the terms of appointment (including payment of Minimum Remuneration) agreed with Mr Borwankar and based on the recommendation of the NRC, the Board of Directors have on May 31, 2017, accorded their approval to the said proposal of reappointment of Mr Borwankar and in the interest of the Company has recommended the aforesaid resolution set out at Item No. 6 in this Notice for the approval of the Members.
None of the Directors, Key Managerial Personnel of the Company and their relatives is in any way concerned or interested in the said Resolution, except for Mr Borwankar in the Resolution at Item No. 6 of the Notice.
Item No. 7
Pursuant to Section 148 of the Companies Act, 2013 (“the Act”) read along with the Companies (Audit and Auditors) Rules, 2014 as amended from time to time, the Company is required to have the audit of its cost records for specified products conducted by a Cost Accountant in Practice. Based on the recommendation of the Audit Committee, the Board had on May 23, 2017, approved the appointment and remuneration of M/s Mani & Co., the Cost Auditors (Firm Registration No. 000004) to conduct the audit of the Cost records maintained by the Company, pertaining to the relevant products prescribed under the Companies (Cost Records and Audit) Rules, 2014, for the Financial Year ending March 31, 2018 at a remuneration of `5,00,000/- (Rupees Five Lakhs).
It may be noted that the records of the activities under Cost Audit is no longer prescribed for “Motor Vehicles and certain parts and accessories thereof”. However, based on the recommendations of the Audit Committee, the Board has also approved the appointment of M/s Mani & Co. for submission of reports to the Company on cost records pertaining to these activities for a remuneration of `15,00,000/- (Rupees Fifteen Lakhs) for the said financial year.
In accordance with the provisions of Section 148 of the Act read along with Rule 14 of the Companies (Audit and Auditors) Rules, 2014, as amended from time to time, ratification for the remuneration payable to the Cost Auditors to audit the cost records of the Company for the said financial year by way of an Ordinary Resolution is being sought from the Members as set out at Item No. 7 of the Notice.
M/s Mani & Co. have furnished a certificate dated May 12, 2017 regarding their eligibility for appointment as Cost Auditors of the Company.
The Board commends the Ordinary Resolution set out at Item No. 7 of the Notice for approval by the Members.
None of the Directors, Key Managerial Personnel or their relatives are, in any way, concerned or interested, financially or otherwise, in the resolution set out at Item No. 7 of the Notice.
Item No. 8
The Non-Convertible Debentures (“NCDs”) issued on private
Corporate Overview Financial StatementsStatutory Reports
78 72nd Annual Report 2016-17

placement basis is one of the cost effective sources of long term borrowings raised by the Company. The Company had obtained the approval of the Members vide Postal Ballot on June 27, 2014 to borrow from time to time any sum(s) of monies which, together with monies already borrowed by the Company (apart from temporary loans obtained or to be obtained from the Company’s Bankers in the ordinary course of business) upto an amount not exceeding `30,000 crores. The borrowings of the Company (on stand-alone basis excluding Joint operations) as at March 31, 2017 aggregate approximately `18,578 crores, of which outstanding NCDs aggregate to ` 7,050 crores. The Company’s Net Debt-Equity ratio (on stand-alone basis excluding Joint operations) as at March 31, 2017 is 0.78:1 and the Company believes that the aggregate borrowings would be well within acceptable levels.
Further, the Company had obtained Members’ approval for borrowing up to `3,000 crores by way of NCDs at the Annual General Meeting (“AGM”) held on August 09, 2016, which is valid for a period of one year from date of the said approval. The Company has borrowed `1,300 crores by way of unsecured NCDs up to May 2017, in accordance with the aforesaid Members’ approval.
As per provisions of Sections 23, 42, 71 of the Act read with rule 14 of the Companies (Prospectus and Allotment of Securities) Rules, 2014, a company making a private placement of its securities is required to obtain the approval of the Members by way of a Special Resolution for each offer or invitation before making such offer. However, in case of offer for NCDs, it shall be sufficient if the Company passes a previous Special Resolution only once in a year for all the offers or invitation for such debentures during the year.
In continuation of its efforts to strengthen its capital structure, the Company intends to augment the resources through a mix of internal accruals and long term borrowings to insure that they are aligned in terms of quamtum, risk, maturity and cost with its earning profile. Accordingly, it is proposed to issue NCDs and / or Rupee Denominated Non-Convertible Foreign Currency Bonds on a private placement basis aggregating upto `3,000 crores, in one or more series/tranches during the 12-month period from the date of this AGM, with an intention to finance, inter-alia the repayment of certain NCDs / term loans from Banks, to fund part of the ongoing capital expenditure during the next 12 months and for general corporate purposes. The Company intends to raise NCDs for tenors ranging between 2 to 10 years and expects the borrowing cost of NCDs to be lower than 1 year MCLR rate of State Bank of India (prevailing at 8% p.a. as on June 1, 2017) plus a spread of 100 bps, considering the current credit rating of the Company of AA by ICRA and AA+ by CARE.
It is therefore proposed to pass an enabling Resolution authorizing the Board of Directors to make specific issuances based on the Company’s requirements, market liquidity and appetite at the opportune time.
The above proposal as set out in Item No. 8 of the Notice is in the interest of the Company and your Directors commend the same for approval by the Members.
None of the Directors, Key Managerial Personnel or their relatives are in any way concerned or interested, financially or otherwise in the resolution set out at Item No. 8 of the Notice.
By Order of the Board of Directors H K SETHNAMumbai Company SecretaryJune 5, 2017 FCS No.: 3507
Registered Office:Bombay House, 24, Homi Mody Street, Mumbai 400 001Tel: +91 22 6665 8282; Fax: +91 22 6665 7799 Email: [email protected]; Website: www.tatamotors.com CIN - L28920MH1945PLC004520
Notice Board’s Report Management Discussion & Analysis Corporate Governance Report Business Responsibility Report
79

For other details, such as number of meetings of the Board attended during the year, remuneration drawn and relationship with other directors and key managerial personnel in respect of the above directors please refer to the Board’s Report and the Corporate Governance Report.
Particulars Dr Ralf Speth Mr Natarajan Chandrasekaran Mr Om Prakash Bhatt Mr Satish Borwankar
Director Identification Number
03318908 00121863 00548091 01793948
Date of Birth (Age) September 9, 1955 (61 years) June 2, 1963 (54 years) March 7, 1951 (66 years) July 15, 1952 (64 years)
Date of Appointment November 10, 2010 January 17, 2017 May 9, 2017 June 21, 2012
Qualifications Doctorate of Engineering in Mechanical Engineering and Business Administration
Bachelor’s Degree in Applied Science, Master’s Degree in Computer Application
Graduate degree in Science, Post Graduate degree in English Literature (Gold Medal)
B.E (Mech) – IIT, Kanpur
Expertise in specificfunctional areas
Wide experience in areas of production, quality and product planning.
Wide experience across various industries.
Wide experience in Banking and Financial Markets
Wide experience in Automobile Industry, manufacturing and quality functions
Directorships held in other companies
Tata Sons LimitedJaguar Land Rover Automotive Plc, UKJaguar Land Rover Limited, UKJaguar Land Rover Holding Limited, UKSpark44 (JV) Limited, UKACEA- Brussels, BelgiumBladon Jets, UKConfederation of British Industry, UKThe Society of Motor Manufacturers & Traders Limited, UKJaguar Racing Limited, UK
(As Chairman unless otherwise stated)Tata Consultancy Services Limited Tata Sons Limited Tata Steel LimitedThe Indian Hotels Company LimitedThe Tata Power Company LimitedTCS FoundationJaguar Land Rover Automotive PLC, UKReserve Bank of India - Director
Hindustan Unilever LimitedTata Steel LimitedTata Consultancy Services LimitedStandard Chartered PLC, UKGreenko Energy Holdings Limited, Mauritius
TML Drivelines Limited - ChairmanTata Daewoo Commercial Vehicle Company LimitedTAL Manufacturing Solutions LimitedTata Cummins Private LimitedTata Motors (Thailand) Limited - Chairman
Memberships/ Chairmanships of statutory committees across companies
Nil Nomination and Remuneration CommitteeTata Sons LimitedTata Consultancy Services LimitedTata Steel LimitedTata Motors LimitedThe Indian Hotels Company LimitedThe Tata Power Company Limited
Corporate Social Responsibility CommitteeTata Consultancy Services Limited – Chairman
Risk Management CommitteeTata Consultancy Services Limited
Audit CommitteeHindustan Unilever LimitedTata Steel Limited- ChairmanTata Consultancy Services Limited
Stakeholders’ Relationship CommitteeHindustan Unilever Limited - ChairmanTata Consultancy Services Limited
Nomination and Remuneration CommitteeHindustan Unilever LimitedTata Motors LimitedTata Steel Limited
Corporate Social Responsibility CommitteeHindustan Unilever Limited-ChairmanTata Consultancy Services LimitedTata Steel Limited
Risk Management CommitteeTata Consultancy Services LimitedStandard Chartered PLCTata Steel Limited-Chairman
Audit CommitteeTAL Manufacturing Solutions LimitedCorporate Social Responsibility CommitteeTata Cummins Private LimitedTata Motors Limited
Nomination and Remuneration CommitteeTML Drivelines Limited
No. of shares held in the Company
Nil Nil Nil 500 Ordinary shares
Details of Director seeking appointment and re-appointment at the Annual General MeetingPursuant to SEBI Listing Regulations and Secretarial Standards – 2 on General Meetings
Corporate Overview Financial StatementsStatutory Reports
80 72nd Annual Report 2016-17

Notice Board’s Report Management Discussion & Analysis Corporate Governance Report Business Responsibility Report
81
TO THE MEMBERS OF TATA MOTORS LIMITED
The Directors present their Seventy Second Annual Report along with the Audited Statement of Accounts for Fiscal 2017.
Pursuant to the notification issued by the Ministry of Corporate Affairs on February 16, 2015 and under the Companies (Indian Accounting Standards) Rules, 2015 and other accounting principles generally accepted in India, the Company has adopted Indian Accounting Standards on April 1, 2016, with the transition date as April 1, 2015. Fiscal 2016 Financial Statements have been prepared in accordance with the recognised and measurement principles stated therein.
FINANCIAL PERFORMANCE SUMMARY
BOARD’S REPORT
(` in crores)
Tata Motors
(Standalone)*
Tata Motors Group
(Consolidated)
Fiscal 2017 Fiscal 2016 Fiscal 2017 Fiscal 2016
FINANCIAL RESULTS Income from operations 49,100.41 47,383.61 2,74,492.12 2,77,660.59Total expenditure 47,399.74 44,018.78 2,37,579.76 2,35,884.31Operating profit 1,700.67 3,364.83 36,912.36 41,776.28Other Income 978.84 1,402.31 754.54 885.35Profit before interest, depreciation, amortization, exceptional item and tax 2,679.51 4,767.14 37,666.90 42,661.63Finance costs 1,590.15 1,592.00 4,238.01 4,889.08Cash profit 1,089.36 3,175.14 33,428.89 37,772.55Depreciation, amortization and product development/ engineering expenses 3,423.87 2,747.49 21,318.56 20,179.55Foreign exchange (gain)/loss (net) (252.45) 222.91 3,910.10 1,616.88Profit/(loss) for the year before exceptional items and tax (2,082.06) 204.74 8,200.23 15,976.12Exceptional Items - loss (net) 338.71 271.84 (1,114.56) 1,850.35Profit/(loss) before tax (2,420.77) (67.10) 9,314.79 14,125.77Tax expenses/(credit) (net) 59.22 (4.80) 3,251.23 3,025.05Profit/(loss) after tax (2,479.99) (62.30) 6,063.56 11,100.72Share of profit of joint ventures and associates (net) - - 1,493.00 577.47Profit/(loss) for the year (2,479.99) (62.30) 7,556.56 11,678.19Other comprehensive income/(loss) 95.48 85.47 (27,494.57) 3,157.46Total Other comprehensive income/(loss) for the year (2,384.51) 23.17 (19,938.01) 14,835.65Attributable to:(a) Shareholders of the Company (20,005.94) 14,724.64(b) Non-controlling interest 67.93 111.01
DIVIDEND Considering the continued weak operating environment in the standalone business and in view of the losses for the year, no dividend is permitted to be paid to the Members for Fiscal 2017, as per the Companies Act, 2013 (“the Act”) and the Rules framed thereunder.
TRANSFER TO RESERVESIn Fiscal 2016, an additional amount has been transferred from retained earnings to Debenture Redemption Reserve (DRR) on outstanding Non-Convertible Debentures (NCDs) and Senior Notes (including interest accrued where applicable) of `43.79 crores. Due to losses in Fiscal 2017, resulting in debit balance in retained earnings no amount has been transferred to DRR on the NCDs allotted in Fiscal 2017.
OPERATING RESULTS AND PROFITS Fiscal 2017 has been marked by couple of ‘Black Swan’ events (like Brexit -UK decision to exit EU and Demonetization in India) having a large impact on the future course of developments. This year was marked by the way for the long awaited and transformational Goods and Service Tax (GST).
Growth of World GDP has been 3.1% in Fiscal 2016. A recovery in commodity prices has provided some relief to commodity exporters and helped in reducing the deflationary pressures. The Orgainisation of the Petroleum Exporting Countries (OPEC) ability to increase price by cutting down production has been curtailed by rising Shale gas output in US. Moreover, structural problems such as low productivity growth and high-income inequality persisted and are
* These include the Company’s proportionate share of income and expenditure in its two Joint Operations, namely Tata Cummins Pvt Ltd and Fiat India Automobiles Pvt Ltd.

Corporate Overview Financial StatementsStatutory Reports
82 72nd Annual Report 2016-17
likely to be continued. Activity rebounded strongly in the United States in second half of calendar 2016 compared to weaker first half. However, output remained below potential in a number of other advanced economies, notable in the European area. The picture of emerging market and developing economies remained much more diverse. The growth rate in China was a bit stronger than expected, supported by continued policy stimulus. Activity was weaker than expected in some Latin American countries such as Brazil, whereas, activity in Russia was slightly better than expected, in part reflecting firmer oil prices.
India’s economy has grown at a strong pace in recent years owing to the implementation of critical structural reforms and lower external vulnerabilities. It has grown by 7.1% in Fiscal 2017, compared to 7.9% in Fiscal 2016 primarily because of the temporary consumption shock induced by cash shortages and payment disruptions from demonetisation. Private investment continues to remain weak due to over capacity. In order to propel the economy the government has been trying to give a thrust to the investment by allocating a higher sum towards gross fixed capital formation.
The Tata Motors Group registered a de-growth of 1.1% in income from operations to `2,74,492 crores in Fiscal 2017 as compared to `2,77,661 crores in Fiscal 2016, due to negative translation impact from Great British Pound (GB£) to Indian Rupee (`) of `27,686 crores and de-growth in the M&HCV segment in India was offset by higher wholesale volumes in Jaguar and Land Rover and growth in Passenger Vehicle segment in India. The consolidated EBITDA margins for Fiscal 2017 stood at 13.4%. Consequently, Profit Before Tax (PBT ) and Profit After Tax (PAT) [post share of profit of joint ventures and associates (net)] were `9,315 crores and `7,557 crores, respectively.
Tata Motors Limited recorded income from operations (including joint operations) of `49,100 crores, 3.6% higher from `47,384 crores in the previous year. Muted demand of M&HCV and LCV due to weak replacement demand, subdued freight demand from industrial segment, which took a further hit post demonetization and lower than expected pre-buying ahead of the implementation of BS-IV, resulting in lower EBITDA margins of 3.5% in Fiscal 2017 as against 7.1% in Fiscal 2016. Loss Before and After Tax (including joint operations) for Fiscal 2017 were at `2,421 crores and `2,480 crores, respectively, as compared to Loss Before and After Tax (including joint operations) of 67 crores and 62 crores, respectively in Fiscal 2016. The losses were primarily driven by less favourable market and model mix, including higher marketing expenses, depreciation and amortization and other operating cost.
Jaguar Land Rover (JLR) (as per IFRS) recorded revenues of GB£24.3 billion compared to GB£22.3 billion in Fiscal 2016, driven by higher sales volumes and weaker GB£.
Consolidated EBITDA for Fiscal 2017 at GB£3.0 billion, was marginally lower as compared to EBITDA of GB£3.1 billion for Fiscal 2016, as the higher revenue was more than offset by higher marketing,
manufacturing and other operating expenses. EBIT was GB£1.5 billion in Fiscal 2017 lower than GB£1.8 billion in Fiscal 2016, due to higher depreciation and amortization which were partially offset by higher profits from the Chinese joint venture.
PBT in Fiscal 2017 was GB£1.6 billion in-line with the PBT of GB£1.6 billion in Fiscal 2016, the lower EBIT and unfavourable foreign exchange revaluation was more than offset by a favourable revaluation of commodity hedges and of GB£151 million further recoveries relating too to Tianjin fire in this year compared to GB£157 million net charge than in Fiscal 2016.
In May 2016, JLR redeemed the remaining US$84 million (GB£57 million equivalent) of the 8.125% US$ bond maturing in 2021 by exercising its call option, the majority of which was successfully tendered and redeemed in March 2015. In January 2017, JLR issued a €650 million 7-year bond with a coupon of 2.20% and a GB£300 million 4-year bond with a coupon of 2.75%. In addition, JLR successfully undertook a consent solicitation in March 2017 to align the terms of three of their older bonds to the terms of the Euro and GB£ bonds issued in January 2017.
Tata Motors Finance Limited (TMFL) (consolidated) (as per Indian GAAP) the Company’s captive financing subsidiary, reported revenue of `2,721 crores (Fiscal 2016 `3,229 crores) and reported a Loss After Tax `1,182 crores in Fiscal 2017, as compared to PAT `267 crores in Fiscal 2016.
Tata Daewoo Commercial Vehicle Company Limited South Korea (TDCV), (as per Korean GAAP) registered revenues of KRW 1,032 billion in Fiscal 2017, a growth of 17.3% over Fiscal 2016 mainly due to increase in domestic sales. The PAT was KRW 50 billion compared to KRW 46 billion in Fiscal 2016. Higher domestic volume, better mix, favourable exchange realizations and material cost reduction helped in improving profits.
VEHICLE SALES AND MARKET SHARES The Tata Motors Group sales for this year stood at 11,57,808 vehicles, up by 8.8% as compared to Fiscal 2016. Globally the Company sold 3,96,097 Commercial Vehicles and Passenger Vehicles were 7,61,711.
TATA MOTORS
Tata Motors recorded sales of 545,416 vehicles, a growth of 6.5% over Fiscal 2016. In Fiscal 2016 Industry in India, grew by 8.3%, resulting in the Company’s market share decreasing to 12.8% in Fiscal 2017 in the Indian Automotive Industry from 13.1% in the Fiscal 2016. The Company’s exports on standalone basis grew by 10.6% to 64,221 vehicles in Fiscal 2017 as compared to 58,058 vehicles in Fiscal 2016.
Commercial Vehicles
The domestic demand for Commercial Vehicles was volatile through the year, as a result of Government and Regulatory announcements -

Notice Board’s Report Management Discussion & Analysis Corporate Governance Report Business Responsibility Report
83
e.g. Goods and Service Tax (GST), demonetization, emissions change from BS-III to BS-IV etc. Within the domestic market, the Company sold 3,24,175 Commercial Vehicles, a marginal fall of 0.8% from Fiscal 2016. While the overall growth of Commercial Vehicles for the Company has been muted, some specific segments like M&HCV tipper (Construck), Buses and Pickup have seen strong growth during Fiscal 2017.
Some of the highlights for the year were:
Unveiled its very first Brand Ambassador – Akshay Kumar in December 2016. He will be the face of the entire CVBU range going forward.
The Xenon Yodha Pickup was launched in January 2017. A reliable new Pickup with high levels of performance and lower operating costs, it has been very well received and is gaining acceptance from customers.
Launched a range of state of the art buses running on alternate fuels including Electric, Hybrid and LNG. An order for 25 hybrid buses to the Mumbai Metropolitan Region Development Authority is in the process of being fulfilled.
The Magic Mantra SCV Passenger Vehicle with superior performance was launched to augment the existing Magic and Iris models in the last mile connectivity segment.
The Magna Bus Coach was introduced as the next-generation coach for inter-city people movement. Feedback on the product has been encouraging.
In the M&HCV segment several new products were launched – Ultra 1518 truck, LPK 1615 tipper, LPT 3718 Pusher Lift Axle rigid truck and a further extension of the SIGNA range of Tractors. Offered in various configurations, the SIGNA range of Commercial Vehicles is engineered and built to offer M&HCV buyers a newly designed cabin with proven Tata Motors aggregates for a world-class trucking experience.
Launched a refreshed version of the Tata Loyalty Program with a unique cover of `10 lakhs accidental insurance for five years for the driver – a first of its kind in the industry, plus a host of benefits to enable customers to accumulate points for every spend along with many more attractive options for redeeming points accrued.
This year, the Company won four prestigious awards at the Apollo CV Awards:
Tata Armoured Personnel Carrier - winners of the Special CV Application of the Year award.
MCV tipper of the Year award was won by Tata Prima 2528.K
Tata DLT double-deck tractor (trailer) carrier won the CV application builder of the Year award
Tata Signa 4923.S tractor won the HCV tractor cargo carrier of the Year award.
Dealership of the Year Award- Cargo Motors Pvt. Ltd.
Dipper Campaign-Use Dipper At Night – an innovative campaign to bring awareness amongst the truck driver community for safe practices has been extremely well received and acknowledged through various awards such as the CANNES 2016 - 2 awards – a first for the TATA Group, SPIKES ASIA 2016 awards, and the EFFIES 2016 award.
Organized the Prima Truck Racing Championship Season 4, which drew in over 30,000 spectators. The highlights this year were the inclusion of FIA’s European Truck Racing Championship (ETRC) drivers in addition to the current crop of racers from the British Truck Racing Association (BTRA), the first female truck driver and an expansion of the Indian Truck Driver Racing Training Program called the “T1 Racer Program”. The T1 Racer Program (TRP) is a program started in 2016 to identify regular Indian truck drivers and train them to become racers. This is the second year of the program. This year also saw the unveiling of a 1,000 bhp truck, which will feature as the racing platform for future editions.
In order to promote various applications on the Company’s products, a series of campaigns have been organized across the country:
Har Business ka ACE- Fully Built expo- Pan India 34 expos covering 14,437 customers conducted to showcase the versatility of the Tata SCV platform and leverage the many applications for use by the customers. It has been well received as customers look towards buying ready to use solutions from the Company for enhancing their business.
Construck Mahotsav - covered 13 important locations in East India with participation from more than 5,500 customers. This exclusive event to showcased the entire range of construction and mining vehicles to leverage the growing demand for such vehicles.
Truck World in 2016-17 - Organized Truck World Exhibition with a full range of over 35 different models displayed and visited by more than 13,000 customers across some of the key trucking centers in the country such as Chandigarh, Hyderabad, Guntur, Kanpur and Delhi.
Tata 407- 30 Year Celebration - More than 35,000 customers participated in this campaign over two months. The iconic Tata 407 celebrated 30 years and it continues to be the best selling product in the category of LCV trucks. Customers across the country were felicitated for their support in making this one of the most successful brands in the Commercial Vehicle Industry.
HAMARE BUS KI BAT HAI - This unique programme reached out to the support staff of school buses across India, helping them improve their efficiency at work.

Corporate Overview Financial StatementsStatutory Reports
84 72nd Annual Report 2016-17
Since it’s inception, the programme has reached out to 2,313 schools in 299 cities/towns covering over 96,586 school bus staff.
Passenger Vehicles
The domestic Passenger Vehicle Industry grew by 9.6% during Fiscal 2017. Correction in fuel prices and easing financing cost has resulted in lower operating cost, which should further aid domestic growth in near to medium term. Industry sales crossed 3 million milestone for the first time during the year. The Company’s Passenger Vehicles sales were higher by 23.5% at 157,020 vehicles, registering a 5.2% market share. The Company sold 137,175 cars (higher by 28.4%) and 19,845 utility vehicles and vans, (lower by 2.2%). In the Utility Vehicle segment, competitive activity intensified with multiple new launches mainly in the soft-roader category. The Company has taken various initiatives to improve its performance such as product refreshes/launch programs, operational efficiency, dealer effectiveness, working capital management and restructuring customer facing functions.
Some of the highlights of this year’s performance were:
Product launches continued during the Fiscal.
Tiago was launched in April 2016, with latest technological advancements and design engineering.
Tata Hexa was launched in January 2017, with Automatic and Manual Gearbox, new design language and class leading features.
Tigor Compact Sedan was launched towards the end of March 2017.
The above new product launches were in-line with the Company’s objective of taking the brand to a higher level, while making it relevant for the younger buyer. The Company continued to focus on building brand strengths, refreshing products and enhancing sales and service experience. The Company expanded it’s new look, stylish, tech savvy best in class flagship Passenger Vehicle showrooms, for superior customer experience
The Company has signed a contract for supply of 3,192 units of the Tata Safari Storme 4×4 to the Indian Armed Forces, under a new category of vehicles – GS800 (General Service 800).
Exports
The Company exported 64,221 vehicles (Fiscal 2016: 58,058 vehicles) comprising 60,184 units of Commercial Vehicles and 4,037units of Passenger Vehicles during Fiscal 2017.
Export of Commercial Vehicles grew by 11.3% in Fiscal 2017 with 60,184 units exported compared to 54,052 in Fiscal 2016, crossing 60,000 shipments for the first time and the highest ever till date. The traditional markets of SAARC remained stronger than last year growing by 21.5% with Sri Lanka, Bangladesh and Nepal contributing to the growth. However, the mid-term duty change in Sri Lanka and the liquidity crisis in Nepal impacted the growth momentum. The
reconstruction and the easing up of pent up demand led to record shipments to Nepal in Fiscal 2017. Low crude oil prices, Middle East geo-political situation, currency devaluations and political strife cast a big shadow over the Company’s strong markets of Middle East and Africa this year, with the exception of the newly opened market of Tunisia which grown more than 100%. The Company was able to grow market shares in the key markets of Nepal and Bangladesh. In Fiscal 2017, the Company successfully bagged and executed several prestigious orders including 553 units Xenon pickups for PoS, Malaysia; 537 units of buses to Ivory Coast as a part of their public transportation system; 25 units of Prima in Oman to Al Tasneem; 25 units of ULTRA trucks in Bangladesh to Pran RFL; 32 units of ULTRA trucks in Malaysia to PoS and 39 units of ULTRA Buses in Nepal to Mahanagar Yatayat. Some of the key events in Fiscal 2017 were the launch of Tata ULTRA Trucks in Kenya and Tanzania; ULTRA Bus in Tanzania; Tata Prima in Kingdom of Saudi Arabia and Bhutan. As a part of its strategy to expand its global footprint, the Company also launched the Commercial Vehicle brand in Vietnam and Bolivia. In Fiscal 2017, the Company achieved a key milestone of 1,000 Ultra retails in export markets.
During the period Fiscal 2017, the Company exports of Passenger Vehicles stood at 4,037 units, compared to 4,006 units in the Fiscal 2016. Sales in Sri Lanka declined considerably due to increase in import duties and tightening of retail financing. However, this was compensated by the improved sales in Nepal and South Africa with a growth of 120% and 30% respectively.
In Nepal, the launch of Tiago has helped the Company to improve its sales in the hatch segment whereas increased sales of Zest helped to gain the leadership position in the compact sedan segment. The Sumo continues to be the ‘Number One’ selling brand in UVs in Nepal. In South Africa, aggressive fleet sales push helped us to increase its sales over last year. In Bangladesh, the Company has improved its sales on account of launch of Nano GenX and an institutional order for Sumo Ambulance.
Jaguar Land Rover
In Fiscal 2017, Jaguar Land Rover achieved record retail sales of 604,009 units in Fiscal 2017 a growth of 15.8% as compared to Fiscal 2016, primarily driven by the introduction of the Jaguar F-PACE and continued strong demand for the Land Rover Discovery Sport. The retail sales were higher year-on-year in China by 32%, North America by 24%, the UK 16% and the Europe 13% in Fiscal 2017. However, retail sales were down by 6% in other overseas markets, which include Brazil, Russia and South Africa.
Some of the key highlights of Fiscal 2017:
Retail sales of the new Jaguar F-PACE commenced in May 2016 (Winner of World Car of the Year and World Car Design of the Year).
The Jaguar XE commenced sales in the US in May 2016.
The Range Rover Evoque convertible commenced sales in June 2016.

Notice Board’s Report Management Discussion & Analysis Corporate Governance Report Business Responsibility Report
85
Production of the new long wheel base Jaguar XFL commenced at the Chinese joint venture and went on sale locally in September 2016.
The all new Land Rover Discovery was unveiled in September 2016, with sales commencing in February 2017 .
The new Range Rover Velar was revealed to the public in March 2017 and is the 4th Range Rover model positioned between the Range Rover Evoque and the Range Rover Sport.
The Jaguar I-PACE concept, JLR’s first battery electric vehicle, was unveiled in November 2016, with sales commencing in 2018.
JLR opened it’s first wholly owned international manufacturing plant in Brazil in June 2016.
Production of JLR’s in-house 4 cylinder Ingenium petrol engine commenced in September 2016 at the Engine Manufacturing Centre in Wolverhampton in the UK and is now available in the Jaguar XE, XF, F-PACE, Land Rover Discovery Sport and Range Rover Evoque. The Ingenium Petrol Engine will also be available in the new Range Rover Velar from launch.
Construction of the manufacturing plant at Nitra in Slovakia began in September 2016 and the all new Discovery would be the first vehicle to be produced at the new plant from 2018.
Jaguar XF won the Auto Express Golden Steering Wheel award for best saloon car of 2016.
JLR launched it’s InMotion Ventures business unit in April 2016, established to develop innovative solutions aimed at overcoming future travel and transport challenges. Investments to date include US$1 million into GoKid (a ride sharing service for schools) and SPLT (a ride sharing/car pooling platform for commuters).
Tata Daewoo Commercial Vehicle Company Limited
Tata Daewoo Commercial Vehicle Company Limited (TDCV) sold 10,317 commercial vehicles, higher by 13.2% over Fiscal 2016, mainly due to increase in domestic sales. TDCV continued the strong performance, in the domestic market in-spite of increased competition by selling 8,795 commercial vehicles, registering a growth of 25.0% compared to sales of 7,036 commercial vehicles in Fiscal 2016. The market share for both HCV and MCV Segments put together was 29.6% as compared to 31.0% in Fiscal 2016. The export market scenario was very challenging in Fiscal 2017. Factors like persistently low oil prices, local currency depreciation against the US dollar, continuing statutory regulations to reduce imports, the slowdown in Chinese economy impacting commodity exporting countries and increased dealer inventory, adversely impacted TDCV’s exports in major markets, such as Gulf Corporation Council, Russia, Algeria, Vietnam and South Africa. The export sales were 1,522 commercial vehicles, 26.8% lower compared to 2,080 commercial vehicles in Fiscal 2016.
Tata Motors (Thailand) Limited
Tata Motors (Thailand) Limited (TMTL) sold 1,332 units in Fiscal 2017, as compared to 1,312 units in Fiscal 2016. The Thai Automobile Industry has witnessed a flat growth in Fiscal 2017 after 3 straight years of decline.
TMTL has taken the opportunity to refresh its products, services and network, as well as, expand the range of offerings to the Thailand Customers. Fiscal 2017 saw the launch of Super Ace Mint in Q2 of Fiscal 2017 and Ultra Trucks in later part of the year. Initial response for Ultra Truck was encouraging. During the year, TMTL exported 317 vehicles to Malaysia against specific order from PoS Malaysia. TMTL is exploring similar opportunities in other parts of South East Asia and neighbouring continents.
Tata Motors (SA) (Pty) Limited
Tata Motors (SA) (Pty) Ltd (TMSA) sold 697 chassis in the South African market in Fiscal 2017 compared to 765 chassis in Fiscal 2016 and exported 6 chassis to Mozambique during Fiscal 2017. TMSA is in the process of introducing a new range of Ultra truck and few more new models of Prima in South Africa and is exploring options to export vehicles to other African countries.
Tata Motors Finance Limited
Tata Motors Finance Limited (TMFL) is the vehicle financing arm under the brand “Tata Motors Finance.”
TMFL’s total disbursements (including refinance) increased by 3.5% at `9,298 crores in Fiscal 2017 as compared to `8,985 crores in Fiscal 2016. TMFL financed a total 1,18,883 vehicles reflecting an increase of 6.0% over 1,12,114 vehicles financed in Fiscal 2016. Disbursements for commercial vehicles decreased by 4.8% and were at `7,127 crores (77,898 units) as compared to `7,485 crores (75,970 units) of Fiscal 2016 mainly due to lower disbursements in the M&HV segment. Disbursements of passenger vehicles increased by 14.3% to `1,542 crores (34,126 units) from a level of `1,350 crores (33,185 units). Disbursements achieved under refinance (through TMFSL, a 100% Subsidiary of TMFL) were at `628 crores (6,859 vehicles) as compared to `150 crores (2,959 vehicles) during Fiscal 2016.
TMFL has increased its reach by opening limited services branches (called Spoke and Collections branches) exclusively in Tier 2 & 3 towns, which has helped in reducing the turn around time to improve customer satisfaction. TMFL had 261 branches at the end of Fiscal 2017. The book size of TMFL’s corporate lending business, which includes providing finance to TML’s Dealers and Vendors, increased by 21.4% from `947 crores in Fiscal 2016 to `1,150 crores in Fiscal 2017.
As a part of restructuring and consolidation of financial services, the Scheme of Arrangement between TMFL and Sheba Properties Limited (Sheba), wholly owned subsidiary of TMFL, became effective on May 9, 2017. Based on the restructuring plan, TMFL has transferred its New Vehicle Finance (NVF) business to Sheba on January 31, 2017 (appointed date for transfer of assets of NVF Business).
Corporate Overview Financial StatementsStatutory Reports
86 72nd Annual Report 2016-17
MATERIAL CHANGES & COMMITMENT AFFECTING THE FINANCIAL POSITION OF THE COMPANY There are no material changes affecting the financial position of the Company subsequent to the close of the Fiscal 2017 till the date of this Report.
SIGNIFICANT & MATERIAL ORDERS PASSED BY THE REGULATORS OR COURTS OR TRIBUNALS There are no significant material orders passed by the Regulators or Courts or Tribunal, which would impact the going concern status of the Company and its future operation. However, Members attention is drawn to the Statement on Contingent Liabilities and commitments in the Notes forming part of the Financial Statements.
RISK MANAGEMENT The Risk Management Committee (RMC) comprising of four Independent Directors, has been entrusted with responsibility to assist the Board in (a) overseeing the Company’s risk management process and controls, risk tolerance and capital liquidity and funding (b) setting strategic plans and objectives for risk management and review of risk assessment of the Company (c) review the Company’s risk appetite and strategy relating to key risks, including credit risk, liquidity and funding risk, market risk, product risk and reputational risk, as well as the guidelines, policies and processes for monitoring and mitigating such risks.
The Committee operates as per its Charter approved by the Board and within the broad guidelines laid down in it. The Company has a Risk Management Policy in accordance with the provisions of the Act and SEBI (Listing Obligations and Disclosure Requirements) Regulation, 2015 (“SEBI Listing Regulations”). It establishes various levels of accountability and overview within the Company, while vesting identified managers with responsibility for each significant risk.
The Board takes responsibility for the overall process of risk management in the organisation. Through Enterprise Risk Management programme, business units and corporate functions address opportunities and the attendant risks through an institutionalized approach aligned to the Company’s objectives. This is facilitated by internal audit. The business risk is managed through cross functional involvement and communication across businesses. The results of the risk assessment are thoroughly discussed with the Senior Management before being presented to RMC.
INTERNAL FINANCIAL CONTROLS WITH REFERENCE TO THE FINANCIAL STATEMENTDetails of internal financial control and its adequacy are included in the Management Discussion and Analysis Report, which forms part of this Report.
HUMAN RESOURCESThe Tata Motors Group employed 79,558 permanent employees (Fiscal 2016: 76,598 employees) as of Fiscal 2017 and the Company employed 26,035 permanent employees (Fiscal 2016: 26,569 employees) as of Fiscal 2017. The Tata Motors Group has generally enjoyed cordial relations with its employees and workers.
The Company has labour unions for operative / worker grade employees at all the plants across India, except the Dharwad Plant. The labour union at Sanand Plant has recently been registered and the first settlement is yet to be done. The Company has generally enjoyed cordial relations with its employees and unions at its factories and offices and has received union support in the Company’s implementation of reforms that impact safety, quality, cost erosion and productivity improvements across all locations. Employee wages are being paid in accordance with wage agreements that have varying terms (typically three to four years) at different locations.
With an objective of improving Organizational Effectiveness, the Company decided to undertake a structure change exercise with key guiding principles of Empowerment to the Business Units with clear accountability for business results, strong functional leadership and oversight for an effective maker-checker concept, improved and speedier decision making, agility and quick responsiveness to market, and strong cross functional alignment to drive quick issue resolution. A new product line organization has been created with complete Profit & Loss responsibility.
Organisational restructuring has delayered the organization to 5 managerial levels below ExCom. This has made the organization lean and agile. The Company has also rationalized span of control of key roles, providing scope for career development and have significantly increased customer facing roles in both the BUs to enhance customer centricity in the organization. Transactional roles have been identified across functions for transition to shared services, and therefore focus on core activities.
Volumetric study has been performed to identify optimum manpower at each level, bringing the organizational spread closer to global standards. This, combined with the Job Evaluation exercise and Management Audit helped in establishing clear job descriptions for each role and identifying the right talent for the roles.
The Executive Committee conducted a thorough assessment of potential candidates for the top 2/3 levels in the organisation. The assessment results were used for placement of the candidates, which was followed up with ‘on boarding’ workshops and Astronaut Trainings to prepare the management teams for the new responsibilities.
In order to create a mind-set free of job titles and hierarchy, the concept of designations has been abolished and individuals will carry the title of their functional role. After market benchmarking, revised Compensation & Policies have been rolled-out. The new terms and conditions of employment has been shared with the employees through individual letters by respective managers.

Notice Board’s Report Management Discussion & Analysis Corporate Governance Report Business Responsibility Report
87
For a smooth transition, a transition team has been developed to lead the change management process, supported by continuous communications from the leadership team.
Prevention Of Sexual Harassment
The Company has zero tolerance for sexual harassment at workplace and has adopted a Policy on prevention, prohibition and redressal of sexual harassment at workplace in line with the provisions of the Sexual Harassment of Women at Workplace (Prevention, Prohibition and Redressal) Act, 2013 and the Rules thereunder for prevention and redressal of complaints of sexual harassment at workplace. The Company is committed to providing equal opportunities without regard to their race, caste, sex, religion, colour, nationality, disability, etc. All women associates (permanent, temporary, contractual and trainees) as well as any women visiting the Company’s office premises or women service providers are covered under this Policy. All employees are treated with dignity with a view to maintain a work environment free of sexual harassment whether physical, verbal or psychological.
During the Fiscal 2017, the Company had received four complaints on sexual harassments, which have been substantiated and appropriate actions were taken. The Company organized 137 workshops and awareness program against sexual harassment. There were no complaints pending for more than 90 days during the year.
Similar initiatives on Prevention of Sexual Harassment are in place across the Tata Motors Group of companies.
Safety & Health – Performance & Initiatives
The Company is committed to provide a safe and healthy working environment for its employees and associates to ensure a high degree of safety norms. The Company continously strives to perform beyond compliance whilst positively influencing its value chain members to improve their safety standards. There is an increased focus on areas like training and awareness, safety observations, audits etc. to drive a positive safety culture.
The Company’s India operation, whilst achieved improved performance with Total Recordable Case Frequency Rate (TRCFR) being 1.84 against the target of 1.96 for the Fiscal 2017, the overall Safety Performance improved but recorded four fatalities during the year, of which three were road related.
Manufacturing Plants across the country are certified to ISO 14001 - Environment Management Systems and OHSAS 18001 – Occupational Health & Safety Management System, along-with Warehouses Safety Infrastructure upgraded and certification of OHSAS 18001 for a warehouse was also accomplished during Fiscal 2017. All the Company’s Manufacturing Plants across India are certified to ISO 50001 - Energy Management System too. The Company has undertaken several initiatives for resource conservation such as re-cycling of treated effluents back to process, energy, material recovery and co-processing from hazardous wastes through cradle
to grave waste management principles and rainwater harvesting. Manufacturing plants also generate in-house renewable power and source off-site green power where available. Except Sanand, all the Company’s sites are certified for GreenCo.
The Company places equal emphasis on safety processes, behavioral safety and strive to create a positive safety culture towards achieving the ultimate goal of ‘zero injury’. Safety is a primary focus area in daily management and safety parameters are part of the scorecard for Senior Leaders. In same lieu ‘SAFE20 - 20 minutes for Safety,’ the company’s initiative on engagement in Safety. Sessions on Road Safety were conducted at 9 offices across India engaging tunes of 1,000+ employees along with mentoring of Flexi Work Force under “MY BUDDY” program by Permanent Blue Collar Work force / Group leaders.
In line with Safety and Health Policy, to enhance safety standards of its business partners, Company engaged its upstream and downstream supply chain in the safety journey. The objective of such engagement is to raise the safety standards at Suppliers and Dealer workshops. In addition to existing 16 safety standards, new standards / guidelines like Cell Phone Policy, CCTV Policy, Lone Working Standard, Industrial Hygiene Standard, Engineering Standards, Vehicle Usage & Replacement Guidelines were developed and rolled out to raise the level of safety.
The Company continued Campaign ‘i-drive safe’ – an initiative on building a safe driving culture amongst its employee and associates and have trained them in defensive driving. In excess of 19,103 employees and associates till date have been trained under this campaign, initiated few years ago. ‘My Road My Discipline’ a Road Safety Week campaign during January 11 to 17 included Road Safety Celebrations conducted in all location including all plants, offices, dealerships, warehouses, vendors and social awareness messages were aired on FM on road safety in Indian 8 cities.
‘senSHEtize’- A Company’s initiative on Women’s Safety Awareness: 950 women employees were trained with focus on Women’s Safety and Self-defense in 14 session across offices & plants.
Jagruti – Safety Awareness Building Campaign for Workshop Managers is a year-long campaign focused on building awareness on safety and understanding of the Company’s expectations on Dealers Workshop Safety. This programme is in collaboration with the Company, Castrol and training partner ICECD. Jagruti Safety Awareness campaign was initiated done for channel partners-PV & CV dealers covering around 1,800 workshop pan-India.
In health area, the Company under the ‘Health Plus because you matter!’ initiative engaged employees on various subject of health. Health & well-being of aging workforce remains a prime concern. Various health programs across all locations with emphasis on contract employees- eye checkup of drivers, stress management, mailers, etc. have been conducted under this initiative.
For Food Safety, Pune Plant was accredited with HACCP Certification

Corporate Overview Financial StatementsStatutory Reports
88 72nd Annual Report 2016-17
(ISO 22001) and rest of the plants shall be implementing in a phased manner.
In accordance with the Company’s stand on protecting the planet, the Company took a number of initiatives to reduce its Green House Gases footprint by 3% over Fiscal 2016. Similarly, in the Company’s quest to go on renewable energy the Company used 75 million units of renewable electricity in its operations, which is close to 17% of its requirement. On the Company’s journey to ZWTL (Zero Waste To Landfill), it reduced hazardous waste to landfill / incineration by approx. 30% over Fiscal 2016.
On Sustainability, supply chain sustainability was one of the major initiatives undertaken. 50 suppliers have been trained and assessed to sustainability expectations. Handholding of those suppliers is being done to improve the sustainability performance.
Circular economy, natural capital evaluation of key dependencies, design for environment, biodiversity assessment, life cycle assessment of products, climate adaptation study were some of the other initiatives the Company has taken in sustaining its business and planet.
JLR, the Company’s subsidiary continues to drive health and safety through Destination Zero – A Journey to Zero Harm. The Company’s commitment is reflected in the JLR commitment ‘Blueprint for Lasting Success’ with the key statement being “Our most valuable asset is our people, nothing is more important than their safety and well-being. Our co-workers and families rely on this commitment. There can be no compromise”. Activities to deploy this ambition, promote awareness with each one of at JLR, encouraged to understand and take responsibility for its own and fellow colleague’s safety and well-being. Various Zero Harm programs, publications and events have contributed to improved performance in Fiscal 2017 and additionally each functional area has built their own plan of activities to lead improved safety and well-being within their own area of responsibility. Lost Time Case performance has continued an improving trend with an overall business improvement of around 6% Y-O-Y, against a backdrop of continued growth and increased volumes and headcount. A notable improvement was seen in manufacturing locations with over 20% improvement against last Fiscal performance. Many of the sites celebrated zero lost time accidents.
The business has gone through OHSAS 18001 - recertification in Fiscal 2017, with all the UK locations accredited to this standard through a series of external assessments. Further locations have now been added to the assessment portfolio. The business has also maintained the internal safety assessment process SHARP (Safety and Health Assessment Review Process) within its manufacturing locations and has now extended a version into non-manufacturing locations. JLR also continues to mature its approach to well-being activities with a number of targeted events over the past year and specific well-being focus and topics planned for the coming year.
TMSA sustained good performance in areas of Safety and Health
during Fiscal 2017. In June 2016, TMSA successfully cleared audit inspection for Occupational Hygiene against the requirements of the OHSAS.
TDCV Korea achieved an improvement in Safety Index to 0.91 from 1.33 in Fiscal 2017.
TMTL, Thailand continued leadership commitment and engagement with focus in areas safety communication, risk assessment, improving capabilities of employees for emergency situations.
BUSINESS RESPONSIBILITY REPORT Pursuant to Regulation 34(2)(f ) of the SEBI Listing Regulations, the Business Responsibility Report (BRR) initiatives taken from an environmental, social and governance perspective, in the prescribed format is available as a separate section of the Annual Report and also hosted on the Company’s website www.tatamotors.com.
FINANCE During the year, the free cash flows for Tata Motors Group were `(268) crores, post spend on capex, design and development of `30,467crores. Tata Motors Group’s borrowing as at March 31, 2017, stood at `78,604 crores (as at March 31, 2016: `69,360 crores). Cash and bank balances and investments in mutual funds stood at 51,119 crores (as at March 31, 2016: `49,693 crores). The consolidated net automotive debt to equity ratio stood at 0.15 as at March 31, 2017, as compared to (0.01) as at March 31, 2016.
The cash flows from operations were positive `1,381 crores for standalone operations (including joint operations) of the Company. Spend on capex, design and development was `3,427 (net). The borrowings of the Company (including joint operations) as at March 31, 2017 stood at `19,574 crores (as at March 31, 2016: `16,473 crores). Cash and bank balances including mutual funds stood at ` 2,687 crores (as at March 31, 2016: `2,534 crores).
The Company, in February 2017 prepaid `300 crores of its Unsecured 8.60% NCD due in 2018. During the year the Company raised `2,700 crores of funds through Unsecured NCDs.
At JLR, post spend on capex, design and development of GB£3,065 million (`26,869 crores), the free cash flows were GB£295 million (`2,586 crores) for Fiscal 2017. The borrowings of JLR as at March 31, 2017, stood at GB£3,581 million (`28,977 crores) [previous year: GB£2,500 million (`23,863 crores)]. Cash and financial deposits stood at GB£5,487 million (`44,400 crores) [previous year: GB£4,651 million (`44,395 crores)]. Additionally, JLR has undrawn committed long term bank lines of GB£1,870 million (JLR data as per IFRS).
During the Fiscal, JLR issued a €650 million bond maturing in 2024 paying an annual coupon of 2.200%. Subsequently, JLR issued a GB£300 million bond maturing in 2021 paying an annual coupon of 2.750%.

Notice Board’s Report Management Discussion & Analysis Corporate Governance Report Business Responsibility Report
89
During the Fiscal, TMFL has neither raised any borrowings by way of unsecured, subordinated perpetual non-convertible debentures towards Tier 1 and Tier 2 Capital nor by way of an issue of unsecured, subordinated non-convertible debentures towards Tier 2 Capital.
Tata Motors Group has undertaken and will continue to implement suitable steps for raising long term resources to match fund requirements and to optimise its loan maturity profile.
During the year, the Company’s rating for foreign currency borrowings was upgraded to “Ba1”/Stable by Moody’s and to “BB+”/ Stable by Standard & Poor’s. For borrowings in the local currency, the ratings was retained by CRISIL at “AA” with a change in outlook to Positive and by ICRA at “AA” with a change in outlook to Positive. The Non-Convertible Debentures and Long Term Bank facilities i.e. (Buyers Credit) rating by CARE was retained at “AA+”. During the year, JLR’s rating was upgraded by Moody’s at “Ba1”/Positive and was upgraded by Standard & Poor’s at “BB+”. For TMFL, CRISIL has maintained its rating on long-term debt instruments and bank facilities to CRISIL “AA/A1+”/with a change in outlook to Positive for long term. ICRA has also maintained its rating at “AA/A1+” with a change in outlook to Positive for long term. CARE has given rating of “AA+” on long-term debt instruments with a Stable outlook.
FIXED DEPOSITSThe Company has not accepted any public deposits during Fiscal 2017. There were no over dues on account of principal or interest on public deposits other than the unclaimed deposits as at the end of Fiscal 2017.
EXTRACT OF ANNUAL RETURN As provided under Section 92(3) of the Act, the details forming part of the extract of the Annual Return in Form MGT 9 is annexed as Annexure - 1.
INFORMATION TECHNOLOGY AND DIGITAL PRODUCT DEVELOPMENT INITIATIVES
Information Technology Initiatives
The Company has been a pioneer in adopting Information Technologies to enable business processes and deploying efficient & secure information technology. The Company has been working towards implementing the components of its IT roadmap to create a digital ready organization. The Company leverages its strong partnerships with product and services companies to harness the potential of Information Technology towards competitive advantage.
The major highlights from IT at the Company are:
Major technology upgrades undertaken in the ERP, CRM, analytics systems to make the systems current and leverage new versions’ mobile friendly capabilities.
Enabling World Class Quality initiative of the Company through extending the implementation of Manufacturing Execution System.
Completed multiple Proof of Concepts in the area of internet of things for smart manufacturing.
Digital initiatives like mobile backend and smart e-guru mobile app along with digital product demonstration capabilities for dealer’s salesforce for effective lead generation.
Focus on Supplier Relationship Transformation (SRT) through implementation of supplier systems and inauguration of SRT training centre.
Continued greater collaboration with subsidiaries leveraging IT leadership in the Company.
Strengthening information security through multiple initiatives such as Network Access Control and preparation for ISO27000 framework.
With the readiness of the Company’s systems on the digital front, it is entering an exciting phase of transformation using cutting edge technology to provide customer centric products and services.
Digital Product Development Systems Initiatives
The Company, in its constant endeavor to improve processes in product design and manufacturing planning domain, has implemented various new processes and improved existing manual process by converting them to digital.
Direct business benefits, in terms of reduction in time, effort, cost and improved control, quality were achieved through various initiatives, some of which are listed below:
30 new knowledge based engineering applications designed and implemented across various product design and safety domains. They were integrated with various tools such as tyre life enhancement for heavy commercial vehicles, exterior trims safety for passenger vehicles, ensuring its validation in virtual environment, thereby reducing the number of physical prototypes.
Specific Mobility Application developed to enable value based selling at CV dealerships and were deployed at 10 locations across India.
Product Lifecycle Management (PLM) System Infrastructure was refreshed at Pantnagar and Lucknow locations.
New innovative Visual Analytics and Reporting framework for applications was deployed for PLM based data and 4 specific applications were implemented for product development teams.
Augmentation of High Performance Computing (HPC) Infrastructure to execute and deliver faster simulation results for product development (productivity improvement). This enabled more design optimization studies during concept and product development phase (capacity enhancement), thus reducing dependence on costly proto-parts & physical testing.
16 customized automation tools provided into CAE domain to increase CAE pre-post processing productivity for durability, crash, CFD and NVH functions.

Corporate Overview Financial StatementsStatutory Reports
90 72nd Annual Report 2016-17
In the digital manufacturing domain, MOST (Maynard Operations Sequence Technique) was implemented on the shop floor at various manufacturing locations.
Subsidiaries
Jaguar Land Rover:
JLR continue to develop the use of the latest Product Lifecycle Management (PLM) technologies to ensure JLR remains at the cutting edge of engineering and drive efficiencies into the process. The application of leading visualisation and systems engineering technologies enable full engagement in the product creation process, all with the aim of producing cars and SUVs that the customers will love for life.
Tata Daewoo Commercial Vehicle:
TDCV continued the focus on quality and agility in its digital product creation processes. PLM software system was upgraded to a higher version giving enhanced features. The PLM processes were also improved, considering various business requirements and scenarios.
Tata Technologies Limited (TTL):
TTL has invested in new technologies and practices both on software and hardware front with strong focus on its business goals and customer requirements. The digital tools and systems continue to be enhanced and upgraded as per customer needs. It continued its new technology evaluation process to support the delivery teams with effective and optimal hardware systems.
TTL invested to enhance the capacity of the High Performance Computing setup to address growing needs of simulation by augmenting its processing power with latest hardware. It extended the Virtual Desktop Infrastructure setup to support few delivery teams to provide them with scalable infrastructure that caters to their requirements on multiple operating environments and also provide them with flexible and controlled access to it from anywhere. TTL leveraged the high performance and high availability computing for enterprise applications and has invested in latest technologies for data center upgrade.
Tata Motors European Technical Centre (TMETC):
TMETC continued the use of best in class hardware and software systems to enhance quality and agility in its product conceptualization, design and virtual validation domain. Knowledge Based Engineering Applications were implemented in the engineering and design areas.
TECHNOLOGY AND ENVIRONMENT FRIENDLY INITIATIVES:
The Company is aiming towards meeting upcoming emission regulations by multifaceted approach of adapting cleaner technologies for internal combustion engines and by working on new technologies in the domains of xEVs, Hybrids and Fuel Cell. The Company intends to reduce the emissions from vehicles through
various powertrain as well as vehicle level measures. Some of the key initiatives in this direction are mentioned below:
Fuel efficiency improvement in diesel SCVs by implementation of fuel control unit based FIE system on twin cylinder turbo diesel engine.
Better emission control for SCVs having two cylinder NA common rail BS-IV engine.
Multi operation mode (economy & normal torque mode) for better fuel economy & drive ability on commercial vehicles fueled with CNG.
Fuel efficiency improvement in diesel passenger car by engine downsizing (30% engine displacement reduction), friction reduction in piston ring pack and implementing multiple drive modes.
Various full electric vehicles ranging from SCV to 12m buses are being developed to address last mile transport and passenger commute in ecologically sensitive areas.
Series hybrid bus with New Gen 5L BS-IV diesel engine developed and serialized; the vehicle has substantially superior fuel economy over baseline diesel vehicle.
The fleet of Fuel Cell bus for demonstration is being built, and two fuel cell buses are under testing.
CONSOLIDATED FINANCIAL STATEMENT
The Company announces its Consolidated Financial Statement on a quarterly basis. As required under the SEBI Listing Regulations, the Consolidated Financial Statement of the Company and its subsidiaries, prepared in accordance with Ind AS 110 issued by the Institute of Chartered Accountants of India, form part of the Annual Report and are reflected in the Consolidated Financial Statement of the Company. Pursuant to Section 129(3) of the Act, a statement containing the salient features of the financial statement of the subsidiary companies is attached to the financial statement in Form AOC-1. The Company will make available the said financial statements and related detailed information of the subsidiary companies upon the request by any member of the Company or its subsidiary companies. These financial statement will also be kept open for inspection by any member at the Registered Office of the Company and the subsidiary companies.
Pursuant to the provisions of section 136 of the Act, the financial statement of the Company, Consolidated Financial Statement along with relevant documents and separate audited accounts in respect of subsidiaries are available on the website of the Company.
SUBSIDIARY, JOINT VENTURES AND ASSOCIATE COMPANIES The Company has 78 subsidiaries (14 direct and 64 indirect) as at March 31, 2017, as disclosed in the accounts.
During the year, the following changes have taken place in subsidiary companies:

Notice Board’s Report Management Discussion & Analysis Corporate Governance Report Business Responsibility Report
91
Subsidiary companies formed/acquired:
Jaguar Land Rover Colombia S.A.S was incorporated with effect from August 22, 2016
InMotion Ventures 1 Limited was incorporated with effect from October 25, 2016
InMotion Ventures 2 Limited was incorporated with effect from October 25, 2016
InMotion Ventures 3 Limited was incorporated with effect from October 25, 2016
Companies ceasing to be subsidiary companies / ceased operations:
JDHT Limited dissolved with effect from December 27, 2016
Silkplan Limited dissolved with effect from January 17, 2017
Tata Technologies (Canada) Inc. dissolved with effect from December 13, 2016
Name changes
Jaguar Land Rover Automotive Trading (Shanghai) Company Limited was renamed as Jaguar Land Rover (China) Investment Co. Limited with effect from November 1, 2016
Cambric Manufacturing Technologies (Shanghai) Company Limited was renamed Tata Manufacturing Technologies (Shanghai) Limited with effect from February 22, 2017
Re-structuring
The Scheme of Arrangement between Tata Motors Finance Limited and Sheba Properties Limited, subsidiaries of the Company, was approved by the Hon’ble National Company Law Tribunal effective from May 9, 2017. Besides the above, JLR continued to integrate / restructure legal entities for manufacturing and for exporting globally as combined brand legal entities. Other than the above, there has been no material change in the nature of the business of the subsidiary companies.
Associate Companies
As at March 31, 2017, the Company has 8 associate companies and 7 joint ventures. One of these joint ventures has 14 wholly owned subsidiaries and details of the same are disclosed in the accounts. The Company has adopted a Policy for determining Material Subsidiaries in line with Regulation 16 of the SEBI Listing Regulations. The Policy, as approved by the Board, is uploaded on the Company’s website (URL: www.tatamotors.com/investors/pdf/material.pdf ).
CONSERVATION OF ENERGY, TECHNOLOGY ABSORPTION & FOREIGN EXCHANGE EARNINGS AND OUTGOThe information on conservation of energy, technology absorption and foreign exchange earnings and outgo stipulated under Section
134(3)(m) of the Act, read along with Rule 8 of the Companies (Accounts) Rules, 2014, is annexed as Annexure - 2.
CORPORATE GOVERNANCEAt the Company we constantly strive to evolve and follow up on the Corporate Governance guidelines and best practices. Our purpose has always been transparency, long term shareholder value and respect to the minority shareholders. The Company discloses timely and accurate information regarding its operations and performance.
During the second half of the year under review the Company witnessed leadership change at Tata Sons (our promoter). During this period there were allegations made regarding the ethics and governance of the Company. Clarifications were also sought by the Regulators with respect to certain business decisions and governance processes. The Company would like to categorically deny the references and would like to impress upon you that it has robust systems and processes in place to ensure compliance to all regulatory requirements. The Company’s Board exercises its independence both in letter and in spirt. The Directors have always acted in the best interest of the Company and will continue to do so.
The Board closely monitored the events during this period and allegations made. The Audit Committee of the Board reviewed all the issues that were brought up including correspondence between the Regulators and the Company on the issues raised in the representations made by Mr Cyrus P Mistry and Mr Nusli Wadia in terms of Section 169 of the Act and allegations made in this regard in the proceedings before the National Company Law Tribunal initiated against our Promoter. The Company has filed responses to the Regulators denying all such allegations. In such responses, the Company has reiterated that the Company is in compliance of the governance processes and requirements in all such cases. The Committee reviewed the various compliances and disclosures and the rigour applied when strategic decisions were taken and the detailed responses to the Regulators by the Company denying such allegations. After due deliberations with relevant officials and review of relevant documents and on the basis of a detailed review of these by a reputed independent Legal Counsel, the Committee expressed its confirmation of the responses by the Company to the Regulators. It follows that the aforesaid allegations against your Company and its governance were incorrect and such statements were made without exercising proper care.
A separate section on Corporate Governance and the certificate from the Practicing Company Secretary confirming compliance of Corporate Governance norms as stipulated in Regulation 34 read along with Schedule V of the SEBI Listing Regulations, giving information pertaining to the Board, Committee of the Board and other details of relevance forms part of this Report.
Corporate Overview Financial StatementsStatutory Reports
92 72nd Annual Report 2016-17
DIRECTORS
Appointment
The Company has, on the recommendation of Nomination & Remuneration Committee (NRC) and in accordance with provisions of the Act and SEBI Listing Regulations, appointed Mr Natarajan Chandrasekaran (DIN: 00121863) as Additional Director and Chairman of the Board with effect from January 17, 2017 and Mr Om Prakash Bhatt (DIN: 00548091) was appointed as Additional and Independent Director, for a tenure of 5 years on May 9, 2017, subject to approval of Members at the forth coming Annual General Meeting (AGM) of the Company. They shall hold office as Additional Directors upto the date of the AGM and are eligible for appointment as Directors.
As reported in the previous year, Mr Guenter Butschek was appointed as Chief Executive Officer and Managing Director of the Company for a term of 5 years w.e.f. February 15, 2016. The Members have vide Special Resolution passed at the AGM held on August 9, 2016 approved of the said appointment and payment of minimum remuneration in case of inadequacy of profits or no profits in any financial year. An application to the Central Government has been filed by the Company and the approval is awaited.
Re-appointment
In accordance with provisions of the Act and the Articles of Association of the Company, Dr Ralf Speth (DIN: 03318908) is liable to retire by rotation and is eligible for re-appointment.
The disclosures required pursuant to Regulation 36 of SEBI Listing Regulations are given in the Notice of the AGM, forming part of the Annual Report and disclosure pursuant to Schedule V, Part II, proviso of Section II B(iv)IV of the Act and Schedule V of the SEBI Listing Regulations is disclosed in the Corporate Governance Report, forming part of the Annual Report.
Attention of the Members is invited to the relevant item in the Notice of the AGM and the Explanatory Statement thereto.
Cessation
Mr Cyrus P Mistry, Non-Executive Director and Chairman, (DIN: 00010178) (resigned with effect from December 19, 2016. Based on the requisition of Tata Sons Limited, the shareholders at the Extraordinary General Meeting of the Company held on December 22, 2016 voted in favour of removal of Mr N N Wadia as an Independent Director (DIN: 00015731) Mr Wadia ceased to be a Director of the Company with effect from December 22, 2016.
Mr Subodh Bhargava, Independent Director, (DIN: 00035672) retired on March 29, 2017 on attaining the age of 75 years, in accordance with Governance Guidelines on Board Effectiveness.
The Board places on record their appreciation for the contribution of these Directors during their tenure.
Independent Directors
All Independent Directors of the Company have given declarations under Section 149(7) of the Act, that they meet the criteria of independence as laid down under Section 149(6) of the Act and Regulation 16 of the SEBI Listing Regulations.
KEY MANAGERIAL PERSONNEL The Key Managerial Personnel (KMPs) of the Company during Fiscal 2017 are:
Mr Guenter Butschek, Chief Executive Officer and Managing Director
Mr Ravindra Pisharody, Executive Director (Commercial Vehicles)
Mr Satish Borwankar, Executive Director (Quality)
Mr C Ramakrishnan, Group Chief Financial Officer
Mr Hoshang Sethna, Company Secretary
During the year, there was no change in the KMPs of the Company.
GOVERNANCE GUIDELINESDuring the year under review, the Company adhered to the Governance Guidelines on Board Effectiveness. The Governance Guidelines cover aspects related to composition and role of the Board, Chairman and Directors, Board diversity, definition of independence, Director term, retirement age and Committees of the Board. It also covers aspects relating to nomination, appointment, induction and development of Directors, Director remuneration, Subsidiary oversight, Code of Conduct, Board Effectiveness Review and Mandates of Board Committees.
Selection and procedure for nomination and appointment of Directors
The NRC is responsible for developing competency requirements for the Board based on the industry and strategy of the Company. The Board composition analysis reflects in-depth understanding of the Company, including its strategies, environment, operations, financial condition and compliance requirements.
The NRC conducts a gap analysis to refresh the Board on a periodic basis, including each time a Director’s appointment or re-appointment is required. The Committee is also responsible for reviewing and vetting the CVs of potential candidates vis-à-vis the required competencies, undertake a reference and due diligence and meeting potential candidates, prior to making recommendations of their nomination to the Board. At the time of appointment, specific requirements for the position, including expert knowledge expected, is communicated to the appointee.
Criteria for Determining Qualifications, Positive Attributes and Independence of a Director
The NRC has formulated the criteria for determining qualifications,

Notice Board’s Report Management Discussion & Analysis Corporate Governance Report Business Responsibility Report
93
positive attributes and independence of directors in terms of provisions of Section 178 (3) of the Act and Regulation 19 read along with Schedule II of SEBI Listing Regulations, which is annexed as Annexure - 3.
REMUNERATION POLICY The Company has in place a Remuneration Policy for the Directors, Key Managerial Personnel and other employees, pursuant to the provisions of the Act and Regulation 19 of SEBI Listing Regulations, the same is annexed as Annexure - 4.
BOARD EVALUATIONThe annual evaluation process of the Board of Directors (“Board”), Committees and individual Directors was carried out in the manner prescribed in the provisions of the Act, Guidance Note on Board Evaluation issued by Securities and Exchange Board of India on January 5, 2017 and as per the Corporate Governance requirements prescribed by SEBI Listing Regulations.
The performance of the Board, Committees and individual Directors was evaluated by the Board seeking inputs from all the Directors. The performance of the Committees was evaluated by the Board seeking inputs from the Committee Members. The “NRC” reviewed the performance of the individual Directors, a separate meeting of Independent Directors was also held to review the performance of Non-Independent Directors; performance of the Board as a whole and performance of the Chairperson of the Company, taking into account the views of Managing Director / Executive Directors and Non-Executive Directors. This was followed by a Board meeting that discussed the performance of the Board, its Committees and individual Directors.
The criteria for performance evaluation of the Board included aspects like Board composition and structure; effectiveness of Board processes, information and functioning, etc. The criteria for performance evaluation of Committees of the Board included aspects like composition and structure of the Committees, functioning of Committee meetings, contribution to decision of the Board, etc. The criteria for performance evaluation of the individual Directors included aspects on contribution to the Board and Committee meetings like preparedness on the issues to be discussed, meaningful and constructive contribution and inputs in meetings, integrity etc. In addition, the Chairman was also evaluated on the key aspects of his role.
FAMILIARISATION PROGRAMME FOR INDEPENDENT DIRECTORSThe details of the Familiarisation Programme for Independent Directors with the Company in respect of their roles, rights, responsibilities in the Company, nature of the industry in which Company operates, business model of the Company and related matters are put up on
the website of the Company at (URL:www.tatamotors.com/investors/pdf/familiarisation-programme-independent-directors.pdf ).
VIGIL MECHANISMThe Company has adopted a Whistle Blower Policy establishing vigil mechanism, to provide a formal mechanism to the Directors and employees to report their concerns about unethical behaviour, actual or suspected fraud or violation of the Company’s Code of Conduct or ethics policy. The Policy provides for adequate safeguards against victimization of employees who avail of the mechanism and also provides for direct access to the Chairman of the Audit Committee. It is affirmed that no personnel of the Company has been denied access to the Audit Committee. The policy of vigil mechanism is available on the Company’s website at (URL: www.tatamotors.com/investors/pdf/whistle-blower-policy.pdf ).
PARTICULARS OF EMPLOYEESDisclosure pertaining to remuneration and other details as required under Section 197(12) of the Act read with Rule 5 (1) of the Companies (Appointment and Remuneration of Managerial Personnel) Rules, 2014 is annexed to the Report as Annexure - 5.
The statement containing particulars of top 10 employees and the employees drawing remuneration in excess of limits prescribed under Section 197 (12) of the Act read with Rule 5 (2) and (3) of the Companies (Appointment and Remuneration of Managerial Personnel) Rules, 2014 is provided in a seperate Annexure forming part of the Report. In terms of proviso to Section 136(1) of the Act, the Report and Accounts are being sent to the shareholders excluding the aforesaid Annexure. The said statement is also open for inspection at the Registered Office of the Company. Any member interested in obtaining a copy of the same may write to the Company Secretary.
CORPORATE SOCIAL RESPONSIBILITY INITIATIVES The brief outline of the Corporate Social Responsibility (CSR) Policy of the Company and the initiatives undertaken by the Company on CSR activities during the year are set out in Annexure - 6 of this Report in the format prescribed in the Companies (CSR Policy) Rules, 2014. The Policy is available on Company’s web-site at (URL: www.tatamotors.com/investors/pdf/csr-policy-23july14.pdf ).

Corporate Overview Financial StatementsStatutory Reports
94 72nd Annual Report 2016-17
Corporate Overview Financial StatementsStatutory Reports
PARTICULARS OF LOANS, GUARANTEES OR INVESTMENTS BY THE COMPANY The details of Loans, Guarantees or Investments made during Fiscal 2017 are given below:
` in crores
Companies Nature of Transaction
Loans Investments
Tata Marcopolo Motors Limited
Inter-corporate deposits
10.00 -
Tata Motors European Technical Centre Plc
Investment in loans/ shares
34.39
139.08
Concorde Motors India Limited
Compulsory Convertible Debentures with a call option to TML
-- $
Notes:
$ Concorde Motors has issued CCD of `78 crores to TMFL. The call option is available with the Company to acquire the CCDs from TMFL.
- During Fiscal 2017, the Company has given no Guarantee to any of its subsidiaries, joint ventures and associate companies
PARTICULARS OF CONTRACTS OR ARRANGEMENTS WITH RELATED PARTIESAll contracts/ arrangements/ transactions entered by the Company during the year with related parties were on an arms’ length basis, in the ordinary course of business and were in compliance with the applicable provisions of the Act and SEBI Listing Regulations. The prior approval of the Audit Committee was sought for all related party transactions. The Company has adopted a Policy on Related Party Transactions which even provides for the parameters to grant Omnibus Approval(s) by the Audit Committee and is available on the website at (URL:www.tatamotors.com/investors/pdf/rpt-policy.pdf ).
A statement on related party transactions specifying the details of the transactions, pursuant to each omnibus approval granted, have been placed on a quarterly basis for review by the Audit Committee.
During the Fiscal 2017, there have been no related party transactions of the Company with its Directors and Key Managerial Personnel or their relatives, its holding, subsidiary or associate companies as prescribed under Section 188 of the Act and SEBI Listing Regulations. Also there are no material transactions with any related party that are required to be disclosed under Form AOC-2.
AUDIT
Statutory Audit
In the 69th Annual General Meeting held on July 31, 2014, M/s. Deloitte Haskins & Sells LLP, (DHS), Chartered Accountants (ICAI Firm
Registration No. 117366W/W-100018) was re-appointed as Statutory Auditors of the Company for a tenure of 3 year, subject to ratification of their appointment by Members at every subsequent AGM. DHS tenure of 3 year as Statutory Auditors concludes at this ensuing AGM.
The report of the Statutory Auditors is enclosed to this Report and contains no qualification, reservation or adverse remark. The observations made in the Auditors’ Report are self-explanatory and therefore do not call for any further comments.
The Board of Director of the Company has on the recommendation of the Audit Committee and a per Section 139 of the Act it is proposed to appoint M/s B S R & Co. LLP, Chartered Accountants (B S R LLP) (ICAI Firm No. 101248W/W – 100022) for a tenure of 5 year, to hold office from the conclusion of the ensuing AGM till the conclusion of the 78th AGM of the Company to be held in the year 2022, subject to ratification of their appointment at every subsequent AGM, at such remuneration as approved by the Members at this AGM. Further, B S R LLP have under Section 139(1) of the Act and the Rules framed thereunder, furnished a certificate of their eligibility and consent for appointment.
The Board commend to seek consent of its Members on appointment of BSR LLP as Statutory Auditors for tenure of 5 year, to examine and audit the accounts of the Company during the said period.
Cost Audit
As per Section 148 of the Act, the Company is required to have the audit of its cost records conducted by a Cost Accountant in Practice. The Board of Directors of the Company has on the recommendation of the Audit Committee, approved the appointment of M/s Mani & Co., a firm of Cost Accountants in Practice (Registration No.000004) as the Cost Auditors of the Company to conduct cost audits pertaining to relevant products prescribed under the Companies (Cost Records and Audit) Rules, 2014 for the year ending March 31, 2018. The Board of Director on recommendation of the Audit Committee approved remuneration of `5 lakhs plus out of pocket expenses, subject to ratification of their remuneration by the Members at the forthcoming AGM.
M/s Mani & Co. have, under Section 139(1) of the Act and the Rules framed thereunder furnished a certificate of their eligibility and consent for appointment.
M/s Mani & Co., have vast experience in the field of cost audit and have conducted the audit of the cost records of the Company for the past several years under the provisions of the erstwhile Companies Act, 1956.
Secretarial Audit
Pursuant to the provisions of Section 204 of the Act and the Companies (Appointment and Remuneration of Managerial Personnel) Rules, 2014, the Board of Directors on recommendation of the Audit Committee appointed M/s Parikh & Associates, a firm of

Notice Board’s Report Management Discussion & Analysis Corporate Governance Report Business Responsibility Report
95
Company Secretaries in Practice to conduct the Secretarial Audit of the Company for the year ended March 31, 2017. The Report of the Secretarial Audit is annexed herewith as Annexure- 7.
The Board provides clarification on Auditor’s observation(s) contained in the Report:
a) the Company has provided adequate responses on queries / observations raised by the Central Government and their approval is awaited.
b) As at March 31, 2017, NRC had recommended to the Board appointment of Mr Om Prakash Bhatt, as Additional and Independent Director. The Board considered the recommendation of NRC and appointed Mr O P Bhatt as Additional and Independent Director on May 9, 2017.
DIRECTORS’ RESPONSIBILITY STATEMENTBased on the framework of internal financial controls and compliance systems established and maintained by the Company, work performed by the internal, statutory, cost, external agencies and secretarial auditors, including audit of internal financial controls over financial reporting by the statutory auditors and the reviews performed by Management and the relevant Board Committees, including the Audit Committee, the Board is of the opinion that the Company’s internal financial controls were adequate and effective during Fiscal 2017.
Accordingly, pursuant to Section 134(5) of the Act, the Board of Directors, to the best of their knowledge and ability, confirm that:
(a) in the preparation of the annual accounts, the applicable accounting standards have been followed and that there are no material departures;
(b) they have, selected such accounting policies and have applied them consistently and made judgments and estimates that are reasonable and prudent, so as to give a true and fair view of the state of affairs of the Company at the end of the financial year and of the loss of the Company for that period;
(c) they have taken proper and sufficient care for the maintenance of adequate accounting records in accordance with the provisions of the Act, for safeguarding the assets of the Company and for preventing and detecting fraud and other irregularities;
(d) they have prepared the annual accounts on a going concern basis;
(e) they have laid down internal financial controls to be followed by the Company and such internal financial controls are adequate and were operating effectively*; and
(f ) they have devised proper systems to ensure compliance with the provisions of all applicable laws and such systems are adequate and operating effectively.
*please refer to the Section “Internal Control Systems and their Adequacy in the Management Discussion and Analysis”.
ACKNOWLEDGEMENTThe Directors wish to convey their appreciation to all of the Company’s employees for their enormous personal efforts as well as their collective contribution to the Company’s performance. The Directors would also like to thank the employee unions, shareholders, customers, dealers, suppliers, bankers, Government and all the other business associates for the continuous support given by them to the Company and their confidence in its management.
On behalf of the Board of Directors
N CHANDRASEKARANChairman
(DIN: 00121863)
Mumbai, May 23, 2017

Corporate Overview Financial StatementsStatutory Reports
96 72nd Annual Report 2016-17
FORM NO. MGT-9
Extract of Annual Return as on March 31, 2017[Pursuant to Section 92(3) of the Companies Act, 2013 read with Rule 12(1) of the Companies (Management and Administration) Rules, 2014]
II. PRINCIPAL BUSINESS ACTIVITIES OF THE COMPANY All the business activities contributing 10 % or more of the total turnover of the company shall be stated:-
III. PARTICULARS OF HOLDING, SUBSIDIARY AND ASSOCIATE COMPANIES (INCLUDING JOINT VENTURES)
Sl. No.
Name and Description of main products / services NIC Code of the Product/Service
% to total turnover of the company
1. Manufacture of Motor Vehicles 2910 92.33%
ANNEXURE 1
Sl. no. NAME AND ADDRESS OF THE COMPANY CIN / GLN HOLDING/SUBSIDIARY/
ASSOCIATE/JV% OF SHARES
HELDAPPLICABLE
SECTION1 Concorde Motors (India) Limited, 3rd Floor, Nanavati Mahalaya, 18 Homi Mody Street, Hutatma Chowk,
Mumbai – 400001U24110MH1972PLC015561 SUBSIDIARY 100.00 2(87)
2 Sheba Properties Limited, 10th floor, 106 A and B, Maker Chambers III, Nariman Point, Mumbai-400021 U45200MH1989PLC050444 SUBSIDIARY 100.00 2(87)
3 TAL Manufacturing Solutions Limited, PDO Building, TATA Motors Campus, Chinchwad, Pune - 411033 U29100PN2000PLC130290 SUBSIDIARY 100.00 2(87)
4 Tata Motors European Technical Centre PLC, 18 Grosvenor Place, London, SW1X 7HS NA SUBSIDIARY 100.00 2(87)
5 Tata Motors Insurance Broking and Advisory Services Limited, 3rd Floor, Nanavati Mahalaya, 18 Homi Mody Street, Hutatma Chowk, Mumbai – 400001
U50300MH1997PLC149349 SUBSIDIARY 100.00 2(87)
6 TML Holdings Pte. Limited, 9 Battery Road, #15-01, Straits Trading Building, Singapore 049910 NA SUBSIDIARY 100.00 2(87)
7 TML Distribution Company Limited, 3rd Floor, Nanavati Mahalaya, 18 Homi Mody Street, Hutatma Chowk, Mumbai – 400001
U63000MH2008PLC180593 SUBSIDIARY 100.00 2(87)
8 Tata Hispano Motors Carrocera S.A., Carretera de Castellon, Km. 230,5 (poligono Empresarium), Zaragoza, Spain NA SUBSIDIARY 100.00 2(87)
9 Tata Hispano Motors Carrocerries Maghreb SA, Zone Industrial - Berrechid, Rue Al Adrisa, Berrechid -26100, Morocco
NA SUBSIDIARY 100.00 2(87)
10 TML Drivelines Limited, C/oTata Motors Limited, 3rd Floor, Nanavati Mahalaya, 18 Homi Mody Street, Hutatma Chowk, Mumbai – 400001
U34100MH2000PLC124874 SUBSIDIARY 100.00 2(87)
11 Trilix S.r.l., Via Teano 3, 10042 Nichelino, Torino, Italy NA SUBSIDIARY 80.00 2(87)
12 Tata Precision Industries Pte. Limited, 1 Robinson Road, #19-01, AIA Towers, Singapore 048 542 NA SUBSIDIARY 78.39 2(87)
13 Tata Technologies Limited, Plot No. 25, Pune Infotechpark, MIDC Taluka - Mulshi Hinjawadi, Pune - 27 U72200PN1994PLC013313 SUBSIDIARY 72.32 2(87)
14 Tata Marcopolo Motors Limited, Bombay House, 24, Homi Mody street, Mumbai-400001 U34101MH2006PLC164771 SUBSIDIARY 51.00 2(87)
15 Tata Motors Finance Limited, 10th floor, 106 A and B, Maker Chambers III, Nariman Point, Mumbai 400021 U65923MH2006PLC162503 SUBSIDIARY 100.00 2(87)
16 Jaguar Land Rover Automotive Plc, Abbey Road, Whitley, Coventry, CV3 4LF - England UK 6477691 SUBSIDIARY 100.00 2(87)
17 Jaguar Land Rover Limited, Abbey Road, Whitley, Coventry, CV3 4LF - England UK 1672070 SUBSIDIARY 100.00 2(87)
18 Jaguar Land Rover Austria GmbH, Fuerbergstrasse 51, Salzburg, A5020, Austria FN84604v SUBSIDIARY 100.00 2(87)
19 Jaguar Land Rover Japan Limited, 3-13 Toranomon 4-chome, Minato-ku, Tokyo, Japan45 0104-01-075166 SUBSIDIARY 100.00 2(87)
20 JLR Nominee Company Limited, Abbey Road, Whitley, Coventry, CV3 4LF - England UK 1672065 SUBSIDIARY 100.00 2(87)
vii) Name, Address and contact details of Registrar & Transfer Agents: TSR Darashaw Limited,
6/10 Haji Moosa Patrawala Industrial Estate, 20, E Moses Road, Mahalaxmi, Mumbai - 400001 Tel: 91 22 6656 8484; Fax: 91 22 6656 8494, Email: [email protected]; Website: www. tsrdarashaw.com
For Rights Issue 2015 : Link InTime India Private Limited No. C-13, Pannalal Silk Mill Compound, Lal Bahadur Shastri Road, Bhandup (W), Mumbai - 400078 Tel: (91 22) 6171 5400/9167779196 /97 /98/ 99 Fax: (91 22) 2596 0329 Email: [email protected] Website: www.linkintime.co.in
I. REGISTRATION AND OTHER DETAILS:i) CIN: L28920MH1945PLC004520ii) Registration Date: 1-9-1945iii) Name of the Company: Tata Motors Limitediv) Category / Sub-Category of the Company: Public Company/
Limited by sharesv) Address of the Registered Office and contact details:
Bombay House, 24 Homi Mody Street, Mumbai-400001 Tel: +91 22 66658282 Fax +91 2266657799 Email: [email protected] Website: www.tatamotors.comvi) Whether listed company: Yes

Notice Board’s Report Management Discussion & Analysis Corporate Governance Report Business Responsibility Report
97
21 Jaguar Land Rover Deutschland GmbH Am Kronberger Hang 2a 65824 Schwalbach/Ts Germany HRB 2408 SUBSIDIARY 100.00 2(87)
22 Jaguar Land Rover North America LLC “555 MacArthur Blvd. Mahwah, New Jersey 07430, USA 2075961 SUBSIDIARY 100.00 2(87)
23 Jaguar Land Rover Nederland BV, “PO Box 40, 4153 ZG Bessd Stationsweg 8, Netherlands” 23074977 SUBSIDIARY 100.00 2(87)
24 Jaguar Land Rover Portugal - Veículos e Peças, Lda. Edificio Escritorios do Tejo, Rua do Polo Sul, Lote 1.10.1.1 – 3. B-3, Parish of Santa Maria dos Olivais, Municipality of Lisboa, Portugal
504 998 803 SUBSIDIARY 100.00 2(87)
25 Jaguar Land Rover Australia Pty Limited, 65 Epping Road, North Ryde, New South Wales, 2113, Australia 4352238 SUBSIDIARY 100.00 2(87)
26 Jaguar Land Rover Italia Spa, Via Alessandro Marchetti 105 - 00148, Roma, Italy 6070621005 SUBSIDIARY 100.00 2(87)
27 Jaguar Land Rover Korea Company Limited, 25F West Mirae Asset Center 1, Building 67 Suha-dong, Jung-gu Seoul 100-210 Korea
110111-3977373 SUBSIDIARY 100.00 2(87)
28 Jaguar Land Rover (China) Investment Co. Limited(Change of name from Jaguar Land Rover Automotive Trading (Shanghai) Company Limited effective November 1, 2016), Room 713, 7F No.6 Jirong Road (Area C1, Plot 001), Shanghai, China Free Trade Zone
310115400245293 SUBSIDIARY 100.00 2(87)
29 Jaguar Land Rover Canada ULC, 75 Courtneypark Drive West, Unit 3, Mississauga, ON L5W 0E3, Canada 2013828088 SUBSIDIARY 100.00 2(87)
30 Jaguar Land Rover France, SAS, 34 Rue de la Croix de Fer 78105 Saint Germain en Laye Cedex, France SOREN 509 016 804 RCS Nanterre
SUBSIDIARY 100.00 2(87)
31 Jaguar Land Rover (South Africa) (Pty) Limited, Simon Vermooten Road, Silverton, Pretoria, South Africa 7769130 SUBSIDIARY 100.00 2(87)
32 Jaguar e Land Rover Brasil Industria e Comercio de Veiculos LTDA, Avenida Ibirapuera 2.332, Torre I -10º andar- Moema 04028-002, São Paulo-SP-Brazil
35.222.373.953 SUBSIDIARY 100.00 2(87)
33 Limited Liability Company "Jaguar Land Rover" (Russia), 28B, Building 2, Mezhdunarodnoe Shosse 141411, Moscow, Russian Federation
1085047006549 SUBSIDIARY 100.00 2(87)
34 Jaguar Land Rover (South Africa) Holdings Limited, Abbey Road, Whitley, Coventry, CV3 4LF - England UK NA SUBSIDIARY 100.00 2(87)
35 Jaguar Land Rover India Limited, Nanavati Mahalaya, 18 Homi Mody Street, Hutatma Chowk, Mumbai – 400001 U34200MH2012FLC237194 SUBSIDIARY 100.00 2(87)
36 Jaguar Land Rover Espana SL, Torre Picasso, Plaza Pablo Ruiz Picasso, 1 – Planta 42, 23020 Madrid, Spain B-82526757 SUBSIDIARY 100.00 2(87)
37 Jaguar Land Rover Belux NV, Generaal Lemanstraat 47, 2018 Antwerpen, Belgium 0456.612.553 SUBSIDIARY 100.00 2(87)
38 Jaguar Land Rover Holdings Limited, Abbey Road, Whitley, Coventry, CV3 4LF, England, UK 4019301UK SUBSIDIARY 100.00 2(87)
39 Jaguar Cars South Africa (Pty) Limited, Simon Vermooten Road Silverton, Pretoria 0184, South Africa NA SUBSIDIARY 100.00 2(87)
40 The Jaguar Collection Limited, Abbey Road, Whitley, Coventry, CV34LF - England, UK 2018432 SUBSIDIARY 100.00 2(87)
41 Jaguar Cars Limited Abbey Road, Whitley, Coventry, CV34LF - England, UK 1672067 SUBSIDIARY 100.00 2(87)
42 Land Rover Exports Limited, Abbey Road, Whitley, Coventry, CV34LF - England, UK 1596703 SUBSIDIARY 100.00 2(87)
43 Land Rover Ireland Limited, “C/o LK Shields Solicitors, 39/40 Upper Mount Street Dublin 2, Ireland 318198 SUBSIDIARY 100.00 2(87)
44 The Daimler Motor Company Limited, Abbey Road, Whitley, Coventry, CV34LF - England, UK 112569 SUBSIDIARY 100.00 2(87)
45 Daimler Transport Vehicles Limited, Abbey Road, Whitley, Coventry, CV34LF - England, UK 322903 SUBSIDIARY 100.00 2(87)
46 S.S. Cars Limited, Abbey Road, Whitley, Coventry, CV34LF - England, UK 333482 SUBSIDIARY 100.00 2(87)
47 The Lanchester Motor Company Limited, Abbey Road, Whitley, Coventry, CV34LF - England, UK 551579 SUBSIDIARY 100.00 2(87)
48 Shanghai Jaguar Land Rover Automotive Services Company Limited, Room E16, Floor 2, 477, Fute West 1st Road, Shanghai Free Trade Zone, PRC
310115400245293 SUBSIDIARY 100.00 2(87)
49 Jaguar Land Rover Pension Trustees Limited, Abbey Road, Whitley, Coventry, CV34LF, England, UK 4102133 SUBSIDIARY 100.00 2(87)
50 Jaguar Land Rover Singapore PTE Ltd, Level 30, Singapore Land Rover, Raffles Place, 048623, Singapore T13FC0063C SUBSIDIARY 100.00 2(87)
51 Jaguar Racing Limited, Abbey Road, Whitley, Coventry, CV3 4LF, England, UK 9983877 SUBSIDIARY 100.00 2(87)
52 InMotion Ventures Limited, Abbey Road, Whitley, Coventry, CV3 4LF, England, UK 10070632 SUBSIDIARY 100.00 2(87)
53 Jaguar Land Rover Slovakia s.r.o., Vysoka 2B, 811 06, Bratislava, Slovakia, 48 302 392 SUBSIDIARY 100.00 2(87)
54 InMotion Ventures 1 Limited (Incorporated w.e.f. October 25, 2016), Abbey Road, Whitley, Coventry, CV34LF, England, UK
10442527 SUBSIDIARY 100.00 2(87)
55 InMotion Ventures 2 Limited (Incorporated w.e.f. October 25, 2016), Abbey Road, Whitley, Coventry, CV34LF, England, UK
10444740 SUBSIDIARY 100.00 2(87)
56 InMotion Ventures 3 Limited (Incorporated w.e.f. October 25, 2016), Abbey Road, Whitley, Coventry, CV34LF, England, UK
10445044 SUBSIDIARY 100.00 2(87)
57 Jaguar Land Rover Colombia S.A.S (Incorporated w.e.f. August 22, 2016), CL 677735 OFE 1204 BOGOTAN CUNDINAMARKA 13192900
Tax ID No: 901.000.833.7 SUBSIDIARY 100.00 2(87)
58 Tata Daewoo Commercial Vehicle Co. Ltd., 172 Dongjangsan-ro, Gunsan-si, Joellabuk-do, 54006, Korea NA SUBSIDIARY 100.00 2(87)
59 Tata Daewoo Commercial Vehicle Sales and Distribution Co. Ltd., 4th floor, 272 Yeongdeung-ro, Yeongdeungpo-gu, Seoul 150 033, Korea
NA SUBSIDIARY 100.00 2(87)
60 Tata Motors (Thailand) Ltd., 199 Column Tower 20th Floor, Ratchadapisek Road, Klongtoey, Bangkok 10110 Thailand
NA SUBSIDIARY 95.28 2(87)

Corporate Overview Financial StatementsStatutory Reports
98 72nd Annual Report 2016-17
61 Tata Motors (SA) (Proprietary) Ltd., 39 Ferguson Road, Illova 2196 NA SUBSIDIARY 60.00 2(87)
62 PT Tata Motors Indonesia, Pondok Indah Office Tower 3 Suite 801-A, Jl Sultan Iskandar Muda Kav V-TA Pondok Pinang Kebayoran Lama, Jakarta 12130 the Republic of Indonesia
NA SUBSIDIARY 100.00 2(87)
63 PT Tata Motors Distribusi Indonesia, Pondok Indah Office Tower 3, Floor 8, Suite 801-B, Jl. Sultan Iskandar Muda Kav. V-TA, Pondok Pinang, Kebayoran Lama, Jakarta Selatan 12310, the Republic of Indonesia
NA SUBSIDIARY 100.00 2(87)
64 Tata Technologies Inc., 41050, W Eleven Mile Road, Novi, Michigan 48375, USA 476-730 SUBSIDIARY 72.37 2(87)
65 Tata Technologies de Mexico, S.A. de C.V. , Blvd. Independencia #1600 Ote., Local C-46 C.P. 27100 Torreon, Coahuila, Mexico
TTM-990127-V84-New Tax Regn NO
SUBSIDIARY 72.37 2(87)
66 Tata Technologies Pte Limited, 8 Shenton Way, #19-05 AXA Tower, Singapore 068811. 198100504W SUBSIDIARY 72.32 2(87)
67 Tata Technologies (Thailand) Limited, “889 Thai CC Tower, Room 108-9, 10th Floor, South Sathorn Road, Kwhaeng Yannawa, Khet Sathorn, Bangkok Metropolis 10120”
010554812171 SUBSIDIARY 72.32 2(87)
68 Tata Technologies Europe Limited, 2 Temple Back East, Temple Quay, Bristol BS1 6EG 2016440 SUBSIDIARY 72.32 2(87)
69 INCAT International Plc., 2 Temple Back East, Temple Quay, Bristol BS1 6EG 2377350 SUBSIDIARY 72.32 2(87)
70 INCAT GmbH, Breitwiesenstrasse 19, 70565 Stuttgart, Germany HRB18622 SUBSIDIARY 72.32 2(87)
71 Cambric Limited, “H & J Corporate Services, Ltd., Ocean Centre, Montagu Foreshore East Bay Street, P.O. Box SS-19084, Nassau, Bahamas”
Company No. 57500 SUBSIDIARY 72.32 2(87)
72 Tata Technologies SRL, “Brasov Office: Str Branduselor, No 84 Brasov, 500397, Romania Craiova Office: Str Iaon Maiorescu, No 10 Etaj 4 cam 405 Craiova, 200760, Romania, Iasi Office: 23, Calea Chisinau Street, First Floor, Tester Building, 700265 Iasi, Roma”
Registration Certificate No. B1766921
SUBSIDIARY 72.32 2(87)
73 Cambric GmbH, “Service Kontor, Universitat Geb A1 1, D-66123 Saarbrucken, Stuhlsatzenhausweg 69 Raum 130, 66123 Saarbrücken”
Entity Registration#:HR B14269
SUBSIDIARY 72.32 2(87)
74 Cambric UK Limited, Blick Rothenberg (BRAL) / UK, 16 Great Queen Street, Covent Garden, London, WC2B 5AH Company No. 06559783 SUBSIDIARY 72.32 2(87)
75 Midwest Managed Services Inc., 556 E. Broadway, #300, Salt Lake City, UT 84102 Utah Entity/File Number 8513733-0142
SUBSIDIARY 72.32 2(87)
76 Cambric Manufacturing Technologies (Shanghai) Co. Limited, (Change of name from Tata Manufacturing Technologies (Shanghai) Ltd w.e.f. February 22, 2017) 11F,Aurora plaza,99 Fucheng Rd,Room 1131, Shanghai 200120, China
310115400245293 SUBSIDIARY 72.32 2(87)
77 Tata Motors Finance Solutions Pvt. Ltd., C/o Tata Motors Finance Ltd., 10th floor, 106 A & B, Maker Chambers III, Nariman Point, Mumbai 400 021
U65910MH1992PTC187184 SUBSIDIARY 100.00 2(87)
78 TMNL Motor Services Nigeria Limited (Incorporated w.e.f. September 02, 2015), C/o. Tata Africa Services (Nigeria) Limited, Plot C89, Amuwo Odofin Industrial Layout, Lagos, Nigeria
Company Registration No: 1284940
SUBSIDIARY 100.00 2(87)
79 Jaguar Cars Finance Limited,135 Bishopsgate London EC2M 3UR 1731924 ASSOCIATE 49.90 2(6)
80 Automobile Corporation of Goa Limited, Plant I, Honda, Sattari, Goa 403530 L35911GA1980PLC000400 ASSOCIATE 47.19 2(6)
81 Nita Co Ltd., “1703, Sky Bhaban,195, Motljheel C/A, Dhaka, Dhaka - 1000, Bangladesh NA ASSOCIATE 40.00 2(6)
82 Tata Hitachi Construction Machinery Company Pvt. Ltd., Jubilee Building,45, Museum Road, Banglore, Karnataka, 560025
U85110KA1998PTC024588 ASSOCIATE 39.99 2(6)
83 Tata Precision Industries (India) Limited , Industrial Area No. 2, A.B. Road, Dewas, Madhya Pradesh, 455001 U29120MP1995PLC009773 ASSOCIATE 39.19 2(6)
84 Tata AutoComp Systems Limited, Bombay House, 24, Homi Mody street, Fort, Mumbai-400001 U34100MH1995PLC093733 ASSOCIATE 26.00 2(6)
85 Synaptiv Limited, 84 Kirakland Avenue, Ilford, Essex, England, IG50TN 10592914 ASSOCIATE 33.30 2(6)
86 Cloud Card Inc., 2771 Centerville Road, Suite 400, Wilmington, Country of New Castle, Delaware, 19808, USA 5052102 ASSOCIATE 34.00 2(6)
87 Tata Cummins Private Limited, Cummins Road, Telco Township, Jamshedpur 831 004, Jharkhand, India U34101JH1993PTC005546 JOINT OPERATIONS 50.00 2(6)
88 Fiat India Automobiles Pvt. Limited., Plot No. B 19, Ranjangaon MIDC Industrial Area, Ranjangaon, Taluka Shirur, District Pune - 412 220
U28900PN1997PTC130940 JOINT OPERATIONS 50.00 2(6)
89 Chery Jaguar Land Rover Automotive Company Limited, “Room 1102, Binjiang, International Plaza, No, 88 Tonggang Road, Changshu Economic and Technical Development Zone, Suzhou City, Jiangsu Province, China”
U93000KA2008PLC046588 JOINT VENTURE 50.00 2(6)
90 Chery Jaguar Land Rover Automotive Sales Company Limited, 6F, Binjiang International Plaza, No. 88 Tonggang Road, Changsu Economic and Technical Development Zone, Jiangsu Province, China
7535151 JOINT VENTURE 50.00 2(6)
91 TATA HAL Technologies Ltd., Venus Building, # 1/2 , Kalyanamantapa Road,Jakkasandra, Koramangala, 1st Block, Bangalore, Karnataka, 560034
U93000KA2008PLC046588 JOINT VENTURE 36.16 2(6)
92 Spark44 (JV) Ltd., Abbey Road, Whitley, Coventry, CV34LF - England NA JOINT VENTURE 50.00 2(6)
93 Spark44 Pty. Ltd. (Sydney), Level 5, 65 Berry Street, North Sydney, NSW 2060, Australia NA JOINT VENTURE 50.00 2(6)
94 Spark44 LLC (LA & NYC), 5870, West Jefferson Blvd, Studio H, Los Angeles, California, CA 90016, USA NA JOINT VENTURE 50.00 2(6)
95 Spark44 Limited (Shanghai), Unit 6401/6402 & 6501/6502, 436, Ju Men Road, Huangpu District, Shanghai 200023. China
NA JOINT VENTURE 50.00 2(6)
96 Spark44 Middle East DMCC (Dubai), Reef Tower, Office Unit 1001 Cluster O, Jumeriah Lake Towers, Dubai, UAE NA JOINT VENTURE 50.00 2(6)
97 Spark44 Demand Creation Partners Private Limited, Block A, Level 1, Shiv Sagar Estate, Dr Annie Besant Road, Worli, Mumbai City, Maharashtra-400018
U74999MH2015FTC269125 JOINT VENTURE 50.00 2(6)
98 Spark44 Limited (London & Birmingham), 5-23, Old Street, London EC1V 9HL, UK NA JOINT VENTURE 50.00 2(6)
99 Spark44 Pte Ltd (Singapore), Level 36, UOB Plaza 1, 80 Raffles Place, Singapore 048624, Singapore NA JOINT VENTURE 50.00 2(6)
100 Spark44 Communication SL (Madrid), Torres de Colon, Plaza de Colon 2, Planta 18, Madrid 28046, Spain NA JOINT VENTURE 50.00 2(6)

Notice Board’s Report Management Discussion & Analysis Corporate Governance Report Business Responsibility Report
99
IV. SHAREHOLDING PATTERN (Equity Share Capital Breakup as percentage of Total Equity): i) Category-wise Shareholding
Category of ShareholersNo.of Shares held at the beginning of the year .i.e
1.4.2016No.of Shares held at the end of the year .i.e
31.03.2017% Change
during the yearDemat Physical Total % of
Total Shares Demat Physical Total % of Total Shares
(i) A. Promoters(a) Individuals / Hindu Undivided Family 0 0 0 0.00 0 0 0 0.00 0.00(b) Central Government / State Governments(s) 0 0 0 0.00 0 0 0 0.00 0.00(c) Bodies Corporate 953,838,171 0 953,838,171 28.09 1,001,370,950 0 1,001,370,950 29.49 1.40(d) Financial Institutions / Banks 0 0 0 0.00 0 0 0 0.00 0.00(e) Any Other (Trust) 1,774,880 0 1,774,880 0.05 1,774,880 0 1,774,880 0.05 0.00
Sub-Total (A) (1) 955,613,051 0 955,613,051 28.14 1,003,145,830 0 1,003,145,830 29.54 1.40(2) Foreign(a) Individuals (Non-Resident Individuals / Foreign
Individuals)0 0 0 0.00 0 0 0 0.00 0.00
(b) Bodies Corporate 0 0 0 0.00 0 0 0 0.00 0.00(c) Institutions 0 0 0 0.00 0 0 0 0.00 0.00(d) Qualified Foreign Investor 0 0 0 0.00 0 0 0 0.00 0.00(e) Any Other (specify) 0 0 0 0.00 0 0 0 0.00 0.00
Sub-Total (A) (2)
Total Shareholding of Promoter and Promoter Group (A) 955,613,051 0 955,613,051 28.14 1,003,145,830 0 1,003,145,830 29.54 1.40(B) Public Shareholding(1) Institutions(a) Mutual Funds / UTI 307,930,776 88,730 308,019,506 9.07 279,632,280 88,730 279,721,010 8.24 -0.83(b) Financial Institutions / Banks 2,601,975 295,935 2,897,910 0.09 3,483,760 291,650 3,775,410 0.11 0.03(c) Cental Government / State Governments(s) 1,544,873 2,013,905 3,558,778 0.10 5,181,711 2,013,905 7,195,616 0.21 0.11(d) Venture Capital Funds 0 0 0 0.00 0 0 0 0.00 0.00
(e) Insurance Companies 399,498,437 1,550 399,499,987 11.76 310,951,228 1,550 310,952,778 9.16 -2.61(f ) Foreign Institutional Investors 599,026,628 43,375 599,070,003 17.64 118,366,247 43,375 118,409,622 3.49 -14.16(g) Foreign Venture Capital Investors 0 0 0 0.00 0 0 0 0.00 0.00(h) Qualified Foreign Investor 0 0 0 0.00 0 0 0 0.00 0.00(i) Any Other (specify)
(i-i) Foreign Portfolio Investors (Corporate) 309,771,223 0 309,771,223 9.12 833,787,950 0 833,787,950 24.55 15.43 (i-ii) Foreign Bodies - DR 6,741,794 6,741,794 0.20 6,231,611 0 6,231,611 0.18 -0.02 (i-iii) Foreign Nationals - DR 286,661 0 286,661 0.01 286,876 0 286,876 0.01 0.00 (i-iv) Foreign Institutional Investors - DR 3,878,624 0 3,878,624 0.11 321,226 0 321,226 0.01 -0.10 (i-v) LLP -DR 2,000 0 2,000 0.00 750 0 750 0.00 0.00
Sub-Total (B) (1) 1,631,282,991 2,443,495 1,633,726,486 48.11 1,558,243,639 2,439,210 1,560,682,849 45.96 -2.15(2) Non-Institutions(a) Bodies Corporate 22,914,690 645,195 23,559,885 0.69 17,710,637 537,735 18,248,372 0.54 -0.16(b) Individuals - 0.00 0.00i Individual shareholders holding nominal share
capital upto Rs. 1 lakh 190,908,566 25,811,585 216,720,151 6.38 184,406,963 24,606,744 209,013,707 6.15 -0.23
ii Individual shareholders holding nominal share capital in excess of Rs. 1 lakh
35,010,298 894,585 35,904,883 1.06 24,996,328 450,240 25,446,568 0.75 -0.31
(c) Qualified Foreign Investor 0 0 0 0.00 0 0 0 0.00 0.00(d) Any Other
(d-i) Non Resident Indians 11,657,684 2,819,998 14,477,682 0.43 11,546,286 2,670,770 14,217,056 0.42 (d-ii) Clearing Member 10,037,086 0 10,037,086 0.30 16,248,035 0 16,248,035 0.48 0.18 (d-iii) Trust 13,511,155 1,750 13,512,905 0.40 18,186,295 1,750 18,188,045 0.54 0.14 (d-iv) OCBs/Foreign Cos 0 490 490 0.00 0 490 490 0.00 0.00 (d-v) Foreign Corporate Bodies (including FDI) 163,487 0 163,487 0.00 163,487 0 163,487 0.00 0.00
Sub-Total (B) (2) 284,202,966 30,173,603 314,376,569 9.26 273,258,031 28,267,729 301,525,760 8.88 -0.37Total Public Shareholding (B) 1,915,485,957 32,617,098 1,948,103,055 57.37 1,831,501,670 30,706,939 1,862,208,609 54.84 -2.53
TOTAL (A)+(B) 2,871,099,008 32,617,098 2,903,716,106 85.51 2,834,647,500 30,706,939 2,865,354,439 84.38 -1.13(C) Shares held by Custodians and against which Depository Receipts have been issued(1) Promoter and Promoter Group(2) Public 491,943,200 21,000 491,964,200 14.49 530,475,530 20,750 530,496,280 15.62 1.13
GRAND TOTAL (A)+(B)+(C) 3,363,042,208 32,638,098 3,395,680,306 100.00 3,365,123,030 30,727,689 3,395,850,719 100.00 0.00
101 Spark44 SRL (Rome), Via Antonia Salandra 18, Rome 00187, Italy NA JOINT VENTURE 50.00 2(6)
102 Spark44 Limited (Seoul), 12th Floor, Cheonggye 11 Bldg., Chengyecheon-ro, Jongnogu, Seoul 110-726, Korea NA JOINT VENTURE 50.00 2(6)
103 Spark44 KK (Tokyo), 14th Floor, Kamiyacho Mt. Budilding, 4-3-20 Toranomon, Minato-Ku, Tokyo 105-0001, Japan NA JOINT VENTURE 50.00 2(6)
104 Spark44 Canada Inc (Toronto), 1235 Bay Street, 7th Floor, Toronto, Ontario, M5R 3K4, Canada NA JOINT VENTURE 50.00 2(6)
105 Spark44 GMBH (Frankfurt), Wildunger Strasse 6s, D-60487 Frankfurt am Main, Germany NA JOINT VENTURE 50.00 2(6)
106 JT Special Vehicles Private Limited (incorporated on July 13, 2017) Post Box. No. 1840, No. 2, Ondipudur Road, Singanallur, Coimbatore – 641005
U34102TZ2016PTC027770 JOINT VENTURE 50.00 2(6)

Corporate Overview Financial StatementsStatutory Reports
100 72nd Annual Report 2016-17
Sl. no Name of the Shareholder
Shareholding at the beginning of the year as on 01.04.2016
Date Reason
Increase/Decrease in Shareholding
Cumulative Shareholding during the year
No. of Shares % of total shares of the company
No. of Shares
% of total Shares of the company No. of Shares
% of total Shares of the
company1 Tata Sons Limited 781,076,151 23.00 781,076,151 23.00
23.09.2016 Sale of Shares -2,105,773 -0.06 778,970,378 22.9415.12.2016 Purchase of Shares 50,000,000 1.47 828,970,378 24.41
31.03.2017 At the end of the year - - 828,970,378 24.412 Tata Investment Corporation Ltd 10,961,448 0.34 - - 10,961,448 0.32
23.09.2016 Sale of Shares -361,448 -0.01 10,600,000 0.3131.03.2017 At the end of the year - - 10,600,000 0.31
3 Tata Chemicals Limited 1,966,294 0.06 1,966,294 0.0601.07.2016 Sale of Shares -1,966,294 -0.06 0 0.0001.07.2016 Purchase of Shares 1,966,294 0.06 1,966,294 0.06
31.03.2017 At the end of the year - - 1,966,294 0.064 Af-Taab Investment Company Ltd 408,181 0.01 408,181 0.01
29.04.2016 Sale of Shares -408,181 -0.01 0 0.0029.04.2016 Purchase of Shares 408,181 0.01 408,181 0.01
31.03.2017 At the end of the year - - 408,181 0.01
iii) Change in Promoter’s Shareholding (please specify,if there is no change)
Sl. no. Shareholder’s Name
Shareholding at the beginning of the year 1.4.2016 Shareholding at the end of the year 31.3.2017 % change in shareholding
during the yearNo.of Shares% of total
Shares of the company
% of Shares Pledged/encumbered to total
sharesNo.of Shares
% of total Shares of the
company
% of Shares Pledged/encumbered to total
shares1 Tata Sons Limited - Promoter 781,076,151 23.00 1.81 828,970,378 24.41 1.73 1.412 Tata Steel Limited 83,637,697 2.46 0.00 83,637,697 2.46 0.00 0.003 Tata Industries Limited 72,203,630 2.13 0.00 72,203,630 2.13 0.00 0.004 Tata Investment Corporation Ltd 10,961,448 0.32 0.00 10,600,000 0.31 0.00 -0.015 Ewart Investments Limited 3,525,187 0.10 0.00 3,525,187 0.10 0.00 0.006 Tata Chemicals Limited 1,966,294 0.06 0.00 1,966,294 0.06 0.00 0.007 Af-Taab Investment Company Ltd 408,181 0.01 0.00 408,181 0.01 0.00 0.008 Simto Investment Company Ltd 59,583 0.00 0.00 59,583 0.00 0.00 0.009 Sir Ratan Tata Trust 859,200 0.03 0.00 859,200 0.03 0.00 0.0010 Sir Dorabji Tata Trust 808,960 0.02 0.00 808,960 0.02 0.00 0.0011 J R D Tata Trust 105,280 0.00 0.00 105,280 0.00 0.00 0.0012 Lady Tata Memorial Trust 1,440 0.00 0.00 1,440 0.00 0.00 0.00
941,901,462 29.26 1.91 955,613,051 28.14 1.91 -1.12
iv) Shareholding Pattern of Top 10 Shareholders (Other than Directors, Promoters and Holders of GDRS and ADRs):
Sl. no Name of the ShareHolder
Shareholding at the beginning of the year as on 1.4.2016
Shareholding at the end of the year as on 31.3.2017
No of Shares % of total Shares of the Company
No of Shares % of total Shares of the Company
1 Life Insurance Corporation of India 199,144,257 5.86 199,144,257 5.862 Government Of Singapore 64,133,414 1.89 149,423,428 4.403 HDFC Trustee Company Limited-HDFC Equity Fund 84,216,364 2.48 67,367,492 1.984 Abu Dhabi Investment Authority 42,011,218 1.24 62,847,816 1.855 ICICI Prudential Life Insurance Company Ltd 67,362,172 1.98 50,686,594 1.496 Franklin Templeton Mutual Fund A/C Franklin India Prima Plus 36,079,591 1.06 46,398,243 1.377 Franklin Templeton Investment Funds 28,832,626 0.85 42,938,549 1.268 ICICI Prudential Value Fund 36,553,423 1.08 39,647,214 1.179 SBI-Etf Nifty 50 28,689,706 0.84 39,088,564 1.1510 Stichting Depositary APG Emerging Markets Equity Pool# 20,780,991 0.61 37,847,939 1.1111 Reliance Capital Trustee Co. Ltd A/C Reliance equity Opportunities Fund* 29,136,816 0.86 9,353,053 0.28
ii) Shareholding of Promoters (Including Promoter Group)
Notes:* ceased to be in the list of Top 10 as on 31.03.2017. The same is reflected above since the shareholder was one of the Top 10 shareholders on 01.04.2016.#Not in the list of Top 10 shareholders as on 01.04.2016. The same is reflected above since the shareholder is in the Top10 shareholder as on 31.03.2017.
Share holding of Top 10 is consolidated based on Permanent Account Number of the shareholder. The date wise increase or decrease in share holding of the Top 10 shareholdesgiving a break-up of Ordinary and ‘A’ Ordinary Shares bought and sold is available on the website of the Company www.tatamotors.com
Note: Entities listed from Sl. No. 2 to 12 above form part of the Promoter Group.
Note: i) Except for the above there is no change in the holding of Tata Steel Ltd, Tata Industries Ltd, Ewart Investment Ltd, Simto Investment Company Ltd, Sir Ratan Tata Trust, Sir Dorabji Tata Trust, J R D Tata Trust and Lady Tata Memorial Trust, Promoter Group during this Fiscal 2017.ii) Entities listed from Sl. No. 2 to 4 above form part of the Promoter Group.

Notice Board’s Report Management Discussion & Analysis Corporate Governance Report Business Responsibility Report
101
v) Shareholding of Directors and Key Managerial Personnel (including changes during the year):
Sl. no Name of the Shareholder
Shareholding at the beginning of the year as on
1.4.2016 Date Reason
Increase/Decrease in Shareholding
Cumulative Shareholding during the year
No. of Shares
% of total shares of the company
No. of Shares
% of total Shares of the company
No. of Shares
% of total Shares of the company
1 "Mr Cyrus Mistry (upto 19.12.2016)
15,855 0.00 15,855 0.00
- No change 0 0.00 15,855 0.002 Mr Nusli Wadia
(upto 22.12.2016)19.12.2016 - - 15,855 0.00
0 0.00 0 0.00
15.12.2016 Purchase of Shares 1,000 0.00 1,000 0.0022.12.2016 - - 1,000 0.00
3 Mr Ravindra Pisharody 50 0.00 50 0.0003.06.2016 Sale of Shares -50 0.00 0 0.00
31.03.2017 At year end - - 0 0.004 Mr Satish B Borwankar 0 0.00 0 0.00
15.12.2016 Purchase of Shares 500 0.00 500 0.0031.03.2017 At year end - - 500 0.00
5 Mr C Ramakrishnan, CFO 8,312 0.00 8,312 0.00 - No change 0 0.00 8,312 0.00
31.03.2017 At year end - - 8,312 0.006 Mr Hoshang K Sethna
(Company Secretary)3,766 0.00 3,766 0.00
- No change 0 0.00 3,766 0.0031.03.2017 At year end - - 3,766 0.00
V. INDEBTEDNESS Indebtedness of the Company including interest outstanding /accrued but not due for payment ` in Crores
Secured loan excluding deposits Unscured Loan Deposits Total Indebetness
Indebtedness at the beginning of the Fiscal 2017i) Principal Amount 3,520.65 12,098.88 0.00 15,619.53ii) Interest due but not paid 0.00 0.00 0.00 0.00iii) Interest accrued but not due 49.01 367.00 0.00 416.01Total (i+ii+iii) 3,569.66 12,465.88 0.00 16,035.54Change in Indebtedness during the Fiscal 2017• Addition 12,595.09 20,360.97 0.00 32,956.06• Reduction (13,712.03) (16285.17) 0.00 (29,997.20)Net Change (1,116.94) 4,075.80 0.00 2,958.86Indebtedness at the end of the Fiscal 2017i) Principal Amount 2,403.71 16,174.68 0.00 18,578.39ii) Interest due but not paid 0.00 0.00 0.00 0.00iii) Interest accrued but not due 48.81 397.29 0.00 446.10Total (i+ii+iii) 2,452.52 16,571.97 0.00 19,024.49
VI. REMUNERATION OF DIRECTORS AND KEY MANAGERIAL PERSONNEL A. Remuneration to Managing Director, Whole-time Directors and/or Manager:
Sl. No.
Particulars of Remuneration Name of MD/WTD/Manager Amount in (`)
Guenter Butschek* Ravindra Pisharody Satish B Borwankar1. Gross salary
(a) Salary as per provisions contained in section 17(1) of the Income-tax Act, 1961
142,707,059 23,686,531 23,408,663 189,802,253
(b) Value of perquisites u/s 17(2) Income-tax Act, 1961 12,878,121 4,842,511 1,145,289 18,865,921(c) Profits in lieu of salary under - - - -
2. Stock Option - - - - 3. Sweat Equity - - - -4. Commission - - - -
- as % of profit - - - -- others, specify… - - - -
5. Others, please specify - - - -Total (A) 155,585,180 28,529,042 24,553,952 208,668,174Ceiling as per Schedule V of the Act - 53,172,263 53,172,263
*Application for appointment and payment of remuneration has been made to the Central Government on 22-06-2016 and is pending approval. Being a managerial person functioning in a professional capacity as per circular of the Ministry of Corporate Affairs dated 12-9-2016, the ceiling under Schedule V is not applicable to him.#The above remuneration is as per Income Tax Act, 1961 and excludes contribution by the Company to Provident Fund and provisions for special retirement benefits etc. Further these amounts are paid to Managing Director and Whole Time Directors during the year

Corporate Overview Financial StatementsStatutory Reports
102 72nd Annual Report 2016-17
B. Remuneration to other directors:Amount in (`)
Sl. no. Particulars of Remuneration Name of Directors Total1. Independent Directors N N Wadia Dr Mashelkar N Munjee S Bhargava V K Jairath F Nayar• Fee for attending board/committee meetings 660,000 1,560,000 1,440,000 900,000 1,580,000 1,440,000 7,580,000
• Commission Nil Nil Nil Nil Nil Nil Nil
• Others, please specify Nil Nil Nil Nil Nil Nil Nil
Total (1) 660,000 1,560,000 1,440,000 900,000 1,580,000 1,440,000 7,580,0002. Other Non-Executive Directors C P Mistry Dr Speth N Chandrasekaran
• Fee for attending board/committee meetings 660,000 Nil 240,000 900,000
• Commission Nil Nil Nil Nil
• Others, please specify Nil Nil Nil Nil
Total (2) 660,000 Nil 240,000 900,000
Total (B)=(1+2) 8,480,000
Total Managerial Remuneration Nil
Overall Ceiling as per the Act Not Applicable as only sitting fees paid
* Mr Mistry resigned on December 19, 2016, Mr Wadia ceased to be a Director w.e.f. from December 22, 2016 and Mr N Chandrasekaran was appointed as Additional Director and Chairman on January 17, 2017
Amount in (`)
Sl. no. Particulars of Remuneration
Key Managerial PersonnelHoshang Sethna
Company SecretaryC Ramakrishan
Chief Financial OfficerTotal
1. Gross salary(a) Salary as per provisions contained in section 17(1) of the Income-tax Act, 1961 11,447,377 23,136,000 34,583,377(b) Value of perquisites u/s 17(2) Income-tax Act, 1961 263,098 1,715,407 1,978,505(c) Profits in lieu of salary under section 17(3) Income-tax Act, 1961 - - -
2. Stock Option - - -3. Sweat Equity - - -4. Commission - as % of profit or if any others, specify… - - -5. Others, please specify - - -
Total 11,710,475 24,851,407 36,561,882
C. Remuneration To Key Managerial Personnel Other Than MD / Manager / WTD:
VII. PENALTIES / PUNISHMENT/ COMPOUNDING OF OFFENCES:
There were no penalties/punishment/compounding of offences for the breach of any sections of Companies Act against the Company or its Directors or other officers in default, if any, during the year.
On behalf of the Board of DirectorsN CHANDRASEKARAN
Chairman(DIN: 00121863)
Mumbai, May 23, 2017

Notice Board’s Report Management Discussion & Analysis Corporate Governance Report Business Responsibility Report
103
A. CONSERVATION OF ENERGYThe Company has always been conscious of the need for conservation of energy and Energy Conservation (ENCON) projects are implemented at all the plants and offices of the Company in a planned and budgeted manner. Some of the major ENCON Perojects in Fiscal 2017 include:
(i) The steps taken or impact on conservation of energy:
Change over the direct heating process in joint sealant baking oven in paint shop.
Installation of LED lights for various applications areas like streetlights, vehicle storage pads, office and shop floor
Providing fans and blower instead of ASPs at TCF shops
Implementation of 3C1B process in Paint Shop
Change from soft starter to VFD for paint booth exhaust blowers
These efforts have resulted in electrical energy saving of 105.18 lakh kWh, fuel saving – Natural Gas 277 MT, Propane 159 MT. The whole effort resulted in cost savings for the Company of around 8.82 crores and annual CO2 emission reduction of 9,099 tCO2e.
(ii) The steps taken by the Company for utilizing alternate sources of energy:
The Company owns a ‘captive wind power’ project of 21.95 MW capacity. Pimpri Plant utilized Captive Wind Energy generation of 2.81 crore units (equivalent CO2e Reduction of 23,042 tCO2e). In Fiscal 2017, Pune Plant procured third party Wind Power of 2.65 crore units (equivalent to 21,730 tCO2e reduction), this resulted in net savings of `27.36 crores in electricity charges, whereas Sanand Plant, procured third party Wind Power of 1.25 crore units (equivalent to 10,269 tCO2e reduction) and Dharwad Plant, procured third party Wind Power of 0.27 crore units (equivalent to 2276 tCO2e reduction) in Fiscal 2017.
In Fiscal 2017, Pune Roof Top Solar PV Power Plant of 1.8MWp capacity, generated 0.27 crore Kwh (equivalent to 2236 tCO2e reduction) with net saving of `0.64 crores in electricity charges. Whilst Sanand Roof Top Solar PV Power Plant of 2.0MWp capacity, generated 0.28 crore Kwh (equivalent to 2327 tCO2e reduction), Lucknow and Dharwad Roof Top Solar PV Power Plant generated 26,678 and 6,580 kWh of power respectively.
Renewable Energy Certificate (REC): the Company 21.95MW Wind Power Project is registered under REC scheme. Auction of 9,493 RECs resulted in net saving of `1.4 crores for Fiscal 2017. Cumulative RECs generated 63,432 RECs out of which 50,010 RECs was sold through auction and cumulative benefit was `7.25 crores.
ANNEXURE 2
Particulars of Conservation of Energy, Technology Absorption and Foreign Exchange Earnings and Outgo [In terms of Section 134 (3) (m) of the Act read with Rule 8 of the Companies (Accounts) Rules, 2014, forms part of the Board’s Report for Fiscal 2017]
(iii) The capital investment on energy conservation equipments:
The Company has invested about `9.24 crores for achieving energy conservation results.
Award / Recognition received during the year is as below,
The Company’s Dharwad Plant received GreenCo “Gold Rating” and Lucknow Plant received CII GreenCo “Silver Rating”. GreenCo is a Factory based rating process, which uses 10 parameters to evaluate the energy and environmental performance.
The Company’s CVBU Pune Plant and Jamshedpur Plant was adjudged as “Excellent Energy Efficient Unit Award” at CII-National Award for Excellence in Energy Management - 2016, in Automobile Manufacturing category. The National Excellence in Energy Management Awards are given to industries of various sectors.
The Company’s PVBU Pune (Car Plant) won National Award for Excellence in Water Management 2016 and FICCI Water Award for Excellence in Water Management and Conservation in “Industrial Water Use Efficiency“.
On occasion of World Environment Day - 5th June 2016, Jharkhand State Pollution Control Board adjudged the Company’s Jamshedpur Plant First in industry category for Environmental Initiatives.
Jamshedpur Plant received CII-GreenCo Best Practices Award 2016 for its’ Innovative Project on “Water Conservation”
B. TECHNOLOGY ABSORPTION, ADAPTATION AND INNOVATION
(i) Efforts made towards technology absorption, adaptation and innovation
Presently automotive industry is facing unprecedented volatility in the technology environment coming from regulations, from emergence of new business models and the way in which the customer will access the future mobility solutions. The Company is working in technology domain of domains of xEVs, Hybrids and Fuel Cell in addition to technology upgrades on conventional IC engines to be able to meet regulations. The Company is also working on various other areas to support connected vehicles and creating value for customers which would make the vehicle offerings attractive. With an overarching theme to support all upcoming regulations and technology developments to support future products, the Company has a well-defined technology strategy.

Corporate Overview Financial StatementsStatutory Reports
104 72nd Annual Report 2016-17
To foster innovation, the Company is in process of setting up various innovation hubs that would be very lean and agile. These hubs themselves will operate in a startup mode with focus on testing of solutions and go-to-market strategies. The setting up of the first of these centers is already underway in the Silicon Valley (US) and UK.
For example of technology programs that the Company is concentrating on are:
Composites, light weighting and fuel efficiency improvement related technologies.
Combustion optimization and thermal efficiency improvement projects in collaboration with academia and consortia.
Alternate fuels technologies CNG, Dual fuel, Hydrogen.
Hybridization, xEVs and associated technologies.
Efficient engine cooling technology.
Advanced technologies for vehicle NVH refinement
Internet of things (IoT) and associated technologies on connectivity like Apps, telematics, diagnostics, analytics, etc.
(ii) Benefits derived as a result of the above efforts
The Company’s continued efforts in the technology domains is manifested by the market launch of products. In passenger cars, showcased Nexon and Tigor in Geneva International Motor Show 2017 and has launched 3 cars – Tiago, Hexa and Tigor – which received critical recognition from both customers and automotive media. In commercial vehicles, company has made good progress in Hybrid and Electric buses and is trying to secure tender based orders from relevant authorities. The Company also showcased its innovation project called Racemo which reinforces its efforts towards connected car and uses a patented Moflex MMS Structural Technology.
Major technology absorption undertaken during the last year includes:
Sr.
No.Technology For Status
1 Development of Connected car Technology and Cyber security Development in Progress
2 Development of Advanced Driver Assistance with 360 degree surround sense,
surround view and parking assist
Development in Progress
3 Moflex MMS Structural Technology Validation in progress
4 Development of ESP-Electronic Stability Program with Advanced Super Drive Modes
& State-of-the-art features
Implemented
5 Fuel Pump with Integrated Filter Technology for Increased Filter Life and Improved
Fuel Economy
Implemented
6 Hydrogen recirculation blower system for Fuel cell system Under implementation
7 Electric Trolley Bus system Development in progress
8 In-house development of parallel hybrid technology Implemented
9 Development of Advanced Driver Assistance Safety Systems LDWS, AEBS Testing in Progress
10 In house development and demonstration of parallel PHEV technology Development in Progress
11 Bring Your Own Device (BYOD) Proof of Concept is ready
12 Development of Automatic transmission on SUV platform Implemented
13 Reduced Cost of Ownership through development of fuel filter with pressure switch
on Nexon
Implemented
14 Software features such as cruise control, vehicle acceleration management, load based
speed control & gear down protection in M&HCV trucks
Implemented
15 Development of Ultra Electric Bus and electric drive train Implemented

Notice Board’s Report Management Discussion & Analysis Corporate Governance Report Business Responsibility Report
105
(iii) Major Technology Imports includes (preceding 3 financial years):
Sr.
No.Technology For Status
1 ESP (Electronic Stability Programme) for Xenon Euro V vehicle 2012-13 Implemented
2 Average Fuel Economy Display for HCV and LCV platform 2012-13 Implemented
3 A door seal pressure measurement rig 2014-15 Commissioned and being used
for new passenger vehicles
4 Synthetic road shells on a chassis dynamometer 2015-16 Implemented
5 A Noise Test Cell for engine and drivelines 2015-16 Implemented
6 Combustion analyser and knock sensors 2015-16 Implemented
7 Miniature shakers [from USA]—needed for Accurate Transfer Path Analysis
of vibrations of engine To vehicle-body
2016-17 Implemented
8 Master air flow calibration rig 2016-17 Implemented
9 Climatic chamber with gasoline emission facility 2016-17 Implemented
(iv) Research and Development
Particulars (` in crores)
Expenditure incurred on research and development: 2016-17 2015-16
(a) Revenue Expenditure - charged to Profit & Loss Statement 508.26 563.11
(b) Revenue Expenditure – capitalized 1,526.34 1,573.20
(c) Capital Expenditure 65.59 80.80
Total 2,100.18 2,217.11
Income from Operations 49,100.41 47,383.61
R&D cost as a % to Income from Operations 4.3% 4.7%
Specific areas in which R & D carried out by the Company
One of the main areas in which the Company’s R&D is carried out is to innovate technology solutions to create exciting products as per pre-defined business strategy. In addition to this, the Company also runs several innovation projects in the domains of light weighting, xEVs and Hybrids, Connected vehicles, ADAS features. While all its current products comply with the existing emission norms, the Company is gearing up to be ready with the upcoming BSVI regulations in India. Product competitiveness for the Company engines/vehicles is targeted through customer value propositions such as best-in-class fuel efficiency, superior performance, better total low cost of ownership, increased service interval, reduced downtime & turn-around time. Application specific technology selection & duty cycle based performance optimization are key enablers to achieve these goals. Enhanced fuel efficiency and thereby reduction in carbon footprint is planned to be achieved through various powertrain as well as vehicle level measures. The Company is investing significantly in development efforts, capital equipment and in infrastructure to meet BSVI requirements for all our products over next 2 to 3 years.
For example, some of the forward-looking R&D programs that the Company is concentrating on are:
M-Flex MMS Technology for modular car platform,
Next generation infotainment system with 6.5” TFT touch screen with advanced features like Google Android Auto, Apple Car Play, In-car voice alerts, premium acoustic experience with 8 speakers had been delivered for Osprey platform
Selective ADAS technologies for market specific implementation like Forward Collision Warning with Camera - Pedestrian, 2 Wheeler, 4 Wheeler detection (Day and Night detection), Seat Belt Reminder using ODS (Occupant Detection Sensor) sensor, etc.
Development of electro-viscous fan control on M&HCV trucks which improve fuel economy by reduced fan duty cycle.
Control systems for hybrid and electric buses
Development of indigenous Li-Ion battery packs for hybrid and electric buses
Enhancing the effectiveness of regenerative braking by optimally blending it with conventional brake systems

Corporate Overview Financial StatementsStatutory Reports
106 72nd Annual Report 2016-17
Indigenous development of fuel cell systems and accessories
Development of high efficiency motors and inverters
Benefits derived as a result of the above R&D
In Passenger Vehicles, the recently launched Hexa and Tigor passenger car received critical recognition from Media and customers for its attributes on design, connectivity, driving dynamics. These innovative products have unique design and offer unique ownership experience to customers. The Super Drive Modes system in Hexa offers seamless integration of vehicle engine performance, new generation Electronic Stability Program, torque on demand, and intuitive HMI. Switching between four drive modes - Auto, Comfort, Dynamic and Rough Road, provides enhanced ride comfort & stability over different terrains. The premium acoustic experience is introduced in Hexa and Tigor with ConnectNext Infotainment system along with ConnectNext apps suite to attract young minds.
In Commercial Vehicles, following benefits derived are encouraging:
Electric Driveline for various categories of commercial vehicles ranging from last mile passenger transport, mini, midi & large buses to support initiative of green and eco-friendly transport solution and reduce dependency on carbon based fuels.
Series Hybrid Bus with new generation 5L engine with advanced features for eco-friendly operation as well as best in class features for comfort and convenience of commuter especially elderly and physically challenged people.
Advanced automated manual transmission for Buses & Trucks for optimum fuel economy and ease of driving and fatigue reduction.
Advanced safety features such as collision mitigation, lane departure warning to improve the road safety.
Buses & Trucks to run on LNG as alternate fuel for increasing the fuel efficiency as well as spreading the use of alternate fuels.
During Fiscal 2017, the Company filed 80 Patent Applications and 52 Design applications. In respect of applications filed in earlier years, 22 Patents were granted and 26 Designs were registered. Both filing and grant details include national and international jurisdictions.
Future Plan of Action
The Company plan to continue its endeavor in the research and development space to develop technologies, skill sets and competencies that will help us meet future product portfolio requirements. One of the main future initiatives in this direction would be a platform approach of creating bills of material and bills of process that have a high degree of commonality to reduce complexity and enhance ability to the scale. Thus, Advance Modular Platform (AMP) is being developed as next generation, futuristic, scalable & modular platform wherein multiple segment products can be developed with improved economies of scale. This will also enable to reduce number of platform in the long run to make the business future ready, reduce
complexity and cut costs. In addition, the Company aims for timely and successful conclusion of technology projects to begin their induction into mainstream products, which will lead to a promising future product portfolio.
C. FOREIGN EXCHANGE EARNINGS & OUTGO
Activities relating to exports
The Company exported during the year 64,221 vehicles consisting of 60,184 commercial vehicles and 4,037 passenger vehicles.
Export initiatives such as goods, products and services exported include:
Commercial Vehicles
The Company participated in key motor shows and conclaves around the world such as the Bangkok Motor Show, Dhaka Automotive Show, Thailand Defence Expo.
Tata Prima successfully launched in two additional markets in Fiscal 2017, including Kingdom of Saudi Arabia and Bhutan. Launched the Ultra buses in Tanzania, Ultra Trucks in Kenya and Tanzania
CVIB conducted ‘Global Service Campaign’ in more than 40 countries from 21st to 23rd November, 2016 as a part of the enhancing the Customer Connect. The service campaign saw more than 15,000 customers being connected in 3 days.
Successfully bagged and executed orders for 553 distribution vehicles on the Xenon for the Malaysian Postal Services.
Successfully bagged orders from SOTRA, Ivory Coast for the supply of 537 buses and 25 support vehicles for the public transportation system in Abidjan.
The 3rd edition of the Company’s One World - International CV Distributor meet, was held at Grand Hyatt, Goa from 20th to 22nd March, 2017. This year’s event saw attendance by the Company’s Senior Management and over 300 guests from across 39 countries. This year’s edition of the T1 Racing in New Delhi, saw the participation of CVIB with it’s own team, One World Racing.
Passenger Vehicles
Tiago was launched in Nepal, the Nano AMT version was launched in Sri Lanka and Bangladesh.
The Company participated in the prestigious Geneva Motor Show in Switzerland for the 20th successive year where the TAMO sub-brand was displayed for the first time in an international arena. The first innovation from TAMO, the Racemo 2-setaer sports coupe, was showcased. The Company also participated in Nepal Automobile Dealers’ Association (NADA) Auto Show.
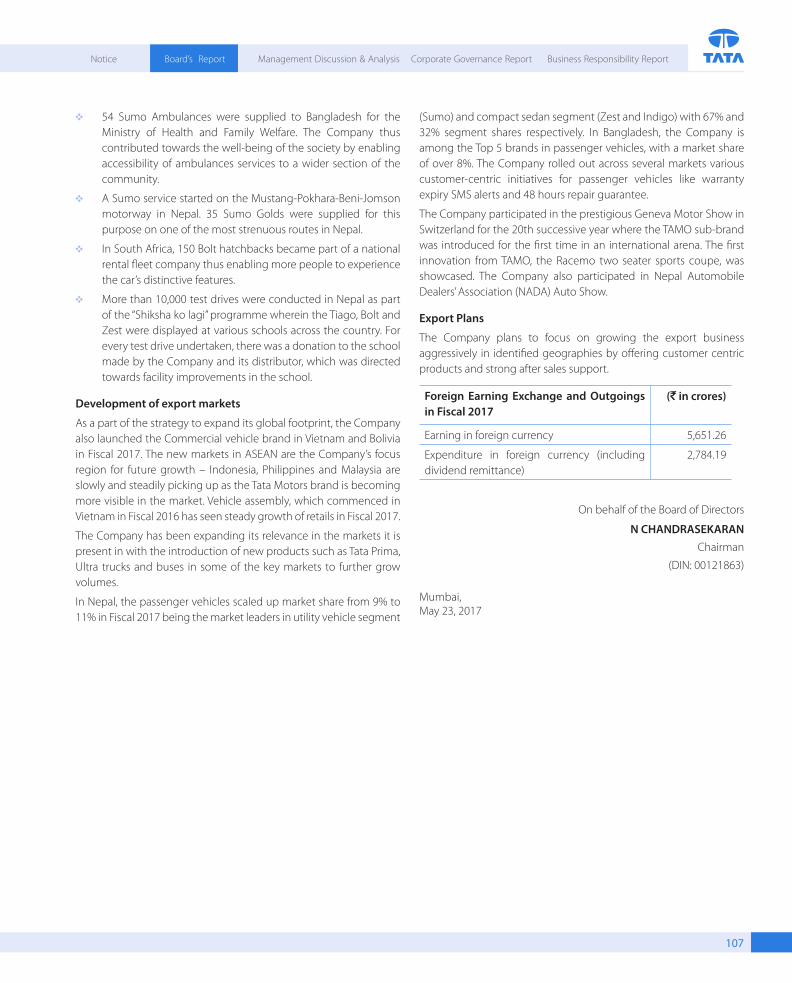
Notice Board’s Report Management Discussion & Analysis Corporate Governance Report Business Responsibility Report
107
54 Sumo Ambulances were supplied to Bangladesh for the Ministry of Health and Family Welfare. The Company thus contributed towards the well-being of the society by enabling accessibility of ambulances services to a wider section of the community.
A Sumo service started on the Mustang-Pokhara-Beni-Jomson motorway in Nepal. 35 Sumo Golds were supplied for this purpose on one of the most strenuous routes in Nepal.
In South Africa, 150 Bolt hatchbacks became part of a national rental fleet company thus enabling more people to experience the car’s distinctive features.
More than 10,000 test drives were conducted in Nepal as part of the “Shiksha ko lagi” programme wherein the Tiago, Bolt and Zest were displayed at various schools across the country. For every test drive undertaken, there was a donation to the school made by the Company and its distributor, which was directed towards facility improvements in the school.
Development of export markets
As a part of the strategy to expand its global footprint, the Company also launched the Commercial vehicle brand in Vietnam and Bolivia in Fiscal 2017. The new markets in ASEAN are the Company’s focus region for future growth – Indonesia, Philippines and Malaysia are slowly and steadily picking up as the Tata Motors brand is becoming more visible in the market. Vehicle assembly, which commenced in Vietnam in Fiscal 2016 has seen steady growth of retails in Fiscal 2017.
The Company has been expanding its relevance in the markets it is present in with the introduction of new products such as Tata Prima, Ultra trucks and buses in some of the key markets to further grow volumes.
In Nepal, the passenger vehicles scaled up market share from 9% to 11% in Fiscal 2017 being the market leaders in utility vehicle segment
(Sumo) and compact sedan segment (Zest and Indigo) with 67% and 32% segment shares respectively. In Bangladesh, the Company is among the Top 5 brands in passenger vehicles, with a market share of over 8%. The Company rolled out across several markets various customer-centric initiatives for passenger vehicles like warranty expiry SMS alerts and 48 hours repair guarantee.
The Company participated in the prestigious Geneva Motor Show in Switzerland for the 20th successive year where the TAMO sub-brand was introduced for the first time in an international arena. The first innovation from TAMO, the Racemo two seater sports coupe, was showcased. The Company also participated in Nepal Automobile Dealers’ Association (NADA) Auto Show.
Export Plans
The Company plans to focus on growing the export business aggressively in identified geographies by offering customer centric products and strong after sales support.
Foreign Earning Exchange and Outgoings in Fiscal 2017
(` in crores)
Earning in foreign currency 5,651.26
Expenditure in foreign currency (including dividend remittance)
2,784.19
On behalf of the Board of Directors
N CHANDRASEKARANChairman
(DIN: 00121863)
Mumbai, May 23, 2017

Corporate Overview Financial StatementsStatutory Reports
108 72nd Annual Report 2016-17
1. Definition of Independence A director will be considered as an “Independent Director” if
the person meets with the criteria for ‘Independent Director’ as laid down in the Act and Regulation 16 of the Securities and Exchange Board of India (Listing Obligations and Disclosure Requirements) Regulations, 2015 (“SEBI Listing Regulations”).
The definition of Independence as provided in the Act and Regulation 16 of SEBI Listing Regulations is as follows:
“An independent director in relation to a company, means a director other than a managing director or a whole-time director or a nominee director, —
(a) who, in the opinion of the Board, is a person of integrity and possesses relevant expertise and experience;
(b) (i) who is or was not a promoter of the company or its holding, subsidiary or associate company;
(ii) who is not related to promoters or directors in the company, its holding, subsidiary or associate company;
(c) who has or had no pecuniary relationship with the company, its holding, subsidiary or associate company, or their promoters, or directors, during the two immediately preceding financial years or during the current financial year;
(d) none of whose relatives has or had pecuniary relationship or transaction with the company, its holding, subsidiary or associate company, or their promoters, or directors, amounting to two per cent or more of its gross turnover or total income or fifty lakh rupees or such higher amount as may be prescribed, whichever is lower, during the two immediately preceding financial years or during the current financial year;
(e) who, neither himself nor any of his relatives—
(i) holds or has held the position of a key managerial personnel or is or has been employee of the company or its holding, subsidiary or associate company in any of the three financial years immediately preceding the financial year in which he is proposed to be appointed;
(ii) is or has been an employee or proprietor or a partner, in any of the three financial years immediately preceding the financial year in which he is proposed to be appointed, of—
(A) a firm of auditors or company secretaries in practice or cost auditors of the company or its holding, subsidiary or
associate company; or
(B) any legal or a consulting firm that has or had any transaction with the company, its holding, subsidiary or associate company amounting to ten per cent or more of the gross turnover of such firm;
(iii) holds together with his relatives two per cent or more of the total voting power of the company; or
(iv) is a Chief Executive or director, by whatever name called, of any non-profit organisation that receives twenty-five percent or more of its receipts from the company, any of its promoters, directors or its holding, subsidiary or associate company or that holds two per cent. or more of the total voting power of the company;
(v) is a material supplier, service provider or customer or a lessor or lessee of the company;
(vi) who is not less than 21 years of age.
Current and ex-employees of a Tata company may be considered as independent only if he/ she has or had no pecuniary relationship with any Tata company (due to employment/ receipt of monthly pension by way of Special Retirement Benefits/ holding consultant or advisor positions) during the two immediately preceding financial years or during the current financial year.
2. Qualifications of Directors Boards will ensure that a transparent board nomination process
is in place that encourages diversity of thought, experience, knowledge, perspective, age and gender.
It is expected that boards have an appropriate blend of functional and industry expertise.
While recommending appointment of a director, it is expected that the Nomination and Remuneration Committee (“NRC”) consider the manner in which the function and domain expertise of the individual contributes to the overall skill-domain mix of the Board.
Independent Directors (“ID”) ideally should be thought/ practice leaders in their respective functions/ domains.
3. Positive attributes of Directors
Directors are expected to comply with duties as provided in the Act. For reference, the duties of the Directors as provided by the Act are as follows:
1) Act in accordance with the articles of the company.
2) Act in good faith in order to promote the objects of the
ANNEXURE - 3 Criteria for Determining Qualifications, Positive Attributes and Independence of a Director
[Pursuant to Section 178 (3) of the Companies Act, 2013 and Regulation 16 read along with Schedule II of the SEBI Listing Regulations]

Notice Board’s Report Management Discussion & Analysis Corporate Governance Report Business Responsibility Report
109
company for the benefit of its members as a whole, and in the best interests of the company, its employees, the shareholders, the community and for the protection of environment.
3) Exercise duties with due and reasonable care, skill and diligence and exercise independent judgment.
4) Not be involved in a situation in which he may have a direct or indirect interest that conflicts, or possibly may conflict, with the interest of the company.
5) Not achieve or attempt to achieve any undue gain or advantage either to himself or to his relatives, partners, or associates.
6) Not assign his office.”
Additionally, the Directors on the Board of a Tata Company are also expected to demonstrate high standards of ethical behaviour, strong interpersonal and communication skills and soundness of judgment.
IDs are also expected to abide by the ‘Code for Independent Directors’ as outlined in Schedule IV to section 149(8) of the Act. The Code specifies the guidelines of professional conduct, role and function and duties of Independent Directors. The guidelines of professional conduct specified in the Code are as follows:
“An independent director shall:
1) uphold ethical standards of integrity and probity;
2) act objectively and constructively while exercising his duties;
3) exercise his responsibilities in a bona fide manner in the interest of the company;
4) devote sufficient time and attention to his professional obligations for informed and balanced decision making;
5) not allow any extraneous considerations that will vitiate his exercise of objective independent judgment in the paramount interest of the company as a whole, while concurring in or dissenting from the collective judgment of the Board in its decision making;
6) not abuse his position to the detriment of the company or its shareholders or for the purpose of gaining direct or indirect personal advantage or advantage for any associated person;
7) refrain from any action that would lead to loss of his independence;
8) where circumstances arise which make an independent director lose his independence, the independent director must immediately inform the Board accordingly;
9) assist the company in implementing the best corporate governance practices.”
On behalf of the Board of Directors
N CHANDRASEKARANChairman
(DIN: 00121863)
Mumbai, May 23, 2017

Corporate Overview Financial StatementsStatutory Reports
110 72nd Annual Report 2016-17
ANNEXURE - 4 Remuneration policy for Directors, Key Managerial Personnel and other employees
[Pursuant to Section 178(3) of the Companies Act,2013 and Regulation 19 read along with Schedule II of the SEBI Listing Regulations]
The philosophy for remuneration of directors, Key Managerial Personnel (“KMP”) and all other employees of Tata Motors Limited (“the Company”) is based on the commitment of fostering a culture of leadership with trust. The remuneration policy is aligned to this philosophy.
This remuneration policy has been prepared pursuant to the provisions of Section 178(3) of the Companies Act, 2013 (“Act”) and Regulation 19 read with Part D of Schedule II of the Securities and Exchange Board of India (Listing Obligations and Disclosure Requirements) Regulations, 2015 (Listing Regulations). In case of any inconsistency between the provisions of law and this remuneration policy, the provisions of the law shall prevail and the Company shall abide by the applicable law. While formulating this policy, the Nomination and Remuneration Committee (“NRC”) has considered the factors laid down under Section 178(4) of the Act, which are as under:
“(a) the level and composition of remuneration is reasonable and sufficient to attract, retain and motivate directors of the quality required to run the company successfully;
(b) relationship of remuneration to performance is clear and meets appropriate performance benchmarks; and
(c) remuneration to directors, key managerial personnel and senior management involves a balance between fixed and incentive pay reflecting short and long-term performance objectives appropriate to the working of the company and its goals”
Key principles governing this remuneration policy are as follows:
Remuneration for Independent Directors and Non-Independent Non- Executive Directors
• Independent directors (“ID”) and non-independent non-executive directors (“NED”) may be paid sitting fees (for attending the meetings of the Board and of committees of which they may be members) and commission within regulatory limits.
• Within the parameters prescribed by law, the payment of sitting fees and commission will be recommended by the NRC and approved by the Board.
• Overall remuneration (sitting fees and commission) should be reasonable and sufficient to attract, retain and motivate directors aligned to the requirements of the company (taking into consideration the challenges faced by the company and its
future growth imperatives).
• Overall remuneration should be reflective of size of the company, complexity of the sector/industry/Company’s operations and the Company’s capacity to pay the remuneration.
• Overall remuneration practices should be consistent with recognized best practices.
• Quantum of sitting fees may be subject to review on a periodic basis, as required.
• The aggregate commission payable to all the NEDs and IDs will be recommended by the NRC to the Board based on Company performance, profits, return to investors, shareholder value creation and any other significant qualitative parameters as may be decided by the Board.
• The NRC will recommend to the Board the quantum of commission for each director based upon the outcome of the evaluation process which is driven by various factors including attendance and time spent in the Board and committee meetings, individual contributions at the meetings and contributions made by directors other than in meetings.
• In addition to the sitting fees and commission, the Company may pay to any director such fair and reasonable expenditure, as may have been incurred by the director while performing his/her role as a director of the Company. This could include reasonable expenditure incurred by the director for attending Board/Board committee meetings, general meetings, court convened meetings, meetings with shareholders/creditors/management, site visits, induction and training (organized by the Company for directors) and in obtaining professional advice from independent advisors in the furtherance of his/her duties as a director.
Remuneration for Managing Director (“MD”)/Executive Directors (“ED”)/KMP/ rest of the employees1
The extent of overall remuneration should be sufficient to attract and retain talented and qualified individuals suitable for every role. Hence remuneration should be
• Market competitive (market for every role is defined as companies from which the Company attracts talent or companies to which the Company loses talent)
• Driven by the role played by the individual,
• Reflective of size of the Company, complexity of the sector/industry/Company’s operations and the Company’s capacity to pay,
1 Excludes employees covered by any long term settlements or specific term contracts. The remuneration for these employees would be driven by the respective long term settlements or contracts.

Notice Board’s Report Management Discussion & Analysis Corporate Governance Report Business Responsibility Report
111
• Consistent with recognized best practices and
• Aligned to any regulatory requirements.
• In terms of remuneration mix or composition,
- The remuneration mix for the MD/EDs is as per the contract approved by the shareholders. In case of any change, the same would require the approval of the shareholders.
- Basic/ fixed salary is provided to all employees to ensure that there is a steady income in line with their skills and experience.
- In addition to the basic/ fixed salary, the Company provides employees with certain perquisites, allowances and benefits to enable a certain level of lifestyle and to offer scope for savings and tax optimization, where possible. The Company also provides all employees with a social security net (subject to limits) by covering medical expenses and hospitalization through re-imbursements or insurance cover and accidental death and dismemberment through personal accident insurance.
- The Company provides retirement benefits as applicable.
- In addition to the basic/ fixed salary, benefits, perquisites and allowances as provided above, the Company provides MD/EDs such remuneration by way of commission, calculated with reference to the net profits of the Company in a particular financial year, as may be determined by the Board, subject to the overall ceilings stipulated in Section 197 of the Act. The specific amount payable to the MD/EDs would be based on performance as evaluated by the Board or the NRC and approved by the Board.2
- [In addition to the basic/ fixed salary, benefits, perquisites and allowances as provided above, the Company provides MD/EDs such remuneration by way of an annual incentive remuneration/ performance linked bonus subject to the achievement of certain performance criteria and such other parameters as may be considered appropriate from time to time by the Board. An indicative list of factors that may be considered for determination of the extent of this component are:
- Company performance on certain defined qualitative and quantitative parameters as may be decided by the Board from time to time,
- Industry benchmarks of remuneration,
- Performance of the individual.3
- The Company provides the rest of the employees a
performance linked bonus. The performance linked bonus would be driven by the outcome of the performance appraisal process and the performance of the Company.
Remuneration payable to Director for services rendered in other capacity
The remuneration payable to the Directors shall be inclusive of any remuneration payable for services rendered by such director in any other capacity unless:
a) The services rendered are of a professional nature; and
b) The NRC is of the opinion that the director possesses requisite qualification for the practice of the profession.
Policy implementation The NRC is responsible for recommending the remuneration
policy to the Board. The Board is responsible for approving and overseeing implementation of the remuneration policy.
On behalf of the Board of Directors
N CHANDRASEKARANChairman
(DIN: 00121863)
Mumbai, May 23, 2017
2 to be retained if commission is provided to MD/EDs3 to be retained only if commission is not provided to MD/EDs

Corporate Overview Financial StatementsStatutory Reports
112 72nd Annual Report 2016-17
ANNEXURE 5Details of Remuneration of Directors, KMPs and Employees and comparatives
[Pursuant to Section 197 and Rule 5(1) of the companies (Appointment and Remuneration of Managerial Remuneration) Rule, 2014]
1. a. The ratio of the remuneration of each Director to the median remuneration of the employees of the Company for the financial year and the percentage increase in remuneration of each Director, Chief Executive Officer, Chief Financial Officer and Company Secretary in the Fiscal 2017:
Sr. No. Names of Directors DesignationRemuneration
(` in lakhs)Ratio of Directors
remuneration% increase in the
remuneration
(I) Non-Executive Directors
1 Mr Cyrus Mistry(1) Chairman - NED 6.60 0.99 -28%2 Mr Natarajan Chandrasekaran(2) Chairman - NED 2.40 0.36 -3 Mr N N Wadia(3) Independent Director 6.60 0.99 -23%4 Dr R A Mashelkar Independent Director 15.60 2.34 47%5 Mr N Munjee Independent Director 14.40 2.16 27%6 Mr S Bhargava(4) Independent Director 9.00 1.35 5%7 Mr V K Jairath Independent Director 15.80 2.37 45%8 Ms Falguni Nayar Independent Director 14.40 2.16 41%9 Dr Ralf Speth(5) Non-Executive Director -- -- --(II) Whole-time Directors
10 Mr Guenter Butschek(6) CEO and Managing Director 2,255.15 338.61 -
11 Mr Ravi Pisharody Executive Director 230.95 45.94 -17%
12 Mr Satish Borwankar Executive Director 214.66 40.34 -12%
(III) Key Managerial Personnel
1 Mr C Ramakrishnan Chief Financial Officer 409.94 61.55 -2%
2 Mr Hoshang Sethna Company Secretary 122.49 18.39 -6%
Notes:(1) Resigned with effect from December 19, 2016(2) Appointed with effect from January 17, 2017, hence the % increase in the remuneration is not comparable.(3) Removed with effect from December 22, 2016(4) Retired with effect from March 29, 2017(5) Dr Ralf Speth is a Non-Executive Director and is not paid any commission or sitting fees for attending Board meetings of the Company in view of his appointment as Chief Executive Officer and Director of Jaguar Land Rover Automative PLC.(6) Mr Guenter Butschek joined on 15th February 2016 hence % increase in the remuneration is not comparable
b. A break-up of median remuneration of employees is given below:
Employee Group Median remuneration (` in Lakhs) Increase in the median remuneration [in (%)]
White Collar - 9.72 - 7.92EG 37.95 - 5.50 -TM 11.85 - 15.12 -SUP 6.74 - 8.86 -Blue Collar - 4.76 - 1.89Total employees - 66.6
The Median Remuneration of employees for the Fiscal year 2017 is ` 6.66 Lakhs
2. The number of permanent employees on the rolls of Company as at March 31, 2017: 26,035
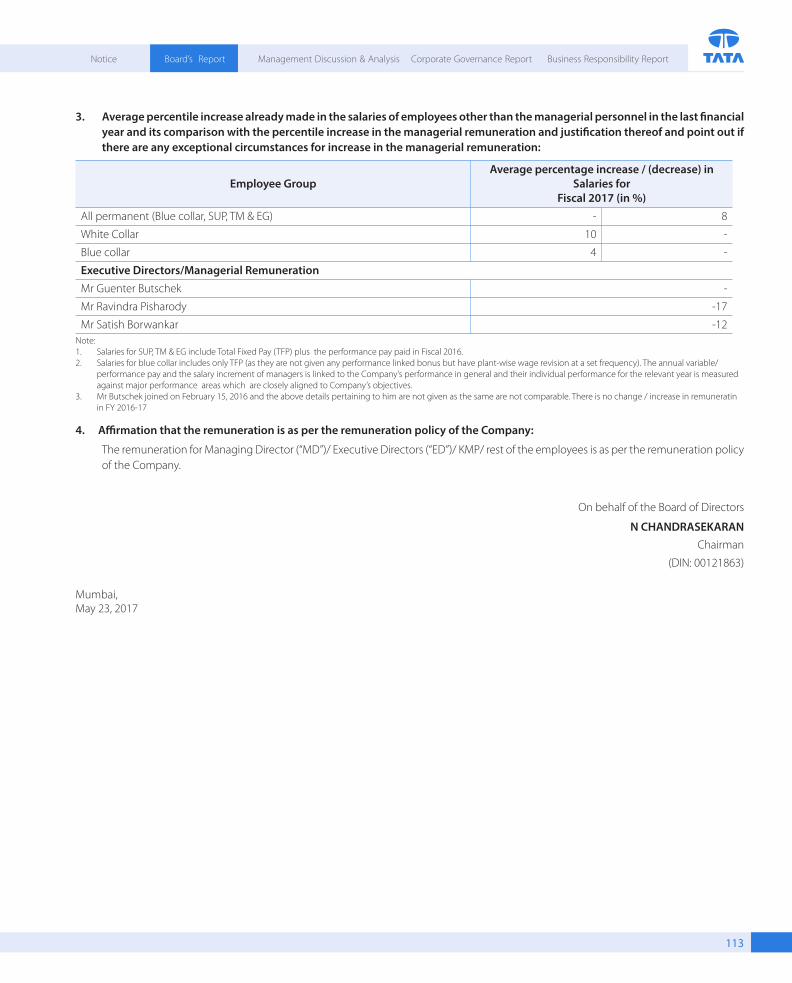
Notice Board’s Report Management Discussion & Analysis Corporate Governance Report Business Responsibility Report
113
3. Average percentile increase already made in the salaries of employees other than the managerial personnel in the last financial year and its comparison with the percentile increase in the managerial remuneration and justification thereof and point out if there are any exceptional circumstances for increase in the managerial remuneration:
Employee GroupAverage percentage increase / (decrease) in
Salaries for Fiscal 2017 (in %)
All permanent (Blue collar, SUP, TM & EG) - 8
White Collar 10 -
Blue collar 4 -
Executive Directors/Managerial RemunerationMr Guenter Butschek -
Mr Ravindra Pisharody -17
Mr Satish Borwankar -12Note:1. Salaries for SUP, TM & EG include Total Fixed Pay (TFP) plus the performance pay paid in Fiscal 2016.2. Salaries for blue collar includes only TFP (as they are not given any performance linked bonus but have plant-wise wage revision at a set frequency). The annual variable/
performance pay and the salary increment of managers is linked to the Company’s performance in general and their individual performance for the relevant year is measured against major performance areas which are closely aligned to Company’s objectives.
3. Mr Butschek joined on February 15, 2016 and the above details pertaining to him are not given as the same are not comparable. There is no change / increase in remuneratin in FY 2016-17
4. Affirmation that the remuneration is as per the remuneration policy of the Company:
The remuneration for Managing Director (“MD”)/ Executive Directors (“ED”)/ KMP/ rest of the employees is as per the remuneration policy of the Company.
On behalf of the Board of Directors
N CHANDRASEKARANChairman
(DIN: 00121863)
Mumbai, May 23, 2017

Corporate Overview Financial StatementsStatutory Reports
114 72nd Annual Report 2016-17
ANNEXURE - 6 Annual Report on CSR Activities
[Pursuant to Section 135 of the Companies Act, 2013 and the Companies (Corporate Social Responsibility Policy) Rule 2014]
A brief outline of the Company’s CSR policy, including an overview of projects or programmes proposed to be undertaking and a reference to the web-link to the CSR Policy and projects or programmes:
1. Overview:
(i) Outline of CSR Policy - As an integral part of the Company’s commitment to good corporate citizenship, the Company believe in actively assisting in improvement of the quality of life of people in communities, giving preference to local areas around the Company’s business operations. Towards achieving long-term stakeholder value creation, the Company shall always continue to respect the interests of and be responsive towards its key stakeholders - the communities, especially those from socially and economically backward groups, the underprivileged and marginalized; focused on inter alia the Scheduled Castes and Scheduled Tribes, and the society at large. In order to leverage the demographic dividend of its country, Company’s CSR efforts shall focus on Health, Education, Environment and Employability interventions for relevant target groups, ensuring diversity and giving preference to needy and deserving communities inhabiting urban India. CSR at the Company shall be underpinned by ‘More from Less for More People’ philosophy, which implies striving to achieve greater impacts, outcomes and outputs of its CSR projects and programmes by judicious investment and utilization of financial and human resources, engaging in like-minded stakeholder partnerships for higher outreach benefitting more lives.
Weblink for Tata Motors India CSR Policy: http://www. tatamotors.com/investors/pdf/csr-policy-16-17.pdf
(ii) CSR Projects: 1. Aarogya (Health): Addressing child malnutrition; health awareness for females; preventive and curative health services, drinking water projects; 2. Vidyadhanam (Education): Scholarships; Special coaching classes for secondary school students; IIT-JEE & competitive exams coaching, school infrastructure improvement; co-curricular activities; financial aid to engineering students; 3. Kaushalya (Employability): Divers training – novice and refresher; ITI partnership and allied-auto trades; Motor Mechanic Vehicle (MMV); training in retail, hospitality, white goods repair, agriculture and allied trades; 4. Vasundhara (Environment): Tree plantation, environmental awareness for school students.
2. Composition of CSR Committee: The CSR Committee of the Board of Tata Motors comprises (i) Dr Raghunath A. Mashelkar, Non-Executive, Independent Director [Chairman of the
Committee]; (ii) Mr Guenter Butschek, CEO & Managing Director, (iii) Mr Satish B. Borwankar, Executive Director (Quality) and (iv) Ms Falguni S. Nayar, Non-Executive, Independent Director. Mr. Ravindra Pisharody, Executive Director (Commercial Vehicles) and Mr Mayank Pareek, President (Passenger Vehicle) also attends the Committee meetings.
3. Average Net Profit of the Company for last three financial years:
Loss of `2,337 crores
4. *Prescribed CSR Expenditure (two per cent. of the amount as in item 3 above):
Not applicable in view of the loss.
5. *Details of CSR Spend during the financial year:
25.94 crores was spent towards various schemes of CSR as prescribed under Section 135 of the Act. The prescribed CSR expenditure required to be spend in Fiscal 2017 as per the Act is Nil, in view of net profit of the Company being negative under Section 198 of the Act.
(a) Total amount to be spent for the financial year: Not applicable
(b) Amount unspent, if any: Not applicable
(c) Manner in which the amount spent during the financial year: Refer Table in Annexure-A
6. In case the company has failed to spend the two per cent of the average net profit of the last three financial years or any part thereof, the company shall provide the reasons for not spending the amount: Not Applicable
7. Responsibility Statement of CSR Committee of Board: The CSR Committee of the Company’s Board states that the implementation and monitoring of CSR Policy, is in compliance with CSR objectives and Policy of the Company. The Company had engaged M/s KPMG India (Registered) for assurance on CSR spend by the Company under Section 135 of the Act, Schedule VII.
Guenter Butschek CEO & Managing Director(DIN:07427375)
Dr. Raghunath A. Mashelkar Non-Executive, Independent Director (Chairman CSR Committee)(DIN: 00074119)
Mumbai, May 23, 2017

Notice Board’s Report Management Discussion & Analysis Corporate Governance Report Business Responsibility Report
115
Annexure-A
Sr.
No.
#
CSR project / activity
identified
Sector in which the Project is covered
Projects /Programmes
1. Local area/ others
2. Specify the state and district where projects or programs were undertaken
Amount outlay
(budget) project/ programs
wise
Amount spent on the project /
programs Subheads
Cumulative spend up to the
reporting period Cumulative
spend up to the reporting period
Amount spent: Direct /through implementing
agency*
(` in crores)
Direct Overhead*
Skill Development and vocational skills in Automotive and Non-Automotive Sector
Employability EnhancingSkill Development
1. Local Area2. Jharkand - East Singhbum;Uttar Pradesh - Lucknow and Barbanki; Uttarakhand - Udham Singh Nagar and Nainital;Maharashtra - Nasik, Aurangabad, Amravati, Nagpur, Pune, Mumbai, Kalyan, Palghar, Thane; Gujarat - Ahmedabad; Karnataka - Dharwad;Pan India
6.71 6.44 0.34 6.78 Direct = 1.19ImplementationAgency = 5.59
2 Promoting primary and secondary education in Rural and Socially/ Economically Backward communities
Promoting Education
1. Local Area2. Jharkand - East Singhbum;Uttar Pradesh - Lucknow and Barbanki; Uttarakhand - Udham Singh Nagar, Nainital;Maharashtra - Thane, Pune, Mumbai, Navi Mumbai, Ratnagiri, Valsad; Madhya Pradesh - Jabalpur;Chhattisgarh - Bilaspur; Gujarat - Ahmedabad, Rajkot; Karnataka - Dharwad, Mangalore, Dakshin Kannada; Assam - Silchar; Nagaland - Dimapur;Punjab - Muktsar;
12.93 12.58 0.39 12.97 Direct = 0.13ImplementationAgency = 12.84
3 Preventive and curative health services in Communities
Eradicating Hunger, Promoting preventive healthcare, Malnutrition, Promoting Preventive
1. Local Area2. Jharkand - East Singhbum; Uttar Pradesh - Lucknow and Barbanki; Uttarakhand - Udham Singh Nagar; Maharashtra - Pune, Mumbai, Palghar; Gujarat - Ahmedabad; Pan India
4.24 3.74 0.50 4.24 Direct =0.06ImplementationAgency = 4.18
4 Ensuring environmental sustainability through awareness and protection of natural habitats
Ensuring environmental sustainability
1. Local Area2. Jharkand - East Singhbum;Uttar Pradesh - Lucknow and Barbanki; Uttarakhand - Udham Singh Nagar, Nainital;Maharashtra - Pune, Palghar, Mumbai; Gujarat - Ahmedabad; Karnataka - Dharwad;
1.32 1.12 0.21 1.32 Direct =0.001ImplementationAgency = 1.32
5 Rural Development
Rural development projects
1. Local Area2. Maharashtra – Palghar
0.15 0.15 0.01 0.15 ImplementationAgency =0.15
Administrative overheads and Capacity Building cost 0.45 0.43 0.02 0.45
Total 25.82 24.46 1.47 25.94
#1 : Employability: Gram Vikas Kendra, Vikas Samity, Samaj Vikas Kendra, MITCON Foundation, Sambhav Foundation, Shashwat, Vigyan Ashram, CII, Vruksha, Sanand Education Trust, Saath Charitable Trust, Indian Academy for Self Employed Women, Centum Foundation, Pratham Education Foundation, Institute of Social Development, Paryavaran Evam Jan Kalyan Samiti, Vedanta Foundation, Ramakrishna Mission, Skills for Progress, Prasad Chikitsa, College of Social Work Nirmala Niketan, A B Trust, BAIF Institute for Sustainable Livelihood & Development
#2: Education: Shiksha Prasar Kendra, Nav Jagrat Manav Samaj, Gram Vikas Kendra, Vikas Samity, Samaj Vikas Kendra, Swaroopwardhinee, Suprabhat Mahila Mandal, Samata Shikshan Sanstha, Seva Sahyog Foundation, College of Engineering Pune, Vidya Poshak, Swami Vivekanand Youth Movement, Ganatar, Manav Seva Education & charitable trust, Catholic Church Sanand, Prayas Organisation for Sustainable Development, Institute of Social Development, Moinee Foundation, Paryavaran Evam Jan Kalyan Samiti, Jainarayan Charitable Trust, Arror Sripathy Rao Memorial Foundation, Prasad Chikitsa, Society for Human and Environmental Development (SHED), IDTR Pune, NATRIP Silcher, SIADS Mahuana, Tata Institute of Social Sciences, Global Education Trust, Urmee Charitable Trust, Indian Institute of Technology Bombay Alumni Association, Indian Institute of Technology Gandhinagar, Avanti Fellows, Children’s Movement for Civic Awareness, Vasundhara Public Charitable Trust, Agastya International Foundation, Sri Sarada Math,
#3 Health: Parivar Kalyan Sansthan, Nav Jagrat Manav Samaj, Vikas Samity, Jan Parivar Kalyan Sansthan, VBDS, Sneh Foundation, Snehdeep Jankalyan Foundation, Sneh Foundation, Manav Seva Education & charitable trust, Our Lady of Pillar “Kalol” Trust, Namaste Life Health Care Foundation, Institute of Social Development, Prasad Chikitsa, Lokmanya Tilak Hospital Silver Jubilee Research Foundation, Ramakrishna Mission, Impact India Foundation, College of Social Work Nirmala Niketan, Sumant Moolgaokar Development Foundation, Swadhar,I.D.W.C. Pune, Sterling Multi Speciality Hospital
#4 Environment: Gram Vikas Kendra, Vikas Samity, Samaj Vikas Kendra, Terre Policy Centre, Green Thumb, Wildlife Research and Conservation Society, Bansilal Ramnath Agarwal Charitable Trust, Shashwat Eco Solutions Foundation, Manav Seva Education & charitable trust, SUVIDHA, College of Social Work Nirmala Niketan, Bombay Natural History Society, Shree Nityananda Education Trust
#5 Rural Development: J K Trust, Pragati Abhiyan
Guenter Butschek CEO & Managing Director(DIN:07427375)
Dr. Raghunath A. Mashelkar Non-Executive, Independent Director (Chairman CSR Committee)(DIN: 00074119)
Mumbai, May 23, 2017

Corporate Overview Financial StatementsStatutory Reports
116 72nd Annual Report 2016-17
To,The Members,Tata Motors Limited
We have conducted the secretarial audit of the compliance of applicable statutory provisions and the adherence to good corporate practices by Tata Motors Limited (hereinafter called the Company). Secretarial Audit was conducted in a manner that provided us a reasonable basis for evaluating the corporate conducts/statutory compliances and expressing our opinion thereon.
Based on our verification of the Company’s books, papers, minute books, forms and returns filed and other records maintained by the Company, the information provided by the Company, its officers, agents and authorised representatives during the conduct of secretarial audit, the explanations and clarifications given to us and the representations made by the Management, we hereby report that in our opinion, the Company has, during the audit period covering the financial year ended on 31st March, 2017, generally complied with the statutory provisions listed hereunder and also that the Company has proper Board processes and compliance mechanism in place to the extent, in the manner and subject to the reporting made hereinafter:
We have examined the books, papers, minute books, forms and returns filed and other records made available to us and maintained by the Company for the financial year ended on 31st March, 2017 according to the provisions of:
(i) The Companies Act, 2013 (the Act) and the rules made thereunder;
(ii) The Securities Contract (Regulation) Act, 1956 (‘SCRA’) and the rules made thereunder;
(iii) The Depositories Act, 1996 and the Regulations and Bye-laws framed thereunder;
(iv) Foreign Exchange Management Act, 1999 and the rules and regulations made thereunder to the extent of Foreign Direct Investment, Overseas Direct Investment and External Commercial Borrowings;
(v) The following Regulations and Guidelines prescribed under the Securities and Exchange Board of India Act, 1992 (‘SEBI Act’)
(a) The Securities and Exchange Board of India (Substantial Acquisition of Shares and Takeovers) Regulations, 2011;
(b) The Securities and Exchange Board of India (Prohibition of Insider Trading) Regulations, 2015;
(c) The Securities and Exchange Board of India (Issue of
Capital and Disclosure Requirements) Regulations, 2009 and amendments from time to time;
(d) The Securities and Exchange Board of India (Employee Stock Option Scheme and Employee Stock Purchase Scheme) Guidelines, 1999 and The Securities and Exchange Board of India (Share Based Employee Benefits) Regulations, 2014; (Not applicable to the Company during the audit period)
(e) The Securities and Exchange Board of India (Issue and Listing of Debt Securities) Regulations, 2008;
(f ) The Securities and Exchange Board of India (Registrars to an Issue and Share Transfer Agents) Regulations, 1993 regarding the Companies Act and dealing with client; (Not applicable to the Company during the audit period)
(g) The Securities and Exchange Board of India (Delisting of Equity Shares) Regulations, 2009; (Not applicable to the Company during the audit period) and
(h) The Securities and Exchange Board of India (Buyback of Securities) Regulations, 1998; (Not applicable to the Company during the audit period)
(vi) Other laws applicable specifically to the Company namely:
1. The Motor Vehicle Act, 1988 and the Rules made thereunder.
We have also examined compliance with the applicable clauses of the following: (i) Secretarial Standards issued by The Institute of Company
Secretaries of India with respect to board and general meetings.
(ii) The Listing Agreements entered into by the Company with BSE Limited and National Stock Exchange of India Limited read with the Securities and Exchange Board of India (Listing Obligations and Disclosure Requirements) Regulations, 2015.
During the period under review, the Company has complied with the provisions of the Act, Rules, Regulations, Guidelines, standards etc. mentioned above
It is observed that:
- The Company has filed an application dated June 22, 2016 with the Central Government for their approval to the appointment of and payment of remuneration to Mr. Guenter Butschek, CEO and Managing Director of the Company and has subsequently filed various responses to its comments/queries. The said approval is yet to be received.
Secretarial Audit Report for the Financial Year ended 31st March, 2017[Pursuant to Section 204 (1) of the Companies Act, 2013 and Rule No. 9 of the Companies (Appointment and Remuneration
of Managerial Personnel) Rules, 2014)]
ANNEXURE 7

Notice Board’s Report Management Discussion & Analysis Corporate Governance Report Business Responsibility Report
117
- As on March 31, 2017 the Company had a Non-Executive Chairman who is regarded as related to the promoter. The Board comprised of 9 directors out of which 4 were independent directors, consequent upon retirement of Mr. Subodh Bhargava, an Independent Director on March 29, 2017. On May 9, 2017, the Board appointed Mr O P Bhatt as an Additional and Independent Director.
We further report that:
The Board of Directors of the Company is duly constituted with proper balance of Executive Directors, Non-Executive Directors and Independent Directors subject to what is stated above. The changes in the composition of the Board of Directors that took place during the period under review were carried out in compliance with the provisions of the Act.
Adequate notice was given to all directors to schedule the Board Meetings, agenda and detailed notes on agenda were sent at least seven days in advance for meetings other than those held at shorter notice for which necessary consents have been sought at the meeting, and a system exists for seeking and obtaining further information and clarifications on the agenda items before the meeting and for meaningful participation at the meeting.
Majority decision is carried through while the dissenting members’ views are captured and recorded as part of the Minutes of the Meetings.
We further report that there are adequate systems and processes in the Company commensurate with the size and operations of the Company to monitor and ensure compliance with applicable laws, rules, regulations and guidelines.
We further report that during the audit period the Company had following events which had bearing on the Company’s affairs in pursuance of the above referred laws, rules, regulations, guidelines, standards etc.i. Memorandum of Understanding (MoU) for a long-term
partnership with Volkswagen Group and Skoda, to explore strategic alliance opportunity for joint development of products.
ii. Announcement of merger of the Company with TML Drivelines Limited, a wholly-owned subsidiary of the Company primarily engaged in the business of manufacturing Axles, Gearboxes and other parts for the Company’s commercial vehicles.
iii. The decision of the Supreme Court to ban sale of BS3 vehicles with effect from April 1, 2017 would impact the automobile industry including the Company mainly in the context of the BS-III inventory lying unsold as on that date.
iv. Issue of 144826 Ordinary shares and 25587 ‘A’ Ordinary shares earlier kept in abeyance.
v. The Company redeemed Non-Convertible Debentures aggregating `1200 crores during the year and has complied with the applicable laws.
For Parikh & AssociatesCompany Secretaries
P. N. Parikh(Partner)FCS No: 327 CP No: 1228
Place: MumbaiDate: May 23, 2017
This Report is to be read with our letter of even date which is annexed as Annexure A and Forms an integral part of this report.
vi. The Company made Private placement of Non- Convertible Debentures aggregating `2700 crores and complied with the applicable provisions of laws.
‘Annexure A’
To, The Members Tata Motors Limited
Our report of even date is to be read along with this letter.
1. Maintenance of secretarial record is the responsibility of the management of the Company. Our responsibility is to express an opinion on these secretarial records based on our audit.
2. We have followed the audit practices and process as were appropriate to obtain reasonable assurance about the correctness of the contents of the secretarial records. The verification was done on test basis to ensure that correct facts are reflected in secretarial records. We believe that the process and practices, we followed provide a reasonable basis for our opinion.
3. We have not verified the correctness and appropriateness of financial records and Books of Accounts of the Company.
4. Wherever required, we have obtained the Management Representation about the Compliance of laws, rules and regulations and happening of events etc.
5. The Compliance of the provisions of Corporate and other applicable laws, rules, regulations, standards is the responsibility of management. Our examination was limited to the verification of procedure on test basis.
6. The Secretarial Audit report is neither an assurance as to the future viability of the Company nor of the efficacy or effectiveness with which the management has conducted the affairs of the Company.
For Parikh & AssociatesCompany Secretaries
P. N. Parikh(Partner)FCS No: 327 CP No: 1228
Place: MumbaiDate: May 23, 2017

Corporate Overview Financial StatementsStatutory Reports
118 72nd Annual Report 2016-17
ECONOMY OVERVIEW
INDIA
The Indian economy in Fiscal 2017, on a macro-economic level stayed fairly robust and stable. India was one of the faster growing large economies in the world, with a currency that performed better than most other emerging markets. There was a significant upturn in commodity prices after a year of deflation. Consumer spending remained subdued during the early part of the year impacted by two years of drought. This year was marked by the way for the long awaited and transformational Goods and Services Tax (GST).
Fiscal 2017 was an eventful year for automobile sector due to: i) Ban on diesel cars, ii) Demonetization, iii) Ban on sale and registration of BSIII vehicles. The demonetization affected the Indian economy, which resulted in decline in sale of passenger and commercial vehicles by 2.3% in December 2016. Further, ban on sale and registration of BSIII vehicles has resulted in higher discounts by the automobile companies at the end of Fiscal 2017 and inventories to be either converted into BSIV vehicles or scrapped, affecting the profits.
As per the advance estimates, in Fiscal 2017, India’s GDP increased by 7.1%, as compared to an increase of 7.9% in Fiscal 2016 (based on second advanced estimate data from the Ministry of Statistics and Programme Implementation). Agriculture sector registered a 4.4% growth in Fiscal 2017 as compared to 0.8% in Fiscal 2016. According to the new base year (2011-12), the Index of Industrial Production (IIP) recorded 5.0% growth in Fiscal 2017, as compared to 3.4% in Fiscal 2016. Significant factors influencing IIP growth in Fiscal 2017 included a 4.9% increase in the manufacturing sector, compared to 3.0% in Fiscal 2016, which was due to a better performance of sectors like motor vehicles, other transport equipment and pharmaceuticals. The IIP of the mining & quarrying sector increased by 5.3%, compared to 4.3% in Fiscal 2016, and electricity services recorded moderate increase of 5.8% in Fiscal 2017, as compared to 5.7% in Fiscal 2016. The consumer durables sector grew by 6.1% in Fiscal 2017, as compared to 4.3% in Fiscal 2016. (Source: Ministry of Statistics and Program Implementation).
However, real GDP growth was lower than Fiscal 2016. Nominal GDP growth recovered to respectable levels, reversing the sharp and worrisome dip that had occurred. The Consumer Price Index (CPI)-New Series inflation, displayed a downward trend since July 2016. The rising international oil prices resulted in reversal of WPI. Core inflation, however, was more stable. The current account deficit declined in the first half of Fiscal 2017. The trade deficit declined for majority of period. During the first half of the fiscal, there was a contraction in
MANAGEMENT DISCUSSION AND ANALYSIS
imports, which was far steeper than the fall in exports but during later half both exports and imports started a long-awaited recovery.
WORLD
The below par performance of global economy was reflected in a continued slowdown in growth in most of the emerging and developing markets. Activity rebounded strongly in the United States in second half of 2016 after a weak first half. However, output remained below potential in a number of other advanced economies, notable in the euro area. The picture for emerging market and developing economies remained much more diverse. The growth rate in China was a bit stronger than expected, supported by continued policy stimulus. However, activity was weaker than expected in some Latin American countries such as Brazil. Activity in Russia was slightly better than expected, in part reflecting firmer oil prices.
During 2016, prices of base metals have also strengthened, with strong infrastructure and real estate investment in China as well as expectations of fiscal easing in the US. Oil prices increased later half of 2016, reflecting an agreement among major producers to trim supply.
The UK secured its seventh consecutive year of growth since the recession, and have been the fastest growing of the group of seven leading industrial economies in 2016. Sterling suffered two sharp devaluations this year — immediately after the EU referendum in June and in October as statements made at the Conservative party conference stoked fears of a “hard Brexit”. The Eurozone had marginal GDP growth in 2016; however, rising inflation poses a risk on growth and may reduce consumer spending. France and Spain had better prospects with GDP growing at decent rates, while Germany and Italy showed no change with GDP growth rates same as last year.
The GDP for China showed a steady performance. The real estate sector has seen an increased investment by government. The Consumer Price Index increased in 2016. Russia’s GDP grew as it continues to recover form crisis brought by low oil prices and western sanctions that closed access to international market. Its inflation is on track to reach projected target of CBR (Central Bank of Russia).
Japan’s economic growth is on back of weaker Yen and government steps to stimulate sluggish completion, the GDP grew in 2016 and unemployment rate declined. South Africa had GDP increase, mainly due to marginally higher global growth, Stabilized commodity prize, Business and Consumer confidence and Improved Labor Relations.

Notice Board’s Report Corporate Governance Report Business Responsibility ReportManagement Discussion & Analysis
(118-165)
119
Risk Factors
Risks associated with the Company’s Business and the Automotive Industry.
Deterioration in global economic conditions could have a material adverse impact on the Company’s sales and results of operations.
The Indian automotive industry could be affected materially by the general economic conditions in India and around the world. The automotive industry, in general, is cyclical, and economic slowdowns in the recent past have affected the manufacturing sector in India, including the automotive and related industries. A continuation of negative economic trends or further deterioration in key economic metrics, such as the growth rate, interest rates and inflation, as well as reduced availability of financing for vehicles at competitive rates, environment policies, tax policies, increase in freight rates and fuel prices could materially and adversely affect the Company’s automotive sales in India and results of operations.
In addition, investors’ reactions to economic developments or a loss of investor confidence in the financial systems of other countries may cause volatility in Indian financial markets and indirectly, in the Indian economy in general. Any worldwide financial instability, including withdrawal from trade pacts by countries in which the Company operates, could also have a negative impact on the Indian economy, including the movement of exchange rates and interest rates in India. In the event global economic recovery is slower than expected, or if there is any significant financial disruption, this could have a material adverse effect on the Company’s cost of funding, portfolio of financing loans, business, prospects, results of operations, financial condition and the trading price of the Company’s Shares and ADSs.
The Company’s Jaguar Land Rover business has significant operations in the United Kingdom, North America, continental Europe and China as well as sales operations in other overseas markets across the globe. The automotive market in China experienced strong growth in Fiscal 2017, with positive growth also in Europe, the UK and the US. Conditions remained challenging in emerging markets such as Brazil, Russia and South Africa where automotive sales deteriorated during Fiscal 2017. Jaguar Land Rovers’ growth plans may not quite materialize as expected which could have a significant adverse impact on company’s financial performance. If automotive demand softens because of lower or negative economic growth in key markets (notably China) or due to other factors, Jaguar Land Rover’s operations and financial condition
could be materially and adversely affected as a result.
The Brexit vote, the June 8, 2017 U.K.-election results and the ongoing negotiations between the United Kingdom and the European Union to finalize terms of the United Kingdom’s exit from the European Union has created significant uncertainty with respect to the United Kingdom’s future relationship with the European Union, the economic and political future of the United Kingdom and the legal structure applicable to companies doing business in the United Kingdom. This uncertainty, along with any real or perceived impact of Brexit, could have a material adverse effect on the Company’s Jaguar Land Rover business, results of operations and financial condition. Deterioration in key economic factors, such as GDP growth rates, interest rates and inflation, as well as the reduced availability of financing for vehicles at competitive rates in countries where Jaguar Land Rover has sales operations may result in a decrease in demand for automobiles. A decrease in demand would, in turn, cause automobile prices and manufacturing capacity utilization rates to fall. Such circumstances have in the past materially affected, and could in the future, materially affect, the Company’s business, results of operations and financial condition.
Intensifying competition could materially and adversely affect the Company’s sales, financial conditions and results of operations.
The global automotive industry is highly competitive and competition is likely to further intensify in light of continuing globalization and consolidation. Competition is especially likely to increase in the premium automotive categories as each market participant intensifies its efforts to retain its position in established markets while also expanding in emerging markets, such as China, India, Russia, Brazil and parts of Asia. Factors affecting competition include product quality and features, innovation and the development time for introduction of new products, cost control, pricing, reliability, safety, fuel economy, environmental impact and perception thereof, customer service and financing terms. In light of the impending Brexit, some of the Company’s EU-based competitors may gain a competitive advantage that would enable them to benefit from their access to the European Union single market post-Brexit. There can be no assurance that the Company will be able to compete successfully in the global automotive industry in the future.
The Company also faces strong competition in the Indian market from domestic, as well as foreign automobile manufacturers. Improving infrastructure and growth prospects, compared to those of other mature markets, has attracted a number of international

Corporate Overview Financial StatementsStatutory Reports
120 72nd Annual Report 2016-17
companies to India either through joint arrangements with local partners or through independently owned operations in India. International competitors bring with them decades of international experience, global scale, advanced technology and significant financial resources. Consequently, domestic competition is likely to further intensify in the future. There can be no assurance that the Company will be able to implement the Company’s future strategies in a way that will mitigate the effects of increased competition on the Indian automotive industry.
Designing, manufacturing and selling vehicles is capital intensive and requires substantial investments in manufacturing, machinery, research and development, product design, engineering, technology and marketing in order to meet both consumer preferences and regulatory requirements. If competitors consolidate or enter into other strategic agreements such as alliances, they may be able to take better advantage of economies of scale. The Company believes that competitors may be able to benefit from the cost savings offered by consolidation or alliances, which could adversely affect the Company’s competitiveness with respect to those competitors. Competitors could use consolidation or alliances as a means of enhancing their competitiveness (including through the acquisition of technology), which could also materially adversely affect Company’s business. Further the Company’s growth strategy relies on the expansion of the Company’s operations in less mature markets abroad, where the Company may face significant competition and higher than expected costs to enter and establish themselves.
If the Company is unable to effectively implement or manage the Company’s strategy, it’s operating results and financial condition could be materially and adversely affected.
As part of its strategy, the Company may open new manufacturing, research or engineering facilities, expand existing facilities, add additional product lines or expand its businesses into new geographical markets. There is a range of risks inherent in such a strategy that could adversely affect its ability to achieve these objectives, including, but not limited to, the potential disruption of the Company’s business; the uncertainty that new product lines will generate anticipated sales; the uncertainty that a new business will achieve anticipated operating results; the diversion of resources and management’s time; the cost reduction efforts, which may not be successful; the difficulty of managing the operations of a larger Company; and the difficulty of competing for growth opportunities with companies having greater financial resources than the Company has.
More specifically, the international businesses of the Company face a range of risks and challenges, including, but not limited to, the following: language barriers, cultural differences, difficulties in staffing and managing overseas operations, inherent difficulties and delays in contract enforcement and the collection of receivables under the legal systems of foreign countries, the risk of non-tariff barriers, regulatory and legal requirements affecting the Company’s ability to enter new markets through joint ventures with local entities, difficulties in obtaining regulatory approvals, environmental permits and other similar types of governmental consents, difficulties in negotiating effective contracts, obtaining the necessary facility sites or marketing outlets or securing essential local financing, liquidity, trade financing or cash management facilities, export and import restrictions, multiple tax regimes (including regulations relating to transfer pricing and withholding and other taxes on remittances and other payments from subsidiaries), foreign investment restrictions, foreign exchange controls and restrictions on repatriation of funds, other restrictions on foreign trade or investment sanctions, and the burdens of complying with a wide variety of foreign laws and regulations. Furthermore, as part of global activities, the Company may engage with third-party dealers and distributors, which the Company do not control but which, nevertheless, take actions that could have a material adverse impact on the Company’s reputation and business; the Company cannot assure you that it will not be held responsible for any activities undertaken by such dealers and distributors. If the Company is unable to manage risks related to its expansion and growth in other parts of the world and therefore fail to establish a strong presence in those higher growth markets, its business, results of operations and financial condition could be adversely affected or its investments could be lost.
Furthermore, the Company is subject to risks associated with growing its business through mergers and acquisitions. The Company believes that its acquisitions provide it opportunities to grow significantly in the global automobile markets by offering premium brands and products. The Company’s acquisitions have provided it with access to technology and additional capabilities while also offering potential synergies. However, the scale, scope and nature of the integration required in connection with its acquisitions present significant challenges, and the Company may be unable to integrate the relevant subsidiaries, divisions and facilities effectively within its expected schedule. An acquisition may not meet its expectations and the realization of the anticipated benefits may be blocked, delayed or reduced as a result of numerous factors, some of which are outside the Company’s control.

Notice Board’s Report Corporate Governance Report Business Responsibility ReportManagement Discussion & Analysis
(118-165)
121
For example, the Company acquired the Jaguar Land Rover business from Ford in June 2008, and since then Jaguar Land Rover has become a significant part of its business, accounting for approximately 79% of its total revenues in Fiscal 2017. As a result of the acquisition, the Company is responsible for, among other things, the obligations and liabilities associated with the legacy business of Jaguar Land Rover. There can be no assurances that any legacy issues at Jaguar Land Rover or any other acquisition the Company has undertaken in the past or will undertake in the future would not have a material adverse effect on its business, financial condition and results of operations, as well as its reputation and prospects.
The Company will continue to evaluate growth opportunities through suitable mergers and acquisitions in the future. Growth through mergers and acquisitions involves business risks, including unforeseen contingent risks or latent business liabilities that may only become apparent after the merger or acquisition is completed. The key success factors are seamless integration, effective management of the merged and/or acquired entity, retention of key personnel, cash flow generation from synergies in engineering and sourcing, joint sales and marketing efforts, and management of a larger business. If any of these factors fails to materialize or if the Company is unable to manage any of the associated risks successfully, the business, financial condition and results of operations could be materially and adversely affected.
The Company’s future success depends on its ability to satisfy changing customer demands by offering innovative products in a timely manner and maintaining such products’ competitiveness and quality.
The Company’s competitors may gain significant advantages if they are able to offer products satisfying customer needs earlier than the Company is able to, which could adversely impact the Company’s sales, results of operations and financial condition. Unanticipated delays or cost overruns in implementing new product launches, expansion plans or capacity enhancements could also materially and adversely impact the Company’s financial condition and results of operations.
Climate change concerns and the promotion of new technologies, such as autopilot, encourage customers to look beyond standard factors (such as price, design, performance, brand image or comfort and features) in favor of more fuel efficient, convenient and environmentally friendly vehicles. As a result of the public discourse on climate change and volatile fuel prices, the Company faces more stringent government regulations, imposition of speed limits and
higher taxes on sports utility vehicles or premium automobiles. The Company endeavours to take account these factors, and is focused on researching, developing and producing new drive technologies, such as hybrid engines and electric cars. The Company also investing in development programs to reduce fuel consumption through the use of lightweight materials, reducing parasitic losses through the driveline and improving aerodynamics. Coupled with consumer preferences, a failure to achieve the Company’s planned objectives or delays in developing fuel efficient products could materially affect the Company’s ability to sell premium passenger cars and large or medium-sized all-terrain vehicles at current or targeted volume levels, and could have a material adverse effect on the Company’s general business activity, net assets, financial position and results of operations. In addition, a deterioration in the quality of the Company’s vehicles could force the Company to incur substantial costs and damage its reputation. There is a risk that competitors or joint ventures set up by competitors will develop better solutions and will be able to manufacture the resulting products more rapidly, in larger quantities, with a higher quality and/or at a lower cost. It is possible that the Company could then be compelled to make new investments in researching and developing other technologies to maintain its existing market share or to win back the market share lost to competitors. Finally, the Company’s manufacturing operations and sales may be subject to potential physical impacts of climate change, including changes in weather patterns and an increased potential for extreme weather events, which could affect the manufacture and distribution of the Company’s products and the cost and availability of raw materials and components.
Private and commercial users of transportation increasingly use modes of transportation other than the automobile. The reasons for this include the rising costs of automotive transport, increasing traffic density in major cities and environmental awareness. Furthermore, the increased use of car-sharing concepts and other innovative mobility initiatives facilitates access to other methods of transport, thereby reducing dependency on the private automobile. Furthermore, non-traditional market participants may dependency on the private automobile altogether. A shift in consumer preferences away from private automobiles would have a material adverse effect on the Company’s general business activity and on sales, prospects, financial condition and results of operations.
To stimulate demand, competitors in the automotive industry have offered customers and dealers price reductions on vehicles and services, which has led to increased price pressures and sharpened

Corporate Overview Financial StatementsStatutory Reports
122 72nd Annual Report 2016-17
competition within the industry. As a provider of numerous high-volume models, the Company’s profitability and cash flows are significantly affected by the risk of rising competitive price pressures. Special sales incentives and increased price pressures in the new car business also influence price levels in the used car market, with a negative effect on vehicle resale values. This may have a negative impact on the profitability of the used car business in the Company’s dealer organization.
There can be no assurance that the Company’s new models will meet its sales expectations, in which case the Company may be unable to realize the intended economic benefits of the Company’s investments, which would in turn materially affect the Company’s business, results of operations and financial condition. In addition, there is a risk that the Company’s quality standards can be maintained only by incurring substantial costs for monitoring and quality assurance. For the Company’s customers, one of the determining factors in purchasing its vehicles is the high quality of the products.
A decrease in the quality of the Company’s vehicles (or if the public were to have the impression that such a decrease in quality had occurred) could damage the Company’s image and reputation as a premium automobile manufacturer and in turn materially affect the Company’s business, results of operations and financial condition.
In addition, product development cycles can be lengthy, and there is no assurance that new designs will lead to revenues from vehicle sales, or that the Company will be able to accurately forecast demand for its vehicles, potentially leading to inefficient use of the Company’s production capacity. Additionally, the Company’s high proportion of fixed costs, due to the Company’s significant investment in property, plant and equipment, further exacerbates the risks associated with incorrectly assessing demand for its vehicles.
The Company is subject to risks associated with product liability warranties and recalls.
The Company is subjected to risks and costs associated with product liability, warranties and recalls in connection with performance, compliance or safety-related issues affecting the Company’s products which may, in turn, cause the Company’s customers to question the safety or reliability of its vehicles and thus result in a materially adverse effect on its business, impacting its reputation, results from operations and financial condition. Such events could also require the Company to expend considerable resources to remediate, and the Company may be subject to class actions, other large-scale product liability, or other lawsuits in various jurisdictions
where the Company conducts business. In May 2016, an industry-wide passenger airbag safety recall was announced in the United States by the National Highway Traffic System Administration or NHTSA, in respect of airbags from Takata Corporation or Takata, a supplier of airbags. Certain front-passenger airbags supplied by Takata were installed in vehicles sold by Jaguar Land Rover. The Company considered the cost associated with the recall to be an adjusting post-balance sheet event and recognized an additional provision of GB£ 67.4 million for the estimated cost of repairs in its income statement for Fiscal 2016. The Company expects to utilize such provision over the next one to four years.
Furthermore, the Company may also be subject to class actions or other large-scale product liability or other lawsuits in various jurisdictions in which the Company may have a significant presence. The use of shared components in vehicle production increases this risk because individual components are deployed in a number of different models across the Company’s brands. Any costs incurred or lost sales caused by product liability, warranties and recalls could materially adversely affect the Company’s business.
Any disruption in the supply of automobile components could have a material adverse impact on the Company’s results of operations.
Adverse economic conditions, a decline in automobile demand and lack of access to sufficient financing arrangements, among others, could have a negative financial impact on the Company’s suppliers, thereby impairing timely availability of components to the Company or causing increase in the costs of components. In addition, if one or more of the other global automotive manufacturers were to become insolvent, this would have an adverse effect on the Company’s supply chains and may have a material adverse effect on the Company’s results of operations.
The Company’s Jaguar Land Rover has also entered into supply agreements with Ford and certain other third parties for critical components and remain reliant upon Ford and the Ford-PSA joint venture for a portion of Jaguar Land Rover engines. However, following the launch of the EMC in Wolverhampton, Jaguar Land Rover now also manufactures its own ‘‘in-house’’ engines. The Company may not be able to manufacture certain types of engines or find a suitable replacement supplier in a timely manner in the event of any disruption in the supply of engines, or parts of engines, and other hardware or services provided to Jaguar Land Rover by Ford or the Ford-PSA joint venture and such disruption could have a material adverse impact on the Company’s operations, business and/or financial condition.

Notice Board’s Report Corporate Governance Report Business Responsibility ReportManagement Discussion & Analysis
(118-165)
123
A change in requirements under long-term supply arrangements committing Jaguar Land Rover to purchase minimum or fixed quantities of certain parts, or to pay a minimum amount to the seller, could have a material adverse impact on the Company’s financial condition or results of operations. The Company have entered into a number of long-term supply contracts that require Jaguar Land Rover to purchase a fixed quantity of parts to be used in the production of Jaguar Land Rover vehicles (e.g., ‘‘take-or-pay’’ contracts). If the need for any of these parts were to lessen, Jaguar Land Rover could still be required to purchase a specified quantity of the part or pay a minimum amount to the seller pursuant to the take-or-pay contract, which could have a substantial adverse effect on the Company’s financial condition or results of operations.
Increases in input prices may have a material adverse effect on the Company’s results of operations.
In Fiscal 2017 and 2016, the consumption of raw materials, components and aggregates and purchase of products for sale (including changes in inventory) constituted approximately 60.4% and 58.8%, respectively, of the Company’s total revenues. Prices of commodity items used in manufacturing automobiles, including steel, aluminum, copper, zinc, rubber, platinum, palladium and rhodium, have become increasingly volatile in recent years. Further price movements would closely depend on the evolving economic scenarios across the globe. While the Company continues to pursue cost reduction initiatives, an increase in price of input materials could severely impact the Company’s profitability to the extent such increase cannot be absorbed by the market through price increases and/or could have a negative impact on demand. In addition, an increased price and supply risk could arise from the need for rare and frequently sought-after raw materials for which demand is high, such as rare earths, which are predominantly found in China. Rare earth metal prices and supply remain uncertain. In the past, China has limited the export of rare earths from time to time. Due to intense price competition and the Company’s high level of fixed costs, the Company may not be able to adequately address changes in commodity prices even if they are foreseeable. Increases in fuel costs also pose a significant challenge, especially in the commercial and premium vehicle categories where increased fuel prices have an impact on demand. If the Company is unable to find substitutes for supplies of raw materials or pass price increases on to customers, or to safeguard the supply of scarce raw materials, the Company’s vehicle production, business, financial condition and results of operations could be materially and adversely affected.
The Company manages these risks through the use of fixed
supply contracts with tenor upto 12 months and the use of financial derivatives pursuant to a defined hedging policy. The Company enters into a variety of foreign currency, interest rates and commodity forward contracts and options to manage the Company’s exposure to fluctuations in foreign exchange rates, interest rates and commodity price risk. These financial exposures are managed in accordance with the Company’s risk management policies and procedures. The Company uses foreign currency forward and option contracts to hedge risks associated with foreign currency fluctuations relating to highly probable forecast transactions. The Company also enters into interest rate swaps and interest rate currency swap agreements, mainly to manage exposure on the Company’s fixed rate or variable rate debt. The Company further uses interest rate derivatives or currency swaps to hedge exposure to exchange rate fluctuations on principal and interest payments for borrowings denominated in foreign currencies. Specific transactional risks include risks like liquidity and pricing risks, interest rate and exchange rate fluctuation risks, volatility risks, counterparty risks, settlement risks and gearing risks. However, the hedging transactions may not adequately protect the Company against these risks. In addition, if markets move adversely, the Company may incur financial losses on such hedging transactions, the financial condition and results of operations may be adversely impacted.
The significant reliance of the Company and Jaguar Land Rover on key markets increases the risk of the negative impact of reduced customer demand in those countries.
The Company and Jaguar Land Rover, relies on the United Kingdom, Chinese, North American and continental European markets. Any decline in demand for the Company’s and Jaguar Land Rover’s vehicles in these key markets may significantly impact the Company’s business, growth prospects, financial position and results of operations. Further, decreased demand for the Company’s and Jaguar Land Rover’s products may not be sufficiently mitigated by new product launches and expansion into growing markets, which could have a significant adverse impact on the Company’s financial performance.
The Company is exposed to liquidity risks.
The Company’s main sources of liquidity are cash generated from operations, the existing notes, external debt in the form of factoring discount facilities and other revolving credit facilities. However, adverse changes in the global economic and financial environment may result in lower consumer demand for vehicles, and prevailing conditions in credit markets may adversely affect both consumer

Corporate Overview Financial StatementsStatutory Reports
124 72nd Annual Report 2016-17
demand and the cost and availability of finance for the Company’s business and operations. If the global economy goes back into recession and consumer demand for the Company’s vehicles drops, as a result of higher oil prices, excessive public debt or for any other reasons, and the supply of external financing becomes limited, the Company may again face significant liquidity risks.
The Company is also subject to various types of restrictions or impediments on the ability of companies in its Group in certain countries to transfer cash across the Group through loans or interim dividends. These restrictions or impediments are caused by exchange controls, withholding taxes on dividends and distributions and other similar restrictions in the markets in which the Company operates. The cash in some of these jurisdictions is subject to certain restrictions on cash pooling, intercompany loan arrangements or interim dividends.
Exchange rate and interest rate fluctuations could materially and adversely affect the Company’s financial condition and results of operations.
The Company’s operations are subject to risks arising from fluctuations in exchange rates with reference to countries in which it operates. The Company imports capital equipment, raw materials and components from, manufacture vehicles in, and sell vehicles into, various countries, and therefore, its revenues and costs have significant exposure to the relative movements of the GB£, the U.S. dollar, the Euro, the Russian Ruble, the Chinese Renminbi, the Singapore dollar, the Japanese Yen, the Australian dollar, the South African rand, the Thai baht, the Korean won and the Indian rupee.
The United Kingdom’s exit from the European Union could also have a negative impact on the growth of the UK economy and cause greater volatility in the pound sterling. This could directly impact the Company’s sales volumes and financial results, as the Company derives the majority of its revenues from overseas markets and source significant levels of raw materials and components from Europe, which may result in decrease in profits to the extent of non- British pound costs, are not fully mitigated by non-British pound sales.
Moreover, the Company has an outstanding foreign currency denominated debt and is sensitive to fluctuations in foreign currency exchange rates. The Company has experienced and could expect in the future to experience foreign exchange losses on obligations denominated in foreign currencies in respect of its borrowings and foreign currency assets and liabilities due to currency fluctuations.
The Company has both interest-bearing assets (including cash
balances) and interest-bearing liabilities, which bear interest at variable rates. The Company is therefore exposed to changes in interest rates. Although the Company engages in managing its interest and foreign exchange exposure through use of financial hedging instruments, such as forward contracts, swap agreements and option contracts, higher interest rates and a weakening of the Indian rupee against major foreign currencies could significantly increase its cost of borrowing, which could have a material adverse effect on the Company’s financial condition, results of operations and liquidity.
The Company is exposed to the risk that appropriate hedging lines for the type of risk exposures it is subjected to may not be available at a reasonable cost, particularly during volatile rate movements, or at all. Moreover, there are risks associated with the use of such hedging instruments. Whilst mitigating to some degree the Company’s exposure to fluctuations in currency exchange rates, the Company potentially forgo benefits that might result from market fluctuations in currency exposures. These hedging transactions can also result in substantial losses. Such losses could occur under various circumstances, including, without limitation, any circumstances in which a counterparty does not perform its obligations under the applicable hedging arrangement (despite having ISDA agreements in place with each of the Company’s hedging counterparties), currency fluctuations, the arrangement is imperfect or ineffective, or the Company’s internal hedging policies and procedures are not followed or do not work as planned. In addition, because the Company’s potential obligations under the financial hedging instruments are marked to market, the Company may experience quarterly and annual volatility in its operating results and cash flows attributable to its financial hedging activities.
A decline in retail customers’ purchasing power or consumer confidence or in corporate customers’ financial condition and willingness to invest could materially and adversely affect the Company’s business.
Demand for vehicles for personal use generally depends on consumers’ net purchasing power, their confidence in future economic developments and changes in fashion and trends, while demand for vehicles for commercial use by corporate customers (including fleet customers) primarily depends on the customers’ financial condition, their willingness to invest (motivated by expected future business prospects) and available financing. A decrease in potential customers’ disposable income or their financial flexibility or an increase in the cost of financing will generally have a negative impact on demand for the Company’s

Notice Board’s Report Corporate Governance Report Business Responsibility ReportManagement Discussion & Analysis
(118-165)
125
products. A weak macroeconomic environment, combined with restrictive lending and a low level of consumer sentiment generally, may reduce consumers’ net purchasing power and lead existing and potential customers to refrain from purchasing a new vehicle, to defer a purchase further or to purchase a smaller model with less equipment at a lower price. A deteriorating macroeconomic environment may disproportionately reduce demand for luxury vehicles. It also leads to reluctance by corporate customers to invest in vehicles for commercial use and/or to lease vehicles, resulting in a postponement of fleet renewal contracts.
The Company is subject to risks associated with the automobile financing business.
The sale of Company’s commercial and passenger vehicles is heavily dependent on funding availability for its customers. Rising delinquencies and early defaults have contributed to a reduction in automobile financing, which, in turn, has had an adverse effect on funding availability for potential customers. This reduction in available financing may continue in the future and have a material adverse effect on the Company’s business, financial condition and results of operations.
In India, the Company is subjected to risks associated with its automobile financing business. Any default by its customers or inability to repay installments as due could materially and adversely affect the Company’s business, financial condition, results of operations and cash flows. In addition, any downgrade in the Company’s credit ratings may increase its borrowing costs and restrict its access to the debt markets. Over time, and particularly in the event of any credit rating downgrade, market volatility, market disruption, regulatory changes or otherwise, the Company may need to reduce the amount of financing receivables it originates, which could severely disrupt its ability to support the sale of its vehicles.
Jaguar Land Rover has consumer financing arrangements in place with financing partners in a number of key markets. Any reduction in the supply of available consumer financing for the purchase of new vehicles could make it more difficult for some customers to purchase vehicles, which could put Jaguar Land Rover under commercial pressure to offer new (or expand existing) retail or dealer incentives to maintain demand for their vehicles, thereby materially and adversely affecting Jaguar Land Rover sales and results of operations. Furthermore, Jaguar Land Rover also offers residual value guarantees on the leases of certain vehicles in certain markets. The value of these guarantees is dependent on used car valuations in those markets at the end of the lease, which is subject
to change. Consequently, Jaguar Land Rover may be adversely affected by movements in used car valuations in these markets.
Underperformance of the Company’s distribution channels and supply chains may have a material adverse effect on the Company’s sales, financial condition and results of operations.
The Company relies on third parties to supply it with the raw materials, parts and components used in the manufacture of the Company’s products. For some of these parts and components, the Company is dependent on a single source. The Company’s ability to procure supplies in a cost-effective and timely manner is subject to various factors, some of which are not within the Company’s control. While the Company manages its supply chain as part of its vendor management process, any significant problems with the Company’s supply chain in the future could disrupt its business and materially and adversely affect the Company’s results of operations, as well as its sales, net income and financial condition.
The Company’s products are sold and serviced through a network of authorized dealers and service centers across India and through a network of distributors and local dealers in international markets. The Company monitors the performance of its dealers and distributors and provide them with support to enable them to perform to its expectations. There can be no assurance, however, that the Company expectations will be met. Any underperformance by the Company’s dealers or distributors could materially and adversely affect the Company’s sales and results of operations.
If dealers or importers encounter financial difficulties and the Company’s products and services cannot be sold or sold only in limited numbers, this would have a direct effect on the sales of such dealers and importers. Additionally, if the Company cannot replace the affected dealers or importers with other franchises, the financial difficulties experienced by such dealers or importers could have an indirect effect on the Company’s vehicle deliveries.
Consequently, the Company could be compelled to provide additional support for dealers and importers and, under certain circumstances, may even take over their obligations to customers, which would adversely affect the Company’s financial position and results of operations in the short term.
Deterioration in the performance of any of the subsidiaries, joint ventures and affiliates may adversely the Company’s results of operations.
The Company has made and may continue to make capital commitments to its subsidiaries, joint ventures and affiliates, and if the business or operations of any of these subsidiaries, joint ventures

Corporate Overview Financial StatementsStatutory Reports
126 72nd Annual Report 2016-17
and affiliates deteriorate, the value of the Company’s investments may decline substantially. Operating a business as a joint venture often requires additional organizational formalities and requirement of information sharing. The Company is also subjected to risks associated with joint ventures and affiliates wherein the Company retains only partial or joint control. The Company’s partners may be unable, or unwilling, to fulfill their obligations, or the strategies of its joint ventures or affiliates may not be implemented successfully, any of which may significantly reduce the value of its investments or relationship with the co-owner may be deteriorated, and, which may, in turn, have a material adverse effect on the Company’s reputation, business, financial position or results of operations.
The Company may be adversely impacted by political instability, wars, terrorism, multinational conflicts, countries resorting to protectionism natural disasters, fuel shortages/prices, epidemics, labour strikes and other risks in the markets in which the Company operates.
The Company’s products are exported to a number of geographical markets and the Company plans to expand its international operations further in the future. Consequently, the Company is subjected to various risks associated with conducting its business both within and outside its domestic market and the Company’s operations may be subject to political instability, wars, terrorism, regional and/or multinational conflicts, natural disasters, fuel shortages/prices, epidemics and labour strikes. Any disruption of the operations of the Company’s manufacturing, design, engineering, sales, corporate and other facilities could materially and adversely affect the Company’s business, financial condition and results of operations. In addition, conducting business internationally, especially in emerging markets, exposes the Company to additional risks, including adverse changes in economic and government policies, unpredictable shifts in regulation, inconsistent application of existing laws and applicability of retrospective taxes/sanction, programs unclear regulatory and taxation systems and divergent commercial and employment practices and procedures. Any significant or prolonged disruptions or delays in the Company’s operations related to these risks could adversely impact its results of operations.
Terrorist attacks, civil disturbances, regional conflicts and other acts of violence, particularly in India, may disrupt or otherwise adversely affect the markets in which the Company operates and the business and profitability of the Company. India has from time to time experienced social and civil unrest and hostilities and adverse social, economic or political events, including terrorist attacks and local civil disturbances, riots and armed conflict with neighboring
countries. Events of this nature in the future could influence the Indian economy and could have a material adverse effect on the Company’s business, as well as the market for securities of Indian companies, including the Company’s Shares and ADSs. Such incidents could also create a greater perception that investment in Indian companies involves a higher degree of risk and could have a material adverse effect on the Company’s business, results of operations and financial condition, and also the market price of the Company’s Shares and ADSs.
The Company is vulnerable to supply chain disruptions resulting from natural disasters or man-made accidents. For example, on August 12, 2015, there was an explosion in the city port of Tianjin, one of three major ports in China through which the Company’s Jaguar Land Rover imports its vehicles. Approximately 5,800 of Jaguar Land Rover vehicles were stored at various locations in Tianjin at the time of the explosion, and, as a result, Jaguar Land Rover recognized an exceptional charge of GBP245 million in the three months ended September 30, 2015. Subsequently, GBP 274 million of net insurance proceeds and other recoveries have been received till March 31, 2017 , including £35 million related to other costs associated with Tianjin including lost and discounted vehicle revenue. A significant delay or sustained interruption in the supply of key inputs sourced from areas affected by disasters or accidents could materially and adversely affect the Company’s ability to maintain the Company’s current and expected levels of production, and therefore negatively affect the Company’s revenues and increase the operating expenses.
The Company is a global organization, and is therefore vulnerable to shifts in global trade and economic policies and outlook. Policies that result in countries withdrawing from trade pacts, increasing protectionism and undermining free trade could substantially affect the Company’s ability to operate as a global business. Additionally, negative sentiments towards foreign companies among the Company’s overseas customers and employees could adversely affect our sales as well as the Company’s ability to hire and retain talented people. A negative shift in either policies or sentiment with respect to global trade and foreign businesses could have a material adverse effect on the Company’s business, results of operations and financial condition.
The Company’s business is seasonal in nature and a substantial decrease in the Company’s sales during certain quarters could have a material adverse impact on the Company’s financial performance.
The sales volumes and prices for the Company’s vehicles are influenced by the cyclicality and seasonality of demand for these

Notice Board’s Report Corporate Governance Report Business Responsibility ReportManagement Discussion & Analysis
(118-165)
127
products. The automotive industry has been cyclical in the past and the Company expects this cyclicality to continue.
In the Indian market, demand for the Company’s vehicles generally peaks between January and March, although there is a decrease in demand in February just before release of the Indian fiscal budget. Demand is usually lean from April to July and picks up again in the festival season from September onwards, with a decline in December due to year-end as customers defer purchases to the New Year.
The Jaguar Land Rover business is impacted by the semi-annual registration of vehicles in the United Kingdom where the vehicle registration number changes every March and September, which, leads to an increase in sales during these months and in turn, has an impact on the resale value of vehicles. Most other markets, such as the United States, are influenced by the introduction of new-model-year products, which typically occurs in the autumn of each year. Furthermore, in the United States there is some seasonality in the purchasing patterns of vehicles in northern states, notably for Jaguar when vehicle sales are concentrated in the spring and summer months and for Land Rover where the trend for purchasing 4x4 vehicles is concentrated in the autumn and winter months. Markets in China tend to experience higher demand for vehicles around the Chinese New Year and other national holidays. In addition, demand in western European automotive markets tends to be softer during the summer and winter holidays. Furthermore, Jaguar Land Rover’s cash flows are impacted by the temporary shutdown of four of their manufacturing plants in the United Kingdom (including the Engine Manufacturing Centre at Wolverhampton) during the summer and winter holidays. As a result, the profile of operating results differs between each reporting period.
Restrictive covenants in financing agreements may limit the Company operations and financial flexibility and materially and adversely impact the Company’s financial condition, results of operations and prospects.
Some of the Company’s financing agreements and debt arrangements set limits on and/or require it to obtain lender consent before, among other things, pledging assets as security. In addition, certain financial covenants may limit the Company’s ability to borrow additional funds or to incur additional liens. In the past, the Company has been able to obtain required lender consent for such activities. However, there can be no assurance that the Company will be able to obtain such consents in the future. If the Company’s liquidity needs or growth plans require such consents and such consents are not obtained, the Company may be forced to forego
or alter the Company’s plans, which could materially and adversely affect the Company’s results of operations and financial condition.
In the event the Company breach these covenants, the outstanding amounts due under such financing agreements could become due and payable immediately and/or result in increased costs. A default under one of these financing agreements may also result in cross-defaults under other financing agreements and result in the outstanding amounts under such other financing agreements becoming due and payable immediately. Defaults under one or more of the Company’s financing agreements could have a material adverse effect on the Company’s financial condition and results of operations.
The Company relies on licensing arrangements with Tata Sons Limited to use the “Tata” brand. Any improper use of the associated trademarks by the Company’s licensor or any other third parties could materially and adversely affect the Company’s business, financial condition and results of operations.
The Company’s rights to the Company’s trade names and trademarks are a crucial factor in marketing the Company’s products. Establishment of the “Tata” word mark and logo mark in and outside India is material to the Company’s operations. The Company has licensed the use of the “Tata” brand from its Promoter, Tata Sons Limited, or Tata Sons. If Tata Sons, or any of its subsidiaries or affiliated entities, or any third party uses the trade name “Tata” in ways that adversely affect such trade name or trademark, its reputation could suffer damage, which, in turn, could have a material adverse effect on its business, financial condition and results of operations.
Inability to protect or preserve the Company’s intellectual property could materially and adversely affect the Company’s business, financial condition and results of operations.
The Company owns or otherwise have rights in respect of a number of patents relating to the products it manufactures. In connection with the design and engineering of new vehicles and the enhancement of existing models, the Company seeks to regularly develop new intellectual property. The Company also uses technical designs, which are the intellectual property of third parties with such third parties’ consent. These patents and trademarks have been of value in the growth of the Company’s business and may continue to be of value in the future. Although the Company does not regard any of its businesses as being dependent upon any single patent or related group of patents, an inability to protect this intellectual property generally, or the illegal breach of some or a large group of the Company’s intellectual property rights, would have a materially

Corporate Overview Financial StatementsStatutory Reports
128 72nd Annual Report 2016-17
adverse effect on its business, financial condition and results of operations. The Company may also be affected by restrictions on the use of intellectual property rights held by third parties and the Company may be held legally liable for the infringement of the intellectual property rights of others in its products.
Impairment of intangible assets may have a material adverse effect on the Company’s results of operations.
Designing, manufacturing and selling vehicles is capital intensive and requires substantial investments in intangible assets such as research and development, product design and engineering technology. The Company reviews the value of its intangible assets to assess on an annual basis whether the carrying amount matches the recoverable amount for the asset concerned based on underlying cash-generating units. The Company may have to take an impairment loss as at a current balance sheet date or future balance sheet date, if the carrying amount exceeds the recoverable amount, which could have a material adverse effect on its financial condition and the results of operations.
The Company may be adversely affected by labour unrest.
All of the Company’s permanent employees in India, other than officers and managers, and most of its permanent employees in South Korea and the United Kingdom, including certain officers and managers, in relation to its automotive business, are members of labour unions and are covered by its wage agreements, where applicable, with those labour unions.
In general, the Company considers its labour relations with all of its employees to be good. However, in the future the Company may be subject to labour unrest, which may delay or disrupt its operations in the affected regions, including the acquisition of raw materials and parts, the manufacture, sales and distribution of products and the provision of services. If work stoppages or lockouts at the Company’s facilities or at the facilities of the Company’s major vendors occur or continue for a long period of time, the Company’s business, financial condition and results of operations may be materially and adversely affected. The Company did recently face two minor standalone incidents of labour unrest, one in the Dharwad plant in Karnataka, India and the other in the Company’s Sanand plant in Gujarat, India, both of which were amicably resolved.
The Company’s business and prospects could suffer if the Company loses one or more key personnel or if the Company is unable to attract and retain the Company’s employees.
The Company’s business and future growth depend largely on the skills of its workforce, including executives and officers, and
automotive designers and engineers. The loss of the services of one or more of the Company’s personnel could impair the Company’s ability to implement its business strategy. In view of intense competition, any inability to continue to attract, retain and motivate the Company’s workforce could materially and adversely affect the Company’s business, financial condition, results of operations and prospects.
Future pension obligations may prove costlier than currently anticipated and the market value of assets in the Company’s pension plans could decline.
The Company provides post-retirement and pension benefits to the Company’s employees, including defined benefit plans. The Company’s pension liabilities are generally funded. However, lower returns on pension fund assets, changes in market conditions, interest rates or inflation rates, and adverse changes in other critical actuarial assumptions, may impact the Company’s pension liabilities or assets and consequently increase funding requirements, which could materially decrease the Company’s net income and cash flows.
For Jaguar Land Rover, the arrangements with the trustees of the defined benefit pension schemes, an actuarial valuation of the assets and liabilities of the schemes is undertaken every three years. The most recent valuation, as at April 2015 and completed in 2016, indicated a shortfall in the assets of the schemes as at that date, versus the actuarially determined liabilities as at that date, of GB£ 789 million (compared to GB£ 702 million as at April 2012).
As part of the valuation process, the Company agreed to a schedule of contributions with the trustee of the schemes, which, together with the expected investment performance of the assets of the schemes, is expected to eliminate the deficit by 2025. As part of this schedule of contributions, the Company paid GB£ 69 million into the pension schemes in March 2016 as advance payments towards deficit contributions due during Fiscal 2017. As at March 31, 2017, the UK defined benefit pension accounted deficit had increased to GB£ 1.46 billion, as compared to GB£ 567 million as at March 31, 2016. This increase has primarily been driven by a decline in AA-negative rated UK corporate bond yields following Brexit and even though the accounted deficit position does not affect cash contributions, movements in the associated balance sheet liability may have other impacts notably on the Company’s results of operations and financial condition.
The Company is exposed to operational risks, including risks in connection with the Company’s use of information technology.
Operational risk is the risk of loss resulting from inadequate or failed

Notice Board’s Report Corporate Governance Report Business Responsibility ReportManagement Discussion & Analysis
(118-165)
129
internal systems and processes, from either internal or external events. Such risks could stem from inadequacy or failures of controls within internal procedures, violations of internal policies by employees, disruptions or malfunctioning of information technology systems, such as computer networks and telecommunication systems, other mechanical or equipment failures, human error, natural disasters or malicious acts by third parties. Any unauthorized access to or misuse of data on the Company’s information technology systems, human errors or technological or process failures of any kind or any failure in its protection measures could severely disrupt the Company’s operations, including its manufacturing, design and engineering processes, and could have a material adverse effect on the Company’s reputation, financial condition and results of operations.
The Company may be materially and adversely affected by the divulgence of confidential information.
Although the Company has implemented policies and procedures to protect confidential information such as key contractual provisions, future projects, and customer records, such information may be divulged, including as a result of hacking or other threats from cyberspace. If this occurs, the Company could be subject to claims by affected parties, negative publicity and loss of proprietary information, all of which could have an adverse and material impact on the Company’s reputation, business, financial condition, results of operations and cash flows.
The Company’s insurance coverage may not be adequate to protect against all potential losses to which the Company may be subject, and this may have a material adverse effect on the Company’s business, financial condition and results of operations.
While the Company believes that the insurance coverage that it maintains is reasonably adequate to cover all normal risks associated with the operation of its business, there can be no assurance that the Company’s insurance coverage will be sufficient, that any claim under its insurance policies will be honored fully or in a timely manner, or that the Company’s insurance premiums will not increase substantially. There can be no assurance that any claim under the Company’s insurance policies will be honoured fully or timely, the Company’s insurance coverage will be sufficient in any respect or its insurance premiums will not change substantially. Accordingly, to the extent that the Company suffers loss or damage that is not covered by insurance or that exceeds the Company’s insurance coverage, or are required to pay higher insurance premiums, the Company’s business, financial condition and results of operations
may be materially and adversely affected.
The Company’s business could be negatively affected by the actions of activist shareholders.
Certain of the Company’s shareholders may from time to time advance shareholder proposals or otherwise attempt to effect changes or acquire control over the Company’s business. Campaigns by shareholders to effect changes at publicly listed companies are sometimes led by investors seeking to increase short-term shareholder value by advocating corporate actions such as financial restructuring, increased borrowing, special dividends, stock repurchases or even sales of assets or the entire Company, or by voting against proposals put forward by the board of directors and management of the Company. If faced with actions by activist shareholders, the Company may not be able to respond effectively to such actions, which could be disruptive to its business.
Political and Regulatory Risks
India’s obligations under the World Trade Organization Agreement could materially affect the Company’s business.
India’s obligations under its World Trade Organization agreement could reduce the present level of tariffs on imports of components and vehicles. Reductions of import tariffs could result in increased competition, which in turn could materially and adversely affect the Company’s sales, business, financial condition and results of operations.
New or changing laws, regulations and government policies regarding increased fuel economy, reduced greenhouse gas and other emissions, vehicle safety and taxes may have significant impact on the Company’s business
As an automobile company, the Company is subjected to extensive governmental regulations regarding vehicle emission levels, noise, safety and levels of pollutants generated by its production facilities. In particular, the United States and Europe have stringent regulations relating to vehicle emissions. The contemplated tightening of vehicle emissions regulations by the European Union will require significant costs for compliance. In China, further regulations are being introduced by Chinese government in the short to medium term future relating to greenhouse gas emissions and other environmental concerns. While the Company is pursuing various technologies in order to meet the required standards in the various countries in which it sells its vehicles, the costs for compliance with these required standards may be significant to the Company’s operations and may adversely impact its results

Corporate Overview Financial StatementsStatutory Reports
130 72nd Annual Report 2016-17
of operations. They may also result in limiting the type of vehicles the Company sells and where the Company sells them, which may affect the Company’s revenues.
In order to comply with current and future safety and environmental norms, the Company may have to incur additional capital expenditure and Research & Development expenditure to (i) operate and maintain the Company’s production facilities, (ii) install new emissions controls or reduction technologies, (iii) purchase or otherwise obtain allowances to emit greenhouse gases, (iv) administer and manage the Company’s greenhouse gas emissions program, and (v) invest in Research and Development to upgrade products and manufacturing facilities. If the Company is unable to develop commercially viable technologies or otherwise unable to attain compliance within the time frames set by the new standards, the Company could face significant civil penalties or be forced to restrict product offerings significantly. For example, in the United States, manufacturers are subject to substantial civil penalties if they fail to meet federal Corporate Average Fuel Economy, or CAFE, standards. These penalties are calculated at $5.50 for each tenth of a mile below the required fuel efficiency level for each vehicle sold in a model year in the U.S. market. As with many European manufacturers, since 2010, Jaguar Land Rover has paid total penalties of US$46 million for its failure to meet CAFE standards. Jaguar Land Rover could incur a substantial increase in these penalties, including as a result of announced increases in CAFE civil penalties to adjust for inflation. Moreover, safety and environmental standards may at times impose conflicting imperatives, which pose engineering challenges and would, among other things, increase the Company’s costs.
The Motor Vehicles (Amendment) Bill, 2017 has been passed in Lok Sabha on April 10, 2017 and presently the Bill is under scrutiny of the Rajya Sabha. This Bill addresses various issues regarding road safety, traffic management & other matters. It provides for the imposition of hefty penalties on vehicle manufacturers found producing faulty vehicles. The Bill proposes for a National Road Safety Board, to be created by the Central Government through a notification. The Board will provide advice to the Central and State Governments on all aspects of road safety and traffic management.
The Government of India had proposed a comprehensive national goods and services tax, or GST, regime that would combine taxes and levies by the central and state governments into one unified rate structure. While both the Government of India and state governments of India have publicly announced that all committed incentives will be protected following the implementation of the GST, given the limited availability of information on incentives and
refunds, the Company is unable to provide any assurance as to this or any other aspect of the tax regime following implementation of the GST.
The Central Goods and Services Tax Bill (CGST), the Integrated Goods and Services Tax Bill (IGST) the Goods and Services Tax (Compensation to States) Bill and the Union Territory Goods and Services Tax Bill (UTGST) were passed by Lok Sabha on April 6, 2017 and so far 17 States have passed SGST Laws as on May 23, 2017. The Government of India has publicly announced its intention to implement the GST on July 1 2017. With the progress made so far, this seems to be a realistic timeline.
Imposition of any additional taxes and levies designed to limit the use of automobiles could adversely affect the demand for the Company’s vehicles and the Company’s results of operations. Changes in corporate and other taxation policies as well as changes in export and other incentives given by various governments or import or tariff policies could also adversely affect the Company’s results of operations. For instance, the United Kingdom’s exit from the European Union would result in material changes to the UK’s tax, tariff and fiscal policies. In addition, the incoming U.S. presidential administration could seek to introduce changes to laws and policies governing international trade and impose additional tariffs and duties on foreign vehicle imports, which could have a material adverse effect on the Company’s sales in the United States. Furthermore, Brazil in recent years increased import duty on foreign vehicles, which put pressure on sales margins in Brazil and prompted the Company to enter into discussions with the Brazilian government to exempt a certain number of imported vehicles from the increased tariff. Such government actions may be unpredictable and beyond the Company’s control, and any adverse changes in government policy could have a material adverse effect on the Company’s business prospects, results of operations and financial condition.
Evaluating and estimating the Company’s provision and accruals for the Company’s taxes requires significant judgement. As the Company conducts its business, the final tax determination may be uncertain. The Company operates in multiple geographical markets and the Company’s operations in each market are susceptible to additional tax assessments and audits. The Company’s collaborations with business partners are similarly susceptible to such tax assessments.
Authorities may engage in additional reviews, inquiries and audits that disrupt the Company’s operations or challenge the Company’s conclusions regarding tax matters. Any resulting tax assessment may be accompanied by a penalty or additional fee for failing to

Notice Board’s Report Corporate Governance Report Business Responsibility ReportManagement Discussion & Analysis
(118-165)
131
make the initial payment. The Company’s tax rates may be affected by earnings estimation errors, losses in jurisdictions that do not grant a related tax benefit, changes in currency rates, acquisitions, investments, or changes in laws, regulations, or practices. Additionally, government fiscal pressures may increase the likelihood of adverse or aggressive interpretations of tax laws or regulations or the imposition of arbitrary or onerous taxes, interest charges and penalties. Tax assessments may be levied even where the Company considers its practices to comply with tax laws and regulations. Should the Company challenge such taxes or believe them to be without merit, the Company may nonetheless be required to pay them? These amounts may be materially different from the Company’s expected tax assessments and could additionally result in expropriation of assets, attachment of additional securities, liens, imposition of royalties or new taxes and requirements for local ownership or beneficiation.
Regulations in the areas of investments, taxes and levies may also have an impact on Indian securities, including the Company’s Shares and ADSs.
In 2014, the antitrust regulator in China, the Bureau of Price Supervision and Anti-Monopoly of the National Development and Reform Commission (the ‘‘NDRC’’), launched an investigation into the pricing practices of more than 1,000 Chinese and international companies in the automotive industry, including Jaguar Land Rover and many of its competitors. The NDRC has reportedly imposed fines on certain of the Company’s international competitors as a result of anti-competitive practices pertaining to vehicle and spare-part pricing. In response to this investigation, Jaguar Land Rover established a process to review our pricing in China and announced reductions in the manufacturer’s suggested retail price for the 5.0-liter V8 models, which include the Range Rover, Range Rover Sport and F-Type and the price of certain of our spare parts. Further imposition of price reductions and other actions taken in relation to Jaguar Land Rover’s products may significantly reduce its revenues and profits generated by operations in China and have a material adverse effect on the Company’s financial condition and results of operations. As a result, the Jaguar Land Rover’s attempts to offset the potential decline in revenue and profits by increasing operational efficiencies and leveraging economies of scale (for example, through local production in China) may fail or not be as successful as expected. Furthermore, any regulatory action taken or penalties imposed by regulatory authorities may have significant adverse financial and reputational consequences on the Company’s business and have a material adverse effect on the Company’s results of operations and financial condition.
On March 29, 2017, the Supreme Court of India prohibited the sale and registration of Bharat Stage III vehicles from April 1, 2017. The Supreme Court’s judgment overturned a government regulation, and was unexpected. The Government of India has applied to the Supreme Court for a grant of appropriate time for manufacturers to dispose Bharat Stage III vehicles in their inventory. This application is currently pending. Similarly a review petition filed by the Society of Indian Manufacturers, or SIAM, is also currently pending. The Supreme Court’s decision resulted in a provision of R148 crores for the unsold inventory of BSIII vehicles at the year end of March 31, 2017. The Company cannot guarantee a favorable outcome for either the Government of India’s application or SIAM’s review petition. Any future potential or real unexpected change in law could havecould have a material adverse effect on the Company’s business prospects, results of operations and financial condition.
The Company may be affected by competition law in India and any adverse application or interpretation of the Competition Act could adversely affect the Company’s business.
The Indian Competition Act oversees practices having an appreciable adverse effect on competition, or AAEC, in a given relevant market in India. Under the Competition Act, any formal or informal arrangement, understanding or action in concert, which causes or is likely to cause an AAEC, is considered void and results in imposition of substantial penalties. Consequently, all agreements entered into by the Company could be within the purview of the Competition Act. Furthermore, any agreement among competitors which directly or indirectly involves determination of purchase or sale prices, limits or controls production, sharing the market by way of geographical area or number of subscribers in the relevant market or which directly or indirectly results in bid-rigging or collusive bidding is presumed to have an AAEC in the relevant market in India and is considered void. The Competition Act also prohibits abuse of a dominant position by any enterprise. The Company cannot predict with certainty the impact of the provisions of the Competition Act on the Company’s agreements at this stage.
On March 4, 2011, the Government of India issued and brought into force the combination regulation (merger control) provisions under the Competition Act with effect from June 1, 2011. These provisions require acquisitions of shares, voting rights, assets or control or mergers or amalgamations that cross the prescribed asset- and turnover-based thresholds to be mandatorily notified to and pre-approved by the Competition Commission of India, or CCI. Additionally, on May 11, 2011, the CCI issued the Competition Commission of India (Procedure for Transaction of Business Relating

Corporate Overview Financial StatementsStatutory Reports
132 72nd Annual Report 2016-17
to Combinations) Regulations, 2011 (as amended), which sets out the mechanism for the implementation of the merger control regime in India.
Furthermore, the CCI has extraterritorial powers and can investigate any agreements, abusive conduct or combination occurring outside India if such agreement, conduct or combination has an AAEC in India. The CCI has initiated an inquiry against the Company and other car manufacturers, collectively referred to hereinafter as the OEMs, pursuant to an allegation that genuine spare parts of automobiles manufactured by the OEMs were not made freely available in the open market in India and, accordingly, anti-competitive practices were carried out by the OEMs.
If the Company is adversely affected, directly or indirectly, by the application or interpretation of any provision of the Competition Act, or any enforcement proceedings initiated by the CCI, or any adverse publicity that may be generated due to scrutiny or prosecution by the CCI or if any prohibition or substantial penalties are levied under the Competition Act, it could adversely affect the Company’s business, financial condition and results of operations.
Compliance with new or changing corporate governance and public disclosure requirements adds uncertainty to the Company’s compliance policies and increases the Company’s costs of compliance.
The Company is subjected to a complex and continuously changing regime of laws, rules, regulations and standards relating to accounting, corporate governance and public disclosure, including the Sarbanes-Oxley Act of 2002 and U.S. Securities and Exchange Commission, or SEC, regulations, Securities and Exchange Board of India, or SEBI, regulations, New York Stock Exchange, or NYSE, listing rules, and the Companies Act, as well as Indian stock market listing regulations. New or changed laws, rules, regulations and standards may lack specificity and are subject to varying interpretations. As an example, pursuant to the U.S. Dodd-Frank Wall Street Reform and Consumer Protection Act, which contains significant corporate governance and executive compensation-related provisions, the SEC has adopted additional rules and regulations in areas such as “say on pay”. Similarly, under applicable Indian laws, for example, remuneration packages may, in certain circumstances, require shareholders’ approval. The Company’s management and other personnel may be required to devote a substantial amount of time to such compliance initiatives. Their application in practice may evolve over time as new guidance is provided by regulatory and governing bodies. This could result in continuing uncertainty regarding compliance matters and higher costs of compliance as
a result of ongoing revisions to such governance standards. The Company is committed to maintaining high standards of corporate governance and public disclosure. However, the Company’s efforts to comply with evolving laws, rules, regulations and standards in this regard have resulted in, and are likely to continue to result in, increased general and administrative expenses and a diversion of management resources and time.
The Companies Act has effected significant changes to the existing Indian Company law framework, which may subject the Company to higher compliance requirements and increase the Company’s compliance costs. The Companies Act brought into effect significant changes to the Indian Company law framework, such as in the provisions related to the issue of capital (including provisions in relation to issue of securities on a private placement basis), disclosures in offering documents, corporate governance norms, accounting policies and audit matters, related party transactions, introduction of a provision allowing the initiation of class action suits in India against companies by shareholders or depositors, a restriction on investment by an Indian Company through more than two layers of subsidiary investment companies (subject to certain permitted exceptions), prohibitions on loans to directors and insider trading, including restrictions on derivative transactions concerning a Company’s securities by directors and key managerial personnel. The Company is also required to spend, in each financial year, at least 2% of the Company’s average net profits during the three immediately preceding financial years, calculated for Tata Motors Limited on a standalone basis under Ind AS, toward corporate social responsibility activities. Furthermore, the Companies Act imposes greater monetary and other liability on the Company and it’s directors for any non-compliance. To ensure compliance with the requirements of the Companies Act, the Company may need to allocate additional resources, which may increase the Company’s regulatory compliance costs and divert management’s attention. The Company may also face challenges in interpreting and complying with certain provisions of the Companies Act due to limited relevant jurisprudence. In the event that the Company’s interpretation of the Companies Act differs from, or contradicts with, any judicial pronouncements or clarifications issued by the Government of India in the future, The Company may face regulatory actions or be required to undertake remedial steps. In addition, some of the provisions of the Companies Act overlap with other existing laws and regulations (such as corporate governance provisions and insider trading regulations issued by SEBI). The SEBI recently promulgated the SEBI (Listing Obligations and Disclosure Requirements) Regulations, 2015, or the Listing Regulations, which are applicable to all Indian

Notice Board’s Report Corporate Governance Report Business Responsibility ReportManagement Discussion & Analysis
(118-165)
133
companies with listed securities or companies intending to list its securities on an Indian Stock Exchange, and the Listing Regulations became effective on December 1, 2015. Pursuant to the Listing Regulations, the Company is required to ensure that the Company’s board of directors includes at least one female director at all times, to establish and maintain a vigilance mechanism for directors and employees to report their concerns about unethical behavior, actual or suspected fraud or violation of the Company’s Code of Conduct or ethics policy under the Company’s whistleblower policy, to implement increased disclosure requirements for price sensitive information.
The Company is subject to risks associated with legal proceedings and governmental investigations, including potential adverse publicity as a result thereof.
The Company is and may be involved from time to time in civil, labour, administrative or tax proceedings arising in the ordinary course of business. It is not possible to predict the potential for, or the ultimate outcomes of, such proceedings, some of which may be unfavorable to the Company. In such cases, the Company may incur costs and any mitigating measures (including provisions taken on the Company’s balance sheet) adopted to protect against the impact of such costs may not be adequate or sufficient. In addition, adverse publicity surrounding legal proceedings, government investigations or allegations may also harm the Company’s reputation and brands.
The Company may have to comply with more stringent foreign investment regulations in India in the event of an increase in shareholding of non-residents or if the Company is considered as engaged in a sector in which foreign investment is restricted.
Indian companies, which are owned or controlled by non-resident persons, are subject to investment restrictions specified in the Consolidated FDI (Foreign Direct Investment) Policy. Under the Consolidated FDI Policy, an Indian company is considered to be “owned” by non-resident persons if more than 50% of its equity interest is beneficially owned by non-resident persons. The non-resident equity shareholding in the Company may, in the near future, exceed 50%, thereby resulting in the Company being considered as being “owned” by non-resident entities under the Consolidated FDI Policy. In such an event, any investment by the Company in existing subsidiaries, associates or joint ventures and new subsidiaries, associates or joint ventures will be considered as indirect foreign investment and shall be subject to various requirements specified under the Consolidated FDI Policy, including sectoral limits, approval requirements and pricing guidelines, as may be applicable.
Furthermore, as part of its automotive business, the Company supplies and has in the past supplied, vehicles to Indian military and paramilitary forces and in the course of such activities have obtained an industrial license from the Department of Industrial Policy. The Consolidated FDI policy applies different foreign investment restrictions to companies based upon the sector in which they operate. While the Company believes it is an automobile company by virtue of the significance of its automobile operations, in the event that foreign investment regulations applicable to the defense sector (including under the Consolidated FDI Policy) are made applicable to it, the Company may face more stringent foreign investment restrictions and other compliance requirements compared to those applicable to it presently, which, in turn, could materially affect the Company’s business, financial condition and results of operations.
The Company requires certain approvals or licenses in the ordinary course of business, and the failure to obtain or retain them in a timely manner, or at all, may adversely affect its operations.
The Company requires certain statutory and regulatory permits, licenses and approvals to carry out its business operations and applications for their renewal need to be made within certain periods. For some of the approvals, which may have expired, the Company either has made, or is in the process of making, an application for obtaining the approval or its renewal. While the Company has applied for renewal for such approvals, registrations and permits, the Company cannot assure you that it will receive them in a timely manner or at all. The Company can make no assurances that the approvals, licenses, registrations and permits issued to it would not be suspended or revoked in the event of non-compliance or alleged non-compliance with any terms or conditions thereof, or pursuant to any regulatory action. Furthermore, if the Company is unable to renew or obtain necessary permits, licenses and approvals on acceptable terms in a timely manner, or at all, its business, financial condition and results of operations could be materially and adversely affected.
Any downgrading of India’s debt rating by a domestic or international rating agency could negatively impact the Company’s business.
Any adverse revisions to India’s credit ratings for domestic and international debt by domestic or international rating agencies could adversely impact the Company’s ability to raise additional financing, as well as the interest rates and other commercial terms at which such additional financing is available. This could have a

Corporate Overview Financial StatementsStatutory Reports
134 72nd Annual Report 2016-17
material adverse effect on the Company’s financial results, business prospects, ability to obtain financing for capital expenditures and the price of the Company’s Shares and ADSs.
Business Summary
The Company primarily operates in the automotive segment. The Company’s automotive segment operations include all activities relating to the development, design, manufacture, assembly and sale of vehicles including vehicle financing, as well as sale of related parts and accessories. The acquisition of the Jaguar Land Rover business has enabled the Company to enter the premium car market in developed markets such as the United Kingdom, the United States, Europe and China as well as several emerging markets such as Russia, Brazil and South Africa amongst others. Going forward, the Company expects to focus on profitable growth opportunities in its global automotive business through new products and market expansion. Within automotive operations, the Company continues to focus on integration and synergy through sharing of resources, platforms, facilities for product development and manufacturing, sourcing strategy and mutual sharing of best practices.
The Company’s business segments are (i) automotive operations and (ii) all other operations. The Company provide financing for vehicles sold by dealers in India. The vehicle financing is intended to encourage sales of vehicles by providing financing to the dealers’ customers and as such is an integral part of the Company’s automotive business. The Company’s automotive operations are further subdivided into Tata and other brand vehicles (including vehicle financing) and Jaguar Land Rover. Tata and other brand vehicles consist of vehicles manufactured under Tata, Daewoo and Fiat brands, and exclude vehicles manufactured under Jaguar Land Rover brands.
The Company’s produce a wide range of automotive products, including:
Passenger Cars: The Company’s range of Tata-branded passenger cars include the Nano (micro), the Indica, the Bolt, the Tiago (compact) in the hatchback category the Indigo eCS, and the Zest (mid-sized) and Tigor in the sedan category. The Company has expanded its passenger car range with several variants and fuel options designed to suit various customer preferences. The Company’s Jaguar Land Rover operations have an established presence in the premium passenger car category under the Jaguar brand name. Current cars lines manufactured under the Jaguar brand name, include the F-TYPE two-seater sports car coupe and convertible, the XF
sedan (including the long wheel base XFL), the XJ saloon, the XE sports saloon and Jaguar’s luxury performance SUV the F-PACE.
Utility Vehicles: The Company manufactures a range of Tata brand utility vehicles, including the Hexa a crossover, the Sumo and the Safari, which are SUVs and the Venture, a multipurpose utility vehicle. The Company offers two variants of the Safari: the Dicor and the Storme. The Company also offer a variant of the Sumo, the Sumo Gold, which is an entry level UV. Current lines manufactured under the Land Rover brand include the Range Rover, Range Rover Sport, Range Rover Evoque (including the Evoque convertible), the all new Land Rover Discovery (which went on sale in February 2017) and the Land Rover Discovery Sport. The new Range Rover Velar was revealed to the public in March 2017, and is the fourth Range Rover model, positioned between the Range Rover Evoque and the Range Rover Sport. The Velar is expected to commence sale during the summer of 2017.
Light Commercial Vehicles: The Company manufacture a variety of light commercial vehicles, including pickup trucks and small commercial vehicles. This includes the Tata Ace, India’s first indigenously developed mini-truck, with a 0.7 ton payload with different fuel options; the Super Ace, with a 1-ton payload; the Ace Zip, with a 0.6 ton payload; the Magic and the Magic Iris, including an electric variant, both of which are passenger variants for commercial transportation developed on the Tata Ace platform; and the Winger. In addition, the Company launched the Xenon Yodha pickup truck and Magic Mantra passenger carrier in Fiscal 2017.
Medium and Heavy Commercial Vehicles: The Company manufactures a variety of medium and heavy commercial vehicles, which include trucks, tractors, buses, tippers, and multi-axle vehicles, with GVWs (including payload) of between 8 tons and 49 tons. In addition, through Tata Daewoo Commercial Vehicle Co. Ltd., or TDCV, the Company manufactures a wide array of trucks ranging from 215 horsepower to 560 horsepower, including dump trucks, tractor-trailers, mixers and cargo vehicles. The company’s signature product is the Prima and Prima LX range of trucks, which are sold in India and South Korea as well as exported to a number of countries in South Asia, Middle East and Africa. The SIGNA range of new M&HCV trucks launched in 2016 has been extended to several additional tractor and tipper variants. The Company also offers a range of buses, which includes the Semi Deluxe Starbus Ultra Contract Bus and the

Notice Board’s Report Corporate Governance Report Business Responsibility ReportManagement Discussion & Analysis
(118-165)
135
new Starbus Ultra. The Company’s range of buses is intended for a variety of uses, including as intercity coaches (with both air-conditioned and non-air-conditioned luxury variants), as school transportation and as ambulances. In Fiscal 2017, the Company introduced a range of electric and hybrid passenger products including the Starbus Electric 9m/12m and Starbus Hybrid 12m.
The Company’s other operations business segment mainly includes information technology services, and machine tools and factory automation services.
The Company’s Strategy
The Company intends to further strengthen its position in the Indian automobile industry by launching new products, investing in research and development, strengthening Company’s financial position and expanding its manufacturing and distribution network. The Company have pursued a strategy of increasing its presence in the global automotive markets and enhancing its product range and capability through strategic acquisitions and alliances. The Company’s goal is to position itself as a major international automotive company by offering products across various markets by combining its engineering and other strengths as well as through strategic acquisitions. The Company’s strategy to achieve these goals consists of the following elements:
Continued focus on new product development: The Company’s recent product launches and anticipated product launches include the following:
Xenon Yodha Pickup: The Xenon Yodha is a reliable new Pick-up range, with high levels of performance at a low operating cost.
SIGNA range of M&HCVs: The SIGNA range offers improved cab experience, connected vehicle-related functionalities and an improved driveline, as compared to prior models. This range is being extended across the heavy product line.
Magic Mantra: The Magic Mantra is a small passenger vehicle in the SCV segment, which offers performance combined with fuel efficiency and a low cost of ownership.
Electric and Hybrid Bus range: Tata Motors launched two variants of its emission-free, ultra-quiet and efficient STARBUS ELECTRIC buses and the STARBUS HYBRID diesel-electric hybrid bus. The STARBUS HYBRID is the most advanced bus in India
Hexa: Contemporary SUV was launched in January 2017.
Tigor: Subcompact sedan was launched in March 2017
Nexon: Subcompact SUV is expected to go on sale in Fiscal 2018.
Jaguar XE: The all new Jaguar XE went on retail sale in the US in May 2016.
Jaguar XFL: The all new long wheel base Jaguar XFL, specifically designed for the China market, is produced by or China joint venture and went on sale in September 2016.
Jaguar F-PACE: The Jaguar F-PACE luxury performance SUV went on sale in April 2016.
Range Rover Evoque: The new Range Rover Evoque convertible went on sale in June 2016.
Land Rover Discovery: The all new Land Rover Discovery went on sale in February 2017.
The new Range Rover Velar was revealed to the public in March 2017 and is the fourth Range Rover model positioned between the Range Rover Evoque and the Range Rover Sport. The Velar is due to go on sale during the summer of 2017.
Production of JLR’s in-house 4 cylinder Ingenium petrol engine commenced at the Engine Manufacturing Centre in Wolverhampton in the UK in September 2016 and is now available in the Jaguar XE, XF, F-PACE and in the Land Rover Discovery Sport and the Range Rover Evoque. The Ingenium petrol engine will also be available in the new Range Rover Velar from launch.
The Jaguar I-PACE concept, JLR’s first battery electric vehicle, was revealed to the public in November 2016 and will go on sale in 2018.
Further, during Fiscal 2017, The Company increased its global presence by launching the Super Ace in Vietnam; the Xenon pickup, Super Ace and LCV Truck in Bolivia; the Prima truck in Bhutan and the Kingdom of Saudi Arabia and the Ultra truck in Kenya. The Company also signed orders to supply 562 buses to the Government of Côte d’Ivoire; 67 Winger ambulances to the Government of Sri Lanka and 553 Xenon pickups to POS Malaysia.
The Company’s research and development focuses on developing and acquiring the technology, core competencies and skill sets required for the timely delivery of its envisaged future product portfolio with industry-leading features across it’s range of commercial and passenger vehicles. For the passenger vehicle product range, the Company’s focus is on stunning design, driving

Corporate Overview Financial StatementsStatutory Reports
136 72nd Annual Report 2016-17
pleasure and connected car technologies. For the commercial vehicle product range, the Company’s focus is on enhancing fuel-efficiency and minimizing the total cost of ownership. The Company continue to endeavour to adopt technologies for its product range to meet the requirements of a globally competitive market. The Company has also undertaken programs for development of vehicles, which run on alternate fuels such as LPG, CNG, bio-diesel, electric-traction and hydrogen.
The Company has plans to expand the range of its product base further supported by its strong brand recognition in India, its understanding of local consumer preferences, in-house engineering capabilities and extensive distribution network. With growing competition, changing technologies and evolving customer expectations, the Company understand the importance of bringing new platforms to address market gaps and further enhance it’s existing range of vehicles to ensure customer satisfaction. The Company’s capital expenditures totaled R31,750.74 crores and R31,425.39 crores during Fiscal 2017 and 2016, respectively, and the Company currently plans to invest approximately R400 billion in Fiscal 2018 in capacity, new products and technologies.
Jaguar Land Rover has invested to enhance its technological expertise through in-house R&D activities, including the development of its engineering and design centers, which centralize Jaguar Land Rover’s capabilities in product design and engineering. Furthermore, Jaguar Land Rover participates in advanced research consortia that bring together leading manufacturers, suppliers and academic specialists in the United Kingdom and are supported by funding from the UK Government’s Technology Strategy Board.
Leveraging the Company’s capabilities: The Company believe that the foundation of its growth over the last five decades has been a deep understanding of economic conditions and customer needs, and the ability to translate this understanding into desirable products though research and development. In India, Company’s Engineering Research Centre, or ERC, established in 1966, has enabled it to successfully design, develop and produce its own range of vehicles. Jaguar Land Rover’s research and development operations are built around state-of-the-art engineering facilities, extensive test tracks, testing centers, design hubs and a virtual innovation center. The Engineering Research Centre, or ERC, in India and Jaguar Land Rover engineering and development operations in the United Kingdom have identified areas to leverage the facilities and resources to enhance the product development process and achieve economies of scale. Furthermore, the Company have a wholly-owned subsidiary, Tata Motors European Technical Centre
PLC, or TMETC, in the United Kingdom, which is engaged in automobile research and engineering.
The Company believes that its in-house research and development capabilities, including those of its subsidiaries Jaguar Land Rover, TDCV and Trilix in Italy, TMETC in the United Kingdom and Company’s joint ventures with Marcopolo S.A. of Brazil in India, with Thonburi in Thailand and Tata Africa Holdings (SA) (Proprietary) Ltd. in South Africa, will enable it to expand it’s product range and extend the Company’s geographical reach. The Company continually strive to achieve synergy wherever possible with its subsidiaries and joint ventures.
The Company has continued modernizing its facilities to meet demand for its vehicles. The Company’s Jamshedpur plant, which manufactures Company’s entire range of M&HCVs, including the Prima, both for civilian and defense uses, was Company’s first plant, set up in 1945 to manufacture steam locomotives. It led Company’s entry into commercial vehicles in 1954.
The Company’s product portfolio of Tata-brand vehicles includes the Nano, Indica, Tiago, Indigo, Sumo, Sumo Grande, Safari, Safari Storme, Aria, Zest, Bolt, Tigor, Hexa and Venture, which enable it to compete in various passenger vehicle market categories. The Company also offer alternative fuel vehicles under the Nano and Indigo brands. The Company also intend to expand its sales reach and volumes in rural areas, where an increase in wealth has resulted in a declining difference between urban and rural automobile purchase volumes.
Jaguar Land Rover invests substantially in the development of new products in new and existing segments by introducing new powertrains and technologies, including CO2 reduction and electrification that satisfy both customer preferences and regulatory requirements. Jaguar Land Rover also invest in expanding manufacturing capacity in the United Kingdom and internationally to meet customer demand. Jaguar Land Rover expects investment spending to be over GB£ 4 billion (approximately R324 billion) in Fiscal 2018 reflecting its growth plans. Of the GB£ 4 billion around half is expected to be spent on research & development with the other half expected to be spent on tangible fixed assets such as facilities, tools and equipment as well as other investments.
In October 2014, Jaguar Land Rover opened its Engine Manufacturing Centre at Wolverhampton, in the West Midlands. The plant currently manufactures Jaguar Land Rover’s own in-house 2.0-litre diesel and petrol engines, which are now available across the majority of company’s models. Jaguar Land Rover’s in-house engines have been engineered to ensure maximum manufacturing

Notice Board’s Report Corporate Governance Report Business Responsibility ReportManagement Discussion & Analysis
(118-165)
137
efficiency, flexibility to increase the number of engine variants and consistently high quality. In December 2015, Jaguar Land Rover announced initial investment of GB£1.0 billion to build a manufacturing facility in Slovakia (Europe) with annual capacity of 150,000 units and production scheduled to commence from FY 2018. Jaguar Land Rover have the option to investment a further GB£ 500 million to expand capacity to 300,000 units per annum subject to further feasibility studies. In June 2016, Jaguar Land Rover opened it’s first wholly owned international manufacturing plant in Brazil, which manufactures the Evoque and Discovery Sport for the local market.
Continuing focus on high quality and enhancing customer satisfaction: One of Company’s principal goals is to achieve international quality standards for its products and services. The Company has established a comprehensive purchasing and quality control system that is designed to consistently deliver quality products and superior service. The Company also have a program for assisting vendors from whom the Company purchases raw materials or components to maintain quality. Each vendor is reviewed on a quarterly basis on parameters of quality, cost and delivery and preference is given to vendors with TS 16949 certification.
Through close coordination supported by company’s IT systems, the Company monitors quality performance in the field and implement corrections on an ongoing basis to improve the performance of company’s products, thereby improving customer satisfaction. The Company believes its extensive sales and service network has also enabled it to provide quality and timely customer service. The Company is encouraging focused initiatives at both sales and service touch points to enhance customer experience and strive to be best in class, and The Company believes that the reach of its sales, service and maintenance network provides it with a significant advantage over its competitors. In India, the Company improved its J.D. Power Asia Pacific 2016 India Customer Service Index (CSI) Study score and the Company moved up from the third ranking last year to the second ranking in that survey.
The Company is committed to satisfying its customers with high quality products and services. As recognition of Company’s efforts towards this it won several awards at the Apollo CV awards in February 2017, with the Tata Armoured Personal Carrier winning special CV Application of the Year; Prima 2528.K winning MCV Tipper of the Year; Signa 4923.S tractor winning HCV Tractor Cargo Carrier of the Year and the Tata Double Deck tractor trailer winning CV application builder of the Year. One of Company’s dealerships, Cargo Motors, won the Dealership of the Year award.
In passenger vehicles segment, the Tiago received a strong responses and accolades with 18 awards during the year. As a key stakeholder in the Indian trucking industry, the Company launched the “Use Dipper at Night” campaign winning numerous global and regional awards.
Jaguar F-Pace won both the World Car of the Year and World Car design of the year award. Jaguar XF won the Golden Steering Wheel Award in Germany. Jaguar and Land Rover in total received 213 awards from leading international motoring writers, magazines and opinion leaders in Fiscal 2017 as well as numerous other awards, accolades and recognition reflecting the strength of company’s model line-up and its design and engineering capabilities.
Environmental performance: Jaguar Land Rover’s strategy is to invest in products and technologies that position their products ahead of expected stricter environmental regulations and ensure that they benefit from a shift in consumer awareness of the environmental impact of the vehicles driven by customers. The Company also believe that Jaguar Land Rover are leaders in automotive green technology in the United Kingdom. Jaguar Land Rover’s environmental vehicle strategy focuses on new propulsion technology, weight reduction and reducing parasitic losses through the driveline. They have developed diesel hybrid versions of the Range Rover and Range Rover Sport, without compromising the vehicles’ off road capability or load space.
Jaguar Land Rover are a global leader in the use of aluminium and other lightweight materials to reduce vehicle weight and improve fuel and CO2 efficiency, and Jaguar Land Rover believe that it is ahead of many of its competitors in the implementation of aluminium construction. For example, the Jaguar XE is the only vehicle in its class to use an aluminium intensive monocoque. Jaguar Land Rover plan to continue to build on this expertise and extend the application of aluminium construction as they develop a range of new products. The aluminium body architecture introduced on the Jaguar XE is also used in the new lightweight Jaguar XF and the new Jaguar F PACE and the all new Land Rover Discovery uses the same lightweight architecture as the Range Rover and Range Rover Sport.
Jaguar Land Rover are also developing more efficient powertrains and other technologies. This includes smaller and more efficient 2.0 litre diesel and petrol engines (now available across the majority of Company’s model range), stop start, mild and plug-in hybrids as well as battery electric propulsion technologies. Jaguar Land Rover’s smaller and more efficient family of Ingenium diesel and petrol engines as well the lightweight Range Rover and Range Rover

Corporate Overview Financial StatementsStatutory Reports
138 72nd Annual Report 2016-17
Sport Diesel Hybrids, powered by downsized and more efficient engines and alternative powertrains have all contributed to the improvement of their carbon footprint.
Jaguar Land Rover’s current product line up is the most efficient it has ever been and the environmental performance of their vehicles has been further improved through the launch of new models. The new Land Rover Discovery uses lightweight aluminium construction, which saves 480 kg compared to the old model, delivering enhanced efficiency and reduced CO2 emissions. The aluminium intensive Jaguar XE is the most fuel efficient Jaguar and the first Jaguar Land Rover vehicle to receive a UK VED Band A rating resulting in a £0/annum tax rate and the aluminium intensive XF delivers improved fuel consumption and CO2 emission performance. The 2.0-litre Ingenium diesel and petrol engines, now used extensively in the product line-up provide significant CO2 reductions versus the outgoing powertrains.
Jaguar Land Rover has pledged that by 2020 half of its model will have the option of electrification, a move spearheaded by its first full electric car, the Jaguar I-Pace. On sale in 2018, the I-Pace is a preview of the Jaguar Land Rover’s first production battery power car, and demonstrates its ongoing commitment to create exciting and desirable electric vehicles.
Recognizing the need to use resources responsibly, produce less waste and reduce Jaguar Land Rover’s carbon footprint, they are also taking measures to reduce emissions, waste and the use of natural resources in all of their operations.
Mitigating cyclicality: The automobile industry is impacted by cyclicality. To mitigate the impact of cyclicality, the Company plans to continually strengthen its operations through gaining market share across different segments, and offering a wide range of products in diverse geographies and segments, such as defence. The Company also plans to continue to strengthen its business operations other than vehicle sales, such as financing of its vehicles, spare part sales, service and maintenance contracts, sales of aggregates for non-vehicle businesses, reconditioning of aggregates and sale of castings, production aids and tooling/fixtures in order to reduce the impact of cyclicality of the automotive industry.
Expanding the Company international business: The Company’s international expansion strategy involves entering new markets where it has an opportunity to grow and introducing new products to existing markets in order to grow its presence in such markets. The Company’s international business strategy has already resulted in the growth of its international operations in select markets and chosen segments over the last five years. Based on
the Company’s internal assessments, in recent years, it has grown its market share across various African and Middle East markets such as Tanzania, Saudi Arabia, United Arab Emirates and Qatar in addition to maintaining its dominant market position in the South Asian markets of Bangladesh, Nepal and Sri Lanka based on data compiled by Company’s country managers. In keeping with the Company’s strategy to enter and grow in new regions, it has focused on business in the ASEAN countries, where in the recent years the Company entered Vietnam, Indonesia, Malaysia and the Philippines. Tunisia has been an example of a success story in a new market where over the last two years, the Company has entered and rapidly ramped up retails and is now a major player in the pickup segment.
The Company has also expanded its range through acquisitions and joint ventures. The Company now offer products in the premium performance car and premium all-terrain vehicle categories with globally recognized brands through Jaguar Land Rover and has diversified its business across markets and product categories. The production of the Range Rover Evoque commenced at the China Joint Venture in October 2014 and went on general retail sale in China in February 2015. Production of the Discovery Sport was also added as the second vehicle to be manufactured at the China joint venture in Fiscal 2016, which went on general retail sale in November 2015, and in September 2016, sales of the long wheelbase Jaguar XFL from Company’s China joint venture began. The Company will aim to continue to build upon the internationally recognized brands of Jaguar Land Rover.
The Company’s subsidiary, Tata Motors (Thailand) Limited, is also focusing on increasing its geographical reach by introducing Thailand-manufactured pickup trucks in other Asian markets. Thailand-produced pickup trucks were introduced in Malaysia in the beginning of Fiscal 2015. During Fiscal 2017, TMTL exported 317 vehicles to Malaysia.
During Fiscal 2008, the Company established a joint venture Company to undertake manufacture and assembly operations in South Africa, which has been one of its largest export markets from India in terms of unit volume. The joint venture Company, Tata Motors (SA) (Proprietary) Limited, commenced operations in July 2011. Currently, Tata Motors (SA) (Proprietary) Limited caters to the domestic South African market and Mozambique market and, in Fiscal 2017, sold 703 chassis.
Jaguar Land Rover also has ambitious plans to continue to develop the product range, for example the new Range Rover Velar, which goes on sale in the summer of 2017. Jaguar Land Rover intends

Notice Board’s Report Corporate Governance Report Business Responsibility ReportManagement Discussion & Analysis
(118-165)
139
to expand its global footprint by increasing marketing and its global dealer network as well as expanding its manufacturing base in the United Kingdom and internationally, including the new manufacturing facility in Brazil, which opened in June 2016, and at the new manufacturing plant in Slovakia where production of the Land Rover Discovery is scheduled to commence in Fiscal 2018.
Reducing operating costs: The Company believes that its scale of operations provides it with a significant advantage in reducing costs and it plans to continue to sustain and enhance this cost advantage. The Company’s ability to leverage its technological capabilities and its manufacturing facilities among it’s commercial vehicle and passenger vehicle businesses enables it to reduce cost. For example, the diesel engine used in its Indica was modified to engineer a new variant for use in the Ace platform, which helped to reduce the project cost. Similarly, platform sharing for the manufacture of pickup trucks and UVs enables the Company to reduce capital investment that would otherwise be required, while allowing it to improve the utilization levels at it’s manufacturing facilities. Where appropriate for the Company to do so, it intends to apply its existing low-cost engineering and sourcing capability to Jaguar Land Rover vehicles.
The Company’s vendor relationships also contribute to its cost reductions. For example, the Company believes that the vendor rationalization program that it is undertaking will provide economies of scale to its vendors, which would benefit it’s cost programs. The Company is also undertaking various internal and external benchmarking exercises that would enable it to improve the cost effectiveness of its components, systems and sub-systems.
The Company is intensified efforts to review and realign its cost structure through a number of measures such as reduction of labour costs and rationalization of other fixed costs The Jaguar Land Rover business continues to focus on cost management initiatives, such as streamlining its purchasing processes and building on its strong relationships with suppliers while increasing employee deployment and flexibility across its sites. In addition, Jaguar Land Rover continues to increase its use of its new modular aluminium architecture across vehicle platforms, which it expect will result in the use of common technology more widely across products lines and a reduction in engineering complexity.
Enhancing capabilities through the adoption of superior processes: Tata Sons and the entities promoted by Tata Sons, including the Company, aim at improving quality of life through leadership in various sectors of national economic significance. In pursuit of this goal, Tata Sons and the Tata Sons-promoted
entities have institutionalized an approach, called the Tata Business Excellence Model, which has been formulated along the lines of the Malcolm Baldrige National Quality Award to enable the Company to improve performance and attain higher levels of efficiency in the Company’s businesses and in discharging Company’s social responsibility. The model aims to nurture core values and concepts embodied in various focus areas such as leadership, strategic planning, customers, markets and human resources, and to translate them to operational performance. The Company’s adoption and implementation of this model seeks to ensure that its business is conducted through superior processes.
The Company has deployed a balance scorecard system for measurement-based management and feedback. The Company has also deployed a new product introduction process for systematic product development and a PLM system for effective product data management across its organization. The Company has adopted various processes to enhance the skills and competencies of its employees. The Company has also enhanced it’s performance management system, with appropriate mechanisms to recognize talent and sustain its leadership base. The Company believes these will enhance company’s way of doing business, given the dynamic and demanding global business environment.
Expanding customer financing activities: With financing a critical factor in vehicle purchases and in light of the rising aspirations of consumers in India, the Company intends to expand it’s vehicle financing activities to enhance its vehicle sales. In addition to improving its competitiveness in customer attraction and retention, the Company believes that expansion of its financing business would also contribute toward moderating the impact on it’s financial results from the cyclical nature of vehicle sales. To spur growth in the small commercial vehicles category, the Company has teamed up with various public sector and cooperative banks and Grameen banks to introduce new finance schemes. TMFL has increased its reach by opening a number of limited services branches in tier 2 and 3 towns. This has reduced turnaround times and, the Company believes, improved customer satisfaction. TMFL’s channel finance initiative and fee-based insurance support business have also helped improve profitability.
Similarly, the Company is working on arranging financing tie-ups in international market, which is critical in ramping up retails.
Continuing to invest in technology and technical skills: The Company believes it is one of the most technologically advanced indigenous vehicle manufacturers in India. Over the years, the Company has enhanced its technological strengths through

Corporate Overview Financial StatementsStatutory Reports
140 72nd Annual Report 2016-17
extensive in-house research and development activities. Further, the Company’s research and development facilities at its subsidiaries, such as TMETC, TDCV, TTL and Trilix, together with the two advanced engineering and design centers of Jaguar Land Rover, have increased its capabilities in product design and engineering. The Jaguar Land Rover business is committed to continue to invest in new technologies to develop products that meet the opportunities of the premium market, including developing sustainable technologies (i.e. plug-in hybrids and battery electric vehicles) that improve fuel economy and reduce CO2 emissions. The Company considers technological leadership to be a significant factor in its continued success, and therefore intends to continue to devote significant resources to upgrade its technological base.
Maintaining financial strength: The Company’s cash flow (consolidated basis) from operating activities in Fiscal 2017 and 2016 was R30,199.25 crores and R37,899.54 crores, respectively. The Company’s operating cash flows are primarily due to company’s Jaguar Land Rover business, implementation of cost reduction programs, and prudent working capital management. The Company has established processes for project evaluation and capital investment decisions with an objective to enhance its long-term profitability.
Automotive Operations
Automotive operations is the Company’s most significant segment, accounting for 99.3% and 99.5% of its total revenues in Fiscal 2017 and 2016 respectively. Revenue from automotive operations before inter-segment eliminations decreased by 1.3% to R2,72,692.41 crores in Fiscal 2017 as compared to R2,76,221.67 crores in Fiscal 2016.
The Company’s automotive operations include:
activities relating to the development, design, manufacture, assembly and sale of vehicles as well as related spare parts and accessories;
distribution and service of vehicles; and
financing of the Company’s vehicles in certain markets.
The Company’s consolidated total retail sales (including international business sales and Jaguar Land Rover sales, including Chery Jaguar Land Rover) for Fiscal 2017 and 2016 are set forth in the table below:
Fiscal 2017 Fiscal 2016Units % Units %
Passenger cars 3,19,638 27.6% 2,12,152 19.9%Utility vehicles 4,42,073 38.2% 4,61,491 43.4%
Light Commercial Vehicles 2,16,222 18.7% 2,05,531 19.3%Medium and Heavy Commercial Vehicles 1,79,875 15.5% 1,85,422 17.4%
Total 11,57,808 100.0% 10,64,596 100.0%
The automotive operations segment is further divided into (i) Tata and other brand vehicles (including vehicle financing) and (ii) Jaguar Land Rover.
Tata and other brand vehicles (including vehicle financing)
India is the primary market for Tata and other brand vehicles (including vehicle financing). During Fiscal 2017, there was a robust and steady pace of economic growth in the geographic markets in which the Tata and other brand vehicles segment has operations.
As per the advance estimates, the Indian economy experienced a GDP growth of 7.1% in Fiscal 2017, compared to 7.9% in Fiscal 2016 (based on data from the Ministry of Statistics and Program Implementation). The Indian automobile industry experienced an increase of 8.2% in Fiscal 2017, as compared to 8.0% in Fiscal 2016. The growth of the automobile sector was affected by demonetization in third quarter of the fiscal and ban on sale and registration of BSIII vehicles in March 2017. This has affected the performance of Tata and other brand vehicles, mainly the Medium and Heavy Commercial vehicles sales. The following table sets forth the Company consolidated total sales of Tata and other brand vehicles:
Fiscal 2017 Fiscal 2016Units % Units %
Passenger cars 1,40,887 25.3% 1,10,046 21.1%Utility vehicles 20,018 3.6% 19,512 3.8%
Light Commercial Vehicles 2,16,222 38.8% 2,05,531 39.5%Medium and Heavy Commercial Vehicles 1,79,875 32.3% 1,85,422 35.6%
Total 5,57,002 100.0% 5,20,511 100.0%
The Company’s overall sales of Tata and other brand vehicles increased by 7.0% to 5,57,002 units in Fiscal 2017 from 5,20,511 units in Fiscal 2016, and the revenue (before inter-segment elimination) increased by 5.6% to R56,448.78 crores during Fiscal 2017, compared to R53,462.52 crores in Fiscal 2016.
Vehicle Sales in India
Automobile sales across categories domestically rose by 8.2% in Fiscal 2017. Sale of passenger vehicles grew by 9.6% in Fiscal 2017,

Notice Board’s Report Corporate Governance Report Business Responsibility ReportManagement Discussion & Analysis
(118-165)
141
vehicles. Commercial vehicles include Medium & Heavy Commercial Vehicles and Light Commercial Vehicles.
Category Industry Sales Company Sales Market Share
Fiscal 2017 Fiscal 2016 Growth Fiscal 2017 Fiscal 2016 Growth Fiscal 2017 Fiscal 2016
Units % Units % %
Commercial Vehicles1 7,29,360 7,06,819 3.2% 3,24,175 3,26,755 (0.8)% 44.4% 46.2%
Passenger Vehicles2 30,34,670 27,68,290 9.6% 1,57,020 1,27,118 23.5% 5.2% 4.6%
Total 37,64,030 34,75,109 8.3% 4,81,195 4,53,873 6.0% 12.8% 13.1%Source:Society of Indian Automobile Manufacturers report and Company Analysis1 Commercial vehicles include V2 van sales.2 Passenger vehicles include Fiat and Jaguar Land Rover-branded cars.
Reflecting the growth in the Indian passenger vehicle sector, the Company’s passenger vehicle sales in India increased by 23.5% to 1,57,020 units in Fiscal 2017 from 1,27,118 units in Fiscal 2016, due to new product offerings by the Company.
Passenger Vehicles in India
Sales in the passenger vehicles industry in India increased by 9.6% in Fiscal 2017, primarily attributable to reduced fuel prices, improved consumer sentiments, and lower interest rates. Utility Vehicles sales witnessed significant growth during Fiscal 2017. Further, the van segment is also experiencing growth.
Category Industry Sales Company Sales Market Share
Fiscal 2017 Fiscal 2016 Growth Fiscal 2017 Fiscal 2016 Growth Fiscal 2017 Fiscal 2016
Units % Units % % %
Micro 7,591 21,007 (63.9)% 7,591 21,007 (63.9)% 100.0% 100.0%
Compact 12,68,965 11,87,725 6.8% 1,28,888 84,472 52.6% 10.2% 7.1%
Mid-Size 1,63,567 1,81,450 (9.9)% - 187 (100.0)% - 0.1%
Premium and Luxury 4,013 3,266 22.9% 696 1,161 (40.1)% 17.3% 35.5%
Utility Vehicles 7,69,055 5,94,443 29.4% 19,600 19,702 (0.5)% 2.5% 3.3%
Vans1 1,59,943 1,49,731 6.8% 245 589 (58.4)% 0.2% 0.4%
Total2 30,34,670 27,68,290 9.6% 1,57,020 1,27,118 23.5% 5.2% 4.6%Source: Society of Indian Automobile Manufacturers report and Company Analysis1 Excludes V2 van sales.2 Total industry numbers includes sale in other segments.
The Company’s passenger vehicles category consists of: (i) passenger cars and (ii) utility vehicles. The Company sold 1,37,175 units in the passenger car category in Fiscal 2017, representing an increase of 28.4% compared to 1,06,827 units in Fiscal 2016. In the utility vehicles (including vans), the Company sold 19,845 units in Fiscal 2017, representing a decrease of 2.2% from 20,291 units in
Fiscal 2016. During Fiscal 2017, the Company launched Tiago and sold 58,227 units. Hexa, a crossover was launched in January 2017 and Tata Tigor was launched in last week of March 2017. All these new product launches has helped Company increasing its market share and volumes in passenger vehicles category.
as compared to Fiscal 2016 whereas Commercial vehicle sales expanded by 3.2% in Fiscal 2017.
The following table sets forth the Company‘s (on standalone basis) sales, industry sales and relative market share in vehicle sales in India. Passenger vehicles includes passenger cars and utility

Corporate Overview Financial StatementsStatutory Reports
142 72nd Annual Report 2016-17
Commercial Vehicles in India
The following table sets forth the Company’s commercial vehicle sales, industry sales and relative market share in commercial vehicle sales in India.
Category Industry Sales Company Sales Market Share
Fiscal 2017 Fiscal 2016 Growth Fiscal 2017 Fiscal 2016 Growth Fiscal 2017 Fiscal 2016
Units % Units % % %
M&HCV 3,02,402 3,02,556 (0.1)% 1,48,774 1,57,120 (5.3)% 49.2% 51.9%
LCVs1 4,26,958 4,04,263 5.6% 1,75,401 1,69,635 3.4% 41.1% 42.2%
Total 7,29,360 7,06,819 3.2% 3,24,175 3,26,755 (0.8)% 44.4% 46.2%Source: Society of Indian Automobile Manufacturers report and Company Analysis1 LCVs include V2 van sales
vehicles manufactured in India - Bangladesh, Sri lanka, Nepal, South Africa and Tunisia accounted for approximately 85% of the exports of commercial vehicles and passenger vehicles.
In Fiscal 2017, TDCV’s overall vehicles sales increased by 13.2% to 10,317 units, from 9,116 units in Fiscal 2016, mainly due to increase in domestic sales. TDCV continued to have strong performance in the domestic market despite increased competition and increased sales by 25% to 8,795 vehicles, second highest in TDCV history, compared to sales of 7,036 vehicles in Fiscal 2016, primarily due to strong demand from construction sector and replacement demand including factors such as low interest rates and diesel prices. However, the export market was very challenging. Factors, such as- low oil prices, local currency depreciation against the US Dollar, continuing statutory regulations to reduce imports, the slowdown in Chinese economy impacting commodity exporting countries, and increased dealer inventory adversely impacted TDCV’s exports in major markets, such as GCC, Russia, Algeria, Vietnam and South Africa. The export sales were 1,522 commercial vehicles, 26.8% lower compared to 2,080 commercial vehicles in Fiscal 2016.
Tata and other brand vehicles — Sales, Distribution and Support
The Company’s sales and distribution network in India as at March 2017 comprised approximately 4,538 contact points for sales and service for its passenger and commercial vehicle business. The Company’s subsidiary, TML Distribution Company Limited, or TDCL, acts as a dedicated distribution and logistics management Company to support the sales and distribution operations of its vehicles in India. The Company believes this has improved the efficiency of its selling and distribution operations and processes. The Company uses a network of service centers on highways and
Industry sales of commercial vehicles increased by 3.2% to 729,360 units in Fiscal 2017 from 706,819 units in Fiscal 2016. Industry sales in the medium and heavy commercial vehicle segment remained flat at 302,402 units in Fiscal 2017, as compared to 302,556 in Fiscal 2016. The sector was hit by BSIII ban and demonetization, but improvement in economic conditions brought the sale level back to previous year. Industry sales of light commercial vehicles reported an increase of 5.6% to 4,26,958 units in Fiscal 2017, from 404,263 units in Fiscal 2016. The ban on BSIII vehicles saw unprecedented discounts in prices of vehicles, which resulted in the increase in sales at the end of the fiscal.
However, overall, sales of the Company’s commercial vehicles in India declined by 0.8% to 324,175 units in Fiscal 2017 from 326,755 units in Fiscal 2016. The Company’s sales in the medium and heavy commercial vehicle category decreased by 5.3% to 148,774 units in Fiscal 2017, as compared to sales of 157,120 units in Fiscal 2016. However, sales in the light commercial vehicles segment increased by 3.4% to 175,401 units in Fiscal 2017, from 169,635 units in Fiscal 2016. The customers in this segment are waiting for clarity about GST, which may bring prices down. The other factors like emission norms, Bus code for safer and comfortable journey, etc. affected this segment.
Tata and other brand vehicles — International Markets
The Company’s exports (on standalone basis) grew by 10.6% to 64,221 units in Fiscal 2017 as compared to 58,058 units in Fiscal 2016. The increase of imports in Nepal provided an opportunity for the Company. The launch of new models in the Middle East and Africa region, along with the opening of new markets in these regions, contributed to an increase in international sales volumes. The Company’s top five (quantity terms) export destinations for

Notice Board’s Report Corporate Governance Report Business Responsibility ReportManagement Discussion & Analysis
(118-165)
143
a toll-free customer assistance center to provide 24-hour roadside assistance, including replacement of parts, to vehicle owners.
TDCL provides distribution and logistics support for vehicles manufactured at the Company’s facilities and has set up stocking points at some of Company’s plants and at different places throughout India. TDCL helps us improve planning, inventory management, transport management and timing of delivery. The Company has customer relations management system, or CRM, at all of its dealerships and offices across the country, which supports users both at its Company and among its distributors in India and abroad.
The Company markets its commercial and passenger vehicles in several countries in Africa, the Middle East, South East Asia, South Asia, Australia, Latin America, Russia and the Commonwealth of Independent States countries. The Company has a network of distributors in all such countries, where it exports its vehicles. Such distributors have created a network of dealers and branch offices and facilities for sales and after-sales servicing of the Company’s products in their respective markets. The Company has also stationed overseas resident sales and service representatives in various countries to oversee its operations in the respective territories.
Through the Company’s vehicle financing division and wholly owned subsidiary, TMFL along with Tata Motors Finance Solutions Ltd or TMFSL, the Company provides financing services to purchasers of its vehicles through independent dealers, who act as the Company’s agents for financing transactions, and through the Company’s branch network. Revenue from the Company’s vehicle financing operations (on Consolidated basis as per Ind AS) decreased by 8.4% to R2,429.23 crores in Fiscal 2017 as compared to R2,240.03 crores in Fiscal 2016.
TMFL disbursed R9,298 crores and R8,985 crores in vehicle financing during Fiscal 2017 and 2016, respectively. During Fiscal 2017 and 2016, approximately 22% and 23%, respectively, of the Company’s vehicle unit sales in India were made by the dealers through financing arrangements where the Company’s captive vehicle financing divisions provided the support. Total vehicle finance receivables outstanding as at March 31, 2017 and 2016 amounted to R17,563.25 crores and R15,751.47 crores, respectively. As at March 31, 2017 and 2016, the Company’s customer finance receivable portfolio comprised 552,991 and 584,101 contracts, respectively. The Company follow specified internal procedures, including quantitative guidelines, for selection of its finance customers and assist in managing default and repayment risk in the Company’s
portfolio. The Company originate all of the contracts through its authorized dealers and direct marketing agents with whom the Company have agreements. All the Company’s marketing, sales and collection activities are undertaken through dealers or by TMFL.
Tata and other brand vehicles — Spare Parts and After-sales Activity
The Company’s consolidated spare parts and after-sales activity revenue was R4,419.90 crores in Fiscal 2017, compared to R4,088.74 crores in Fiscal 2016. The Company’s spare parts and after-sales activity experienced limited growth due to weak sales of both commercial vehicles and passenger vehicles in recent years.
Tata and other brand vehicles — Competition
The Company faces competition from various domestic and foreign automotive manufacturers in the Indian automotive market. Improving infrastructure and robust growth prospects compared to other mature markets has attracted a number of international companies to India that have either formed joint ventures with local partners or have established independently owned operations in India. Global competitors bring with them decades of international experience, global scale, advanced technology and significant financial resources, and, as a result, competition is likely to further intensify in the future. The Company has designed its products to suit the requirements of the Indian market based on specific customer needs such as safety, driving comfort, fuel-efficiency and durability. The Company believes that its vehicles are suited to the general conditions of Indian roads and the local climate. Its vehicles have also been designed to comply with applicable environmental regulations currently in effect. The Company also offers a wide range of optional configurations to meet the specific needs of its customers and intends to develop and is developing products to strengthen its product portfolio in order to meet the increasing customer expectations of owning world-class products.
Tata and other brand vehicles — Seasonality
Demand for the Company’s vehicles in the Indian market is subject to seasonal variations. Demand for the Company’s vehicles generally peaks between January and March, although there is a decrease in demand in February just before release of the Indian fiscal budget. Demand is usually lean from April to July and picks up again in the festival season from September onwards, with a decline in December due to year-end.
Jaguar Land Rover
Total wholesales of Jaguar Land Rover vehicles (including Chery

Corporate Overview Financial StatementsStatutory Reports
144 72nd Annual Report 2016-17
Jaguar Land Rover) with a breakdown between Jaguar and Land Rover brand vehicles, in Fiscal 2017 and 2016 are set forth in the table below:
Year ended March 31Fiscal 2017 Fiscal 2016
Units % Units %Jaguar 1,78,751 29.8% 1,02,106 18.8%Land Rover 4,22,055 70.2% 4,41,979 81.2%
Total 6,00,806 100.0% 5,44,085 100.0%
In Fiscal 2017, Jaguar Land Rover wholesale volumes were 600,806 units (including unconsolidated sales from the China Joint Venture), up 10% compared to Fiscal 2016 primarily reflecting the introduction of the Jaguar F-PACE and continued strong demand for the Land Rover Discovery Sport partially offset by the production run-out of the Land Rover Defender and Discovery ahead of the start of sales of the all new Discovery in the fourth quarter of Fiscal 2017. Wholesale volumes were up in China (30%), North America (21%), Europe (9%), and the United Kingdom (4%) but down 12% in other overseas markets, which includes Russia, Brazil and South Africa.
Jaguar wholesale volumes were 178,751 units, up 75% compared to Fiscal 2016, reflecting the introduction of the Jaguar F-PACE and the launch of the XE in the US in May 2016. However, Land Rover wholesale volumes were 422,055 units, down 5% compared to the prior fiscal year as continuing strong demand for the Land Rover Discovery Sport, solid sales of the Range Rover Evoque and the start of sales of the all new Discovery were offset by the production run-out of the Defender and the previous Discovery model.
Jaguar Land Rover’s performance in key geographical markets on a retail basis
Retail volumes (including retail sales from the China Joint Venture) in Fiscal 2017 increased by 16% to 604,009 units from 521,571 units in Fiscal 2016 following the introduction of the Jaguar F-PACE, the launch of XE in the US and continued strong demand for the Land Rover Discovery Sport which offset the production run-out of Defender and Discovery with retail sales of the all new Discovery only starting in February 2017. Jaguar XF retail volumes were higher supported by the launch of the long wheelbase XFL from Company’s joint venture in China.
United Kingdom
Industry vehicle sales rose by 2.1% in Fiscal 2017 in the United Kingdom broadly in-line with economic growth despite the outcome of the Brexit vote. Jaguar Land Rover retail volumes
increased by 16% to 124,755 units in Fiscal 2017 from 107,371 units in Fiscal 2016, with a strong sales performance from Jaguar, up 42% in Fiscal 2017, reflecting the introduction of the F-PACE and solid sales of the XF. Land Rover retail volumes increased by 7%, reflecting continued strong demand for Discovery Sport and Evoque as well as solid sales of the Range Rover Sport.
North America
Economic performance in North America was generally favourable in Fiscal 2017 as the labour market approached full employment and the Federal Reserve increased interest rates by another 0.25% in March. Passenger car sales were broadly in-line with the prior year but Jaguar Land Rover retail volumes increased by 24% in Fiscal 2017 to 123,527 units from 99,606 units in Fiscal 2016. Jaguar retail sales were up over 150% in North America with the introduction of the F-PACE and XE at the beginning of the year. Land Rover retailed 81,949 in Fiscal 2017, down slightly 1%, as continued strong demand for the Land Rover Discovery Sport and solid sales of the Range Rover Sport were offset by softer sales of the Range Rover and the Evoque as well as the run-out of the Discovery.
Europe
Passenger car sales increased by 6.9% in Europe supported by positive, albeit lower, economic growth, improving labour markets as well as lower inflation. Jaguar Land Rover retail sales of 141,043 units in Europe were higher than in any of the Company’s other key regions in Fiscal 2017, up 13% compared to 124,734 units sold in Fiscal 2016. Jaguar volumes increased by 92% to 40,332 units in Fiscal 2017 compared to 21,051 units in Fiscal 2016, primarily driven by the introduction of the F-PACE and solid sales of XF. Land Rover retails were 100,711 units in Fiscal 2017, down 3% compared to the 103,683 units in Fiscal 2016 as solid sales of the Discovery Sport, Range Rover Sport, Range Rover and Evoque were offset by the production run-out of Defender and the prior Discovery Model.
China
Passenger car sales in China increased by 14.5% in Fiscal 2017 supported by GDP growth in-line with the government’s target and a stronger economic performance more recently. Jaguar Land Rover retail volumes (including sales from the China Joint Venture) increased by 32% to 125,207 units in Fiscal 2017 from 95,167 units in Fiscal 2016. Jaguar retail sales in Fiscal 2017 were 29,351 units, up 93% compared to the 15,230 units sold in Fiscal 2016 led by the introduction of the F-PACE and the start of sales of the long wheelbase Jaguar XFL from Company’s China joint venture in September 2016 as well as positive

Notice Board’s Report Corporate Governance Report Business Responsibility ReportManagement Discussion & Analysis
(118-165)
145
sales growth of other Jaguar models. Land Rover retail sales were 95,856 units in Fiscal 2017, up 20% compared to the 79,937 units sold in Fiscal 2016 led by strong sales of the Discovery Sport from company’s joint venture in China, and solid sales growth of Range Rover and Range Rover Sport.
Other Overseas markets
Jaguar Land Rover’s retail volumes in the other overseas markets declined by 6% to 89,477 units in Fiscal 2017 compared to 94,693 units in the prior year. Jaguar retail volumes were 22,455 units, up 60% compared to the 14,047 units last year with the introduction of the F-PACE and solid sales of Jaguar’s XE and XF saloon models. Land Rover retail volumes were 67,022 units, down 17% on the 80,646 units retailed in Fiscal 2016 as solid sales of the Discovery Sport were more than offset by the production run-out of the Defender and Discovery as well as softer sales of Range Rover, Range Rover Sport and Evoque.
Jaguar Land Rover’s Sales & Distribution
As at March 31, 2017, Jaguar Land Rover distribute its vehicles in approximately 124 markets for Jaguar and approximately 136 markets for Land Rover globally. Sales locations for vehicles are operated as independent franchises. Jaguar Land Rover are represented in its key markets through its National Sales Company’s (“NSC’s”) as well as third party importers. Jaguar and Land Rover have regional offices in certain select countries that manage customer relationships and vehicle supplies and provide marketing and sales support to their regional importer markets. The remaining importer markets are managed from the United Kingdom.
Jaguar Land Rover products are sold through a variety of sales channels: through its dealerships for retail sales; for sale to fleet customers, including daily rental car companies; commercial fleet customers; leasing companies; and governments. Jaguar Land Rover do not depend on a single customer or small group of customers to the extent that the loss of such a customer or group of customers would have a material adverse effect on its business.
As at March 31, 2017, Jaguar Land Rover global sales and distribution network comprised 20 NSCs, 78 importers, 15 export partners and 1,585 franchise sales dealers, of which 1,097 are joint Jaguar and Land Rover dealers.
Jaguar Land Rover — Competition
Jaguar Land Rover operates in a globally competitive environment and faces competition from established premium and other vehicle manufacturers who aspire to move into the premium performance car and premium SUV markets, some of which are much larger
than they are. Jaguar vehicles compete primarily against other European brands such as Audi, Porsche, BMW and Mercedes Benz. Land Rover and Range Rover vehicles compete largely against SUVs from companies such as Audi, BMW, Infiniti, Lexus, Mercedes Benz, Porsche, Volvo and Volkswagen.
Jaguar Land Rover — Seasonality
Jaguar Land Rover volumes are impacted by the biannual change in age related registration plates of vehicles in the United Kingdom, where new age related plate registrations take effect in March and September. This has an impact on the resale value of the vehicles because sales are clustered around the time of the year when the vehicle registration number change occurs. Seasonality in most other markets is driven by introduction of new model year vehicles and derivatives. Furthermore, Western European markets tend to be impacted by summer and winter holidays, and the Chinese market tends to be affected by the Lunar New Year holiday in either January or February, the PRC National Day holiday and the Golden Week holiday in October. The resulting sales profile influences operating results on a quarter to quarter basis.
Other Operations Overview
The Company’s other operations business segment mainly includes information technology services, machine tools and factory automation services. The Company’s revenue from other operations before inter-segment eliminations was R3,184.06 crores in Fiscal 2017, an increase of 7.8% from R2,953.89 crores in Fiscal 2016. Revenues from other operations represented 1.2% and 1.1% of total revenues, before inter-segment eliminations, in Fiscal 2017 and 2016.
Research and Development
Over the years, the Company has devoted significant resources toward its research and development activities. The Company’s research and development activities focus on product development, environmental technologies and vehicle safety. In India, Company’s Engineering Research Centre (ERC), established in 1966, is one of the few in-house automotive research and development centers in India recognized by the Government of India. The ERC is integrated with all of the Tata Motors Global Automotive Product Design and Development Centers in South Korea, Italy and the United Kingdom.
In Fiscal 2017, the focus was on strengthening the Company’s product portfolio to address key gaps in existing market, identify white space opportunity in line with changing trends and introduce value-added technologies to improve the attractiveness of the

Corporate Overview Financial StatementsStatutory Reports
146 72nd Annual Report 2016-17
Company’s products. This is in alignment with Tata Motors’ efforts to make itself ‘FutuReady’ by embracing new technologies, fostering higher platform efficiency and offering solutions that connect with the aspirations of the Company’s customers. For passenger vehicles, the focus is on great design, great driving experience and features. Therefore, the research and development portfolio is aligned towards developing technologies, core competencies and skill sets in these specific domains to ensure impactful and timely delivery of the envisaged future products with class leading product attributes. For commercial vehicles, in addition to design, the main focus areas are occupant comfort, reducing the total cost of ownership, to be a market leader in fuel efficiency and delivering high performance and reliable products.
In addition to this, the Company also runs several innovation projects in the domains of light weighting, xEVs and Hybrids, Connected vehicles, ADAS features. While all its current products comply with the existing emission norms, the Company is gearing up to be ready with the upcoming BSVI regulations in India. Product competitiveness for the Company’s engines/vehicles is targeted through customer value propositions such as best-in-class fuel efficiency, superior performance, better total low cost of ownership, increased service interval, reduced downtime & turn-around time. Application specific technology selection & duty cycle based performance optimization are key enablers to achieve these goals. Enhanced fuel efficiency and thereby reduction in carbon footprint is planned to be achieved through various powertrain as well as vehicle level measures. The Company is investing significantly in development efforts, capital equipment and in infrastructure to meet BSVI requirements for all the Company’s products over next 2 to 3 years
In passenger vehicles, the recently launched Hexa and Tigor received critical recognition from Media and customers for its attributes on design, connectivity, driving dynamics. These Innovative products have unique design and offer unique ownership experience to customers. The Super Drive Modes system in Hexa offers seamless integration of Vehicle engine performance, new generation Electronic Stability Program, Torque on demand, and intuitive HMI. Switching between four drive modes - Auto, Comfort, Dynamic and Rough Road, provides enhanced ride comfort & stability over different terrains. The premium acoustic experience is introduced in Hexa and Tigor with ConnectNext Infotainment system along with ConnectNext apps suite to attract young minds.
In commercial vehicles, following developments are encouraging:
Electric Driveline for various categories of commercial vehicles ranging from last mile passenger transport, mini, midi & large buses to support initiative of green and eco-friendly transport solution and reduce dependency on carbon based fuels.
Series Hybrid Bus with new generation 5L engine with advanced features for eco-friendly operation as well as best in class features for comfort and convenience for commuter especially elderly and physically challenged people.
Advanced automated manual transmission for Buses & Trucks for optimum fuel economy and ease of driving and fatigue reduction.
Advanced safety features such as collision mitigation, lane departure warning to improve the road safety.
Buses & Trucks to run on LNG as alternate fuel for increasing the fuel efficiency as well as spreading the use of alternate fuels.
During Fiscal 2017, the Company filed 80 Patent Applications and 52 Design applications. In respect of applications filed in earlier years, 22 Patents were granted and 26 Designs were registered. Both filing and grant details include national and international jurisdictions.
The Company plans to continue its endeavour in the research and development space to develop vehicles with reduced cost, time to market and shorter product life cycles. One of the main future initiatives in this direction would be a platform approach of creating bills of material and bills of process that have a high degree of commonality to reduce complexity and enhance ability to the scale. Thus, Advance Modular Platform (AMP) is being developed as next generation, futuristic, scalable & modular platform wherein multiple segment products can be developed with improved economies of scale. This will also enable to reduce number of platform in the long run to make the business FutuReady, reduce complexity and cut costs. Also, the Company aims for timely and successful conclusion of technology projects so as to begin their induction into mainstream products, which will lead to a promising future.
The Company has constantly adopted new technologies and practices in the digital product development domain to improve the product development process. This has led to better front loading of product creation, validation and testing, which results in greater likelihood of timely delivery and ensuring that new products are properly developed from the beginning. Niche integration tools, systems and processes continue to be enhanced in the areas of CAx, knowledge based engineering, or KBE, product lifecycle management, or PLM and manufacturing planning management,

Notice Board’s Report Corporate Governance Report Business Responsibility ReportManagement Discussion & Analysis
(118-165)
147
or MPM, for more efficient end-to-end delivery of the product development process. To deliver projects which meets customer target and to do the things first time right, the Company is working on one of the critical project known as Requirements Management Design Verification and Validation (RMDV2). This project will bring system engineering approach towards the Company’s product development process, which will bring all engineering design rules and standards on one platform to meet the design requirement. In terms of physical assets used for product validation and testing, the Company has state-of-the-art facilities, such as Crash Lab, which is a facility where crash tests are performed, engine development and testing facilities, prototype shop and noise, vibration and harshness refinement facilities. These facilities are used extensively to physically validate the new products in a robust manner before they enter the market.
Jaguar Land Rover’s research and development operations are built around state-of-the-art engineering facilities, extensive test tracks, testing centers, design hubs and virtual innovation center. The ERC in India and Jaguar Land Rover’s engineering and development operations in the United Kingdom have identified areas in which to leverage the facilities and resources to enhance the product development process and to achieve economies of scale.
Jaguar Land Rover’s two design and development centres are equipped with computer-aided design, manufacturing and engineering tools configured to support an ambitious product development cycle plan. In recent years, Jaguar Land Rover has refreshed the entire Jaguar range under a unified concept and design language and has continued to enhance the design of Land Rover’s range of all-terrain vehicles. The majority of Jaguar Land Rover’s products are designed and engineered in the United Kingdom and Jaguar Land Rover endeavours to implement the best technologies into its product range to meet the requirements of a globally competitive market and to comply with regulatory requirements. Jaguar Land Rover currently offers hybrid technology on some of its models such as the Range Rover and Range Rover Sport and are also developing more efficient powertrains and other alternative propulsion technologies. This includes smaller and more efficient 2.0 litre diesel and petrol engines (now available across the majority of the Company’s model range), stop start, mild and plug-in hybrids as well as battery electric vehicles, to satisfy growing customer demand and to further improve the environmental performance of its vehicles including the reduction of CO2 emissions.
Jaguar Land Rover endeavour to apply the best technologies for their product range to meet the requirements of a globally
competitive market and all vehicles and engines are compliant with the prevalent regulatory norms in the respective countries in which they are sold.
Intellectual Property
The Company creates, its own, and maintains a wide array of intellectual property assets throughout the world that are among the Company’s most valuable assets. The Company’s intellectual property assets include patents, trademarks, copyrights, designs, trade secrets and other intellectual property rights. The Company proactively and aggressively seek to protect its intellectual property in India and other countries.
The Company own a number of patents and have applied for new patents, which are pending for grant in India, as well as in other countries. The Company has also filed a number of patent applications outside India under the Patent Cooperation Treaty, which the Company expects will be effective in other countries going forward. The Company also obtain new patents as part of its ongoing research and development activities.
The Company owns registrations for a number of trademarks and has pending applications for registration of these in India, as well as in other countries. The registrations mainly include trademarks for company’s vehicle models and other promotional initiatives. The Company uses the Tata brand, which has been licensed by Tata Sons. The Company believes that establishment of the Tata word mark and logo mark in India and around the world is material to Company’s operations. As part of its acquisition of TDCV, the Company has rights to the perpetual and exclusive use of the Daewoo brand and trademarks in South Korea and overseas markets for the product range of TDCV.
As part of the acquisition of the Company’s Jaguar Land Rover business, ownership (or co-ownership, as applicable) of core intellectual property associated with Jaguar Land Rover was transferred to the Company; however, such intellectual property is still ultimately owned by Jaguar Land Rover entities. Additionally, perpetual royalty-free licenses to use other essential intellectual property from the third parties have been granted to company for use in Jaguar and Land Rover vehicles. Jaguar Land Rover owns registered designs to protect the design of its vehicles in several countries.
In varying degrees, all of Company’s intellectual property is important to it. In particular, the Tata, Jaguar, Land Rover and Range

Corporate Overview Financial StatementsStatutory Reports
148 72nd Annual Report 2016-17
Rover brands are integral to the conduct of Company’s business, a loss of which could lead to dilution of Company’s brand image and have a material adverse effect on its business.
Components and Raw Materials
The principal materials and components required for use in Tata and other brand vehicles are steel sheets (for in-house stampings) and plates, iron and steel castings and forgings, alloy wheels, tyres, fuel injection systems, batteries, electrical wiring systems, electronic information systems and displays, interior systems such as seats, cockpits, doors, plastic finishers and plastic functional parts, glass and consumables (such as paints, oils, thinner, welding consumables, chemicals, adhesives and sealants) and fuels. The Company also requires aggregates axles, engines, gear boxes and cams for its vehicles, which are manufactured in-house or by its subsidiaries, affiliates, joint ventures and strategic suppliers. The Company has long-term purchase agreements for some critical components such as transmissions and engines. The Company has established contracts with some commodity suppliers to cover its own as well as its suppliers’ requirements in order to moderate the effect of volatility in commodity prices. The Company has also undertaken special initiatives to reduce material consumption through value engineering and value analysis techniques.
The Company has reorganized the sourcing department in India under two divisions, namely, Purchasing and Supplier Quality (P&SQ) and Supply Chain Management. P&SQ includes Purchase Programme Management (PPM). The reorganization was done in order to establish and define responsibility and accountability in the sourcing department. Purchasing oversees the commercial aspects of product sourcing; Supplier Quality is primarily responsible for development of new components and maintaining the quality of supplies that the Company purchases; Supply Chain oversees the logistics of the supply and delivery of parts for its vendors while PPM oversees execution of new projects.
As part of the Company’s strategy to become a value for money vehicle manufacturer, it has undertaken various initiatives to reduce its fixed and variable costs. The Company uses an e-sourcing initiative to procure supplies through reverse auctions. The Company uses external agencies such as third-party logistics providers. This has resulted in space and cost savings. The Company’s initiatives to leverage information technology in supply chain activities have resulted in improved efficiency through real-time information exchanges and processing with its suppliers.
The Company has an established a sixteen-step supplier quality
process in order to ensure the quality of outsourced components. The Company formalized the component development process using Automotive Industry Action Group guidelines. The Company also has a programme for assisting suppliers from whom it purchases raw materials or components to maintain quality. Preference is given to suppliers with TS 16949 certification. The Company also maintains a stringent quality assurance programme that includes random testing of production samples, frequent recalibration of production equipment and analysis of post-production vehicle performance, as well as an ongoing dialogue with supplier partners to eliminate production defects.
The Company is also exploring opportunities for increasing the global sourcing of parts and components from low-cost countries, and has in place a supplier management programme that includes supplier base rationalization, supplier quality improvement and supplier satisfaction surveys. The Company has begun to include its supply chain in its initiatives on social accountability and environment management activities, including its Conflict Minerals Compliance Program, supply chain carbon footprint measurement and knowledge sharing on various environmental aspects.
The principal materials and components required for use in Jaguar Land Rover vehicles are steel and aluminum sheets, aluminium castings and extrusions, iron and steel castings and forgings and items such as alloy wheels, tires, fuel injection systems, batteries, electrical wiring systems, electronic information systems and displays, leather-trimmed interior systems such as seats, cockpits, doors, plastic finishers and plastic functional parts, glass and consumables such as paints, oils, thinner, welding consumables, chemicals, adhesives, sealants and fuels. Jaguar Land Rover also requires certain highly functional components such as axles, engines and gear boxes for its vehicles, which are mainly manufactured by strategic suppliers. Jaguar Land Rover has long-term purchase agreements for critical components such as transmissions with ZF Friedrichshafen AG and for engines with Ford and the Ford-PSA joint venture. The components and raw materials in Jaguar Land Rover cars include steel, aluminum, copper, platinum and other commodities. Jaguar Land Rover has established contracts with certain commodity suppliers, such as Novelis, to cover its own and its suppliers’ requirements to mitigate the effect of high volatility. Special initiatives are also undertaken to reduce material consumption through value engineering and value analysis techniques.
Jaguar Land Rover works with a range of strategic suppliers to meet
Notice Board’s Report Corporate Governance Report Business Responsibility ReportManagement Discussion & Analysis
(118-165)
149
its requirements for parts and components and they endeavour to work closely with their suppliers to form short and medium term plans for the business. The Jaguar Land Rover business has established quality control programmes to ensure that externally purchased raw materials and components are monitored and meet its quality standards. Jaguar Land Rover also outsources many of the manufacturing processes and activities to various suppliers. Where this is the case, Jaguar Land Rover provides training to the outside suppliers who design and manufacture the required tooling and fixtures. Such programmes include site engineers who regularly interface with suppliers and carry out visits to supplier sites and ensure that the relevant quality standards are being met. Site engineers are also supported by persons in other functions, such as program engineers who interface with new model teams as well as resident engineers located at the Jaguar Land Rover plants, who provide the link between the site engineers and the Jaguar Land Rover plants. Jaguar Land Rover has in the past worked, and is expected to continue to work, with its suppliers to optimize their procurement of components, including the sourcing of certain raw materials and component requirements from low-cost countries.
Although Jaguar Land Rover have commenced the production of their own “in house” four cylinder diesel and petrol engines, at present they continue to source a significant proportion of their engines from Ford or the joint venture between Ford and PSA on an arm’s-length basis.
Suppliers
The Company has an extensive supply chain for procuring various components. The Company also outsources many manufacturing processes and activities to various suppliers. In such cases, it provides training to external suppliers who design and manufacture the required tools and fixtures.
The Company’s associate company, Tata AutoComp Systems Ltd., or TACO, manufactures automotive components and encourages the entry of internationally acclaimed automotive component manufacturers into India by setting up joint ventures with them.
The Company’s other suppliers include some of the large Indian automotive supplier groups with multiple product offerings, such as the Anand Group, the Sona Group, and the TVS Group, as well as large multinational suppliers, such as Bosch, Continental, Delphi and Denso, Johnson Controls Limited for seats and Yazaki AutoComp Limited for wiring harnesses. The Company continue to work with company’s suppliers for its Jaguar Land Rover business to optimize procurements and enhance its supplier base,
including for the sourcing of certain of company’s raw material and component requirements. In addition, the co-development of various components, such as engines, axles and transmissions also continue to be evaluated, which the Company believes may lead to the development of a low-cost supplier base for Jaguar Land Rover.
In India, the Company has established vendor parks in the vicinity of its manufacturing operations and vendor clusters have been formed at Company’s facilities at Pantnagar and Sanand. This initiative is aimed at ensuring availability of component supplies on a real-time basis, thereby reducing logistics and inventory costs as well as reducing uncertainties in the long distance supply chain. Efforts are being taken to replicate the model at new upcoming locations as well as a few existing plant locations. The Company also encourage suppliers to follow sustainability principles and ensuring long-term sustainability.
As part of Company’s pursuit of continued improvement in procurement, it has integrated its system for electronic interchange of data with its suppliers. This has facilitated real time information exchange and processing, which enables the Company to manage supply chain more effectively.
The Company has also started working on a new initiative “Auto Data Exchange (autoDX)”. It is a collaborative initiative by Society of Indian Automobile Manufacturers (SIAM) and Automotive Components Manufacturers Association (ACMA) developed by IBM. autoDX is delivered on a Business-to-Business Cloud based Platform that has the power to transform the Automotive Industry by accelerating the movement of data & reducing transaction cost.
In 2016, the Company had introduced a comprehensive supplier assessment processes MSA (Manufacturing site assessment). The framework is broadly based on lead measures and lag measures to assess the suppliers capability and for the first time the company have put in place a financial risk assessment that would help in bringing a consistent level of oversight to it.
The Company has established processes to encourage improvements through knowledge sharing among it’s vendors through an initiative called the Vendor Council, which consists of the Company’s senior executives and representatives of major suppliers. The Vendor Council also helps in addressing common concerns through joint deliberations. The Vendor Council works on four critical aspects of engagement between the Company and the suppliers: quality, efficiency, relationships and new technology development.
The Company import some components that are either not
Corporate Overview Financial StatementsStatutory Reports
150 72nd Annual Report 2016-17
available in the domestic market or when equivalent domestically available components do not meet company’s quality standards. The Company also imports some products based on competitive pricing and capacity/lead time where domestic suppliers are not able to meet Company’s requirements.
Long-term agreements have been entered into with Ford for technology sharing and joint development providing technical support across a range of technologies focused mainly around powertrain engineering such that the Company may continue to operate according to its existing business plan. This includes the EuCD platform, a shared platform consisting of shared technologies, common parts and systems and owned by Ford, which is shared among Land Rover, Ford and Volvo Cars.
Supply agreements, aligned to the business cycle plan and having end-stop dates to December 2020 at the latest, were entered into with Ford Motor Company for (i) the long-term supply of engines developed by Ford, (ii) engines developed by the Company but manufactured by Ford and (iii) engines developed by the Ford-PSA joint venture. Purchases under these agreements are generally denominated in euro and pounds sterling.
Following the global financial crisis and its cascading effect on the financial health of Company’s suppliers, it has commenced efforts to assess supplier financial risk. Suppliers are appraised based on Company’s long-term requirements through a number of platforms, such as Vendor Council meetings, council regional chapter meetings, national vendor meets and location-specific vendor meets.
OPPORTUNITIES:
The Union budget of 2017, has provided funds worth R6,400 crores for Infrastructure development including highway development has been set up, which is good for Heavy machinery and construction equipment manufacturers.
The Indian economy is slated to prosper along with China (estimated growth rate of more than 5%). This creates opportunity in rise in vehicle ownership. By 2020, transportation will have 23% of private consumer spending which is perfectly synergistic with the fact that automotive sales in Indian market is destined to resonate with global economic shift. India’s car market is expected to grow to 6 million plus units annually in next two years.
The Automotive Mission Plan 2016-26 aims at 13% share of automotive industry in GDP, along with implementation of BSIV vehicles in 2019, BSVI Vehicles in 2019 and Increase in Value added services. National Electric Mobility Mission, aims at providing 7
million electric cars 2020, along with concession in manufacturing of selected parts for electric cars. Use of Block chain in Supply chain; augmented reality in designing and manufacturing; 3D printing and Four-cylinder supercar. At a global level, increasing levels of environmental regulations adds up the complexity quotient in design, marked by diverging behaviour.
Jaguar Land Rover intends to grow its business by diversifying its product range to compete in new segments, for example the Jaguar XE sports saloon, the Jaguar F-PACE (on sale since April 2016) and the new Range Rover Velar (goes on sale in the summer of 2017) ensures that Jaguar Land Rover competes in new premium segments with class-leading products that further supports their growth plans.
FINANCIAL PERFORMANCE ON A CONSOLIDATED BASIS
The Company has adopted Indian Accounting Standards on April 1, 2016, with the transition date as April 1, 2015. Accordingly, financial statements for Fiscal 2017 along with the comparatives (Fiscal 2016) have been prepared in accordance with the recognition and measurement principles stated therein, prescribed under section 133 of the Companies Act 2013 read with the relevant rules issued thereunder and the other accounting principles generally accepted in India.
The financial information discussed in this section is derived from the Company’s Audited Consolidated Financial Statements.
Overview
The Company income from operations including finance revenues decreased by 1.1% to R274,492.12 crores in Fiscal 2017 from R277,660.59 crores in Fiscal 2016. The decrease is attributable to R27,686 crores impact due to unfavourable currency translation from GB£ to INR. The Company’s net income (attributable to shareholders of the Company) declined by 35.6% to R7,454.36 crores in Fiscal 2017 from R11,579.31 crores in Fiscal 2016. Overall, earnings before other income, finance cost and tax, were R15,593.80 crores in Fiscal 2017 compared to R21,596.73 crores in Fiscal 2016, a decrease of 27.8%. The decrease in net income was primarily driven by performance at India operations of the Company, foreign exchange losses at Jaguar Land Rover business coupled with higher depreciation and amortization.
The Company has pursued a strategy of increasing exports of Tata and other brand vehicles to new and existing markets. The performance of the Company’s subsidiary in South Korea, TDCV, and TTL, its specialized subsidiary engaged in engineering, design

Notice Board’s Report Corporate Governance Report Business Responsibility ReportManagement Discussion & Analysis
(118-165)
151
and information technology services, contributed to its revenue from international markets. Improved market sentiment in certain countries to which the Company exports and the strong sales performance of Jaguar Land Rover has enabled the Company to increase its sales in these international markets in Fiscal 2017. However, due to unfavourable currency translation from GB£ to INR and also growth in revenue in India in Fiscal 2017, the proportion of the Company’s net sales earned from markets outside of India decreased to 82.5% in Fiscal 2017 from 83.4% in Fiscal 2016. The following table sets forth the Company’s revenues from its key geographical markets and the percentage of total revenues that each key geographical market contributes for the periods indicated:
Revenue Fiscal 2017 Fiscal 2016
(Rin crores) % (Rin crores) %
India 47,101.21 17.2% 46,027.25 16.6%
United States 42,935.31 15.6% 43,809.17 15.8%
UK 50,588.18 18.4% 46,209.94 16.6%
Rest of Europe* 47,122.48 17.2% 41,575.25 15.0%
China 41,369.40 15.1% 48,760.19 17.6%
Rest of World* 45,375.54 16.5% 51,278.79 18.5%
Total 274,492.12 100.0% 277,660.59 100.0%
* The Rest of Europe market is geographic Europe, excluding the United Kingdom and Russia. The Rest of the World market is any region not included above.
The Company’s operations is divided into automotive operations and other operations as described further below. The table below sets forth the breakdown in revenues between the Company automotive operations and other operations in Fiscal 2017 and 2016 and the percentage change from period to period.
Fiscal 2017 Fiscal 2016 Change
(Rin crores) %
Automotive operations 272,692.41 276,221.67 (1.3)%
Others 3,184.06 2,953.89 7.8%
Inter-segment
elimination (1,384.35) (1,514.97) (8.6)%
Total 274,492.12 277,660.59 (1.1)%
Automotive operations
Automotive operations are the Company most significant segment, accounting for 99.3% of the Company’s total revenues in Fiscal 2017 and 99.5% of the Company’s total revenue in Fiscal 2016. In Fiscal
2017, revenue from automotive operations before inter-segment eliminations was R272,692.41 crores as compared to R276,221.67 crores in Fiscal 2016, a decrease of 1.3%.
The following table sets forth selected data regarding the Company’s automotive operations for the periods indicated, and the percentage change from period to period (before inter-segment eliminations).
Fiscal 2017 Fiscal 2016 Change
%
Total revenue (R in
crores) 272,692.41 276,221.67 (1.3)%
Earning before other
income, interest and tax
(Rin crores) 15,324.12 21,244.44 (27.9)%
Earning before other
income, interest and tax
(% to total revenue) 5.6% 7.7%
The Company’s automotive operations segment is further divided into Tata and other brand vehicles (including vehicle financing) and Jaguar Land Rover. In Fiscal 2017, Jaguar Land Rover contributed 79.4% of the Company’s total automotive revenue compared to 80.7% in Fiscal 2016 and the remaining 20.6% was contributed by Tata and other brand vehicles in Fiscal 2017 compared to 19.3% in Fiscal 2016.
The Company’s revenue from Tata and other brand vehicles (including vehicle financing) and Jaguar Land Rover in Fiscals 2017 and 2016 and the percentage change from period to period (before intra-segment eliminations) is set forth in the table below.
Fiscal 2017 Fiscal 2016 Change
(` in crores) %
Tata and other brand
vehicles 56,448.78 53,462. 52 5.6%
Jaguar Land Rover 216,388.82 222,822.93 (2.9%)
Intra-segment
elimination (145.19) (63.78) 127.6%
Total 272,692.41 276,221.67 (1.3%)

Corporate Overview Financial StatementsStatutory Reports
152 72nd Annual Report 2016-17
Other operations
The following table sets forth selected data regarding the Company’s other operations for the periods indicated and the percentage change from period to period (before inter-segment eliminations).
Fiscal 2017 Fiscal 2016 Change(%)
Total revenue (` in crores) 3,184.06 2,953.89 7.8%Earning before other income, interest and tax (` in crores) 471.90 436.24 8.2%Earning before other income, interest and tax (% to total revenue) 14.8% 14.8%
The other operations business segment includes information technology, machine tools and factory automation solutions. In Fiscal 2017, revenue from other operations before inter-segment eliminations was R3,184.06 crores compared to R2,953.89 crores in Fiscal 2016. Results for the other operations business segment before other income, finance cost, tax and exceptional items (before inter-segment eliminations) were R471.90 crores in Fiscal 2017 as compared to R436.24 crores for Fiscal 2016.
Results of Operations
The following table sets forth selected items from the Company’s consolidated statement of profit and loss for the periods indicated and shows these items as a percentage of total revenues:
Fiscal 2017 Fiscal 2016(%) (%)
Income from operations 100.0 100.0 Expenditure:
Cost of material consumed (including change in stock) 60.4 58.8Excise duty 1.8 1.7Employee Cost 10.3 10.4Other expenses (net) 20.2 20.1Amount capitalized (6.1) (6.0)Total expenditure 86.6 85.0Other income 0.3 0.3Profit before exceptional items, Depreciation and amortization expense, Foreign exchange (gain)/loss (net), Finance cost and Tax 13.7 15.4
Depreciation and Amortization
(including product development/
engineering expenses written off )
7.8
7.3Finance costs 1.5 1.8
Foreign exchange loss (net) 1.4 0.6
Exceptional Item (gain)/loss (net) (0.4) 0.6
Profit before Tax 3.4 5.1
Tax expense 1.2 1.1
Profit after Tax 2.2 4.0
Cost of materials consumed (including change in stock)
Fiscal 2017 Fiscal 2016
(` in crores)
Consumption of raw materials
and components 160,147.12 151,065.61
Basis adjustment on hedge
accounted derivatives
(777.57)
2,226.88
Purchase of product for sale 13,924.53 12,841.52
Change in inventories of finished
goods, Work-in-progress and
products for sale
(7,399.92)
(2,750.99)
Total 165,894.16 163,383.02
Cost of material consumed increased from 58.8% of total revenue (excluding income from vehicle financing) in Fiscal 2016 to 60.4% in Fiscal 2017. For Tata Motors Standalone (including Joint Operations), costs of materials consumed was 63.8% of net revenue in Fiscal 2017 of total revenue as compared to 61.4% in Fiscal 2016, representing an increase of 240 bps, which was mainly attributable to a change in product mix that includes a relatively lower proportion of M&HCV sales. For Jaguar Land Rover, costs of materials consumed was 60.7% of total revenue in Fiscal 2017 compared to 59.1% in Fiscal 2016, representing an increase of 160 bps, driven by linear volumes and the general weakening of the Euro in Fiscal 2017.
Excise duty were R4,799.61 crores in Fiscal 2017 as compared to R4,614.99 crores in Fiscal 2016, an increase of 4.0%, primarily due to increase in revenues at the Company’s India operations.
Employee Costs were R28,332.89 crores in Fiscal 2017 as compared to R28,880.39 crores in Fiscal 2016, a marginal decrease of 1.9% primarily due to favourable translation impact of GB£ to INR of Jaguar Land Rover operation of R2,765.01 crores. At Jaguar Land

Notice Board’s Report Corporate Governance Report Business Responsibility ReportManagement Discussion & Analysis
(118-165)
153
Rover the increase in employee cost is by 7.1% to GB£ 2,495 million (R21,829.15 crores) in Fiscal 2017 as compared to GBP 2,328 million (R22,930.37 crores) in Fiscal 2016, primarily reflects the increase in the employee head count to support the higher production volume in Fiscal 2017. For Tata Motors Standalone (including joint operations), the employee cost increased by 11.6% to R3,558.52 crores as compared to R3,188.97 crores in Fiscal 2016, mainly due to annual increments and wage revisions. Employee costs at TDCV were R775.83 crores in Fiscal 2017, as compared to R736.98 crores in Fiscal 2016, an increase of 5.3%.
Other Expenses includes all works operations, indirect manufacturing expenses, freight cost, fixed marketing costs and other administrative costs. These expenses have decreased marginally to R55,430.06 crores in Fiscal 2017 from R55,683.75 crores in Fiscal 2016. Each line item includes the element of foreign currency translation favourable impact of Jaguar Land Rover operations of approximately R6,007.94 crores in aggregate in Fiscal 2017. The breakdown is provided below:
Fiscal
2017
Fiscal
2016
Change
(` in crores)Processing charges 1,172.03 1,110.68 61.35 Consumption of stores and spare parts 2,419.11 2,096.19 322.92 Freight, transportation, port charges, etc. 9,754.71 9,754.67 0.04 Power and fuel 1,159.82 1,143.63 16.19 Warranty and product
liability expenses 8,064.00 6,791.49 1,272.51Publicity 8,698.68 8,768.46 (69.78)Information technology/
computer expenses 2,202.51 2,379.90 (177.39)Allowance for finance, trade
and other receivables 104.78 885.62 (780.84)Engineering expenses 4,273.72 6,514.76 (2,241.04)MTM (gain)/loss on
commodity derivatives 918.40 (1,155.53) 2073.93Works operation and other
expenses 16,662.30 17,393.88 (731.58)
Other Expenses 55,430.06 55,683.75 (253.69)
The changes are mainly driven by volumes and the size of operations.
i. Processing charges were mainly incurred by Tata and other brand vehicles (including vehicle financing) which, due to
higher volumes, led to higher expenditures.
ii. Freight, transportation, port charges etc. have increased, mainly for Jaguar Land Rover, predominantly due to increased sales in certain geographies. As a percentage to total revenue, Freight, transportation and port charges etc. were flat at 3.6% in Fiscal 2017.
iii. Publicity expenses remained flat and represented 3.2% of total revenues in Fiscal 2017 and 2016. In addition to routine product and brand campaigns, the Company incurred expenses relating to new product introduction campaigns for the new Jaguar XE, the all new Jaguar XF, refreshed 2016 Model year the Jaguar XJ, the new Jaguar F-PACE, the Range Rover Evoque (including convertible), the Tiago, Hexa, Tigor, Yodha at Tata Motors.
iv Warranty and product liability expenses represented 2.9% and 2.4% of the Company’s revenues in Fiscal 2017 and 2016, respectively. The warranty expenses at Jaguar Land Rover represented 3.31% of the revenue as compared to 2.6% last year, primarily due to product and market mix, whereas Tata Motors India operations represent 1% of revenue for Fiscal 2017 and 2016.
v. Works operation and other expenses have decreased to 6.1% of net revenue in Fiscal 2017 from 6.3% in Fiscal 2016.
vi. Engineering expenses at Jaguar Land Rover reflect investment in the development of new vehicles. A significant portion of these costs are capitalized and shown under the line item “Amount capitalized”.
vii. Allowances for finance, trade and other receivables have decreased to R104.78 crores in Fiscal 2017, as compared to R885.62 crores in Fiscal 2016, mainly reflect provisions for finance receivables, where the collections have improved in Fiscal 2017.
Amount capitalized represents expenditure transferred to capital and other accounts allocated out of employee cost and other expenses, incurred in connection with product development projects and other capital items. The expenditure transferred to capital and other accounts has increased by 1.2% to R16,876.96 crores in Fiscal 2017 from R16,678.34 crores in Fiscal 2016, mainly due to various product development projects undertaken by the Company for the introduction of new products and the development of engine and products variants.
Other Income decreased by 14.8% to R754.54 crores in Fiscal 2017

Corporate Overview Financial StatementsStatutory Reports
154 72nd Annual Report 2016-17
from R885.35 crores in Fiscal 2016. Interest income decreased to R562.21 crores in Fiscal 2017, compared to R718.98 crores in Fiscal 2016, whereas profit on sale of investment increased to R176.14 crores in Fiscal 2017, compared to R101.00 crores in Fiscal 2016. The increase is primarily due to profit on the sale of mutual funds, mainly at Tata and other brand vehicles (including vehicle financing).
Profit before finance cost, Depreciation and Amortization expence, Foreign Exchange (gain)/loss, Exceptional Items and Tax is R37,666.90 crores in Fiscal 2017, representing 13.7% of revenue in Fiscal 2017 compared to R42,661.63 crores in Fiscal 2016.
Depreciation and Amortization expence (including product development / engineering expenses): During Fiscal 2017, expenditures increased by 5.6% to R21,318.56 crores from R20,179.55 crores in Fiscal 2016. The depreciation has increased by 13.7% to R9,048.62 crores as compared to R7,959.95 crores in Fiscal 2016 is due to new product launches both at Jaguar Land Rover and Tata and other brand vehicles (including vehicle financing). The amortization expenses have marginally increased by 1.2% to R8,856.37 crores in Fiscal 2017 from R8,750.83 crores in Fiscal 2016, and are attributable to new products introduced during the year. Expenditure on product development/engineering expenses decreased marginally by 1.6% to R3,413.57 crores in Fiscal 2017 from R3,468.77 crores in Fiscal 2016.
Finance Cost decreased by 13.3% to R4,238.01 crores in Fiscal 2017 from R4,889.08 crores in Fiscal 2016. The decrease was mainly achieved by refinancing certain senior notes and other long-term loans with loans with lower interest rates.
Foreign exchange loss increased to R3,910.10 crores in Fiscal 2017 from R1,616.88 crores in Fiscal 2016. The increase was mainly due to depreciation of GB£ as compared to US$.
Exceptional items
Fiscal 2017 Fiscal 2016 Change(` in crores)
Employee separation cost 67.61 32.72 34.89Provision for costs associated with closure of operations and impairment of intangibles of a subsidiary company - 44.31 (44.31)Impairment of capitalized fixed assets - 163.94 (163.94)Provision for BSIII vehicles 147.93 - 147.93Others (1,330.10) 1,609.38 (2,939.48)Total (1,114.56) 1,850.35 (2,964.91)
The credit of R1,330.10 crores (GB£ 151 million) during the Fiscal 2017, relates to the explosion at the port of Tianjin (China) in August 2015. This relates to the receipt of insurance proceeds, recovery of import duties and taxes and to an updated assessment of the condition of the remaining vehicles, which led to a reversal of initial provision recorded in the quarter ended September 30, 2015 in Fiscal 2016.
Consolidated Profit Before Tax (PBT) decreased to R9,314.79 crores in Fiscal 2017, compared to R14,125.77 crores in Fiscal 2016. The reduction in PBT is primarily driven by less favourable market and model mix, mainly at the Company’s India operations, including higher marketing expenses, depreciation and amortization and other operating costs. Further, the reduction was also due to translation impact from GB£ to INR of R1,263.04 crores. Furthermore, the decrease in profitability at Jaguar Land Rover operations were due to higher manufacturing expenses and other operating costs including higher marketing expenses, higher depreciation and amortization expenses related to significant capital expenditure incurred in prior periods, more unfavourable revaluation of unrealized foreign currency debt and hedges, offset by lower net finance expenses, favourable revaluation of commodity hedges and further insurance recoveries related to Tianjin.
Tax Expense represents a net charge of R3,251.23 crores in Fiscal 2017, as compared to R3,025.05 crores in Fiscal 2016. The effective tax rate in Fiscal 2017 was 34.9% as compared to 21.4% in Fiscal 2016. For Tata Motors Ltd and certain subsidiaries, the Company has not recognized deferred tax assets due to uncertainty of future taxable profits. In Fiscal 2017, there was a reduction in the UK Corporation tax from 20% to 19% for Fiscal 2018 to 2020 and to 17% thereafter, resulting in a deferred tax credit. Further, higher tax expenses, reflected the non-recurrence of favourable deferred tax credits in Fiscal 2016 (GB£ 74 million related to UK Patent Box legislation).
Consolidated Profit for the year declined by 35.6% to R7,454.36 crores in Fiscal 2017 from R11,579.31 crores in Fiscal 2016, after considering the profit from associate companies and shares of minority investees. The decrease was mainly attributable to negative earnings before other income, interest and tax for Tata and other brand vehicles (including financing thereof ) of R207.05 crores in Fiscal 2017 from R2,188.15 crores in Fiscal 2016.

Notice Board’s Report Corporate Governance Report Business Responsibility ReportManagement Discussion & Analysis
(118-165)
155
Consolidated Balance Sheet
Property, plant and equipment, Goodwill and other intangible assets
As at March 31, As at April 1, Change2017 2016 2015(` in crores)
Property, plant and equipment (including capital work-in-progress) 69,781.39 71,478.04 63,117.34 (1,696.65)Goodwill and Other intangible assets (including assets under development) 59,861.53 61,672.66 53,795.60 (1,811.13)Total 1,29,642.92 1,33,150.70 1,16,912.94 (3,507.78)
There is decrease (net of depreciation and amortization) in the intangible and tangible assets in Fiscal 2017, due to unfavourable currency translation impact from GB£ to INR of R17,849 crores. The decrease was offset by additions in the Brazil manufacturing facility, tooling and facilities for new Range Rover Velar, Slovakia plant and product development cost at Jaguar Land Rover. At Tata Motors Ltd, the additions were mainly in dies, toolings, and product development cost for new products.
Investments in equity accounted investees were R4,606.01 crores as at March 31, 2017, as compared to R3,763.95 crores as at March 31, 2016. The increase was mainly due to profits at the Company’s joint venture at China of GB£ 159 million (R1,384.36 crores). During Fiscal 2017, Jaguar Land Rover purchased 32% of CloudCar Inc. for GB£ 12 million (R107.15 crores).
Investments (Current + Non-current) were R15,731.91 crores as at March 31, 2017, as compared to R20,003.07 crores as at March 31, 2016. The details are as follows:
As at March 31, As at April 1, Change2017 2016 2015(` in crores)
Mutual Funds 15,065.84 19,233.04 14,068.31 (4,167.20)Quoted Equity shares 260.29 210.49 210.57 49.80 Unquoted Equity shares 366.98 373.76 373.25 (6.78)Others 38.80 185.78 191.50 (149.98)Total 15,731.91 20,003.07 14,843.63 (4,271.16)
The decrease in mutual fund investments was mainly at Jaguar Land Rover.
Deferred tax assets / liability: Deferred tax assets represent timing differences for which there will be future current tax benefits due to unabsorbed tax losses and expenses allowable on a payment basis in future years. Deferred tax liabilities represent timing differences where current benefit in tax will be offset by a debit in the statement of profit and loss.
As at March 31, As at April 1, Change2017 2016 2015(` in crores)
Deferred tax assets 4,457.34 3,957.03 4,049.41 500.31 Deferred tax liability 1,174.00 4,474.78 2,559.49 3,300.78
A deferred tax liability (net) of R113.57 crores was recorded in the income statement and R3,774.28 crores in other comprehensive income, which mainly includes deferred tax towards post-retirement benefits and cash flow hedges in Fiscal 2017.
Finance receivables (current + non-current) were R17,563.25 crores as at March 31, 2017, as compared to R15,751.47 crores as at March 31, 2016, an increase of 11.5%, primarily due to decrease in allowances for vehicle financing due to improved collections. The Gross finance receivables were R21,160.76 crores as at March 31, 2017, as compared to R20,758.16 crores as at March 31, 2016.
Loans and Advances
As at March 31, As at April 1, Change2017 2016 2015(` in crores)
Long term loans and advances 753.66 503.88 496.71 249.78Short term loans and advances 710.45 1,117.10 779.78 (406.65)Total 1,464.11 1,620.98 1,276.49 (156.87)
Loans and advances include advance to suppliers, contractors etc.
Other Financial AssetsAs at March 31, As at April 1, Change2017 2016 2015
(` in crores)Other financial assets - non current 2,911.12 1,825.51 647.64 1,085.61 Other financial assets – current 1,555.94 835.73 1,689.80 720.21 Total 4,467.06 2,661.24 2,337.44 1,805.82
These included R4,285.52 crores of derivative financial instruments, mainly attributable to Jaguar Land Rover as at March 31, 2017 compared to R2,348.54 crores as at March 31, 2016, reflecting notional liability due to the valuation of derivative contracts.
Inventories as at March 31, 2017, were R35,085.31 crores as compared to R32,655.73 crores as at March 31, 2016, an increase of 7.4%. Inventory at Tata and other brand vehicles (including vehicle financing) was R6,923.42 crores as at March 31, 2017 as compared to R6,819.13 crores as at March 31, 2016. Inventory at Jaguar Land Rover was R28,079.40 crores as at March 31, 2017, an increase of 8.5%, as compared to R25,762.35 crores as at March 31, 2016, mainly due to inventory volumes, higher actual costs of all models,

Corporate Overview Financial StatementsStatutory Reports
156 72nd Annual Report 2016-17
due to working of GB£/EUR exchange rate and other overheads. In terms of number of days of sales, finished goods represented 34 inventory days in Fiscal 2017 as compared to 32 days in Fiscal 2016.
Trade Receivables (net of allowance for doubtful debts) were R14,075.55 crores as at March 31, 2017, representing an increase of 3.7% compared to R13,570.91 crores as at March 31, 2016. Trade Receivables have increased at Tata and other brand vehicles (including vehicle financing) to R3,471.93 crores as at March 31, 2017 as compared to R3,255.88 crores as at March 31, 2016. Trade receivables at Jaguar Land Rover was R10,006.21 crores as at March 31, 2017, as compared to R10,024.79 crores as at March 31, 2016. The allowances for doubtful debts were R1,377.44 crores as at March 31, 2017 compared to R1,274.29 crores as at March 31, 2016.
Cash and cash equivalents were R13,986.76 crores, as at March 31, 2017, compared to R17,153.61 crores as at March 31, 2016. The Company holds cash and bank balances in Indian rupees, GB£, Chinese Renminbi, etc. The decrease is also attributable to unfavourable currency translation impact from GB£ to INR of R2,028 crores.
Other bank balances were R22,091.12 crores, as at March 31, 2017, compared to R13,306.79 crores as at March 31, 2016. These include bank deposits maturing within one year of R21,852.76 crores as at March 31, 2017, compared to R12,775.97 crores as at March 31, 2016.
Current tax assets (net) (current + non-current) were R1,195.67 crores, as at March 31, 2017, compared to R1,412.56 crores as at March 31, 2016.
Other assets
As at March 31, As at April 1, Change2017 2016 2015(` in crores)
Other assets - non current 2,847.36 2,309.02 1,983.60 538.34 Other assets – current 6,539.99 5,824.09 5,412.09 715.90 Total 9,387.35 8,133.11 7,395.69 1,254.24
These mainly includes prepaid expenses, including rentals on operating lease of R2,063.55 crores as at March 31, 2017, as compared to R1,774.54 crores as at March 31, 2016. Taxes recoverable, statutory deposits and dues from government were R6,030.06 crores as at March 31, 2017, as compared to R5,472.15 crores as at March 31, 2016.
Equity attributable to owners of Tata Motors Ltd was R58,061.89 crores and R78,952.41 crores as at March 31, 2017 and
2016, respectively, a decrease of 26.5%.
Other equity decreased by 26.7% from R78,273.23 crores as at March 31, 2016 to R57,382.67 crores as at March 31, 2017. Though, the profit for Fiscal 2017 was R7,454.36 crores, decrease in other equity of R20,890.56 crores was primarily attributable to following reasons:
Debits for remeasurement of employee benefit plans was R6,569.14 in Fiscal 2017.
Translation loss of R9,952.33 crores recognized in Translation Reserve on consolidation of subsidiaries further contributed to a decrease in Reserves and Surplus.
Further reduction in Hedging Reserves by R11,759.48 crores, primarily due to mark-to-market losses on forwards and options in Jaguar Land Rover, primarily due to decline in the US$-GB£ forward rates.
Borrowings:
As at March 31, As at April 1, Change2017 2016 2015(` in crores)
Long term borrowings 60,629.18 50,510.39 54,607.14 10,118.79Short term borrowings 13,859.94 11,450.78 13,154.68 2,409.16Current maturities of long term borrowings 4,114.86 7,398.79 4,949.04 (3,283.93)Total 78,603.98 69,359.96 72,710.86 9,244.02 Current maturities of long-term borrowings represent the
amount of loan repayable within one year.
During Fiscal 2017, the Company raised R2,700 crores through unsecured non-convertible debentures with a tenor ranging from 2 years to 5 years.
During Fiscal 2017, Jaguar land rover Automotive plc, issued Euro 650 million (R4,466.88 crores) Senior Notes maturing in January 2024 at a coupon of 2.20%. Further, it issued GB£ 300 million (R2,406.52 crores) Senior Notes maturing in January 2021 at a coupon of 2.75%.
Other financial liabilities
As at March 31, As at April 1, Change2017 2016 2015(` in crores)
Other financial liabilities - non current 11,409.58 7,943.74 7,994.85 3,465.84Other financial liabilities – current 25,634.83 21,281.60 19,173.01 4,353.23Total 37,044.41 29,225.34 27,167.86 7,819.07

Notice Board’s Report Corporate Governance Report Business Responsibility ReportManagement Discussion & Analysis
(118-165)
157
These included R25,517.52 crores of derivative financial instruments, mainly attributable to Jaguar Land Rover as at March 31, 2017 compared to R14,226.41 crores as at March 31, 2016, reflecting notional liability due to the valuation of derivative contracts. However, current maturities of long-term borrowings were R4,114.86 crores as at March 31, 2017, as compared to R7,398.79 crores as at March 31, 2016.
Trade payables were R57,698.33 crores as at March 31, 2017, as compared to R57,580.46 crores as at March 31, 2016.
Acceptances were R4,834.24 crores as at March 31, 2017, as compared to R3,981.33 crores as at March 31, 2016.
Provisions (current and non-current) were made towards warranty and employee benefit schemes. Short-term provisions are those, which are expected to be settled during next financial year. The details are as follows:
As at March 31, As at April 1, Change2017 2016 2015(` in crores)
Long term provisions - non-current 9,004.46 7,891.01 6,938.27 1,113.45Short term provisions – current 5,807.76 5,844.51 4969.12 (36.75)Total 14,812.22 13,735.52 11,907.39 1,076.70
i. Provision for warranty increased to R12,031.33 crores as at March 31, 2017, as compared to R11,516.43 crores as at March 31, 2016, an increase of R514.90 crores.
ii. The provision for employee benefits obligations decreased to R801.90 crores as at March 31, 2017, as compared to R954.69 crores as at March 31, 2016.
iii. Provision for legal and product liability increased to R822.17 crores as at March 31, 2017, as compared to R758.37 crores as at March 31, 2016.
Other liabilities
As at March 31, As at April 1, Change2017 2016 2015(` in crores)
Other liabilities - non current 17,392.56 9,886.55 10,948.00 7,506.01 Other liabilities – current 6,401.84 6,187.22 5,105.25 214.62 Total 23,794.40 16,073.77 16,053.25 7,720.63
These mainly includes liabilities towards employee benefits obligations of R11,984.02 crores as at March 31, 2017, as compared to R5,547.24 crores as at March 31, 2016, increase mainly at Jaguar
Land Rover, primarily driven by a decline in AA rated UK corprate bond yields. Deferred revenue were R6,926.35 crores as at March 31, 2017, as compared to R5,609.88 crores as at March 31, 2016. Statutory dues (VAT, Excise, Service Tax, Octroi etc.) were R2,658.93 crores as at March 31, 2017, as compared to R2,443.43 crores as at March 31, 2016.
Consolidated Cash Flow
The following table sets forth selected items from consolidated cash flow statement:
Fiscal 2017 Fiscal 2016 Change(` in crores)
Cash from operating activity 30,199.25 37,899.54 (7,700.29)Profit for the year 7,556.56 11,678.19 Adjustments for cash flow from operations 21,283.55 26,947.95 Changes in working capital 32,094.35 39,939.32 Direct taxes paid (1,895.10) (2,039.78) Cash from investing activity (38,079.88) (37,504.43) (575.45)Payment for property, plant and equipment and other intangible assets (net) (30,413.49) (31,444.15) Net investments, short term deposit, margin money and loans given (8,924.27) (6,848.93)
Dividend and interest received 1,257.88 788.65 Net Cash from / (used in) Financing Activities 6,205.30 (3,795.12) 10,000.42 Proceeds from issue of shares 4.55 7,433.22 Dividend Paid (including paid to minority shareholders) (121.22) (108.11) Interest paid (5,336.34) (5,715.66) Net Borrowings (net of issue expenses) 11,658.31 (5,404.57) Net increase / (decrease) in cash and cash equivalent (1,675.33) (3,400.01) 1,724.68 Cash and cash equivalent, beginning of the year 17,153.61 19,743.09 Effect of exchange fluctuation on cash flows (1,491.52) 810.53 Cash and cash equivalent, end of the year 13,986.76 17,153.61
a) Cash generated from operations before working capital changes was R28,840.11 crores in Fiscal 2017, as compared to R38,626.14 crores in the previous year, representing a decrease in cash from generated from consolidated operations, consistent with the reduction in profit on a consolidated

Corporate Overview Financial StatementsStatutory Reports
158 72nd Annual Report 2016-17
basis. After considering the impact of working capital changes including the net movement of vehicle financing portfolio, the net cash generated from operations was R30,199.25 crores in Fiscal 2017, as compared to R37,899.54 crores in the previous year. The increase in trade receivables, inventories and other assets amounting to R11,668.00 crores mainly due to increase in sales was offset by increase in trade and other payables and provisions amounting to R14,922.24 crores.
b) The net cash outflow from investing activity increased to R38,079.88 crores in Fiscal 2017 from R37,504.43 crores in Fiscal 2016.
Capital expenditure (net) was at R30,413.49 crores in Fiscal 2017, compared to R31,344.15 crores, related mainly to capacity/ expansion of facilities, quality and reliability projects and product development projects.
Net investments, short-term deposits, margin money and loans given was an outflow of R8,924.27 crores in Fiscal 2017 as compared to R6,848.93 crores in Fiscal 2016, mainly at Jaguar Land Rover.
c) The net change in financing activity was an inflow of R6,205.30 crores in Fiscal 2017 as compared to an outflow of R3,795.12 crores in Fiscal 2016.
During Fiscal 2016, the Company raised R7,433.22 crores through rights issue of shares.
In Fiscal 2017, R9,172.39 crores were raised from long-term borrowings (net) as compared to repayment of R3,526.78 crores (net) in Fiscal 2016 as described in further detail below
Net increase in short-term borrowings of R2,485.30 crores in Fiscal 2017 as compared to a decrease of R1,877.98 crores in Fiscal 2016, mainly at Tata and other brand vehicles (including vehicle financing).
As at March 31, 2017, the Company’s borrowings (including short-term debt) were R78,603.98 crores, compared to R69,359.96 crores as at March 31, 2016.
Principal Sources of Funding Liquidity
The Company finances its capital expenditures and research and development investments through cash generated from operations, cash and cash equivalents, debt and equity funding. The Company also raises funds through sale of investments, including divestment in stakes of subsidiaries on a selective basis.
The Company’s cash and bank balances on a consolidated basis were R36,077.88 crores as at March 31, 2017, as compared to R30,460.40 crores as at March 31, 2016. These enable the Company to cater to business needs in the event of changes in market conditions.
The Company’s capital expenditures were R31,750.74 crores and R31,425.39 crores for Fiscal 2017 and 2016, respectively, and it currently plans to invest approximately R400 billion in Fiscal 2018 in new products and technologies. The Company intends to continue to invest in new products and technologies to meet consumer and regulatory requirements. These investments are intended to enable the Company to pursue further growth opportunities and improve the Company’s competitive positioning. In December 2015, Jaguar Land Rover announced the initial investment of GB£ 1 billion to build a manufacturing facility in Slovakia with annual capacity of 150,000 units and production scheduled to begin in 2018 (construction of the plant commenced in September 2016) and in November 2016 confirmed that the all new Land Rover Discovery would be the first model manufactured at the plant. In November 2015, Jaguar Land Rover announced additional investment of GB£ 450 million to double capacity at the engine manufacturing facility in Wolverhampton and production of the 2.0l Ingenium petrol engine recently began. The manufacturing partnership with Magna Steyr, an operating unit of Magna International Inc, to build vehicles in Graz, Austria was announced in July 2015 and more recently Jaguar Land Rover announced that their first battery electric vehicle, the Jaguar I-PACE would be produced under the agreement with Magna Steyr from 2018. The Company expects to meet most of its investments out of operating cash flows and cash liquidity available. In order to meet the remaining funding requirements, the Company may be required to raise funds through additional loans and by accessing capital markets from time to time, as deemed necessary.
With the ongoing need for investments in products and technologies, the Company on a standalone basis (Including joint operations) was free cash flow (a non-GAAP measure, measured at cash flow from operating activities, less payment for property, plant and equipment and intangible assets) negative in Fiscal 2017, of R2,045.52 crores. The Company expects that with the improvement in macro-economic conditions and business performance, through other steps like raising funds at subsidiary levels, review of non-core investments, and through appropriate actions for raising additional long-term resources at Tata Motors Limited on a standalone basis, the funding gap can be appropriately addressed.
The following table provides information for the credit rating of Tata Motors Limited for short-term borrowing and long-term borrowing

Notice Board’s Report Corporate Governance Report Business Responsibility ReportManagement Discussion & Analysis
(118-165)
159
from the following rating agencies as at March 31, 2017: Credit Analysis and Research Ltd Ratings, or CARE, Information and Credit Rating Agency of India Ltd, or ICRA, Credit Rating Information Services of India Limited, or CRISIL Ltd, Standard & Poor’s Ratings Group, or S&P, and Moody’s Investor Services, or Moody’s. A credit rating is not a recommendation to buy, sell or hold securities. A credit rating may be subject to withdrawal or revision at any time. Each rating should be evaluated separately of any other rating:
CARE ICRA CRISIL S&P Moody’sLong-term borrowings AA+ AA AA BB+ Ba1Short-term borrowings — A1+ A1+ — —
The Company believes that it has sufficient liquidity available to meet its planned capital requirements. However, the Company’s sources of funding could be materially and adversely affected by an economic slowdown, as was witnessed in Fiscal 2009, or other macroeconomic factors in India and abroad, such as in the United Kingdom, the United States, Europe, Russia and China, all of which are beyond the Company’s control. A decrease in the demand for the Company’s vehicles could affect its ability to obtain funds from external sources on acceptable terms or in a timely manner.
The Company’s cash is located at various subsidiaries within the Tata Motors Group. There may be legal, contractual or economic restrictions on the ability of subsidiaries to transfer funds to the Company in the form of cash dividends, loans, or advances. Brazil, Russia, South Africa and other jurisdictions have regulatory restrictions, disincentives or costs on pooling or transferring of cash. However, such restrictions have not had and are not estimated to have a significant impact on the Company’s ability to meet its cash obligations.
In order to refinance the Company’s borrowings and for supporting long-term fund needs, the Company continued to raise funds in Fiscal 2016 and 2017, through issue of various debt securities and Rights issue of shares described below.
During Fiscal 2016, the Company allotted 15,04,90,480 Ordinary shares (including 3,20,49,820 shares underlying the ADRs) of R2 each at a premium of R448 per share, aggregating R6,772.07 crores and 2,65,09,759 ‘A’ Ordinary shares of R2 each at a premium of R269 per share, aggregating R718.42 crores pursuant to the Rights issue. Out of the proceeds of the Rights issue, R500 crores have been used for funding expenditure towards plant and machinery, R1,500 crores towards research and product development, R4,000 crores towards repayment in full or in part of certain long-term and short-term borrowings, and R1,401.10 crores towards general corporate purposes.
During Fiscal 2016, TML Holdings Pte. Ltd., a subsidiary of the Company, has
refinanced an existing unsecured multi-currency loan of US$600 million (US$250 million and SG$62.8 million maturing in November 2017 and US$210 million and SG$114 million maturing in November 2019) with a new unsecured loan of US$600 million (US$300 million maturing in October 2020 and US$300 million maturing in October 2022); and
refinanced the existing SG$350 million 4.25% Senior notes due in May 2018 with a new syndicated loan of US$250 million maturing in March 2020.
During Fiscal 2016, Tata Motors Finance Limited issued 43,400,000 privately placed, cumulative non-participating compulsory convertible preference shares of R100 each convertible after seven years, which qualified as tier 1 capital.
In Fiscal 2016, TMFL, and its subsidiary, TMFSL, through secured and unsecured NCDs raised R2,214 crores.
In January 2017, Jaguar Land Rover Automotive plc issued EUR 650 million senior notes due 2024 at a coupon of 2.20% per annum and GB£ 300 million senior notes due 2021 at a coupon of 2.75% per annum. The proceeds were for general corporate purposes, including support for Jaguar Land Rover’s ongoing growth and capital spending requirements.
In March 2017, Jaguar Land Rover Automotive plc completed consent transactions to align the terms of its US$ 500 million 5.625% senior notes due 2023, its US$ 700 million 4.125% senior notes due 2018 and its GB£ 400 million 5.000% senior notes due 2022 to bonds it issued after January 2014.
During Fiscal 2017, Tata Motors Limited issued rated, listed, unsecured NCDs of R2,700 crores with a tenor ranging from 2 to 5 years. The proceeds have been utilized for general corporate purpose. Tata Motors Limited prepaid R300 crores of its Unsecured 8.60% NCD due 2018 in February 2017.
During Fiscal 2017, Tata Motors Finance Limited through its subsidiary Sheba Properties Ltd., issued 22,500,000 privately placed, cumulative non-participating compulsory convertible preference shares of R100 each convertible after seven years, which qualifies as tier 1 capital. In Fiscal 2017, Tata Motors Finance Limited, and its subsidiaries, Sheba Properties Ltd and Tata Motors Finance Solutions Ltd, raised NCDs R3,161 crores through secured and unsecured NCDS.

Corporate Overview Financial StatementsStatutory Reports
160 72nd Annual Report 2016-17
The Tata Motors Group funds its short-term working capital requirements with cash generated from operations, overdraft facilities with banks, short-and medium-term borrowings from lending institutions, banks and commercial paper. The maturities of these short-and medium-term borrowings and debentures are generally matched to particular cash flow requirements. The working capital limits are R14,000 crores from various banks in India as at March 31, 2017. The working capital limits are secured by hypothecation of certain existing current assets of the Company. The working capital limits are renewed annually.
Jaguar Land Rover Automotive plc currently has a GB£ 1.87 billion revolving credit facility with a syndicate of 30 banks, maturing in 2020. The revolving credit facility remained undrawn as at March 31, 2017.
Some of the Company’s financing agreements and debt arrangements set limits on and/or require prior lender consent for, among other things, undertaking new projects, issuing new securities, changes in management, mergers, sales of undertakings and investment in subsidiaries. In addition, certain negative covenants may limit the Company’s ability to borrow additional funds or to incur additional liens, and/or provide for increased costs in case of breach. Certain of the Company’s financing arrangements also include financial covenants to maintain certain debt- to-equity ratios, debt-to-earnings ratios, liquidity ratios, capital expenditure ratios and debt coverage ratios.
The Company monitors compliance with its financial covenants on an ongoing basis. The Company also reviews its refinancing strategy and continues to plan for deployment of long-term funds to address any potential non-compliance.
As at March 31, 2017, GB£ 687 million of cash was held by Jaguar Land Rover subsidiaries outside of the UK. The cash in some of these jurisdictions is subject to certain restrictions on cash pooling, intercompany loan arrangements or interim dividends. However, annual dividends are generally permitted and JLR do not believe that these restrictions have, or are expected to have, any impact on Jaguar Land Rover’s ability to meet it’s cash obligations.
Certain debt issued by Jaguar Land Rover is subject to customary covenants and events of default, which include, among other things, restrictions or limitations on the amount of cash, which may be transferred outside the Jaguar Land Rover group of companies in the form of dividends, loans or investments to the Company and its subsidiaries. These are referred to as restricted payments in the relevant Jaguar Land Rover financing documentation. In general, the amount of cash which may be transferred as restricted
payments from the Jaguar Land Rover group to the Company and its subsidiaries is limited to 50% of its cumulative consolidated net income (as defined in the relevant financing documentation) from January 2011. As at March 31, 2017, the estimated amount that is available for dividend payments, other distributions and restricted payments was approximately GB£ 4,841 million.
FINANCIAL PERFORMANCE ON A STANDALONE BASIS
The financial information discussed in this section is derived from the Company’s Audited Standalone Financial Statements. These include the Company’s proportionate share of income and expenditure in its two Joint Operations, namely Tata Cummins Pvt Ltd and Fiat India Automobiles Pvt Ltd.
Fiscal 2017
Fiscal 2016
(%) (%)
Income from operations 100.0 100.0
Expenditure:
Cost of material consumed (including change in stock) 63.8 61.4
Excise duty 9.7 9.6
Employee cost 7.2 6.7
Other expenses (net) 17.7 17.4
Amount capitalised (1.9) (2.2)
Other income 2.0 3.0
Profit before exceptional items, depreciation and amortisation expenses, foreign exchange (gain)/loss finance costs and tax 5.5 10.1
Depreciation and amortisation expenses (including product development / engineering expenses) 7.0 5.8
Finance costs 3.2 3.4
Foreign exchange (gain)/loss (0.5) 0.5
Exceptional items – loss 0.7 0.5
Profit before tax (4.9) (0.1)
Tax expenses 0.1 -
Profit after tax (5.0) (0.1)
Fiscal 2017 has been a challenging and highly volatile year, which followed a period of low demand and inconsistent recovery in the prior year in the automotive sector in India. In addition, the Company also underperformed on many fronts, amplifying the impact of the external environment.

Notice Board’s Report Corporate Governance Report Business Responsibility ReportManagement Discussion & Analysis
(118-165)
161
Income from operations of the Company for Fiscal 2017, stood at R49,100.41 crores as compared to R47,383.61 crores, increased by 3.6%. Total number of vehicles sold were 545,416 units in Fiscal 2017, as compared to 511,931 units in Fiscal 2016, a growth of 6.5%
Cost of materials consumed (including change in stock)
Fiscal 2017 Fiscal 2016
(R in crores)
Consumption of raw materials and components
27,654.40 24,997.40
Purchase of product for sale 3,945.97 4,101.97
Change in inventories of finished goods, Work-in-progress and products for sale (251.43) 10.05
Total 31,348.94 29,109.42
Cost of material consumed increased from 61.4% of total revenue to 63.8% in Fiscal 2017, representing an increase of 240 bps, mainly due to product mix – relatively lower proportion of M&HCV sales.
Excise duty were R4,736.41 crores in Fiscal 2017 as compared to R4,538.14 crores in Fiscal 2016, an increase of 4.4%, primarily due to increase in revenues.
Employee Costs were R3,558.52 crores in Fiscal 2017 as compared to R3,188.97 crores in Fiscal 2016, an increase by 11.6%, mainly due to annual increments and wage revisions at various plant locations.
Other Expenses includes all works operations, indirect manufacturing expenses, freight cost, fixed marketing costs and other administrative costs. These expenses have increased by 5.9% to R8,697.42 crores in Fiscal 2017 from R8,216.65 crores in Fiscal 2016. The breakdown is provided below:
Fiscal 2017 Fiscal 2016 Change(` in crores)
Processing charges 1,522.44 1,507.21 15.23Consumption of stores & spare parts 579.09 519.37 59.72Freight, transportation, port charges, etc. 1,541.88 1,296.71 245.17Power and fuel 440.03 430.77 9.26Warranty expenses 486.27 492.11 (5.84)Information technology/computer expenses 762.37 631.93 130.44Publicity 848.36 670.01 178.35Allowance for finance, trade and other receivables 133.72 138.79 (5.07)
Works operation and other expenses 2,383.26 2,529.75 (146.49)Other Expenses 8,697.42 8,216.65 480.77
The changes are mainly driven by volumes and the size of operations.
i. Freight, transportation, port charges etc., as a percentage to total revenue, were 3.1% in Fiscal 2017, as compared to 2.7% in Fiscal 2016. The increase was due to rise in diesel prices.
ii. Publicity expenses represented 1.7% of total revenues in Fiscal 2017 and 1.4% in Fiscal 2016. In addition to routine product and brand campaigns, the Company incurred expenses relating to new product introduction campaigns for the Tiago, the Hexa, the Tigor, the Yodha, etc.
iii. Warranty expenses represented 1% of the Company’s revenues in Fiscal 2017 and 2016.
iv. Information technology/computer expenses represented 1.6% and 1.3% of the Company’s revenues in Fiscal 2017 and 2016, respectively. The increase was mainly due to certain purchases of software for the Company.
v. Works operation and other expenses have decreased to 4.9% of net revenue in Fiscal 2017 from 5.3% in Fiscal 2016.
Amount capitalized represents expenditure transferred to capital and other accounts allocated out of employee cost and other expenses, incurred in connection with product development projects and other capital items. The expenditure transferred to capital and other accounts has decreased by 9.0% to R941.55 crores in Fiscal 2017 from R1,034.40 crores in Fiscal 2016, mainly due to various product development projects undertaken by the Company for the introduction of new products and variants.
Other Income decreased by 30.2% to R978.84 crores in Fiscal 2017 from R1,402.31 crores in Fiscal 2016. This includes interest income of R184.65 crores in Fiscal 2017, compared to R263.79 crores in Fiscal 2016. Dividend income decreased to R676.50 crores in Fiscal 2017 from R1,061.71 crores in Fiscal 2016, whereas profit on sale of investment increased to R116.76 crores in Fiscal 2017, compared to R67.48 crores in Fiscal 2016, which are primarily profit on the sale of mutual funds.
Profit before exceptional items, depreciation and amortization expense, finance costs, foreign exchange (gain)/loss and tax is R2,679.51 crores in Fiscal 2017, representing 5.5% of revenue in Fiscal 2017 compared to R4,767.14 crores in Fiscal 2016.
Depreciation and amortization expense (including product development / engineering expenses): During Fiscal 2017,

Corporate Overview Financial StatementsStatutory Reports
162 72nd Annual Report 2016-17
expenditures increased by 24.6% to R3,423.87 crores from R2,747.49 crores in Fiscal 2016. The depreciation has increased by 34.1% to R1,873.41 crores as compared to R1,396.65 in Fiscal 2016 is due to new product launches and change in useful life of certain assets. The amortization expenses have increased by 17.5% to R1,095.98 crores in Fiscal 2017 from R932.57 crores in Fiscal 2016, and are attributable to new products introduced during the year. Expenditure on product development / engineering expenses decreased by 8.7% to R454.48 in Fiscal 2017 from R418.27 in Fiscal 2016.
During, Fiscal 2017, the Company has carried out a review of the useful life of its assets, considering the physical condition of the assets and benchmarking analysis. As a result the depreciation and amortization charge is higher by R253.29 crores.
Finance Cost was flat at R1,590.15 crores in Fiscal 2017 from R1,592.00 crores in Fiscal 2016. Though, the borrowings have increased in Fiscal 2017, the decrease was mainly achieved by refinancing certain long-term loans with loans with lower interest rates and reduction in interest rates.
Foreign exchange (gain)/loss (net) of R252.45 crores in Fiscal 2017 as compared to loss of R221.91 crores in Fiscal 2016. The gain was due to appreciation on INR as compared to USD.
Exceptional items
Fiscal 2017 Fiscal 2016 Change
(` in crores)Employee separation cost 67.61 10.04 57.57Provision for impairment of investments and cost associated with closure of operations of a subsidiary - 97.86 (97.86)Provision for impairment of investment in a subsidiary 123.17 - 123.71Impairment of capitalized fixed assets - 163.94 (163.94)Provision for BSIII vehicles 147.93 - 147.93Total 338.71 271.84 66.87
i. Employee separation cost: The Company has given early retirement to various employees resulting in an expense both in Fiscal 2017 and 2016.
ii. R147.93 crores for Fiscal 2017, relates to provision for inventory of BSIII vehicles as at March 31, 2017.
Loss before tax was R2,420.77 crores in Fiscal 2017, compared to R67.10 crores in Fiscal 2016. The losses were mainly attributable to
reduction in sales volumes of medium & heavy commercial vehicles and competitive pressure on pricing. Further, there was increase in depreciation expenses as a result of additions to plant and facilities in recent years and change in useful life of certain assets; increase in employee cost due to wage revision at various plant locations; increase in publicity expenses due to new product launches. Furthermore, there was reduction in dividend from subsidiary companies and there was provision for BSIII inventory and discounts thereon as at March 31, 2017.
Tax Expense represents a net charge of R59.22 crores in Fiscal 2017, as compared to net credit of R4.80 crores in Fiscal 2016.
Loss after tax was R2,479.99 crores in Fiscal 2017 as compared to R62.30 crores in Fiscal 2016.
Standalone Balance Sheet
Property, plant and equipment, Goodwill and Other Intangible assets
As at March 31, As at April 1, Change2017 2016 2015(` in crores)
Property, plant and equipment (including capital work-in-progress) 19,235.70 19,131.20 18,906.81 104.50 Goodwill and Other intangible assets (including assets under development) 8,238.81 7,631.14 7,161.54 607.67
Total 27,474.51 26,762.34 26,068.35 712.17
There is increase (net of depreciation and amortization) in the intangible and tangible assets in Fiscal 2017. The increase is mainly due to dies and toolings capitalized for new products launched during the year and also product development costs capitalized (under development) during the year.
Investments in subsidiaries, joint ventures and associates were R14,778.87 crores as at March 31, 2017, as compared to R14,590.41 crores as at March 31, 2016. During Fiscal 2017, the Company converted R159 crores of optionally convertible preference shares into equity in one of the associates, namely Tata Hitachi Construction Machinery Co. Ltd.

Notice Board’s Report Corporate Governance Report Business Responsibility ReportManagement Discussion & Analysis
(118-165)
163
Investments (Current + Non-current) were R2,929.29 crores as at March 31, 2017, as compared to R2,372.91 crores as at March 31, 2016. The details are as follows:
As at March 31, As at April 1, Change2017 2016 2015(` in crores)
Mutual Funds 2,400.92 1,745.84 - 655.08 Quoted Equity shares 218.18 144.34 143.53 73.84 Unquoted Equity shares 310.19 310.19 314.87 - Others - 172.54 172.54 (172.54)Total 2,929.29 2,372.91 630.94 556.38
There was increase in mutual fund investments in Fiscal 2017. Increase in quoted equity shares were due to increase in market value as at March 31, 2017. Others in Fiscal 2016 included optionally convertible preference shares in one the associates of the Company, which were converted to equity in Fiscal 2017.
Loans and Advances
As at March 31, As at April 1, Change2017 2016 2015(` in crores)
Long term loans and advances 389.61 252.93 310.73 136.68 Short term loans and advances 231.35 484.44 342.58 (253.09)Total 620.96 737.37 653.31 (116.41)
Loans and advances include advance to suppliers, contractors etc. Fiscal 2016 included loan to Joint operation, Fiat India Automobiles Pvt Ltd of R132.50 crores, which has been repaid in Fiscal 2017. Advance and other receivables decreased to R81.94 crores as at March 31, 2017, as compared to R166.45 crores as at March 31, 2016.
Other Financial Assets
As at March 31, As at April 1, Change2017 2016 2015(` in crores)
Other financial assets - non current 196.32 102.92 158.60 93.40 Other financial assets - current 100.76 125.20 40.47 (24.44)Total 297.08 228.12 199.07 68.96
These included R291.11 crores of derivative financial instruments, as at March 31, 2017 compared to R159.71 crores as at March 31, 2016, reflecting notional liability due to the valuation of derivative contracts.
Inventories as at March 31, 2017, were R5,504.42 crores as compared to R5,117.92 crores as at March 31, 2016, an increase of 7.6%. In
terms of number of days of sales, finished goods represented 21 inventory days in Fiscal 2017 as compared to 22 days in Fiscal 2016.
Trade Receivables (net of allowance for doubtful debts) were R2,128.00 crores as at March 31, 2017, representing an increase of 4.0% compared to R2,045.58 crores as at March 31, 2016. The allowances for doubtful debts were R693.17 crores as at March 31, 2017 compared to R632.10 crores as at March 31, 2016.
Cash and cash equivalents were R188.39 crores, as at March 31, 2017, compared to R427.07 crores as at March 31, 2016. The decrease was mainly attributable to reduction in balances and deposits with banks.
Other bank balances were R97.67 crores, as at March 31, 2017, compared to R361.35 crores as at March 31, 2016. These include earmarked balances with banks of R86.60 crores as at March 31, 2017, compared to R291.28 crores as at March 31, 2016.
Current tax assets (net) (current + non-current) were R854.07 crores, as at March 31, 2017, compared to R803.47 crores as at March 31, 2016.
Other assets
As at March 31, As at April 1, Change2017 2016 2015(` in crores)
Other assets - non current 1,856.28 1,679.01 1,612.76 177.27 Other assets – current 1,807.06 1,550.45 1,345.91 256.61 Total 3,663.34 3,229.46 2,958.67 433.88
These mainly includes prepaid expenses, including rentals on operating lease of R233.09 crores as at March 31, 2017, as compared to R218.29 crores as at March 31, 2016. Taxes recoverable, statutory deposits and dues from government were R2,433.82 crores as at March 31, 2017, as compared to R2,185.49 crores as at March 31, 2016. Capital advances were R558.84 crores as at March 31, 2017, as compared to R453.47 crores as at March 31, 2016.
Equity was R20,809.15 crores and R23,262.11 crores as at March 31, 2017 and 2016, respectively, a decrease of 10.5%.
Other equity decreased by 10.9% from R22,582.93 crores as at March 31, 2016 to R20,129.93 crores as at March 31, 2017, mainly due to losses for Fiscal 2017.

Corporate Overview Financial StatementsStatutory Reports
164 72nd Annual Report 2016-17
Borrowings
As at March 31, As at April 1, Change2017 2016 2015(` in crores)
Long term borrowings 13,686.09 10,599.96 12,234.88 3,086.13 Short term borrowings 5,375.52 3,654.72 8,173.02 1,720.80 Current maturities of long term borrowings 512.37 2,218.66 1,217.85 (1,706.29)Total 19,573.98 16,473.34 21,625.75 3,100.64
Current maturities of long-term borrowings represent the amount of loan repayable within one year.
During Fiscal 2017, the Company raised R2,700 crores through unsecured non-convertible debentures with a tenor ranging from 2 years to 5 years.
Other financial liabilities
As at March 31, As at April 1, Change2017 2016 2015(` in crores)
Other financial liabilities - non current 1,123.66 2,911.84 3,749.76 (1,788.18)Other financial liabilities – current 2,465.14 3,784.19 2,324.90 (1,319.05)Total 3,588.80 6,696.03 6,074.66 (3,107.23)
These included R2,045.08 crores of financial guarantee contracts as at March 31, 2017 compared to R3,391.29 crores as at March 31, 2016. The reduction is due to payments and reversal of provision in Fiscal 2017. Further, current maturities of long-term borrowings were R512.37 crores as at March 31, 2017 as compared to R2,218.66 crores as at March 31, 2016. Furthermore, interest accrued but not due on borrowings were R449.73 crores as at March 31, 2017 as compared to R453.41 crores as at March 31, 2016.
Trade payables were R7,015.21 crores as at March 31, 2017, as compared to R5,141.17 crores as at March 31, 2016, mainly due to sundry creditors for goods supplied and services received, liabilities for variable marketing expenses, wage revisions etc.
Acceptances were R4,379.29 crores as at March 31, 2017, as compared to R3,887.28 crores as at March 31, 2016.
Provisions (current and non-current) were made towards warranty and employee benefit schemes. Short-term provisions are those, which are expected to be settled during next financial year. The details are as follows:
As at March 31, As at April 1, Change2017 2016 2015(` in crores)
Long term provisions (Non-current) 850.71 750.89 711.54 99.82Short term provisions (Current) 467.98 450.27 378.77 17.71Total 1,318.69 1,201.16 1,090.31 117.53
i. Provision for warranty increased to R657.38 crores as at March 31, 2017, as compared to R597.85 crores as at March 31, 2016, a marginal increase of R59.53 crores.
ii. The provision for employee benefits obligations increased to R610.92 crores as at March 31, 2017, as compared to R575.53 crores as at March 31, 2016, mainly due to changes in actuarial assumptions.
Other liabilities
As at March 31, As at April 1, Change2017 2016 2015(` in crores)
Other liabilities - non current 321.24 378.07 380.86 (56.83)Other liabilities – current 1,864.02 1,704.84 1,299.26 159.18 Total 2,185.26 2,082.91 1,680.12 102.35
These mainly includes liability for advance received from customers of R849.51 crores as at March 31, 2017, as compared to R728.65 crores as at March 31, 2016. Deferred revenue were R428.05 crores as at March 31, 2017, as compared to R427.58 crores as at March 31, 2016. Statutory dues (VAT, Excise, Service Tax, Octroi etc.) were R799.04 crores as at March 31, 2017, as compared to R713.83 crores as at March 31, 2016.
Deferred tax liability represent timing differences where current benefit in tax will be offset by a debit in the statement of profit and loss. The amount increased to R97.95 crores as at March 31, 2017, as compared to R71.39 crores as at March 31, 2016.
Standalone Cash Flow
Fiscal 2017 Fiscal 2016 Change(` in crores)
Net cash from operating activities 1,381.47 2,702.98 (1,321.51)Profit/(Loss) for the year (2,479.99) (62.30) Adjustments for cash flow from operations 4,028.96 3,564.72 Changes in working capital (73.75) 775.94 Direct taxes paid (93.75) (23.50)

Notice Board’s Report Corporate Governance Report Business Responsibility ReportManagement Discussion & Analysis
(118-165)
165
Net cash used in investing activities (2,737.98) (3,264.22) 526.24 Payment for Assets (net) (3,411.58) (3,249.21) Net investments, short term deposit, margin money and loans given (259.01) (1,311.37) Dividend and interest received 932.61 1,296.36 Net Cash from/(used in) financing activities 1,119.21 (78.87) 1,198.08 Proceeds from issue of shares 4.55 7,433.22 Dividend Paid (73.00) - Interest paid (1,957.59) (2,085.91) Net Borrowings (net of issue expenses) 3,145.25 (5,426.18) Net increase / (decrease) in cash and cash equivalent (237.30) (640.11) Cash and cash equivalent, beginning of the year 427.07 1,066.47 Effect of exchange fluctuation on cash flows (1.38) 0.71 Cash and cash equivalent, end of the year 188.39 427.07
a) Decrease in net cash from operations reflects loss in Fiscal 2017. The cash from operations before working capital changes was R1,548.97 crores in Fiscal 2017 compared to R3,502.42 crores in Fiscal 2016. There was net outflow of R73.75 crores in Fiscal 2017 towards working capital changes.
b) The net cash used in investing activities was R2,737.98 crores in Fiscal 2017 compared to R3,264.22 crores in Fiscal 2016, mainly attributable to:
Investments in mutual funds in Fiscal 2017 was R537.40 crores as compared to R1,669.02 crores in Fiscal 2016.
The cash used for payments for fixed assets was R3,411.58 crores (net) in Fiscal 2016 compared to R3,249.21 crores in Fiscal 2016.
Inflow by way of divestments in subsidiary companies resulting in cash inflow of R746.90 crores in Fiscal 2016.
Inflow due to dividends and interest in Fiscal 2017 was R932.61 crores as compared to R1,296.36 crores in Fiscal 2016.
There was an inflow (net) of R264.29 crores in Fiscal 2017 compared to an outflow of R227.49 crores for Fiscal 2016
towards Fixed / restricted deposits.
There was an outflow (net) of R139.08 crores in Fiscal 2017 compared to inflow of R613.81 crores for Fiscal 2016 towards investments in subsidiary, joint arrangements and associate companies.
c) The net change in financing activity was an inflow of R1,119.21 in Fiscal 2017 against outflow of R78.87 crores in Fiscal 2016. The outflow is attributable to:
Long-term borrowings (net) – inflow of R1,474.30 crores in Fiscal 2017 as compared to outflow of R949.90 crores.
Short-term borrowings (net) – inflow of R1,670.95 crores in Fiscal 2017 as compared to outflow of R4,476.28 crores.
During Fiscal 2016, the Company raised R7,433.22 crores through rights issue of shares.
In Fiscal 2017, the Company paid dividend of R73.00 crores.
In Fiscal 2017, interest payment was R1,957.59 crores as compared to R2,085.91 crores in Fiscal 2016.
FINANCIAL PERFORMANCE OF JAGUAR LAND ROVER (AS PER IFRS)
The financial statements of Jaguar Land Rover are prepared in accordance with International Financial Reporting Standards (IFRS) applicable in the United Kingdom. This information is given to enable the readers to understand the performance of Jaguar Land Rover on a consolidated basis for the Jaguar Land Rover group.
Revenues for Jaguar Land Rover for Fiscal 2017 were GB£24,339 million, an increase of 9.2% compared to GB£22,286 million in Fiscal 2016, driven primarily by increased wholesale volumes and a more favourable foreign exchange environment with the weaker pound following Brexit.
Material and other cost of sales in Fiscal 2017 were GB£15,071 million were 12.4% higher compared to the GB£13,405 million in Fiscal 2016 (and increased as a proportion of revenue to 61.9% in Fiscal 2017 compared to 60.1% in Fiscal 2016) primarily driven by the increase in sales volumes and the weaker pound.
Employee costs increased by 7.3% to GB£2,490 million in Fiscal 2017 compared to GB£2,321 million in Fiscal 2016, primarily reflecting increased headcount in manufacturing (to support the increase in production volumes) and product development to support Jaguar Land Rover’s plans to launch new models.

Corporate Overview Financial StatementsStatutory Reports
166 72nd Annual Report 2016-17
Other expenses (net of income) increased by 9.9% to GB£4,997 million in Fiscal 2017 compared to GB£4,546 million in Fiscal 2016 primarily reflecting higher costs related to freight and distribution, warranty, selling and fixed marketing expense and launch costs.
In Fiscal 2017 there was an accounting policy change to reclassify gains and losses on revenue and cost hedges from “Other Expense” to “Revenue” and “Material and Other Cost” respectively which the Company believe more appropriately reflects the intent of these hedges. This change is also reflected in the financial statements of the prior year.
Product development costs capitalized increased by 14.8% to GB£1,426 million in Fiscal 2017 compared to GB£1,242 million in Fiscal 2016 due primarily to expenditure on the development of future products and technologies.
EBITDA was GB£2,955 million (12.1% margin) in Fiscal 2017, down 6.1% compared to the EBITDA of GB£3,147 million (14.1% margin) in Fiscal 2016 due to the factors described above.
EBIT was GB£1,458 million (6.0% margin) in Fiscal 2017, down 18.7% compared to the EBIT of GB£1,793 million (8.0% margin) in Fiscal 2016 due to the lower EBITDA as well as an increase in depreciation and amortization, partially offset by higher profits from company’s China joint venture.
Profit before tax (“PBT”) increased by 3.4% to GB£1,610 million in Fiscal 2017 compared to GB£1,557 million in Fiscal 2016, reflecting the lower EBIT and more unfavourable revaluation of unrealized foreign currency debt and hedges, offset by lower net finance expense, favourable revaluation of commodity hedges and GB£151 million of further insurance and other recoveries related to Tianjin (compared to the GB£157 million net charge incurred in Fiscal 2016).
Profit after tax (“PAT”) decreased by 3.0% to GB£1,272 million in Fiscal 2017 compared to GB£1,312 million in Fiscal 2016. However, the effective tax rate of 21.0% in Fiscal 2017 was higher than the 15.7% in Fiscal 2016 primarily reflecting the non-recurrence of favourable deferred tax credits in Fiscal 2016 (£74 million related to UK Patent Box legislation).
Net cash generated from operating activities was GB£3,160 million in Fiscal 2017 compared to GB£3,556 million in Fiscal 2017 driven by solid profitability, positive working capital and non-cash accruals of GB£467 million (positive working capital and non-cash accruals of GB£547 million in Fiscal 2016) and a GB£68 million dividend received from the China joint venture partially offset by GB£199 million of tax paid. After GB£3,070 million of total investment spending (excluding GB£368 million of research
& development already expensed through the income statement) and GB£110 million of other income (primarily interest received and foreign exchange gains on deposits) free cash flow before financing was GB£295 million. Increases in debt of GB£841 million primarily reflects the approx. GB£857 million of bonds issued in January 2017 and a GB£45 million increase in the utilization of the invoice discounting facility offset by the redemption of the remaining US$84 million (GB£57 million) 8.125% notes due 2021 and lease payments of GB£4 million. Finance expenses and fees, primarily relating to interest payments on outstanding bonds and fees relating to financing facilities were GB£150 million and a dividend of GB£150 million was also paid to Tata Motors in June 2016. As at March 31, 2017, Jaguar Land Rover had a total cash balance of GB£5,487 million (comprised of GB£2,878 million of cash and cash equivalents and GB£2,609 million of financial deposits) compared to GB£4,651 million of total cash at March 31, 2016 (which comprised of GB£3,399 million of cash and cash equivalents and GB£1,252 million of financial deposits). With total cash of GB£5,487 million and an undrawn revolving credit facility of GB£1,870 million, total liquidity available to Jaguar Land Rover was GB£7,357 million at March 31, 2017, compared to GB£6,521 million at March 31, 2016.
FINANCIAL PERFORMANCE OF TATA MOTORS FINANCE LTD (AS PER INDIAN GAAP)
During Fiscal 2017, TMFL earned a total income of R2,721.25 crores compared to R3,228.57 crores earned in Fiscal 2016, reflecting a decrease of 15.7%. The expansion of spoke branches (Tier 2 and 3 towns) has helped in reaching out to the customer more quickly and in improving customer satisfaction. The loss before tax was R698.56 crores in Fiscal 2017 as compared to a profit of R301.64 crores in Fiscal 2016. The loss after tax was R1,182.29 crores in Fiscal 2017, as compared to a profit of R267.03 crores in previous year.
FINANCIAL PERFORMANCE OF TATA DAEWOO COMMERCIAL VEHICLES (AS PER KOREAN GAAP)
In Fiscal 2017, TDCV’s total revenue increased by 17.3% to KRW1,031.77 billion (R5,986 crores) compared to KRW879.66 billion (R5,096 crores) in Fiscal 2016, mainly due to lower export sales partially offset by increase in domestic sales. The profit after tax was KRW50.25 billion (R290 crores) compared to KRW45.56 billion (R264 crores) of previous year. Better profitability of Euro 6 Vehicles, better mix, favorable exchange realizations, continuous material cost reduction, various cost control and inventory initiatives helped in improving profits.

Notice Board’s Report Corporate Governance Report Business Responsibility ReportManagement Discussion & Analysis
(118-165)
167
FINANCIAL PERFORMANCE OF TATA TECHNOLOGIES LTD
The consolidated revenue of TTL in Fiscal 2017 increased 4.4% to R2,801.95 crores, compared to R2,683.38 crores in Fiscal 2016. The profit before tax decreased by 2.3% to R452.77 crores in Fiscal 2017, compared to R463.53 crores in Fiscal 2016. The profit after tax decreased by 7.8% to R353.59 crores in Fiscal 2017, as compared to R383.56 crores in Fiscal 2016.
INTERNAL CONTROL SYSTEMS AND THEIR ADEQUACY
The Company has an adequate system of internal controls in place. It has documented policies and procedures covering all financial and operating functions. These controls have been designed to provide a reasonable assurance with regard to maintaining of proper accounting controls for ensuring reliability of financial reporting, monitoring of operations, protecting assets from unauthorized use or losses, compliances with regulations. The Company has continued its efforts to align all its processes and controls with global best practices.
Some significant features of the internal control of systems are:
The Audit Committee of the Board of Directors, comprising of independent directors and functional since August 1988, regularly reviews the audit plans, significant audit findings, adequacy of internal controls, compliance with accounting standards as well as reasons for changes in accounting policies and practices, if any;
Documentation of major business processes and testing thereof including financial closing, computer controls and entity level controls, as part of compliance programme towards Sarbanes-Oxley Act, as required by the listing requirements at New York Stock Exchange;
An ongoing programme, for the reinforcement of the Tata Code of Conduct is prevalent across the organization. The Code covers integrity of financial reporting, ethical conduct, regulatory compliance, conflicts of interest’s review and reporting of concerns.
State-of-the-art Enterprise Resource Planning, supplier relations management and customer relations management connect the Company’s different locations, dealers and vendors for efficient and seamless information exchange. The Company also maintains a comprehensive information security policy and undertakes continuous upgrades to its IT systems;
Detailed business plans for each segment, investment
strategies, year-on-year reviews, annual financial and operating plans and monthly monitoring are part of the established practices for all operating and service functions;
A well-established, independent, multi-disciplinary Internal Audit team operates in line with governance best practices. It reviews and reports to management and the Audit Committee about compliance with internal controls and the efficiency and effectiveness of operations as well as the key process risks. The scope and authority of the Internal Audit division is derived from the Internal Audit Charter, duly approved by the Audit Committee; and Anti-fraud programmes including whistle blower mechanisms are operative across the Company.
The Board takes responsibility for the overall process of risk management throughout the organization. Through an Enterprise Risk Management programme, the Company’s business units and corporate functions address risks through an institutionalized approach aligned to the Company’s objectives. This is facilitated by internal audit. The Business risk is managed through cross-functional involvement and communication across businesses. The results of the risk assessment are presented to the senior management. The Risk Management Committee reviews business risk areas covering operational, financial, strategic and regulatory risks.
During Fiscal 2017, the Company conducted an assessment of the effectiveness of the Internal Control over Financial Reporting and has determined that the Company’s Internal Control over Financial Reporting as at March 31, 2017 is effective.
HUMAN RESOURCES / INDUSTRIAL RELATIONS
The Company considers its human capital a critical factor to its success. Under the aegis of Tata Sons and the Tata Sons promoted entities, the Company has drawn up a comprehensive human resource strategy, which addresses key aspects of human resource development such as:
The code of conduct and fair business practices;
A fair and objective performance management system linked to the performance of the businesses which identifies and differentiates employees by performance level;
Creation of a common pool of talented managers across Tata Sons and the Tata Sons promoted entities with a view to increasing their mobility through job rotation among the entities;
Evolution of performance based compensation packages to

Corporate Overview Financial StatementsStatutory Reports
168 72nd Annual Report 2016-17
attract and retain talent within Tata Sons and the Tata Sons promoted entities; and
Development and delivery of comprehensive training programs to impact and improve industry- and/or function-specific skills as well as managerial competence.
In line with the Company human resource strategy, it has implemented various initiatives in order to build better organizational capabilities that the Company believe will enable it to sustain competitiveness in the global marketplace. The Company’s focus is to attract talent, retain the better and advance the best. Some of the initiatives to meet this objective include:
Development of an agile organization through process modification, delayering and structure alignment and increase in customer facing roles;
Changed organization structure has empowered teams, across each product lines, which will manage the product lifecycle and be accountable for the Profit and Loss;
Extensive process mapping exercises to benchmark and align the human resource processes with global best practices;
Outsource transactional activities to an in house back office (Global Delivery Center), thereby reducing cost and time of transaction;
Talent management process redesigned with a stronger emphasis on identifying future leaders;
Build strategic partnerships with educational institutions of repute to foster academia based research and provide avenues for employees to further their educational studies;
Enhance company’s image and desirability amongst the target engineering and management schools, to enable it to attract the best;
Functional academies setup for functional skills development; and
Skill development of all Blue collared workforce to enable them to effectively meet the productivity and quality deliverables.
The Company employed approximately 80,389 and 76,598 permanent employees as at March 31, 2017 and 2016, respectively. The average number of flexible (temporary, trainee and contractual) employees for Fiscal 2017, was approximately 38,692 (including joint operations) compared to 40,205 in Fiscal 2016.
The following table set forth a breakdown of persons employed by the Company’s business segments and by geographic location as at March 31, 2017 and 2016.
As at March 31,2017 2016
Segment No. of EmployeesAutomotive 71,428 68,089Other 8,130 8,509Total 79,558 76,598Location No. of EmployeesIndia 42,991 42,238Abroad 36,567 34,360Total 79,558 76,598
Training and Development The Company has committed to the development of its employees to strengthen their functional and leadership capabilities. The Company have a focused approach with the objective of addressing all capability gaps and preparing its employees to adopt to fast changing external environment in order to meet its strategic objectives.
To achieve this, the Company has established the Tata Motors Academy, which addresses development needs of various segments of its workforce through a structured approach. The Tata Motors Academy focuses on three functional pillars – customer excellence, product leadership, and operational excellence – and one pillar on management education, all of which are aligned with the Company-level strategic objectives. The emphasis of functional academies is to strengthen knowledge, skills and expertise with an in depth approach, and the emphasis of management education is developing general management skills.
In addition to the Tata Motors Academy, the Company’s Learning Advisory Council, which includes senior leaders from different parts of organization, aims to more closely align its learning and development efforts with its business needs and priorities. The Learning Advisory Council is responsible for designing, implementing and reviewing the learning agenda.
The Company is now migrating from a trade-based training approach to a process-based training approach, which emphasizes team members’ knowledge as related to their actual work, in addition to the general trade-based skills, which are learned at training institutes. These skills are very specific and not currently taught at the training institutes. To accomplish this, the Company is implementing a fundamental skills training initiative throughout organization. Its objective is to address key employee performance issues, such as inconsistent quality, poor craftsmanship, high

Notice Board’s Report Corporate Governance Report Business Responsibility ReportManagement Discussion & Analysis
(118-165)
169
frequencies of repair reworking and low productivity levels through training of front-line team members.
Union Wage Settlements The Company has labour unions for operative grade employees at all its plant across India, except Dharwad plant. The labour union at Sanand plant has recently been registered and the first settlement is yet to be done. The Company has generally enjoyed cordial relations with its employees at its factories and offices and have received union support in the implementation of reforms that impact safety, quality, cost erosion and productivity improvements across all locations.
Employee wages are paid in accordance with wage agreements that have varying terms (typically three to four years) at different locations. The expiration dates of the wage agreements with respect to various locations/subsidiaries are as follows:
Location/subsidiariesWage Agreement valid
untilPune commercial vehicles August 31, 2019Pune passenger vehicles March 31, 2016#
Jamshedpur March 31, 2016#
Mumbai December 31, 2015#
Lucknow March 31, 2017#
Pantnagar March 31, 2019Jaguar Land Rover October 31, 2017
# Under negotiation
An amicable settlement has been arrived at the Pantnagar plant in May 2016 and in Pune CVBU Plant in March 2017. Negotiations are underway for new wage agreements at locations where it has expired. In the interim, the wages set forth in the previous wage agreements will continue until a new settlement is reached.
The Company’s wage agreements link an employee’s compensation to certain performance criteria that are based on various factors such as quality, productivity, operating profit and an individual’s performance and attendance. The Company has generally received union support in its implementation of reforms that impact quality, cost erosion and productivity improvements across all locations.
OUTLOOK
The Company expects to take advantage of being an established automaker and reap benefits from the expected growth of GDP and also form the proposed increase in automobile sector impact in GDP. Also, increase impact in global market is expected with increase of Indian automobile sector’s global market size. The Company is preparing to align with National Electric Mobility Mission 2017 and
also with Automobile Mission 2017, in BS5 and BS6 standards.
With government providing financing infrastructure in rural areas, the Company plans to take better advantage of this opportunity. Also, improvements in highway infrastructure will benefit the Company’s subsidiaries like TATA Hitachi.
The Company is prepared with BSIV standard infrastructure and plans to proactively work for BSV and BSVI standards to be applicable in 2019 and 2023, respectively.
The Company is preparing itself to be efficient in not only BSIV, BSV and BSVI, but also plans to take a holistic approach towards environment regulations and stay ahead in Industry. The emergence of diverging markets and mis-alignment in production and supply at global level, will be strategically dealt with the help of wide network of subsidiaries and Joint ventures. The emergence of digital platforms for purchasing the Automobiles gives an opportunity to venture into an unexplored sector.
Continued investment, by Jaguar Land Rover, in new products and technologies as well as expanding its production capacity in appropriate strategic locations, while balancing production with sales, is key for the success of the Company.
CAUTIONARY STATEMENT
Statements in the Management Discussion and Analysis describing the Company’s objective, projections, estimates and expectations may be “forward-looking statements” within the meaning of applicable securities laws and regulations. Actual results could differ materially from those expressed or implied. Important factors that could make a difference to the Company operations include, among others, economic conditions affecting demand/supply and price conditions in the domestic and overseas markets in which the Company operates, changes in government regulations, tax laws and other statutes and incidental factors.

COMPANY’S PHILOSOPHY ON CORPORATE GOVERNANCEAs a Tata Company, the Company’s philosophy on Corporate Governance is founded upon a rich legacy of fair, ethical and transparent governance practices, many of which were in place even before they were mandated by adopting the highest standards of professionalism, honesty, integrity and ethical behavior. As a global organization, the Corporate Governance practices followed by the Company and its subsidiaries are compatible with international standards and best practices. Through the Governance mechanism in the Company, the Board along with its Committees undertakes its fiduciary responsibilities to all its stakeholders by ensuring transparency, fairplay and independence in its decision making.
The Corporate Governance philosophy is further strengthened with the adherence to the Tata Business Excellence Model as a means to drive excellence and the Balanced Scorecard methodology for tracking progress on long term strategic objectives. The Tata Code of Conduct, which articulates the values, ethics and business principles, serves as a guide to the Company, its directors and employees is supplemented with an appropriate mechanism to report any concern pertaining to non-adherence to the said Code. The Company is in full compliance with the requirements of Corporate Governance under the Securities and Exchange Board of India (Listing Obligations and Disclosure Requirements) Regulations, 2015 (“SEBI Listing Regulations”). The Company’s Depositary Programme is listed on the New York Stock Exchange and the Company also complies with US regulations as applicable to Foreign Private Issuers (non-US companies listed on US Exchange) which cast upon the Board of Directors and the Audit Committee, onerous responsibilities to improve the Company’s operating efficiencies. Risk management and the internal control process focus areas, continue to meet the progressive governance standards.
The Company has adopted Governance Guidelines on Board Effectiveness based on current and emerging best practices from both within and outside the Tata Group of companies.
BOARD OF DIRECTORS The Board of Directors along with its Committees provide leadership and guidance to the Company’s management as also direct, supervise and control the performance of the Company. The Board currently comprises of 10 Directors out of which 7 Directors (70%) are Non-Executive Directors. As at March 31, 2017 the Company has a Non-Executive Chairman and 4 Independent Directors consequent to the retirement of Mr Subodh Bhargava, an Independent Director on March 29, 2017. The Company appointed Mr Om Prakash Bhatt on May 9, 2017 and presently the Independent Directors comprise more than half of the total strength of the Board. All the Independent Directors have confirmed that they meet the ‘independence’ criteria as mentioned under Regulation 16(1)(b) of the SEBI Listing
Regulations and Section 149 of the Companies Act, 2013 (“Act”).
All the Directors have made necessary disclosures regarding their directorships as required under Section 184 of the Act and on the Committee positions held by them in other companies. None of the Directors on the Company’s Board hold the office of Director in more than 20 companies, including 10 public companies and none of the Directors of the Company are related to each other. In accordance with Regulation 26 of the SEBI Listing Regulations none of the Directors are members in more than 10 committees or act as chairperson of more than 5 committees [the committees being, Audit Committee and Stakeholders’ Relationship Committee] across all listed entities in which he/she is a Director. All Non-Executive, Non Independent Directors, are liable to retire by rotation. The appointment of the Managing Director and Executive Directors, including the tenure and terms of remuneration are also approved by the members at the first meeting after the said appointment.
The required information, including information as enumerated in Regulation 17(7) read together with Part A of Schedule II of the SEBI Listing Regulations is made available to the Board of Directors, for discussions and consideration at Board Meetings. The Board reviews the declaration made by the CEO & Managing Director and the Group Chief Financial Officer (“CFO”) regarding compliance with all applicable laws on a quarterly basis, as also steps taken to remediate instances of non-compliance, if any.
Pursuant to Regulation 27(2) of the SEBI Listing Regulations, the Company also submits a quarterly compliance report on Corporate Governance to the Indian Stock Exchanges including details on all material transactions with related parties, within 15 days from the close of every quarter. The CEO & Managing Director and the CFO have certified to the Board on inter alia, the accuracy of the financial statements and adequacy of internal controls for financial reporting, in accordance with Regulation 17(8) read together with Part B of Schedule II of the SEBI Listing Regulations, pertaining to CEO and CFO certification for the Financial Year ended March 31, 2017. During the year under review, 10 Board Meetings were held on May 30, 2016, August 6, 2016, August 26, 2016, October 5, 2016, November 14, 2016 November 23, 2016, December 12, 2016, January 24, 2017, February 14, 2017 and March 30, 2017. The maximum time-gap between any two consecutive meetings did not exceed 120 days. All the agenda papers for the Board and Committee meetings are disseminated electronically on a real-time basis, by uploading them on a secured online application, specifically designed for this purpose, thereby eliminating circulation of printed agenda papers. The composition of the Board, attendance at Board Meetings held during the Financial Year under review and at the last Annual General Meeting (AGM), number of directorships (including Tata Motors), memberships/chairmanships of the Board and Committees of public companies and their shareholding as at March 31, 2017 in the Company are as follows:
REPORT ON CORPORATE GOVERNANCE
Corporate Overview Financial StatementsStatutory Reports
170 72nd Annual Report 2016-17

Name of the Director
DirectorIdenti-fication Number
Director Category
No. of Board
Meetingsattended
in the year
Attend-ance(%)
Attend-ance
at thelast
AGM
Directorships(1) Committee positions(2)
Holding in shares
and other convertible instruments
Chairman Member Chairman Member
Mr Cyrus Mistry (3) (4) 00010178 Non-Executive, Chairman
7 100 Yes 10 - - - 15,855 OrdinaryShares
Mr Natarajan Chandrasekaran (5)
00121863 Non-Executive, Chairman
3 100 NA 6 - - - -
Mr Nusli Wadia (4) (6) 00015731 Non-Executive, Independent
6 86 Yes 4 4 - - 1,000 OrdinaryShares
Dr R A Mashelkar 00074119 Non-Executive, Independent
9 90 Yes - 6 1 3 -
Mr S Bhargava (7) 00035672 Non-Executive, Independent
9 100 Yes 3 5 1 4 -
Mr N Munjee 00010180 Non-Executive, Independent
9(8) 90 Yes 2 8 5 1 -
Mr V K Jairath 00391684 Non-Executive, Independent
10 100 Yes - 7 3 5 -
Ms Falguni Nayar 00003633 Non-Executive, Independent
9 90 Yes - 9 1 5 -
Mr Om Prakash Bhatt (9) 00548091 Non-Executive, Independent
NA NA NA - 4 2 3 -
Dr Ralf Speth 03318908 Non-Executive 10 100 Yes - 2 - - -
Mr Guenter Butschek 07427375 CEO and Managing Director
9(8) 90 Yes - 1 - 1 -
Mr Ravindra Pisharody 01875848 Executive Director (Commercial
Vehicles)
10 100 Yes - 5 - 2 -
Mr Satish B Borwankar 01793948 Executive Director(Quality)
10 100 Yes 1 2 - 1 500 OrdinaryShares
(1) Excludes Directorships in private companies, foreign companies, Section 8 companies and alternate directorships.(2) Includes only Audit and Stakeholders’ Relationship Committees. (3) Resigned as the Non-Executive Chairman and Director of the Company with effect from December 19, 2016.(4) Number of Directorships, Committee positions and shareholding details are as on the date of cessation as director.(5) Appointed as an Additional Director and Non-Executive Chairman of the Company with effect from January 17, 2017.(6) Removed as an Independent Director by the Shareholders at the Extraordinary General Meeting of the Company held on December 22, 2016.(7) Retired on March 29, 2017, upon attaining the age of 75 years in accordance with the Company’s Governance Guidelines on Board Effectiveness.(8) Excludes 1 meeting attended via audio conference facility.( 9) Appointed as a Non-Executive Independent Director of the Company with effect from May 9, 2017 and disclosures above are as on date.
The Company actively uses the facility of video conferencing permitted under Section 173(2) of the Act read together with Rule 3 of the Companies (Meetings of Board and its Powers) Rules, 2014, thereby saving resources – cost to the Company and valued time of the Directors.
Independent Directors’ Meeting: As per Regulation 25(1) of the SEBI Listing Regulations, none of the Independent Directors serves as Independent Directors in more than 7 listed entities and in case of whole-time directors in any listed entity, then they do not serve as Independent Directors in more than 3 listed entities. During the year 3 Meetings of Independent Directors were held on November 14, 2016, December 12, 2016 and March 30, 2017, the attendance
whereat is as follows:
Composition Meetings attended Attendance (%)Mr Nusli Wadia (1) 2 100Dr R A Mashelkar 2 67Mr Nasser Munjee 2 (2) 67Mr Subodh Bhargava (3) 2 100Mr Vinesh Kumar Jairath 3 100Ms Falguni Nayar 3 100
(1) Removed as Independent Director by the Shareholders at the Extraordinary General Meeting of the Company held on December 22, 2016.
(2) Excludes 1 meeting attended via audio conference facility.(3) Retired in accordance with the Company’s Governance Guidelines on Board
Effectiveness on March 29, 2017, upon attaining the age of 75 years.
Notice Board’s Report Management Discussion & Analysis Corporate Governance Report Business Responsibility Report
171

An Independent Directors meeting in accordance with the provisions of Section 149(8) read with Schedule IV of the Act and Regulation 25(3) and 25(4) of the SEBI Listing Regulations was convened on March 30, 2017, to review the performance of the Non-Independent Non-Executive Directors including the Chairman of the Board and performance of the Board as a whole.
Board Effectiveness Evaluation: Pursuant to provisions of Regulation 17(10) of the SEBI Listing Regulations and the provisions of the Act, Board evaluation involving evaluation of the Board of Directors, its Committees and individual Directors, including the role of the Board Chairman, was conducted during the year. For details pertaining to the same kindly refer to the Board’s Report.
Familiarisation Programme: Kindly refer to the Company’s website for details of the familiarisation programme for Independent Directors on their roles, rights, responsibilities in the Company, nature
of the industry in which the Company operates, business model of the Company and related matters.
COMMITTEES OF THE BOARD The Board has constituted a set of Committees with specific terms of reference/scope to focus effectively on the issues and ensure expedient resolution of diverse matters. The Committees operate as empowered agents of the Board as per their Charter/terms of reference. Targets set / actions directed by them as agreed with the management are reviewed periodically and mid-course corrections are also carried out. The Board of Directors and the Committees also take decisions by circular resolutions which are noted at the next meeting. The minutes of the meetings of all Committees of the Board are placed before the Board for discussions/noting. An Organisation Chart depicting the relationship between the Board of Directors, the Committees and the senior management functions as at March 31, 2017 is illustrated below:
SHAREHOLDERS
CEO & MANAGING DIRECTOR (MD)
BOARD COMMITTEESEXECUTIVE COMMITTEE - ExCom#
BUSINESS COMMITTEESCV & PV Business Unit Steering
Committee#CV & PV Product Review
CommitteeInvestment Review Committee#
Risk Oversight CommitteeSourcing Council#
IT Governance Committee
Commercial Vehicles (ED)Quality (ED)
Passenger VehiclesCTO (Chief Technology Officer)Group Chief Financial Officer
Chief Human Resource OfficerChief Purchasing Officer
Corporate Strategy and Business Transformation
Corporate Communications**
Audit CommitteeExecutive Committee of the Board
Nomination & Remuneration Committee
Stakeholders’ Relationship Committee
Safety, Health & Environment Committee
Corporate Social Responsibility Committee
Risk Management CommitteeSpecial Need Based Committees
OTHER DIRECT REPORTS TO MD
** associated member of ExCom*The CEO & MD chairs the ExCom
# Business Committees are chaired by related ExCom member where indicated, otherwise by the CEO & MD
Chief Internal AuditorCompany SecretaryGovernment Affairs
Corporate LegalChief Information Officer
BOARD OF DIRECTORS
Corporate Overview Financial StatementsStatutory Reports
172 72nd Annual Report 2016-17

AUDIT COMMITTEE The Audit Committee functions according to its Charter that defines its composition, authority, responsibility and reporting functions in accordance with Section 177 of the Act, Regulation 18(3) read with Part C of Schedule II of the SEBI Listing Regulations and US regulations applicable to the Company and is reviewed from time to time. Whilst, the full Charter is available on the Company’s website, given below is a gist of the responsibilities of the Audit Committee:
i. Reviewing with the management, quarterly/annual financial statements before submission to the Board, focusing primarily on:
Overseeing the Company’s financial reporting process and the disclosure of its financial information, including earnings, press release, to ensure that the financial statements are correct, sufficient and credible;
Review Reports on the Management Discussion and Analysis of financial condition, results of Operations and the Directors’ Responsibility Statement;
Compliance with accounting standards and changes in accounting policies and practices as well as reasons thereof;
Major accounting entries involving estimates based on exercise of judgment by Management;
Draft Audit Report, qualifications, if any and significant adjustments arising out of audit;
Analysis of the effects of alternative GAAP methods on the financial statements;
Compliance with listing and other legal requirements concerning financial statements;
Scrutinise inter corporate loans and investments; and
Disclosures made under the CEO and CFO certification and related party transactions to the Board and Shareholders.
ii. Reviewing with the management, external auditor and internal auditor, adequacy of internal control systems and recommending improvements to the management.
iii. Review Management letters/Letters of internal control weakness issued by the statutory auditors.
iv. Reviewing, with the management, the statement of uses/application of funds raised through an issue (public issue, rights issue, preferential issue, etc.), the statement of funds utilized for purposes other than those stated in the offer document/
prospectus/ notice and the report submitted by the monitoring agency monitoring the utilisation of proceeds of a public or rights issue, statement of deviations both quarterly and annual, if any, and making appropriate recommendations to the Board to take up steps in this matter.
v. Recommending the appointment/removal of the statutory auditor, cost auditor, fixing audit fees, name of Audit firm and approving non-audit/consulting services provided by the statutory auditors’ firms to the Company and its subsidiaries; evaluating auditors’ performance, qualifications, experience, independence and pending proceedings relating to professional misconduct, if any. It shall also ensure that the cost auditors are independent, have arm’s length relationship and are also not otherwise disqualified at the time of their appointment or during their tenure.
vi. Reviewing the adequacy of internal audit function, including the structure of the internal audit department, staffing and seniority of the chief internal auditor, coverage and frequency of internal audit, appointment, removal, performance and terms of remuneration of the chief internal auditor.
vii. Discussing with the internal auditor and senior management, significant internal audit findings and follow-up thereon.
viii. Reviewing the findings of any internal investigation by the internal auditor into matters involving suspected fraud or irregularity or a failure of internal control systems of a material nature and report the matter to the Board.
ix. Discussing with the statutory auditor before the audit commences, the nature and scope of audit, as well as conduct post-audit discussions to ascertain any area of concern.
x. Reviewing the Company’s financial controls and risk management systems.
xi. Establish and review the functioning of the Vigil Mechanism under the Whistle-Blower policy of the Company.
xii. Reviewing the financial statements and investments made by subsidiary companies and subsidiary oversight relating to areas such as adequacy of the internal audit structure and function of the subsidiaries, their status of audit plan and its execution, key internal audit observations, risk management and the control environment.
xiii. Look into the reasons for any substantial defaults in payment to the depositors, debenture holders, shareholders (in case of non-payment of declared dividend) and creditors, if any.
xiv. Reviewing the effectiveness of the system for monitoring compliance with laws and regulations.
Notice Board’s Report Management Discussion & Analysis Corporate Governance Report Business Responsibility Report
173

xv. Approving the appointment of CFO after assessing the qualification, experience and background etc. of the candidate.
xvi. Engage a registered valuer in case valuations are required in respect of any property, stocks, shares, debentures, securities, goodwill, undertaking or assets, liabilities or net worth of the Company.
xvii. Review and suitably reply to the report(s) forwarded by the auditors on the matters where auditors have sufficient reason to believe that an offence involving fraud, is being or has been committed against the Company by officers or employees of the Company.
xviii. Review the system of storage, retrieval, display or printout of books of accounts maintained in electronic mode during the required period under law.
xix. Approve all or any subsequent modification of transactions with related parties.
xx. To approve policies in relation to the implementation of the Tata Code of Conduct for Prevention of Insider Trading and Code of Corporate Disclosure Practices (‘Code’) and to supervise implementation of the Code.
xxi. To note and take on record the status reports, detailing the dealings by Designated Persons in Securities of the Company, as submitted by the Compliance Officer on a quarterly basis and to provide directions on any penal action to be initiated, in case of any violation of the Code, by any person.
During the year, the Committee reviewed key audit findings covering operational, financial and compliance areas. It also reviewed the internal control system in subsidiary companies, status on compliance of its obligations under the Charter and confirmed that it fulfilled its duties and responsibilities. The Committee, through self-assessment, annually evaluates its performance. The Chairman of the Audit Committee briefs the Board members about significant discussions at Audit Committee meetings.
The Committee comprises of 4 Independent Directors, all of whom are financially literate and have relevant finance and/or audit exposure. Mr Munjee is the Financial Expert. The quorum of the Committee is two members or one-third of its members, whichever is higher. The Chairman of the Audit Committee also attended the last Annual General Meeting of the Company. During the period under review, 10 Audit Committee meetings were held on April 4, 2016, May 27, 2016, July 8, 2016, August 11, 2016, August 24, 2016, October 4, 2016, November 11, 2016, January 12-13, 2017, February 13, 2017 and March 30, 2017. The maximum gap between any two meetings was less than 120 days. Each Audit Committee meeting which considers financial results is preceded by a meeting of the
Audit Committee members along with the Auditors only.
The composition of the Audit Committee and attendance at its meetings is as follows:
Composition Meetings attended Attendance (%)Mr N Munjee (Chairman) 10 100Dr R A Mashelkar 9 90Mr V K Jairath 10 100Ms Falguni Nayar 9 90
The Committee meetings are held at the Company’s Corporate Headquarters or at its plant locations and are attended by the CEO & Managing Director, Executive Directors, CFO, Company Secretary, Chief Internal Auditor, Statutory Auditors and Cost Auditors on need based basis. The Business and Operation Heads are invited to the meetings, as and when required. The Company Secretary acts as the Secretary of the Audit Committee, as well as all the other Committees of the Company. The Chief Internal Auditor reports directly to the Audit Committee to ensure independence of the Internal Audit function.
The Committee relies on the expertise and knowledge of the management, the internal auditors and the Statutory Auditor, in carrying out its oversight responsibilities. It also uses external expertise, if required. The management is responsible for the preparation, presentation and integrity of the Company’s financial statements including consolidated statements, accounting and financial reporting principles. The management is also responsible for internal control over financial reporting and all procedures are designed to ensure compliance with accounting standards, applicable laws and regulations as well as for objectively reviewing and evaluating the adequacy, effectiveness and quality of the Company’s system of internal controls.
Deloitte Haskins & Sells LLP, Mumbai (ICAI Firm Registration No.117366W/W – 100018), the Company’s Statutory Auditor, is responsible for performing an independent audit of the Financial Statements and expressing an opinion on the conformity of those financial statements with accounting principles generally accepted in India.
NOMINATION AND REMUNERATION COMMITTEE The Nomination and Remuneration Committee (NRC) of the Company functions according to its Charter, that defines its objective, composition, meeting requirements, authority and power, responsibilities, reporting and evaluation functions in accordance with Section 178 of the Act and SEBI Listing Regulations, which are reviewed from time to time. The broad terms of reference of the NRC are as follows:
Corporate Overview Financial StatementsStatutory Reports
174 72nd Annual Report 2016-17

Recommend to the Board the set up and composition of the Board and its Committees including the “formulation of the criteria for determining qualifications, positive attributes and independence of a director”. The Committee periodically reviews the composition of the Board with the objective of achieving an optimum balance of size, skills, independence, knowledge, age, gender and experience.
Devise a policy on Board diversity.
Recommend to the Board the appointment or reappointment of Directors, including Independent Directors, on the basis of Report on performance evaluation of Independent Directors.
Support the board in matters related to set-up, review and refresh of the Committees.
Recommend to the Board on voting on resolutions for appointment and remuneration of Directors on the Boards of its material subsidiary companies and provide guidelines for remuneration of Directors on material subsidiaries.
Identify and recommend to the Board appointment of Key Managerial Personnel (“KMP” as defined by the Act) and executive team members of the Company (as defined by this Committee). The Committee shall consult the Audit Committee before recommending the appointment of the CFO.
Carry out evaluation of every Director’s performance and support the Board, its Committees and individual Directors, including “formulation of criteria for evaluation of Independent Directors and the Board”.
Oversee the performance review process for the KMP and executive team of the Company with a view that there is an appropriate cascading of goals and targets across the Company and on an annual basis, recommend to the Board the remuneration payable to the Directors, KMP and executive team of the Company.
Recommend the Remuneration Policy for Directors, KMP, executive team and other employees.
Review matters related to voluntary retirement and early separation schemes for the Company.
Oversee familiarization programmes for Directors.
Oversee HR philosophy, HR and people strategy and efficacy of HR practices including those for leadership development, rewards and recognition, talent management and succession planning (specifically for the Board, KMP and executive team).
Performing such other duties and responsibilities as may be consistent with the provisions of the Committee Charter.
The Committee presently comprises of 3 Independent Directors and 1 Non-Executive Director. During the year under review, four meetings of the Committee were held on May 30, 2016, August 12, 2016, November 14, 2016 and March 30, 2017. The Board also inducted Mr O P Bhatt, Inependent Director as a Member of the NRC with effect from May 16, 2017. The decisions are taken by the Committee, at meetings or by passing circular resolutions. The composition of the Nomination and Remuneration Committee and attendance at its meeting is as follows:.
Composition Meetings attended Attendance (%)Mr Nusli Wadia (1) 3 100Mr Cyrus Mistry (2) 3 100Mr N Chandrasekaran (3) 1 100Mr S Bhargava (4) 3 100Dr R A Mashelkar 3 75Mr N Munjee (5) 1 100
1. Removed as Independent Director by the Shareholders at the Extraordinary General Meeting of the Company held on December 22, 2016.
2. Resigned as the Non-Executive Chairman and Director of the Company with effect from December 19, 2016.
3. Appointed as an Additional Director and Non-Executive Chairman of the Company with effect from January 17, 2017.
4. Retired in accordance with the Company’s Governance Guidelines on Board Effectiveness on March 29, 2017, upon attaining the age of 75 years.
5. Appointed as a Member with effect from March 29, 2017.
Remuneration Policy The Company has in place a Remuneration Policy for Directors, KMP and other employees, in accordance with the provisions of the Act and the SEBI Listing Regulations. For details on Remuneration Policy for Directors, KMP and other employees, kindly refer to Annexure 4 of the Board’s Report.
Remuneration of DirectorsNon-Executive Directors
A sitting fee of `60,000/- for attendance at each meeting of the Board, Audit Committee, Executive Committee of the Board, NRC and for Independent Directors Meeting; and `20,000/- for attendance at each meeting of Stakeholders’ Relationship Committee, Safety, Health & Environment Committee, the Corporate Social Responsibility Committee, Risk Management Committee, Fund Raising Committee and other special need based committees, is paid to its Members (excluding Managing Director and Executive Directors) and also to Directors attending by invitation. The sitting fees paid/payable to the Non Whole-time Directors is excluded whilst calculating the limits of remuneration in accordance with Section 197 of the Act. The Company also reimburses out-of-pocket expenses to Directors attending meetings held at a city other than the one in which the Directors reside.
Notice Board’s Report Management Discussion & Analysis Corporate Governance Report Business Responsibility Report
175

The remuneration by way of commission to the Non-Executive Directors is decided by the Board of Directors and distributed to them based on their participation and contribution at the Board and certain Committee meetings as well as time spent on matters other than at meetings. The Members had, at the Annual General Meeting held on August 21, 2013, approved the payment of remuneration by way of commission to the Non Whole-time Directors of the Company, of a sum not exceeding 1% per annum of the net profits of the Company, calculated in accordance with the provisions of the Act for a period of 5 years commencing April 1, 2013, respectively.
No Commission was paid to any Non-Executive Director for FY 2016-17 in view of inadequacy of profits.
The performance evaluation criteria for Non-Executive Directors, including Independent Directors, is determined by the NRC. An indicative list of factors that were evaluated include participation and contribution by a director, commitment, effective deployment of knowledge and expertise, effective management of relationship with stakeholders, integrity and maintenance of confidentiality and independence of behaviour and judgement.
Given below are the Sitting Fees paid/ payable by the Company to Non-Executive Directors during FY 2016-17:
` in lakhs
Name Sitting FeesMr Cyrus Mistry (1) 6.60Mr N Chandrasekaran (2) 2.40Mr N N Wadia (3) 6.60Dr R A Mashelkar 15.60Mr N Munjee 14.40Mr S Bhargava (4) 9.00Mr V K Jairath 15.80Ms Falguni Nayar 14.40Dr Ralf Speth (5) -Total 84.80
(1) Resigned as the Non-Executive Chairman and Director of the Company with effect from December 19, 2016.
(2) Appointed as an Additional Director and Non-Executive Chairman of the Company with effect from January 17, 2017.
(3) Removed as an Independent Director by the Shareholders at the Extraordinary General Meeting of the Company on December 22, 2016
(4) Retired in accordance with the Company’s Governance Guidelines on Board Effectiveness upon attaining 75 years of age on March 29, 2017.
(5) Dr Ralf Speth is a Non-Executive Director and is not paid any commission or sitting fees for attending Board meetings of the Company in view of his appointment as Chief Executive Officer and Director of Jaguar Land Rover Automotive PLC.
Some of the aforementioned Directors are also on the Board of the Company’s subsidiaries and associates, in a non-executive capacity and are paid remuneration and sitting fees
for participating in their meetings. Other than the above, the Non-Executive Directors have no pecuniary relationship or transactions with the Company, its subsidiaries and associates.
Managing and Executive DirectorsThe remuneration paid to the CEO & Managing Director and the Executive Directors commensurates with industry standards and Board level positions held in similar sized companies, taking into consideration the individual responsibilities shouldered by them and is in consonance with the terms of appointment approved by the Members, at the time of their appointment.
The NRC, reviews and recommends to the Board the changes in the managerial remuneration, generally being increment in basic salary and commission/incentive remuneration of the Managing and Executive Directors on a yearly basis. This review is based on the Balance Score Card that includes the performance of the Company and the individual director on certain defined qualitative and quantitative parameters such as volumes, EBITDA, cashflows, cost reduction initiatives, safety, strategic initiatives and special projects as decided by the Board vis-a-vis targets set in the beginning of the year. This review also takes into consideration the benchmark study undertaken by reputed independent agencies on comparative industry remuneration and practices.
The variable portion of the CEO & Managing Directors remuneration comprises of incentive remuneration in the form of performance linked bonus and long-term incentive. The target performance linked bonus would be €550,000 per annum upto a maximum of €825,000 per annum. With the objective of achieving long-term value creation, through retention and continuity in leadership, a long term incentive plan is provided, with a value intended target of €550,000 per annum upto a maximum of €825,000 per annum. For the period from the date of joining upto March 31, 2017, the amount for the performance linked bonus and long-term incentive will be the target annual performance amount of €550,000 for each of the aforesaid 2 components, prorated for the actual period worked.
The variable portion of the Executive Directors remuneration comprises a profit-linked commission and/or merit based incentive remuneration. The profit-linked commission is awarded at the discretion of the NRC and the Board of Directors, based on the net profits of the Company for that financial year, subject to the overall ceiling limits stipulated in Section 197 of the Act, but in any case not exceeding 400% of the basic salary. In case the Net Profits of the Company are inadequate for payment of profit-linked commission in any financial year, an incentive remuneration, not exceeding 200% of the basic salary, may be paid at the discretion of the Board.
Given below are details pertaining to certain terms of appointment and payment of Managerial Remuneration to the CEO & Managing Director and Executive Directors for FY 2016-17:
Corporate Overview Financial StatementsStatutory Reports
176 72nd Annual Report 2016-17

` in lakhs
Particulars Mr Guenter Butschek Mr Ravindra Pisharody Mr Satish BorwankarCEO & Managing Director Executive Director
(Commercial Vehicles)Executive Director (Quality)
Basic Salary 241.88 72.00 57.00 Benefits, Perquisites & Allowance 1,314.06(1) 70.51 82.27(2) Incentive Remuneration (3) 670.18 69.00 60.00 Retirement Benefits 29.03 19.44 15.39 Total Remuneration 2,255.15 230.95 214.66
Note: No Commission was paid to the Executive Directors for FY 2016-17 in view of inadequacy of profits.(1) Includes reimbursement of pension benefits of `149.53 lakhs.(2) Includes leave encashment (3) Incentive remuneration shall be paid to the Directors after the forthcoming Annual General Meeting of the Company.
Terms of Appointment
CEO & Managing Director (MD) Executive Directors
Severance Notice Period and Fees
- The Contract with the CEO & MD may be terminated earlier, without any cause by either giving to the other party six months’ notice of such termination or the Company paying six months’ remuneration which shall be limited to provision of basic salary, benefits, perquisites and allowances (including Living Allowance) and any pro-rated incentive remuneration, in lieu of such notice. Additionally, in case of termination initiated by the Company before the end of the term for the reasons other than Tata Code of Conduct (“TCoC”), the MD shall be entitled to severance pay for a period of 12 months or balance term of the agreement whichever is less and which shall be limited to provision of basic salary, living allowance and any pro-rated incentive remuneration.
- This appointment may not be terminated by the Company without notice or payment in lieu of notice except for reasons of breach of TCoC. In case of breach of TCoC, the CEO & MD shall not be entitled to Severance.
- In the event the CEO & MD is not in a position to discharge his official duties due to any physical or mental incapacity, he shall be entitled to receive notice pay and the severance as mentioned above and this contract shall stand terminated.
- This appointment may be terminated by either party by giving to the other party six months’ notice of such termination or the Company paying six months’ remuneration in lieu of the Notice.
- The employment of the Executive Director, may be terminated by the Company without notice or payment in lieu of notice:
• if the Executive Director, is found guilty of any gross negligence, default or misconduct in connection with or affecting the business of the Company or any subsidiary or associated company to which he is required by the Agreement to render services; or
• in the event of any serious repeated or continuing breach (after prior warning) or non-observance by the Executive Director, of any of the stipulations contained in the Agreement to be executed between the Company and the Executive Director; or
• in the event the Board expresses its loss of confidence in the Executive Director.
- In the event the Executive Director is not in a position to discharge his official duties due to any physical or mental incapacity, the Board shall be entitled to terminate his contract on such terms as the Board may consider appropriate in the circumstances.
The Company does not have an Employee Stock Option Scheme for any of its employees or directors.
Notice Board’s Report Management Discussion & Analysis Corporate Governance Report Business Responsibility Report
177

Retirement Policy for Directors The Company has adopted the Tata Group Governance Guidelines on Board Effectiveness, wherein the Managing and Executive Directors retire at the age of 65 years. The Executive Director, who have been retained on the Company’s Board beyond the age of 65 years as Non-Executive Directors for special reasons may continue as Directors at the discretion of the Board but in no case beyond the age of 70 years. The Company has also adopted a Policy for Managing and Executive Directors, which has also been approved by the Members of the Company, offering special retirement benefits, including pension, ex-gratia and medical. In addition to the above, the retiring Managing Director (except where he is an expat) is entitled to residential accommodation or compensation in lieu of accommodation on retirement. The quantum and payment of the said benefits are subject to an eligibility criteria of the retiring director and is payable at the discretion of the Board in each individual case on the recommendation of the NRC.
Section 149 of the Act provides that an Independent Director shall hold office for a term of upto 5 consecutive years on the Board of a Company and would not be liable to retire by rotation pursuant to Section 152 of the Act. An Independent Director would be eligible to be re-appointed for another 5 years on passing of a Special Resolution by the Company. However, no Independent Director shall hold office for more than 2 consecutive terms, but would be eligible for appointment after the expiration of 3 years of ceasing to become an Independent Director. Provided that, during the said period of 3 years, he/she is not appointed in or associated with the Company in any other capacity, either directly or indirectly. The retirement age for Independent Directors is 75 years as per the Governance Guidelines on Board Effectiveness. Accordingly, all Independent Directors have a tenure of 5 years each or upon attaining the retirement age of 75 years, whichever is earlier, as approved by the Members at the Annual General Meeting held on July 31, 2014.
STAKEHOLDERS’ RELATIONSHIP COMMITTEE The Stakeholders’ Relationship Committee functions in accordance with Section 178 of the Act and Regulation 20 read with Part D of Schedule II of the SEBI Listing Regulations. The Committee comprising of 2 Independent Directors and the CEO & Managing Director, is empowered to:
Review statutory compliances relating to all security holders.
Consider and resolve the grievances of security holders of the Company, including complaints related to transfer of securities, non-receipt of annual report/ declared dividends/ notices/ balance sheet.
Oversee compliances in respect of dividend payments and transfer of unclaimed amounts to the Investor Education and Protection Fund.
Oversee and review all matters related to the transfer of securities of the Company.
Approve issue of duplicate certificates of the Company.
Review movements in shareholding and ownership structures of the Company.
Ensure setting of proper controls and oversee performance of the Registrar and Share Transfer Agent.
Recommend measures for overall improvement of the quality of investor services.
During the year under review, 2 Committee meetings were held on August 9, 2016 and January 13, 2017. The composition of the Stakeholders’ Relationship Committee and attendance at its meetings is as follows:
Composition Meetings attended Attendance (%)Mr V K Jairath (Chairman) 2 100Ms Falguni Nayar - 0Mr Guenter Butschek 2 100
Compliance OfficerMr H K Sethna, Company Secretary, who is the Compliance Officer, can be contacted at: Tata Motors Limited, Bombay House, 24, Homi Mody Street, Mumbai - 400001, India.
Tel: 91 22 6665 8282, 91 22 6665 7824; Fax: 91 22 6665 7260; Email: [email protected].
Complaints or queries relating to the shares and/or debentures can be forwarded to the Company’s Registrar and Transfer Agents – M/s TSR Darashaw Limited at [email protected], whereas complaints or queries relating to the public fixed deposits can be forwarded to the Registrars to the Fixed Deposits Scheme – M/s TSR Darashaw Limited at [email protected].
Complaints or queries relating to the Rights Issue launched by the Company vide Letter of Offer dated March 30, 2015 of Ordinary and ‘A’ Ordinary Shares, can be forwarded to Link Intime India Private Limited, the Registrar to the Issue, for addressing any pre and post-Issue related queries / complaints including those relating to the Applications Supported by Blocked Amount (ASBA) process. Tel: (91 22) 6171 5400 / 9167779196 /97; Fax: (91 22) 2596 0329; Website: www.linkintime.co.in; Email: [email protected]; Contact Person: Mr Sachin Achar.
The status on the total number of investors’ complaints during FY 2016-17 is as follows:
Corporate Overview Financial StatementsStatutory Reports
178 72nd Annual Report 2016-17

pertaining to legal cases, acquisitions and divestment, new business forays and donations. During the year under review, 1 Committee meeting was held on September 16, 2016. The Executive Committee of Board presently comprises of 1 Independent Director, 1 Non-Executive Director and 3 Whole-time Directors. The composition of the Executive Committee of Board and attendance at its meetings is given hereunder:
Composition Meetings attended Attendance (%)Mr Cyrus Mistry (1) 1 100Mr N Chandrasekaran (Chariman) (2)
- NA
Mr N N Wadia (3) - 0Mr N Munjee - 0Mr S Bhargava (4) 1 100Mr R Pisharody 1 100Mr S B Borwankar 1 100Mr Guenter Butschek 1 100
1. Resigned as the Non-Executive Chairman and Director of the Company with effect from December 19, 2016.
2. Appointed as an Additional Director and Non-Executive Chairman of the Company with effect from January 17, 2017.
3. Removed as an Independent Director by the Shareholders at the Extraordinary General Meeting of the Company held on December 22, 2016. The meeting was attended via audio conference.
4. Retired in accordance with the Company’s Governance Guidelines on Board Effectiveness on March 29, 2017, upon attaining the age of 75 years.
The Safety, Health and Environment (SHE) Committee was constituted with the objective of reviewing Safety, Health and Environment practices. The terms of reference of the Committee include the following:
to take a holistic approach to safety, health and environmental matters in decision making;
to provide direction to Tata Motors Group in carrying out its safety, health and environment function;
to frame broad guidelines/policies with regard to safety, health and environment;
to oversee the implementation of these guidelines/policies; and
to review the policies, processes and systems periodically and recommend measures for improvement from time to time.
The Committee comprises of 2 Independent Directors including the Chairman of the Committee and 3 Whole-time Directors viz Dr R A Mashelkar (Chairman), Mr V K Jairath, Mr Ravindra Pisharody, Mr S B Borwankar and Mr Guenter Butschek. During the year under review, two meetings of the Committee were held on May 27, 2016 and October 4, 2016, wherein all the members were present at the said meetings.
Type Nos.Complaints regarding non-receipt of dividend, shares lodged for transfer
71
Complaints received from the shareholders through SEBI and other statutory bodies and resolved
49
Complaints redressed out of the above 112Pending complaints as on 31.03.2017 8*Other queries received from shareholders and replied 7,787
* The SEBI complaints have been replied to within 4 days but the same has been reflected as unresolved as at March 31, 2017, as per the condition for complete resolution defined by SEBI.
All letters received from the investors are replied to and the response time for attending to investors’ correspondence during FY 2016-17 is shown in the following table:
Number %Total number of correspondence received during FY 2016-17
7,907 100.00
Replied within 1 to 4 days of receipt 3,957 50.00Replied within 5 to 7 days of receipt 1,660 21.00Replied within 8 to 15 days of receipt 1,572 20.00Replied after 15 days of receipt (1) 642 8.00Received in last week of March 2017 have been replied in April 2017
76 1.00
(1) These correspondence pertained to court cases which involved retrieval of case files, cases involving retrieval of very old records, co-ordination with the Company/Advocates etc, partial documents awaited from the Investors, cases involving registration of legal documents, executed documents received for issue of duplicate certificates and transmission of shares without legal representation which involved checking of the documents, sending notices to Stock Exchange and issue of duplicate certificates/transmission of shares after approval from the Company. However, all these cases have been attended to within the statutory limit of 30 days.
There were no pending share transfers pertaining to the Financial Year ended March 31, 2017. Out of the total number of complaints mentioned above, 49 complaints pertained to letters received through Statutory/Regulatory bodies and those related to the Court/Consumer forum matters, fraudulent encashment and non-receipt of dividend.
On recommendations of the Stakeholders’ Relationship Committee, the Company has taken various investor friendly initiatives like organising Shareholders’ visit to Company’s Works at Pune, sending reminders to investors who have not claimed their dues, sending nomination forms etc.
OTHER COMMITTEES The Executive Committee of the Board reviews capital and revenue budgets, long-term business strategies and plans, the organizational structure of the Company, real estate and investment transactions, allotment of shares and/or debentures, borrowing and other routine matters. The Committee also discusses the matters
Notice Board’s Report Management Discussion & Analysis Corporate Governance Report Business Responsibility Report
179

Corporate Social Responsibility (CSR) Committee was constituted by the Board in accordance with the Act to:
(a) Formulate and recommend to the Board, a Corporate Social Responsibility Policy which shall indicate the activities to be undertaken by the Company as specified in Schedule VII of the Act;
(b) Recommend the amount of expenditure to be incurred on the activities referred to in clause (a); and
(c) Monitor the Corporate Social Responsibility Policy of the Company from time to time.
The CSR Policy is uploaded on the Company’s website as required under the provisions of Section 135 of the Act and Rule 9 of the Companies (Corporate Social Responsibility Policy) Rules, 2014.
The CSR committee comprises of 2 Independent Directors and 2 Whole-time Directors. During the year under review, 3 meetings of the Committee were held on May 27, 2016, October 4, 2016 and March 30, 2017.The composition of the CSR Committee and attendance at its meetings is given hereunder:
Composition Meetings attended Attendance (%)Dr R A Mashelkar (Chairman) 3 100Ms Falguni Nayar 3 100Mr S B Borwankar 3 100Mr Guenter Butschek 3 100
Risk Management Committee (RMC) is constituted and functions as per Regulation 21 of the SEBI Listing Regulations. The Committee comprises 4 Independent Directors namely, Mr Nasser Munjee, as Chairman, Dr Mashelkar, Mr V K Jairath and Ms Falguni Nayar as members. The terms of reference enumerated in the Committee Charter are as follows:
Principles and objectives inter alia include assisting the Board in overseeing the Company’s risk management process and controls, risk tolerance, capital liquidity and funding etc. and its periodic update to the Board.
Committee shall act and have powers in accordance with the terms of reference specified in writing by the Board and shall be responsible for reviewing the Company’s risk governance structure, assessment, practice, guidelines etc.
The Committee will report to the Board periodically on various matters and shall undergo an annual self-evaluation of its performance and report the results thereof to the Board.
During the year under review 5 meetings of the Committee were held on April 4, 2016, July 8, 2016, October 4, 2016, December 5, 2016
and January 12, 2017. The composition of the RMC and attendance at its meeting is given hereunder:
Composition Meetings attended Attendance (%)Mr N Munjee 5 100Dr R A Mashelkar 3 60Mr V K Jairath 5 100Ms Falguni Nayar 5 100
Apart from the above, the Board of Directors also constitutes Committee(s) of Directors and/or Executives with specific terms of reference, as it deems fit.
CODE OF CONDUCTWhilst the Tata Code of Conduct is applicable to all Whole-time Directors and employees of the Company, the Board has also adopted a Tata Code of Conduct for Non-Executive Directors and Independent Directors. Pursuant to Regulation 26(5) of the SEBI Listing Regulations, all members of senior management have confirmed that there are no material, financial and commercial transactions wherein they have a personal interest that may have a potential conflict with the interest of the Company at large. Pursuant to Regulation 26(3) of the SEBI Listing Regulations, all the Board members and senior management of the Company as on March 31, 2017 have affirmed compliance with their respective Codes of Conduct. A Declaration to this effect, duly signed by the CEO and Managing Director is annexed hereto.
GENERAL BODY MEETINGSAnnual General Meeting (AGM)Date of AGM
Year Special Resolutions passed Venue and Time
August 9, 2016
2015-2016
Appointment of Mr Guenter Butschek as the Chief Executive Officer and Managing Director
Re-appointment of Mr Ravindra Pisharody – Executive Director (Commercial Vehicles) and payment of remuneration
Re-appointment of Mr Satish Borwankar – Executive Director (Quality) and payment of remuneration
Offer or invite for Subscription of Non-Convertible Debentures on private placement basis
Birla Matushri Sabhagar, 19, Sir Vithaldas Thackersey
Marg, Mumbai - 400020 at 3:00 p.m.
August 13, 2015
2014-2015
Offer or invite for Subscription of Non-Convertible Debentures on private placement basis
July 31, 2014
2013-2014
Invitation and acceptance of Fixed Deposits from the Members and Public
Corporate Overview Financial StatementsStatutory Reports
180 72nd Annual Report 2016-17

Extraordinary General Meeting (EGM)Upon the Requisition and Special Notice received from Tata Sons Limited, the Company’s Shareholder, for the removal of Mr Cyrus P Mistry and Mr Nusli N Wadia as Director’s of the Company, an EGM was convened, as detailed below:
Date and Time of EGM
Ordinary Resolutions
Outcome Venue
December 22, 2016
at 3:00 p.m.
1. Removal of Mr Cyrus P Mistry as a Director
Resolution was rendered infructuous, as Mr Mistry had submitted his resignation as a Director on December 19, 2016
Yashwantrao Chavan
Prathishtan Auditorium, Y. B. Chavan
Centre, General Jagannath
Bhosle Marg, Next to
Sachivalaya Gymkhana,
Mumbai 400021
2. Removal of Mr Nusli N Wadia as a Director
Resolution was passed with requisite majority
All resolutions moved at the last AGM and EGM were passed by means of electronic and physical voting, by the requisite majority of members attending the meeting. None of the businesses proposed to be transacted at the ensuing AGM require the passing of a special resolution by way of postal ballot.
There were no resolutions passed by Postal Ballot by the Company during the year under review.
MEANS OF COMMUNICATION The Quarterly, Half Yearly and Annual Results are regularly submitted to the Stock Exchanges in accordance with SEBI Listing Regulations and are generally published in the Indian Express, Financial Express and the Loksatta (Marathi). The Company has emailed to the Members who had provided email addresses, the half yearly results of the Company. The information regarding the performance of the Company is shared with the shareholders vide the Annual Report. The official news releases, including on the quarterly and annual results and presentations made to institutional investors and analysts are also posted on the Company’s website (www.tatamotors.com) in the ‘Investors’ section.
The Annual Report, Quarterly Results, Shareholding Pattern, Press Releases, Intimation of Board Meetings and other relevant information of the Company are posted through BSE Listing Centre and NSE Electronic Application Processing System (NEAPS) portals for investor information
Green Initiative:In support of the “Green Initiative” undertaken by the Ministry of Corporate Affairs, the Company had during FY 2016-17 sent various communications including intimation of dividend and Half Yearly Communiqué by email to those shareholders whose email addresses were registered with the depositories or the Registrar and Transfer Agents.
All agenda papers for the Board and Committee meetings are disseminated electronically on a real-time basis, by uploading them on a secured online application specifically designed for this purpose.
In line with the SEBI Listing Regulations, the Company has emailed soft copies of its Annual Report to all those shareholders who have registered their email address for the said purpose. We would greatly appreciate and encourage more Members to register their email address with their Depository Participant or the Registrar and Transfer Agent of the Company, to receive soft copies of the Annual Report, Postal Ballot Notices and other information disseminated by the Company, on a real-time basis without any delay.
GENERAL INFORMATION FOR MEMBERSThe Company is registered with the Registrar of Companies, Mumbai, Maharashtra. The Corporate Identity Number (CIN) allotted to the Company by the Ministry of Corporate Affairs (MCA) is L28920MH1945PLC004520.
ANNUAL GENERAL MEETINGDate and Time Tuesday, August 22, 2017 at 3:00 p.m.Venue Birla Matushri Sabhagar, 19, Sir Vithaldas
Thackersey Marg, Mumbai 400020
FINANCIAL CALENDAR (TENTATIVE)Financial Year ending March 31
Results for the Quarter endingJune 30, 2017 On or before August 14, 2017
September 30, 2017 On or before November 14, 2017December 31, 2017 On or before February 14, 2018March 31, 2018 On or before May 30, 2018Date of Dividend payment
No divident was announced and recommended by the Board for FY 2016-17
LISTINGS The Company’s shares are listed on the BSE Ltd. (BSE) and National Stock Exchange of India Ltd. (NSE). The following are the details of the Company’s shares:
Type Ordinary Shares ‘A’ Ordinary SharesISIN INE155A01022 IN9155A01020BSE – Stock Code 500570 570001NSE – Stock Code TATAMOTORS TATAMTRDVR
Notice Board’s Report Management Discussion & Analysis Corporate Governance Report Business Responsibility Report
181

BSE - Address Phiroze Jeejeebhoy Towers, Dalal Street, Mumbai 400001; www.bseindia.com
NSE - Address “Exchange Plaza”, Bandra Kurla Complex,
Bandra (E), Mumbai 400051; www.nseindia.com
The Company has paid Annual Listing fees for FY 2017-18 to all the Stock Exchanges (both domestic and international) where the Company’s securities are listed.
Attention is also drawn to foreign listing and listing of debt securities of the Company as mentioned under Outstanding Securities below.
MARKET INFORMATION Market price data - monthly high/low of the closing price and trading volumes on BSE/NSE depicting liquidity of the Company’s Ordinary Shares and ‘A’ Ordinary Shares on the said exchanges is given hereunder:-
Month Ordinary Shares ‘A’ Ordinary Shares BSE NSE BSE NSE
High(`)
Low(`)
No. of Shares
High(`)
Low(`)
No. of Shares
High(`)
Low(`)
No. of Shares
High(`)
Low(`)
No. of Shares
Apr-16 419.30 370.50 9162156 419.05 370.50 124230334 306.55 272.05 1974851 306.50 271.25 34228686
May-16 458.20 380.10 18347837 459.65 379.85 310845164 311.65 260.10 5196859 314.50 259.90 56057627
Jun-16 488.00 440.35 23047496 487.95 440.40 242209799 323.85 287.40 12546218 324.70 287.55 74359259
Jul-16 510.10 455.25 15269479 510.10 455.15 130370299 330.00 291.25 7251939 330.65 290.95 40167587
Aug-16 537.45 479.15 19255368 537.70 478.40 158425947 343.10 313.65 6330649 343.55 313.40 39381756
Sep-16 589.35 526.20 19454513 588.70 526.00 164094093 373.35 334.70 2769462 373.50 335.10 37243000
Oct-16 565.70 521.85 9415442 565.70 522.00 108142885 365.45 338.75 2827255 366.15 338.80 30945237
Nov-16 540.20 453.05 13558398 540.20 452.35 169878493 348.45 285.55 2570880 348.55 285.30 50489432
Dec-16 472.80 433.05 10279248 473.15 432.90 181549238 304.10 287.05 1296757 304.60 287.75 29997642
Jan-17 548.00 481.25 10130929 548.90 481.10 110527645 341.75 307.95 2154717 341.85 308.40 26577374
Feb-17 541.70 436.55 14480959 542.25 436.45 163811534 343.30 268.15 3132935 344.75 268.30 52622569
Mar-17 480.40 449.10 12098007 480.95 449.45 134165992 292.40 274.60 8732943 292.85 274.55 54498816
The Performance of the Company’s stock price vis-a-vis BSE Sensex, Auto Index and ADR:
0 0
5000 100
100
0
Apr/16 May/16 Jun/16 Jul/16 Aug/16 Sep/16 Oct/16 Nov/16 Dec/16 Jan/17 Feb/17 Mar/17
Apr/16 May/16 Jun/16 Jul/16 Aug/16 Sep/16 Oct/16 Nov/16 Dec/16 Jan/17 Feb/17 Mar/17
200
200300
300400
400500
500600
600700
700 $ 50
$ 45
$ 40
$ 35
$ 30
$ 25
$ 20
$ 15
$ 10
$ 5
$ 0
10000
15000
20000
25000
30000
35000
Tata
Mot
ors
Ord
inar
y &
‘A’ O
rdin
ary
Sha
res
(`)
AD
R (U
S$)
Tata
Mot
ors
Ord
inar
y Sh
ares
( `)
BSE
SEN
SEX
& A
UTO
IND
EX
Corporate Overview Financial StatementsStatutory Reports
182 72nd Annual Report 2016-17

The monthly high and low of the Company’s ADRs is given below:
(in US $)Month High Low Month High LowApril 2016 35.86 33.54 October 2016 43.66 38.72May 2016 38.26 34.36 November 2016 44.16 42.03June 2016 38.23 35.44 December 2016 43.21 37.39July 2016 40.39 36.88 January 2017 49.22 39.09August 2016 43.38 35.40 February 2017 48.91 43.64September 2016 44.40 40.66 March 2017 47.28 41.83
Each Depositary Receipt represents 5 underlying Ordinary Shares of face value of `2/- each.
REGISTRAR AND TRANSFER AGENTS For share related matters, Members are requested to correspond with the Company’s Registrar and Transfer Agents – M/s TSR Darashaw Limited quoting their folio no./DP ID & Client ID at the following addresses:
1. For transfer lodgement, delivery and correspondence: TSR Darashaw Limited, Unit: Tata Motors Limited, 6-10, Haji Moosa Patrawala Industrial Estate, 20, Dr. E Moses Road, (Nr. Famous Studios) Mahalaxmi, Mumbai – 400011. Tel: 022-6656 8484; Fax: 022- 6656 8494; e-mail : [email protected]; website:www.tsrdarashaw.com
2. For the convenience of investors based in the following cities, transfer documents and letters will also be accepted at the following branches/agencies of TSR Darashaw Limited:
(i) Bangalore: 503, Barton Centre, 5th Floor, 84, Mahatma Gandhi Road, Bangalore – 560001.
Tel: 080 – 25320321, Fax: 080 – 25580019, e-mail: [email protected]
(ii) Jamshedpur: Bungalow No.1, “E” Road, Northern Town, Bistupur, Jamshedpur – 831001.
Tel: 0657 – 2426616, Fax: 0657 – 2426937, email : [email protected]
(iii) Kolkata: Tata Centre, 1st Floor, 43, Jawaharlal Nehru Road, Kolkata – 700071.
Tel: 033 – 22883087, Fax: 033 – 22883062, e-mail: [email protected]
(iv) New Delhi: Plot No.2/42, Sant Vihar, Ansari Road, Daryaganj, New Delhi – 110002.
Tel : 011 – 23271805, Fax : 011 – 23271802, e-mail : [email protected]
(v) Ahmedabad: Agent of TSRDL – Shah Consultancy Services Pvt. Limited: 3-Sumathinath Complex, Pritam Nagar Akhada Road, Ellisbridge, Ahmedabad -380006. Tel: 079-2657 6038,
e-mail: [email protected]
For Fixed Deposits: the investors are requested to correspond with the Registrars to the Fixed Deposits Scheme – TSR Darashaw Limited at the same addresses as mentioned above or send an e-mail at [email protected]. Tel : 022-66568484
For Rights Issue related matters: The Company launched a Rights Issue vide Letter of offer dated March 30, 2015 and Members are requested to correspond with Link Intime India Private Limited, the Registrar to the Issue, for addressing any pre-Issue/ post-Issue related matter, including all grievances relating to the ASBA process. Contact details: C-13, Pannalal Silk Mills Compound, L.B.S. Marg, Bhandup (West), Mumbai 400078;
Tel: (91 22) 6171 5400 / 9167779196 /97 /98/ 99; Fax: (91 22) 2596 0329; Website: www.linkintime.co.in;
Email: [email protected]; Contact Person: Sachin Achar.
SHARE TRANSFER SYSTEM Securities lodged for transfer at the Registrar’s address are normally processed within 15 days from the date of lodgment, if the documents are clear in all respects. All requests for dematerialization of securities are processed and the confirmation is given to the depositories within 15 days. The Executives of the Registrar are empowered to approve transfer of shares and debentures and other investor related matters. Grievances received from investors and other miscellaneous correspondence on change of address, mandates, etc. are processed by the Registrars within 15 days. The following compliances pertain to share transfers, grievances, etc.:
1. Pursuant to Regulation 7(3) of the SEBI Listing Regulations, certificates are filed with the stock exchanges on half yearly basis by the Compliance Officer and the representative of the Registrar and Share Transfer Agent for maintenance of an appropriate share transfer facility.
2. Pursuant to Regulation 13(2) of the SEBI Listing Regulations, a statement on the pending investor complaints is filed with the stock exchanges and placed before the Board of Directors on a quarterly basis.
3. A Company Secretary-in-Practice carried out a Reconciliation of Share Capital Audit on a quarterly basis to reconcile the total admitted capital with depositories viz National Securities Depository Limited (NSDL) and Central Depository Services Limited (CDSL) and the total issued and listed capital. The audit confirms that the total issued/paid up capital is in agreement with the aggregate of the total number of shares in physical form and the total number of shares in dematerialized form (held with NSDL and CDSL).
4. Pursuant to Regulation 61(4) read together with Regulation 40(9) of the SEBI Listing Regulations, a Company Secretary-in-Practice certificate is filed with the stock exchanges within one month from the end of each half of the financial year, certifying
Notice Board’s Report Management Discussion & Analysis Corporate Governance Report Business Responsibility Report
183

that all certificates are issued within thirty days of the date of lodgement for transfer, sub-division, consolidation, renewal, exchange or endorsement of calls/ allotment monies
Transfer of unclaimed / unpaid amounts to the Investor Education and Protection Fund (IEPF):
(i) During the year, the Ministry of Corporate Affairs had notified Sections 124 and 125 of the Act and the Investor Education and Protection Fund (Accounting, Audit, Transfer and Refund) Rules, 2016 (“IEPF Rules”). As per the said Act and the IEPF Rules all unclaimed/unpaid dividend, application money, debenture interest and interest on deposits as well as principal amount of debentures and deposits, sale proceeds of fractional shares, redemption amount of preference shares, etc. pertaining to the Company remaining unpaid or unclaimed for a period of 7 years from the date they became due for payment, have to be transferred to the IEPF Authority established by the Central Government.
Furthermore, the IEPF Rules mandate companies to transfer shares of shareholders whose dividends remain unpaid / unclaimed for a period of 7 consecutive years to the demat account of the IEPF Authority. The Company strongly recommends shareholders to encash / claim their respective dividend within the period given below:
Financial Year
Date of Declaration Last date for claiming dividend
2009-10 September 1, 2010 October 1, 20172010-11 August 12, 2011 September 11, 20182011-12 August 10, 2012 September 9, 20192012-13 August 21, 2013 September 20, 20202013-14 July 31, 2014 August 30, 20212014-15 No dividend declared2015-16 August 9, 2016 September 8, 2023
The Company has sent individual communication to the concerned shareholders at their registered address, whose dividend remains unclaimed and whose shares are liable to be transferred to the IEPF.
(ii) While the Company’s Registrar has already written to the Members, Debenture holders and Depositors informing them about the due dates for transfer to IEPF for unclaimed dividends/interest payments, attention of the stakeholders is again drawn to this matter through the Annual Report. The data on unpaid / unclaimed dividend and other unclaimed monies is also available on the Company’s website under the head (http://www.tatamotors.com/investor/iepf/). Investors of the Company who have not yet encashed their unclaimed/unpaid amounts are requested to correspond with the Company’s Registrar and Transfer Agents, at the earliest.
Members may refer to the Refund Procedure for claiming the aforementioned amounts transferred to the IEPF Authority as detailed on http://iepf.gov.in/IEPFA/refund.html.
(iii) Upto March 31, 2017, the Company transferred 22,48,23,214.34 to IEPF, including the following amounts during the year.
(in `)
Particulars FY 2016-17
Unpaid dividend amounts of the Company 88,64,667.00Application moneys received for allotment of any securities and due for refund
-
Unpaid matured deposit with the Company 1,54,000.00Unpaid matured debentures with the Company -Interest accrued on application money due for refund, unpaid matured deposits and debentures with the Company
6,65,177.00
Sale proceeds of fractional shares arising out of issuance of bonus shares, merger and amalgamation
3,97,703.00
Redemption amount of preference shares -Grants and donation -Others -Total 1,00,81,547.00
(iv) Other facilities of interest to shareholders holding shares in physical form:
As per Regulation 39(4) read with Schedule VI of the SEBI Listing Regulations, the Company has sent 9915 reminders in February 2013 and 8994 reminders in August 10, 2015 to those shareholders whose certificates have been returned undelivered. These certificates are currently lying with the Registrar and Transfer Agents of the Company. Members, holding Company’s shares in physical form, are requested to tally their holding with the certificates in their possession and revert in case of any discrepancy in holdings. In case there is no response after three reminders, the unclaimed shares shall be transferred to one folio in the name of “Unclaimed Suspense Account” and the voting rights on such shares shall remain frozen till the rightful owner claims the shares.
Nomination facility: Shareholders, who hold shares in single name or wish to make/change the nomination in respect of their shares as permitted under the Act, may submit in the prescribed form to the Registrars and Transfer Agents.
Corporate Overview Financial StatementsStatutory Reports
184 72nd Annual Report 2016-17

DISTRIBUTION OF SHAREHOLDING AS AT MARCH 31, 2017Ordinary Shares
Range of Shares No. of Shares No. of shareholdersNo. of shares Physical
form (%)Demat form (%)
% of Capital No. of Holders Physical form (%)
Demat form (%)
% of Capital
1 – 500 41,898,993 0.19 1.26 1.45 435,202 7.06 79.03 86.09
501 – 1000 21,851,490 0.15 0.61 0.76 30,047 1.15 4.79 5.94
1001 – 2000 28,028,792 0.18 0.79 0.97 19,640 0.74 3.15 3.89
2001 – 5000 42,116,645 0.23 1.23 1.46 13,726 0.43 2.28 2.72
5001 – 10000 26,317,226 0.11 0.80 0.91 3,809 0.09 0.67 0.75
Above 10000 2,727,135,282 0.20 94.25 94.45 3,079 0.04 0.57 0.61
Total 2,887,348,428 1.06 98.94 100.00 505,503 9.51 90.49 100.00
‘A’ Ordinary Shares
Range of Shares No. of Shares No. of shareholdersNo. of shares Physical
form (%)Demat form (%)
% of Capital No. of Holders Physical form (%)
Demat form (%)
% of Capital
1 – 500 9,421,919 0.02 1.83 1.85 91,477 0.94 86.71 87.65
501 – 1000 4,064,228 0.01 0.79 0.80 5,486 0.06 5.20 5.26
1001 – 2000 4,499,431 0.01 0.88 0.89 3,126 0.03 2.97 3.00
2001 – 5000 7,017,220 0.00 1.38 1.38 2,215 0.01 2.12 2.12
5001 – 10000 5,948,180 0.00 1.17 1.17 843 0.00 0.80 0.81
Above 10000 477,551,313 0.00 93.91 93.91 1,214 0.00 1.16 1.16
Total 508,502,291 0.04 99.96 100.00 104,361 1.04 98.96 100.00
For details on the Shareholding pattern, kindly refer Form MGT-9 appended to the Directors’ Report of this Annual Report.
DEMATERIALISATION OF SHARES
The electronic holding of the shares as on March 31, 2017 through NSDL and CDSL are as follows:
Particulars Ordinary Shares (%) ‘A’ Ordinary Shares (%)2017 2016 2017 2016
NSDL 97.71 97.43 97.75 97.45
CDSL 1.23 1.45 2.21 2.50
Total 98.94 98.88 99.96 99.95
OUTSTANDING SECURITIES
Outstanding Depositary Receipts/Warrants or Convertible instruments, conversion / maturity date and likely impact on equity as on March 31, 2017 are as follows:
Depositary Receipts: The Company has 10,60,99,256 ADSs listed on the New York Stock Exchange as on March 31, 2017. Each Depository Receipts represents 5 underlying Ordinary Shares of `2/- each.
Listing on Foreign Stock Exchange
New York Stock Exchange (NYSE)
Security Type American Depositary Receipts (ADRs)
ISIN US8765685024Stock Code / Ticker TTMAddress NYSE, 20 Broad Street, New York,
NY 10005
Overseas Depositary Domestic CustodianCitibank N.A., 388 Greenwich Street, 14th Floor, New York, NY 10013
Citibank N.A., Trent House, 3rd Floor, G-60, Bandra Kurla Complex, Bandra (East), Mumbai 400051
Listing on Foreign Stock Exchange
New York Stock Exchange (NYSE)
Security Type American Depositary Receipts (ADRs)
ISIN US8765685024Stock Code / Ticker TTMAddress NYSE, 20 Broad Street, New
York, NY 10005
Senior Unsecured Notes: In October 2014, the Company issued a dual tranche of Senior Unsecured Notes aggregating US$ 750 million, details of which are given herein under:
Notice Board’s Report Management Discussion & Analysis Corporate Governance Report Business Responsibility Report
185

Security Type ISIN Issue Size (US$ million)
Yield per annum (%)
Date of Maturity Listing
Senior Unsecured Notes XS1121907676 500 4.625% April 30, 2020 Singapore Stock Exchange
Senior Unsecured Notes XS1121908211 250 5.750% October 30, 2024
There are no outstanding warrants or any other convertible instruments issued by the Company.
The following Non-Convertible Debentures (NCD) are listed on NSE and BSE under Wholesale Debt Market Segment*:
Series No. Stock Exchange Listing
ISIN Principal Amount (` in crores)
Yield to Maturity (%)
Date of Maturity
E 22 NSE INE155A07219 200 9.95 March 2, 2020
E 22A NSE INE155A07227 500 10.25 - Rs.100 crores on April 30, 2022 and April 30, 2023- Rs.150 crores on April 30, 2024 and April 30, 2025
E 23A NSE INE155A08043 150 9.90 May 7, 2020
E 23B NSE INE155A08050 100 9.75 May 24, 2020
E 23C NSE INE155A08068 150 9.70 June18, 2020
E 24A NSE INE155A08076 250 10.00 May 26, 2017
E 24B NSE INE155A08084 110 10.00 May 28, 2019
E 24E NSE INE155A08118 200 9.69 March 29, 2019
E 24F NSE INE155A08126 200 9.45 March 29, 2018
E26A NSE INE155A08183 190 10.30 November 30, 2018
E26B NSE INE155A08191 300 9.81 August 20, 2024
E26C NSE INE155A08209 200 9.77 September 12, 2024
E26D (Option - I) NSE INE155A08217 300 9.71 October 1, 2019
E26D (Option - II) NSE INE155A08225 400 9.73 October 1, 2020
E26E NSE & BSE INE155A08233 400 9.60 October 29, 2022
E26F NSE & BSE INE155A08241 400 9.35 November 10, 2023
E26G NSE & BSE INE155A08258 300 9.02 December 10, 2021
E27A NSE & BSE INE155A08274 300 8.25 January 28, 2019
E27B NSE & BSE INE155A08282 300 8.40 May 26, 2021
E27C NSE & BSE INE155A08290 400 8.13 July 18, 2018
E27D NSE & BSE INE155A08308 400 8.00 August 1, 2019
E27E NSE & BSE INE155A08316 300 7.50 October 20, 2021
E27F NSE & BSE INE155A08324 500 7.71 March 3, 2022
E27G NSE & BSE INE155A08332 500 7.84 September 27, 2021
*Detailed information on the above debentures is included in the ‘Notes to Accounts’.
Vistra ITCL (India) Limited (formerly IL&FS Trust Company Limited) situated at the IL&FS Financial Centre, 7th Floor, East Quadrant, Plot C- 22, G Block, Bandra Kurla Complex, Bandra (E), Mumbai 400051, are the debenture trustees for all the aforementioned NCD’s issued by the Company,. They may be contacted at Tel.: +91 22 26593612, Fax : + 91 22 2653 3297, Email id: [email protected].
Corporate Overview Financial StatementsStatutory Reports
186 72nd Annual Report 2016-17

PLANT LOCATIONS
Location Range of Products Produced
Pimpri, Pune – 411018;Chikhali, Pune – 410501;Chinchwad, Pune – 411033
Medium and Heavy Commercial Vehicles (M&HCVs), Light Commercial Vehicles (LCVs), Utility Vehicles (UVs) and Cars
Jamshedpur – 831010 Intermediate Commercial Vehicles (ICVs) and M&HCVs
Chinhat Industrial Area, Dewa Road, Chinhat, Lucknow – 226019
ICVs, M&HCVs and LCVs
Plot No. 1, Sector 11 and Plot No. 14, Sector 12, I.I.E., Pantnagar, District Udhamsingh Nagar, Uttarakhand – 263145
LCVs, M&HCVs and UVs
Revenue Survey No. 1, Village Northkotpura, Tal, Sanand, Dist. Ahmedabad – 380015
Cars
KIADB Block II, Belur Industrial Area, Mummigatti Post, Dharwad – 580011
Small Commercial Vehicles (SCVs) and LCVs
ADDRESS FOR CORRESPONDENCE
For Investor Queries
Retail / HNI InvestorsMr H K Sethna, Company Secretary Bombay House,24, Homi Mody Street, Mumbai - 400001, INDIA Phone : 91-22- 6665 7824; Fax : 91-22- 6665 7260E-Mail : [email protected]
Institutional InvestorsMr V B Somaiya, Head (Treasury & Investor Relations)3rd Floor, Nanavati Mahalaya,18, Homi Mody Street, Mumbai - 400001, INDIA Phone : 91-22-66658282E-Mail : [email protected]
For Fixed Deposit, Rights Issue and other Share related queries
Kindly refer details mentioned herein above under the head ‘Registrar and Transfer Agents’
SUBSIDIARY COMPANIES The Company does not have any material non-listed Indian subsidiary company and hence, it is not required to have an Independent Director of the Company on the Board of such subsidiary company. However, the following Independent Directors of the Company, are also present in an independent capacity, on the Board of the below mentioned subsidiary companies:
Common Independent Directors
Presence on the Board of Subsidiary Companies
Mr N Munjee Jaguar Land Rover Automotive Plc and Tata Motors Finance Limited
Dr R A Mashelkar TAL Manufacturing Solutions Limited
Mr V K Jairath Concorde Motors (India) Limited, TML Distribution Company Limited and Tata Motors Finance Solutions Limited
Ms Falguni Nayar Tata Marcopolo Motors Limited, and Tata Technologies Limited
The Company adopted a Policy for Determining Material Subsidiaries of the Company, pursuant to Regulation 16(1)(c) of the SEBI Listing Regulations. This policy is available on the Company’s website pursuant to Regulation 46(2) of the SEBI Listing Regulations.
The Audit Committee also has a 2-day meeting wherein the CEO and CFO of subsidiary companies make a presentation on significant issues in audit, internal control, risk management, etc. Significant issues pertaining to subsidiary companies are also discussed at Audit Committee meetings of the Company.
The Minutes of the subsidiary companies are placed before the Board of Directors of the Company and the attention of the Directors is drawn to significant transactions and arrangements entered into by the subsidiary companies. The performance of its subsidiaries is also reviewed by the Board periodically.
DISCLOSURES i. Details of relevant Related Party Transactions entered into by the
Company are included in the Board’s Report and in the Notes to Accounts. The Company has in place a Policy on Related Party Transactions setting out (a) the materiality thresholds for related parties and (b) the manner of dealing with transactions between the Company and related parties, including omnibus approvals by Audit Committee based on the provisions of the Act and Regulation 23 of the SEBI Listing Regulations. During the year, there were no materially significant transactions with related parties, as per the Policy adopted by the Company that have potential conflict with the interests of the Company at large. All transactions with related parties entered into by the Company were in the normal course of business on an arm’s length basis and were approved by the Audit Committee.
ii. The Company has complied with various rules and regulations prescribed by the Stock Exchanges, Securities and Exchange Board of India or any other statutory authority relating to the capital markets during the last 3 years. No penalties or strictures have been imposed by them on the Company.
iii. In accordance with the provisions of the Act and Regulation 22 of the SEBI Listing Regulations the Company has in place a Vigil Mechanism and a Whistle-Blower Policy duly approved by the Audit Committee which provides a formal mechanism for
Notice Board’s Report Management Discussion & Analysis Corporate Governance Report Business Responsibility Report
187

all Directors and employees of the Company to approach the Management of the Company (Audit Committee in case where the concern involves the Senior Management) and make protective disclosures to the Management about unethical behaviour, actual or suspected fraud or violation of the Company’s Code of Conduct or Ethics policy. The disclosures reported are addressed in the manner and within the time frames prescribed in the Policy. The Company affirms that no director or employee of the Company has been denied access to the Audit Committee.
iv. The Company has complied with all the mandatory requirements of corporate governance as specified in sub-paras (2) to (10) of Part C of Schedule V of the SEBI Listing Regulations.
v. The Company also fulfilled the following non-mandatory requirements as specified in Part E of the Schedule II of the SEBI Listing Regulations:
The Board: The Non-Executive Chairman maintains a separate office, for which the Company does not reimburse expenses.
Shareholder Rights: Details are given under the heading “Means of Communications”.
Modified opinion in Audit Report: During the year under review, there was no audit qualification in the Auditors’ Report on the Company’s financial statements. The Company continues to adopt best practices to ensure a regime of unqualified financial statements.
Separate posts of Chairman and CEO: The post of the Non- Executive Chairman of the Board is separate from that of the Managing Director/CEO.
Reporting of Internal Auditor: The Chief Internal Auditor reports to the Audit Committee of the Company, to ensure independence of the Internal Audit function.
vi. Commodity price risk or foreign exchange risk and hedging activities:
During the FY 2016-17, the Company had managed the foreign exchange risk and hedged to the extent considered necessary. The Company enters into forward contracts for hedging foreign exchange exposures against exports and imports. The details of foreign currency exposure are disclosed in Note No. 41(c)(i)(a) to the Standalone Financial Statements.
vii. The Company is in compliance with the disclosures required to be made under this report in accordance with regulation 34(3) read together with Schedule V(C) to the SEBI listing regulations.
viii. Disclosures on compliance with corporate governance requirements specified in Regulations 17 to 27 have been included in the relevant sections of his report. Appropriate information has been placed on the Company’s website pursuant to clauses (b) to (i) of sub-regulation (2) of Regulation 46 of the SEBI Listing Regulations.
Information on the Company’s website regarding key policies, codes and charters, adopted by the Company:
Name of Policy, Code or Charter
Brief Description Web Link
Terms of Appointment of Independent Directors
Relevant extracts form the appointment letter issued to Independent Directors detailing the broad terms and conditions of their appointment.
http://www.tatamotors.com/investors/pdf/Terms-of-Appointment-ID.pdf
Board Committees The composition of various committees of the Board http://www.tatamotors.com/about-us/leadership/
Tata Code of Conduct Represents the values and core principles that guide the conduct of every Tata business. The Code lays down the ethical standards that Tata colleagues need to observe in their professional lives.a) For Whole-time Directors & Employees: http://corp-content.tatamotors.com.s3-ap-
southeast-1.amazonaws.com/wp-content/uploads/2015/10/tata-code-of-conduct.pdf
b) For Non-Executive Directors and Independent Directors http://www.tatamotors.com/investors/pdf/ned-id.pdf
Whistleblower Policy (Vigil Mechanism)
The Whistleblower policy has been formulated for Directors and employees of the Company to report concerns about unethical behavior, actual or suspected fraud or violation of the Tata Code of Conduct.
http://www.tatamotors.com/investors/pdf/whistle-blower-policy.pdf
Corporate Overview Financial StatementsStatutory Reports
188 72nd Annual Report 2016-17

On behalf of the Board of Directors
N CHANDRASEKARANChairman
(DIN: 00121863)
Mumbai, May 23, 2017
Name of Policy, Code or Charter
Brief Description Web Link
Policy on Related Party Transactions
A policy on materiality of related party transactions and regulates all transactions between the Company and its related parties.
http://www.tatamotors.com/investors/pdf/rpt-policy.pdf
Policy for determinimg Material Subsidiaries
This policy is determine material subsidiaries and material non-listed Indian subsidiaries of the Company and to provide governance framework for them.
http://www.tatamotors.com/investors /pdf/material.pdf
Familiarisation Programme For Independent Directors through various programmes/ presentations.
http://www.tatamotors.com/investors/pdf/familiarisation-programme-independent-directors.pdf
Unpaid Dividend Account Details
Statement of unclaimed and unpaid amounts to be transferred to the IEPF
http://www.tatamotors.com/investor/iepf/
Corporate Social Responsibility Policy
The policy outlines the Company’s strategy to bring about a positive impact on society through programmes focusing on Health, Education, Employability and Environment interventions for relevant target groups, ensuring diversity and giving preference to needy and deserving communities inhabiting urban India.
http://www.tatamotors.com/investors/pdf/csr-policy-16-17.pdf
Audit Committee Charter Inter alia outlines the terms of reference, composition, quorum, meeting requirements, authority and responsibility of the Audit Committee of the Company.
http://www.tatamotors.com/investors/ pdf/audit_committee_charter.pdf
Policy on determination of Materiality for Disclosure of Event / Information
This policy applies to disclosures of material events affecting the Company and its subsidiaries. This policy is in addition to the company’s corporate policy.
http://www.tatamotors.com/investors/pdf/materiality.pdf
Content Archiving Policy The policy provides guidelines for archiving of corporate records and documents as statutorily required by the Company.
http://www.tatamotors.com/investors/pdf/content-archiving-policy.pdf
Code of Corporate Disclosure Practices
This policy is aimed at providing timely, adequate, uniform and universal dissemination of information and disclosure of Unpublished Price Sensitive Information outside the Company in order to provide accurate and timely communication to our shareholders and the financial markets.
http://www.tatamotors.com/investors/pdf/CodeCorporateDisclosure.pdf
Dividend Distribution Policy
This policy outlines the financial parameters and factors that are considered whilst declaring dividend.
http://www.tatamotors.com/investors/pdf/dividend-distribution-policy.pdf
Notice Board’s Report Management Discussion & Analysis Corporate Governance Report Business Responsibility Report
189

DECLARATION BY THE CEO UNDER REGULATION 26(3) OF THE SEBI (LISTING OBLIGATIONS AND DISCLOSURE REQUIREMENTS) REGULATIONS, 2015 REGARDING ADHERENCE TO THE CODE OF CONDUCT
Pursuant to Regulation 26(3) of the SEBI (Listing Obligations and Disclosure Requirements) Regulations, 2015, the Board Members and the Senior Management personnel of the Company have affirmed compliance to their respective Codes of Conduct, as applicable to them for the Financial Year ended March 31, 2017.
For Tata Motors Limited
Guenter ButschekCEO and Managing DirectorMumbai, May 23, 2017
PRACTISING COMPANY SECRETARIES’ CERTIFICATE ON CORPORATE GOVERNANCE TO THE MEMBERS OF TATA MOTORS LIMITED
We have examined the compliance of the conditions of Corporate Governance by Tata Motors Limited (‘the Company’) for the year ended on March 31, 2017, as stipulated under Regulations 17 to 27, clauses (b) to (i) of sub-regulation (2) of Regulation 46 and para C, D & E of Schedule V of the Securities and Exchange Board of India (Listing Obligations and Disclosure Requirements) Regulations, 2015 (“SEBI Listing Regulations”) for the period April 1, 2016 to March 31, 2017.
The compliance of the conditions of Corporate Governance is the responsibility of the management. Our examination was limited to a review of procedures and implementation thereof, as adopted by the Company for ensuring compliance to the conditions of Corporate Governance. It is neither an audit nor an expression of opinion on the financial statements of the Company.
In our opinion and to the best of our information and according to the explanations given to us, and the representations made by the Directors and the management, we certify that the Company has complied with the conditions of Corporate Governance as stipulated in the SEBI Listing Regulations.
We further state that such compliance is neither an assurance as to the future viability of the Company nor of the efficiency or effectiveness with which the management has conducted the affairs of the Company.
For Parikh & AssociatesPractising Company Secretaries
P. N. PARIKH FCS: 327 CP: 1228 Mumbai, May 23, 2017
Corporate Overview Financial StatementsStatutory Reports
190 72nd Annual Report 2016-17

BUSINESS RESPONSIBILITY REPORT
INTRODUCTION
With a legacy of over six decades, the Company continues to be India’s largest automobile company with total income of 2,75,246.66 crores in Fiscal 2017. The Company is the first Indian company in engineering sector to be listed in the New York Stock Exchange. As leaders in commercial vehicles, and among top six in passenger vehicles in India, the Company is present across all segments with over 6,600 dealership points - sales, services and spare parts globally. With the ethos of ‘Corporate Social Responsibility’ and ‘Sustainability’ strongly embedded in its DNA, the Company continues to nurture the core value of ‘giving back to society’.
The Business Responsibility disclosures in this Report illustrate the Company’s efforts towards creating enduring value for all stakeholders in a responsible manner. This Report is aligned with National Voluntary Guidelines on Social, Environmental and Economic Responsibilities of Business (NVG-SEE) released by Ministry of Corporate Affairs, and is in accordance with Regulation 34 (2) (f ) of the Securities and Exchange Board of India (SEBI) (Listing Obligations and Disclosure Requirements) Regulations 2015. This report provides an overview of the activities carried out by the Company under each of the nine principles as outlined in NVG.
SECTION A: GENERAL INFORMATION ABOUT THE COMPANY1 Corporate Identity Number (CIN) of the Company:
L28920MH1945PLC004520
2. Name of the Company: Tata Motors Limited
3. Registered address: Bombay House, 24, Homi Mody Street, Mumbai - 400001
4. Website: http://www.tatamotors.com/
5. E-mail id: [email protected]
6. Financial Year reported: 2016-17
7. Sector(s) that the Company is engaged in (industrial activity code-wise)
NIC Code Description
2910 Manufacture of motor vehicles
2920 Manufacture of bodies(coachwork) for motor vehicles
2930 Manufacture of parts and accessories for motor vehicles
4530 Sale of motor vehicle parts and accessories
8. List three key products/services that the Company manufactures/provides (as in balance sheet)
i) Passenger Cars ii) Commercial Vehicles iii) Vehicles sales and service (Please refer to the Company’s website www.tatamotors.com for complete list of its products)
9. Total number of locations where business activity is undertaken by the Company
i. Number of International Locations (Provide details of major 5): Through subsidiaries, the Company operates in over 175 markets and has over 6,600 sales and service touch points. The Company has manufacturing facilities in the UK, South Korea, Thailand, South Africa, Brazil and Indonesia. Please refer “Global Footprint” section of the Company’s Annual Report Fiscal 2017 for complete list of the Company’s global operations.
ii. Number of National Locations – The Company manufacturing base in India is spread across Jamshedpur (Jharkhand), Pune (Maharashtra), Lucknow (Uttar Pradesh), Pantnagar (Uttarakhand), Sanand (Gujarat) and Dharwad (Karnataka).
10. Markets served by the Company - Local/State/National/International
The Company vehicles and services cater to entire Indian market. The Company’s commercial and passenger vehicles are already being marketed in several countries in North America, Central and South America, Africa, Europe, Asia and Oceania.
Please refer “Global Footprint” section of the Company’s Annual Report Fiscal 2017 for complete list of the Company’s global operations.
SECTION B: FINANCIAL DETAILS OF THE COMPANY 1. Paid up Capital (INR): ` 679.22 crores
2. Total Turnover (INR): ` 48,319.90 crores (Standalone basis without joint operations)
3. Total Profit After Taxes (INR): Loss of ` 2,597.62 crores (Standalone basis without joint operations)
4. Total Spending on Corporate Social Responsibility (CSR) as percentage of profit after tax (%): Total expenditure reported is ` 25.94 crores (Standalone basis without joint operations).
5. List of activities in which expenditure in 4 above has been incurred: -
The Company has been regularly conducting a community engagement strategy, which revolves around four focus themes:
i) Arogya (Health): The focus is to work on addressing child malnutrition, health awareness for females. This initiative provides preventive & curative health services to community.
In Fiscal 2017, 361,983 members benefited from the Company’s health initiatives.
ii) Vidyadhanam (Education): This initiative aims to improve the quality of education in schools by offering scholarship to meritorious and needy secondary school students, organizing special coaching classes to improve academic performance
[Pursuant to Regulation 34(2)(f) of the SEBI Listing Regulations]
Notice Board’s Report Management Discussion & Analysis Corporate Governance Report Business Responsibility Report
191

in Class X Board exam, supporting school infrastructure and organizing co-curricular activities for well-rounded personality development.
In Fiscal 2017, 86,922 students have been benefitted through the education program.
iii) Kaushalya (Employability): This program has been developed considering enhanced skill development among youth. It includes infusing marketable skills in school dropout youth in auto sector, non-auto trades, agriculture and allied activities. It also, strengthens the Industrial Training Institutes by offering domain expertise of automotive skills through knowledge partnership.
In Fiscal 2017, the Company has trained 87,751 youth marketable vocational skills.
Through the AA policy initiatives, this year the Company has added 5 new SC/ST entrepreneurs in the supply chain totaling to 27 Nos and extended business of `10.99 crores to them.
iv) Vasundhara (Environment): The Company’s approach to improve environment included promotion of renewable energy, creation of carbon sinks through large scale sapling plantation, construction of water conservation structures and building awareness among the community members. More than 100,000 saplings have been planted in the Company’s various programs under this initiative and 43,546 people participated in various environment awareness initiatives.
Please refer ‘Corporate Social Responsibility’ section of Company’s Annual Report FY 2016-17 and Company’s Annual CSR Report 2016-17 for detailed community engagement strategy and key initiatives. The reports are available on the Company’s website www.tatamotors.com.
SECTION C: OTHER DETAILS1. Does the Company have any Subsidiary Company/
Companies? The Company has seventy-eight direct and indirect subsidiaries
in India and abroad as at 31.03.2017.
2. Do the Subsidiary Company/Companies participate in the BR Initiatives of the parent company? If yes, then indicate the number of such subsidiary company(s)
The Company positively influences and encourages its subsidiaries to adopt Business Responsibility (BR) initiatives. All the Company’s subsidiaries are guided by Tata Code of Conduct (TCoC) to conduct their business in an ethical, transparent and accountable manner. It encompasses suppliers, customers and other stakeholders. It also addresses key BR issues like Quality and Customer value, Corruption and Bribery, Health & Safety, Environment, Human Rights and Employee well-being. Key subsidiaries like Jaguar Land Rover Automotive Plc. releases the sustainability report every year. The scope of this report is defined each year. For the Fiscal 2017, the Company has extended its reporting boundary to include the performance of three subsidiary companies and one Joint Arrangement (JA) operating out of its premises.
3. Do any other entity/entities (e.g. suppliers, distributors etc.) that the Company does business with participate in the BR initiatives of the Company? If yes, then indicate the percentage of such entity/entities? [Less than 30%, 30-60%, More than 60%]
Suppliers, distributors are critical to the Company’s operations and supply chain sustainability issues can impact its operations. The Company engage with suppliers through various channels for operational issues and also focus on emerging and futuristic technologies through Technology Day events. Project Sankalp – a supplier transformation initiative is underway in which cross functional team of domain experts work with suppliers at their plant location on improving quality, productivity, SHE and profitability. The suppliers and vendors are provided awareness on environmental and social issues. The vendor meets are used as a platform to raise awareness on health & safety, environmental and community initiatives of the Company. The vendors situated in the vendor parks at Pantnagar and Sanand manufacturing locations actively participate in the site health & safety, environmental and CSR programmes. Special emphasis is laid on skill development and up-gradation of the dealer and channel partner resources. Currently less than 30% of value chain entities participate in the Company’s BR initiatives and there is a constant effort by the Company to extend these initiatives to larger value chain base.
SECTION D: BR INFORMATION1. Details of Director/Directors responsible for BRa) Details of the Director/Directors responsible for
implementation of the BR policy/policies.
SN Particulars Details1. DIN Number (if applicable) 01875848 2. Name Mr. Ravindra Pisharody 3. Designation Executive Director
(Commercial Vehicles) 4. Telephone 022-66657837 5. E-mail id [email protected]
SN Particulars Details1. DIN (if applicable) 01793948 2. Name Mr Satish B Borwankar 3. Designation Executive Director (Quality)4 Telephone 020-66132257 5. E-mail id [email protected]
SN Particulars Details1. DIN Number (if applicable) N.A2. Name Mr Arvind Bodhankar3. Designation Head – Safety, Health,
Environment and Sustainability4 Telephone 022-66158538 5. E-mail id [email protected]
b) Details of the BR head
Corporate Overview Financial StatementsStatutory Reports
192 72nd Annual Report 2016-17

2. Principle-wise (as per NVGs) BR Policy/policies (Reply in Y/N)
The National Voluntary Guidelines on Social, Environmental and Economic Responsibilities of Business released by the Ministry of Corporate Affairs has adopted nine areas of Business Responsibility. These are as follows:
P1 – Businesses should conduct and govern themselves with Ethics, Transparency and Accountability.
P2 – Businesses should provide goods and services that are safe and contribute to sustainability throughout their life cycle.
P3 – Businesses should promote the well-being of all employees.
SN Questions P1 P2 P3 P4 P5 P6 P7 P8 P9
1. Do you have policy/policies for? Y Y Y Y Y Y Y Y Y
2. Has the policy being formulated in consultation with the relevant stakeholders? Y Y Y Y Y Y Y Y Y3. Does the policy conform to any national /international standards? If yes, specify?
(The policies conformance to the spirit of international standards like ISO 9000, ISO 14000, OHSAS 18000, SA 8000, UNGC guidelines and ILO principles and meet the regulatory requirements such as SEBI Listing Regulations, Sarbanes Oxley Act etc. The policies reflects Tata group’s commitment to improve the quality of life of the communities it serves and practice of returning to society what it earns)
Y Y Y Y Y Y Y Y Y
4. Has the policy being approved by the Board? Is yes, has it been signed by MD/owner/CEO/appropriate Board Director?* Y Y Y Y Y Y Y Y Y
5. Does the company have a specified committee of the Board/ Director/Official to oversee the implementation of the policy? Y Y Y Y Y Y Y Y Y
6. Has the policy been formally communicated to all relevant internal and external stakeholders?
The policies have been communicated to all internal stakeholders. Tata Code of Conduct and other policies are communicated to suppliers, vendors, dealers and channel partners based on their relevance.
7. Does the company have in-house structure to implement the policy/policies The Company has established in-house structures to implement these policies.
8. Does the Company have a grievance redressal mechanism related to the policy/policies to address stakeholders’ grievances related to the policy/policies?
The whistle blower mechanism provides employees to report any concerns or grievances pertaining to any potential or actual violation of Tata Code of Conduct, which covers all aspects of BRR. An Investor grievance mechanism is in place to respond to investor grievances. The Customer Complaints mechanism records the grievances of customers on product and service quality and other issues of interest to them. The supplier, vendor, dealer and channel partner forums and ongoing communication captures their concerns and grievances. The continual community engagement, needs assessments, impact assessments serve as means for communities to represent their concerns and grievances.
P4 – Businesses should respect the interests of, and be responsive towards all stakeholders, especially those who are disadvantaged, vulnerable and marginalized.
P5 – Businesses should respect and promote human rights.
P6 – Businesses should respect, protect, and make efforts to restore the environment.
P7 – Businesses, when engaged in influencing public and regulatory policy, should do so in a responsible manner.
P8 – Businesses should support inclusive growth and equitable development.
P9 – Businesses should engage with and provide value to their customers and consumers in a responsible manner.
Notice Board’s Report Management Discussion & Analysis Corporate Governance Report Business Responsibility Report
193

9. Has the company carried out independent audit/evaluation of the working of this policy by an internal or external agency?
The implementation of Tata Code of Conduct and other policies are reviewed through internal audit function/ethics counsellor. External assessment of Tata Business Excellence Model (TBEM) covers the review of implementation of all Company policies. The Quality, Safety & Health and Environmental policies are subject to internal and external audits as part of certification process.
* All the policies are signed by the Managing Director or an Executive Director.All the policies in the Company are carved from its Guiding Principles and Core Values. These policies are mapped to each principle hereunder:
Principle Applicable Policies Link for policiesPrinciple1: Businesses should conduct and govern themselves with Ethics, Transparency and Accountability.
Whistle Blower Policy http://www.tatamotors.com/investors/pdf/whistle-blower-policy.pdf
Principle 2: Businesses should provide goods and services that are safe and contribute to sustainability throughout their life cycle.
Environment Policy, Quality Policy
http://www.tatamotors.com/about-us/corporate-governance/policies/http://www.tatamotors.com/about-us/corporate-governance/policies/
Principle 3: Businesses should promote the well-being of all employees.
Safety Policy http://www.tatamotors.com/about-us/corporate-governance/policies/
Principle 4: Businesses should respect the interests of, and be responsive towards all stakeholders, especially those who are disadvantaged, vulnerable and marginalized.
CSR PolicyTata Affirmative Action Policy
http://www.tatamotors.com/investors/pdf/csr-policy-16-17.pdfhttp://www.tata.com/sustainability/articlesinside/Tata-Affirmative-Action-Programme
Principle 5: Businesses should respect and promote human rights.
Tata Code of Conduct
Whistle Blower Policy
http://corp-content.tatamotors.com.s3-ap-southeast-1.amazonaws.com/wp-content/uploads/2015/10/tata-code-of-conduct.pdfhttp://www.tatamotors.com/investors/pdf/whistle-blower-policy.pdf
Principle 6: Businesses should respect, protect, and make efforts to restore the environment.
Environment Policy
Sustainability Policy
http://www.tatamotors.com/about-us/corporate-governance/policies/http://www.tatasustainability.com/tataSustainabilityPolicy.aspx
Principle 7: Businesses, when engaged in influencing public and regulatory policy, should do so in a responsible manner.
Tata Code of Conduct http://corp-content.tatamotors.com.s3-ap-southeast-1.amazonaws.com/wp-content/uploads/2015/10/tata-code-of-conduct.pd
Principle 8: Businesses should support inclusive growth and equitable development.
CSR Policy http://corp-content.tatamotors.com.s3-ap-southeast-1.amazonaws.com/wpcontent/uploads/2015/10/12061154/csr-policy-15-161.pdf
Principle 9: Businesses should engage with and provide value to their customers and consumers in a responsible manner.
Tata Code of Conduct
Quality Policy
http://corp-content.tatamotors.com.s3-ap-southeast-1.amazonaws.com/wp-content/uploads/2015/10/tata-code-of-conduct.pdhttp://www.tatamotors.com/about-us/corporate-governance/policies/
Corporate Overview Financial StatementsStatutory Reports
194 72nd Annual Report 2016-17
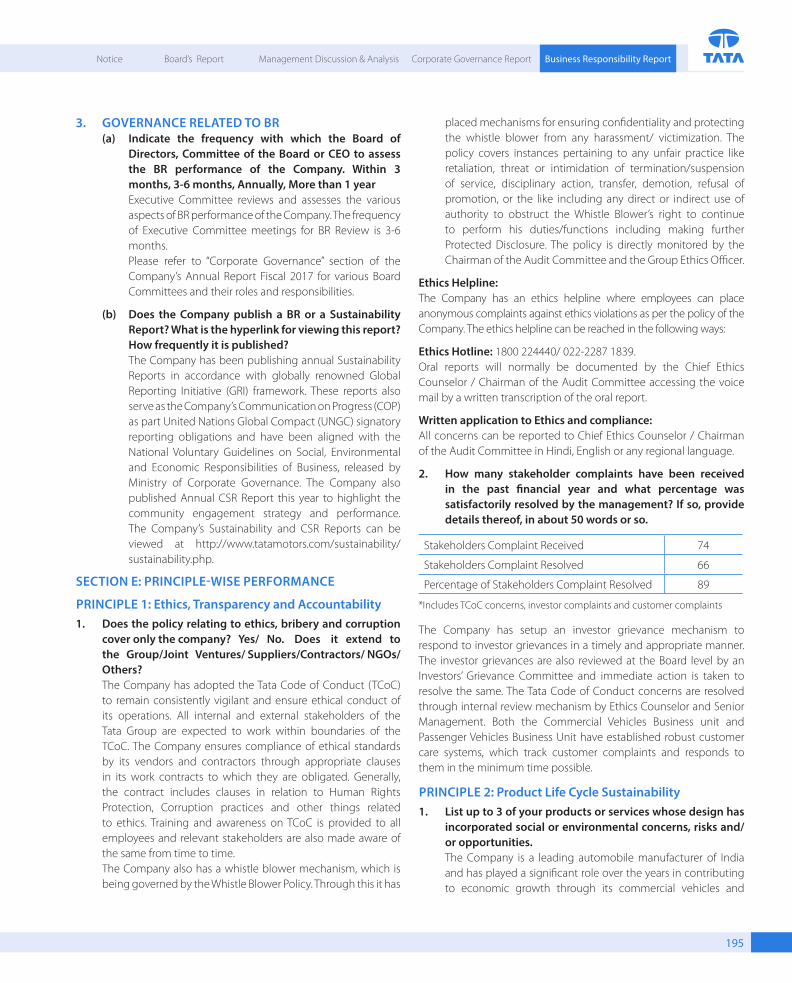
3. GOVERNANCE RELATED TO BR (a) Indicate the frequency with which the Board of
Directors, Committee of the Board or CEO to assess the BR performance of the Company. Within 3 months, 3-6 months, Annually, More than 1 year
Executive Committee reviews and assesses the various aspects of BR performance of the Company. The frequency of Executive Committee meetings for BR Review is 3-6 months.
Please refer to “Corporate Governance” section of the Company’s Annual Report Fiscal 2017 for various Board Committees and their roles and responsibilities.
(b) Does the Company publish a BR or a Sustainability Report? What is the hyperlink for viewing this report? How frequently it is published?
The Company has been publishing annual Sustainability Reports in accordance with globally renowned Global Reporting Initiative (GRI) framework. These reports also serve as the Company’s Communication on Progress (COP) as part United Nations Global Compact (UNGC) signatory reporting obligations and have been aligned with the National Voluntary Guidelines on Social, Environmental and Economic Responsibilities of Business, released by Ministry of Corporate Governance. The Company also published Annual CSR Report this year to highlight the community engagement strategy and performance. The Company’s Sustainability and CSR Reports can be viewed at http://www.tatamotors.com/sustainability/sustainability.php.
SECTION E: PRINCIPLE-WISE PERFORMANCE
PRINCIPLE 1: Ethics, Transparency and Accountability1. Does the policy relating to ethics, bribery and corruption
cover only the company? Yes/ No. Does it extend to the Group/Joint Ventures/ Suppliers/Contractors/ NGOs/Others?
The Company has adopted the Tata Code of Conduct (TCoC) to remain consistently vigilant and ensure ethical conduct of its operations. All internal and external stakeholders of the Tata Group are expected to work within boundaries of the TCoC. The Company ensures compliance of ethical standards by its vendors and contractors through appropriate clauses in its work contracts to which they are obligated. Generally, the contract includes clauses in relation to Human Rights Protection, Corruption practices and other things related to ethics. Training and awareness on TCoC is provided to all employees and relevant stakeholders are also made aware of the same from time to time.
The Company also has a whistle blower mechanism, which is being governed by the Whistle Blower Policy. Through this it has
placed mechanisms for ensuring confidentiality and protecting the whistle blower from any harassment/ victimization. The policy covers instances pertaining to any unfair practice like retaliation, threat or intimidation of termination/suspension of service, disciplinary action, transfer, demotion, refusal of promotion, or the like including any direct or indirect use of authority to obstruct the Whistle Blower’s right to continue to perform his duties/functions including making further Protected Disclosure. The policy is directly monitored by the Chairman of the Audit Committee and the Group Ethics Officer.
Ethics Helpline:The Company has an ethics helpline where employees can place anonymous complaints against ethics violations as per the policy of the Company. The ethics helpline can be reached in the following ways:
Ethics Hotline: 1800 224440/ 022-2287 1839.Oral reports will normally be documented by the Chief Ethics Counselor / Chairman of the Audit Committee accessing the voice mail by a written transcription of the oral report.
Written application to Ethics and compliance:All concerns can be reported to Chief Ethics Counselor / Chairman of the Audit Committee in Hindi, English or any regional language.
2. How many stakeholder complaints have been received in the past financial year and what percentage was satisfactorily resolved by the management? If so, provide details thereof, in about 50 words or so.
Stakeholders Complaint Received 74
Stakeholders Complaint Resolved 66
Percentage of Stakeholders Complaint Resolved 89
*Includes TCoC concerns, investor complaints and customer complaints
The Company has setup an investor grievance mechanism to respond to investor grievances in a timely and appropriate manner. The investor grievances are also reviewed at the Board level by an Investors’ Grievance Committee and immediate action is taken to resolve the same. The Tata Code of Conduct concerns are resolved through internal review mechanism by Ethics Counselor and Senior Management. Both the Commercial Vehicles Business unit and Passenger Vehicles Business Unit have established robust customer care systems, which track customer complaints and responds to them in the minimum time possible.
PRINCIPLE 2: Product Life Cycle Sustainability1. List up to 3 of your products or services whose design has
incorporated social or environmental concerns, risks and/or opportunities.
The Company is a leading automobile manufacturer of India and has played a significant role over the years in contributing to economic growth through its commercial vehicles and
Notice Board’s Report Management Discussion & Analysis Corporate Governance Report Business Responsibility Report
195

passenger cars which transport people, goods and help deliver services on time. The Company realizes its responsibility as a growth enabler and endeavors to create vehicles which will promote entrepreneurship. The Company is also cognizant of the environmental impacts caused during production and lifecycle of its products and continually strives to innovate to reduce such impacts. The Company has signed a contract to
Products Social or Environmental Benefits
Buses for Public Transport – Tata Starbus Fuel Cell, Tata Ultra Electric Bus
World’s first commercially produced CNG Hybrid Bus3 Times more fuel efficiency than GasolineEnsures 50% reduction in fuel consumptionFast refueling ensures reduced downtimeZERO Pollution, Zero Noise busBS IV compliant, CMVR (Central Motor Vehicles Rules), 1989 & UBS – II (Urban Bus Specification) norms
Small Commercial Vehicles (SCV) and Pickup range- Tata Xenon YODHA
Available in BSIII and BS IVBetter mileage, smart pick-up, reliable and rugged gearbox aids in better pick up in loaded conditions, ensuring lesser gearshifts.Additional strong suspension – 6-leaves at the front & 9-leaves at rear, ensures better safety in loaded conditions and at high speeds.Unique three-layered body construction, crumple zones, a collapsible steering column, retractable seatbelts and side intrusion beams, which will protect passengers in the event of a side impact collision.vehicle is fitted with antiroll bars for better stability in loaded conditions, at high speeds and off road conditions too
Passenger Cars –Utility Vehicle- HEXA Fuel and Emission norms - Diesel, BS IV Engine6 Airbags- absolute safety for every occupant.Hill Descent Control (HDC) for added safety.Perfect balance of power and mileage with optimized fuel utilization.Ice cube patterned Striking Daylight Running Lights (DRLs) integrated with fog lamps for added safety.ABS with Electronic Brake-force Distribution optimizes braking distance and warrants vehicle stability,SMOKED PROJECTOR HEADLAMPS- for focused illumination and better visibility.
2. For each such product, provide the following details in respect of resource use (energy, water, raw material etc.) per unit of product (optional):
(a) Reduction during sourcing/production/ distribution achieved since the previous year throughout the value chain?
In order to reduce the vehicular weight, the focus of the company is on the new and improved technologies so as to achieve higher fuel efficiency as well as it should reduce the environmental impact created by the vehicle, including its material sourcing, production, use and end-of-life stages. Also in order to reduce the fuel consumption, the Company focuses on researching, developing and producing new technologies, such as hybrid engines, electric cars, fuel-cell vehicles. Various
supply 25 nos. of the Tata Starbus Diesel Series Hybrid Electric Bus with Full Low floor configuration, with the Mumbai Metropolitan Region Development Authority (MMRDA) – the single largest order awarded for Hybrid Electric vehicle technology. Below are few of the products which have been designed to address social or environmental concerns, risks and/or opportunities.
development programs to reduce the consumption of fuel, like the use of lightweight materials, reducing parasitic losses through the driveline and improvements in aerodynamics are also studied and implemented by the Company. At the sourcing stage, the Company work with its suppliers in order to reduce the environmental impacts like, by making use of returnable and recyclable packing solutions for majority of the components thereby managing the cost and the quality, as well as reducing the material use and avoiding waste generation. Some key areas that the Company is currently exploring are the use of hollow camshafts, low density polyamides and magnesium alloys, in order to target the Product sustainability. The Company continuously strives to achieve the sustainability in the Life Cycle of the Product.
Corporate Overview Financial StatementsStatutory Reports
196 72nd Annual Report 2016-17

(b) Reduction during usage by consumers (energy, water) has been achieved since the previous year?
The class leading fuel efficiencies of the Company’s vehicles enable the customers to achieve fuel savings which translate into cost savings as well. The launch of all new REVOTRON engine which epitomizes the FuelNext philosophy of the Company is developed under Futuready philosophy of the Company. It is developed using a range of eco-friendly and future oriented technologies. It also incorporates latest know-how like multi drive modes, allowing the best of economy and driving pleasure. The Company’s value proposition in the commercial vehicles is aimed to create vehicles with lowest overall cost of ownership. The Recon business, which reconditions aggregates, extends the life of the aggregates and eliminates the use of fresh resources that might have been consumed for new aggregates.
3. Does the company have procedures in place for sustainable sourcing (including transportation)? If yes, what percentage of your inputs was sourced sustainably?
The Company continually works with its vendors and suppliers to reducing the environmental impacts of sourcing. The Company has an Environment Procurement Policy to engage with its value chain partners on environmental sustainability. Significant initiatives have been taken to reduce the packaging impacts in the supply chain by using recycled / returnable packaging solutions for various components sourced. Transportation and logistics optimization is an ongoing activity to reduce the related environmental impacts. The Pantnagar and Sanand plants have created a vendor park model, wherein the key vendors are situated surrounding the plant. This not only enables to optimize the production related costs but also significantly reduces the environmental impact of transportation of components.
4. Has the company taken any steps to procure goods and services from local & small producers, including communities surrounding their place of work? If yes, what steps have been taken to improve their capacity and capability of local and small vendors?
During the year, the Company has procured 50.88% of the materials (by value) from local sources, where local is defined as the State in which the manufacturing plant is established.
The Company takes significant initiatives in enhancing the capabilities of local and small vendors. Through the AA policy initiatives, this year the Company has added 5 new SC/ST entrepreneurs in the supply chain totaling to 27 in number and extended business of `10.99 crores to them.
To ensure reliable and responsible suppliers for automotive production and service parts, the Company expects all its suppliers to adopt the ISO 9001/TS 16949 quality management system frameworks. The Company also encourage its dealers to adopt quality, environmental and safety management systems.
The Company conducts awareness sessions for suppliers on social and environmental issues. Suppliers are provided with managerial and technical assistance to train them on practices and procedures that will ensure improvements in Productivity, Quality, Cost, Delivery, Safety, Moral and Environment (PQCDSME).
5. Does the company have a mechanism to recycle products and waste? If yes what is the percentage of recycling of products and waste (separately as <5%, 5-10%, >10%). Also, provide details thereof, in about 50 words or so.
It is the Company’s ongoing endeavor to have a mechanism to recycle its products and limit the waste arising out of production of vehicles. The Company has initiated well defined program Prolife. The Company’s objective is to reduce the waste and to minimize the need of raw materials to produce a brand new item. In Fiscal 2017, total of 24065 components were reconditioned. The re-conditioned long blocks are also being exported to international markets. Hazardous waste is disposed as per regulatory requirements through the Common Hazardous Waste Treatment, Storage & Disposal Facilities (CHWTSDF), Authorized Re-cyclers and co-processing in cement plants.
PRINCIPLE 3 Employee Wellbeing1. Please indicate the Total number of employees.
47,920 as at March 31, 2017 (includes permanent, temporary, trainee and contractual employees)
2. Please indicate the Total number of employees hired on temporary/ contractual/ casual basis. 21,885 as at March 31, 2017
3. Please indicate the Number of permanent women employees.
806 as at March 31, 2017
4. Please indicate the Number of permanent employees with disabilities
13 as at March 31, 2017
5. Do you have an employee association that is recognized by management?
The manufacturing plants at Jamshedpur, Pune, Lucknow, Pantnagar and Sanand have employee unions recognized by the management. The Company enters into long term wage settlements with these recognized unions.
6. What percentage of your permanent employees is members of this recognized employee association?
Around 94% of the operative employees at Jamshedpur, Pune, Lucknow, Pantnagar & Sanand plants are members of these employee unions. These employees represent around 52% of the total permanent employees at these five plants. The Company do not have an Employees Union at the Company’s Dharwad Plant presently.
Notice Board’s Report Management Discussion & Analysis Corporate Governance Report Business Responsibility Report
197

7. Please indicate the Number of complaints relating to child labour, forced labour, involuntary labour, sexual harassment in the last financial year and pending, as on the end of the financial year.
SN Category
No of complaints
filed during the financial year
No of complaints pending as
on end of the financial year
1 Child labour / forced labour / involuntary labour
- -
2 Sexual harassment 4 -3 Discriminatory
Employment- -
8. What percentage of your under mentioned employees were given safety & skill up-gradation training in the last year?
(a) Permanent Employees (b) Permanent Women Employees (c) Casual/Temporary/Contractual Employees (d) Employees with Disabilities Safety is of paramount importance to the Company. All
employees of the Company are provided with safety training as part of the induction programme. The safety induction programme is also a critical requirement for contract workforce before they are inducted into the system. The Company has a structured safety training agenda on an on-going basis to build a culture of safety across its workforce.
The Company believes in continual learning of its employees and has institutionalized a continual learning model for skill upgradation, especially at the shop-floor level. The learning and development needs of management cadre employees are met through the Company’s L&D structure which includes various training delivery mechanisms
Area Stakeholder (SC/ST community)Benefits
Education SC/ST students are also benefitted from the Company’s CSR Vidyadhanam programme in Fiscal 2017. The projects include IIT-JEE & competitive exams coaching; co-curricular activities; Financial Aid Program for Engineering Students at IIT Bombay; Scholarships for Secondary school students and Govt. Engineering College at Pune, School Infra Improvement and Special Coaching classes in Std. 8th, 9th and 10th.
Employability The programme has benefitted SC/ST youths across different locations in the country in Fiscal 2017. The skilling projects include: Novice Drivers Training, agriculture & allied training, ITI partnership & allied-auto trades; Motor Mechanic Vehicle (MMV) and Training in marketable trades such as Retail, Tally, White goods repair, etc.
Health In Fiscal 2017, more than 3.6 Lakh community members benefited from the Company’s health initiatives including those who inhabit rural/tribal areas.
PRINCIPLE 4: Stakeholder Engagement1. Has the company mapped its internal and external
stakeholders? Yes, the Company has mapped its internal and external
stakeholders. It uses both formal and informal mechanisms to engage with various stakeholders to understand their concerns and expectations. Individual departments within the organization have roles and responsibilities identified and defined to engage with various stakeholders.
2. Out of the above, has the company identified the disadvantaged, vulnerable & marginalized stakeholders?
Yes, the Company’s AA policy is specially designed to address the socially disadvantaged sections of the society, Scheduled Castes and Tribes. Within the broader stakeholder group of communities, the Company works towards women empowerment and education of children. Every year, the Company participate in TAAP (Tata Affirmative Action Program) Assessment, developed on the lines of TBEM (Tata Business Excellence Model).
3. Are there any special initiatives taken by the company to engage with the disadvantaged, vulnerable and marginalized stakeholders. If so, provide details thereof, in about 50 words or so.
The Company’s CSR programmes and projects are aimed at serving the needy, deserving, socio-economically backward and disadvantaged communities aimed at improving the quality of their lives. Under Tata Affirmative Action Programme (TAAP), the company continues to serve the SC and ST communities in inter alia Education, Employability and Entrepreneurship.
Corporate Overview Financial StatementsStatutory Reports
198 72nd Annual Report 2016-17

PRINCIPLE 5: Human Rights1. Does the policy of the company on human rights cover
only the company or extend to the Group/Joint Ventures/Suppliers/Contractors/NGOs/Others?
The Company respects human rights and has established a Policy on Human Rights. The policy details the Company’s approach towards human rights and sets the Company’s expectations of its Channel Partners and Contractors to adhere to principles of human rights. The Company encourage its suppliers, vendors, contractors and other business partners associated with the Company to follow the principles laid out in the Tata Code of Conduct.
2. How many stakeholder complaints have been received in the past financial year and what percent was satisfactorily resolved by the management?
During the year, 74 concerns have been received towards actual or potential violation of Tata Code of Conduct, of which 66 of the complaints were satisfactorily resolved as at March 31, 2017.
PRINCIPLE 6: Environmental1. Does the policy related to Principle 6 cover only the
company or extends to the Group/Joint Ventures/Suppliers/Contractors/NGOs/others.
Sustainability is built into the Company’s business processes through well-defined Tata Group’s Sustainability Policy. This policy reaffirms value system committed to social expenditure, environmental preservation and governance structure that engages employees and other stakeholders.
The Company also has Environmental Procurement Policy which is applicable to all its vendors, contractors and service providers.
2. Does the company have strategies/initiatives to address global environmental issues such as climate change, global warming, etc.? Y/N. If yes, please give hyperlink for webpage etc.
Yes, the Company has adopted Tata Group’s Climate Change policy to guide the organizational efforts towards mitigating and adapting to climate change. The Company approach towards climate change mitigation and pursuing low carbon growth is three-fold – develop cleaner and more fuel efficient vehicles, reduce environmental impacts of manufacturing operations and build awareness among stakeholders. It has also continually working on alternate fuel technologies like electric vehicles, hybrid vehicles and fuel cell technologies.
The Tata group became part of the Prime Minister’s low carbon committee and was a member in the steering committee of the ‘Caring for Climate’ initiative of the United Nations Global Compact and United Nations Environment Programme. Ahead of the crucial global climate change talks that concluded in Paris, global corporate leaders signed an open letter on climate change.
3. Does the company identify and assess potential environmental risks? Y/N
Yes, the Company has an Environmental Policy which guides the Company’s efforts to manage its environmental impacts and continually improve its environmental performance. All manufacturing plants in India are certified to ISO 14001 Environmental Management Systems (EMS) standard. As part of EMS implementation, potential environmental risks are identified and appropriate mitigation strategies are planned.
4. Does the company have any project related to Clean Development Mechanism? If so, provide details thereof, in about 50 words or so. Also, if yes, whether any environmental compliance report is filed?
None of the Company’s plants have undertaken Clean Development Mechanism projects during the Fiscal 2017.
5. Has the company undertaken any other initiatives on - clean technology, energy efficiency, renewable energy, etc.? Y/N. If yes, please give hyperlink for web page etc.
In Fiscal 2017, the Company continued to work on improving energy efficiency, introduction of clean technology and increasing its renewable energy consumption in line with its commitment to RE100 which is a collaborative, global initiative of influential businesses committed to 100% renewable electricity for operations.
As at March 31, 2017, the Company installed capacity for RE (wind and solar) generation includes:
• 21.95 MW Captive Wind Power project at Supa and Satara in Maharashtra;
• 2 MW Roof-top Solar PV plant at Sanand Works; • 1.8 MW Roof-top Solar PV plant at Pune Works; • 25 kWp Solar PV Plant at Lucknow Works; • 18.5 kWp Solar PV Plant at Pant Nagar Works; and • 7.2 kW hybrid wind and solar energy system at Dharwad Works. The Company source off site wind power at its Pune, Sanand
and Dharwad Works through Power Purchase Agreements (PPA) with Third Party Wind Power Generators. The Company will continue to source renewable electricity from grid in line with favorable regulatory policies / frameworks and tariffs in the States where it operates.
In Fiscal 2017, the Company generated / sourced a total of 75,703 MWh of renewable electricity for its manufacturing operations. Further, the Company carried out significant Energy Conservation projects across its manufacturing plants and offices.
• Pune Plants made progress on energy efficient lighting by replacing around 6,000 fluorescent tube-lights with energy efficient LED tube-lights. Also, nine high masts fitted with conventional sodium-vapor lamps were replaced with LED fittings. All light fittings in offices and shops, are being progressively replaced with LED fixtures.
Notice Board’s Report Management Discussion & Analysis Corporate Governance Report Business Responsibility Report
199

• Jamshedpur and Pantnagar Plant also made progress on energy efficient LED lighting by installing around 2,500 and 1,325 energy efficient LED lights respectively in areas such as streetlights, vehicle storage pads, office and Shop floor areas.
• In addition, Jamshedpur also installed 20 light pipes to harness natural day light in manufacturing areas.
• Lucknow Plant implemented Waste Heat Recovery System for Ovens and SCADA Control for high bay lights and man coolers in Paint Shop.
Please refer Annexure to Board’s Report of the Company Annual Report Fiscal 2017, ‘Energy and Climate Change’ and ‘Environmental Stewardship’ sections of the Tata Motors Sustainability Report 2016-17 for details on the Company’s energy efficiency and cleaner production initiatives.
6. Are the Emissions/Waste generated by the company within the permissible limits given by CPCB/SPCB for the financial year being reported?
The Company is in compliance within the prescribed permissible limits as per CPCB/SPCB for air emissions, effluent quality and discharge, solid and hazardous waste generation and disposal.
7. Number of show cause/ legal notices received from CPCB/SPCB which are pending (i.e. not resolved to satisfaction) as on end of Financial Year.
There is no show cause /legal notice pending resolution by CPCB/SPCB.
PRINCIPLE 7: Policy Advocacy1. Is your company a member of any trade and chamber or
association? If Yes, Name only those major ones that your business deals with:
The Company is member of various trade and chamber associations:
1) The Company actively participate in all WP29 UNECE group activities.
2) The Company also participate in the following National Committees which are working on formulating policies and regulations for improvement of environment including GHG reduction throughout the country;
I. Standing Committee on Emissions (SCOE) II. Sub-committee on CO emission norms of Union Ministry
of Shipping, Road Transport and Highways of India, along with Automotive Research Association of India (ARAI).
III. Expert committee to define “Heavy Duty Vehicle Fuel Economy Norms for India under Ministry of Shipping, Road Transport and Highways of Government of India (GoI) & Petroleum Conservation Research Association (PCRA).
IV. Expert committee on Fuel Economy Labeling of Passenger Cars under Bureau of Energy Efficiency under Ministry of Power (GoI).
V. Interministerial committee for upcoming emission norms (BSV,BSVI) for Motor Vehicles of Ministry of Shipping, Road Transport and Highways, Ministry of Heavy Industries, Ministry of Petroleum & Natural Gas (GoI).
VI. Working group on Quadricycle Emission Norms for India. VII. Ministry of New & Renewable Energy, GoI, is promoting
and assisting technology development for GHG reduction by way of increased usage of Biodiesel. The Company is engaged in this initiative of GoI and currently running number of engine and vehicle programs to commercialize usage of Biodiesel as soon as the same is made available to the general public by oil marketing companies.
VIII. Working Group on Energy for Sub-Group on DST’s XIIth plan on Technology Development Program (TDP).
IX. National Electric Mobility Mission Plan - The Company has been actively participating in forming hybrid performance criteria along with SIAM-FTG group and helped government to launch FAME scheme. Now the Company is building two types of hybrid and electric vehicles under Technical Advisor Group under R&D scheme.
2. Have you advocated/lobbied through above associations for the advancement or improvement of public good? Yes/No; if yes specify the broad areas (drop box: Governance and Administration, Economic Reforms, Inclusive Development Policies, Energy security, Water, Food Security, Sustainable Business Principles, Others)
The Company, through various industry associations, participates in advocating matters advancement of the industry and public good. It supports various initiatives of the SIAM which include aspects of product safety, alternate fuel vehicles, environment, fuel policies, customer information and education, to name a few. The Company’s AA policy is a progressive step towards inclusive development.
PRINCIPLE 8 : Inclusive Growth1. Does the company have specified programmes/initiatives/
projects in pursuit of the policy related to Principle 8? If yes details thereof.
Inclusive growth is at the core of the Company’s community development strategy. Ankur, the Company’s community engagement strategy, is percolated to each manufacturing plant through a detailed community development plan. The plant specific plan addresses the local needs and the corporate cell drives some company-wide strategic community development initiatives such as driver training. The initiatives primarily focus on Arogya (Health), Vidyadhanam (Education), Kaushalya (Employability) and Vasundhara (Environment). Seva, the employee volunteering initiative provides the Company’s employees with a platform to be a part of its community initiatives. The Company along with its employees also supports Sumant Moolgaonkar Development Foundation (SMDF)
Corporate Overview Financial StatementsStatutory Reports
200 72nd Annual Report 2016-17

towards implementing Amurtdhara, a National Drinking Water Project to provide safe drinking water to communities. Through adoption of Tata Group Affirmative Action (AA) Policy, the Company works toward inclusion of socially disadvantaged and marginalized sections of society (Scheduled Castes and Scheduled Tribes). The AA interventions focus on Education, Health, Employability and Entrepreneurship.
Please refer the Company’s ‘Annual CSR Report 2016-17’ and ‘Community Development’ section of Tata Motors Sustainability
Area Partners InvolvedEducation Action Aid, Agastya International Foundation, Avanti Fellows, Block Resource Centre EDUCATION DEPT.(SSA),
CATHEDRAL CHURCH SANAND, Center for Youth Development & Activities, Children’s Movement for Civic Awareness,
College of Engineering Pune, GANATAR, Global Education Trust, Gram Vikas Kendra, IIT Bombay Alumni Association,
Manav Seva Education Trust, Moinee Foundation, Nav Jagrat Manav Samaj, Paryawaran Evam Jan Kalyan Samiti, Rotary
Club of Nigdi, Samaj Vikas Kendra, Samata Shikshan Sanstha, SANAND LIONS FOUNDATION TRUST, Seva Sahyog
Foundation, Shanti Seva Nidhi Trust, Shiksha Prasar Kendra, SHRI SHAKTI KELAVNI UTTEJAK TRUST, Society for Human
Environmental Development, Suprabhat Mahila Mandal, Swami Vivekananda Youth Movement, Swaroopwardhinee,
Tata Institute of Social Sciences, Tata Motors Gruhini Social Welfare Society, The Jai Narayan Charitable Trust, Urmee
Charitable Trust, Vidya Poshak, Vikas SamitiesEmployability Ahmedabad Dist. Cooperative Milk Producers Union Ltd, Ambika Motor Driving School, Centre for Civil Society, CII,
Gram Vikas Kendra, LAURUS EDUTECH LIFE SKILLS PVT LTD, Manikbag Automobile Pvt Ltd, MITCON Foundation,
Paryawaran Evam Jan Kalyan Samiti, Prasad Chikitsa, Pratham Education Foundation, Ramkrishna Mission Sakwar,
Samaj Vikas Kendra, Sambhav Foundation, SANAND EDUCATION TRUST, Shashwat, Skill For Progress, SUVIDHA, Vedanta
Foundation, Vigyan Ashram (IIE), Vikas SamitiesHealth Action Aid, CHETNA, Family Planning Association of India, Gram Vikas Kendra, Jan Parivar Kalyan Sansthan, Manav Seva
Education Trust, NAMASTE LIFE, Nav Jagrat Manav Samaj, Parivar Kalyan Sansthan, Paryawaran Evam Jan Kalyan Samiti,
Prasad Chikitsa, Seth G S Medical College and KEM Hospital, Sneh Foundation, Snehdeep Jankalyan Foundation,
Sumant Moolgaonkar Development Foundation, Sterling Hospital, Swadhar, Vikas SamitiesEnvironment Bansilal Ramntath Agarwal Charitable Trust, Bombay Natural History Society, COLLEGE OF SOCIAL WORK (NIRMALA
NIKETAN INSTITUTE), GANATAR, Gram Vikas Kendra, Green Thumb, Manav Seva Education Trust, Paryawaran Evam Jan
Kalyan Samiti, Samaj Vikas Kendra, Sarvodhaya Maha Sangh, Terre Policy Center, Tree Public Foundation, Vikas Samities,
Wildlife Research and Conservation Society
Report FY 2016-17 for detailed community engagement strategy and key initiatives.
2. Are the programmes/projects undertaken through in-house team/own foundation/external NGO/government structures/any other organization?
CSR Programmes and Projects are deployed by company: directly; through its own company-promoted societies/NGOS; partnering with government and collaborating with reputed, external non-profit organizations under different models
Please refer the Company’s ‘Annual CSR Report 2016-17’ and ‘Community Development’ section of Tata Motors Sustainability Report 2016-17 for details on various community development programme partnerships.
3. Have you done any impact assessment of your initiative? Yes. The Company has adopted ‘Tata CS Protocol’ to assess
the impact of the various community interventions. Periodic impact assessments are conducted and the outcome forms a critical input to the community development plan preparation and implementation.
Please refer the Company’s ‘Annual CSR Report 2016-17’ and ‘Community Development’ section of Tata Motors Sustainability Report 2016-17 for details on community impacts created and assessed
4. What is your company’s direct contribution to community development projects- Amount in INR and the details of the projects undertaken?
Total expenditure reported is `25.94 crores. The details of projects:1. Arogya (Health) build awareness on malnourishment and
other health problems in the community, provides ferry mobile medical van to look into curative and preventive health care.
2. Vidyadhanam (Education) supporting for infrastructure, skills development, training and Institutionalized need based scholarships.
3. Kaushalya (Employability) Industrial Training to school dropout youth in auto sector, non-auto trades, agriculture and allied activities.
4. Vasundhara (Environment) large scale sapling plantation,
Notice Board’s Report Management Discussion & Analysis Corporate Governance Report Business Responsibility Report
201

construction of water conservation structures and building awareness about environment and renewable energy sources.
Please refer to the Company’s Annual CSR Report and ‘Community Development’ section of Tata Motors Sustainability Report 2016-17 for details on various community development programmes undertaken.
5. Have you taken steps to ensure that this community development initiative is successfully adopted by the community? Please explain in 50 words, or so.
Yes, the Company adopts a collaborative and participatory approach with communities/beneficiaries in conceiving and deploying CSR projects. Partial beneficiary contribution is sought, wherever feasible, for project deployment / asset creation, maintenance for them to have greater ownership of the projects - which the Company believes is crucial for sustainability of its initiatives. Training and capacity building of communities and relevant stakeholders to successfully adopt & carry forward these initiatives is done from time to time.
Please refer the Company’s Annual CSR Report and ‘Community Development’ section of Tata Motors Sustainability Report 2016-17 for details on various community development programme implementation models.
PRINCIPLE 9: Customer Value1. What percentage of customer complaints/consumer cases
are pending as on the end of financial year. The Company provides customers with the best in class after
sales service. The Company hear its customers through various mediums such as 24X7 Call center toll free no, website.
The Company’s Servicerests on three core ‘Service Promises’ – ‘Responsive’, ‘Reliable’ and ‘Best value’. A host of distinctive facilities and services are being offered to deliver each of these promises to customers in the Company’s nationwide service network.
Passenger Vehicle
Business Unit
Commercial Vehicle
Business UnitTotal
Percentage of Consumer Cases Pending as at March 31, 2017
0.45 0.14 0.16
2. Does the company display product information on the product label, over and above what is mandated as per local laws? Yes/No/N.A./ Remarks (additional information)
The Company displays all the requisite product information and safety guidance on the product label as required by the local laws. Over and above the mandatory requirements, the Company also subscribes to guidance by SIAM (Society of Indian Automobile Manufacturers) of various customer
information requirements such as the Fuel Economy Customer Information. The vehicle manual is an important source of information for customers which contains product information, safety guidance, customer support details and tips on efficient use of the vehicle.
3. Is there any case filed by any stakeholder against the company regarding unfair trade practices, irresponsible advertising and/or anti-competitive behavior during the last five years and pending as on end of financial year. If so, provide details thereof, in about 50 words or so
There have been no cases relating to unfair trade practices, irresponsible advertising and/or anti-competitive behavior against the Company in the last five years.
4. Did your company carry out any consumer survey/ consumer satisfaction trends?
The Company’s new Hozionext philosophy puts customer at the core of the business strategy. Customer engagement processes have been aligned across the value chain to monitor customer satisfaction and feedback. Regular customer satisfaction surveys are conducted to assess customer satisfaction levels and benchmark the Company’s performance with industry peers. The Passenger Vehicle business uses globally renowned J.D.Power survey scores to assess overall customer satisfaction and benchmark with industry peers. The Commercial Vehicle business conduct customer satisfaction survey (eQ scores) through External Agency AC Nielsen every year. The eQ i.e. CEI scores conducted by AC Nielsen are in line with the Company’s internal satisfaction scores.
Corporate Overview Financial StatementsStatutory Reports
202 72nd Annual Report 2016-17

F-1
INDEPENDENT AUDITOR’S REPORT
TO THE MEMBERS OF TATA MOTORS LIMITEDReport on the Standalone Ind AS Financial Statements
We have audited the accompanying standalone Ind AS financial statements of Tata Motors Limited (“the Company”), which comprise the Balance Sheet as at March 31, 2017, the Statement of Profit and Loss (including Other Comprehensive Income), the Cash Flow Statement and the Statement of Changes in Equity for the year then ended, and a summary of the significant accounting policies and other explanatory information, which includes two Joint Operation Companies on a proportionate basis.
Management’s Responsibility for the Standalone Ind AS Financial StatementsThe Company’s Board of Directors is responsible for the matters stated in Section 134(5) of the Companies Act, 2013 (“the Act”) with respect to the preparation of these standalone Ind AS financial statements that give a true and fair view of the financial position, financial performance including other comprehensive income, cash flows and changes in equity of the Company including its Joint Operation Companies in accordance with the accounting principles generally accepted in India, including the Indian Accounting Standards (Ind AS) prescribed under Section 133 of the Act.
The respective Boards of Directors of the Company and its Joint Operation Companies are responsible for maintenance of adequate accounting records in accordance with the provisions of the Act for safeguarding the assets of the Company and its Joint Operation Companies and for preventing and detecting frauds and other irregularities; selection and application of appropriate accounting policies; making judgments and estimates that are reasonable and prudent; and design, implementation and maintenance of adequate internal financial controls, that were operating effectively for ensuring the accuracy and completeness of the accounting records, relevant to the preparation and presentation of the standalone Ind AS financial statements that give a true and fair view and are free from material misstatement, whether due to fraud or error.
Auditor’s ResponsibilityOur responsibility is to express an opinion on these standalone Ind AS financial statements based on our audit.
In conducting our audit, we have taken into account the provisions of the Act, the accounting and auditing standards and matters which are required to be included in the audit report under the provisions of the Act and the Rules made thereunder.
We conducted our audit of the standalone Ind AS financial statements in accordance with the Standards on Auditing specified under Section 143(10) of the Act. Those Standards require that we comply with ethical requirements and plan and perform the audit to obtain reasonable assurance about whether the standalone Ind AS financial statements are free from material misstatement.
An audit involves performing procedures to obtain audit evidence about the amounts and the disclosures in the standalone Ind AS financial statements. The procedures selected depend on the auditor’s judgment, including the assessment of the risks of material misstatement of the standalone Ind AS financial statements, whether due to fraud or error. In making those risk assessments, the auditor considers internal financial control relevant to the Company’s preparation of the standalone Ind AS financial statements that give a true and fair view in order to design audit procedures that are appropriate in the circumstances. An audit also includes evaluating the appropriateness of the accounting policies used and the reasonableness of the accounting estimates made by the Company’s Directors, as well as evaluating the overall presentation of the standalone Ind AS financial statements.
We believe that the audit evidence obtained by us is sufficient and appropriate to provide a basis for our audit opinion on the standalone Ind AS financial statements.
OpinionIn our opinion and to the best of our information and according to the explanations given to us, the aforesaid standalone Ind AS financial statements give the information required by the Act in the manner so required and give a true and fair view in conformity with the accounting principles generally accepted in India, of the state of affairs of the Company as at March 31, 2017, and its loss, total comprehensive loss, its cash flows and the changes in equity for the year ended on that date.
Report on Other Legal and Regulatory Requirements1. As required by Section 143(3) of the Act, based on our audit, we report to the extent applicable that:
a) We have sought and obtained all the information and explanations which to the best of our knowledge and belief were necessary for the purposes of our audit.
b) In our opinion, proper books of account as required by law have been kept by the Company and its Joint Operation Companies so far as it appears from our examination of those books.
c) The Balance Sheet, the Statement of Profit and Loss including Other Comprehensive Income, the Cash Flow Statement and Statement of Changes in Equity dealt with by this Report are in agreement with the relevant books of account.

Statutory ReportsCorporate Overview Financial Statements
F-2
(Standalone)
72nd Annual Report 2016-17
d) In our opinion, the aforesaid standalone Ind AS financial statements comply with the Indian Accounting Standards prescribed under Section 133 of the Act.
e) On the basis of the written representations received from the directors of the Company as on March 31, 2017 taken on record by the Board of Directors of the Company and the reports of the statutory auditors of its Joint Operation companies, none of the directors of the Company and its Joint Operation Companies are disqualified as on March 31, 2017 from being appointed as a director in terms of Section 164(2) of the Act.
f ) With respect to the adequacy of the internal financial controls over financial reporting of the Company and its joint operations which are companies incorporated in India and the operating effectiveness of such controls, refer to our separate Report in “Annexure A”. Our report expresses an unmodified opinion on the adequacy and operating effectiveness of the Company’s and its Joint Operation Companies’, internal financial controls over financial reporting.
g) With respect to the other matters to be included in the Auditor’s Report in accordance with Rule 11 of the Companies (Audit and Auditors) Rules, 2014, as amended, in our opinion and to the best of our information and according to the explanations given to us:
i. The Company has disclosed the impact of pending litigations on its financial position in its standalone Ind AS financial statements; ii. The Company has made provision, as required under the applicable law or accounting standards, for material foreseeable losses, if any,
on long-term contracts including derivative contracts; iii. There have been no delays in transferring amounts, required to be transferred to the Investor Education and Protection Fund by the
Company; iv. The Company has provided requisite disclosures in the standalone Ind AS financial statements as regards the Company’s and its Joint
Operation Companies’, holding and dealings in Specified Bank Notes as defined in the Notification S.O. 3407(E) dated November 8, 2016 of the Ministry of Finance, during the period from November 8, 2016 to December 30, 2016. However, as stated in Note No. 47 (ii) to the financial statements amounts aggregating to R79,500 /- as represented to us by the Management have been received from transactions which are not permitted.
2. As required by the Companies (Auditor’s Report) Order, 2016 (“the Order”) issued by the Central Government in terms of Section 143(11) of the Act, we
give in “Annexure B” a statement on the matters specified in paragraphs 3 and 4 of the Order.
For DELOITTE HASKINS & SELLS LLPChartered Accountants
(Firm Registration No. 117366W/W-100018)
B. P. SHROFFPartner
Mumbai, May 23, 2017 (Membership No. 34382)

F-3
ANNEXURE “A” TO THE INDEPENDENT AUDITOR’S REPORT
(Referred to in paragraph 1(f) under ‘Report on Other Legal and Regulatory Requirements’ section of our report of even date to the Members of Tata
Motors Limited)
Report on the Internal Financial Controls Over Financial Reporting under Clause (i) of Sub-section 3 of Section 143 of the Companies Act, 2013 (“the Act”)
We have audited the internal financial controls over financial reporting of TATA MOTORS LIMITED (“the Company”) as of March 31, 2017 in conjunction with our audit of the standalone Ind AS financial statements of the Company for the year ended on that date which includes internal financial controls over financial reporting of the Company’s Joint Operations which are companies incorporated in India.
Management’s Responsibility for Internal Financial ControlsThe respective Boards of Directors of the Company and its Joint Operation Companies incorporated in India are responsible for establishing and maintaining internal financial controls based on the internal control over financial reporting criteria established by the respective companies considering the essential components of internal control stated in the Guidance Note on Audit of Internal Financial Controls Over Financial Reporting issued by the Institute of Chartered Accountants of India. These responsibilities include the design, implementation and maintenance of adequate internal financial controls that were operating effectively for ensuring the orderly and efficient conduct of its business, including adherence to respective company’s policies, the safeguarding of its assets, the prevention and detection of frauds and errors, the accuracy and completeness of the accounting records, and the timely preparation of reliable financial information, as required under the Companies Act, 2013.
Auditor’s ResponsibilityOur responsibility is to express an opinion on the internal financial controls over financial reporting of the Company and its Joint Operation Companies incorporated in India based on our audit. We conducted our audit in accordance with the Guidance Note on Audit of Internal Financial Controls Over Financial Reporting (the “Guidance Note”) issued by the Institute of Chartered Accountants of India and the Standards on Auditing prescribed under Section 143(10) of the Companies Act, 2013, to the extent applicable to an audit of internal financial controls. Those Standards and the Guidance Note require that we comply with ethical requirements and plan and perform the audit to obtain reasonable assurance about whether adequate internal financial controls over financial reporting was established and maintained and if such controls operated effectively in all material respects.
Our audit involves performing procedures to obtain audit evidence about the adequacy of the internal financial controls system over financial reporting and their operating effectiveness. Our audit of internal financial controls over financial reporting included obtaining an understanding of internal financial controls over financial reporting, assessing the risk that a material weakness exists, and testing and evaluating the design and operating effectiveness of internal control based on the assessed risk. The procedures selected depend on the auditor’s judgement, including the assessment of the risks of material misstatement of the financial statements, whether due to fraud or error.
We believe that the audit evidence we have obtained, is sufficient and appropriate to provide a basis for our audit opinion on the internal financial controls system over financial reporting of the Company and its Joint Operation Companies incorporated in India.
Meaning of Internal Financial Controls Over Financial ReportingA company’s internal financial control over financial reporting is a process designed to provide reasonable assurance regarding the reliability of financial reporting and the preparation of financial statements for external purposes in accordance with generally accepted accounting principles. A company’s internal financial control over financial reporting includes those policies and procedures that (1) pertain to the maintenance of records that, in reasonable detail, accurately and fairly reflect the transactions and dispositions of the assets of the company; (2) provide reasonable assurance that transactions are recorded as necessary to permit preparation of financial statements in accordance with generally accepted accounting principles, and that receipts and expenditures of the company are being made only in accordance with authorisations of management and directors of the company; and (3) provide reasonable assurance regarding prevention or timely detection of unauthorised acquisition, use, or disposition of the company’s assets that could have a material effect on the financial statements.
Inherent Limitations of Internal Financial Controls Over Financial ReportingBecause of the inherent limitations of internal financial controls over financial reporting, including the possibility of collusion or improper management override of controls, material misstatements due to error or fraud may occur and not be detected. Also, projections of any evaluation of the internal financial controls over financial reporting to future periods are subject to the risk that the internal financial control over financial reporting may become inadequate because of changes in conditions, or that the degree of compliance with the policies or procedures may deteriorate.

Statutory ReportsCorporate Overview Financial Statements
F-4
(Standalone)
72nd Annual Report 2016-17
OpinionIn our opinion, to the best of our information and according to the explanations given to us, the Company and its Joint Operation Companies have, in all material respects, an adequate internal financial controls system over financial reporting and such internal financial controls over financial reporting were operating effectively as at March 31, 2017, based on the internal control over financial reporting criteria established by the Company and its Joint Operation Companies considering the essential components of internal control stated in the Guidance Note on Audit of Internal Financial Controls Over Financial Reporting issued by the Institute of Chartered Accountants of India.
For DELOITTE HASKINS & SELLS LLPChartered Accountants
(Firm Registration No.117366W / W-100018)
B.P. SHROFFPartner
Mumbai, May 23, 2017 (Membership No. 34382)

F-5
(Referred to in paragraph 2 under “Report on Other Legal and Regulatory Requirements” section of our report of even date to the Members of Tata Motors Limited)
(i) In respect of its property, plant and equipment:
(a) The Company has maintained proper records showing full particulars, including quantitative details and situation of property, plant and equipment.
(b) The property, plant and equipment were physically verified during the year by the Management in accordance with a regular programme of verification which, in our opinion, provides for physical verification of all the property, plant and equipment at reasonable intervals. According to the information and explanations given to us, no material discrepancies were noticed on such verification.
(c) According to the information and explanations given to us, the records examined by us and based on the examination of the registered sale deed /transfer deed /conveyance deed /confirmation from custodians /court orders approving schemes of arrangements /amalgamations provided to us, we report that, the title deeds, comprising all the immovable properties of land and buildings which are freehold, are held in the name of the Company as at the balance sheet date. In respect of immovable properties that have been taken on lease and disclosed as property, plant and equipment in the financial statements, the lease agreements are in the name of the Company, where the Company is the lessee in the agreement.
(ii) As explained to us, the stock of finished goods and work-in-progress in the Company’s custody have been physically verified by the Management as at the end of the financial year, before the year-end or after the year-end, other than a significant part of the spare parts held for sale, and raw materials in the Company’s custody for both of which, there is a perpetual inventory system and a substantial portion of the stocks have been verified during the year. In our opinion, the frequency of verification is reasonable. In case of materials and spare parts held for sale lying with third parties, certificates confirming stocks have been received periodically for stocks held during the year and for a substantial portion of such stocks held at the year-end.
(iii) According to the information and explanations given to us, the Company has granted loans, secured or unsecured, to companies, firms, or other parties covered in the Register maintained under Section 189 of the Companies Act, 2013, in respect of which:
(a) The terms and conditions of the grant of such loans are, in our opinion, prima facie, not prejudicial to the Company’s interest.
(b) The schedule of repayment of principal and payment of interest has been stipulated and repayments or receipts of principal amounts and interest have been regular as per stipulations.
(c) There is no amount overdue for more than 90 days at the balance sheet date.
(iv) In our opinion and according to the information and explanations given to us, the Company has complied with the provisions of Sections 185 and 186 of the Companies Act, 2013 in respect of grant of loans, making investments and providing guarantees and securities, as applicable.
(v) According to the information and explanations given to us, the Company has not accepted any deposit during the year. In respect of unclaimed deposits, the Company has complied with the provisions of Sections 73 to 76 or any other relevant provisions of the Companies Act, 2013.
(vi) The maintenance of cost records has been specified by the Central Government under Section 148(1) of the Companies Act, 2013 in respect of its products. We have broadly reviewed the cost records maintained by the Company pursuant to the Companies (cost records and audit) Rules, 2014 and amended Companies (cost records and audit) Amendment Rules, 2016 as prescribed by the Central Government under sub-section (1) of Section 148 of the Companies Act, 2013, and are of the opinion that prima facie, the prescribed cost records have been made and maintained. We have, however, not made a detailed examination of the cost records with a view to determine whether they are accurate or complete.
(vii) According to the information and explanations given to us, in respect of statutory dues:
(a) The Company has generally been regular in depositing undisputed statutory dues, including Provident Fund, Employees’ State Insurance, Income-tax, Sales Tax, Service Tax, Customs Duty, Excise Duty, Cess and other material statutory dues applicable to it with the appropriate authorities. We are informed by the Company that the Employees’ State Insurance Act, 1948 is applicable only to certain locations of the Company. With regard to the contribution under the Employees’ Deposit Linked Insurance Scheme, 1976 (the Scheme), we are informed that the Company has sought exemption from making contribution to the Scheme since it has its own Life Cover Scheme. The Company has made an application on March 28, 2017 seeking an extension of exemption from contribution to the Scheme for a period of 3 years which is awaited.
ANNEXURE ‘‘B’’ TO THE INDEPENDENT AUDITOR’S REPORT
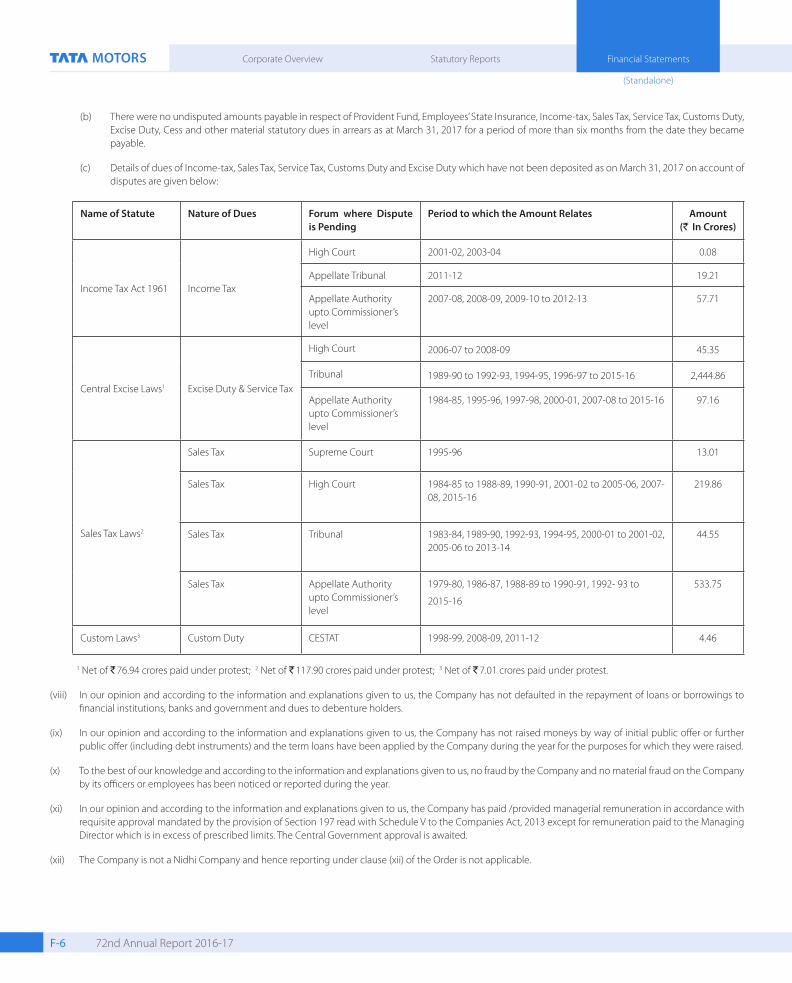
Statutory ReportsCorporate Overview Financial Statements
F-6
(Standalone)
72nd Annual Report 2016-17
(b) There were no undisputed amounts payable in respect of Provident Fund, Employees’ State Insurance, Income-tax, Sales Tax, Service Tax, Customs Duty, Excise Duty, Cess and other material statutory dues in arrears as at March 31, 2017 for a period of more than six months from the date they became payable.
(c) Details of dues of Income-tax, Sales Tax, Service Tax, Customs Duty and Excise Duty which have not been deposited as on March 31, 2017 on account of disputes are given below:
Name of Statute Nature of Dues Forum where Dispute is Pending
Period to which the Amount Relates Amount (R In Crores)
Income Tax Act 1961 Income Tax
High Court 2001-02, 2003-04 0.08
Appellate Tribunal 2011-12 19.21
Appellate Authority upto Commissioner’s level
2007-08, 2008-09, 2009-10 to 2012-13 57.71
Central Excise Laws1 Excise Duty & Service Tax
High Court 2006-07 to 2008-09 45.35
Tribunal 1989-90 to 1992-93, 1994-95, 1996-97 to 2015-16 2,444.86
Appellate Authority upto Commissioner’s level
1984-85, 1995-96, 1997-98, 2000-01, 2007-08 to 2015-16 97.16
Sales Tax Laws2
Sales Tax Supreme Court 1995-96 13.01
Sales Tax High Court 1984-85 to 1988-89, 1990-91, 2001-02 to 2005-06, 2007-08, 2015-16
219.86
Sales Tax Tribunal 1983-84, 1989-90, 1992-93, 1994-95, 2000-01 to 2001-02, 2005-06 to 2013-14
44.55
Sales Tax Appellate Authority upto Commissioner’s level
1979-80, 1986-87, 1988-89 to 1990-91, 1992- 93 to
2015-16
533.75
Custom Laws3 Custom Duty CESTAT 1998-99, 2008-09, 2011-12 4.46
1 Net of R76.94 crores paid under protest; 2 Net of R117.90 crores paid under protest; 3 Net of R7.01 crores paid under protest.
(viii) In our opinion and according to the information and explanations given to us, the Company has not defaulted in the repayment of loans or borrowings to financial institutions, banks and government and dues to debenture holders.
(ix) In our opinion and according to the information and explanations given to us, the Company has not raised moneys by way of initial public offer or further public offer (including debt instruments) and the term loans have been applied by the Company during the year for the purposes for which they were raised.
(x) To the best of our knowledge and according to the information and explanations given to us, no fraud by the Company and no material fraud on the Company by its officers or employees has been noticed or reported during the year.
(xi) In our opinion and according to the information and explanations given to us, the Company has paid /provided managerial remuneration in accordance with requisite approval mandated by the provision of Section 197 read with Schedule V to the Companies Act, 2013 except for remuneration paid to the Managing Director which is in excess of prescribed limits. The Central Government approval is awaited.
(xii) The Company is not a Nidhi Company and hence reporting under clause (xii) of the Order is not applicable.

F-7
(xiii) In our opinion and according to the information and explanations given to us, the Company is in compliance with Section 177 and 188 of the Companies Act, 2013, where applicable, for all transactions with the related parties and the details of related party transactions have been disclosed in the financial statements etc. as required by the applicable accounting standards.
(xiv) During the year the Company has not made any preferential allotment or private placement of shares or fully or partly convertible debentures and hence reporting under clause (xiv) of the Order is not applicable to the Company.
(xv) In our opinion and according to the information and explanations given to us, during the year the Company has not entered into any non-cash transactions with its directors or directors of its holding, subsidiary or associate company or persons connected with them and hence provisions of Section 192 of the Companies Act, 2013 are not applicable.
(xvi) The Company is not required to be registered under Section 45-I of the Reserve Bank of India Act, 1934.
For DELOITTE HASKINS & SELLS LLPChartered Accountants
(Firm Registration No.117366W / W-100018)
B.P. SHROFFPartner
Mumbai, May 23, 2017 (Membership No. 34382)

Statutory ReportsCorporate Overview Financial Statements
F-8
(Standalone)
72nd Annual Report 2016-17
BALANCE SHEET (R in crores)
Note As at March 31, 2017
As at March 31, 2016
As at April 1, 2015
I. ASSETS1. NON-CURRENT ASSETS
(a) Property, plant and equipment 3 17,364.77 17,573.25 17,389.90 (b) Capital work-in-progress 1,870.93 1,557.95 1,516.91 (c) Goodwill 99.09 99.09 99.09 (d) Other intangible assets 5 2,773.69 3,403.47 3,221.45 (e) Intangible assets under development 5,366.03 4,128.58 3,841.00 (f ) Investments in subsidiaries, joint ventures and associates 6 14,778.87 14,590.41 14,581.90 (g) Financial assets
(i) Investments 8 528.37 627.07 626.26 (ii) Loans and advances 10 389.61 252.93 310.73 (iii) Other financial assets 12 196.32 102.92 158.60
(h) Non-current tax assets (net) 724.58 799.63 647.24 (i) Other non-current assets 14 1,856.28 1,679.01 1,612.76
45,948.54 44,814.31 44,005.84
2. CURRENT ASSETS(a) Inventories 16 5,504.42 5,117.92 5,019.46 (b) Investments in subsidiaries, joint ventures and associates 7 - - 15.54 (c) Financial assets
(i) Investments 9 2,400.92 1,745.84 4.68 (ii) Trade receivables 17 2,128.00 2,045.58 1,448.39 (iii) Cash and cash equivalents 19 188.39 427.07 1,066.47 (iv) Bank balances other than (iii) above 20 97.67 361.35 83.94 (v) Loans and advances 11 231.35 484.44 342.58 (vi) Other financial assets 13 100.76 125.20 40.47
(d) Current tax assets (net) 129.49 3.84 106.62 (e) Other current assets 15 1,807.06 1,550.45 1,345.91
12,588.06 11,861.69 9,474.06 TOTAL ASSETS 58,536.60 56,676.00 53,479.90
II. EQUITY AND LIABILITIESEQUITY
(a) Equity share capital 21 679.22 679.18 643.78 (b) Other equity 22 20,129.93 22,582.93 14,505.58
20,809.15 23,262.11 15,149.36 LIABILITIES1. NON-CURRENT LIABILITIES
(a) Financial liabilities(i) Borrowings 23 13,686.09 10,599.96 12,234.88 (ii) Other financial liabilities 25 1,123.66 2,911.84 3,749.76
(b) Provisions 27 850.71 750.89 711.54 (c) Deferred tax liabilities (net) 29 97.95 71.39 66.34 (d) Other non-current liabilities 30 321.24 378.07 380.86
16,079.65 14,712.15 17,143.38 2. CURRENT LIABILITIES
(a) Financial liabilities(i) Borrowings 24 5,375.52 3,654.72 8,173.02 (ii) Trade payables [includes dues of micro and small enterprises
R123.27 crores (as at March 31, 2016 R128.40 crores and as at April 1, 2015 R139.43 crores)]
7,015.21 5,141.17 5,000.18
(iii) Acceptances 4,379.29 3,887.28 3,950.53 (iv) Other financial liabilities 26 2,465.14 3,784.19 2,324.90
(b) Provisions 28 467.98 450.27 378.77 (c) Current tax liabilities (net) 80.64 79.27 60.50 (d) Other current liabilities 31 1,864.02 1,704.84 1,299.26
21,647.80 18,701.74 21,187.16 TOTAL EQUITY AND LIABILITIES 58,536.60 56,676.00 53,479.90
See accompanying notes to financial statementsIn terms of our report attached For and on behalf of the Board
For DELOITTE HASKINS & SELLS LLP Chartered Accountants
B P SHROFFPartner
R A MASHELKAR [DIN: 00074119]
N MUNJEE [DIN:00010180]
V K JAIRATH [DIN: 00391684]
O P BHATT [DIN:00548091]
R SPETH [DIN: 03318908]Directors
N CHANDRASEKARAN [DIN: 00121863]Chairman
GUENTER BUTSCHEK [DIN: 07427375] CEO & Managing Director R PISHARODY [DIN: 01875848] Executive Director S B BORWANKAR [DIN: 01793948] Executive Director C RAMAKRISHNAN Group Chief Financial Officer H K SETHNA [FCS: 3507]Company SecretaryMumbai, May 23, 2017Mumbai, May 23, 2017

F-9
STATEMENT OF PROFIT AND LOSS (R in crores)
Year ended March 31,
Note 2017 2016
I. Income from operations 32 49,100.41 47,383.61 II. Other Income 33 978.84 1,402.31 III. Total Income (I + II) 50,079.25 48,785.92 IV. Expenses:
(a) Cost of materials consumed 27,654.40 24,997.40 (b) Purchases of products for sale 3,945.97 4,101.97 (c) Changes in inventories of finished goods, work-in-progress, and products for sale (251.43) 10.05 (d) Excise duty 4,736.41 4,538.14 (e) Employee benefits expense 34 3,558.52 3,188.97 (f ) Finance costs 35 1,590.15 1,592.00 (g) Foreign exchange (gain)/loss (net) (252.45) 222.91 (h) Depreciation and amortisation expense 2,969.39 2,329.22 (i) Product development/Engineering expenses 454.48 418.27 (j) Other expenses 36 8,697.42 8,216.65 (k) Amount capitalised (941.55) (1,034.40) Total Expenses (IV) 52,161.31 48,581.18
V. Profit/(loss) before exceptional items and tax (III-IV) (2,082.06) 204.74 VI. Exceptional Items
(a) Provision for impairment of investments and cost associated with closure of operations of a subsidiary - 97.86 (b) Provision for impairment of investment in a subsidiary 123.17 - (c) Impairment of capitalised property, plant and equipment and other intangible assets - 163.94 (d) Employee separation cost 67.61 10.04 (e) Others 37 147.93 -
VII. Profit/(loss) before tax (V-VI) (2,420.77) (67.10)VIII. Tax expense/(credit) (net) 29
(a) Current tax 44.52 (7.34)(b) Deferred tax 14.70 2.54 Total Tax Expense/(credit) 59.22 (4.80)
IX. Profit/(loss) for the year from continuing operations (VII-VIII) (2,479.99) (62.30)X. Other comprehensive income/(loss):
A. (i) Items that will not be reclassified to profit or loss:a. Remeasurement gains and (losses) on defined benefit obligations (net) 10.18 20.77 b. Equity instruments fair value through other comprehensive income 73.84 81.19
(ii) Income tax (expense)/credit relating to items that will not be reclassified to profit or loss (3.79) (7.19)B. (i) Items that will be reclassified to profit or loss - gains and (losses) in cash flow hedges 23.32 (13.98)
(ii) Income tax (expense)/credit relating to items that will be reclassified to profit or loss (8.07) 4.68 Total other comprehensive income/(loss), net of taxes 95.48 85.47
XI Total comprehensive income/(loss) for the year (IX+X) (2,384.51) 23.17 XII. Earnings per equity share (EPS) 39
A. Ordinary shares (face value of R2 each) :(i) Basic R (7.30) (0.18)(ii) Diluted R (7.30) (0.18)
B. ‘A’ Ordinary shares (face value of R2 each) :(i) Basic R (7.30) (0.18)(ii) Diluted R (7.30) (0.18)
See accompanying notes to financial statements
In terms of our report attached For and on behalf of the Board
For DELOITTE HASKINS & SELLS LLP Chartered Accountants
B P SHROFFPartner
Mumbai, May 23, 2017
R A MASHELKAR [DIN: 00074119]
N MUNJEE [DIN:00010180]
V K JAIRATH [DIN: 00391684]
O P BHATT [DIN:00548091]
R SPETH [DIN: 03318908]Directors
N CHANDRASEKARAN [DIN: 00121863]Chairman
GUENTER BUTSCHEK [DIN: 07427375] CEO & Managing Director R PISHARODY [DIN: 01875848] Executive Director S B BORWANKAR [DIN: 01793948] Executive Director C RAMAKRISHNAN Group Chief Financial Officer H K SETHNA [FCS: 3507]Company Secretary
Mumbai, May 23, 2017

Statutory ReportsCorporate Overview Financial Statements
F-10
(Standalone)
72nd Annual Report 2016-17
CASH FLOW STATEMENT
In terms of our report attached For and on behalf of the Board For DELOITTE HASKINS & SELLS LLP Chartered Accountants
B P SHROFFPartner
R A MASHELKAR [DIN: 00074119]N MUNJEE [DIN:00010180]V K JAIRATH [DIN: 00391684]O P BHATT [DIN:00548091] R SPETH [DIN: 03318908]Directors
N CHANDRASEKARAN [DIN: 00121863]Chairman
GUENTER BUTSCHEK [DIN: 07427375] CEO & Managing Director R PISHARODY [DIN: 01875848] Executive Director S B BORWANKAR [DIN: 01793948] Executive Director C RAMAKRISHNAN Group Chief Financial Officer H K SETHNA [FCS: 3507]Company Secretary
(R in crores)
Year ended March 31,
2017 2016
Cash flows from Operating ActivitiesProfit/(loss) after tax (2,479.99) (62.30)Adjustments for:Depreciation and amortisation expense 2,969.39 2,329.22 Allowances for trade and other receivables 133.72 138.79 Inventory write down 103.35 136.33 Provision for impairment of investments and costs associated with closure of operations of a subsidiary - 97.86 Provision for impairment of investment in a subsidiary 123.17 - Marked-to-market on investments measured at Fair value through profit or loss (0.93) (9.33)Impairment of capitalised property, plant and equipment and other intangible assets - 163.94 Exceptional items - others 147.93 - Loss on sale of assets (net) (including assets scrapped/ written off ) 139.49 388.37 Profit on sale of investments at FVTPL (net) (116.76) (67.48)Gain on fair value of below market interest loans (46.52) (50.50)Tax expense 59.22 (4.80)Interest/dividend (net) 729.00 266.50 Foreign exchange (gain)/ loss (net) (212.10) 175.82
4,028.96 3,564.72 Cash flows from operating activities before changes in following assets and liabilities 1,548.97 3,502.42 Trade receivables (199.63) (677.54)Loans and advances and other financial assets (80.28) (55.29)Other current and non-current assets (325.84) (62.62)Inventories (566.77) (234.79)Trade payables and acceptances 2,298.02 76.31 Other current and non-current liabilities 23.71 377.23 Other financial liabilities (1,307.43) (324.53)Provisions 84.47 125.29 Cash generated from operations 1,475.22 2,726.48 Income taxes credit/(paid) (net) (93.75) (23.50)Net cash from operating activities 1,381.47 2,702.98
Cash flows from investing activities:Payments for property, plant and equipment (1,872.83) (1,687.63)Payments for other intangible assets (1,554.16) (1,596.00)Proceeds from sale of property, plant and equipment 15.41 34.42 Advance towards investments in subsidiary companies - (73.11)Investments in Mutual Fund (purchased)/ sold (net) (537.40) (1,669.02)Investments in subsidiary companies (139.08) (59.98)Proceeds from sale of investments in subsidiary companies - 746.90 Loans to subsidiary companies (0.07) (77.97)Loans to others - (0.75)Repayment of loans to others 0.75 - Proceeds from sale of investments in other companies - 85.05 (Increase)/Decrease in short term inter corporate deposit 20.00 (35.00)Repayment of loans to joint operations 132.50 - Deposits with financial institution - (1,968.00)Reaslisation of deposits with financial institution - 1,968.00 Deposits/restricted deposits with banks (114.71) (5,738.79)Realisation of deposits/restricted deposits with banks 379.00 5,511.30 Interest received 256.11 253.90 Dividend received 676.50 1,042.46 Net cash used in investing activities (2,737.98) (3,264.22)Cash flows from financing activitiesProceeds from Rights issue of shares (net of issue expenses) - 7,433.22 Proceeds from issue of shares held in abeyance 4.55 - Proceeds from long-term borrowings 4,070.52 468.45 Repayment of long-term borrowings (2,596.22) (1,418.35)Proceeds from short-term borrowings 6,616.67 3,118.25 Repayment of short-term borrowings (3,298.44) (4,956.91)Net change in other short-term borrowings (with maturity up to three months) (1,647.28) (2,637.62)Dividend paid (including dividend distribution tax) (73.00) - Interest paid [including discounting charges paid, R373.02 crores (March 31, 2016 R364.47 crores)] (1,957.59) (2,085.91)Net Cash from/(used in) financing activities 1,119.21 (78.87)Net decrease in cash and cash equivalents (237.30) (640.11)Cash and cash equivalents as at April 1, (opening balance) 427.07 1,066.47 Exchange fluctuation on foreign currency bank balances (1.38) 0.71 Cash and cash equivalents as at March 31, (closing balance) Non-cash transactions :
188.39 427.07
Liability towards property, plant and equipment and other intangible assets purchased on credit/ deferred credit 327.82 415.15
Mumbai, May 23, 2017Mumbai, May 23, 2017

F-11
A.
Equi
ty S
hare
Cap
ital
(R in
cro
res)
Part
icul
ars
Equi
ty S
hare
Ca
pita
l
Bala
nce
as a
t Apr
il 1,
201
6 6
79.1
8 Pr
ocee
ds f
rom
iss
ue o
f sh
ares
hel
d in
abe
yanc
e an
d am
ount
s re
ceiv
ed o
n un
paid
cal
ls
0.0
4 Ba
lanc
e as
at M
arch
31,
201
7 6
79.2
2
B. O
ther
Equ
ity
(R in
cro
res)
Part
icul
ars
Secu
ritie
s pr
emiu
m
acco
unt
Capi
tal
rede
mpt
ion
rese
rve
Deb
entu
re
rede
mpt
ion
rese
rve
Reta
ined
ea
rnin
gsO
ther
com
pone
nts
of e
quit
yTo
tal o
ther
eq
uity
Equi
ty
inst
rum
ents
th
roug
h O
CI
Hed
ging
re
serv
eCo
st o
f H
edgi
ng
rese
rve
Bala
nce
as a
t Apr
il 1,
201
619
,209
.42
2.2
8 1
,042
.15
2,4
22.6
5 (1
00.9
6) 7
.39
- 2
2,58
2.93
Pr
ofit/
(loss
) for
the
year
- -
- (2
,479
.99)
- -
- (2
,479
.99)
Oth
er c
ompr
ehen
sive
in
com
e /(
loss
) for
the
year
- -
- 6
.39
73.
84
3.8
7 1
1.38
9
5.48
To
tal c
ompr
ehen
sive
in
com
e/(lo
ss) f
or th
e ye
ar -
- -
(2,4
73.6
0) 7
3.84
3
.87
11.
38
(2,3
84.5
1)Pr
ocee
ds fr
om is
sue
of
shar
es h
eld
in a
beya
nce
4.5
1 -
- -
- -
- 4
.51
Tran
sfer
to D
eben
ture
re
dem
ptio
n re
serv
e -
- 4
3.79
(4
3.79
) -
- -
- D
ivid
end
(incl
udin
g di
vide
nd ta
x) -
- -
(73.
00)
- -
- (7
3.00
)Ba
lanc
e as
at M
arch
31,
201
719
,213
.93
2.2
8 1
,085
.94
(167
.74)
(27.
12)
11.
26 1
1.38
2
0,12
9.93
See
acco
mpa
nyin
g no
tes t
o fin
anci
al st
atem
ents
In te
rms o
f our
repo
rt a
ttac
hed
For a
nd o
n be
half
of th
e Bo
ard
For D
ELO
ITTE
HA
SKIN
S &
SEL
LS L
LP
Ch
arte
red
Acco
unta
nts
B P
SHRO
FFPa
rtne
r
Mum
bai, M
ay 2
3, 2
017
R A
MA
SHEL
KAR
[DIN
: 000
7411
9]
N M
UN
JEE
[DIN
:000
1018
0]
V K
JAIR
ATH
[DIN
: 003
9168
4]
O P
BH
ATT
[DIN
:005
4809
1]
R SP
ETH
[DIN
: 033
1890
8]D
irect
ors
N C
HA
ND
RASE
KARA
N [D
IN: 0
0121
863]
Chai
rman
GU
ENTE
R BU
TSCH
EK [D
IN: 0
7427
375]
C
EO &
Man
agin
g D
irect
or
R P
ISH
ARO
DY
[DIN
: 018
7584
8]
Exe
cutiv
e Dire
ctor
S
B B
ORW
AN
KAR
[DIN
: 017
9394
8]
Exe
cutiv
e Dire
ctor
C
RA
MA
KRIS
HN
AN
G
roup
Chi
ef Fi
nanc
ial O
ffice
r
H K
SET
HN
A [F
CS: 3
507]
Com
pany
Sec
reta
ry
Mum
bai, M
ay 2
3, 2
017
STAT
EMEN
T O
F CH
AN
GES
IN E
QU
ITY
For t
he y
ear e
nded
Mar
ch 3
1, 2
017

Statutory ReportsCorporate Overview Financial Statements
F-12
(Standalone)
72nd Annual Report 2016-17
A.
Equi
ty S
hare
Cap
ital
(R in
cro
res)
Part
icul
ars
Equi
ty S
hare
Ca
pita
l
Bala
nce
as a
t Apr
il 1,
201
5 6
43.7
8 Iss
ue o
f sha
res p
ursu
ant t
o rig
hts i
ssue
35.
40
Bala
nce
as a
t Mar
ch 3
1, 2
016
679
.18
B.O
ther
Equ
ity
(R in
cro
res)
Part
icul
ars
Secu
ritie
s pr
emiu
m
acco
unt
Capi
tal
rede
mpt
ion
rese
rve
Deb
entu
re
rede
mpt
ion
rese
rve
Reta
ined
ea
rnin
gs
Oth
er c
ompo
nent
s of
equ
ity
Tota
l oth
er
equi
tyEq
uity
in
stru
men
ts
thro
ugh
OCI
Hed
ging
re
serv
e
Bala
nce
as a
t Apr
il 1,
201
511
,811
.60
2.2
8 1
,042
.15
1,7
34.6
3 (1
01.7
7) 1
6.69
1
4,50
5.58
Pr
ofit/
(loss
) for
the
year
- -
- (6
2.30
) -
- (6
2.30
)O
ther
com
preh
ensiv
e in
com
e /(
loss
) for
the
year
- -
- 1
3.58
8
1.19
(9
.30)
85.
47
Tota
l com
preh
ensiv
e in
com
e/(lo
ss) f
or th
e ye
ar -
- -
(48.
72)
81.
19
(9.3
0) 2
3.17
Pr
ofit o
n sa
le o
f unq
uote
d eq
uity
inve
stm
ent
- -
- 8
0.38
(8
0.38
) -
- Pr
ofit o
n sa
le o
f inv
estm
ents
on
com
mon
con
trol
tran
sact
ions
- -
- 6
56.3
6 -
- 6
56.3
6 Iss
ue o
f sha
res p
ursu
ant t
o Ri
ghts
issu
e (n
et o
f iss
ue
expe
nses
of R
57.2
7 cr
ores
) 7
,397
.82
- -
- -
- 7
,397
.82
Bala
nce
as a
t Mar
ch 3
1, 2
016
19,
209.
42
2.2
8 1
,042
.15
2,4
22.6
5 (1
00.9
6) 7
.39
22,
582.
93
See
acco
mpa
nyin
g no
tes t
o fin
anci
al st
atem
ents
In te
rms o
f our
repo
rt a
ttac
hed
For a
nd o
n be
half
of th
e Bo
ard
For D
ELO
ITTE
HA
SKIN
S &
SEL
LS L
LP
Ch
arte
red
Acco
unta
nts
B P
SHRO
FFPa
rtne
r
Mum
bai, M
ay 2
3, 2
017
R A
MA
SHEL
KAR
[DIN
: 000
7411
9]
N M
UN
JEE
[DIN
:000
1018
0]
V K
JAIR
ATH
[DIN
: 003
9168
4]
O P
BH
ATT
[DIN
:005
4809
1]
R SP
ETH
[DIN
: 033
1890
8]D
irect
ors
N C
HA
ND
RASE
KARA
N [D
IN: 0
0121
863]
Chai
rman
GU
ENTE
R BU
TSCH
EK [D
IN: 0
7427
375]
C
EO &
Man
agin
g D
irect
or
R P
ISH
ARO
DY
[DIN
: 018
7584
8]
Exe
cutiv
e Dire
ctor
S
B B
ORW
AN
KAR
[DIN
: 017
9394
8]
Exe
cutiv
e Dire
ctor
C
RA
MA
KRIS
HN
AN
G
roup
Chi
ef Fi
nanc
ial O
ffice
r
H K
SET
HN
A [F
CS: 3
507]
Com
pany
Sec
reta
ry
Mum
bai, M
ay 2
3, 2
017
STAT
EMEN
T O
F CH
AN
GES
IN E
QU
ITY
For t
he y
ear e
nded
Mar
ch 3
1, 2
016

F-13
1. Background and operations Tata Motors Limited referred to as (“the Company” or “Tata Motors”), designs, manufactures and sells a wide range of automotive vehicles. The Company also
manufactures engines for industrial and marine applications.
The Company is a public limited Company incorporated and domiciled in India and has its registered office at Mumbai, India. As at March 31, 2017, Tata Sons Limited, together with its subsidiaries owns 31.69 % of the Ordinary shares and 0.09 % of ‘A’ Ordinary shares of the Company, and has the ability to significantly influence the Company’s operation.
The standalone financial statements were approved by the Board of Directors and authorized for issue on May 23, 2017.
2. Significant accounting policies(a) Statement of compliance In accordance with the notification issued by the Ministry of Corporate Affairs, the Company has adopted Indian Accounting Standards (referred to as “Ind
AS”) notified under the Companies (Indian Accounting Standards) Rules, 2015 with effect from April 1, 2016. Previous period figures have been restated to Ind AS. In accordance with Ind AS 101 First-time Adoption of Indian Accounting Standards, the Company has presented a reconciliation from the presentation of financial statements under Accounting Standards notified under the Companies (Accounting Standards) Rules, 2006 (“Previous GAAP”) to Ind AS of Shareholders’ equity as at March 31, 2016 and April 1, 2015 and of the Total comprehensive income for the year ended March 31, 2016.
These financial statements have been prepared in accordance with Ind AS as notified under the Companies (Indian Accounting Standards) Rules, 2015 read with Section 133 of the Companies Act, 2013 (the “Act”).
(b) Basis of preparation
The financial statements have been prepared on historical cost basis except for certain financial instruments measured at fair value at the end of each reporting period as explained in the accounting policies below.
Joint operations
Certain of the Company’s activities, are conducted through joint operations, which are joint arrangements whereby the parties that have joint control of the arrangement have rights to the assets, and obligations for the liabilities, relating to the arrangement. As per Ind AS 111 - Joint arrangements, in its separate financial statements, the Company being a joint operator has recognised its share of the assets, liabilities, income and expenses of these joint operations incurred jointly with the other partners, along with its share of income from the sale of the output and any assets, liabilities and expenses that it has incurred in relation to the joint operation.
Although not required by Ind AS’s, the Company has provided in note 46 additional information of Tata Motors Limited on a standalone basis excluding its interest in its two Joint Operations viz. Tata Cummins Private Limited and Fiat India Automobiles Private Limited.
(c) Use of estimates and judgments
The preparation of financial statements in conformity with Ind AS requires management to make judgments, estimates and assumptions, that affect the application of accounting policies and the reported amounts of assets, liabilities and disclosures of contingent assets and liabilities at the date of these financial statements and the reported amounts of revenues and expenses for the years presented. Actual results may differ from these estimates.
Estimates and underlying assumptions are reviewed at each balance sheet date. Revisions to accounting estimates are recognised in the period in which the estimate is revised and future periods affected.
In particular, information about significant areas of estimation uncertainty and critical judgments in applying accounting policies that have the most significant effect on the amounts recognized in the financial statements are included in following notes :
i) Note 3 - Property, plant and equipment ii) Note 29 - Recoverability/recognition of deferred tax assets iii) Note 27 and 28 - Provision for product warranty iv) Note 45 - Assets and obligations relating to employee benefits
(d) Revenue recognition Revenue is measured at fair value of consideration received or receivable. (i) Sale of products
The Company recognizes revenues on the sale of products, net of discounts, sales incentives, customer bonuses and rebates granted, when products are delivered to dealers or when delivered to a carrier for export sales, which is when title and risks and rewards of ownership pass to the customer. Sale of products includes export and other recurring and non-recurring incentives from governments (referred to as “incentives”).
Revenues are recognized when collectability of the resulting receivable is reasonably assured.
NOTES FORMING PART OF FINANCIAL STATEMENTS

Statutory ReportsCorporate Overview Financial Statements
F-14
(Standalone)
72nd Annual Report 2016-17
Incentives are recognized when there is reasonable assurance that the Company will comply with the conditions and the incentive will be received. Incentives are recorded at fair value where applicable. Sales of products include incentives of R309.86 crores and R481.62 crores for the years ended March 31, 2017 and 2016, respectively.
(ii) Other operating revenue Include incentive of R110.01 crores and R82.84 crores for the year ended March 31, 2017 and 2016, respectively, towards
Exports Promotion Capital Goods (EPCG) scheme. (e) Cost recognition Costs and expenses are recognized when incurred and are classified according to their nature. Expenditure capitalized represents employee costs, stores and other manufacturing supplies, and other expenses incurred for construction including product
development undertaken by the Company.
(f ) Provisions A provision is recognized if, as a result of a past event, the Company has a present legal or constructive obligation that can be estimated reliably, and it is
probable that an outflow of economic benefits will be required to settle the obligation. Provisions are determined by discounting the expected future cash flows at a pre-tax rate that reflects current market assessments of the time value of money and the risks specific to the liability.
Product warranty expenses The estimated liability for product warranties is recorded when products are sold. These estimates are established using historical information on the nature,
frequency and average cost of warranty claims and management estimates regarding possible future incidences based on actions on product failures. The timing of outflows will vary as and when warranty claim will arise, being typically up to four years.
(g) Foreign currency These financial statements are presented in Indian rupees, which is the functional currency of Tata Motors Limited. Transactions in foreign currencies are recorded at the exchange rate prevailing on the date of transaction. Foreign currency denominated monetary assets
and liabilities are re-measured into the functional currency at the exchange rate prevailing on the balance sheet date. Exchange differences are recognized in the Statement of Profit and Loss except to the extent, exchange differences which are regarded as an adjustment to
interest costs on foreign currency borrowings, are capitalized as part of borrowing costs.
(h) Income taxes Income tax expense comprises current and deferred taxes. Income tax expense is recognized in the Statement of Profit and Loss except when they relate to
items that are recognized outside profit or loss (whether in other comprehensive income or directly in equity), in which case tax is also recognized outside profit or loss.
Current income taxes are determined based on respective taxable income of each taxable entity. Deferred tax assets and liabilities are recognized for the future tax consequences of temporary differences between the carrying values of assets and liabilities
and their respective tax bases, and unutilized business loss and depreciation carry-forwards and tax credits. Such deferred tax assets and liabilities are computed separately for each taxable entity. Deferred tax assets are recognized to the extent that it is probable that future taxable income will be available against which the deductible temporary differences, unused tax losses, depreciation carry-forwards and unused tax credits could be utilized.
Deferred tax assets and liabilities are measured based on the tax rates that are expected to apply in the period when the asset is realized or the liability is settled, based on tax rates and tax laws that have been enacted or substantively enacted by the balance sheet date.
Deferred tax assets and liabilities are offset when there is a legally enforceable right to set off current tax assets against current tax liabilities and when they relate to income taxes levied by the same taxation authority and the Company intends to settle its current tax assets and liabilities on a net basis.
(i) Earnings per share Basic earnings per share has been computed by dividing profit/loss for the year by the weighted average number of shares outstanding during the year.
Partly paid up shares are included as fully paid equivalents according to the fraction paid up. Diluted earnings per share has been computed using the weighted average number of shares and dilutive potential shares, except where the result would be anti-dilutive.
(j) Inventories Inventories are valued at the lower of cost and net realizable value. Cost of raw materials, components and consumables are ascertained on a moving
weighted average/monthly moving weighted average basis. Cost, including fixed and variable production overheads, are allocated to work-in-progress and finished goods determined on a full absorption cost basis. Net realizable value is the estimated selling price in the ordinary course of business less estimated cost of completion and selling expenses.
NOTES FORMING PART OF FINANCIAL STATEMENTS

F-15
(k) Property, plant and equipment Property, plant and equipment are stated at cost of acquisition or construction less accumulated depreciation less accumulated impairment, if any. Freehold land is measured at cost and is not depreciated. Cost includes purchase price, taxes and duties, labour cost and direct overheads for self-constructed assets and other direct costs incurred up to the date the
asset is ready for its intended use. Interest cost incurred for constructed assets is capitalized up to the date the asset is ready for its intended use, based on borrowings incurred specifically for
financing the asset or the weighted average rate of all other borrowings, if no specific borrowings have been incurred for the asset. Depreciation is provided on the Straight Line Method (SLM) over the estimated useful lives of the assets considering the nature, estimated usage, operating
conditions, past history of replacement, anticipated technological changes, manufacturers warranties and maintenance support. Taking into account these factors, the Company has decided to apply the useful life for various categories of property, plant & equipment, which are different from those prescribed in Schedule II of the Act. Estimated useful lives of assets are as follows:
Type of Asset Estimated useful life Buildings, Roads, Bridges and culverts 4 to 60 years Plant, machinery and equipment 8 to 20 years Computers and other IT assets 4 to 6 years Vehicles 4 to 10 years Furniture, fixture and office appliances 5 to 15 years
The useful lives is reviewed at least at each year end. Changes in expected useful lives are treated as change in accounting estimate. Assets held under finance leases are depreciated over their expected useful lives on the same basis as owned assets or, where shorter, the term of the relevant
lease. Depreciation is not recorded on capital work-in-progress until construction and installation are complete and the asset is ready for its intended use.
(l) Other intangible assets Intangible assets purchased are measured at cost less accumulated amortization and accumulated impairment, if any. Amortization is provided on a straight-line basis over estimated useful lives of the intangible assets as per details below:
Type of asset Estimated amortization period Technological know-how 8 to 10 years Software 4 years
The amortization period for intangible assets with finite useful lives is reviewed at least at each year-end. Changes in expected useful lives are treated as changes in accounting estimates
Internally generated intangible assets Research costs are charged to the Statement of Profit and Loss in the year in which they are incurred. Product development costs incurred on new vehicle platform, engines, transmission and new products are recognized as intangible assets, when feasibility
has been established, the Company has committed technical, financial and other resources to complete the development and it is probable that asset will generate probable future economic benefits.
The costs capitalized include the cost of materials, direct labour and directly attributable overhead expenditure incurred up to the date the asset is available for use.
Interest cost incurred is capitalized up to the date the asset is ready for its intended use, based on borrowings incurred specifically for financing the asset or the weighted average rate of all other borrowings if no specific borrowings have been incurred for the asset.
Product development costs are amortised over a period of 120 months for New Generation vehicles and powertrains on the basis of higher of the volumes between planned and actuals and on a straight line method over a period of 36 months for Vehicle Variants, Derivatives and other Regulatory Projects.
Capitalized development expenditure is measured at cost less accumulated amortization and accumulated impairment, if any.
(m) Goodwill Cash generating units to which goodwill is allocated are tested for impairment annually at each balance sheet date, or more frequently when there is an
indication that the unit may be impaired. If the recoverable amount of the cash generating unit is less than the carrying amount of the unit, the impairment loss is allocated first to reduce the carrying amount of any goodwill allocated to that unit and then to the other assets of the unit pro rata on the basis of carrying amount of each asset in the unit. Goodwill impairment loss recognized is not reversed in subsequent period.
(n) Leases At the inception of a lease, the lease arrangement is classified as either a finance lease or an operating lease, based on the substance of the lease
arrangement.
NOTES FORMING PART OF FINANCIAL STATEMENTS

Statutory ReportsCorporate Overview Financial Statements
F-16
(Standalone)
72nd Annual Report 2016-17
Assets taken on finance lease A finance lease is recognized as an asset and a liability at the commencement of the lease, at the lower of the fair value of the asset and the present value of
the minimum lease payments. Initial direct costs, if any, are also capitalized and, subsequent to initial recognition, the asset is accounted for in accordance with the accounting policy applicable to that asset. Minimum lease payments made under finance leases are apportioned between the finance expense and the reduction of the outstanding liability. The finance expense is allocated to each period during the lease term so as to produce a constant periodic rate of interest on the remaining balance of the liability.
Assets taken on operating lease Leases other than finance leases are operating leases, and the leased assets are not recognized on the Company’s balance sheet. Payments made under
operating leases are recognized in the Statement of Profit and Loss on a straight-line basis over the term of the lease.
(o) Impairment At each balance sheet date, the Company assesses whether there is any indication that any property, plant and equipment and intangible assets with finite
lives may be impaired. If any such impairment exists the recoverable amount of an asset is estimated to determine the extent of impairment, if any. Where it is not possible to estimate the recoverable amount of an individual asset, the Company estimates the recoverable amount of the cash-generating unit to which the asset belongs.
Intangible assets not yet available for use, are tested for impairment annually at each balance sheet date, or earlier, if there is an indication that the asset may be impaired.
Recoverable amount is the higher of fair value less costs to sell and value in use. In assessing value in use, the estimated future cash flows are discounted to their present value using a pre-tax discount rate that reflects current market assessments of the time value of money and the risks specific to the asset for which the estimates of future cash flows have not been adjusted.
If the recoverable amount of an asset (or cash-generating unit) is estimated to be less than its carrying amount, the carrying amount of the asset (or cash-generating unit) is reduced to its recoverable amount. An impairment loss is recognized immediately in the Statement of Profit and Loss.
As at March 31, 2017, none of the Company’s property, plant and equipment and intangible assets were considered impaired.
(p) Employee benefits i) Gratuity Tata Motors Limited and its Joint operations have an obligation towards gratuity, a defined benefit retirement plan covering eligible employees. The
plan provides for a lump-sum payment to vested employees at retirement, death while in employment or on termination of employment of an amount equivalent to 15 to 30 days salary payable for each completed year of service. Vesting occurs upon completion of five years of service. Tata Motors Limited make annual contributions to gratuity funds established as trusts. Tata Motors Limited account for the liability for gratuity benefits payable in the future based on an actuarial valuation.
ii) Superannuation Tata Motors Limited have two superannuation plans, a defined benefit plan and a defined contribution plan. An eligible employee on April 1, 1996 could
elect to be a member of either plan. Employees who are members of the defined benefit superannuation plan are entitled to benefits depending on the years of service and salary drawn.
The monthly pension benefits after retirement range from 0.75% to 2% of the annual basic salary for each year of service. Tata Motors Limited account for superannuation benefits payable in future under the plan based on an actuarial valuation.
With effect from April 1, 2003, this plan was amended and benefits earned by covered employees have been protected as at March 31, 2003. Employees covered by this plan are prospectively entitled to benefits computed on a basis that ensures that the annual cost of providing the pension benefits would not exceed 15% of salary.
Separate irrevocable trusts are maintained for employees covered and entitled to benefits. Tata Motors Limited contributes up to 15% or R1,50,000, whichever is lower, of the eligible employees’ salary to the trust every year. Such contribution are recognised as an expense when incurred. Tata Motors Limited has no further obligation beyond this contribution.
iii) Bhavishya Kalyan Yojana (BKY) Bhavishya Kalyan Yojana is an unfunded defined benefit plan for employees of Tata Motors Limited. The benefits of the plan include pension in certain
cases, payable up to the date of normal superannuation had the employee been in service, to an eligible employee at the time of death or permanent disablement, while in service, either as a result of an injury or as certified by the appropriate authority. The monthly payment to dependents of the deceased/disabled employee under the plan equals 50% of the salary drawn at the time of death or accident or a specified amount, whichever is greater. Tata Motors Limited account for the liability for BKY benefits payable in the future based on an actuarial valuation.
iv) Provident fund and family pension In accordance with Indian law, eligible employees of Tata Motors Limited and its Joint operations are entitled to receive benefits in respect of provident
fund, a defined contribution plan, in which both employees and the Company make monthly contributions at a specified percentage of the covered employees’ salary (currently 12% of employees’ salary). The contributions, as specified under the law, are made to the provident fund and pension fund set up as an irrevocable trust by Tata Motors Limited.
NOTES FORMING PART OF FINANCIAL STATEMENTS

F-17
v) Post-retirement medicare scheme Under this unfunded scheme, employees of Tata Motors Limited receive medical benefits subject to certain limits on amounts of benefits, periods after
retirement and types of benefits, depending on their grade and location at the time of retirement. Employees separated from the Company as part of an Early Separation Scheme, on medical grounds or due to permanent disablement are also covered under the scheme. Tata Motors Limited account for the liability for post-retirement medical scheme based on an actuarial valuation.
vi) Remeasurement gains and losses Remeasurement comprising actuarial gains and losses, the effect of the asset ceiling and the return on assets (excluding interest) relating to retirement
benefit plans, are recognized directly in other comprehensive income in the period in which they arise. Remeasurement recorded in other comprehensive income is not reclassified to Statement of Profit and Loss.
Actuarial gains and losses relating to long-term employee benefits are recognized in the Statement of Profit and Loss in the period in which they arise.
vii) Measurement date The measurement date of retirement plans is March 31.
(q) Dividends Any dividend declared or paid by Tata Motors Limited for any financial year is based on the profits available for distribution as reported in the statutory
financial statements of Tata Motors Limited (Standalone) prepared in accordance with Generally Accepted Accounting Principles in India, or Indian GAAP or Ind AS. Indian law permits the declaration and payment of dividend out of profits for the year or previous financial year(s) as stated in the statutory financial statements of Tata Motors Limited (Standalone) prepared in accordance with Generally Accepted Accounting Principles in India, or Indian GAAP or Ind AS after providing for depreciation in accordance with the provisions of Schedule II to the Companies Act. However, in the absence or inadequacy of the said profits, it may declare dividend out of free reserves, subject to certain conditions as prescribed under the Companies (Declaration and payment of Dividend) Rules, 2014. Accordingly, in certain years the net income reported in these financial statements may not be fully distributable. The amount available for distribution is RNil as at March 31, 2017 (R198.19 crores as at March 31, 2016).
(r) Segments The Company is engaged mainly in the business of automobile products consisting of all types of commercial and passenger vehicles. These in the context
of Ind AS 108 - operating segments reporting are considered to constitute one reportable segment.
(s) Investments in Subsidiaries, Joint Ventures and Associates Investments in Subsidiaries, Joint Ventures and Associates are measured at cost as per Ind AS 27 – Separate Financial Statements.
(t) Financial instruments
i) Classification, initial recognition and measurement A financial instrument is any contract that gives rise to a financial asset of one entity and a financial liability or equity instrument of another entity. Financial
assets other than equity instruments are classified into categories: financial assets at fair value through profit or loss and at amortised cost. Financial assets that are equity instruments are classified as fair value through profit or loss or fair value through other comprehensive income. Financial liabilities are classified into financial liabilities at fair value through profit or loss and other financial liabilities.
Financial instruments are recognized on the balance sheet when the Company becomes a party to the contractual provisions of the instrument. Initially, a financial instrument is recognized at its fair value. Transaction costs directly attributable to the acquisition or issue of financial instruments are
recognized in determining the carrying amount, if it is not classified as at fair value through profit or loss. Subsequently, financial instruments are measured according to the category in which they are classified.
Financial assets at amortised cost: Financial assets having contractual terms that give rise on specified dates to cash flows that are solely payments of principal and interest on the principal outstanding and that are held within a business model whose objective is to hold such assets in order to collect such contractual cash flows are classified in this category. Subsequently, these are measured at amortized cost using the effective interest method less any impairment losses.
Equity investments at fair value through other comprehensive income: These include financial assets that are equity instruments and are irrevocably designated as such upon initial recognition. Subsequently, these are measured at fair value and changes therein are recognized directly in other comprehensive income, net of applicable income taxes.
Dividends from these equity investments are recognized in the Statement of Profit and Loss when the right to receive payment has been established. When the equity investment is derecognized, the cumulative gain or loss in equity is transferred to retained earnings. Financial assets at fair value through profit or loss: Financial assets are measured at fair value through profit or loss unless it is measured at amortised
cost or at fair value through other comprehensive income on initial recognition. The transaction costs directly attributable to the acquisition of financial assets at fair value through profit or loss are immediately recognised in profit or loss.
Equity instruments: An equity instrument is any contract that evidences residual interests in the assets of the Company after deducting all of its liabilities. Equity instruments issued by the Company are recorded at the proceeds received, net of direct issue costs.
NOTES FORMING PART OF FINANCIAL STATEMENTS

Statutory ReportsCorporate Overview Financial Statements
F-18
(Standalone)
72nd Annual Report 2016-17
Financial liabilities at fair value through profit or loss: Derivatives, including embedded derivatives separated from the host contract, unless they are designated as hedging instruments, for which hedge accounting is applied, are classified into this category. These are measured at fair value with changes in fair value recognized in the Statement of Profit and Loss.
Financial guarantee contracts: These are initially measured at their fair values and, are subsequently measured at the higher of the amount of loss allowance determined or the amount initially recognized less, the cumulative amount of income recognized.
Other financial liabilities: These are measured at amortized cost using the effective interest method.
ii) Determination of fair value: The fair value of a financial instrument on initial recognition is normally the transaction price (fair value of the consideration given or received). Subsequent
to initial recognition, the Company determines the fair value of financial instruments that are quoted in active markets using the quoted bid prices (financial assets held) or quoted ask prices (financial liabilities held) and using valuation techniques for other instruments. Valuation techniques include discounted cash flow method and other valuation models.
iii) Derecognition of financial assets and financial liabilities: The Company derecognizes a financial asset only when the contractual rights to the cash flows from the asset expires or it transfers the financial asset and
substantially all the risks and rewards of ownership of the asset to another entity. If the Company neither transfers nor retains substantially all the risks and rewards of ownership and continues to control the transferred asset, the Company recognizes its retained interest in the asset and an associated liability for amounts it may have to pay. If the Company retains substantially all the risks and rewards of ownership of a transferred financial asset, the Company continues to recognize the financial asset and also recognizes a collateralized borrowing for the proceeds received.
Financial liabilities are derecognised when these are extingushed, that is when the obligation is discharged, cancelled or has expired.
iv) Impairment of financial assets: The Company recognizes a loss allowance for expected credit losses on a financial asset that is at amortized cost. Loss allowance in respect of financial
assets is measured at an amount equal to life time expected credit losses and is calculated as the difference between their carrying amount and the present value of the expected future cash flows discounted at the original effective interest rate.
(u) Hedge accounting The Company uses foreign currency forward contracts to hedge its risks associated with foreign currency fluctuations relating to highly probable
forecast transactions. The Company designates these forward contracts in a cash flow hedging relationship by applying the hedge accounting principles.
These forward contracts are stated at fair value at each reporting date. Changes in the fair value of these forward contracts that are designated and effective as hedges of future cash flows are recognized in other comprehensive income and the ineffective portion is recognized immediately in the Statement of Profit and Loss. Amounts accumulated in equity are reclassified to the Statement of Profit and Loss in the periods in which the forecasted transactions occurs.
Forward premium in forward contract are not considered part of the hedge. These are treated as cost of hedge and the changes in fair value attributable to forward premium is recognized in the other comprehensive income along with the changes in fair value determined to be effective portion of the hedge.
Hedge accounting is discontinued when the hedging instrument expires or is sold, terminated, or exercised, or no longer qualifies for hedge accounting. For forecast transactions, any cumulative gain or loss on the hedging instrument recognized in equity is retained there until the forecast transaction occurs.
If the forecast transaction is no longer expected to occur, the net cumulative gain or loss recognized in equity is immediately transferred to the Statement of Pofit and Loss for the year.
(v) Recent accounting pronouncements New Accounting pronouncements affecting amounts reported and /or disclosures in the financial statements. The Company has not applied the following revisions to Ind ASs that have been issued but are not yet effective. The Company is evaluating the impact of
these pronouncements on the financial statements:
i) Amendments to Ind AS 107 – Statements of Cash Flows In March 2017, the Ministry of Corporate Affairs (MCA) issued amendments to Ind AS 107 - Statement of Cash Flows introducing additional disclosures that
will enable users of financial statements to evaluate changes in liabilities arising from financing activities. The amendment is effective from April 1, 2017.
ii) Amendments to Ind AS 102 – Share-based Payments In March 2017, the MCA issued amendments to Ind AS 102 – Share-based Payments that clarify how to account certain share-based payment transactions.
The amendments for: Accounting requirements with respect to the effects of vesting and non-vesting conditions on the measurement of cash-settled share-based
payments; Accounting requirements with respect to share-based payment transactions with a net settlement feature for withholding tax obligations; and Modification to the terms and conditions of a share-based payment that changes the classification of the transaction from cash-settled to
equity-settled. The amendment is effective from April 1, 2017.
NOTES FORMING PART OF FINANCIAL STATEMENTS

F-19
(w) Transition to Ind AS The Company has prepared the opening balance sheet as per Ind AS as at April 1, 2015 (the transition date) by recognizing all assets and liabilities whose
recognition is required by Ind AS, not recognizing items of assets or liabilities which are not permitted by Ind AS, by reclassifying items from previous GAAP to Ind AS as required by Ind AS, and applying Ind AS in measurement of recognized assets and liabilities. However, this principle is subject to the certain exception and certain optional exemptions availed by the Company as detailed below.
Fair valuation as deemed cost for certain items of Property, Plant and Equipment and Other intangible assets The Company has elected to measure certain items of its Property, Plant and Equipment and its related intangible assets at its fair value and use that fair
value as its deemed cost at the date of transition to Ind AS. Other items of Property, Plant and Equipment and Other intangible assets have been measured as per Ind AS 16 and Ind AS 38, respectively.
Derecognition of financial assets The Company has choosen to apply derecognition criteria retrospectively. Accordingly certain trade receivables have been re-recognised under Ind AS as
at April 1, 2015.
Reconciliation between Previous GAAP and Ind AS
(R in crores)a) Equity Reconciliation
Particulars Note As at March 31, 2016 As at April 1, 2015
Equity as reported under previous GAAP 22,368.08 14,862.59 (a) Equity of Joint operations (h) 177.82 (62.45)(b) Movement of financial instruments classified as fair value through
Other Comprehensive Income (a) (100.95) (101.78)
(c) Proposed Dividend (b) 73.00 -(d) Provision for expected credit losses (c) (2,130.87) (2,112.87)(e) Gain on fair value of below market interest loan (net of effective
interest rate adjustment)(d) 447.48 396.98
(f ) Property, plant and equipment and intangible assets: (e)&(f )(i) Fair valuation as deemed cost for Property, Plant and
Equipment and intangible assets 2,609.67 2,343.98
(ii) Foreign exchange (764.93) (741.94)(iii) Pre-operative expenses (47.89) (50.89)(iv) Interest capitalized 193.94 186.79 (v) Government Grant (EPCG licenses) 515.46 2,506.25 514.68 2,252.62
(g) Fair value gain on investments in mutual funds (a) 9.34 - (h) Others (net) (51.16) (49.71)(i) Tax effect on above adjustments (g) (36.88) (36.02)Equity under Ind AS 23,262.11 15,149.36
b) Total Comprehensive Income ReconciliationParticulars
NoteYear ended
March 31, 2016Net profit after tax as reported under previous GAAP 234.23
(a) Profits of Joint operations (net of tax) (h) 239.29 (b) Reversal of exchange loss accumulated in foreign currency monetary item translation difference account (f ) (82.50)(c) Effect of adoption of fair value as deemed cost relating to property, plant and equipment and intangibles (net of
depreciation and amortization) (e) & (f ) 253.63
(d) Gain on fair value of below market interest loan (net of effective interest rate adjustment) (d) 50.50 (e) Reversal of gain on sale of Investment in Equity instruments classified as fair value through Other Comprehensive
Income (a) (80.38)
(f ) Fair value gain on investment in mutual funds (a) 9.34 (g) Provision for expected credit losses (c) (18.00)(h) Reversal of Profit on sale of investments on common control transactions (656.36)(i) Others (net) (12.91)(j) Tax effect on above adjustments (g) 0.86
Net loss after tax as per Ind AS (62.30)Other Comprehensive Income (net of tax) 85.47 Total Comprehensive Income after tax as per Ind AS 23.17
NOTES FORMING PART OF FINANCIAL STATEMENTS

Statutory ReportsCorporate Overview Financial Statements
F-20
(Standalone)
72nd Annual Report 2016-17
Notes to reconciliations between Previous GAAP and Ind AS (a) Investments Under Previous GAAP, investments were classified into current and long term investments. Current investments were carried at the lower of cost or market
value, while long term investments were carried at cost less any impairment that was other than temporary. Under Ind AS, equity investments have been classified as Fair Value through Other Comprehensive Income (FVTOCI). Fair value movements are recognized
directly in other comprehensive income on such investments. Investment in Mutual Funds have been classified as Fair Value through Profit or Loss (FVTPL) and fair value changes are recognized in Statment of Profit and Loss.
(b) Dividends Under Ind AS, dividends payable are recorded as a liability in the year in which these are declared and approved. Under Previous GAAP, dividends payable
were recorded as a liability in the year to which they relate.
(c) Provision for expected credit losses Financial guarantees issued by the Company are accounted in Ind AS initially at fair value and subsequently measured at the higher of the loss allowance
based on Ind AS 109; and the amount initially recognized, reduced by the amount of income recorded as per Ind AS 18. On the transition date, such contracts are measured based on the expected credit losses.
Under Previous GAAP, such estimates were determined based on experience of historic losses on such contracts. Impairment for trade receivable is measured in Ind AS based on life time expected credit losses. Expected credit loss allowance is measured based
on historical credit loss experience, defaults, bankruptcy and forward looking information where relevant adjusted for probability of recovery. Under Previous GAAP, provision for trade receivable is measured based on factors such as age of receivables, defaults etc. adjusted for probability of recovery.
(d) Gain on fair value of below market interest loans Under Ind AS, below market interest rate loan received is recorded at fair value by using an appropriate discount rate on date of obtaining the loan. The
difference between the fair value and the amount received is recognised as a gain in profit or loss as per Ind AS 20. The interest expense is recorded periodically till the maturity of the loan based on effective interest method.
Under Previous GAAP, the loan were recorded same as the amount received.
(e) Property, plant and equipment and intangible assets On the date of transition to Ind AS, the Company has elected to measure certain items of property, plant and equipment and intangible assets at fair value
and use that fair value as its deemed cost. The aggregate fair values of such property, plant and equipment is R5,647.20 crores and of related intangible assets is R1,891.97 crores. Fair value adjustments recorded to the carrying amounts is R3,447.20 crores for property, plant and equipment and R(1,103.22) crores for related Intangible assets.
Under Ind AS, all foreign exchange transaction gains and losses are recorded in net income except to the extent these are treated as an adjustment to interest cost and considered for capitalization. Under Previous GAAP, foreign exchange gains and losses arising on foreign currency denominated borrowings that were incurred to acquire property, plant and equipment and intangible assets were recorded in the cost of the asset and depreciated over their remaining useful life.
Further under Previous GAAP, the cost of property, plant and equipment also included indirectly attributable expenses that are incurred before a property, plant and equipment is ready for its intended use. Under Ind AS such costs are expensed as incurred.
Under Ind AS, import duty waivers for capital assets purchased under Export Promotion Credit Guarantee (EPCG) schemes are recorded as deferred revenue and recognized in Statment of Profit and Loss on a systematic basis over the periods in which the related performance obligations are fulfilled. On the transition date, the Company, therefore, recorded an adjustment to measure such property, plant and equipment in accordance with Ind AS 16. Under Previous GAAP, cost of the property, plant and equipment was recorded at the cash price paid to acquire such assets.
Consequently, depreciation relating to the above differences in the cost of property, plant and equipment under Ind AS and Previous GAAP has also been adjusted.
(f ) Exchange gain/(loss) accumulated in foreign currency monetary item translation difference account Under Ind AS, all exchange differences are accounted for in the statement of profit and loss in the period in which they arise. Under Previous GAAP, exchange
differences relating to long term foreign currency monetary assets/liabilities were accounted for in the following manner: (a) Differences relating to borrowings attributable to the acquisition of the depreciable capital asset were added to/deducted from the cost of such
capital assets; (b) Other differences were accumulated in foreign currency monetary item translation difference account, to be amortized over the period, beginning
April 1, 2011 or date of inception of such item, as applicable, and ending on March 31, 2020 or the date of its maturity, whichever was earlier. (g) Deferred taxes have been recorded under Ind AS for undistributed earnings of joint operations and intra company adjustments with joint operations, which
were not recorded under Previous GAAP.
(h) Accounting for Joint Operations Under Ind AS, in its separate financial statements, a joint operator shall recognize its share of assets, liabilities, revenue and expenses in a joint operation. Under Previous GAAP the interest in the joint operation was recognized as Investments and measured at cost less impairment other than temporary.
(i) Cash Flow Statement Under Ind AS, cash flow statement for the year ended March 31, 2016 includes the amounts in respect of Joint Operations. There are no other reconciling
items between cash flow statement reported under Previous GAAP and Ind AS.
NOTES FORMING PART OF FINANCIAL STATEMENTS

F-21
3. P
rope
rty,
pla
nt a
nd e
quip
men
t (R
in c
rore
s)
Owne
d as
sets
Give
n on
leas
eTa
ken
on le
ase
Tota
l
Land
Build
ings
Plan
t, m
achi
nery
an
d eq
uipm
ent
Furn
iture
an
d fix
ture
s
Vehi
cles
Com
pute
rs &
ot
her I
T as
sets
Plan
t, m
achi
nery
and
equi
pmen
t
Build
ings
Build
ings
Plan
t, m
achi
nery
and
equi
pmen
t
Com
pute
rs &
ot
her I
T as
sets
Furn
iture
an
d fix
ture
s
Cost
as at
Apr
il 1,
201
6 4
,574
.93
3,2
47.3
9 2
2,33
1.38
2
29.5
3 1
76.7
5 6
28.7
2 3
2.88
4
.05
31.
28
116
.42
174
.26
- 3
1,54
7.59
Addi
tion
s -
80.
48
1,5
17.4
7 1
1.45
2
4.33
4
0.60
-
- -
- 4
.62
4.3
1 1
,683
.26
Disp
osal
- (
0.37
) (1
07.4
3) (3
.71)
(16.
58)
(32.
27)
- -
- (7
9.99
) -
- (2
40.3
5)Co
st a
s at
Mar
ch 3
1,
2017
4,5
74.9
3 3
,327
.50
23,
741.
42
237
.27
184
.50
637
.05
32.
88
4.0
5 3
1.28
3
6.43
1
78.8
8 4
.31
32,
990.
50
Accu
mul
ated
dep
recia
tion
as at
Apr
il 1,
201
6 -
(877
.38)
(12,
072.
58)
(120
.91)
(111
.96)
(521
.59)
(17.
50)
(0.5
9) (5
.76)
(94.
72)
(151
.35)
- (1
3,97
4.34
)
Depr
ecia
tion
for t
he ye
ar -
(105
.66)
(1,
661.
23)
(12
.47)
(24
.41)
(34
.75)
(1.
76)
(0.
09)
(0.
51)
(19
.87)
(12
.01)
(0.
65)
(1,
873.
41)
Disp
osal
- 0
.10
94.
19
1.7
9 1
3.69
3
2.26
-
- -
79.
99
- -
222
.02
Accu
mul
ated
de
prec
iati
on a
s at
M
arch
31,
201
7 -
(98
2.94
)(1
3,63
9.62
) (1
31.5
9)(1
22.6
8) (
524.
08)
(19
.26)
(0.
68)
(6.
27)
(34
.60)
(16
3.36
) (
0.65
)(1
5,62
5.73
)Ne
t car
ryin
g am
ount
as at
M
arch
31,
201
7 4
,574
.93
2,3
44.5
6 1
0,10
1.80
1
05.6
8 6
1.82
1
12.9
7 1
3.62
3
.37
25.
01
1.8
3 1
5.52
3
.66
17,
364.
77
Cost
as at
Apr
il 1, 2
015
4,5
74.9
3 3
,120
.52
21,
212.
81
211
.55
170
.02
611
.92
33.
05
4.0
5 3
1.28
1
16.4
2 1
64.4
6 -
30,
251.
01
Addi
tions
- 1
28.0
4 1
,435
.86
18.
97
38.
09
26.
37
1.0
0 -
- -
9.8
0 -
1,6
58.1
3 W
rite
off o
f ass
ets
- -
(225
.79)
- -
- -
- -
- -
- (2
25.7
9)Di
spos
al -
(1.
17)
(91
.50)
(0.
99)
(31
.36)
(9.
57)
(1.
17)
- -
- -
- (
135.
76)
Cost
as at
Mar
ch 3
1, 20
16 4
,574
.93
3,2
47.3
9 2
2,33
1.38
2
29.5
3 1
76.7
5 6
28.7
2 3
2.88
4
.05
31.
28
116
.42
174
.26
- 3
1,54
7.59
Ac
cum
ulat
ed d
epre
ciatio
n as
at A
pril 1
, 201
5 -
(777
.09)
(11
,112
.42)
(109
.16)
(112
.21)
(498
.19)
(16.
13)
(0.5
0) (5
.25)
(94.
72)
(135
.44)
- (1
2,86
1.11
)
Depr
eciat
ion
for t
he ye
ar -
(100
.68)
(1,
206.
00)
(12.
61)
(26.
12)
(32.
84)
(1.8
9) (0
.09)
(0.5
1) -
(15.
91)
- (1
,396
.65)
Writ
e off
of a
sset
s -
- 1
65.4
7 -
- -
- -
- -
- -
165
.47
Disp
osal
- 0
.39
80.
37
0.8
6 2
6.37
9
.44
0.5
2 -
- -
- -
117
.95
Accu
mul
ated
dep
recia
tion
as at
Mar
ch 3
1, 20
16 -
(877
.38)
(12,
072.
58)
(120
.91)
(111
.96)
(521
.59)
(17.
50)
(0.5
9) (5
.76)
(94.
72)
(151
.35)
- (1
3,97
4.34
)Ne
t car
ryin
g am
ount
as at
M
arch
31,
2016
4,5
74.9
3 2
,370
.01
10,
258.
80 1
08.6
2 6
4.79
1
07.1
3 1
5.38
3
.46
25.
52
21.
70
22.
91
- 1
7,57
3.25
Not
es:
a)
Build
ing
incl
ude
R8,
631.
00 (a
s at M
arch
31,
201
6 R
8,63
1.00
) bei
ng v
alue
of i
nves
tmen
t in
shar
es o
f Co-
oper
ativ
e H
ousin
g So
ciet
ies.
b)
Land
incl
udes
R52
5.80
cro
res
for w
hich
tran
sfer
of t
itle
is pe
ndin
g.
c)
Dur
ing
the
year
end
ed M
arch
31,
201
7, th
e Co
mpa
ny h
as c
arrie
d ou
t a re
view
of t
he u
sefu
l life
of i
ts p
rope
rty,
plan
t and
equ
ipm
ent i
n ac
cord
ance
with
the
acco
untin
g po
licy.
Cons
ider
ing
the
phys
ical
con
ditio
n of
the
asse
ts a
nd
benc
hmar
king
ana
lysis
, the
Com
pany
has
revi
sed
the
usef
ul li
fe o
f its
ass
ets.
As a
resu
lt, th
e ne
t dep
reci
atio
n ch
arge
for t
he y
ear e
nded
Mar
ch 3
1, 2
017
is hi
gher
by
R22
2.29
cro
res.
NO
TES
FORM
ING
PA
RT O
F FI
NA
NCI
AL
STAT
EMEN
TS

Statutory ReportsCorporate Overview Financial Statements
F-22
(Standalone)
72nd Annual Report 2016-17
4Le
ases
The
Com
pany
has
take
n la
nd, b
uild
ings
, pla
nt a
nd e
quip
men
t, co
mpu
ters
and
furn
iture
and
fixt
ures
und
er o
pera
ting
and
finan
ce le
ases
. The
follo
win
g is
the
sum
mar
y of
fu
ture
min
imum
leas
e re
ntal
pay
men
ts u
nder
non
-can
cella
ble
oper
atin
g le
ases
and
fina
nce
leas
es e
nter
ed in
to b
y th
e Co
mpa
ny:
(R in
cro
res)
As
at M
arch
31,
201
7As
at M
arch
31,
201
6As
at A
pril
1, 2
015
Ope
ratin
gFi
nanc
eO
pera
ting
Fina
nce
Ope
ratin
gFi
nanc
e
Min
imum
Le
ase
Paym
ents
Min
imum
Le
ase
Paym
ents
Pres
ent
valu
e of
m
inim
um
leas
e pa
ymen
ts
Min
imum
Le
ase
Paym
ents
Min
imum
Le
ase
Paym
ents
Pres
ent
valu
e of
m
inim
um
leas
e pa
ymen
ts
Min
imum
Le
ase
Paym
ents
Min
imum
Le
ase
Paym
ents
Pres
ent
valu
e of
m
inim
um
leas
e pa
ymen
ts
Not
late
r tha
n on
e ye
ar0.
97 8
.65
8.3
6 1.
68 1
3.27
1
2.08
1.
75 1
6.86
1
5.22
Late
r tha
n on
e ye
ar b
ut n
ot la
ter t
han
five
year
s 1
.62
9.9
7 9
.44
7.8
7 1
0.68
1
0.03
7
.55
11.
94
10.
94
Late
r tha
n fiv
e ye
ars
29.
90
- -
868
.58
- -
870
.55
- -
Tota
l min
imum
leas
e co
mm
itmen
ts 3
2.49
1
8.62
1
7.80
8
78.1
3 2
3.95
2
2.11
879.
85 2
8.80
2
6.16
Le
ss: f
utur
e fin
ance
cha
rges
(0.8
2) (1
.84)
(2.6
4)
Pres
ent v
alue
of m
inim
um le
ase
paym
ents
17.
80
22.
11 2
6.16
Incl
uded
in th
e fin
anci
al s
tate
men
ts a
s:O
ther
fina
ncia
l lia
bilit
ies -
cur
rent
(ref
er n
ote
26)
8.3
6 1
2.08
1
5.22
Oth
er fi
nanc
ial l
iabi
litie
s - n
on-c
urre
nt (r
efer
not
e 25
) 9
.44
10.
03
10.
94
17.
80
22.
11
26.
16
Tota
l ope
ratin
g le
ase
rent
exp
ense
s wer
e R
28.7
9 cr
ores
and
R11
1.71
cro
res f
or th
e ye
ars e
nded
Mar
ch 3
1, 2
017
and
2016
, res
pect
ivel
y.
NO
TES
FORM
ING
PA
RT O
F FI
NA
NCI
AL
STAT
EMEN
TS

F-23
5.
Oth
er In
tang
ible
ass
ets
(R in
cro
res)
Part
icula
rsTe
chni
cal
know
how
Com
pute
r So
ftwar
ePr
oduc
t de
velo
pmen
tTo
tal
Cost
as at
Apr
il 1,
201
6 3
48.9
1 5
13.0
6 6
,796
.77
7,6
58.7
4 Ad
ditio
ns 0
.24
20.
00
445
.96
466
.20
Fully
amor
tised
not
in u
se -
- (2
,437
.76)
(2,4
37.7
6)Co
st as
at M
arch
31,
201
7 3
49.1
5 5
33.0
6 4
,804
.97
5,6
87.1
8
Accu
mul
ated
amor
tisat
ion
as at
Apr
il 1,
201
6 (1
23.4
5) (4
59.1
3) (3
,672
.69)
(4,2
55.2
7)Am
ortis
atio
n fo
r the
year
(33.
20)
(26
.80)
(1,
035.
98)
(1,
095.
98)
Fully
amor
tised
not
in u
se -
- 2
,437
.76
2,4
37.7
6
Accu
mul
ated
amor
tisat
ion
as at
Mar
ch 3
1, 2
017
(15
6.65
) (
485.
93)
(2,
270.
91)
(2,
913.
49)
Net c
arry
ing
amou
nt as
at M
arch
31,
201
7 1
92.5
0 4
7.13
2
,534
.06
2,7
73.6
9
Cost
as at
Apr
il 1, 2
015
321
.37
491
.23
6,5
36.8
2 7
,349
.42
Addi
tions
27.
54
23.
00
1,1
67.6
7 1
,218
.21
Writ
e off
of a
sset
s -
- (
907.
72)
(90
7.72
)Di
spos
al -
(1.
17)
- (
1.17
)Co
st as
at M
arch
31,
2016
348
.91
513
.06
6,7
96.7
7 7
,658
.74
Accu
mul
ated
amor
tisat
ion
as at
Apr
il 1, 2
015
(90
.95)
(42
0.87
) (
3,61
6.15
) (
4,12
7.97
)Am
ortiz
atio
n fo
r the
year
(32
.50)
(39
.43)
(86
0.64
) (
932.
57)
Writ
e off
of a
sset
s -
- 8
04.1
0 8
04.1
0
Disp
osal
- 1
.17
- 1
.17
Accu
mul
ated
amor
tisat
ion
as at
Mar
ch 3
1, 20
16 (
123.
45)
(45
9.13
) (
3,67
2.69
) (
4,25
5.27
)
Net c
arry
ing
amou
nt as
at M
arch
31,
2016
225
.46
53.
93
3,1
24.0
8 3
,403
.47
Not
e:
D
urin
g th
e ye
ar e
nded
Mar
ch 3
1, 2
017,
the
Com
pany
has
car
ried
out a
revi
ew o
f the
use
ful l
ife o
f its
pro
pert
y, pl
ant a
nd e
quip
men
t in
acco
rdan
ce w
ith th
e ac
coun
ting
polic
y. Co
nsid
erin
g th
e ph
ysic
al c
ondi
tion
of th
e as
sets
and
ben
chm
arki
ng a
naly
sis, t
he C
ompa
ny h
as re
vise
d th
e us
eful
life
of i
ts a
sset
s. As
a re
sult
the
Com
pany
has
also
re
vise
d us
eful
life
of r
elat
ed in
tang
ible
ass
ets,
ther
efor
e th
e ne
t am
ortiz
atio
n ch
arge
for t
he y
ear e
nded
Mar
ch 3
1, 2
017
is hi
gher
by
R83
.89
cror
es.
NO
TES
FORM
ING
PA
RT O
F FI
NA
NCI
AL
STAT
EMEN
TS

Statutory ReportsCorporate Overview Financial Statements
F-24
(Standalone)
72nd Annual Report 2016-17
(R in crores)
6. Investments in subsidiaries, joint ventures and associates measured at cost - non-current
As at March 31, 2017
As at March 31, 2016
As at April1, 2015
Number Face value per unit
Description
Equity sharesi) SubsidiariesUnquotedSheba Properties Ltd - - 75.00
3,03,00,600 10 Tata Technologies Ltd 224.10 224.10 224.10 6,36,97,694 10 Concorde Motors (India) Ltd [Note 4] 109.63 79.63 64.63
(3,00,00,000 shares acquired during the year) 11,50,00,000 10 TAL Manufacturing Solutions Ltd 200.00 200.00 185.00
7,70,00,000 10 TML Drivelines Ltd 448.85 448.85 448.85 25,00,000 10 Tata Motors Insurance Broking and Advisory Services Ltd [Note 3] 19.31 19.31 19.31
5,39,98,427 (GBP) 1 Tata Motors European Technical Centre PLC, (UK) (1,96,05,932 shares acquired during the year) [Note 2]
474.90 292.71 262.73
7,900 - Tata Technologies Inc, (USA) 0.63 0.63 0.63 1,31,90,20,771 10 Tata Motors Finance Ltd 2,500.00 2,500.00 2,500.00
8,67,00,000 10 Tata Marcopolo Motors Ltd 86.70 86.70 86.70 22,50,00,000 10 TML Distribution Company Ltd 225.00 225.00 225.00
2,51,16,59,418 (USD) 1 TML Holdings Pte Ltd, (Singapore) 10,158.52 10,158.52 10,158.52 1,34,523 (EUR) 31.28 Tata Hispano Motors Carrocera S.A., (Spain) 17.97 17.97 17.97
1,220 (IDR) 8,855 PT Tata Motors Indonesia 0.01 0.01 - 2,02,000 (MAD) 1,000 Tata Hispano Motors Carroceries Maghreb S.A., (Morocco) 49.59 49.59 -
1,83,59,203 (SGD) 1 Tata Precision Industries Pte. Ltd, (Singapore) 40.53 40.53 40.53 Trilix Srl., Turin (Italy) [Note 5] 11.94 11.94 11.94
1,00,000 (NGN) 1 TMNL Motor Services Nigeria Ltd - # - # - 14,567.68 14,355.49 14,320.91
Less: Provision for impairment of long term investments (214.28) 14,353.40 (104.65) 14,250.84 (55.06) 14,265.85
Advance towards InvestmentsTata Motors Eurpoean Technical Centre PLC (UK) - 43.11 -Tata Hispano Motors Carroceries Maghreb S.A., (Morocco) - - 49.59Concorde Motors (India) Ltd - - 30.00 73.11 - 49.59
14,353.40 14,323.95 14,315.44 ii) AssociatesQuoted
29,82,214 10 Automobile Corporation of Goa Ltd 108.22 108.22 108.22
Unquoted 16,000 (TK) 1,000 NITA Co. Ltd (Bangladesh) 1.27 1.27 1.27
5,23,33,170 10 Tata AutoComp Systems Ltd 77.47 77.47 77.47 4,54,28,572 10 Tata Hitachi Construction Machinery Company Private Ltd 238.50 425.46 79.50 266.46 79.50 266.46
[1,59,00,000 Preference shares converted to 56,78,572 equity shares]
(iii) Joint Ventures (JV)Unquoted
5,000 10 JT Special Vehicle (P) Ltd. 0.01 0.01 - - - - (5,000 shares acquired during the year)
Total 14,778.87 14,590.41 14,581.90 # Less than R50,000
Notes:
(1) Market Value of quoted investment 189.16 125.75 131.73
(2) The Company had given a letter of comfort to ANZ Bank, London for GBP 2 million (R16.19 crores as at March 31, 2017) against loan extended by the bank to Tata Motors European Technical Centre PLC. UK (TMETC). Also the company has given an undertaking to ANZ Bank, London to retain 51% ownership of TMETC at all times during the tenor of the loan.
(3) The Company has given a letter of comfort to HDFC Bank amounting to R1 crore against Working Capital Facility to Tata Motors Insurance Broking and Advisory Services Limited (TMIBASL). Also the company has given an undertaking to HDFC Bank that it will not dilute its stake below 51% in TMIBASL during the tenor of the loan.
(4) The Company has given a letter of comfort to Tata Capital Financial Services Limited amounting to R15 crores against credit facility extended to Concorde Motors (India) Limited (CMIL). The Company will not dilute its stake in CMIL below 100% during the tenor of the facility.
(5) Trilix Srl., Turin (Italy) is a limited liability Company.
7. Investments in subsidiaries, joint ventures and associates measured at cost-current As at March 31, 2017
As at March 31, 2016
As at April 1, 2015
Equity sharesSubsidiariesUnquotedPT Tata Motors Indonesia - - 15.54 Total - - 15.54
NOTES FORMING PART OF FINANCIAL STATEMENTS

F-25
(R in crores)
8. Investments-non-current As at March 31, 2017
As at March 31, 2016
As at April1, 2015
Number Face value per unit
Description
Investment in equity shares measured at fair value through other comprehensive income
Quoted44,32,497 10 Tata Steel Ltd 213.96 141.71 140.41
70,249 10 Tata Chemicals Ltd 4.22 218.18 2.63 144.34 3.12 143.53
Unquoted50,000 1,000 Tata International Ltd 28.85 28.85 28.85
1,383 1,000 Tata Services Ltd 0.14 0.14 0.14 350 900 The Associated Building Company Ltd 0.01 0.01 0.01
1,03,10,242 100 Tata Industries Ltd 183.19 183.19 183.19 33,600 100 Kulkarni Engineering Associates Ltd - - - 12,375 1,000 Tata Sons Ltd 68.75 68.75 68.75
2,25,00,001 10 Haldia Petrochemicals Ltd 22.50 22.50 22.50 2,40,000 10 Oriental Floratech (India) Pvt. Ltd - - -
43,26,651 15 Tata Capital Ltd 6.70 6.70 6.70 50,000 10 NICCO Jubilee Park Ltd. 0.05 310.19 0.05 310.19 0.05 310.19
Investment in preference shares measured at fair value through profit and lossa) Cumulative Redeemable Preference shares Subsidiaries Unquoted
13,54,195 100 7% Concorde Motors (India) Ltd - 13.54 13.54 b) Optionally Convertible Preference sharesAssociatesUnquoted9% Tata Hitachi Construction Machinery Company Private Ltd - 159.00 159.00 [1,59,00,000 Preference shares converted to equity shares at fair value]
Total 528.37 627.07 626.26
Notes : a) Investment in equity shares measured at fair value through other comprehensive income also include:
R R R Number Face value
per unitDescription As at
March 31, 2017As at
March 31, 2016As at
April1, 2015
20,000 10 Metal Scrap Trade Corporation Ltd. 25,000 25,000 25,000 50 5 Jamshedpur Co-operative Stores Ltd. 250 250 250
16,56,517 (M$) 1 Tatab Industries Sdn. Bhd., (Malaysia) 1 1 1 4 25,000 ICICI Money Multiplier Bond 1 1 1
100 10 Optel Telecommunications 1,995 1,995 1,995
200 10 Punjab Chemicals 1 1 1
(R in crores)
b) (1) Book Value of quoted investments 218.18 144.34 143.53 (2) Book Value of unquoted investments 310.19 310.19 310.19 (3) Market Value of quoted investments 218.18 144.34 143.53
(R in crores)
9. Investments-current As at
March 31, 2017 As at
March 31, 2016
As at
April1, 2015
Description Investment in equity shares measured at fair value through other comprehensive income
UnquotedTata Projects Ltd - - 4.68 Investments in Mutual funds measured at Fair value through profit and lossUnquotedMutual funds 2,400.92 1,745.84 - Total 2,400.92 1,745.84 4.68
NOTES FORMING PART OF FINANCIAL STATEMENTS
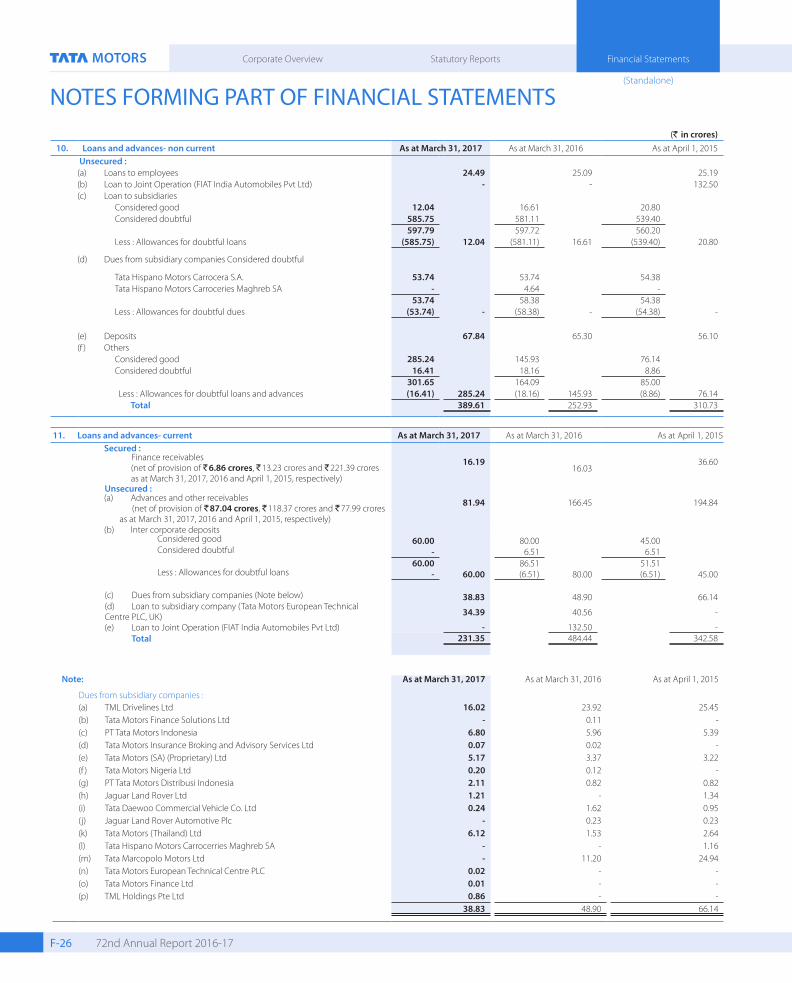
Statutory ReportsCorporate Overview Financial Statements
F-26
(Standalone)
72nd Annual Report 2016-17
(R in crores)10. Loans and advances- non current As at March 31, 2017 As at March 31, 2016 As at April 1, 2015
Unsecured : (a) Loans to employees 24.49 25.09 25.19 (b) Loan to Joint Operation (FIAT India Automobiles Pvt Ltd) - - 132.50 (c) Loan to subsidiaries Considered good 12.04 16.61 20.80 Considered doubtful 585.75 581.11 539.40
597.79 597.72 560.20 Less : Allowances for doubtful loans (585.75) 12.04 (581.11) 16.61 (539.40) 20.80
(d) Dues from subsidiary companies Considered doubtful
Tata Hispano Motors Carrocera S.A. 53.74 53.74 54.38 Tata Hispano Motors Carroceries Maghreb SA - 4.64 -
53.74 58.38 54.38 Less : Allowances for doubtful dues (53.74) - (58.38) - (54.38) -
(e) Deposits 67.84 65.30 56.10 (f ) Others Considered good 285.24 145.93 76.14 Considered doubtful 16.41 18.16 8.86
301.65 164.09 85.00 Less : Allowances for doubtful loans and advances (16.41) 285.24 (18.16) 145.93 (8.86) 76.14
Total 389.61 252.93 310.73
11. Loans and advances- current As at March 31, 2017 As at March 31, 2016 As at April 1, 2015 Secured :
Finance receivables (net of provision of R6.86 crores, R13.23 crores and R221.39 crores
as at March 31, 2017, 2016 and April 1, 2015, respectively)
16.19 16.03
36.60
Unsecured : (a) Advances and other receivables
(net of provision of R87.04 crores, R118.37 crores and R77.99 crores as at March 31, 2017, 2016 and April 1, 2015, respectively)
81.94 166.45 194.84
(b) Inter corporate deposits Considered good 60.00 80.00 45.00 Considered doubtful - 6.51 6.51
60.00 86.51 51.51 Less : Allowances for doubtful loans - 60.00 (6.51) 80.00 (6.51) 45.00
(c) Dues from subsidiary companies (Note below) 38.83 48.90 66.14 (d) Loan to subsidiary company (Tata Motors European Technical Centre PLC, UK) 34.39 40.56 -
(e) Loan to Joint Operation (FIAT India Automobiles Pvt Ltd) - 132.50 - Total 231.35 484.44 342.58
Note: As at March 31, 2017 As at March 31, 2016 As at April 1, 2015
Dues from subsidiary companies :(a) TML Drivelines Ltd 16.02 23.92 25.45 (b) Tata Motors Finance Solutions Ltd - 0.11 - (c) PT Tata Motors Indonesia 6.80 5.96 5.39 (d) Tata Motors Insurance Broking and Advisory Services Ltd 0.07 0.02 - (e) Tata Motors (SA) (Proprietary) Ltd 5.17 3.37 3.22 (f ) Tata Motors Nigeria Ltd 0.20 0.12 - (g) PT Tata Motors Distribusi Indonesia 2.11 0.82 0.82 (h) Jaguar Land Rover Ltd 1.21 - 1.34 (i) Tata Daewoo Commercial Vehicle Co. Ltd 0.24 1.62 0.95 (j) Jaguar Land Rover Automotive Plc - 0.23 0.23 (k) Tata Motors (Thailand) Ltd 6.12 1.53 2.64 (l) Tata Hispano Motors Carrocerries Maghreb SA - - 1.16 (m) Tata Marcopolo Motors Ltd - 11.20 24.94 (n) Tata Motors European Technical Centre PLC 0.02 - - (o) Tata Motors Finance Ltd 0.01 - - (p) TML Holdings Pte Ltd 0.86 - -
38.83 48.90 66.14
NOTES FORMING PART OF FINANCIAL STATEMENTS

F-27
(R in crores)
12. Other financial assets - non-currentAs at
March 31,2017
As atMarch 31,
2016
As at April1,
2015
(a) Derivative financial instruments 190.75 97.93 56.08 (b) Interest accrued on loans and deposits - - 47.68 (c) Restricted deposits 3.94 3.99 53.92 (d) Others 1.63 1.00 0.92
Total 196.32 102.92 158.60
13. Other financial assets - currentAs at
March 31,2017
As atMarch 31,
2016
As at April1,
2015
(a) Derivative financial instruments 100.36 61.78 38.17 (b) Interest accrued on loans and deposits 0.40 63.42 2.30
Total 100.76 125.20 40.47
14. Other non-current assetsAs at
March 31,2017
As atMarch 31,
2016
As at April1,
2015
(a) Capital advances 558.84 453.47 226.28
(b) Taxes recoverable, statutory deposits and dues from government 998.39 927.73 1,130.23
(c) Prepaid lease rental on operating lease 128.86 130.92 131.96
(d) Others 170.19 166.89 124.29
Total 1,856.28 1,679.01 1,612.76
15. Other current assetsAs at
March 31,2017
As atMarch 31,
2016
As at April 1,
2015
(a) Advance to suppliers and contractors 236.13 160.71 107.51
(b) VAT, other taxes recoverable, statutory deposits and dues from government 1,435.43 1,257.76 1,113.02
(c) Prepaid expenses 104.23 87.37 71.19 (d) Others 31.27 44.61 54.19
Total 1,807.06 1,550.45 1,345.91
NOTES FORMING PART OF FINANCIAL STATEMENTS

Statutory ReportsCorporate Overview Financial Statements
F-28
(Standalone)
72nd Annual Report 2016-17
17. Trade receivables-unsecuredAs at
March 31,2017
As atMarch 31,
2016
As at April 1,
2015
Considered good 2,128.00 2,045.58 1,448.39 Considered doubtful 693.17 632.10 604.74
2,821.17 2,677.68 2,053.13 Less : Allowances for doubtful debts (693.17) (632.10) (604.74)
2,128.00 2,045.58 1,448.39
For the year ended March 31,18. Allowance for trade receivables, loans and other receivables 2017 2016
Balance at the beginning 1,432.44 1,513.29
Allowances made during the year 133.72 185.14
Written off (118.61) (265.99)
Balance at the end 1,447.55 1,432.44
(R in crores)
16. InventoriesAs at
March 31,2017
As atMarch 31,
2016
As at April 1,
2015
(a) Raw materials and components 1,511.16 1,430.77 1,286.16 (b) Work-in-progress 815.70 488.54 455.35 (c) Finished goods 2,821.00 2,896.73 2,939.97 (d) Stores and spare parts 166.96 165.83 157.43 (e) Consumable tools 24.35 26.94 25.06 (f ) Goods-in-transit - Raw materials and components 165.25 109.11 155.49
Total 5,504.42 5,117.92 5,019.46
During the year ended March 31, 2017 and 2016, the Company recorded inventory write-down expenses of R180.27 crores and R136.33 crores, respectively. Cost of inventories (including cost of purchased products) recognized as expense during the year ended March 31, 2017 and March 31, 2016 amounted to R44,238.04 crores and R41,020.46 crores, respectively.
19. Cash and cash equivalentsAs at
March 31,2017
As atMarch 31,
2016
As at April 1,
2015
(a) Cash on hand 0.38 0.28 0.25 (b) Cheques on hand 0.78 59.18 6.12 (c) Balances with banks (refer note below) 117.78 183.11 872.60 (d) Deposits with Banks 69.45 184.50 187.50
188.39 427.07 1,066.47
Note: Includes remittances in transit 60.91 143.94 167.94
20. Other bank balancesAs at
March 31,2017
As atMarch 31,
2016
As at April 1,
2015With upto 12 months maturity:
(a) Earmarked balances with banks (refer note below) 86.60 291.28 83.87 (b) Bank deposits 11.07 70.07 0.07
Total 97.67 361.35 83.94
Note: Earmarked balances with banks as at March 31, 2017 of R67.50 crores (as at March 31, 2016 of R212.50 crores and as at April 1, 2015 R27.53 crores) is held as security in relation to repayment of borrowings.
NOTES FORMING PART OF FINANCIAL STATEMENTS

F-29
(R in crores)
As at March 31, 2017
As at March 31, 2016
As at April 1, 2015
21. Equity Share Capital
(a) Authorised :(i) 350,00,00,000 Ordinary shares of R2 each 700.00 700.00 700.00
(as at March 31, 2016: 350,00,00,000 Ordinary shares of R2 each)(as at April 1, 2015: 350,00,00,000 Ordinary shares of R2 each)
(ii) 100,00,00,000 ‘A’ Ordinary shares of R2 each 200.00 200.00 200.00 (as at March 31, 2016: 100,00,00,000 ‘A’ Ordinary shares of R2 each)(as at April 1, 2015: 100,00,00,000 ‘A’ Ordinary shares of R2 each)
(iii) 30,00,00,000 Convertible Cumulative Preference shares of R100 each 3,000.00 3,000.00 3,000.00 (as at March 31, 2016: 30,00,00,000 shares of R100 each)(as at April 1, 2015: 30,00,00,000 shares of R100 each) Total 3,900.00 3,900.00 3,900.00
(b) Issued [Note (k)]:(i) 288,78,43,046 Ordinary shares of R2 each 577.57 577.57 547.44
(as at March 31, 2016: 288,78,43,046 Ordinary shares of R2 each)(as at April 1, 2015: 273,71,98,287 Ordinary shares of R2 each)
(ii) 50,87,36,110 ‘A’ Ordinary shares of R2 each 101.75 101.75 96.44 (as at March 31, 2016: 50,87,36,110 ‘A’ Ordinary shares of R2 each)(as at April 1, 2015: 48,22,05,820 ‘A’ Ordinary shares of R2 each)
Total 679.32 679.32 643.88
(c) Subscribed and called up:(i) 288,73,48,428 Ordinary shares of R2 each 577.47 577.44 547.34
(as at March 31, 2016: 288,72,03,602 Ordinary shares of R2 each)(as at April 1, 2015: 273,67,13,122 Ordinary shares of R2 each)
(ii) 50,85,02,291 ‘A’ Ordinary shares of R2 each 101.70 101.70 96.40 (as at March 31, 2016: 50,84,76,704 ‘A’ Ordinary shares of R2 each)(as at April 1, 2015: 48,19,66,945 ‘A’ Ordinary shares of R2 each) Total 679.17 679.14 643.74
(d) Calls unpaid - Ordinary shares310 Ordinary shares of R2 each (R1 outstanding on each) and 260 Ordinary shares of R2 each (R0.50 outstanding on each)
(0.00)* (0.01) (0.01)
(as at March 31, 2016: 68,490 Ordinary shares of R2 each (R1 outstanding on each) and 260 Ordinary shares of R2 each (R0.50 outstanding on each))(as at April 1, 2015: 68,490 Ordinary shares of R2 each (R1 outstanding on each) and 260 Ordinary shares of R2 each (R0.50 outstanding on each))
(e) Paid-up (c+d): 679.17 679.13 643.73 (f) Forfeited Shares - Ordinary shares 0.05 0.05 0.05
Total ( e + f ) 679.22 679.18 643.78
(g) The movement of number of shares and share capital
Year ended March 31, 2017 Year ended March 31, 2016 (No. of shares) (R in crores) (No. of shares) (R in crores)
(i) Ordinary shares Balance as at April 1 288,72,03,602 577.44 273,67,13,122 547.34 Add: Rights issue of shares - - 15,04,90,480 30.10 Add: Allotment of shares held in abeyance 1,44,826 0.03 - - Balance as at March 31 288,73,48,428 577.47 288,72,03,602 577.44 (ii) ‘A’ Ordinary shares Balance as at April 1 50,84,76,704 101.70 48,19,66,945 96.40 Add: Rights issue of shares - - 2,65,09,759 5.30 Add: Allotment of shares held in abeyance 25,587 0.00* - - Balance as at March 31 50,85,02,291 101.70 50,84,76,704 101.70
(h) The entitlements to 4,94,618 Ordinary shares of R2 each (as at March 31, 2016 : 6,39,444 Ordinary shares of R2 each and as at April 1, 2015 : 4,85,165 Ordinary shares of R2 each) and 2,33,819 ‘A’ Ordinary shares of R2 each (as at March 31, 2016: 2,59,406 ‘A’ Ordinary shares of R2 each and as at April 1, 2015: 2,38,875 ‘A’ Ordinary shares of R2 each) are subject matter of various suits filed in the courts/forums by third parties for which final order is awaited and hence kept in abeyance.
(i) During the year ended, the Company has allotted 68,180 Ordinary Shares each of R2 each, previously unissued on account of unpaid calls.
* amounts less than R50,000/-
NOTES FORMING PART OF FINANCIAL STATEMENTS

Statutory ReportsCorporate Overview Financial Statements
F-30
(Standalone)
72nd Annual Report 2016-17
(j) Rights, preferences and restrictions attached to shares : (i) Ordinary shares and ‘A’ Ordinary shares, both of ₹ 2 each : The Company has two classes of shares – the Ordinary shares and the ‘A’ Ordinary shares both of R2 each (together referred to as shares). In respect of every Ordinary
share (whether fully or partly paid), voting rights shall be in the same proportion as the capital paid up on such Ordinary share bears to the total paid up Ordinary share capital of the Company. In case of every ‘A’ Ordinary share, if any resolution is put to vote on a poll or by postal ballot at any general meeting of shareholders, the holder shall be entitled to one vote for every ten ‘A’ Ordinary shares held as per the terms of its issue and if a resolution is put to vote on a show of hands, the holder of ‘A’ Ordinary shares shall be entitled to the same number of votes as available to holders of Ordinary shares.
The dividend proposed by the Board of Directors is subject to the approval of the shareholders in the ensuing Annual General Meeting. Further, the Board of Directors may also declare an interim dividend. The holders of ‘A’ Ordinary shares shall be entitled to receive dividend for each financial year at five percentage point more than the aggregate rate of dividend declared on Ordinary shares for that financial year.
In the event of liquidation, the shareholders are eligible to receive the remaining assets of the Company after distribution of all preferential amounts, in proportion to their shareholdings.
(ii) American Depository Shares (ADSs) and Global Depository Shares (GDSs) : Each ADS and GDS underlying the ADR and GDR respectively represents five Ordinary shares of R2 each. A holder of ADS and GDS is not entitled to attend or vote
at shareholders meetings. An ADS holder is entitled to issue voting instructions to the depository with respect to the Ordinary shares represented by ADSs only in accordance with the provisions of the Company’s ADSs deposit agreement and Indian Law. The depository for the ADSs and GDSs shall exercise voting rights in respect of the deposited shares by issue of an appropriate proxy or power of attorney in terms of the respective deposit agreements.
Shares issued upon conversion of ADSs and GDSs will rank pari passu with the existing Ordinary shares of R2 each in all respects including entitlement of the dividend declared.
(k) Number of shares held by each shareholder holding more than 5 percent of the issued share capital :
As at March 31, 2017 As at March 31, 2016 As at April 1, 2015
% of Issued share capital
No. of shares % of Issued share capital
No. of shares % of Issued share capital
No. of shares
(i) Ordinary shares :
(a) Tata Sons Limited 28.71% 82,89,70,378 26.98% 77,89,70,378 25.67% 70,23,33,345
(b) Tata Steel Limited * * * * 5.54% 15,16,87,515 (c) Life Insurance Corporation of India 5.18% 14,94,23,428 6.90% 19,91,44,257 * *(d) Citibank N.A. as Depository # 53,04,96,280 # 49,19,64,200 # 58,22,60,190
(ii) ‘A’ Ordinary shares :(a) HDFC Trustee Company Limited-HDFC Equity Fund 8.19% 4,16,71,282 12.95% 6,58,38,405 * *(b) HSBC Global Investment Funds A/C HSBC Global Investment
Funds Mauritius Ltd * * * * 5.16% 2,48,78,664 (c) Franklin Templeton Mutual Fund 5.96% 3,03,29,225 * * * *
# held by Citibank, N.A. as depository for American Depository Receipts (ADRs) and Global Depository Receipts (GDRs)
* Less than 5%
(l) Information regarding issue of shares in the last five years (a) The Company has not issued any shares without payment being received in cash. (b) The Company has not issued any bonus shares. (c) The Company has not undertaken any buy-back of shares.
(m) During the year ended March 31, 2016, the Company alloted 15,04,90,480 Ordinary Shares (including 3,20,49,820 shares underlying the ADRs) of R 2 each at a premium of R448 per share, aggregating R6,772.07 crores and 2,65,09,759 ‘A’ Ordinary Shares of R 2 each at a premium of R 269 per share, aggregating R 718.42 crores pursuant to the Rights issue. 1,54,279 Ordinary Shares and 20,531 ‘A’ Ordinary Shares were kept in abeyance.
Proceeds from the Rights issue have been utilised in the following manner : (R in crores)Particulars Planned Actual
Funding capital expenditure towards plant and machinery 500.00 500.00
Funding expenditure relating to research and product development 1,500.00 1,500.00 Repayment, in full or part, of certain long-term and short-term borrowings availed by the Company 4,000.00 4,000.00 General corporate purposes 1,428.00 1,425.73 Issue related expenses 70.00 64.76 Total 7,498.00 7,490.49 Less : Rights Shares held in abeyance (7.51) - Total 7,490.49 7,490.49
NOTES FORMING PART OF FINANCIAL STATEMENTS

F-31
(R in crores)
Year ended March 31,
22. A) Other components of equity 2017 2016
(a) The movement of Equity instruments through Other Comprehensive Income is as follows:
Balance at the beginning (100.96) (101.77)
Other comprehensive income/(loss) for the year 73.84 81.19
Profit on sale of unquoted equity investment - (80.38)
Balance at the end (27.12) (100.96)
(b) The movement of Hedging reserve is as follows:
Balance at the beginning 7.39 16.69
Gain/(loss) recognised on cash flow hedges 17.22 11.29
Income tax relating to gain/loss recognized on cash flow hedges (5.97) (4.07)
(Gain)/loss reclassified to profit or loss (11.30) (25.27)
Income tax relating to gain/loss reclassified to profit or loss 3.92 8.75
Balance at the end 11.26 7.39
(c) The movement of Cost of Hedging reserve is as follows:
Balance at the beginning - -
Gain/(loss) recognised on cash flow hedges 17.40 -
Income tax relating to gain/loss recognized on cash flow hedges (6.02) -
Balance at the end 11.38 -
(d) Summary of Other Components of Equity:
Equity instruments through other comprehensive income (27.12) (100.96)
Hedging reserve 11.26 7.39
Cost of hedging reserve 11.38 -
Total (4.48) (93.57)
(B) Notes to reserves(a) Capital redemption reserve
The Companies Act, 2013 (the “Companies Act”) requires that where a company purchases its own shares out of free reserves or securities premium account, a sum equal to the nominal value of the shares so purchased shall be transferred to a capital redemption reserve account and details of such transfer shall be disclosed in the balance sheet. The capital redemption reserve account may be applied by the company, in paying up unissued shares of the company to be issued to shareholders of the company as fully paid bonus shares. Tata Motors Limited established this reserve pursuant to the redemption of preference shares issued in earlier years.
(b) Debenture redemption reserve The Companies Act requires that where a company issues debentures, it shall create a debenture redemption reserve out of profits of the company available for payment of
dividend. The company is required to maintain a Debenture Redemption Reserve of 25% of the value of debentures issued, either by a public issue or on a private placement basis. The amounts credited to the debenture redemption reserve may not be utilized by the company except to redeem debentures.
(c) Dividends The final dividend is recommended by the Board of Directors and is recorded in the books of account upon its approval by the shareholders. For the year ended March 31,
2016, dividend per share of R0.20 per Ordinary share of R2 each and R0.30 per ‘A’ Ordinary share of R2 each was declared.
For the year ended March 31, 2017, considering the losses in the Tata Motors Limited (Standalone), no dividend is permitted to be paid to the Members, as per the Companies Act, 2013 and the Rules framed thereunder.
NOTES FORMING PART OF FINANCIAL STATEMENTS

Statutory ReportsCorporate Overview Financial Statements
F-32
(Standalone)
72nd Annual Report 2016-17
(R in crores)
23. Long-term borrowings As at March 31,2017
As at March 31,2016
As at April 1,2015
Secured:
(a) Privately placed Non-Convertible Debentures (refer note I (i) (a) and I (ii) (a))
700.00 700.00 700.00
(b) Term loans:
(i) from banks (refer note I (i) (d)) 621.57 383.35 176.04
(ii) buyer’s line of credit (at floating interest rate) (refer note I (i) (b)) - 14.31 76.12
(iii) others (refer note I (i) (c)) 130.16 106.08 83.30
(c) Finance lease obligations 9.44 10.03 10.94
1,461.17 1,213.77 1,046.40
Unsecured:
(a) Privately placed Non-Convertible Debentures (refer note I (ii) (b)) 5,898.57 3,950.00 5,000.00
(b) Term loan from banks
Buyer’s line of credit (at floating interest rate) (refer note 1 (iii)) 1,500.00 506.31 1,428.11
(c) Senior notes (note 1 (iv)) 4,826.35 4,923.76 4,634.91
(d) Others - 6.12 125.46
12,224.92 9,386.19 11,188.48
Total 13,686.09 10,599.96 12,234.88
24. Short-term borrowings As at March 31,2017
As at March 31,2016
As at April 1,2015
Secured:
Loans from banks (refer note II) 1,662.95 2,711.86 3,966.24
1,662.95 2,711.86 3,966.24
Unsecured:
(a) Loans from banks 46.33 45.85 744.67
(b) Inter corporate deposits from subsidiaries and associates 394.00 472.45 288.75
(c) Commercial paper 3,272.24 424.56 3,173.36
3,712.57 942.86 4,206.78
Total 5,375.52 3,654.72 8,173.02
NOTES FORMING PART OF FINANCIAL STATEMENTS

F-33
(ii) Schedule of repayment and redemption for Non-Convertible Debentures : (R in crores) Non-Convertible Debentures (NCDs) Redeemable on Principal(a) Secured :
10.25% Non-Convertible Debentures (2025) # April 30, 2025 150.00 10.25% Non-Convertible Debentures (2024) # April 30, 2024 150.00 10.25% Non-Convertible Debentures (2023) # April 30, 2023 100.00 10.25% Non-Convertible Debentures (2022) # April 30, 2022 100.00 9.95% Non-Convertible Debentures (2020) March 2, 2020 200.00 # The Company has a call option to redeem, either in part or full, at the end of 8th year from the date of allotment i.e. April 30, 2018.
I. Information regarding long-term borrowings (i) Nature of security (on loans including interest accrued thereon) : (a) Rated, Listed, Secured, 9.95% Coupon, Non-Convertible Debentures amounting to R200 crores and 10.25% Coupon, Non-Convertible Debentures amounting to R500
crores are secured by a pari passu charge by way of an English mortgage of the Company’s freehold land together with immovable properties, plant and machinery and other movable assets (excluding stock and book debts) situated at Sanand in the State of Gujarat.
(b) Buyers line of credit from banks are secured by hypothecation of existing current assets of the Company viz. stock of raw materials, stock in process, semi-finished goods, stores and spares not relating to plant and machinery (consumable stores and spares), bills receivable and book debts including receivable from hire purchase / leasing and all other movable current assets except cash and bank balances, loans and advances of the Company both present and future. Classified under other current liabilities being maturity before March 31, 2018.
Buyers credit facility taken by joint operation Tata Cummins Private Ltd are obtained in multiple tranches and are repayable at the end of three years from the individual drawdown dates commencing from 2016-2017. Interest @ LIBOR + Spread is payable. The loan is secured by pari passu charge on plant and machinery and other movable assets of its Phaltan plant.
(c) The term loan of R581.00 crores (recorded in books at R120.82 crores) is due for repayment from the quarter ending March 31, 2033 to quarter ending March 31, 2037, along with simple interest at the rate of 0.10% p.a. The loan is secured by a second and subservient charge (creation of charge is under process) over Company’s freehold land together with immovable properties, plant and machinery and other movable assets (excluding stock and book debts) situated at Sanand plant in the State of Gujarat.
The term loan of R31.69 crores (recorded in books at R9.34 crores) is due for repayment from the quarter ending June 30, 2030 to March 31, 2032, along with a simple interest of 0.10% p.a. The loan is secured by bank guarantee for the due performance of the conditions as per the terms of the agreement.
(d) Term loan is taken by joint operation Fiat India Automobiles Private Ltd which is due for repayment from December 2017 to May 2023. The loan is secured by first charge over fixed assets procured from its loan/jeep project.
Term loan taken by joint operation Tata Cummins Private Ltd is repayable in four equal quarterly instalments starting from December 2016. Interest rate is based on prevailing Base rate + fixed spread. The loan is secured by exclusive charge on factory land and building of its Phaltan plant and hypothecation charge on other movable assets on pari passu basis.
(R in crores)Non-Convertible Debentures (NCDs) Redeemable on Principal
(b) Unsecured :9.77% Non-Convertible Debentures (2024) September 12, 2024 200.00 9.81% Non-Convertible Debentures (2024) August 20, 2024 300.00 9.35% Non-Convertible Debentures (2023) November 10, 2023 400.00 9.60% Non-Convertible Debentures (2022) October 29, 2022 400.00 7.71% Non-Convertible Debentures (2022) March 3, 2022 500.00 9.02% Non-Convertible Debentures (2021) December 10, 2021 300.00 7.50% Non-Convertible Debentures (2021) October 20, 2021 300.00 7.84% Non-Convertible Debentures (2021) September 27, 2021 500.00 8.40% Non-Convertible Debentures (2021) May 26, 2021 300.00 9.73% Non-Convertible Debentures (2020) October 1, 2020 400.00 9.70% Non-Convertible Debentures (2020) June 18, 2020 150.00 9.75% Non-Convertible Debentures (2020) May 24, 2020 100.00 9.90% Non-Convertible Debentures (2020) May 7, 2020 150.00 9.71% Non-Convertible Debentures (2019) October 1, 2019 300.00 8.00% Non-Convertible Debentures (2019) August 1, 2019 400.00 10.00% Non-Convertible Debentures (2019) May 28, 2019 110.00 9.69% Non-Convertible Debentures (2019) March 29, 2019 200.00 8.25% Non-Convertible Debentures (2019) January 28, 2019 300.00 10.30% Non-Convertible Debentures (2018) November 30, 2018 190.00 8.13% Non-Convertible Debentures (2018) July 18, 2018 400.00 9.45% Non-Convertible Debentures (2018) March 29, 2018 * 200.00 10.00% Non-Convertible Debentures (2017) May 26, 2017 * 250.00 Debt issue cost (1.43)* Classified as other current liabilities being maturity before March 31, 2018
(iii) The buyers line of credit from banks is repayable within a maximum period of four years from the drawdown dates. All the repayments are due from financial year ending March 31, 2018 to financial year ending March 31, 2021.
(iv) Schedule of repayment of Senior Notes: (R in crores)Redeemable on Currency Amount (in million) As at March 31, 2017 As at March 31, 2016 As at April1, 2015
w4.625% Senior Notes April 30, 2020 USD 500 3,230.54 3,282.51 3,089.94 5.750% Senior Notes October 30, 2024 USD 250 1,595.81 1,641.25 1,544.97
4,826.35 4,923.76 4,634.91
II. Information regarding short-term borrowingsLoans, cash credits, overdrafts and buyers line of credit from banks are secured by hypothecation of existing current assets of the Company viz. stock of raw materials, stock in process, semi-finished goods, stores and spares not relating to plant and machinery (consumable stores and spares), bills receivable and book debts including receivable from hire purchase / leasing and all other moveable current assets except cash and bank balances, loans and advances of the Company both present and future.
III. Collateral Inventory, trade receivables, other financial assets, property, plant and equipment with a carrying amount of R4,460.45 crores, R5,921.33 crores and R7,328.17 crores are pledged as collateral/ security against the borrowings as at March 31, 2017, 2016 and April 1, 2015, respectively.
NOTES FORMING PART OF FINANCIAL STATEMENTS

Statutory ReportsCorporate Overview Financial Statements
F-34
(Standalone)
72nd Annual Report 2016-17
(R in crores)
25. Other financial liabilities – non-current As atMarch 31,
2017
As atMarch 31,
2016
As at April 1,
2015(a) Deferred payment liability - 70.08 126.41 (b) Derivative financial instruments 0.55 0.67 23.55 (c) Financial guarantee contracts 995.08 2,760.29 3,495.05 (d) Interest accrued but not due on borrowings - 0.07 22.37 (e) Liability towards employee separation scheme 65.27 69.40 80.05 (f ) Others 62.76 11.33 2.33 Total 1,123.66 2,911.84 3,749.76
26. Other financial liabilities – current As atMarch 31,
2017
As atMarch 31,
2016
As at April 1,
2015(a) Current maturities of long-term borrowings (refer note below) 512.37 2,218.66 1,217.85(b) Financial guarantee contracts 1,050.00 631.00 214.08 (c) Interest accrued but not due on borrowings 449.73 453.41 469.76 (d) Liability for capital expenditure 109.94 128.30 95.38 (e) Deposits and retention money 197.83 212.22 198.66 (f ) Derivative financial instruments 9.38 6.28 4.29 (g) Deferred payment liability 70.08 64.50 59.75 (h) Liability towards Investors Education and Protection Fund under Section 125 of the Companies Act, 2013 not due
(i) Unpaid dividends 13.48 14.37 17.22 (ii) Unpaid matured deposits and interest thereon 14.09 18.60 21.69 (iii) Unpaid debentures and interest thereon 0.18 0.22 0.22
(i) Others 38.06 36.63 26.00 Total 2,465.14 3,784.19 2,324.90
Details of Current maturities of long-term borrowings :(i) Non Convertible Debentures (refer note I (ii) (b)) 450.00 900.00 900.00 (ii) Current maturities of finance lease obligations 8.36 12.08 15.22 (iii) Loans from Banks (refer note I (i) (d)) 34.94 180.78 164.40 (iv) Buyers Credit (Capex) (refer note I (i) (b)) 19.07 989.98 138.23 (v) Loan others - 135.82 - Total 512.37 2,218.66 1,217.85
27. Provisions-non current As at
March 31,2017
As atMarch 31,
2016
As at April 1,
2015(a) Employee benefits obligations 587.51 553.53 543.10 (b) Warranty 246.54 187.37 155.87 (c) Annual maintenance contract (AMC) 16.66 9.99 12.57
Total 850.71 750.89 711.54
28. Provisions-current As atMarch 31,
2017
As atMarch 31,
2016
As at April 1,
2015(a) Employee benefit obligations 23.41 22.00 24.38
(b) Warranty 410.84 410.48 338.10
(c) Annual maintenance contract (AMC) 33.73 17.79 16.29
Total 467.98 450.27 378.77
Note Year ended March 31, 2017AMC and Warranty provision movement AMC Warranty
Balance at the beginning 27.78 597.85 Provision made/(reversal) during the year 31.42 486.27 Provision used during the year (8.81) (460.62) Impact of discounting - 33.88 Balance at the end 50.39 657.38 Current 33.73 410.84 Non-current 16.66 246.54
NOTES FORMING PART OF FINANCIAL STATEMENTS

F-35
29. Income taxes
(R in crores)
The reconciliation of estimated income tax to income tax expense is as follows:
Year ended March 31, 2017 2016
Profit / (Loss) before taxes (2,420.77) (67.10)
Income tax expense at tax rates applicable to individual entities (837.78) (23.22)
Additional deduction for research and product development cost (697.87) (738.40)
Items (net) not deductible for tax/not liable to tax :
- foreign currency (gain)/loss relating to loans and deposits (net) - 46.78
- interest and other expenses relating to borrowings for investment 21.46 21.11
- Dividend from subsidiaries, joint operations, associates and investments measured at fair value through other comprehensive income (58.70) (122.79)Undistributed earnings of joint operations 28.19 2.69
Deferred tax assets not recognized as realization is not probable 1,700.51 973.28
Utilization/credit of unrecognised tax losses, unabsorbed depreciation and other tax benefits (62.24) (82.01)
Reversal of tax provision for previous years (15.78) (74.15)
Others (18.57) (8.09)
Income tax expense reported 59.22 (4.80)
Significant components of deferred tax assets and liabilities for the year ended March 31, 2017 are as follows:
Opening balance
Recognized in profit or loss
Recognized in/reclassified
from OCI
Closing balance
Deferred tax assets:Depreciation carry forwards 1,984.14 562.02 - 2,546.16Business loss carry forwards 1,531.47 46.54 - 1,578.01Expenses deductible in future years:
- provisions, allowances for doubtful receivables and others 1,440.93 (463.32) - 977.61
Compensated absences and retirement benefits 111.36 4.61 (3.79) 112.18
Minimum alternate tax carry-forward 16.82 12.96 - 29.78 Intangible assets 7.47 (0.90) - 6.57 Others 93.88 33.31 - 127.19Total deferred tax assets 5,186.07 195.22 (3.79) 5,377.50
Deferred tax liabilities:
Property, plant and equipment 2,663.29 (38.63) - 2,624.66Intangible assets 2,519.18 216.26 - 2,735.44Undistributed earnings in joint operations 36.88 26.36 * - 63.24 Derivative financial instruments 3.91 10.63 8.07 22.61Others 34.20 (4.70) - 29.50Total deferred tax liabilities 5,257.46 209.92 8.07 5,475.45 Deferred tax liabilities (net) (71.39) (14.70) (11.86) (97.95)
* Net of R1.83 crores reversed on dividend distribution by joint operation.
NOTES FORMING PART OF FINANCIAL STATEMENTS

Statutory ReportsCorporate Overview Financial Statements
F-36
(Standalone)
72nd Annual Report 2016-17
As at March 31, 2017, unrecognized deferred tax assets amount to R1,532.70 crores and R5,198.01 crores, which can be carried forward indefinitely and up to a specified period, respectively. These relate primarily to business losses, depreciation carry forwards and other deductible temporary differences. The deferred tax asset has not been recognized on the basis that its recovery is not probable in the foreseeable future.
Unrecognized deferred tax assets expire unutilized based on the year of origination as follows: (Rin crores)
March 31, Amount
2021 258.652022 25.88Thereafter 4,913.48
Significant components of deferred tax assets and liabilities for the year ended March 31, 2016 are as follows:
(Rin crores)
Opening balance
Recognized in profit or loss
Recognized in/reclassified
from OCI
Closing balance
Deferred tax assets:
Depreciation carry forwards 1,558.79 425.35 - 1,984.14
Business loss carry forwards 1,537.55 (6.08) - 1,531.47
Expenses deductible in future years:
- provisions, allowances for doubtful receivables and others 1,579.27 (138.34) - 1,440.93
Compensated absences and retirement benefits 103.65 14.90 (7.19) 111.36
Minimum alternate tax carry-forward 12.19 4.63 - 16.82
Intangible assets 9.15 (1.68) - 7.47
Others 86.00 7.88 - 93.88
Total deferred tax assets 4,886.60 306.66 (7.19) 5,186.07 Deferred tax liabilities:
Property, plant and equipment 2,583.12 80.17 - 2,663.29
Intangible assets 2,304.71 214.47 - 2519.18
Undistributed earnings of joint operations 36.02 0.86 * - 36.88
Derivative financial instruments 8.59 - (4.68) 3.91
Others 20.50 13.70 - 34.20
Total deferred tax liabilities 4,952.94 309.20 (4.68) 5,257.46
Deferred tax liabilities (net) (66.34) (2.54) (2.51) (71.39)
* Net of R1.83 crores reversed on dividend distribution by joint operation.
NOTES FORMING PART OF FINANCIAL STATEMENTS

F-37
(R in crores)
30. Other non-current liabilities As atMarch 31,
2017
As atMarch 31,
2016
As atApril1,
2015(a) Deferred revenue (refer note below) 270.40 261.73 249.26
(b) Lease rent - 75.58 67.32
(c) Employee Benefit Obligations - Funded 42.79 26.11 39.83
(d) Others 8.05 14.65 24.45
Total 321.24 378.07 380.86
31. Other current liabilities As atMarch 31,
2017
As atMarch 31,
2016
As atApril1,
2015(a) Liability for advances received 849.51 728.65 498.79
(b) Statutory dues (VAT, Excise, Service Tax, Octroi etc) 799.04 713.83 619.01
(c) Deferred revenue (refer note below) 157.65 165.85 145.30
(d) Others 57.82 96.51 36.16
Total 1,864.02 1,704.84 1,299.26
Note: Deferred revenue includes R 227.92 crores as at March 31, 2017 (R 249.22 crores as at March 31, 2016 and R 235.19 crores as at April 1, 2015) grants relating to property, plant
and equipment relate to duty saved on import of capital goods and spares under the EPCG scheme. Under such scheme, the Company is committed to export prescribed times of the duty saved on import of capital goods over a specified period of time. In case such commitments are not met, the Company would be required to pay the duty saved along with interest to the regulatory authorities.
NOTES FORMING PART OF FINANCIAL STATEMENTS
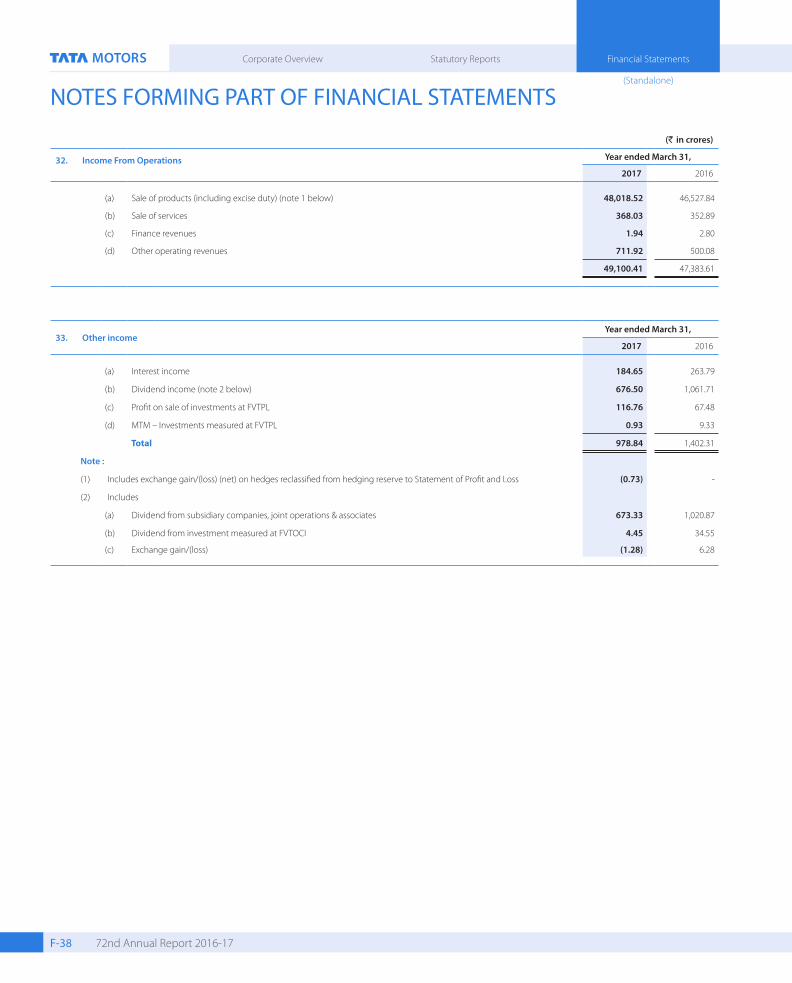
Statutory ReportsCorporate Overview Financial Statements
F-38
(Standalone)
72nd Annual Report 2016-17
(R in crores)
32. Income From Operations Year ended March 31,
2017 2016
(a) Sale of products (including excise duty) (note 1 below) 48,018.52 46,527.84
(b) Sale of services 368.03 352.89
(c) Finance revenues 1.94 2.80
(d) Other operating revenues 711.92 500.08
49,100.41 47,383.61
33. Other incomeYear ended March 31,
2017 2016
(a) Interest income 184.65 263.79
(b) Dividend income (note 2 below) 676.50 1,061.71
(c) Profit on sale of investments at FVTPL 116.76 67.48
(d) MTM – Investments measured at FVTPL 0.93 9.33
Total 978.84 1,402.31
Note :
(1) Includes exchange gain/(loss) (net) on hedges reclassified from hedging reserve to Statement of Profit and Loss (0.73) -
(2) Includes
(a) Dividend from subsidiary companies, joint operations & associates 673.33 1,020.87
(b) Dividend from investment measured at FVTOCI 4.45 34.55
(c) Exchange gain/(loss) (1.28) 6.28
NOTES FORMING PART OF FINANCIAL STATEMENTS

F-39
(R in crores)
34. Employee benefits expenseYear ended March 31,
2017 2016
(a) Salaries, wages and bonus 2,991.44 2,666.38
(b) Contribution to provident fund and other funds 196.01 188.29
(c) Staff welfare expenses 371.07 334.30
Total 3,558.52 3,188.97
35. Finance costYear ended March 31,
2017 2016
(a) Interest 1,670.82 1,607.71
Add: Exchange fluctuation considered as interest cost - 41.11
Less: Transferred to capital account (451.00) (429.69)
1,219.82 1,219.13
(b) Discounting charges 370.33 372.87
Total 1,590.15 1,592.00
Note: The weighted average rate for capitalisation of interest relating to general borrowings was approximately 7.63 % and 8.54 % for the years ended March 31, 2017 and 2016, respectively.
36. Other expensesYear ended March 31,
2017 2016 (a) Processing charges 1,522.44 1,507.21
(b) Consumption of stores & spare parts 579.09 519.37
(c) Power and fuel 440.03 430.77
(d) Freight, transportation, port charges etc. 1,541.88 1,296.71
(e) Publicity 848.36 670.01
(f ) Warranty expenses 486.27 492.11
(g) Information technology/computer expenses 762.37 631.93
(h) Allowances for trade and other receivables 133.72 138.79
(i) Works operation and other expenses (note below) 2,383.26 2,529.75
Total 8,697.42 8,216.65
Note : Works operation and other expenses include (a) Auditors’ remuneration (excluding service tax) (i) Audit Fees 7.77 5.53 (ii) Audit Fees for financial statements as per IFRS (including SOX certification) 3.59 3.85 (iii) In other Capacities : - Company law matters (R47,500 for 2016-17, R48,534 for 2015-16) 0.00 0.00
- Tax audit/Transfer pricing audit 0.70 0.74
- Taxation matters 0.08 0.19
(iv) Other services* 1.42 0.91
(v) Reimbursement of travelling and out-of-pocket expenses 0.88 0.62
* - Includes payment to an affiliate firm of statutory auditors 0.56 0.58
- Excludes audit fees debited to Securities Premium Account related to Rights issue - 1.70
(b) Cost Auditors’ remuneration (excluding service tax) : (i) Cost Audit fees 0.20 0.20
(ii) Reimbursement of travelling and out-of-pocket expenses - 0.01
(c) Works operation and other expenses for the year 2016-17 includes R25.94 crores (R20.57 crores for the year 2015-16) spent by Tata Motors Ltd on standalone basis excluding interest in the joint operations, towards various schemes of Corporate Social Responsibility (CSR) as prescribed under Section 135 of the Companies Act, 2013. No amount has been spent on construction/acquisition of an asset of the Company. The prescribed CSR expenditure required to be spent in the year 2016-17 as per the Companies Act, 2013 is RNil, in view of average net profits of the Company being RNil (under section 198 of the Act) for last three financial years.
37. Exceptional item VI (e) of R147.93 crores for the year ended March 31, 2017, relates to provision for inventory of BSIII vehicles as at March 31, 2017. This does not include higher level of customer discounts and variable marketing expenses in March 2017, to support higher level of retail sales, which have been netted off against ‘Income from operations’.
NOTES FORMING PART OF FINANCIAL STATEMENTS

Statutory ReportsCorporate Overview Financial Statements
F-40
(Standalone)
72nd Annual Report 2016-17
38. Commitments and contingencies In the ordinary course of business, the Company faces claims and assertions by various parties. The Company assesses such claims and assertions and monitors
the legal environment on an ongoing basis, with the assistance of external legal counsel, wherever necessary. The Company records a liability for any claims where a potential loss is probable and capable of being estimated and discloses such matters in its financial statements, if material. For potential losses that are considered possible, but not probable, the Company provides disclosure in the financial statements but does not record a liability in its accounts unless the loss becomes probable.
The following is a description of claims and assertions where a potential loss is possible, but not probable. The Company believes that none of the contingencies described below would have a material adverse effect on the Company’s financial condition, results of operations or cash flows.
Litigation The Company is involved in legal proceedings, both as plaintiff and as defendant. There are claims which the Company does not believe to be of material nature,
other than those described below.
Income Tax The Company has ongoing disputes with Income Tax Authorities relating to tax treatment of certain items. These mainly include disallowed expenses, the tax
treatment of certain expenses claimed by the Company as deductions and the computation of, or eligibility of, the Company’s use of certain tax incentives or allowances.
Most of these disputes and/or disallowances, being repetitive in nature, have been raised by the income tax authorities consistently in most of the years.
The Company has a right of appeal to the Commissioner of Income Tax (Appeals), or CIT (A), the Dispute Resolution Panel, or DRP, and to the Income Tax Appellate Tribunal, or ITAT, against adverse decisions by the assessing officer, DRP or CIT (A), as applicable. The income tax authorities have similar rights of appeal to the ITAT against adverse decisions by the CIT (A) or DRP. The Company has a further right of appeal to the High Court of Bombay or Supreme Court against adverse decisions by the appellate authorities for matters involving substantial question of law. The income tax authorities have similar rights of appeal.
As at March 31, 2017, there are matters and/or disputes pending in appeal amounting to R145.43 crores (R108.15 crores as at March 31, 2016 and R100.56 crores as at April 1, 2015).
Customs, Excise Duty and Service Tax As at March 31, 2017, there are pending litigation for various matters relating to customs, excise duty and service taxes involving demands, including interest and
penalties, of R1,324.19 crores (R1,284.60 crores as at March 31, 2016 and R1,334.21 crores as at April 1, 2015). These demands challenged the basis of valuation of the Company’s products and denied the Company’s claims of Central Value Added Tax, or CENVAT, credit on inputs. The details of the demands for more than R20 crores are as follows:
As at March 31, 2017, the Excise Authorities had denied a CENVAT credit of R29.43 crores and imposed a penalty of R Nil for the period between April 2011 to September 2012 (R52.41 crores and a R23.00 crores CENVAT credit and penalty, respectively, as at March 31, 2016 and R52.41 crores and a R23.00 crores CENVAT credit and penalty, respectively, as at April 1, 2015) in respect of consulting engineering services alleged to have been used exclusively for producing prototypes at the Engineering Research Centre, in Pune. The contention of the Excise Authorities is that since the Company claims exemptions from CENVAT under Notification No.167/71-CE, dated September 11, 1971, the Company is not entitled to avail service tax credits on consulting engineering services used in the Engineering Research Centre. The matter is being contested by the Company before the appellate authorities. The Company believes it has a merit in its case, since the consulting engineering services are not exclusively used in the manufacture of prototypes and they form part of the assessable value of final products manufactured by the Company on which CENVAT is paid.
The Excise Authorities have raised a demand for R90.72 crores as at March 31, 2017 (R90.72 crores as at March 31, 2016 and R90.72 crores as at April 1, 2015), on account of alleged undervaluation’s of ex-factory discounts given by Company on passenger vehicles through invoices. The matter is being contested by the Company before the High Court of Bombay.
As at March 31, 2017, the Excise Authorities have raised a demand and penalty of R218.23 crores, (R198.56 crores as at March 31, 2016 and R187.60 crores as at April 1, 2015), due to the classification of certain chassis (as dumpers instead of goods transport vehicles) which were sent to automotive body builders by the Company, which the Excise Authorities claim requires the payment of the National Calamity Contingent Duty, or NCCD. The Company has obtained a technical expert certificate on the classification. The appeal is pending before the Custom Excise & Service Tax Appellate Tribunal.
The Excise Authorities had denied the Company’s claim of a CENVAT credit of R24.96 crores (R22.74 crores as at March 31, 2016 and R83.67 crores as at April 1, 2015) claimed by the Company from Fiscal 1992 to Fiscal 2013, on technical grounds. The matter is being contested by the Company before the appellate authorities.
As at March 31, 2017, the Excise Authorities had levied penalties and interest amounting to R679.88 crores (R679.88 crores as at March 31, 2016 and R679.88 crores as at April 1, 2015) with respect to CENVAT credit claimed by the Company from March 2010 to November 2012, on inputs, stating that vehicles manufactured at Uttarakhand plant are “Exempted Products” and the Company may not claim a CENVAT credit on these vehicles. The Company has challenged this demand as NCCD and the automobile cess is assessed on those vehicles, which are “duties of excise”. Therefore, the Company asserts that these vehicles are not “Exempted Products”. The matter is being contested by the Company before the appellate authorities.
As at March 31, 2017, the Excise Authorities have raised a demand amounting to R29.54 crores (R29.54 crores as at March 31, 2016 and R29.54 crores as at April 1, 2015) on pre-delivery inspection charges and free after-sales service charges incurred by dealers on certain of the Company’s products on the alleged grounds that the pre-delivery inspection charges and free after-sales services are provided by the dealer on behalf of the Company and should be included in excisable value of the vehicle. The case is pending before Tribunal.
As at March 31, 2017, the Excise Authorities have raised a demand amounting to R Nil (R21.89 crores as at March 31, 2016 and R21.89 crores as at April 1, 2015) with respect to customs duties on dies and fixtures imported under the EPCG Scheme and, in the case of the fixtures, are installed at premises of a vendor. The Tribunal has rejected the stay application filed by the department. The department has further filed an appeal with CESTAT.
As at March 31, 2017, the Excise Authorities have raised demand amounting to R34.68 crores (R14.73 crores as at March 31, 2016 and R12.70 crores as at April 1, 2015) with respect to denial of CENVAT credit on service tax availed on freight outward and courier services. The Company asserts that since freight forms part

F-41
of the services on which the taxes have been paid, CENVAT credit can be availed. The Company is contesting the show cause notice.
Sales Tax The total sales tax demands (including interest and penalty), that are being contested by the Company amount to R949.69 crores (R1134.14 crores as at March 31, 2016
and R 907.84 crores as at April 1, 2015). The details of the demands for more than R20 crores are as follows:
The Sales Tax Authorities have raised demand of R208.59 crores (R403.38 crores as at March 31, 2016 and R120.12 crores as at April 1, 2015) towards rejection of certain statutory forms for concessional lower/nil tax rate (Form F and Form C) on technical grounds such as late submission, single form issued against different months / quarters dispatches / sales, etc. and denial of exemption from tax in absence of proof of export for certain years. The Company has contended that the benefit cannot be denied on technicalities, which are being complied with. The matter is pending at various levels.
In some of the states in India, the Sales Tax Authorities have raised disputes totaling up to R40.80 crores as at March 31, 2017 (R41.10 crores as at March 31, 2016 and R 41.10 crores as at April 1, 2015), treating the stock transfers of vehicles from the Company’s manufacturing plants to regional sales offices and the transfers between two regional sales offices as sales liable for levy of sales tax. The Company is contesting this issue.
The Sales Tax authorities have denied input tax credit and levied interest and penalty thereon due to varied reasons aggregating to R305.46 crores as at March 31, 2017 (R330.17 crores as at March 31, 2016 and R366.45 crores as at April 1, 2015). The reasons for disallowing credit was mainly due to Taxes not paid by Vendors, incorrect method of calculation of set off as per the department, alleging suppression of sales as per the department etc. The matter is contested in appeal.
Sales tax demand aggregating R258.35 crores as at March 31, 2017 (R252.66 crores as at March 31, 2016 and R258.40 crores as at April 1, 2015) has been raised by Sales Tax Authorities disallowing the concessional rate of 2% on certain purchases of raw materials in case the final product is stock transferred for sale outside the state. The matter is pending with various authorities.
Other Taxes and Dues Other amounts for which the Company may contingently be liable aggregate to R221.14 crores (R229.42 crores as at March 31, 2016 and R258.09 crores as at April 1,
2015). Following are the cases involving more than R20 crores:
The municipal authorities in certain states levy octroi duty (a local indirect tax) on goods brought inside the municipal limits at rates based on the classification of goods. Demands aggregating R61.65 crores as at March 31, 2017 (R61.65 crores as at March 31, 2016 and R61.65 crores as at April 1, 2015) had been raised demanding higher octroi duties on account of classification disputes relating to components purchased for the manufacture of vehicles and retrospective increase in octroi rates relating to past periods. The dispute relating to classification is presently pending before the Supreme Court and the other dispute is pending before the Bombay High Court on remand by the Supreme Court.
As at March 31, 2017, property tax amounting to R53.70 crores (R50.56 crores as at March 31, 2016 and R49.10 crores as at April 1, 2015) has been demanded by the local municipal authorities in respect of vacant land of the Company in the plant in Pimpri, Pune. The Company has filed Special Leave Petition (SLP) before the Supreme Court against an unfavourable decision of the Bombay High Court. The Supreme Court has disposed of the SLP and remanded the matter back to the local municipal corporation for fresh adjudication.
As at March 31, 2017, a penalty of R20.31 crores (R20.31 crores as at March 31, 2016 and R56.21 crores as at April 1, 2015) is likely to be imposed relating to a matter of regularization of construction of certain buildings in respect of which approvals from appropriate authorities are awaited. However, as the buildings were constructed as per the applicable development rules, the Company believes it will be possible to get the waiver of the same.
As at March 31, 2017, Sales tax / VAT amounting to R 29.95 crores (R24.10 crores as at March 31, 2016 and R15.10 crores as at April 1, 2015) has been demanded by local authorities on dealers in respect of spare parts used for carrying out warranty repairs. The dispute is pending before the Supreme Court.
Commitments The Company has entered into various contracts with vendors and contractors for the acquisition of plant and machinery, equipment and various civil contracts of a capital
nature amounting to R1,493.73 crores at March 31, 2017 (R1,953.50 crores as at March 31, 2016 and R1,074.51 crores as at April 1, 2015), which are yet to be executed.
The Company has entered into various contracts with vendors and contractors for the acquisition of intangible assets of a capital nature amounting to R420.06 crores as at March 31, 2017 (R398.25 crores as at March 31, 2016 and R382.02 crores as at April 1, 2015), which are yet to be executed.
The Company has contractual obligation towards Purchase Commitment for R Nil (R1,603.90 crores as at March 31, 2016 and R3,206.79 crores as at April 1, 2015).

Statutory ReportsCorporate Overview Financial Statements
F-42
(Standalone)
72nd Annual Report 2016-17
NOTES FORMING PART OF FINANCIAL STATEMENTS
39. Earnings Per Share (“EPS”) Year ended March 31,
2017 2016
(a) Profit/(Loss) after tax Rcrores (2,479.99) (62.30)
(b) The weighted average number of Ordinary shares for Basic EPS Nos. 2,88,72,18,310 2,87,31,88,838
(c) The weighted average number of 'A' Ordinary shares for Basic EPS Nos. 50,84,83,714 50,60,63,234
(d) The nominal value per share (Ordinary and 'A' Ordinary) R 2 2
(e) Share of profit/(loss) for Ordinary shares for Basic EPS Rcrores (2,108.63) (52.97)
(f ) Share of profit/(loss) for 'A' Ordinary shares for Basic EPS * Rcrores (371.36) (9.33)
(g) Earnings Per Ordinary share (Basic) R (7.30) (0.18)
(h) Earnings Per 'A' Ordinary share (Basic) R (7.30) (0.18)
(i) Profit after tax for Diluted EPS Rcrores # #
(j) The weighted average number of Ordinary shares for Basic EPS Nos. # #
(k) Add: Adjustment for Options relating to warrants and shares held in abeyance Nos. # #
(l) The weighted average number of Ordinary shares for Diluted EPS Nos. # #
(m) The weighted average number of 'A' Ordinary shares for Basic EPS Nos. # #
(n) Add: Adjustment for 'A' Ordinary shares held in abeyance Nos. # #
(o) The weighted average number of 'A' Ordinary shares for Diluted EPS Nos. # #
(p) Share of profit for Ordinary shares for Diluted EPS Rcrores # #
(q) Share of profit for 'A' Ordinary shares for Diluted EPS * Rcrores # #
(r) Earnings Per Ordinary share (Diluted) R (7.30) (0.18)
(s) Earnings Per 'A' Ordinary share (Diluted) R (7.30) (0.18)
*
#
‘A’ Ordinary Shareholders are entitled to receive dividend @ 5% points more than the aggregate rate of dividend determined by the Company on Ordinary Shares for the financial year.
Since there is a loss for the year ended March 31, 2017 and 2016, potential equity shares are not considered as dilutive and hence Diluted EPS is same as Basic EPS.

F-43
40. Capital Management
The Company’s capital management is intended to create value for shareholders by facilitating the meeting of long-term and short-term goals of the Company.
The Company determines the amount of capital required on the basis of annual operating plans and long-term product and other strategic investment plans. The funding requirements are met through equity, non-convertible debentures, senior notes and other long-term/short-term borrowings. The Company’s policy is aimed at combination of short-term and long-term borrowings.
The Company monitors the capital structure on the basis of total debt to equity ratio and maturity profile of the overall debt portfolio of the Company.
Total borrowings includes all long and short-term borrowings as disclosed in notes 23,24 and 26 (a) to the financial statements. Equity comprises all components excluding (profit)/loss on cash flow hedges.
The following table summarizes the capital of the Company:
(R in crores)
As atMarch 31,
2017
As atMarch 31,
2016
As atApril 1,
2015
Equity* 20,786.51 23,254.72 15,132.67
Short-term borrowings and current maturities of long-term borrowings 5,887.89 5,873.38 9,390.87
Long-term borrowings 13,686.09 10,599.96 12,234.88
Total borrowings 19,573.98 16,473.34 21,625.75
Total capital (Debt + Equity) 40,360.49 39,728.06 36,758.42
* Details of equity :
Total equity as reported in balance sheet 20,809.15 23,262.11 15,149.36
Hedging reserve (11.26) (7.39) (16.69)
Cost of Hedge reserve (11.38) - -
Equity as reported above 20,786.51 23,254.72 15,132.67
NOTES FORMING PART OF FINANCIAL STATEMENTS

Statutory ReportsCorporate Overview Financial Statements
F-44
(Standalone)
72nd Annual Report 2016-17
41.
Dis
clos
ures
on
finan
cial
inst
rum
ents
Th
is se
ctio
n gi
ves a
n ov
ervi
ew o
f the
sign
ifica
nce
of fi
nanc
ial i
nstr
umen
ts fo
r the
Com
pany
and
pro
vide
s add
ition
al in
form
atio
n on
bal
ance
shee
t ite
ms t
hat c
onta
in fi
nanc
ial i
nstr
umen
ts.
Th
e de
tails
of s
igni
fican
t acc
ount
ing
polic
ies,
incl
udin
g th
e cr
iteria
for r
ecog
nitio
n, th
e ba
sis o
f mea
sure
men
t and
the
basis
on
whi
ch in
com
e an
d ex
pens
es a
re re
cogn
ized
, in re
spec
t of e
ach
clas
s of fi
nanc
ial
asse
t, fin
anci
al li
abili
ty a
nd e
quity
inst
rum
ent a
re d
isclo
sed
in n
ote
2 to
the
finan
cial
stat
emen
ts.
(a
) Fin
anci
al a
sset
s an
d lia
bilit
ies
T
he fo
llow
ing
tabl
e pr
esen
ts th
e ca
rryi
ng a
mou
nts a
nd fa
ir va
lue
of e
ach
cate
gory
of fi
nanc
ial a
sset
s and
liab
ilitie
s as a
t Mar
ch 3
1, 2
017.
(R in
cro
res)
Cash
, and
oth
er
finan
cial
ass
ets
at a
mor
tized
co
st
Inve
stm
ents
- FV
TOCI
Inve
stm
ents
- FV
TPL
Der
ivat
ives
ot
her t
han
in h
edgi
ng
rela
tions
hip
Der
ivat
ives
in
hed
ging
re
latio
nshi
p
Tota
l ca
rryi
ng
valu
e
Tota
l fai
r va
lue
Fina
ncia
l ass
ets
(a)
Inve
stm
ents
- no
n-cu
rrent
- 5
28.3
7 -
- -
528
.37
528
.37
(b)
Inve
stm
ents
- cu
rrent
- -
2,4
00.9
2 -
- 2
,400
.92
2,4
00.9
2 (c
)Tr
ade
rece
ivab
les
2,1
28.0
0 -
- -
- 2
,128
.00
2,1
28.0
0
(d)
Cash
and
cas
h eq
uiva
lent
s 1
88.3
9 -
- -
- 1
88.3
9 1
88.3
9
(e)
Oth
er b
ank
bala
nces
97.
67
- -
- -
97.
67
97.
67
(f)
Loan
s and
adv
ance
s - n
on-c
urre
nt 3
89.6
1 -
- -
- 3
89.6
1 3
89.6
1
(g)
Loan
s and
adv
ance
s - c
urre
nt 2
31.3
5 -
- -
- 2
31.3
5 2
31.3
5
(h)
Oth
er fi
nanc
ial a
sset
s - n
on-c
urre
nt 5
.57
- -
190
.75
- 1
96.3
2 1
96.3
2
(i)O
ther
fina
ncia
l ass
ets -
cur
rent
0.4
0 -
- 6
5.74
3
4.62
1
00.7
6 1
00.7
6
Tota
l 3
,040
.99
528
.37
2,4
00.9
2 2
56.4
9 3
4.62
6
,261
.39
6,2
61.3
9
Der
ivat
ives
ot
her t
han
in h
edgi
ng
rela
tions
hip
Der
ivat
ives
in
hed
ging
re
latio
nshi
p
Oth
er
finan
cial
lia
bilit
ies
Tota
l ca
rryi
ng
valu
e
Tota
l fai
r va
lue
Fina
ncia
l lia
bilit
ies
(a)
Long
-ter
m b
orro
win
gs (I
nclu
ding
cur
rent
mat
uriti
es o
f lon
g-te
rm b
orro
win
gs)
- -
14,1
98.4
614
,198
.46
14,7
00.9
7
(b)
Shor
t-te
rm b
orro
win
gs -
- 5
,375
.52
5,3
75.5
2 5
,375
.52
(c)
Trad
e pa
yabl
es -
- 7,
015.
21 7
,015
.21
7,01
5.21
(d)
Acce
ptan
ces
- -
4,37
9.29
4,37
9.29
4,37
9.29
(e)
Oth
er fi
nanc
ial l
iabi
litie
s - n
on-c
urre
nt 0
.55
- 1
,123
.11
1,1
23.6
6 1
,123
.66
(f)
Oth
er fi
nanc
ial l
iabi
litie
s - c
urre
nt 9
.38
- 1,
943.
391,
952.
771,
952.
77
Tota
l 9
.93
- 34
,034
.98
34,0
44.9
1 3
4,54
7.42
NO
TES
FORM
ING
PA
RT O
F FI
NA
NCI
AL
STAT
EMEN
TS

F-45
Th
e fo
llow
ing
tabl
e pr
esen
ts th
e ca
rryi
ng a
mou
nts a
nd fa
ir va
lue
of e
ach
cate
gory
of fi
nanc
ial a
sset
s and
liab
ilitie
s as a
t Mar
ch 3
1, 2
016.
(R in
cro
res)
Cash
, and
oth
er
finan
cial
ass
ets
at a
mor
tized
co
st
Inve
stm
ents
- FV
TOCI
Inve
stm
ents
- FV
TPL
Der
ivat
ives
ot
her t
han
in h
edgi
ng
rela
tions
hip
Der
ivat
ives
in
hed
ging
re
latio
nshi
p
Tota
l ca
rryi
ng
valu
e
Tota
l fai
r va
lue
Fina
ncia
l ass
ets
(a)
Inve
stm
ents
- no
n-cu
rrent
- 4
54.5
3 1
72.5
4 -
- 6
27.0
7 6
27.0
7
(b)
Inve
stm
ents
- cu
rrent
- -
1,7
45.8
4 -
- 1
,745
.84
1,7
45.8
4 (c
)Tr
ade
rece
ivab
les
2,0
45.5
8 -
- -
- 2
,045
.58
2,0
45.5
8 (d
)Ca
sh a
nd c
ash
equi
vale
nts
427
.07
- -
- -
427
.07
427
.07
(e)
Oth
er b
ank
bala
nces
361
.35
- -
- -
361
.35
361
.35
(f)
Loan
s and
adv
ance
s - n
on-c
urre
nt 2
52.9
3 -
- -
- 2
52.9
3 2
52.9
3
(g)
Loan
s and
adv
ance
s - c
urre
nt 4
84.4
4 -
- -
- 4
84.4
4 4
84.4
4 (h
)O
ther
fina
ncia
l ass
ets -
non
-cur
rent
4.9
9 -
- 9
7.93
-
102
.92
102
.92
(i)O
ther
fina
ncia
l ass
ets -
cur
rent
63.
42
- -
49.
95
11.
83
125
.20
125
.20
Tota
l 3
,639
.78
454
.53
1,9
18.3
8 1
47.8
8 1
1.83
6
,172
.40
6,1
72.4
0
Der
ivat
ives
ot
her t
han
in h
edgi
ng
rela
tions
hip
Der
ivat
ives
in
hed
ging
re
latio
nshi
p
Oth
er
finan
cial
lia
bilit
ies
Tota
l ca
rryi
ng
valu
e
Tota
l fai
r va
lue
Fina
ncia
l lia
bilit
ies
(a)
Long
-ter
m b
orro
win
gs (i
nclu
ding
Cur
rent
mat
uriti
es o
f lon
g-te
rm b
orro
win
gs)
- -
12,
818.
62
12,
818.
62
13,2
69.8
8
(b)
Shor
t-te
rm b
orro
win
gs -
- 3
,654
.72
3,6
54.7
2 3
,654
.72
(c)
Trad
e pa
yabl
es -
- 5
,141
.17
5,1
41.1
7 5
,141
.17
(d)
Acce
ptan
ces
- -
3,8
87.2
8 3
,887
.28
3,8
87.2
8
(e)
Oth
er fi
nanc
ial l
iabi
litie
s - n
on-c
urre
nt 0
.67
- 2
,911
.17
2,9
11.8
4 2
,922
.07
(f)
Oth
er fi
nanc
ial l
iabi
litie
s - c
urre
nt 6
.21
0.0
7 1
,559
.25
1,5
65.5
3 1
,565
.53
Tota
l 6
.88
0.0
7 2
9,97
2.21
2
9,97
9.16
30,
440.
65
NO
TES
FORM
ING
PA
RT O
F FI
NA
NCI
AL
STAT
EMEN
TS

Statutory ReportsCorporate Overview Financial Statements
F-46
(Standalone)
72nd Annual Report 2016-17
Th
e fo
llow
ing
tabl
e pr
esen
ts th
e ca
rryi
ng a
mou
nts a
nd fa
ir va
lue
of e
ach
cate
gory
of fi
nanc
ial a
sset
s and
liab
ilitie
s as a
t Apr
il 1,
201
5.
(R in
cro
res)
Cash
, and
ot
her fi
nanc
ial
asse
ts a
t am
ortiz
ed c
ost
Inve
stm
ents
- FV
TOCI
Inve
stm
ents
- FV
TPL
Der
ivat
ives
ot
her t
han
in h
edgi
ng
rela
tions
hip
Der
ivat
ives
in
hed
ging
re
latio
nshi
p
Tota
l ca
rryi
ng
valu
e
Tota
l fai
r va
lue
Fina
ncia
l ass
ets
(a)
Inve
stm
ents
- no
n-cu
rrent
- 4
53.7
2 1
72.5
4 -
- 6
26.2
6 6
26.2
6
(b)
Inve
stm
ents
- cu
rrent
- 4
.68
- -
- 4
.68
4.6
8
(c)
Trad
e re
ceiv
able
s 1
,448
.39
- -
- -
1,4
48.3
9 1
,448
.39
(d)
Cash
and
cas
h eq
uiva
lent
s 1
,066
.47
- -
- -
1,0
66.4
7 1
,066
.47
(e)
Oth
er b
ank
bala
nces
83.
94
- -
- -
83.
94
83.
94
(f)
Loan
s and
adv
ance
s - n
on-c
urre
nt 3
10.7
3 -
- -
- 3
10.7
3 3
10.7
3
(g)
Loan
s and
adv
ance
s - c
urre
nt 3
42.5
8 -
- -
- 3
42.5
8 3
42.5
8
(h)
Oth
er fi
nanc
ial a
sset
s - n
on-c
urre
nt 1
02.5
2 -
- 5
6.03
0
.05
158
.60
158
.60
(i)O
ther
fina
ncia
l ass
ets -
cur
rent
2.3
0 -
- 7
.99
30.
18
40.
47
40.
47
Tota
l 3
,356
.93
458
.40
172
.54
64.
02
30.
23
4,0
82.1
2 4
,082
.12
Der
ivat
ives
ot
her t
han
in h
edgi
ng
rela
tions
hip
Der
ivat
ives
in
hed
ging
re
latio
nshi
p
Oth
er
finan
cial
lia
bilit
ies
Tota
l ca
rryi
ng
valu
e
Tota
l fai
r va
lue
Fina
ncia
l lia
bilit
ies
(a)
Long
-ter
m b
orro
win
gs (i
nclu
ding
Cur
rent
mat
uriti
es o
f lon
g-te
rm
borro
win
gs)
- -
13,
452.
73
13,
452.
73
13,
887.
76
(b)
Shor
t-te
rm b
orro
win
gs -
- 8
,173
.02
8,1
73.0
2 8
,173
.02
(c)
Trad
e pa
yabl
es -
- 5
,000
.18
5,0
00.1
8 5
,000
.18
(d)
Acce
ptan
ces
- -
3,9
50.5
3 3
,950
.53
3,9
50.5
3
(e)
Oth
er fi
nanc
ial l
iabi
litie
s - n
on-c
urre
nt 1
8.60
4
.95
3,7
26.2
1 3
,749
.76
3,7
71.8
8
(f)
Oth
er fi
nanc
ial l
iabi
litie
s - c
urre
nt 4
.29
- 1
,102
.76
1,1
07.0
5 1
,107
.05
Tota
l 2
2.89
4
.95
35,
405.
43
35,
433.
27
35,
890.
42
NO
TES
FORM
ING
PA
RT O
F FI
NA
NCI
AL
STAT
EMEN
TS

F-47
The following table provides an analysis of financial instruments that are measured subsequent to initial recognition at fair value, grouped into Level 1 to Level 3, as described below.
Quoted prices in an active market (Level 1): This level of hierarchy includes financial assets that are measured by reference to quoted prices (unadjusted) in active markets for identical assets or liabilities. This category consists of quoted equity shares, quoted corporate debt instruments and mutual fund investments.
Valuation techniques with observable inputs (Level 2): This level of hierarchy includes financial assets and liabilities, measured using inputs other than quoted prices included within Level 1 that are observable for the asset or liability, either directly (i.e; as prices) or indirectly (i.e; derived from prices). This level of hierarchy include Company’s over-the-counter (OTC) derivative contracts.
Valuation techniques with significant unobservable inputs (Level 3): This level of hierarchy includes financial assets and liabilities measured using inputs that are not based on observable market data (unobservable inputs). Fair values are determined in whole or in part, using a valuation model based on assumptions that are neither supported by prices from observable current market transactions in the same instrument nor are they based on available market data.
There has been no transfers between level 1, level 2 and level 3 for the years ended March 31, 2017 and 2016.
Costs of certain unquoted equity instruments has been considered as an appropriate estimate of fair value because of a wide range of possible fair value measurements and cost represents the best estimate of fair value within that range. These investments in equity instruments are not held for trading. Instead, they are held for medium or long term strategic purpose. Upon the application of Ind AS 109, the group has chosen to designate these investments in equity instruments as at FVTOCI as the directors believes this provides a more meaningful presentation for medium or long term strategic investments, than reflecting changes in fair value immediately in profit or loss.
Derivatives are fair valued using market observable rates and published prices together with forecast cash flow information where applicable.
(R in crores)As at March 31, 2017
Level 1 Level 2 Level 3 TotalFinancial assets measured at fair value(a) Investments 2,619.10 - 310.19 2,929.29
(b) Derivative assets - 291.11 - 291.11 Total 2,619.10 291.11 310.19 3,220.40 Financial liabilities measured at fair value(a) Derivative liabilities - 9.93 - 9.93
Total - 9.93 - 9.93
As at March 31, 2016
Level 1 Level 2 Level 3 TotalFinancial assets measured at fair value
(a) Investments 1,890.18 - 482.73 2,372.91
(b) Derivative assets - 159.71 - 159.71
Total 1,890.18 159.71 482.73 2,532.62
Financial liabilities measured at fair value
(a) Derivative liabilities - 6.95 - 6.95
Total - 6.95 - 6.95
As at April 1, 2015
Level 1 Level 2 Level 3 TotalFinancial assets measured at fair value
(a) Investments 143.53 - 487.41 630.94
(b) Derivative assets - 94.25 - 94.25
Total 143.53 94.25 487.41 725.19
Financial liabilities measured at fair value
(a) Derivative liabilities - 27.84 - 27.84
Total - 27.84 - 27.84
NOTES FORMING PART OF FINANCIAL STATEMENTS
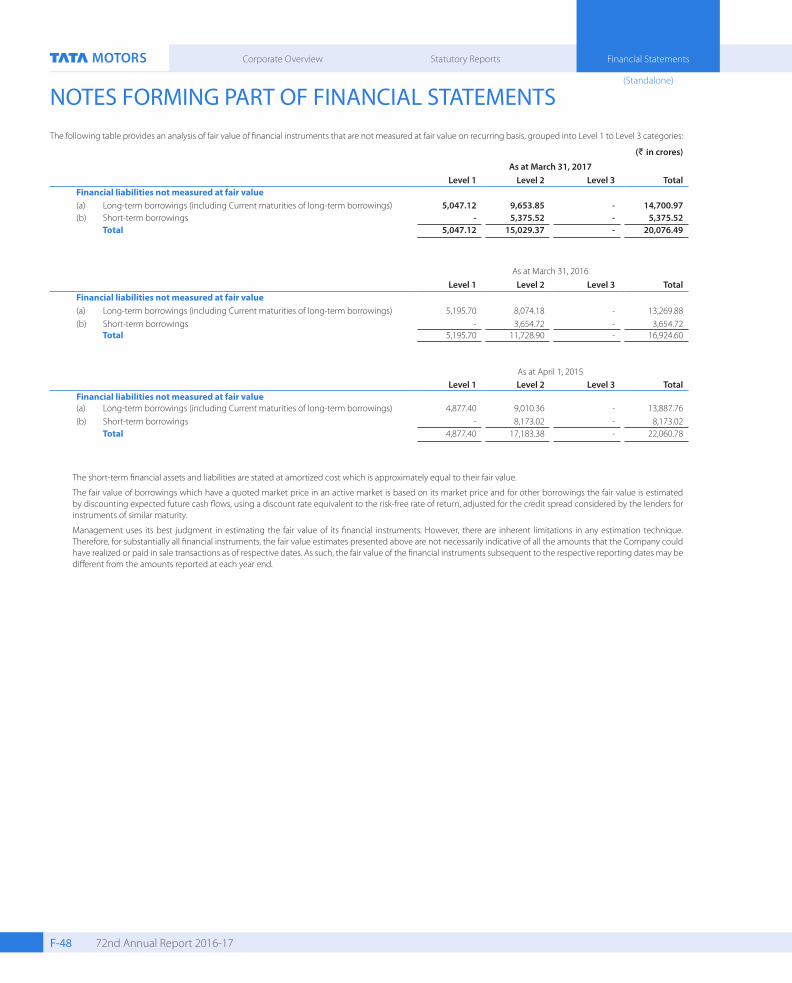
Statutory ReportsCorporate Overview Financial Statements
F-48
(Standalone)
72nd Annual Report 2016-17
The following table provides an analysis of fair value of financial instruments that are not measured at fair value on recurring basis, grouped into Level 1 to Level 3 categories:
(R in crores)
As at March 31, 2017Level 1 Level 2 Level 3 Total
Financial liabilities not measured at fair value(a) Long-term borrowings (including Current maturities of long-term borrowings) 5,047.12 9,653.85 - 14,700.97 (b) Short-term borrowings - 5,375.52 - 5,375.52 Total 5,047.12 15,029.37 - 20,076.49
As at March 31, 2016Level 1 Level 2 Level 3 Total
Financial liabilities not measured at fair value(a) Long-term borrowings (including Current maturities of long-term borrowings) 5,195.70 8,074.18 - 13,269.88 (b) Short-term borrowings - 3,654.72 - 3,654.72 Total 5,195.70 11,728.90 - 16,924.60
As at April 1, 2015Level 1 Level 2 Level 3 Total
Financial liabilities not measured at fair value(a) Long-term borrowings (including Current maturities of long-term borrowings) 4,877.40 9,010.36 - 13,887.76 (b) Short-term borrowings - 8,173.02 - 8,173.02 Total 4,877.40 17,183.38 - 22,060.78
The short-term financial assets and liabilities are stated at amortized cost which is approximately equal to their fair value.
The fair value of borrowings which have a quoted market price in an active market is based on its market price and for other borrowings the fair value is estimated by discounting expected future cash flows, using a discount rate equivalent to the risk-free rate of return, adjusted for the credit spread considered by the lenders for instruments of similar maturity.
Management uses its best judgment in estimating the fair value of its financial instruments. However, there are inherent limitations in any estimation technique. Therefore, for substantially all financial instruments, the fair value estimates presented above are not necessarily indicative of all the amounts that the Company could have realized or paid in sale transactions as of respective dates. As such, the fair value of the financial instruments subsequent to the respective reporting dates may be different from the amounts reported at each year end.
NOTES FORMING PART OF FINANCIAL STATEMENTS

F-49
The following table discloses the amounts that have been offset, in arriving at the balance sheet presentation and the amounts that are available for offset only under certain conditions as at March 31, 2016:
(R in crores)
Gross amount recognized
Gross amount recognized as set off in the
balance sheet
Net amount presented in the balance
sheet
Amounts subject to an enforceable master netting
arrangement
Net amount after offsetting
Financial instruments
Cash collateral
Financial assets(a) Derivative financial instruments 159.71 - 159.71 (4.58) - 155.13
(b) Trade receivables 2,117.13 (71.55) 2,045.58 - - 2,045.58 (c) Loans and advances-current 529.27 (44.83) 484.44 - - 484.44
Total 2,806.11 (116.38) 2,689.73 (4.58) - 2,685.15Financial liabilities
(a) Derivative financial instruments 6.95 - 6.95 (4.58) - 2.37
(b) Accounts payable 5,257.55 (116.38) 5,141.17 - - 5,141.17 Total 5,264.50 (116.38) 5,148.12 (4.58) - 5,143.54
Offsetting
Certain financial assets and financial liabilities are subject to offsetting where there is currently a legally enforceable right to set off recognized amounts and the Company intends to either settle on a net basis, or to realise the asset and settle the liability, simultaneously.
Certain derivative financial assets and financial liabilities are subject to master netting arrangements, whereby in the case of insolvency, derivative financial assets and financial liabilities will be settled on a net basis.
The following table discloses the amounts that have been offset, in arriving at the balance sheet presentation and the amounts that are available for offset only under certain conditions as at March 31, 2017:
(R in crores)
Gross amount recognized
Gross amount recognized as set off in the
balance sheet
Net amount presented in the balance
sheet
Amounts subject to an enforceable master netting
arrangement
Net amount after offsetting
Financial instruments
Cash collateral
Financial assets(a) Derivative financial instruments 291.11 - 291.11 (6.07) - 285.04 (b) Trade receivables 2,209.19 (81.19) 2,128.00 - - 2,128.00 (c) Loans and advances-current 272.07 (40.72) 231.35 - - 231.35
Total 2,772.37 (121.91) 2,650.46 (6.07) - 2,644.39
Financial liabilities
(a) Derivative financial instruments 9.93 - 9.93 (6.07) - 3.86 (b) Trade payables 7,137.12 (121.91) 7,015.21 - - 7,015.21
Total 7,147.05 (121.91) 7,025.14 (6.07) - 7,019.07
NOTES FORMING PART OF FINANCIAL STATEMENTS

Statutory ReportsCorporate Overview Financial Statements
F-50
(Standalone)
72nd Annual Report 2016-17
The following table discloses the amounts that have been offset, in arriving at the balance sheet presentation and the amounts that are available for offset only under certain conditions as at April 1, 2015:
(R in crores)
Gross amount recognized
Gross amount recognized as set off in the
balance sheet
Net amount presented in the balance
sheet
Amounts subject to an enforceable master netting arrangement
Net amount after offsetting
Financial instruments
Cash collateral
Financial assets(a) Derivative financial instruments 94.25 - 94.25 (9.52) - 84.73
(b) Trade receivables 1,582.37 (133.98) 1,448.39 - - 1,448.39 (c) Loans and advances-current 393.56 (50.98) 342.58 - - 342.58
Total 2,070.18 (184.96) 1,885.22 (9.52) - 1,875.70
Financial liabilities
(a) Derivative financial instruments 27.84 - 27.84 (9.52) - 18.32
(b) Trade payables 5,185.14 (184.96) 5,000.18 - - 5,000.18 Total 5,212.98 (184.96) 5,028.02 (9.52) - 5,018.50
(b) Transfer of financial assetsThe Company transfers certain trade receivables under the debt factoring arrangements. These do not qualify for derecognition, due to the recourse arrangement in place. Consequently the proceeds received from transfer are recorded as loans from banks / financial institutions and classified under short-term borrowings. The carrying amount of trade receivables along with the associated liabilities is as follows:
(R in crores)
As at March 31, As at April 1,
2017 2016 2015
Nature of Asset
Carrying amount of asset sold
Carrying amount of associated
liabilities
Carrying amount of asset sold
Carrying amount of associated
liabilities
Carrying amount of asset sold
Carrying amount of associated
liabilities
Trade receivables - - 224.04 224.04 234.63 234.63
NOTES FORMING PART OF FINANCIAL STATEMENTS

F-51
(c) Financial risk management
In the course of its business, the Company is exposed primarily to fluctuations in foreign currency exchange rates, interest rates, equity prices, liquidity and credit risk, which may adversely impact the fair value of its financial instruments.
The Company has a risk management policy which not only covers the foreign exchange risks but also other risks associated with the financial assets and liabilities such as interest rate risks and credit risks. The risk management policy is approved by the board of directors. The risk management framework aims to:
• Create a stable business planning environment by reducing the impact of currency and interest rate fluctuations on the Company’s business plan.
• Achieve greater predictability to earnings by determining the financial value of the expected earnings in advance.
(i) Market risk
Market risk is the risk of any loss in future earnings, in realizable fair values or in future cash flows that may result from a change in the price of a financial instrument. The value of a financial instrument may change as a result of changes in the interest rates, foreign currency exchange rates, equity price fluctuations, liquidity and other market changes. Future specific market movements cannot be normally predicted with reasonable accuracy.
(a) Foreign currency exchange rate risk:
The fluctuation in foreign currency exchange rates may have potential impact on the statement of profit and loss and equity, where any transaction references more than one currency or where assets/liabilities are denominated in a currency other than the functional currency.
Considering the countries and economic environment in which the Company operates, its operations are subject to risks arising from fluctuations in exchange rates. The risks primarily relate to fluctuations in U.S. dollar, Euro, GBP and Thai Baht against the functional currencies of the Company.
The Company, as per its risk management policy, uses foreign exchange and other derivative instruments primarily to hedge foreign exchange and interest rate exposure. Any weakening of the functional currency may impact the Company’s exports and cost of borrowings and consequently may increase the cost of financing the Company’s capital expenditures.
The Company evaluates the impact of foreign exchange rate fluctuations by assessing its exposure to exchange rate risks. It hedges a part of these risks by using derivative financial instruments in accordance with its risk management policies.
The foreign exchange rate sensitivity is calculated for each currency by aggregation of the net foreign exchange rate exposure of a currency and a simultaneous parallel foreign exchange rates shift in the foreign exchange rates of each currency by 10%.
NOTES FORMING PART OF FINANCIAL STATEMENTS

Statutory ReportsCorporate Overview Financial Statements
F-52
(Standalone)
72nd Annual Report 2016-17
The exposure as indicated below is mitigated by some of the derivative contracts entered into by the Company as disclosed in (iv) derivative financial instruments and risk management below.
The following table sets forth information relating to foreign currency exposure (other than risk arising from derivatives disclosed at clause (iv) below) as at March 31, 2017:
(R in crores)U.S. dollar Euro GBP THB Others 1 Total
(a) Financial assets 395.23 11.03 34.53 95.25 16.22 552.26(b) Financial liabilities 5,974.81 150.24 374.84 8.17 26.17 6,534.23
1 Others mainly include currencies such as the Russian rouble, Japanese yen, Swiss franc, Australian dollars, South African rand and Korean won.
10% appreciation/depreciation of the respective foreign currencies with respect to functional currency of the Company would result in decrease/increase in the Company’s net profit/(loss)before tax by approximately R55.23 crores and R653.42 crores for financial assets and financial liabilities respectively for the year ended March 31, 2017.
The following table set forth information relating to foreign currency exposure (other than risk arising from derivatives disclosed at clause (iv) below) as at March 31, 2016:
(R in crores)U.S. dollar Euro GBP THB Others 2 Total
(a) Financial assets 323.14 6.53 41.10 57.60 12.24 440.61 (b) Financial liabilities 6,136.72 407.51 315.46 13.98 16.41 6,890.08
2 Others mainly include currencies such as the Russian rouble, Swiss Franc, Australian dollars, South African rand, Singapore dollars and Korean won.
10% appreciation/depreciation of the respective foreign currencies with respect to functional currency of the Company would result in decrease/increase in the Company’s net profit/(loss)before tax by approximately R44.06 crores and R689.01 crores for financial assets and financial liabilities respectively for the year ended March 31, 2016.
The following table sets forth information relating to foreign currency exposure (other than risk arising from derivatives disclosed at clause (iv) below) as at April 1, 2015:
(R in crores)U.S. dollar Euro GBP THB Others 3 Total
(a) Financial assets 966.35 22.09 54.96 34.53 27.52 1,105.45 (b) Financial liabilities 5,364.58 431.66 358.59 1.81 9.33 6,165.97
3 Others mainly include currencies such as the Russian rouble, Swiss Franc, Australian dollars, South African rand, Singapore dollars and Korean won.
10% appreciation/depreciation of the respective foreign currencies with respect to functional currency of the Company would result in decrease/increase in the Company’s net profit/(loss) before tax by approximately R110.55 crores and R616.60 crores for financial assets and financial liabilities respectively for the year ended March 31, 2015.
(Note: The impact is indicated on the profit/(loss) before tax basis.)
NOTES FORMING PART OF FINANCIAL STATEMENTS

F-53
(b) Interest rate risk
Interest rate risk is measured by using the cash flow sensitivity for changes in variable interest rates. Any movement in the reference rates could have an impact on the Company’s cash flows as well as costs.
The Company is subject to variable interest rates on some of its interest bearing liabilities. The Company’s interest rate exposure is mainly related to debt obligations. The Company also uses a mix of interest rate sensitive financial instruments to manage the liquidity and fund requirements for its day to day operations like short-term loans.
As at March 31, 2017 and 2016, financial liability of R3,418.97 crores and R4,848.39 crores, respectively, was subject to variable interest rates. Increase/decrease of 100 basis points in interest rates at the balance sheet date would result in decrease/increase in profit/(loss) before tax of R34.19 crores and R48.48 crores for the year ended March 31, 2017 and 2016, respectively.
The model assumes that interest rate changes are instantaneous parallel shifts in the yield curve. Although some assets and liabilities may have similar maturities or periods to re-pricing, these may not react correspondingly to changes in market interest rates. Also, the interest rates on some types of assets and liabilities may fluctuate with changes in market interest rates, while interest rates on other types of assets may change with a lag.
The risk estimates provided assume a parallel shift of 100 basis points interest rate across all yield curves. This calculation also assumes that the change occurs at the balance sheet date and has been calculated based on risk exposures outstanding as at that date. The period end balances are not necessarily representative of the average debt outstanding during the period.
This analysis assumes that all other variables, in particular foreign currency rates, remain constant.
(Note: The impact is indicated on the profit/(loss) before tax basis).
(c) Equity Price risk
Equity Price Risk is related to the change in market reference price of the investments in equity securities.
The fair value of some of the Company’s investments measured at fair value through other comprehensive income exposes the Company to equity price risks. These investments are subject to changes in the market price of securities. The fair value of Company’s investment in quoted equity securities as at March 31, 2017, 2016 and April 1, 2015 was R218.18 crores, R143.34 crores and R143.53 crores, respectively. A 10% change in equity price as at March 31, 2017, 2016 and April 1, 2015 would result in an impact of R21.82 crores, R14.43 crores and R14.35 crores, respectively
(Note: The impact is indicated on equity before consequential tax impact, if any).
NOTES FORMING PART OF FINANCIAL STATEMENTS

Statutory ReportsCorporate Overview Financial Statements
F-54
(Standalone)
72nd Annual Report 2016-17
Cred
it qu
alit
y of
fina
ncia
l ass
ets
and
impa
irm
ent l
oss
The
agei
ng o
f tra
de re
ceiv
able
s as o
f bal
ance
shee
t dat
e is
give
n be
low
. The
age
ana
lysis
has
bee
n co
nsid
ered
from
the
due
date
.
(R in
cro
res)
A
s at
Mar
ch 3
1,As
at A
pril
1,
2017
2016
2015
Trad
e re
ceiv
able
sG
ross
Allo
wan
ceN
etG
ross
Allo
wan
ceN
etG
ross
Allo
wan
ceN
et
Peri
od (i
n m
onth
s)
(a)
Not
due
915.
10 (9
.59)
905.
51 8
74.7
2 (3
4.05
) 8
40.6
7 6
37.9
7 (3
2.44
) 6
05.5
3
(b)
Ove
rdue
up
to 3
mon
ths
841.
67 (1
5.83
)82
5.84
768
.96
(9.7
2) 7
59.2
4 4
23.9
1 (2
5.52
) 3
98.3
9
(c)
Ove
rdue
3-6
mon
ths
138
.47
(11.
36)
127
.11
160
.89
(9.8
6) 1
51.0
3 2
30.3
0 (1
1.06
) 2
19.2
4
(d)
Ove
rdue
mor
e th
an 6
mon
ths
925.
93 (6
56.3
9)26
9.54
1 8
73.1
1 (5
78.4
7) 2
94.6
4 1
760
.95
(535
.72)
225
.23
1
Tota
l 2
,821
.17
(693
.17)
2,1
28.0
0 2,
677.
68
(632
.10)
2,0
45.5
8 2
,053
.13
(604
.74)
1,4
48.3
9
1Tr
ade
rece
ivab
les
over
due
mor
e th
an s
ix m
onth
s in
clud
e R
212.
29 c
rore
s as
at
Mar
ch 3
1, 2
017
(R23
0.02
cro
res
as a
t M
arch
31,
201
6 an
d R
152.
93 c
rore
s as
at
April
1, 2
015)
ou
tsta
ndin
g fro
m g
over
nmen
t org
aniz
atio
ns in
Indi
a, w
hich
are
con
sider
ed re
cove
rabl
e.
Trad
e re
ceiv
able
s co
nsist
of a
larg
e nu
mbe
r of v
ario
us t
ypes
of c
usto
mer
s, sp
read
acr
oss
geog
raph
ical
are
as. O
ngoi
ng c
redi
t eva
luat
ion
is pe
rform
ed o
n th
e fin
anci
al c
ondi
tion
of t
hese
tra
de re
ceiv
able
s an
d w
here
app
ropr
iate
allo
wan
ce fo
r lo
sses
are
pro
vide
d. F
urth
er, t
he C
ompa
ny g
roup
s th
e tr
ade
rece
ivab
les
depe
ndin
g on
typ
e of
cus
tom
ers
and
acco
rdin
gly
cred
it ris
k is
dete
rmin
ed.
(ii)
Cred
it ri
sk
Cr
edit
risk
is th
e ris
k of
fina
ncia
l los
s ar
ising
from
cou
nter
part
y fa
ilure
to re
pay
or s
ervi
ce d
ebt a
ccor
ding
to th
e co
ntra
ctua
l ter
ms
or o
blig
atio
ns. C
redi
t risk
enc
ompa
sses
bo
th th
e di
rect
risk
of d
efau
lt an
d th
e ris
k of
det
erio
ratio
n of
cre
ditw
orth
ines
s as w
ell a
s con
cent
ratio
n ris
ks.
F i
nanc
ial i
nstr
umen
ts th
at a
re su
bjec
t to
conc
entr
atio
ns o
f cre
dit r
isk, p
rinci
pally
con
sist o
f inv
estm
ents
cla
ssifi
ed a
s fai
r val
ue th
roug
h pr
ofit o
r los
s, tr
ade
rece
ivab
les,
loan
s an
d ad
vanc
es a
nd d
eriv
ativ
e fin
anci
al in
stru
men
ts. N
one
of th
e fin
anci
al in
stru
men
ts o
f the
Com
pany
resu
lt in
mat
eria
l con
cent
ratio
ns o
f exp
osur
e to
cre
dit r
isks.
Ex
posu
re to
cre
dit r
isk
T h
e ca
rryi
ng a
mou
nt o
f fina
ncia
l ass
ets
repr
esen
ts t
he m
axim
um c
redi
t ex
posu
re. T
he m
axim
um e
xpos
ure
to c
redi
t ris
k w
as R
5,73
2.64
cro
res
as a
t M
arch
31,
201
7,
R5,
717.
59 c
rore
s as a
t Mar
ch 3
1, 2
016,
bei
ng th
e to
tal o
f the
car
ryin
g am
ount
of b
alan
ces w
ith b
anks
, sho
rt te
rm d
epos
its w
ith b
anks
, tra
de re
ceiv
able
s, fin
ance
rece
ivab
les,
mar
gin
mon
ey a
nd o
ther
fina
ncia
l ass
ets e
xclu
ding
equ
ity in
vest
men
ts.
Fi
nanc
ial a
sset
s tha
t are
nei
ther
pas
t due
nor
impa
ired
N
one
of th
e Co
mpa
ny’s
cash
equ
ival
ents
, incl
udin
g tim
e de
posit
s with
ban
ks, a
re p
ast d
ue o
r im
paire
d. R
egar
ding
trad
e re
ceiv
able
s and
oth
er re
ceiv
able
s, an
d ot
her l
oans
or
rece
ivab
les t
hat a
re n
eith
er im
paire
d no
r pas
t due
, the
re w
ere
no in
dica
tions
as a
t Mar
ch 3
1, 2
017,
that
def
aults
in p
aym
ent o
blig
atio
ns w
ill o
ccur
.
In
add
ition
, exp
osur
e to
cre
dit r
isk is
also
in re
latio
n to
fina
ncia
l gua
rant
ee c
ontr
acts
for w
hich
the
Com
pany
has
cre
ated
a li
abili
ty fo
r pot
entio
nal e
xpos
ures
.
NO
TES
FORM
ING
PA
RT O
F FI
NA
NCI
AL
STAT
EMEN
TS

F-55
(iii)
Liqu
idit
y ri
sk
Li
quid
ity ri
sk re
fers
to th
e ris
k th
at th
e Co
mpa
ny c
anno
t mee
t its
fina
ncia
l obl
igat
ions
. The
obj
ectiv
e of
liqu
idity
risk
man
agem
ent i
s to
mai
ntai
n su
ffici
ent l
iqui
dity
and
ens
ure
that
fu
nds a
re a
vaila
ble
for u
se a
s per
requ
irem
ents
.
Th
e Co
mpa
ny h
as o
btai
ned
fund
and
non
-fund
bas
ed w
orki
ng c
apita
l lin
es fr
om v
ario
us b
anks
. Fur
ther
, the
Com
pany
has
acc
ess t
o fu
nds f
rom
deb
t mar
kets
thro
ugh
com
mer
cial
pa
per p
rogr
ams,
non-
conv
ertib
le d
eben
ture
s, se
nior
not
es a
nd o
ther
deb
t ins
trum
ents
. The
Com
pany
inve
sts
its s
urpl
us fu
nds
in b
ank
fixed
dep
osit
and
liqui
d an
d liq
uid
plus
sc
hem
es o
f mut
ual f
unds
, whi
ch c
arry
no/
low
mar
k to
mar
ket r
isks.
The
Com
pany
has
also
inve
sted
15%
of t
he n
on-c
onve
rtib
le d
eben
ture
s (ta
ken/
issue
d by
the
Com
pany
) fal
ling
due
for r
epay
men
t in
the
next
12
mon
ths i
n ba
nk d
epos
its, t
o m
eet t
he re
gula
tory
nor
ms o
f liq
uidi
ty re
quire
men
ts.
Th
e Co
mpa
ny a
lso c
onst
antly
mon
itors
fund
ing
optio
ns a
vaila
ble
in th
e de
bt a
nd c
apita
l mar
kets
with
a v
iew
to m
aint
aini
ng fi
nanc
ial fl
exib
ility
.
Th
e ta
ble
belo
w p
rovi
des d
etai
ls re
gard
ing
the
cont
ract
ual m
atur
ities
of fi
nanc
ial l
iabi
litie
s, in
clud
ing
estim
ated
inte
rest
pay
men
ts a
s at M
arch
31,
201
7:
(R in
cro
res)
Fina
ncia
l lia
bilit
ies
Carr
ying
am
ount
Due
in 1
st Y
ear
Due
in 2
nd Y
ear
Due
in 3
rd to
5th
Yea
rD
ue a
fter
5th
Yea
rTo
tal c
ontr
actu
al c
ash
flow
s
(a)
Trad
e pa
yabl
es 7
,015
.21
7,0
15.2
1 -
- -
7,0
15.2
1
(b)
Acc
epta
nces
4,3
79.2
9 4
,379
.29
- -
- 4
,379
.29
(c)
Borr
owin
gs a
nd in
tere
st
ther
eon
20,0
23.7
17,
056.
762,
662.
8510
,158
.67
5,00
3.70
24,8
81.9
8
(d)
Oth
er fi
nanc
ial l
iabi
litie
s 2
,616
.77
1,49
3.66
1,01
9.23
56.5
673
.13
2,64
2.58
(e)
Der
ivat
ive
liabi
litie
s 9
.93
9.3
8 -
-0.
55 9
.93
Tota
l 3
4,04
4.91
19
,954
.30
3,68
2.08
10,2
15.2
35,
077.
3838
,928
.99
NO
TES
FORM
ING
PA
RT O
F FI
NA
NCI
AL
STAT
EMEN
TS

Statutory ReportsCorporate Overview Financial Statements
F-56
(Standalone)
72nd Annual Report 2016-17
The
tabl
e be
low
pro
vide
s det
ails
rega
rdin
g th
e co
ntra
ctua
l mat
uriti
es o
f fina
ncia
l lia
bilit
ies,
incl
udin
g es
timat
ed in
tere
st p
aym
ents
as a
t Mar
ch 3
1, 2
016:
(R in
cro
res)
Fina
ncia
l lia
bilit
ies
Carr
ying
am
ount
Due
in 1
st Y
ear
Due
in 2
nd Y
ear
Due
in 3
rd to
5th
Yea
rD
ue a
fter
5th
Yea
rTo
tal c
ontr
actu
al c
ash
flow
s
(a)
Trad
e pa
yabl
es 5
,141
.17
5,1
41.1
7 -
- -
5,1
41.1
7
(b)
Acce
ptan
ces
3,8
87.2
8 3
,887
.28
- -
- 3
,887
.28
(c)
Borro
win
gs a
nd in
tere
st th
ereo
n 1
6,92
6.82
6,
853.
32 1
,580
.97
7485
.76
5,5
37.5
5 21
,457
.60
(d)
Oth
er fi
nanc
ial l
iabi
litie
s 4
,016
.94
1,10
5.84
1,13
7.45
1,74
3.31
60.0
6 4
,046
.66
(e)
Der
ivat
ive
liabi
litie
s 6
.95
6.28
- 0.
58 0
.09
6.9
5
Tota
l 2
9,97
9.16
16
,993
.89
2,7
18.4
29,
229.
655,
597.
70 3
4,53
9.66
The
tabl
e be
low
pro
vide
s det
ails
rega
rdin
g th
e co
ntra
ctua
l mat
uriti
es o
f fina
ncia
l lia
bilit
ies,
incl
udin
g es
timat
ed in
tere
st p
aym
ents
as a
t Apr
il 1,
201
5:
Fina
ncia
l lia
bilit
ies
Carr
ying
am
ount
Due
in 1
st Y
ear
Due
in 2
nd Y
ear
Due
in 3
rd to
5th
Yea
rD
ue a
fter
5th
Yea
rTo
tal c
ontr
actu
al c
ash
flow
s
(a)
Trad
e pa
yabl
es 5
,000
.18
5,0
00.1
8 -
- -
5,0
00.1
8
(b)
Acce
ptan
ces
3,9
50.5
3 3
,950
.53
--
- 3
,950
.53
(c)
Borro
win
gs a
nd in
tere
st th
ereo
n 2
2,11
7.88
10
,535
.62
2,96
6.27
4,6
08.4
5 9
,481
.55
27,5
91.8
9
(d)
Oth
er fi
nanc
ial l
iabi
litie
s 4
,336
.84
633
.00
721.
312,
960.
1760
.69
4,37
5.17
(e)
Der
ivat
ive
liabi
litie
s 2
7.84
4
.29
8.68
1.96
12.
91
27.
84
Tota
l 3
5,43
3.27
2
0,12
3.62
3,69
6.26
7,57
0.58
9,5
55.1
5 40
,945
.61
NO
TES
FORM
ING
PA
RT O
F FI
NA
NCI
AL
STAT
EMEN
TS

F-57
(iv) Derivative financial instruments and risk management
The Company has entered into variety of foreign currency, interest rates and commodity forward contracts and options to manage its exposure to fluctuations in foreign exchange rates, interest rates and commodity price risk. These financial exposures are managed in accordance with the Company’s risk management policies and procedures.
The Company also enters into interest rate swaps and interest rate currency swap agreements, mainly to manage exposure on its fixed rate or variable rate debt. The Company uses interest rate derivatives or currency swaps to hedge exposure to exchange rate fluctuations on principal and interest payments for borrowings denominated in foreign currencies.
Specific transactional risks include risks like liquidity and pricing risks, interest rate and exchange rate fluctuation risks, volatility risks, counterparty risks, settlement risks and gearing risks.
Fair value of derivative financial instruments are determined using valuation techniques based on information derived from observable market data.
The fair value of derivative financial instruments is as follows:
(R in crores) As at March 31, As at April 1,
2017 2016 2015
(a) Foreign currency forward exchange contracts and options 276.81 151.95 66.85
(b) Commodity Derivatives 4.37 0.81 (0.44)
Total 281.18 152.76 66.41
The gain/(loss) on due to fluctuation in foreign currency exchange rates on derivative contract, recognized in the statement of profit and loss was R85.41 crores and R26.51 crores for the years ended March 31, 2017 and 2016, respectively.
The gain/(loss) on commodity derivative contracts, recognized in the statement of profit and loss was R9.06 crores and (R8.58 crores) for the years ended March 31, 2017 and 2016, respectively.
NOTES FORMING PART OF FINANCIAL STATEMENTS

Statutory ReportsCorporate Overview Financial Statements
F-58
(Standalone)
72nd Annual Report 2016-17
42. Related-party transactions The Company’s related parties principally consist of subsidiaries, joint operations, associates and their subsidiaries, Tata Sons Limited., subsidiaries and joint ventures of Tata Sons
Limited. The Company routinely enters into transactions with these related parties in the ordinary course of business. The Company enters into transactions for sale and purchase of products and services with its related parties.
The following table summarizes related-party transactions and balances for the year ended/as at March 31, 2017:
(R in crores)Subsidiaries Joint
OperationsAssociates
and its subsidiaries
Tata Sons Ltd., its subsidiaries
and joint ventures
Total
Purchase of products 1,025.38 2,275.75 2,056.84 65.46 5,423.43 Sale of products 4,545.41 323.72 248.20 452.62 5,569.95 Services received 2,571.56 0.07 10.89 256.50 2,839.02 Services rendered 327.87 16.12 13.03 4.64 361.66 Bills discounted - - - 3,202.77 3,202.77
Purchase of property, plant and equipment 46.10 - 13.79 0.02 59.91
Interest (income)/expense, dividend (income)/paid, net (631.60) (12.12) (11.07) 36.52 (618.27)
Deposits taken as security 3.31 - - - 3.31
Amounts receivable in respect of loans and interest thereon 692.48 - - 5.33 697.81
Amounts payable in respect of loans and interest thereon 338.00 - 56.00 0.64 394.64
Trade and other receivables 247.06 - 46.26 36.14 329.46
Trade payables 1,013.33 123.96 39.63 49.55 1,226.47
Finance given, taken back (including loans and equity) 252.26 132.50 - - 384.76
Finance taken, paid back (including loans and equity) 3,628.45 - 629.00 - 4,257.45
Conversion of Optionally Convertible Preference shares into Equity shares - - 159.00 - 159.00
Assets / deposits given as security 2,502.35 - - 3.00 2,505.35
Deposit taken as security 3.31 - - - 3.31
Provision for amount recievable (including loans) 639.49 - - - 639.49
NOTES FORMING PART OF FINANCIAL STATEMENTS

F-59
The following table summarizes related-party balances as at April 1, 2015:
Subsidiaries Joint Operations
Associates and its
subsidiaries
Tata Sons Ltd., its subsidiaries
and joint ventures
Total
Amounts receivable in respect of loans and interest thereon 605.48 183.97 25.66 5.33 820.44 Amounts payable in respect of loans and interest thereon 288.75 - - 3.19 291.94 Trade and other receivables 620.95 - 6.10 94.77 721.82 Trade payables 337.63 143.68 74.98 58.40 614.69 Bills discounted (in respect of amount receivable) - - 4.86 - 4.86
Assets / deposits given as security 2.35 - - 3.00 5.35
Provision for amount recievable (including loans) 539.40 - - - 539.40
The following table summarizes related-party transactions and balances for the year ended/as at March 31, 2016:
(R in crores)Subsidiaries Joint
OperationsAssociates
and its subsidiaries
Tata Sons Ltd., its subsidiaries
and joint ventures
Total
Purchase of products 1,060.41 2,781.45 1,764.44 65.89 5,672.19 Sale of products 2,612.77 597.12 210.35 607.47 4,027.71 Services received 2,475.24 0.12 9.61 260.27 2,745.24 Services rendered 256.40 7.97 14.87 11.02 290.26 Bills discounted - - - 2,901.80 2,901.80
Purchase of property, plant and equipment 26.17 - 11.45 0.87 38.49
Sale of property, plant and equipment 5.57 - - - 5.57
Sale of investments 746.90 - - - 746.90
Interest / dividend paid / (received) (net) (979.85) (14.24) (13.85) (8.09) (1,016.03)
Provision for loan given 45.71 - - - 45.71
Assets given as security 2,500.00 - - - 2,500.00 Amounts receivable in respect of loans and interest thereon 718.40 193.56 - 5.33 917.29 Amounts payable in respect of loans and interest thereon 445.45 - 27.00 3.62 476.07 Trade and other receivables 343.35 - 12.33 47.66 403.34
Trade payables 1,637.05 168.04 58.31 61.11 1,924.51 Finance given (including loans and equity) 256.07 - - - 256.07 Finance taken, paid back (including loans and equity) 3,411.80 - 345.00 1,747.09 5,503.89Bills discounted (in respect of amount receivable) - - 5.18 - 5.18 Assets / deposits given as security 2,502.35 - - 3.00 2,505.35 Provision for amount recievable (including loans) 639.49 - - - 639.49
Year ended March 31,
Compensation of key management personnel: 2017 2016
Short-term benefits^ 30.40 15.81
Post-employment benefits* 2.04 1.50
^ Includes R8.08 crores (R4.61 crores for the year 2015-16) of managerial remuneration which is subject to the approval of the Central Government*Excludes provision for encashable leave and gratuity for certain key management personnel as a separate actuarial valuation is not available.
Year ended March 31,
Other transactions with key management personnel: 2017 2016
Issue of shares pursuant to rights issue - 0.08
Dividend paid - ** -
**amount less than R50,000/-
Refer note 44 for list of subsidiaries of the Company.Refer note 45 for information on transactions with post-employment benefit plans.
NOTES FORMING PART OF FINANCIAL STATEMENTS

Statutory ReportsCorporate Overview Financial Statements
F-60
(Standalone)
72nd Annual Report 2016-17
43. Disclosures required by Schedule V of SEBI (Listing Obligations and Disclosure Requirements) Regulations, 2015 and Section 186 (4) of the Companies Act, 2013
(a) Amount of loans/advances in nature of loans outstanding from Subsidiaries and Joint Operations for the year ended March 31, 2017, on a standalone basis. (R in crores)
Name of the CompanyOutstanding
as at March 31, 2017
Maximum amount outstanding during
the year(i) Subsidiaries:
Tata Motors European Technical Centre Plc., UK[Tata Motors European Technical Centre has utilised this loan for investment in National Automotive Innovation Centre set up jointly with University of Warwick and Jaguar Landrover Ltd and carried an interest rate of 12 months LIBOR + 3% prevailing rate (4.7076% p.a-5.6492% p.a)
34.39 40.56
40.56 40.56
Tata Hispano Motors Carrocera S.A.(Tata Hispano Motors Carrocera S.A. has utilised this loan for meeting its capex requirement and general corporate purposes, which is fully provided)
539.40 539.40
539.40 539.40
Tata Hispano Motors Carroceries Maghreb S.A.(Tata Hispano Motors Carroceries Maghreb S.A. has utilised this loan for general corporate purposes, which is partly provided)
58.3958.32
58.39 58.32
TAL Manufacturing Solutions Ltd(Inter Corporate Deposit utilised for working capital finance at the rate of interest of 9.25% p.a. to 10.50% p.a. having Call / Put option)
- 5.00
5.00 15.00
Concorde Motors (India) Ltd(Inter Corporate Deposit utilised for working capital finance at the rate of interest of 9.00% p.a. to 10.00% p.a. having Call / Put option)
50.00 50.00
50.00 50.00
Tata Marcopolo Motors Ltd(Inter Corporate Deposit utilised for working capital finance at the rate of interest of 9.00% p.a. to 10.00% p.a. having Call / Put option)
10.00 25.00
25.00 25.00
(ii) Joint Operations:Fiat India Automobiles Private Ltd(Loan has been utilised for meeting Capex requirement. The Interest rate is RBI Bank rate)
- 265.00
265.00 265.00
(b) Details of Investments made are given in notes 6, 7, 8 and 9.
44 Details of significant investment in subsidiaries, joint ventures and associates % direct holding
Name of the Company Country of incorporation/ As at March 31, As at April 1,
Place of business 2017 2016 2015SubsidiariesSheba Properties Ltd India - - 100.00 TML Drivelines Ltd India 100.00 100.00 100.00 TAL Manufacturing Solutions Ltd India 100.00 100.00 100.00 Concorde Motors (India) Ltd India 100.00 100.00 100.00 Tata Motors Insurance Broking & Advisory Services Ltd India 100.00 100.00 100.00 Tata Motors European Technical Centre Plc UK 100.00 100.00 100.00 Tata Technologies Ltd India 70.42 70.43 70.43 Tata Motors Finance Ltd India 100.00 100.00 100.00 Tata Marcopolo Motors Ltd India 51.00 51.00 51.00 TML Holdings Pte Ltd Singapore 100.00 100.00 100.00 TML Distribution Company Ltd India 100.00 100.00 100.00 Tata Hispano Motors Carrocera S.A Spain 100.00 100.00 100.00 Tata Hispano Motors Carroceries Maghreb S.A Morocco 100.00 100.00 100.00 Trilix S.r.l Italy 80.00 80.00 80.00 Tata Precision Industries Pte Ltd Singapore 78.39 78.39 78.39
Joint VenturesJT Special Vehicle (P) Ltd. India 50.00 - -
AssociatesAutomobile Corporation of Goa Ltd India 46.44 46.44 46.44 Nita Co. Ltd Bangladesh 40.00 40.00 40.00 Tata AutoComp Systems Ltd India 26.00 26.00 26.00 Tata Hitachi Construction Machinery Company Private Ltd India 39.74 39.74 39.74
NOTES FORMING PART OF FINANCIAL STATEMENTS

F-61
45. Employee benefits
Defined Benefit PlanPension and post retirement medical plans
The following table sets out the funded and unfunded status and the amounts recognized in the financial statements for the pension and the post retirement medical plans in respect of Tata Motors and joint operations:
(R in crores)
Pension benefits Post retirement medical benefits
As at March 31,2017 2016 2017 2016
Change in defined benefit obligations:Defined benefit obligation, beginning of the year 770.31 756.01 133.09 132.75 Current service cost 50.84 48.00 6.43 6.05 Interest cost 58.57 56.12 10.35 10.39 Remeasurements (gains) / losses
Actuarial (gains) / losses arising from changes in demographic assumptions - 1.46 - - Actuarial (gains) / losses arising from changes in financial assumptions 11.97 2.78 16.88 3.70 Actuarial (gains) / losses arising from changes in experience adjustments (6.89) 2.81 (9.21) (14.88)
Past service cost - - - - Transfer in/(out) of liability - 5.47 - 0.73 Benefits paid from plan assets (66.19) (97.54) - -Benefits paid directly by employer (4.78) (4.80) (7.34) (5.65)Defined benefit obligation, end of the year 813.83 770.31 150.20 133.09
Change in plan assets:Fair value of plan assets, beginning of the year 674.17 665.48 - - Interest income 51.67 50.46 - - Remeasurements gains / (losses)
Return on plan assets, (excluding amount included in net Interest expense) 22.93 16.64
- -
Employer’s contributions 16.10 33.73 - - Transfer in/(out) of assets - 5.40 - - Benefits paid (66.19) (97.54) - - Fair value of plan assets, end of the year 698.68 674.17 - -
Pension benefits Post retirement medical benefits
As at March 31, As at April 1, As at March 31, As at April 1,
2017 2016 2015 2017 2016 2015Amount recognized in the balance sheet consists of: Present value of defined benefit obligation 813.83 770.31 756.01 150.20 133.09 132.75Fair value of plan assets 698.68 674.17 665.48 - - -Net liability (115.15) (96.14) (90.53) (150.20) (133.09) (132.75)Amounts in the balance sheet:Non–current assets 4.19 3.62 5.49 - - -Non–current liabilities (119.34) (99.76) (96.02) (150.20) (133.09) (132.75)Net liability (115.15) (96.14) (90.53) (150.20) (133.09) (132.75)
NOTES FORMING PART OF FINANCIAL STATEMENTS
Total amount recognized in other comprehensive income consists of: Pension benefits Post retirement medical benefits
As at March 31,2017 2016 2017 2016
Remeasurements (gains) / losses (27.44) (9.59) (3.51) (11.18)
(27.44) (9.59) (3.51) (11.18)

Statutory ReportsCorporate Overview Financial Statements
F-62
(Standalone)
72nd Annual Report 2016-17
(R in crores)
Information for funded plans with a defined benefit obligation in excess of plan assets: Pension benefits
As at March 31, As at April 1,
2017 2016 2015
Defined benefit obligation 704.76 664.53 651.35
Fair value of plan assets 678.06 652.25 636.76
Information for funded plans with a defined benefit obligation less than plan assets: Pension benefits
As at March 31, As at April 1,
2017 2016 2015
Defined benefit obligation 16.43 18.30 23.23
Fair value of plan assets 20.62 21.92 28.72
NOTES FORMING PART OF FINANCIAL STATEMENTS
Other changes in plan assets and benefit obligation recognized in other comprehensive income:
Pension benefits Post retirement medical benefits
As at March 31,
2017 2016 2017 2016
Remeasurements
Return on plan assets, (excluding amount included in net Interest expense) (22.93) (16.64) - -
Actuarial (gains) / losses arising from changes in demographic assumptions - 1.46 - -
Actuarial (gains) / losses arising from changes in financial assumptions 11.97 2.78 16.88 3.70
Actuarial (gains) / losses arising from changes in experience adjustments on plan liabilities (6.89) 2.81 (9.21) (14.88)
Total recognized in other comprehensive income (17.85) (9.59) 7.67 (11.18)
Total recognized in statement of profit and loss and other comprehensive income 39.89 44.07 24.45 5.26
Information for unfunded plans: Pension benefits Post retirement medical benefits
As at March 31, As at April 1, As at March 31, As at April 1,
2017 2016 2015 2017 2016 2015
Defined benefit obligation 92.64 87.48 81.43 150.22 133.10 132.75
Net pension and post retirement medical cost consist of the following components: Pension benefits Post retirement medical benefits
As at March 31,
2017 2016 2017 2016
Service cost 50.84 48.00 6.43 6.05
Net interest cost / (income) 6.90 5.66 10.35 10.39
Net periodic cost 57.74 53.66 16.78 16.44

F-63
The assumptions used in accounting for the pension and post retirement medical plans are set out below:
Pension benefits Post retirement medical benefitsAs at March 31, As at April 1, As at March 31, As at April 1,
2017 2016 2015 2017 2016 2015
Discount rate 6.75%-7.50% 6.75%-8.00% 6.75%-8.00% 7.30% 8.00% 8.00%
Rate of increase in compensation
level of covered employees 5.00% -8.00% 5.00% -11.00% 5.00% -11.00% NA NA NA
Increase in health care cost NA NA NA 6.00% 6.00% 6.00%
Plan Assets
The fair value of Company’s pension plan asset as of March 31, 2017, 2016 and April 1, 2015 by category are as follows:
Pension benefits
As at March 31, As at April 1,
2017 2016 2015
Asset category: 0.4% 2.2% 6.8%
Cash and cash equivalents 71.9% 77.8% 65.0%
Debt instruments (quoted) 5.4% 1.1% 7.0%
Debt instruments (unquoted) 1.5% 1.2% -
Equity instruments (quoted) 20.8% 17.7% 21.2%
Deposits with Insurance companies 100.0% 100.0% 100.0%
The Company’s policy is driven by considerations of maximizing returns while ensuring credit quality of the debt instruments. The asset allocation for plan assets is determined based on investment criteria prescribed under the Indian Income Tax Act, 1961, and is also subject to other exposure limitations. The Company evaluates the risks, transaction costs and liquidity for potential investments. To measure plan asset performance, the Company compares actual returns for each asset category with published bench marks.
The weighted average duration of the defined benefit obligation as at March 31, 2017 is 15.7 years (March 31, 2016 : 16 years, April 1, 2015 : 16.3 years)
The Company expects to contribute R60.89 crores to the funded pension plans in FY 2017-18.
The table below outlines the effect on the service cost, the interest cost and the defined benefit obligation in the event of a decrease/increase of 1% in the assumed rate of discount rate, salary escalation and health care cost:
Assumption Change in assumption Impact on defined benefit obligation Impact on service cost and interest cost
Discount rate Increase by 1% Decrease by R79.94 crores Decrease by R16.04 crores
Decrease by 1% Increase by R92.01 crores Increase by R17.60 crores
Salary escalation rate Increase by 1% Increase by R67.17 crores Increase by R15.58 crores
Decrease by 1% Decrease by R59.16 crores Decrease by R13.51 crores
Health care cost Increase by 1% Increase by R19.96 crores Increase by R4.58 crores
Decrease by 1% Decrease by R17.94 crores Decrease by R3.80 crores
The Company’s contribution to defined contribution plan aggregated R152.62 crores and R148.25 crores for the years ended March 31, 2017 and 2016, respectively.
NOTES FORMING PART OF FINANCIAL STATEMENTS

Statutory ReportsCorporate Overview Financial Statements
F-64
(Standalone)
72nd Annual Report 2016-17
46. Additional informationThe financial statements include the Company’s proportionate share of assets, liabilities, income and expenditure in its two Joint Operations, namely Tata Cummins Private Limited and Fiat India Automobiles Private Limited. Below are supplementary details of Tata Motors Limited on standalone basis excluding interest in the aforesaid two Joint Operations:
A. Balance Sheet (R in crores)
As at March 31, 2017
As at March 31, 2016
As at April 1, 2015
I. ASSETS1. NON-CURRENT ASSETS
(a) Property, plant and equipment 15,792.78 15,861.26 15,717.55 (b) Capital work-in-progress 1,458.75 1,415.86 1,297.53 (c) Other intangible assets 2,720.93 3,338.28 3,171.24 (d) Intangible assets under development 5,328.15 4,128.57 3,840.98 (e) Investments in subsidiaries, joint arrangements and associates 16,435.91 16,247.45 16,238.94 (f ) Financial assets
(i) Investments 528.37 627.07 626.26 (ii) Loans and advances 388.86 246.74 441.53 (iii) Other financial assets 190.54 102.34 180.34
(g) Non-current tax assets (net) 674.04 717.63 512.78 (h) Other non-current assets 1,534.09 1,485.13 1,548.57
45,052.42 44,170.33 43,575.72
2. CURRENT ASSETS(a) Inventories 5,136.99 4,902.20 4,802.08 (b) Investments in subsidiaries, joint arrangements and associates - - 15.54 (c) Financial assets
(i) Investments 2,400.92 1,745.34 4.68 (ii) Trade receivables 1,922.88 1,758.45 1,316.66 (iii) Cash and cash equivalents 109.34 211.74 861.95 (iv) Bank balances other than (iii) above 86.67 236.35 28.87 (v) Loans and advances 231.03 616.15 372.55 (vi) Other financial assets 100.69 156.94 39.27
(d) Current tax assets (net) 129.49 3.84 106.62 (e) Other current assets 1,395.46 1,273.40 1,176.49
11,513.47 10,904.41 8,724.71 TOTAL ASSETS 56,565.89 55,074.74 52,300.43
II. EQUITY AND LIABILITIESEQUITY(a) Equity Share capital 679.22 679.18 643.78 (b) Other Equity 19,874.55 22,441.98 14,604.01
20,553.77 23,121.16 15,247.79 LIABILITIES1. NON-CURRENT LIABILITIES
(a) Financial liabilities
(i) Borrowings 13,064.52 10,196.18 11,870.05 (ii) Other financial liabilities 1,123.11 2,911.26 3,721.71
(b) Provisions 822.85 729.37 687.77 (c) Other non-current liabilities 86.61 154.29 165.55
15,097.09 13,991.10 16,445.08 2. CURRENT LIABILITIES
(a) Financial liabilities(i) Borrowings 5,049.20 3,575.78 7,996.64 (ii) Trade payables 6,782.99 5,008.25 4,877.45 (iii) Acceptances 4,379.29 3,887.28 3,950.53 (iv) Other financial liabilities 2,365.30 3,321.72 2,122.06
(b) Provisions 435.24 421.95 351.14(c) Current tax liabilities (net) 67.02 67.02 22.46 (d) Other current liabilities 1,835.99 1,680.48 1,287.28
20,915.03 17,962.48 20,607.56 TOTAL EQUITY AND LIABILITIES 56,565.89 55,074.74 52,300.43
NOTES FORMING PART OF FINANCIAL STATEMENTS

F-65
B. Statement of Profit and Loss (R in crores)
Year ended March 31,
2017 2016
I. Income from operations 48,319.90 46,715.90
II. Other Income 982.12 1,406.58
III. Total Income (I + II) 49,302.02 48,122.48IV. Expenses:
(a) Cost of materials consumed 27,390.59 24,313.08
(b) Purchase of products for sale 4,405.11 5,259.27
(c) Changes in inventories of finished goods, work-in-progress, and products for sale (193.81) 22.94
(d) Excise duty 4,506.71 4,325.81
(e) Employee benefits expense 3,401.34 3,048.71
(f ) Finance cost 1,556.90 1,541.54
(g) Foreign exchange (gain)/loss (net) (253.82) 200.86
(h) Depreciation and amortisation expense 2,763.11 2,144.89
(i) Product development/Engineering expenses 453.33 417.89
(j) Other expenses 8,494.68 8,003.71 (k) Amount capitalised (941.55) (1,034.18)Total Expenses (IV) 51,582.59 48,244.52
V. Profit/(loss) before exceptional items and tax (III - IV) (2,280.57) (122.04)VI. Exceptional Items
(a) Provision for impairment of investments and cost associated with closure of operations of a subsidiary - 97.86 (b) Provision for impairment of investment in a subsidiary 123.17 - (c) Impairment of capitalised property, plant and equipment and other intangible assets - 163.94
(d) Employee separation cost 67.61 10.04
(e) Others 147.93 -
VII. Profit/(loss) before tax (V-VI) (2,619.28) (393.88)
VIII. Tax expense/(credit) (net)(a) Current tax (8.52) (88.52)(b) Deferred tax (13.14) (2.92)Total Tax Expense/(credit) (21.66) (91.44)
IX. Profit/(loss) for the period from continuing operations (VII-VIII) (2,597.62) (302.44)X. Other comprehensive income/(loss):
A. (i) Items that will not be reclassified to profit and loss:a. Remeasurement gains and (losses) on defined benefit obligations (net) 14.66 21.94 b. Equity instruments fair value through other comprehensive income 73.84 81.19
(ii) Income tax (expense)/credit relating to items that will not be reclassified to profit or loss (5.07) (7.60)B. (i) Items that will be reclassified to profit or loss - gains and (losses) in cash flow hedges 23.32 (13.98)
(ii) Income tax (expense)/credit relating to items that will be reclassified to profit or loss (8.07) 4.68 Total other comprehensive income/(loss), net of taxes 98.68 86.23
XI. Total comprehensive income/(loss) for the period (IX+X) (2,498.94) (216.21)XII. Earnings per equity share (EPS)
A. Ordinary shares (face value of R2 each) :(i) Basic R (7.65) (0.89)
(ii) Diluted R (7.65) (0.89)
B. ‘A’ Ordinary shares (face value of R2 each) :
(i) Basic R (7.65) (0.89)(ii) Diluted R (7.65) (0.89)
NOTES FORMING PART OF FINANCIAL STATEMENTS

Statutory ReportsCorporate Overview Financial Statements
F-66
(Standalone)
72nd Annual Report 2016-17
(ii)
Oth
er e
quit
y(R
in c
rore
s)Pa
rtic
ular
sSe
curi
ties
prem
ium
ac
coun
t
Capi
tal
rede
mpt
ion
rese
rve
Deb
entu
re
rede
mpt
ion
rese
rve
Reta
ined
ear
ning
sO
ther
com
pone
nts
of e
quit
y (O
CI)
Tota
l oth
er
equi
tyU
ndis
trib
utab
le
(Ind
AS
101)
Dis
trib
utab
leEq
uity
in
stru
men
ts
thro
ugh
OCI
Hed
ging
re
serv
eCo
st o
f H
edgi
ng
rese
rve
Bala
nce
as a
t Apr
il 1,
201
6 1
9,20
9.42
2
.28
1,0
42.1
5 7
09.3
6 1
,572
.34
(100
.96)
7.3
9 -
22,
441.
98
Profi
t/(lo
ss) f
or th
e ye
ar -
- -
- (2
,597
.62)
- -
- (2
,597
.62)
Oth
er c
ompr
ehen
sive
inco
me
/(lo
ss) f
or th
e ye
ar -
- -
- 9
.59
73.
84
3.8
7 1
1.38
9
8.68
Tota
l com
preh
ensi
ve in
com
e/(lo
ss) f
or th
e ye
ar -
- -
- (2
,588
.03)
73.
84
3.8
7 1
1.38
(2
,498
.94)
Proc
eeds
from
issu
e of
sha
res
held
in a
beya
nce
4.5
1 -
- -
- -
- -
4.5
1
Tran
sfer
to D
eben
ture
re
dem
ptio
n re
serv
e-
- 4
3.79
-
(43.
79)
--
- -
Div
iden
d (in
clud
ing
di
vide
nd ta
x)-
--
- (7
3.00
)-
--
(73.
00)
Bala
nce
as a
t Mar
ch 3
1, 2
017
19,
213.
93
2.2
8 1
,085
.94
709
.36
(1,1
32.4
8) (2
7.12
) 1
1.26
1
1.38
1
9,87
4.55
NO
TES
FORM
ING
PA
RT O
F FI
NA
NCI
AL
STAT
EMEN
TS
CSt
atem
ent o
f Cha
nges
in E
quit
y fo
r the
yea
r end
ed M
arch
31,
201
7(i)
Equi
ty S
hare
Cap
ital
(R in
cro
res)
Part
icul
ars
Equi
ty S
hare
Ca
pita
l
Bala
nce
as a
t Apr
il 1,
201
6 6
79.1
8
Proc
eeds
fr
om
issu
e of
sh
ares
he
ld
in
abey
ance
an
d am
ount
s re
ceiv
ed o
n un
paid
cal
ls
0.0
4
Bala
nce
as a
t Mar
ch 3
1, 2
017
679
.22

F-67
D.
Stat
emen
t of C
hang
es in
Equ
ity
for t
he y
ear e
nded
Mar
ch 3
1, 2
016
(i)Eq
uity
Sha
re C
apita
l(R
in c
rore
s)Pa
rtic
ular
sEq
uity
Sha
re
Capi
tal
Bala
nce
as a
t Apr
il 1,
201
5 6
43.7
8
Issue
of s
hare
s pur
suan
t to
Righ
ts is
sue
35.
40
Bala
nce
as a
t Mar
ch 3
1, 2
016
679
.18
(ii)
Oth
er e
quit
y(R
in c
rore
s)Pa
rtic
ular
sSe
curi
ties
prem
ium
ac
coun
t
Capi
tal
rede
mpt
ion
rese
rve
Deb
entu
re
rede
mpt
ion
rese
rve
Reta
ined
ear
ning
sO
ther
com
pone
nts
of e
quit
y (O
CI)
Tota
l oth
er
equi
tyU
ndis
trib
utab
le
(Ind
AS
101)
Dis
trib
utab
leEq
uity
in
stru
men
ts
thro
ugh
OCI
Hed
ging
re
serv
e
Bala
nce
as a
t Apr
il 1,
201
5 1
1,81
1.60
2
.28
1,0
42.1
5 4
94.9
5 1
,338
.11
(101
.77)
16.
69
14,
604.
01
Profi
t/(lo
ss) f
or th
e ye
ar -
- -
(536
.67)
234
.23
- -
(302
.44)
Oth
er c
ompr
ehen
sive
inco
me
/(lo
ss) f
or th
e ye
ar -
- -
14.
34
- 8
1.19
(9
.30)
86.
23
Tota
l com
preh
ensiv
e in
com
e/(lo
ss) f
or th
e ye
ar -
- -
(522
.33)
234
.23
81.
19
(9.3
0) (2
16.2
1)
Profi
t on
sale
of u
nquo
ted
equi
ty in
vest
men
t -
- -
80.
38
- (8
0.38
) -
-
Profi
t on
sale
of i
nves
tmen
ts
on c
omm
on c
ontr
ol
tran
sact
ions
- -
- 6
56.3
6 -
- -
656
.36
Issue
of s
hare
s pur
suan
t to
Righ
ts is
sue
(net
of I
ssue
ex
pens
es o
f R57
.27
cror
es)
7
,397
.82
-
-
-
-
-
-
7
,397
.82
Bala
nce
as a
t Mar
ch 3
1, 2
016
19,
209.
42
2.2
8 1
,042
.15
709
.36
1,5
72.3
4 (1
00.9
6) 7
.39
22,
441.
98
NO
TES
FORM
ING
PA
RT O
F FI
NA
NCI
AL
STAT
EMEN
TS

Statutory ReportsCorporate Overview Financial Statements
F-68
(Standalone)
72nd Annual Report 2016-17
ii) Disclosure on Specified Bank Notes (SBNs)
As required by MCA notification G.S.R. 308 (E) dated March 30, 2017, details in respect of Specified Bank Notes (SBNs) held and transacted during the period from November 8, 2016 to December 30, 2016 are given below:
(Amount in R)Particulars SBNs Other denomination notes TotalClosing cash in hand as on November 8, 2016 20,52,250 2,64,624 23,16,874(+) Non-permitted receipts 79,500 - 79,500(+) Permitted receipts - 1,74,88,395 1,74,88,395(-) Permitted payments - (81,69,746) (81,69,746)(-) Amount deposited in banks (21,31,750) (80,92,795) (1,02,24,545)Closing cash in hand as on December 30, 2016 - 14,90,478 14,90,478
iii) Expenditure incurred on Research and Development by Tata Motors Ltd on standalone basis excluding interest in the joint operations (R in crores)
Particulars , Year ended March 312017 2016
(a) Revenue expenditure-charged to statement of profit and loss 508.26 563.11 (b) Revenue expenditure-capitalised 1,526.34 1,573.20 (c) Capital expenditure 65.59 80.80
2,100.19 2,217.11
iv) The Company has a process whereby periodically all long term contracts (including derivative contracts) are assessed for material foreseeable losses. At the year end, the Company has reviewed and ensured that adequate provision as required under any law/ accounting standards for material foreseeable losses on such long term contracts (including derivative contracts) has been made in the books of account.
v) Current year figures are shown in bold prints.
(R in crores)
As at March 31, As at April 1,2017 2016 2015
(a) Amounts outstanding but not due as at March 31/April 1, 123.27 128.40 139.43(b) Amounts due but unpaid as at March 31/April 1, - Principal - - - (c) Amounts paid after appointed date during the year - Principal 88.32 123.71 127.08(d) Amount of interest accrued and unpaid as at March 31/April 1, - Interest 1.72 1.18 1.16(e) Amount of estimated interest due and payable for the period from April 1,2017
to actual date of payment or May 23, 2017 (whichever is earlier) - Interest 0.18 0.09 0.10
47. Other Notes:
i) Micro, Small and Medium Enterprises Development Act, 2006
The information as required to be disclosed under the Micro, Small and Medium Enterprises Development Act, 2006 has been determined to the extent such parties have been identified on the basis of information available with the Company. The amount of principal and interest outstanding during the year is given below :
R A MASHELKAR [DIN: 00074119]
N MUNJEE [DIN:00010180]
V K JAIRATH [DIN: 00391684]
O P BHATT [DIN:00548091]
R SPETH [DIN: 03318908]Directors
N CHANDRASEKARAN [DIN: 00121863]Chairman
GUENTER BUTSCHEK [DIN: 07427375] CEO & Managing Director R PISHARODY [DIN: 01875848] Executive Director S B BORWANKAR [DIN: 01793948] Executive Director
C RAMAKRISHNAN Group Chief Financial Officer
H K SETHNA [FCS: 3507]Company Secretary
Mumbai, May 23, 2017
For and on behalf of the Board
NOTES FORMING PART OF FINANCIAL STATEMENTS

F-69
INDEPENDENT AUDITOR’S REPORT
TO THE MEMBERS OF
TATA MOTORS LIMITED
Report on the Consolidated Ind AS Financial Statements
We have audited the accompanying consolidated Ind AS financial statements of TATA MOTORS LIMITED (hereinafter referred to as “the Parent”) and its subsidiaries (the Parent and its subsidiaries together referred to as “the Group”) its associates and its joint ventures, comprising the Consolidated Balance Sheet as at March 31, 2017, the Consolidated Statement of Profit and Loss (including Other Comprehensive Income), the Consolidated Cash Flow Statement, the Consolidated Statement of Changes in Equity, for the year then ended, and a summary of the significant accounting policies and other explanatory information (hereinafter referred to as “the consolidated Ind AS financial statements”) and which includes two Joint Operation Companies consolidated on a proportionate basis with the Parent.
Management’s Responsibility for the Consolidated Ind AS Financial Statements
The Parent’s Board of Directors is responsible for the preparation of these consolidated Ind AS financial statements in terms of the requirements of the Companies Act, 2013 (hereinafter referred to as “the Act”) that give a true and fair view of the consolidated financial position, consolidated financial performance including other comprehensive income, consolidated cash flows and statement of changes in equity of the Group including its Associates and Joint ventures in accordance with the accounting principles generally accepted in India, including the Indian Accounting Standards (Ind AS) prescribed under Section 133 of the Act. The respective Boards of Directors of the companies included in the Group and of its associates, joint ventures and joint operation companies are responsible for maintenance of adequate accounting records in accordance with the provisions of the Act for safeguarding the assets of the Group and its associates, its joint ventures and joint operation companies and for preventing and detecting frauds and other irregularities; the selection and application of appropriate accounting policies; making judgments and estimates that are reasonable and prudent; and the design, implementation and maintenance of adequate internal financial controls, that were operating effectively for ensuring the accuracy and completeness of the accounting records, relevant to the preparation and presentation of the financial statements that give a true and fair view and are free from material misstatement, whether due to fraud or error, which have been used for the purpose of preparation of the consolidated Ind AS financial statements by the Directors of the Parent, as aforesaid.
Auditor’s Responsibility
Our responsibility is to express an opinion on these consolidated Ind AS financial statements based on our audit. In conducting our audit, we have taken into account the provisions of the Act, the accounting and auditing standards and matters which are required to be included in the audit report under the provisions of the Act and the Rules made thereunder.
We conducted our audit in accordance with the Standards on Auditing specified under Section 143(10) of the Act. Those Standards require that we comply with ethical requirements and plan and perform the audit to obtain reasonable assurance about whether the consolidated Ind AS financial statements are free from material misstatement.
An audit involves performing procedures to obtain audit evidence about the amounts and the disclosures in the consolidated Ind AS financial statements. The procedures selected depend on the auditor’s judgment, including the assessment of the risks of material misstatement of the consolidated Ind AS financial statements, whether due to fraud or error. In making those risk assessments, the auditor considers internal financial control relevant to the Parent’s preparation of the consolidated Ind AS financial statements that give a true and fair view in order to design audit procedures that are appropriate in the circumstances. An audit also includes evaluating the appropriateness of the accounting policies used and the reasonableness of the accounting estimates made by the Parent’s Board of Directors, as well as evaluating the overall presentation of the consolidated Ind AS financial statements.
We believe that the audit evidence obtained by us and the audit evidence obtained by the other auditors in terms of their reports referred to in sub-paragraph (a) of the Other Matters paragraph below, is sufficient and appropriate to provide a basis for our audit opinion on the consolidated Ind AS financial statements.

Statutory ReportsCorporate Overview Financial Statements
F-70
(Consolidated)
72nd Annual Report 2016-17
Opinion
In our opinion and to the best of our information and according to the explanations given to us and based on the consideration of reports of the other auditors on separate financial statements/financial information of the subsidiaries, associates and joint ventures referred to below in the Other Matters paragraph, the aforesaid consolidated Ind AS financial statements give the information required by the Act in the manner so required and give a true and fair view in conformity with the accounting principles generally accepted in India, of the consolidated state of affairs of the Group, its associates and joint ventures as at March 31, 2017, and their consolidated profit/loss, consolidated total comprehensive income/ loss, their consolidated cash flows and consolidated statement of changes in equity for the year ended on that date.
Other Matters
(a) We did not audit the financial statements/financial information of thirteen subsidiaries, whose financial statements/financial information reflect total assets(net) of R56,463.53 crores as at March 31, 2017, total revenues of R224,217.37 crores and net cash outflows amounting to R3,785.40 crores for the year ended on that date, as considered in the consolidated Ind AS financial statements. The consolidated Ind AS financial statements also include the Group’s share of net profit of R104.18 crores for the year ended March 31, 2017, as considered in the consolidated Ind AS financial statements, in respect of three associates, whose financial statements/financial information have not been audited by us. These financial statements have been audited by other auditors whose reports have been furnished to us by the Management and our opinion on the consolidated Ind AS financial statements, in so far as it relates to the amounts and disclosures included in respect of these subsidiaries and associates, and our report in terms of sub-section (3) of Section 143 of the Act, in so far as it relates to the aforesaid subsidiaries and associates is based solely on the reports of the other auditors.
(b) We did not audit the financial statements/financial information of six subsidiaries, whose financial statements/financial information reflect total assets (net) of (-) R311.26 crores as at March 31, 2017, total revenues of R336.51 crores and net cash outflows amounting to R46.11 crores for the year ended on that date, as considered in the consolidated Ind AS financial statements. These financial statements/financial information are unaudited and have been furnished to us by the Management and our opinion on the consolidated Ind AS financial statements, in so far as it relates to the amounts and disclosures included in respect of these subsidiaries is based solely on such unaudited financial statements/financial information. In our opinion and according to the information and explanations given to us by the Management, these financial statements/financial information are not material to the Group.
(c) The comparative financial information for the year ended March 31, 2016 and the transition date opening balance sheet as at April 1, 2015 in respect of thirteen subsidiaries and three associates included in this consolidated Ind AS financial statements prepared in accordance with the Ind AS have been audited by other auditors and have been relied upon by us.
Our opinion on the consolidated Ind AS financial statements above, and our report on Other Legal and Regulatory Requirements below, is not modified in respect of the above matters with respect to our reliance on the work done and the reports of other auditors and the financial statements/financial information certified by the Management.
Report on Other Legal and Regulatory Requirements
As required by Section 143(3) of the Act, based on our audit and on the consideration of the report of other auditors on separate financial statements and the other financial information of subsidiaries, associates and joint venture companies incorporated in India, referred in the Other Matters paragraph above we report, to the extent applicable, that:
(a) We have sought and obtained all the information and explanations which to the best of our knowledge and belief were necessary for the purposes of our audit of the aforesaid consolidated Ind AS financial statements.
(b) In our opinion, proper books of account as required by law relating to preparation of the aforesaid consolidated Ind AS financial statements have been kept so far as it appears from our examination of those books and the reports of the other auditors.
(c) The Consolidated Balance Sheet, the Consolidated Statement of Profit and Loss (including Other Comprehensive Income), the Consolidated Cash Flow Statement and Consolidated Statement of Changes in Equity dealt with by this Report are in agreement with the relevant books of account maintained for the purpose of preparation of the consolidated Ind AS financial statements.
(d) In our opinion, the aforesaid consolidated Ind AS financial statements comply with the Indian Accounting Standards prescribed under Section 133 of the Act.

F-71
(e) On the basis of the written representations received from the directors of the Parent as on March 31, 2017 taken on record by the Board of Directors of the Parent and the reports of the statutory auditors of its subsidiary companies, associate companies, joint venture companies and joint operation companies incorporated in India, none of the directors of the Group companies, its associate companies, joint venture companies and its joint operation companies incorporated in India are disqualified as on March 31, 2017 from being appointed as a director in terms of Section 164 (2) of the Act.
(f ) With respect to the adequacy of the internal financial controls over financial reporting and the operating effectiveness of such controls, refer to our separate Report in “Annexure A”, which is based on the auditors’ reports of the Parent, subsidiary companies, associate companies, joint venture companies and joint operation companies incorporated in India. Our report expresses an unmodified opinion on the adequacy and operating effectiveness of internal financial controls over financial reporting of the Parent, its subsidiary companies, associate companies, joint venture companies and joint operation companies incorporated in India.
(g) With respect to the other matters to be included in the Auditor’s Report in accordance with Rule 11 of the Companies (Audit and Auditor’s) Rules, 2014, as amended, in our opinion and to the best of our information and according to the explanations given to us:
i. The consolidated Ind AS financial statements disclose the impact of pending litigations on the consolidated financial position of the Group, its associates, its joint ventures and joint operation companies.
ii. Provision has been made in the consolidated Ind AS financial statements, as required under the applicable law or accounting standards, for material foreseeable losses, if any, on long-term contracts including derivative contracts.
iii. There has been no delay in transferring amounts required to be transferred, to the Investor Education and Protection Fund by the Parent and its subsidiaries, associates, joint ventures and joint operations companies incorporated in India.
iv. The Parent has provided requisite disclosures in the consolidated Ind AS financial statements as regards the holding and dealings in Specified Bank Notes as defined in the Notification S.O. 3407(E) dated the November 8, 2016 of the Ministry of Finance, during the period from November 8, 2016 to December 30, 2016 of the Group entities and joint operation companies as applicable. However, as stated in Note No. 45 (a) to the consolidated Ind AS financial statements, amounts aggregating to R79,500/- as represented to us by the Management have been received from transactions which are not permitted.
For DELOITTE HASKINS & SELLS LLP Chartered Accountants
(Firm Registration No. 117366W/W-100018)
B. P. SHROFFPartner
(Membership No. 34382)Mumbai, May 23, 2017

Statutory ReportsCorporate Overview Financial Statements
F-72
(Consolidated)
72nd Annual Report 2016-17
ANNEXURE “A” TO THE INDEPENDENT AUDITOR’S REPORT(Referred to in paragraph (f ) under ‘Report on Other Legal and Regulatory Requirements’ section of our report of even date to Members of Tata Motors Limited)
Report on the Internal Financial Controls Over Financial Reporting under Clause (i) of Sub-section 3 of Section 143 of the Companies Act, 2013 (“the Act”)
In conjunction with our audit of the consolidated Ind AS financial statements of the Company as of and for the year ended March 31, 2017, we have audited the internal financial controls over financial reporting of TATA MOTORS LIMITED (hereinafter referred to as “Parent”) and its subsidiary companies, which includes internal financial controls over financial reporting of its joint operation companies incorporated in India, its associate companies and joint ventures, which are companies incorporated in India, as of that date.
Management’s Responsibility for Internal Financial Controls
The respective Board of Directors of the Parent, its subsidiary companies, its joint operation companies, its associate companies and joint ventures, which are companies incorporated in India, are responsible for establishing and maintaining internal financial controls based on the internal control over financial reporting criteria established by the respective Companies considering the essential components of internal control stated in the Guidance Note on Audit of Internal Financial Controls Over Financial Reporting (“the Guidance Note”) issued by the Institute of Chartered Accountants of India (ICAI). These responsibilities include the design, implementation and maintenance of adequate internal financial controls that were operating effectively for ensuring the orderly and efficient conduct of its business, including adherence to the respective company’s policies, the safeguarding of its assets, the prevention and detection of frauds and errors, the accuracy and completeness of the accounting records, and the timely preparation of reliable financial information, as required under the Companies Act, 2013.
Auditor’s Responsibility
Our responsibility is to express an opinion on the internal financial controls over financial reporting of the Parent, its subsidiary companies, its joint operation companies, its associate companies and its joint ventures, which are companies incorporated in India, based on our audit. We conducted our audit in accordance with the Guidance Note on Audit of Internal Financial Controls Over Financial Reporting (the “Guidance Note”) issued by the Institute of Chartered Accountants of India and the Standards on Auditing, prescribed under Section 143(10) of the Companies Act, 2013, to the extent applicable to an audit of internal financial controls. Those Standards and the Guidance Note require that we comply with ethical requirements and plan and perform the audit to obtain reasonable assurance about whether adequate internal financial controls over financial reporting was established and maintained and if such controls operated effectively in all material respects.
Our audit involves performing procedures to obtain audit evidence about the adequacy of the internal financial controls system over financial reporting and their operating effectiveness. Our audit of internal financial controls over financial reporting included obtaining an understanding of internal financial controls over financial reporting, assessing the risk that a material weakness exists, and testing and evaluating the design and operating effectiveness of internal control based on the assessed risk. The procedures selected depend on the auditor’s judgement, including the assessment of the risks of material misstatement of the financial statements, whether due to fraud or error.
We believe that the audit evidence we have obtained and the audit evidence obtained by other auditors of the subsidiary companies, joint operations, associate companies and joint ventures, which are companies incorporated in India, in terms of their reports referred to in the Other Matters paragraph below, is sufficient and appropriate to provide a basis for our audit opinion on the internal financial controls system over financial reporting of the Parent, its subsidiary companies, its joint operation companies, its associate companies and its joint ventures, which are companies incorporated in India.
Meaning of Internal Financial Controls Over Financial Reporting
A company’s internal financial control over financial reporting is a process designed to provide reasonable assurance regarding the reliability of financial reporting and the preparation of financial statements for external purposes in accordance with generally accepted accounting principles. A company’s internal financial control over financial reporting includes those policies and procedures that (1) pertain to the maintenance of records that, in reasonable detail, accurately and fairly reflect the transactions and dispositions of the assets of the company; (2)

F-73
provide reasonable assurance that transactions are recorded as necessary to permit preparation of financial statements in accordance with generally accepted accounting principles, and that receipts and expenditures of the company are being made only in accordance with authorisations of management and directors of the company; and (3) provide reasonable assurance regarding prevention or timely detection of unauthorised acquisition, use, or disposition of the company’s assets that could have a material effect on the financial statements.
Inherent Limitations of Internal Financial Controls Over Financial Reporting
Because of the inherent limitations of internal financial controls over financial reporting, including the possibility of collusion or improper management override of controls, material misstatements due to error or fraud may occur and not be detected. Also, projections of any evaluation of the internal financial controls over financial reporting to future periods are subject to the risk that the internal financial control over financial reporting may become inadequate because of changes in conditions, or that the degree of compliance with the policies or procedures may deteriorate.
Opinion
In our opinion and to the best of our information and according to the explanations given to us and based on the consideration of the reports of other auditors referred to in the Other Matters paragraph below, the Parent, its subsidiary companies, its joint operation companies, its associate companies and joint ventures, which are companies incorporated in India, have, in all material respects, an adequate internal financial controls system over financial reporting and such internal financial controls over financial reporting were operating effectively as at March 31, 2017, based on the internal control over financial reporting criteria established by the respective companies considering the essential components of internal control stated in the Guidance Note on Audit of Internal Financial Controls Over Financial Reporting issued by the Institute of Chartered Accountants of India.
Other Matters
Our aforesaid report under Section 143(3)(i) of the Act on the adequacy and operating effectiveness of the internal financial controls over financial reporting in so far as it relates to one subsidiary company and two associate companies, which are companies incorporated in India, is based solely on the corresponding reports of the auditors of such companies incorporated in India.
Our opinion is not modified in respect of the above matters.
For DELOITTE HASKINS & SELLS LLP Chartered Accountants
(Firm Registration No. 117366W/W-100018)
B. P. SHROFFPartner
(Membership No. 34382)Mumbai, May 23, 2017

Statutory ReportsCorporate Overview Financial Statements
F-74
(Consolidated)
72nd Annual Report 2016-17
(R in crores)
Note As at March 31, 2017
As atMarch 31, 2016
As atApril 1,2015
I. ASSETS1. NON-CURRENT ASSETS
(a) Property, plant and equipment 3 59,594.56 64,927.07 54,264.65 (b) Capital work-in-progress 10,186.83 6,550.97 8,852.69 (c) Goodwill 5 673.32 759.80 731.95 (d) Other intangible assets 6 35,676.20 41,544.89 33,908.19 (e) Intangible assets under development 23,512.01 19,367.97 19,155.46 (f ) Investment in equity accounted investees 7 4,606.01 3,763.95 3,173.66 (g) Financial assets: (i) Other investments 8 690.76 770.03 768.85 (ii) Finance receivables 16 10,753.13 9,671.55 9,606.60 (iii) Loans and advances 10 753.66 503.88 496.71 (iv) Other financial assets 11 2,911.12 1,825.51 647.64 (h) Deferred tax assets (net) 20 4,457.34 3,957.03 4,049.41 (i) Non-current tax assets (net) 260.20 1,265.81 947.45 (j) Other non-current assets 18 2,847.36 2,309.02 1,983.60
156,922.50 157,217.48 138,586.86
2. CURRENT ASSETS(a) Inventories 12 35,085.31 32,655.73 29,044.15 (b) Financial assets: (i) Other investments 9 15,041.15 19,233.04 14,074.78 (ii) Trade receivables 13 14,075.55 13,570.91 12,972.80 (iii) Cash and cash equivalents 14 13,986.76 17,153.61 19,743.09 (iv) Bank balances other than (iii) above 15 22,091.12 13,306.79 10,668.84 (v) Finance receivables 16 6,810.12 6,079.92 4,959.45 (vi) Loans and advances 10 710.45 1,117.10 779.78 (vii) Other financial assets 11 1,555.94 835.73 1,689.80 (c) Current tax assets (net) 935.47 146.75 212.08 (d) Other current assets 19 6,539.99 5,824.09 5,412.09
116,831.86 109,923.67 99,556.86 TOTAL ASSETS 273,754.36 267,141.15 238,143.72
II. EQUITY AND LIABILITIESEQUITY
(a) Equity share capital 21 679.22 679.18 643.78 (b) Other equity 22 57,382.67 78,273.23 54,628.80
Equity attributable to owners of Tata Motors Ltd 58,061.89 78,952.41 55,272.58 Non-controlling interests 453.17 432.84 429.75
58,515.06 79,385.25 55,702.33 LIABILITIES
1. NON-CURRENT LIABILITIES (a) Financial liabilities: (i) Borrowings 24 60,629.18 50,510.39 54,607.14 (ii) Other financial liabilities 26 11,409.58 7,943.74 7,994.85 (b) Provisions 28 9,004.46 7,891.01 6,938.27 (c) Deferred tax liabilities (net) 20 1,174.00 4,474.78 2,559.49 (d) Other non-current liabilities 29 17,392.56 9,886.55 10,948.00
99,609.78 80,706.47 83,047.75
2. CURRENT LIABILITIES (a) Financial liabilities: (i) Borrowings 25 13,859.94 11,450.78 13,154.68 (ii) Trade payables 57,698.33 57,580.46 52,094.70 (iii) Acceptances 4,834.24 3,981.33 4,076.75 (iv) Other financial liabilities 27 25,634.83 21,281.60 19,173.01 (b) Provisions 28 5,807.76 5,844.51 4,969.12 (c) Current tax liabilities (net) 1,392.58 723.53 820.13 (d) Other current liabilities 30 6,401.84 6,187.22 5,105.25
115,629.52 107,049.43 99,393.64 TOTAL EQUITY AND LIABILITIES 273,754.36 267,141.15 238,143.72
See accompanying notes to the consolidated financial statements
In terms of our report attached For and on behalf of the Board
For DELOITTE HASKINS & SELLS LLP Chartered Accountants
B P SHROFFPartner
Mumbai, May 23, 2017
R A MASHELKAR [DIN: 00074119]
N MUNJEE [DIN:00010180]
V K JAIRATH [DIN: 00391684]
O P BHATT [DIN:00548091]
R SPETH [DIN: 03318908]Directors
N CHANDRASEKARAN [DIN: 00121863]Chairman
GUENTER BUTSCHEK [DIN: 07427375] CEO & Managing Director R PISHARODY [DIN: 01875848] Executive Director S B BORWANKAR [DIN: 01793948] Executive Director C RAMAKRISHNAN Group Chief Financial Officer
H K SETHNA [FCS: 3507]Company Secretary
Mumbai, May 23, 2017
CONSOLIDATED BALANCE SHEET

F-75
In terms of our report attached For and on behalf of the Board
For DELOITTE HASKINS & SELLS LLP Chartered Accountants
B P SHROFFPartner
Mumbai, May 23, 2017
R A MASHELKAR [DIN: 00074119]
N MUNJEE [DIN:00010180]
V K JAIRATH [DIN: 00391684]
O P BHATT [DIN:00548091]
R SPETH [DIN: 03318908]Directors
N CHANDRASEKARAN [DIN: 00121863]Chairman
GUENTER BUTSCHEK [DIN: 07427375] CEO & Managing Director R PISHARODY [DIN: 01875848] Executive Director S B BORWANKAR [DIN: 01793948] Executive Director C RAMAKRISHNAN Group Chief Financial Officer
H K SETHNA [FCS: 3507]Company Secretary
Mumbai, May 23, 2017
CONSOLIDATED STATEMENT OF PROFIT AND LOSS (R in crores)
Year ended March 31,Note 2017 2016
I. Income from operations 31 274,492.12 277,660.59 II. Other income 32 754.54 885.35 III. Total Income (I+II) 275,246.66 278,545.94 IV. Expenses:
(a) Cost of materials consumed(i) Cost of materials consumed 160,147.12 151,065.61 (ii) Basis adjustment on hedge accounted derivatives (777.57) 2,226.88
(b) Purchase of products for sale 13,924.53 12,841.52 (c) Changes in inventories of finished goods, work-in-progress and products for sale (7,399.92) (2,750.99)(d) Excise duty 4,799.61 4,614.99 (e) Employee benefits expense 33 28,332.89 28,880.89 (f ) Finance costs 34 4,238.01 4,889.08 (g) Foreign exchange (gain)/loss (net) 3,910.10 1,616.88 (h) Depreciation and amortisation expense 17,904.99 16,710.78 (i) Product development/Engineering expenses 3,413.57 3,468.77 (j) Other expenses 35 55,430.06 55,683.75 (k) Amount capitalised (16,876.96) (16,678.34)Total Expenses (IV) 267,046.43 262,569.82
V. Profit before exceptional items and tax (III-IV) 8,200.23 15,976.12 VI. Exceptional Items:
(a) Employee separation cost 67.61 32.72 (b) Others 12(iv) & 45(b) (1,182.17) 1,817.63
VII. Profit before tax (V-VI) 9,314.79 14,125.77 VIII. Tax expense 20
(a) Current tax 3,137.66 1,862.05 (b) Deferred tax 113.57 1,163.00 Total tax expense 3,251.23 3,025.05
IX. Profit/(loss) for the year from continuing operations (VII-VIII) 6,063.56 11,100.72 X. Share of profit/(loss) of joint ventures and associates (net) 7 1,493.00 577.47 XI. Profit for the year (IX+X) 7,556.56 11,678.19
Attributable to:(a) Shareholders of the Company 7,454.36 11,579.31 (b) Non-controlling interests 102.20 98.88
XII. Other comprehensive income/(loss):(A) (i) Items that will not be reclassified to profit or loss:
(a) Remeasurement gains and (losses) on defined benefit obligations (net) (7,823.75) 4,867.37 (b) Quoted equity instruments at fair value through other comprehensive income 83.15 68.79 (c) Share of other comprehensive income in equity accounted investees (net) (6.08) (1.34)(d) Gains and (losses) in cash flow hedges of forecast inventory purchases 2,026.77 2,430.04
(ii) Income tax (expense)/credit relating to items that will not be reclassified to profit or loss: 867.35 (1,514.57)(B) (i) Items that will be reclassified to profit or loss:
(a) Exchange differences in translating the financial statements of foreign operations (9,678.58) 1,687.11(b) Gains and (losses) in cash flow hedges of forecast sales (15,565.66) (5,371.92)(c) Share of other comprehensive income in associates and joint ventures (net) (304.70) 29.00
(ii) Income tax (expense)/credit relating to items that will be reclassified to profit or loss: 2,906.93 962.98 Total Other comprehensive income/(loss) for the year (net of tax) (27,494.57) 3,157.46 Attributable to:
(a) Shareholders of the Company (27,460.30) 3,145.33 (b) Non-controlling interests (34.27) 12.13
XIII. Total comprehensive income/(loss) for the year (net of tax) (XI+XII) (19,938.01) 14,835.65 Attributable to:
(a) Shareholders of the Company (20,005.94) 14,724.64 (b) Non-controlling interests 67.93 111.01
XIV. Earnings per equity share (EPS) 43(A) Ordinary shares (face value of `2 each):
(i) Basic EPS ` 21.94 34.25 (ii) Diluted EPS ` 21.93 34.24
(B) ‘A’ Ordinary shares (face value of `2 each):(i) Basic EPS ` 22.04 34.35 (ii) Diluted EPS ` 22.03 34.34
See accompanying notes to the consolidated financial statements

Statutory ReportsCorporate Overview Financial Statements
F-76
(Consolidated)
72nd Annual Report 2016-17
CONSOLIDATED CASH FLOW STATEMENT (R in crores)
Year ended March 31,
2017 2016
Cash flows from operating activities
Profit for the year 7,556.56 11,678.19
Adjustments for:Depreciation and amortisation expense 17,904.99 16,710.78
Allowances for finance receivables (28.15) 220.96
Allowances for trade and other receivables 132.93 664.66
Inventory write-down 295.59 328.59
Exceptional items-others (1,182.17) 2,172.63
Provision for costs associated with closure of operations and impairment of intangibles - 44.31
Marked-to-market on investments measured at Fair value through profit or loss (5.68) (12.01)
Impairment of capitalised property, plant and equipment and other intangible assets 101.69 163.94
Impairment of Goodwill 14.25 -
Loss on sale of assets (including assets scrapped/written off ) (net) 272.00 792.04
Profit on sale of investments (net) (176.14) (101.00)
Gain on fair value of below market interest loans (46.52) (50.50)
Share of profit of joint ventures and associates (net) (1,493.00) (577.47)
Tax expense (net) 3,251.23 3,025.05
Interest/dividend (net) 3,665.29 4,116.74
Foreign exchange gain (net) (1,422.76) (550.77)
Cash flows from operating activities before changes in following assets and liabilities 28,840.11 38,626.14
Finance receivables (1,783.64) (1,406.39)
Trade receivables (2,368.66) (817.01)
Loans and advances and other financial assets 379.93 (520.00)
Other current and non-current assets (1,274.96) 54.91
Inventories (6,620.67) (5,743.35)
Trade payables and acceptances 9,300.56 3,947.46
Other current and non-current liabilities 1,911.48 3,705.02
Other financial liabilities 744.28 708.84
Provisions 2,965.92 1,383.70 Cash generated from operations 32,094.35 39,939.32
Income tax paid (net) (1,895.10) (2,039.78)
Net cash from operating activities 30,199.25 37,899.54
Cash flows from investing activities:Payments for property, plant and equipment (16,071.78) (16,135.93)
Payments for other intangible assets (14,395.10) (15,367.06)
Proceeds from sale of property, plant and equipment 53.39 58.84
Investments in Mutual Fund (purchased)/sold (net) 1,914.38 (4,714.73)
Loans to others (9.78) (0.75)
Repayment of loans by others 0.75 8.33
Repayment of loans by joint operation 132.50 -
Acquisition of subsidiary company - (111.44)
Investment in equity accounted investees (106.95) -
Investments - others (6.36) (12.91)
Proceeds from sale of investments in other companies 50.61 89.20
Interest received 638.18 730.96
Dividend received 10.51 42.27
Dividend received from joint ventures and associates 609.19 15.42
Decrease in short-term inter-corporate deposit 30.00 65.00
Deposits with financial institution (35.00) (1,968.00)
Realisation of deposits with financial institution - 1,968.00
Deposits/restricted deposits with banks (45,127.19) (47,202.63)
Realisation of deposits/restricted deposits with banks 34,232.77 45,031.00
Net cash used in investing activities (38,079.88) (37,504.43)

F-77
CONSOLIDATED CASH FLOW STATEMENT (Rin crores)
Year ended March 31,
2017 2016Cash flows from financing activities
Proceeds from Rights issue of shares (net of issue expenses) 4.55 7,433.22
Proceeds from issue of shares to minority shareholders 0.62 0.19
Proceeds from long-term borrowings 18,384.52 11,058.70
Repayment of long-term borrowings (9,212.13) (14,585.48)
Proceeds from short-term borrowings 15,005.26 8,460.20
Repayment of short-term borrowings (11,753.71) (9,000.44)
Net change in other short-term borrowings (with maturity up to three months) (766.25) (1,337.74)
Dividend paid (including dividend distribution tax) (73.00) -
Dividend paid to non-controlling interests shareholders of subsidiaries (including dividend distribution tax) (48.22) (108.11)
Interest paid [including discounting charges paid R666.40 crores (March 31, 2016 R635.52 crores)] (5,336.34) (5,715.66)
Net cash from/(used in) financing activities 6,205.30 (3,795.12)
Net decrease in cash and cash equivalents (1,675.33) (3,400.01)
Cash and cash equivalents as at April 01, (opening balance) 17,153.61 19,743.09
Effect of foreign exchange on cash and cash equivalents (1,491.52) 810.53
Cash and cash equivalents as at March 31, (closing balance) 13,986.76 17,153.61
Non-cash transactions:
Liability towards property, plant and equipment and intangible asests purchased on credit/deferred credit 3,346.35 3,796.05
In terms of our report attached For and on behalf of the Board
For DELOITTE HASKINS & SELLS LLP Chartered Accountants
B P SHROFFPartner
R A MASHELKAR [DIN: 00074119]
N MUNJEE [DIN:00010180]
V K JAIRATH [DIN: 00391684]
O P BHATT [DIN:00548091]
R SPETH [DIN: 03318908]Directors
N CHANDRASEKARAN [DIN: 00121863]Chairman
GUENTER BUTSCHEK [DIN: 07427375] CEO & Managing Director R PISHARODY [DIN: 01875848] Executive Director S B BORWANKAR [DIN: 01793948] Executive Director C RAMAKRISHNAN Group Chief Financial Officer
H K SETHNA [FCS: 3507]Company Secretary
Mumbai, May 23, 2017 Mumbai, May 23, 2017

Statutory ReportsCorporate Overview Financial Statements
F-78
(Consolidated)
72nd Annual Report 2016-17
B
Oth
er E
quit
y (R
in c
rore
s)Pa
rtic
ular
sSe
curi
ties
Prem
ium
A
ccou
nt
Capi
tal
rede
mpt
ion
rese
rve
Deb
entu
re
rede
mpt
ion
rese
rve
Rese
rve
for
rese
arch
and
hu
man
re
sour
ce
deve
lopm
ent
Spec
ial
rese
rve
Earn
ed
surp
lus
rese
rve
Capi
tal
Rese
rve
Reta
ined
ea
rnin
gsO
ther
com
pone
nts
of e
quit
yA
ttri
buta
ble
to O
wne
rs o
f Ta
ta M
otor
s Li
mite
d
Non
-co
ntro
lling
in
tere
sts
Tota
l oth
er
equi
tyEq
uity
in
stru
men
ts
thr o
ugh
Oth
er
Com
preh
en-
sive
Inco
me
Hed
ging
Re
serv
eCo
st o
f he
dgin
g re
serv
e
Curr
ency
tr
ansl
atio
n re
serv
e
Bala
nce
as a
t Apr
il 1,
201
6 1
8,88
7.42
2
.28
1,0
42.1
5 1
65.7
8 2
92.4
6 2
4.00
1
,164
.20
58,
292.
89
(102
.70)
(6,1
52.1
5) 4
.70
4,6
52.2
0 7
8,27
3.23
4
32.8
4 7
8,70
6.07
Profi
t for
the
year
- -
- -
- -
- 7
,454
.36
- -
- -
7,4
54.3
6 1
02.2
0 7
,556
.56
Oth
er c
ompr
ehen
sive
inco
me
/(lo
ss)
for t
he y
ear
- -
- -
- -
- (6
,569
.14)
83.
44
(1
0,94
3.35
) (7
8.92
) (9
,952
.33)
(27,
460.
30)
(34.
27)
(2
7,49
4.57
)To
tal c
ompr
ehen
sive
inco
me/
(loss
) fo
r the
yea
r -
- -
- -
- -
885
.22
83.
44
(1
0,94
3.35
) (7
8.92
) (9
,952
.33)
(20,
005.
94)
67.
93
(19,
938.
01)
Am
ount
s re
cogn
ized
in in
vent
ory
- -
- -
- -
- -
- (8
16.1
3) -
- (8
16.1
3) -
(816
.13)
Div
iden
d pa
id (i
nclu
ding
div
iden
d ta
x) -
- -
- -
- -
(73.
00)
- -
- -
(73.
00)
(48.
22)
(121
.22)
Proc
eeds
from
issu
e of
sha
res
held
in
abe
yanc
e 4
.51
- -
- -
- -
- -
- -
- 4
.51
- 4
.51
Shar
es is
sued
to n
on-c
ontr
ollin
g in
tere
st -
- -
- -
- -
- -
- -
- -
0.6
2 0
.62
Tran
sfer
to d
eben
ture
rede
mpt
ion
rese
rve
- -
43.
79
- -
- -
(43.
79)
- -
- -
- -
-
Tran
sfer
(fro
m)/
to re
tain
ed e
arni
ngs
- -
- -
- 8
.18
- (8
.18)
- -
- -
- -
-
Bala
nce
as a
t Mar
ch 3
1, 2
017
18,
891.
93
2.2
8 1
,085
.94
165
.78
292
.46
32.
18
1,1
64.2
059
,053
.14
(19.
26)
(17,
911.
63)
(74.
22)
(5,3
00.1
3) 5
7,38
2.67
4
53.1
7 5
7,83
5.84
See
acco
mpa
nyin
g no
tes t
o th
e co
nsol
idat
ed fi
nanc
ial s
tate
men
ts
A.
Equi
ty S
hare
Cap
ital
(R in
cro
res)
Part
icul
ars
Equi
ty S
hare
Cap
ital
Bala
nce
as a
t Apr
il 1,
201
6 6
79.1
8 Pr
ocee
ds f
rom
iss
ue o
f sh
ares
hel
d in
abe
yanc
e an
d am
ount
s re
ceiv
ed o
n un
paid
cal
ls 0
.04
Bala
nce
as a
t Mar
ch 3
1, 2
017
679
.22
In te
rms o
f our
repo
rt a
ttac
hed
For a
nd o
n be
half
of th
e Bo
ard
F or D
ELO
ITTE
HA
SKIN
S &
SEL
LS L
LP
Ch
arte
red
Acco
unta
nts
B P
SHRO
FFPa
rtne
r
Mum
bai, M
ay 2
3, 2
017
R A
MA
SHEL
KAR
[DIN
: 000
7411
9]
N M
UN
JEE
[DIN
:000
1018
0]
V K
JAIR
ATH
[DIN
: 003
9168
4]
O P
BH
ATT
[DIN
:005
4809
1]
R SP
ETH
[DIN
: 033
1890
8]D
irect
ors
N C
HA
ND
RASE
KARA
N [
DIN
: 001
2186
3]Ch
airm
an G
UEN
TER
BUTS
CHEK
[DIN
: 074
2737
5]
CEO
& M
anag
ing
Dire
ctor
R
PIS
HA
ROD
Y [D
IN: 0
1875
848]
E
xecu
tive D
irect
or
S B
BO
RWA
NKA
R [D
IN: 0
1793
948]
E
xecu
tive D
irect
or
C R
AM
AKR
ISH
NA
N
Gro
up C
hief
Fina
ncia
l Offi
cer
H K
SET
HN
A [F
CS: 3
507]
Com
pany
Sec
reta
ry
Mum
bai, M
ay 2
3, 2
017
STAT
EMEN
T O
F CH
AN
GES
IN E
QU
ITY
For t
he y
ear e
nded
Mar
ch 3
1, 2
017

F-79
B.
O
ther
Equ
ity
(R in
cro
res)
Part
icul
ars
Secu
ritie
s Pr
emiu
m
Acc
ount
Capi
tal
rede
mpt
ion
rese
rve
Deb
entu
re
rede
mpt
ion
rese
rve
Rese
rve
for
rese
arch
an
d hu
man
re
sour
ce
deve
lopm
ent
Spec
ial
rese
rve
Earn
ed
surp
lus
rese
rve
Capi
tal
Rese
rve
Reta
ined
ea
rnin
gsO
ther
com
pone
nts
of e
quit
yA
ttri
buta
ble
to O
wne
rs o
f Ta
ta M
otor
s Li
mite
d
Non
-co
ntro
lling
in
tere
sts
Tota
l ot
her
equi
tyEq
uity
in
stru
men
ts
thro
ugh
Oth
er C
om-
preh
ensi
ve
Inco
me
Hed
ging
Re
serv
eCo
st o
f he
dgin
g re
serv
e
Curr
ency
tr
ansl
atio
n re
serv
e
Bala
nce
as a
t Apr
il 1,
201
5 1
1,48
9.60
2
.28
1,0
42.1
5 1
65.7
8 2
69.5
8 1
4.51
1
,164
.20
42,
904.
21
(91.
12)
(5,2
78.2
8) -
2,9
45.8
9 5
4,62
8.80
4
29.7
5 5
5,05
8.55
Profi
t for
the
year
- -
- -
- -
- 1
1,57
9.31
-
- -
11,
579.
31
98.
88
11,
678.
19
Oth
er c
ompr
ehen
sive
inco
me
/(lo
ss)
for t
he y
ear
- -
- -
- -
- 3
,761
.36
68.
80
(2,3
95.8
4) 4
.70
1,7
06.3
1 3
,145
.33
12.
13
3,1
57.4
6
Tota
l com
preh
ensiv
e in
com
e/(lo
ss)
for t
he y
ear
- -
- -
- -
- 1
5,34
0.67
6
8.80
(2
,395
.84)
4.7
0 1
,706
.31
14,
724.
64
111
.01
14,
835.
65
Amou
nts r
ecog
nize
d in
inve
ntor
y -
- -
- -
- -
- -
1,5
21.9
7 -
1,5
21.9
7 -
1,5
21.9
7 Pr
ofit o
n sa
le o
f unq
uote
d eq
uity
in
vest
men
ts -
- -
- -
- -
80.
38
(80.
38)
- -
- -
-
Issue
of S
hare
s pur
suan
t to
Righ
ts (n
et
of is
sue
expe
nses
of R
57.2
7cro
res)
7,3
97.8
2 -
- -
- -
- -
- -
- 7
,397
.82
- 7
,397
.82
Div
iden
d pa
id (i
nclu
ding
div
iden
d ta
x) -
- -
- -
- -
- -
- -
- (1
08.1
1) (1
08.1
1)Sh
ares
issu
ed to
non
-con
trol
ling
inte
rest
- -
- -
- -
- -
- -
- -
0.1
9 0
.19
Tran
sfer
(fro
m)/
to re
tain
ed e
arni
ngs
- -
- -
22.
88
9.4
9 (3
2.37
) -
- -
- -
-
Bala
nce
as a
t Mar
ch 3
1, 2
016
18,
887.
42
2.2
8 1
,042
.15
165
.78
292
.46
24.
00
1,1
64.2
0 5
8,29
2.89
(1
02.7
0) (6
,152
.15)
4.7
0 4
,652
.20
78,
273.
23
432
.84
78,
706.
07
See
acco
mpa
nyin
g no
tes t
o th
e co
nsol
idat
ed fi
nanc
ial s
tate
men
ts
A.
Equi
ty S
hare
Cap
ital
(R in
cro
res)
Part
icul
ars
Equi
ty S
hare
Cap
ital
Bala
nce
as a
t Apr
il 1,
201
5 6
43.7
8 Iss
ues o
f sha
res p
ursu
ant t
o Ri
ghts
3
5.40
Ba
lanc
e as
at M
arch
31,
201
6 6
79.1
8
In te
rms o
f our
repo
rt a
ttac
hed
For a
nd o
n be
half
of th
e Bo
ard
For D
ELO
ITTE
HA
SKIN
S &
SEL
LS L
LP
Ch
arte
red
Acco
unta
nts
B P
SHRO
FFPa
rtne
r
Mum
bai, M
ay 2
3, 2
017
R A
MA
SHEL
KAR
[DIN
: 000
7411
9]
N M
UN
JEE
[DIN
:000
1018
0]
V K
JAIR
ATH
[DIN
: 003
9168
4]
O P
BH
ATT
[DIN
:005
4809
1]
R SP
ETH
[DIN
: 033
1890
8]D
irect
ors
N C
HA
ND
RASE
KARA
N [
DIN
: 001
2186
3]Ch
airm
an G
UEN
TER
BUTS
CHEK
[DIN
: 074
2737
5]
CEO
& M
anag
ing
Dire
ctor
R
PIS
HA
ROD
Y [D
IN: 0
1875
848]
E
xecu
tive D
irect
or
S B
BO
RWA
NKA
R [D
IN: 0
1793
948]
E
xecu
tive D
irect
or
C R
AM
AKR
ISH
NA
N
Gro
up C
hief
Fina
ncia
l Offi
cer
H K
SET
HN
A [F
CS: 3
507]
Com
pany
Sec
reta
ry
Mum
bai, M
ay 2
3, 2
017
STAT
EMEN
T O
F CH
AN
GES
IN E
QU
ITY
For t
he y
ear e
nded
Mar
ch 3
1, 2
016

Statutory ReportsCorporate Overview Financial Statements
F-80
(Consolidated)
72nd Annual Report 2016-17
1. Background and operations Tata Motors Limited and its subsidiaries, collectively referred to as (“the Company” or “Tata Motors”), designs, manufactures and sells a wide range
of automotive vehicles. The Company provides financing for the vehicles sold by dealers of the Company in certain markets. The Company also manufactures engines for industrial and marine applications, aggregates such as axles and transmissions for commercial vehicles and factory automation equipment, and provides information technology services.
Tata Motors Limited is a public limited Company incorporated and domiciled in India and has its registered office in Mumbai, India. As at March 31, 2017, Tata Sons Limited, together with its subsidiaries owns 31.32% of the Ordinary shares and 0.09% of ‘A’ Ordinary shares of the Company, and has the ability to significantly influence the Company’s operation.
The Company’s subsidiaries include the Jaguar Land Rover business (referred to as JLR or Jaguar Land Rover).
The consolidated financial statements were approved by the Board of Directors and authorized for issue on May 23, 2017.
2. Significant accounting policies a. Statement of compliance
In accordance with the notification issued by the Ministry of Corporate Affairs, the Company has adopted Indian Accounting Standards (referred to as “Ind AS”) notified under the Companies (Indian Accounting Standards) Rules, 2015 with effect from April 1, 2016. Previous period figures have been restated to Ind AS. In accordance with Ind AS 101 First-time Adoption of Indian Accounting Standard, the Company has presented a reconciliation from the presentation of financial statements under Accounting Standards notified under the Companies (Accounting Standards) Rules, 2006 (“Previous GAAP”) to Ind AS of Shareholders’ equity as at March 31, 2016 and April 1, 2015 and of the total comprehensive income for the year ended March 31, 2016.
These financial statements have been prepared in accordance with Ind AS as notified under the Companies (Indian Accounting Standards) Rules, 2015 read with Section 133 of the Companies Act, 2013 (“the Act”).
b. Basis of preparation The consolidated financial statements have been prepared on historical cost basis except for certain financial instruments measured at fair value at the
end of each reporting period as explained in the accounting policies below.
c. Basis of consolidation
Subsidiaries
The consolidated financial statements include Tata Motors Limited and its subsidiaries. Subsidiaries are entities controlled by the Company. Control exists when the Company (a) has power over the investee, (b) it is exposed, or has rights, to variable returns from its involvement with the investee and (c) has the ability to affect those returns through its power over the investee. The Company reassesses whether or not it controls an investee if facts and circumstances indicate that there are changes to one or more of the three elements listed above. In assessing control, potential voting rights that currently are exercisable are taken into account. The results of subsidiaries acquired or disposed off during the year are included in the consolidated financial statements from the effective date of acquisition and up to the effective date of disposal, as appropriate.
Inter-company transactions and balances including unrealized profits are eliminated in full on consolidation.
Non-controlling interests in the net assets (excluding goodwill) of consolidated subsidiaries are identified separately from the Company’s equity. The interest of non-controlling shareholders may be initially measured either at fair value or at the non-controlling interests’ proportionate share of the fair value of the acquiree’s identifiable net assets. The choice of measurement basis is made on an acquisition-by-acquisition basis. Subsequent to acquisition, the carrying amount of non-controlling interests is the amount of those interests at initial recognition plus the non-controlling interests’ share of subsequent changes in equity. Total comprehensive income is attributed to non-controlling interests even if it results in the non-controlling interest having a deficit balance.
Changes in the Company’s interests in subsidiaries that do not result in a loss of control are accounted for as equity transactions. The carrying amount of the Company’s interests and the non-controlling interests are adjusted to reflect the changes in their relative interests in the subsidiaries. Any difference between the amount by which the non-controlling interests are adjusted and the fair value of the consideration paid or received is recognized directly in equity and attributed to owners of the Company.
When the Company loses control of a subsidiary, the profit or loss on disposal is calculated as the difference between (i) the aggregate of the fair value of consideration received and the fair value of any retained interest and (ii) the previous carrying amount of the assets (including goodwill), and liabilities of the subsidiary and any non-controlling interests. Amounts previously recognized in other comprehensive income in relation to the subsidiary are accounted for (i.e., reclassified to profit or loss) in the same manner as would be required if the relevant assets or liabilities were disposed off. The fair value of any investment retained in the former subsidiary at the date when control is lost is regarded as the fair value on initial recognition for subsequent accounting under Ind AS 109 Financial Instruments: Recognition and Measurement or, when applicable, the cost on initial recognition of an investment in an associate or jointly controlled entity.
NOTES FORMING PART OF CONSOLIDATED FINANCIAL STATEMENTS

F-81
Interests in joint arrangements
A joint arrangement is an arrangement of which two or more parties have joint control. Joint control is the contractually agreed sharing of control of an arrangement, which exists only when decisions about the relevant activities require the unanimous consent of the parties sharing control.
Joint operations
Certain of the Company’s activities, are conducted through joint operations, which are joint arrangements whereby the parties that have joint control of the arrangement have rights to the assets, and obligations for the liabilities, relating to the arrangement. The Company recognizes, in the consolidated financial statements, its share of the assets, liabilities, income and expenses of these joint operations incurred jointly with the other partners, along with its share of income from the sale of the output and any assets, liabilities and expenses that it has incurred in relation to the joint operation.
Joint ventures
A joint venture is a joint arrangement whereby the parties that have joint control of the arrangement have rights to the net assets of the arrangement. The results, assets and liabilities of a joint venture are incorporated in these financial statements using the equity method of accounting as described below.
Associates
Associates are those entities in which the Company has significant influence. Significant influence is the power to participate in the financial and operating policy decisions of the investee but not control or joint control those policies. Significant influence is presumed to exist when the Company holds between 20 and 50 percent of the voting power of another entity. The results, assets and liabilities of associates are incorporated in these financial statements using the equity method of accounting as described below.
Equity method of accounting (equity accounted investees)
An interest in an associate or joint venture is accounted for using the equity method from the date in which the investee becomes an associate or a joint venture and are recognized initially at cost. The Company’s investment includes goodwill identified on acquisition, net of any accumulated impairment losses. The consolidated financial statements include the Company’s share of profits or losses and equity movements of equity accounted investees, from the date that significant influence or joint control commences until the date that significant influence or joint control ceases. When the Company’s share of losses exceeds its interest in an equity accounted investee, the carrying amount of that interest (including any long-term investments in the nature of net investments) is reduced to nil and the recognition of further losses is discontinued except to the extent that the Company has an obligation or has made payments on behalf of the investee.
When the Company transacts with an associate or joint venture of the Company, unrealized profits and losses are eliminated to the extent of the Company’s interest in its associate or joint venture.
d. Business combination Acquisitions of subsidiaries and businesses are accounted for using the acquisition method. Acquisition related costs are recognized in profit or loss
as incurred. The acquiree’s identifiable assets, liabilities and contingent liabilities that meet the conditions for recognition are recognized at their fair value at the acquisition date, except certain assets and liabilities required to be measured as per the applicable standard.
Purchase consideration in excess of the Company’s interest in the acquiree’s net fair value of identifiable assets, liabilities and contingent liabilities is recognized as goodwill. Excess of the Company’s interest in the net fair value of the acquiree’s identifiable assets, liabilities and contingent liabilities over the purchase consideration is recognized, after reassessment of fair value of net assets acquired, in the Capital Reserve.
e. Use of estimates and judgments The preparation of financial statements in conformity with Ind AS requires management to make judgments, estimates and assumptions, that affect
the application of accounting policies and the reported amounts of assets, liabilities, income, expenses and disclosures of contingent assets and liabilities at the date of these financial statements and the reported amounts of revenues and expenses for the years presented. Actual results may differ from these estimates.
Estimates and underlying assumptions are reviewed at each balance sheet date. Revisions to accounting estimates are recognised in the period in which the estimate is revised and future periods affected.
In particular, information about significant areas of estimation uncertainty and critical judgments in applying accounting policies that have the most significant effect on the amounts recognized in the financial statements are included in the following notes:
i) Note 5 - Impairment of goodwill
ii) Note 6 - Impairment of indefinite life intangible assets
iii) Note 20 - Recoverability/recognition of deferred tax assets
iv) Note 28 - Provision for product warranty
v) Note 36 - Assets and obligations relating to employee benefits
NOTES FORMING PART OF CONSOLIDATED FINANCIAL STATEMENTS

Statutory ReportsCorporate Overview Financial Statements
F-82
(Consolidated)
72nd Annual Report 2016-17
f. Revenue recognition Revenue is measured at fair value of consideration received or receivable.
i) Sale of products
The Company recognizes revenues on the sale of products, net of discounts, sales incentives, customer bonuses and rebates granted, when products are delivered to dealers or when delivered to a carrier for export sales, which is when title and risks and rewards of ownership pass to the customer. Sale of products includes export and other recurring and non-recurring incentives from governments (referred to as “incentives”).
Revenues are recognized when collectability of the resulting receivable is reasonably assured.
If the sale of products includes a determinable amount for subsequent services (multiple component contracts) the related revenues are deferred and recognized as income over the relevant service period. Amounts are normally recognized as income by reference to the pattern of related expenditure.
Incentives are recognized when there is reasonable assurance that the Company will comply with the conditions and the incentive will be received. Incentives are recorded at fair value where applicable. Sale of products include incentives of R930.22 crores and R2,149.58 crores for the years ended March 31, 2017 and 2016, respectively. These include during the years ended March 31, 2017 and 2016, R561.04 crores and R996.08 crores, respectively, received by a foreign subsidiary as an indirect tax incentive that requires the subsidiary to meet certain criteria relating to vehicle efficiency and investment in engineering and research and development. The incentive is provided as a partial off set to the higher sales tax payable following implementation of new legislation.
ii) Other operating revenues
Other operating revenues include incentive of R110.01 crores and R82.84 crores for the years ended March 31, 2017 and 2016 respectively, towards Exports Promotion Capital Goods (EPCG) scheme. Further, it also includes during the years ended March 31, 2017 and 2016, R504.72 crores and R501.20 crores, respectively for Research and Development Expenditure Credit (RDEC) on qualifying expenditure by an indirect subsidiary in the UK.
iii) Finance revenues
Finance and service charges are accrued on the unpaid principal balance of finance receivables using the effective interest method.
g. Cost recognition Costs and expenses are recognized when incurred and are classified according to their nature.
Expenditure capitalized represents employee costs, stores and other manufacturing supplies, and other expenses incurred for construction including product development undertaken by the Company.
h. Provisions
A provision is recognized if, as a result of a past event, the Company has a present legal or constructive obligation that can be estimated reliably, and it is probable that an outflow of economic benefits will be required to settle the obligation. Provisions are determined by discounting the expected future cash flows at a pre-tax rate that reflects current market assessments of the time value of money and the risks specific to the liability.
i)Product warranty expenses
The estimated liability for product warranties is recorded when products are sold. These estimates are established using historical information on the nature, frequency and average cost of warranty claims and management estimates regarding possible future incidences based on actions on product failures. The timing of outflows will vary as and when warranty claim will arise, being typically up to five years.
ii) Residual risk
In certain markets, the Company is responsible for the residual risk arising on vehicles sold by dealers under leasing arrangements. The provision is based on the latest available market expectations of future residual value trends. The timing of the outflows will be at the end of the lease arrangements – being typically up to three years.
iii) Legal and product liability
Legal and product liability provision is recorded in respect of compliance with regulations and known litigations which impact the Company. The product liability claim primarily relates to motor accident claims, consumer complaints, dealer terminations, personal injury claims and compliance with regulations.
iv) Environmental liability
Environmental liability relates to various environmental remediation cost such as asbestos removal and land clean up. The timing of when these costs will be incurred is not known with certainty.
NOTES FORMING PART OF CONSOLIDATED FINANCIAL STATEMENTS

F-83
i. Foreign currency These consolidated financial statements are presented in Indian rupees, which is the functional currency of Tata Motors Limited.
Transactions in foreign currencies are recorded at the exchange rate prevailing on the date of transaction. Foreign currency denominated monetary assets and liabilities are re-measured into the functional currency at the exchange rate prevailing on the balance sheet date. Exchange differences are recognized in the Statement of Profit and Loss except to the extent, exchange differences which are regarded as an adjustment to interest costs on foreign currency borrowings, are capitalized as part of borrowing costs.
For the purpose of consolidation, the assets and liabilities of the Company’s foreign operations are translated to Indian rupees at the exchange rate prevailing on the balance sheet date, and the income and expenses at the average rate of exchange for the respective months. Exchange differences arising are recognized as currency translation reserve under equity.
j. Income taxes Income tax expense comprises current and deferred taxes. Income tax expense is recognized in the Statement of Profit and Loss except when they
relate to items that are recognized outside profit or loss (whether in other comprehensive income or directly in equity), in which case tax is also recognized outside profit or loss, or where they arise from the initial accounting for business combination. In the case of a business combination the tax effect is included in the accounting for the business combination.
Current income taxes are determined based on respective taxable income of each taxable entity and tax rules applicable for respective tax jurisdictions.
Deferred tax assets and liabilities are recognized for the future tax consequences of temporary differences between the carrying values of assets and liabilities and their respective tax bases, and unutilized business loss and depreciation carry-forwards and tax credits. Such deferred tax assets and liabilities are computed separately for each taxable entity and for each taxable jurisdiction. Deferred tax assets are recognized to the extent that it is probable that future taxable income will be available against which the deductible temporary differences, unused tax losses, depreciation carry-forwards and unused tax credits could be utilized.
Deferred tax assets and liabilities are measured based on the tax rates that are expected to apply in the period when the asset is realized or the liability is settled, based on tax rates and tax laws that have been enacted or substantively enacted by the balance sheet date.
Deferred tax assets and liabilities are offset when there is a legally enforceable right to set off current tax assets against current tax liabilities and when they relate to income taxes levied by the same taxation authority and the Company intends to settle its current tax assets and liabilities on a net basis.
k. Earnings per share Basic earnings per share has been computed by dividing profit for the year by the weighted average number of shares outstanding during the year.
Partly paid up shares are included as fully paid equivalents according to the fraction paid up. Diluted earnings per share has been computed using the weighted average number of shares and dilutive potential shares, except where the result would be anti-dilutive.
l. Inventories
Inventories (other than those recognized consequent to the sale of vehicles subject to repurchase arrangements) are valued at the lower of cost and net realizable value. Cost of raw materials, components and consumables are ascertained on a first in first out basis. Cost, including fixed and variable production overheads, are allocated to work-in-progress and finished goods determined on a full absorption cost basis. Net realizable value is the estimated selling price in the ordinary course of business less estimated cost of completion and selling expenses.
Inventories include vehicles sold subject to repurchase arrangements. These vehicles are carried at cost to the Company and are amortized in changes in inventories of finished goods to their residual values (i.e., estimated second hand sale value) over the term of the arrangement.
m. Property, plant and equipment
Property, plant and equipment are stated at cost of acquisition or construction less accumulated depreciation less accumulated impairment, if any.
Freehold land is measured at cost and is not depreciated.
Heritage assets, comprising antique vehicles purchased by the Company, are not depreciated as they are considered to have a residual value in excess of cost. Residual values are re-assessed on an annual basis.
Cost includes purchase price, taxes and duties, labor cost and direct overheads for self-constructed assets and other direct costs incurred up to the date the asset is ready for its intended use.
Interest cost incurred for constructed assets is capitalized up to the date the asset is ready for its intended use, based on borrowings incurred specifically for financing the asset or the weighted average rate of all other borrowings, if no specific borrowings have been incurred for the asset.
Depreciation is provided on the Straight Line Method (SLM) over the estimated useful lives of the assets considering the nature, estimated usage, operating conditions, past history of replacement, anticipated technological changes, manufacturers warranties and maintenance support. Taking into account these factors, the Company and its domestic group companies have decided to apply the useful life for various categories of property, plant and equipment, which are different from those prescribed in Schedule II of the Act.
NOTES FORMING PART OF CONSOLIDATED FINANCIAL STATEMENTS

Statutory ReportsCorporate Overview Financial Statements
F-84
(Consolidated)
72nd Annual Report 2016-17
Estimated useful lives of the assets are as follows:
Type of Asset Estimated useful life
Buildings, Roads, Bridge and culverts 4 to 60 years
Plant, machinery and equipment 3 to 30 years
Computers and other IT assets 3 to 6 years
Vehicles 3 to 11 years
Furniture, fixtures and office appliances 3 to 21 years
The useful lives is reviewed at least at each year-end. Changes in expected useful lives are treated as change in accounting estimates.
Assets held under finance leases are depreciated over their expected useful lives on the same basis as owned assets or, where shorter, the term of the relevant lease.
Depreciation is not recorded on capital work-in-progress until construction and installation are complete and the asset is ready for its intended use.
n. Other intangible assets Intangible assets purchased, including those acquired in business combinations, are measured at cost or fair value as of the date of acquisition
where applicable less accumulated amortization and accumulated impairment, if any. Intangible assets with indefinite lives are reviewed annually to determine whether indefinite-life assessment continues to be supportable. If not, the change in the useful-life assessment from indefinite to finite is made on a prospective basis.
Estimated useful lives of assets are as follows:
Type of Asset Estimated useful life
Patents and technical know-how 2 to 12 years
Computer software 1 to 8 years
Dealer network 20 years
Intellectual property rights 3 to 10 years
The amortization period for intangible assets with finite useful lives is reviewed at least at each year-end. Changes in expected useful lives are treated as changes in accounting estimates.
Customer related intangible assets consists of the Company’s dealer network.
Internally generated intangible asset
Research costs are charged to the Statement of Profit and Loss in the year in which they are incurred.
Product development costs incurred on new vehicle platform, engines, transmission and new products are recognized as intangible assets, when feasibility has been established, the Company has committed technical, financial and other resources to complete the development and it is probable that asset will generate probable future economic benefits.
The costs capitalized include the cost of materials, direct labour and directly attributable overhead expenditure incurred up to the date the asset is available for use.
Interest cost incurred is capitalized up to the date the asset is ready for its intended use, based on borrowings incurred specifically for financing the asset or the weighted average rate of all other borrowings if no specific borrowings have been incurred for the asset.
Product development cost is amortized over a period of 24 months to 120 months or on the basis of actual production or planned production volume over such period.
Capitalized development expenditure is measured at cost less accumulated amortization and accumulated impairment, if any.
NOTES FORMING PART OF CONSOLIDATED FINANCIAL STATEMENTS

F-85
o. Leases
At the inception of a lease, the lease arrangement is classified as either a finance lease or an operating lease, based on the substance of the lease arrangement.
Assets taken on finance lease
A finance lease is recognized as an asset and a liability at the commencement of the lease, at the lower of the fair value of the asset and the present value of the minimum lease payments. Initial direct costs, if any, are also capitalized and, subsequent to initial recognition, the asset is accounted for in accordance with the accounting policy applicable to that asset. Minimum lease payments made under finance leases are apportioned between the finance expense and the reduction of the outstanding liability. The finance expense is allocated to each period during the lease term so as to produce a constant periodic rate of interest on the remaining balance of the liability.
Assets taken on operating lease
Leases other than finance leases are operating leases, and the leased assets are not recognized on the Company’s balance sheet. Payments made under operating leases are recognized in the Statement of Profit and Loss on a straight-line basis over the term of the lease.
p. Impairment
i) Goodwill
Cash generating units to which goodwill is allocated are tested for impairment annually at each balance sheet date, or more frequently when there is an indication that the unit may be impaired. If the recoverable amount of the cash generating unit is less than the carrying amount of the unit, the impairment loss is allocated first to reduce the carrying amount of any goodwill allocated to that unit and then to the other assets of the unit pro rata on the basis of carrying amount of each asset in the unit. Goodwill impairment loss recognized is not reversed in subsequent period.
ii) Property, plant and equipment and other intangible assets
At each balance sheet date, the Company assesses whether there is any indication that any property, plant and equipment and intangible assets with finite lives may be impaired. If any such impairment exists the recoverable amount of an asset is estimated to determine the extent of impairment, if any. Where it is not possible to estimate the recoverable amount of an individual asset, the Company estimates the recoverable amount of the cash-generating unit to which the asset belongs.
Intangible assets with indefinite useful lives and intangible assets not yet available for use, are tested for impairment annually at each balance sheet date, or earlier, if there is an indication that the asset may be impaired.
Recoverable amount is the higher of fair value less costs to sell and value in use. In assessing value in use, the estimated future cash flows are discounted to their present value using a pre-tax discount rate that reflects current market assessments of the time value of money and the risks specific to the asset for which the estimates of future cash flows have not been adjusted.
If the recoverable amount of an asset (or cash-generating unit) is estimated to be less than its carrying amount, the carrying amount of the asset (or cash-generating unit) is reduced to its recoverable amount. An impairment loss is recognized immediately in the Statement of Profit and Loss.
As at March 31, 2017, none of the Company’s property, plant and equipment and intangible assets were considered impaired.
q. Employee benefits
i) Pension plans
The Jaguar Land Rover subsidiaries operate several defined benefit pension plans, which are contracted out of the second state pension scheme until April 5, 2016. The assets of the plan are held in separate trustee administered funds. The plans provide for monthly pension after retirement as per salary drawn and service period as set out in rules of each fund.
Contributions to the plans by the subsidiary group take into consideration the results of actuarial valuations. The plans with a surplus position at the year-end have been limited to the maximum economic benefit available from unconditional rights to refund from the scheme or reduction in future contributions. Where the subsidiary group is considered to have a contractual obligation to fund the pension plan above the accounting value of the liabilities, an onerous obligation is recognized.
A separate defined contribution plan is available to employees of Jaguar Land Rover. Costs in respect of this plan are charged to the Statement of Profit and Loss as incurred.
ii) Gratuity
Tata Motors Limited and its subsidiaries in India have an obligation towards gratuity, a defined benefit retirement plan covering eligible employees. The plan provides for a lump-sum payment to vested employees at retirement, death while in employment or on termination of employment of an amount equivalent to 15 to 30 days salary payable for each completed year of service. Vesting occurs upon completion of five years of service. Tata Motors Limited and such subsidiaries make annual contributions to gratuity funds established as trusts or insurance companies. Tata Motors Limited and its subsidiaries in India account for the liability for gratuity benefits payable in the future based on an actuarial valuation.
NOTES FORMING PART OF CONSOLIDATED FINANCIAL STATEMENTS

Statutory ReportsCorporate Overview Financial Statements
F-86
(Consolidated)
72nd Annual Report 2016-17
iii) Superannuation
Tata Motors Limited and some of its subsidiaries in India have two superannuation plans, a defined benefit plan and a defined contribution plan. An eligible employee on April 1, 1996 could elect to be a member of either plan.
Employees who are members of the defined benefit superannuation plan are entitled to benefits depending on the years of service and salary drawn. The monthly pension benefits after retirement range from 0.75% to 2% of the annual basic salary for each year of service. Tata Motors Limited and such subsidiaries account for superannuation benefits payable in future under the plan based on an actuarial valuation.
With effect from April 1, 2003, this plan was amended and benefits earned by covered employees have been protected as at March 31, 2003. Employees covered by this plan are prospectively entitled to benefits computed on a basis that ensures that the annual cost of providing the pension benefits would not exceed 15% of salary.
During the year ended March 31, 2015, the employees covered by this plan were given a one-time option to exit from the plan prospectively. Furthermore, the employees who opted for exit were given one- time option to withdraw accumulated balances from the superannuation plan.
Separate irrevocable trusts are maintained for employees covered and entitled to benefits. Tata Motors Limited and its subsidiaries contribute up to 15% or R150,000, whichever is lower, of the eligible employees’ salary to the trust every year. Such contributions are recognized as an expense when incurred. Tata Motors Limited and such subsidiaries have no further obligation beyond this contribution.
iv) Bhavishya Kalyan Yojana (BKY)
Bhavishya Kalyan Yojana is an unfunded defined benefit plan for employees of Tata Motors Limited and some of its subsidiaries. The benefits of the plan include pension in certain cases, payable up to the date of normal superannuation had the employee been in service, to an eligible employee at the time of death or permanent disablement, while in service, either as a result of an injury or as certified by the appropriate authority. The monthly payment to dependents of the deceased/disabled employee under the plan equals 50% of the salary drawn at the time of death or accident or a specified amount, whichever is greater. Tata Motors Limited and these subsidiaries account for the liability for BKY benefits payable in the future based on an actuarial valuation.
v) Provident fund and family pension
In accordance with Indian law, eligible employees of Tata Motors Limited and some of its subsidiaries are entitled to receive benefits in respect of provident fund, a defined contribution plan, in which both employees and the Company make monthly contributions at a specified percentage of the covered employees’ salary (currently 12% of employees’ salary). The contributions, as specified under the law, are made to the provident fund and pension fund set up as an irrevocable trust by Tata Motors Limited and its subsidiaries or to respective Regional Provident Fund Commissioner and the Central Provident Fund under the State Pension scheme.
vi) Severance indemnity
Tata Daewoo Commercial Vehicle Company Limited, or TDCV, a subsidiary company incorporated in Korea; has an obligation towards severance indemnity, a defined benefit retirement plan, covering eligible employees. The plan provides for a lump sum payment to all employees with more than one year of employment equivalent to 30 days’ salary payable for each completed year of service.
vii) Post-retirement medicare scheme
Under this unfunded scheme, employees of Tata Motors Limited and some of its subsidiaries receive medical benefits subject to certain limits on amounts of benefits, periods after retirement and types of benefits, depending on their grade and location at the time of retirement. Employees separated from the Company as part of an Early Separation Scheme, on medical grounds or due to permanent disablement are also covered under the scheme. Tata Motors Limited and such subsidiaries account for the liability for post-retirement medical scheme based on an actuarial valuation.
viii) Remeasurement gains and losses
Remeasurement comprising actuarial gains and losses, the effect of the asset ceiling and the return on assets (excluding interest) relating to retirement benefit plans, are recognized directly in other comprehensive income in the period in which they arise. Remeasurement recorded in other comprehensive income is not reclassified to statement of profit and loss.
Actuarial gains and losses relating to long-term employee benefits are recognized in the statement of profit and loss in the period in which they arise.
ix) Measurement date
The measurement date of retirement plans is March 31.
r. Dividends
Any dividend declared or paid by Tata Motors Limited for any financial year is based on the profits available for distribution as reported in the statutory financial statements of Tata Motors Limited (standalone) prepared in accordance with Generally Accepted Accounting Principles in India or Indian GAAP or Ind AS. Indian law permits the declaration and payment of dividend out of profits for the year or previous financial year(s) as stated in the statutory financial statements of Tata Motors Limited (Standalone) prepared in accordance with Generally Accepted Accounting Principles in India, or Indian GAAP or Ind AS after providing for depreciation in accordance with the provisions of Schedule II to the Companies Act. However, in the absence or inadequacy of the said profits, it may declare dividend out of free reserves, subject to certain conditions as prescribed under the
NOTES FORMING PART OF CONSOLIDATED FINANCIAL STATEMENTS

F-87
Companies (Declaration and payment of Dividend) Rules, 2014. Accordingly, in certain years the net income reported in these financial statements may not be fully distributable. The amount available for distribution is RNil as at March 31, 2017 (R198.19 crores as at March 31, 2016).
s. Segments
The Company primarily operates in the automotive segment. The automotive segment comprises two reportable segments i.e. Tata and other brand vehicles, including financing thereof and Jaguar Land Rover. Other operating segments do not meet the quantitative thresholds for disclosure and have been aggregated.
t. Financial instruments
i) Classification, initial recognition and measurement
A financial instrument is any contract that gives rise to a financial asset of one entity and a financial liability or equity instrument of another entity. Financial assets other than equity instruments are classified into categories: financial assets at fair value through profit or loss and at amortised cost. Financial assets that are equity instruments are classified as fair value through profit or loss or fair value through other comprehensive income. Financial liabilities are classified into financial liabilities at fair value through profit or loss and other financial liabilities.
Financial instruments are recognized on the balance sheet when the Company becomes a party to the contractual provisions of the instrument.
Initially, a financial instrument is recognized at its fair value. Transaction costs directly attributable to the acquisition or issue of financial instruments are recognized in determining the carrying amount, if it is not classified as at fair value through profit or loss. Subsequently, financial instruments are measured according to the category in which they are classified.
Financial assets at amortised cost: Financial assets having contractual terms that give rise on specified dates to cash flows that are solely payments of principal and interest on the principal outstanding and that are held within a business model whose objective is to hold such assets in order to collect such contractual cash flows are classified in this category. Subsequently, these are measured at amortized cost using the effective interest method less any impairment losses.
Equity investments at fair value through other comprehensive income: These include financial assets that are equity instruments and are designated as such upon initial recognition irrevocably. Subsequently, these are measured at fair value and changes therein, are recognized directly in other comprehensive income, net of applicable income taxes.
Dividends from these equity investments are recognized in the statement of profit and loss when the right to receive payment has been established.
When the equity investment is derecognized, the cumulative gain or loss in equity is transferred to retained earnings.
Financial assets at fair value through profit or loss: Financial assets are measured at fair value through profit or loss unless it is measured at amortised cost or at fair value through other comprehensive income on initial recognition. The transaction costs directly attributable to the acquisition of financial assets and liabilities at fair value through profit or loss are immediately recognised in profit or loss.
Equity instruments: An equity instrument is any contract that evidences residual interests in the assets of the Company after deducting all of its liabilities. Equity instruments issued by the Company are recorded at the proceeds received, net of direct issue costs.
Financial liabilities at fair value through profit or loss
Derivatives, including embedded derivatives separated from the host contract, unless they are designated as hedging instruments, for which hedge accounting is applied, are classified into this category. These are measured at fair value with changes in fair value recognized in the statement of profit and loss.
Other financial liabilities: These are measured at amortized cost using the effective interest method.
ii) Determination of fair value:
The fair value of a financial instrument on initial recognition is normally the transaction price (fair value of the consideration given or received). Subsequent to initial recognition, the Company determines the fair value of financial instruments that are quoted in active markets using the quoted bid prices (financial assets held) or quoted ask prices (financial liabilities held) and using valuation techniques for other instruments. Valuation techniques include discounted cash flow method and other valuation models.
iii) Derecognition of financial assets and financial liabilities:
The Company derecognizes a financial asset only when the contractual rights to the cash flows from the asset expires or it transfers the financial asset and substantially all the risks and rewards of ownership of the asset to another entity. If the Company neither transfers nor retains substantially all the risks and rewards of ownership and continues to control the transferred asset, the Company recognizes its retained interest in the asset and an associated liability for amounts it may have to pay. If the Company retains substantially all the risks and rewards of ownership of a transferred financial asset, the Company continues to recognize the financial asset and also recognizes a collateralized borrowing for the proceeds received.
Financial liabilities are derecognized when these are extinguished, that is when the obligation is discharged, cancelled or has expired.
NOTES FORMING PART OF CONSOLIDATED FINANCIAL STATEMENTS

Statutory ReportsCorporate Overview Financial Statements
F-88
(Consolidated)
72nd Annual Report 2016-17
iv) Impairment of financial assets:
The Company recognizes a loss allowance for expected credit losses on a financial asset that is at amortized cost.
Loss allowance in respect of financial assets other than finance receivables is measured at an amount equal to life time expected credit losses and is calculated as the difference between their carrying amount and the present value of the expected future cash flows discounted at the original effective interest rate.
Loss allowance for finance receivables is measured at an amount equal to twelve month expected losses if credit risk on such assets has not increased significantly since initial recognition. An allowance equal to life time expected losses is provided if credit risk has increased significantly from the date of initial recognition. Credit risk is determined to have increased significantly when a finance receivable contract becomes sixty/ninety days past due. Such impairment loss is recognized in the Statement of Profit and Loss.
u. Hedge accounting
The Company uses foreign currency forward and option contracts to hedge its risks associated with foreign currency fluctuations relating to highly probable forecast transactions. The Company designates these forward and option contracts in a cash flow hedging relationship by applying the hedge accounting principles.
These forward and option contracts are stated at fair value at each reporting date. Changes in the fair value of these forward and option contracts that are designated and effective as hedges of future cash flows are recognized in other comprehensive income (net of tax) and the ineffective portion is recognized immediately in the consolidated statement of profit and loss. Amounts accumulated in equity are reclassified to the consolidated statement of profit and loss in the periods in which the forecasted transaction occurs.
For options, time value is not considered part of the hedge. These are treated as cost of hedge and the changes in fair value attributable to time value is recognized in the other comprehensive income along with the changes in fair value determined to be effective portion of the hedge.
Hedge accounting is discontinued when the hedging instrument expires or is sold, terminated, or exercised, or no longer qualifies for hedge accounting. For forecast transactions, any cumulative gain or loss on the hedging instrument recognized in equity is retained there until the forecast transaction occurs.
If the forecast transaction is no longer expected to occur, the net cumulative gain or loss recognized in equity is immediately transferred to the consolidated Statement of Profit and Loss for the year.
v. Recent accounting pronouncements
New Accounting pronouncements affecting amounts reported and /or disclosures in the financial statements.
The Company has not applied the following revisions to Ind ASs that have been issued but are not yet effective. The Company is evaluating the impact of these pronouncements on the financial statements:
i) Amendments to Ind AS 107 – Statements of Cash Flows
In March 2017, the Ministry of Corporate Affairs (MCA) issued amendments to Ind AS 107 - Statement of Cash Flows introducing additional disclosures that will enable users of financial statements to evaluate changes in liabilities arising from financing activities. The amendment is effective from April 1, 2017.
ii) Amendments to Ind AS 102 – Share-based Payments
In March 2017, the MCA issued amendments to Ind AS 102 – Share-based Payments that clarify how to account certain share-based payment transactions.
The amendments for:
Accounting requirements with respect to the effects of vesting and non-vesting conditions on the measurement of cash-settled share-based payments;
Accounting requirements with respect to share-based payment transactions with a net settlement feature for withholding tax obligations; and
Modification to the terms and conditions of a share-based payment that changes the classification of the transaction from cash-settled to equity-settled.
The amendment is effective from April 1, 2017.
NOTES FORMING PART OF CONSOLIDATED FINANCIAL STATEMENTS

F-89
(w) The following subsidiary companies are considered in the consolidated financial statements: % of holding either directly or through subsidiaries
SrNo. Name of the Subsidiary Company Country of
incorporation As at
March 31, 2017As at
March 31, 2016 As at
April 1, 2015
Direct Subsidiaries1 TML Drivelines Limited India 100 100 100 2 TAL Manufacturing Solutions Limited India 100 100 100 3 Concorde Motors (India) Limited India 100 100 100 4 Tata Motors Insurance Broking & Advisory Services Limited India 100 100 100 5 Tata Motors European Technical Centre PLC UK 100 100 100 6 Tata Technologies Limited India 72.32 72.32 72.32 7 Tata Motors Finance Limited India 100 100 100 8 Tata Marcopolo Motors Limited India 51 51 51 9 TML Holdings Pte. Limited Singapore 100 100 100 10 TML Distribution Company Limited India 100 100 100 11 Tata Hispano Motors Carrocera S.A. Spain 100 100 100 12 Tata Hispano Motors Carrocerries Maghreb SA Morocco 100 100 100 13 Trilix S.r.l Italy 80 80 80 14 Tata Precision Industries Pte. Limited Singapore 78.39 78.39 78.39
Indirect subsidiaries *15 Tata Daewoo Commercial Vehicle Company Limited South Korea 100 100 100 16 Tata Daewoo Commercial Vehicle Sales and Distribution Company Limited South Korea 100 100 100 17 Tata Motors (Thailand) Limited Thailand 95.28 95.28 95.28 18 Tata Motors (SA) (Proprietary) Limited South Africa 60 60 60 19 PT Tata Motors Indonesia Indonesia 100 100 100 20 Tata Technologies (Thailand) Limited Thailand 72.32 72.32 72.32 21 Tata Technologies Pte Limited Singapore 72.32 72.32 72.32 22 INCAT International Plc. UK 72.32 72.32 72.32 23 Tata Technologies Europe Limited UK 72.32 72.32 72.32 24 INCAT GmbH. Germany 72.32 72.32 72.32 25 Tata Technologies Inc. USA 72.37 72.37 72.52 26 Tata Technologies de Mexico, S.A. de C.V. Mexico 72.37 72.37 72.52 27 Cambric Limited USA 72.32 72.32 72.32 28 Cambric UK Limited UK 72.32 72.32 72.3229 Cambric GmbH Germany 72.32 72.32 72.3230 Midwest Managed Services Inc. USA 72.32 72.32 72.32 31 Tata Technologies SRL Romania 72.32 72.32 72.32 32 Cambric Manufacturing Technologies (Shanghai) Company Limited China 72.32 72.32 72.32 33 Jaguar Land Rover Automotive Plc UK 100 100 100 34 Jaguar Land Rover Limited UK 100 100 100 35 Jaguar Land Rover Austria GmbH Austria 100 100 100 36 Jaguar Land Rover Belux NV Belgium 100 100 100 37 Jaguar Land Rover Japan Limited Japan 100 100 100 38 Jaguar Cars South Africa (Pty) Limited South Africa 100 100 100 39 JLR Nominee Company Limited UK 100 100 100 40 The Daimler Motor Company Limited UK 100 100 100 41 The Jaguar Collection Limited UK 100 100 100 42 Daimler Transport Vehicles Limited UK 100 100 100 43 S.S. Cars Limited UK 100 100 100 44 The Lanchester Motor Company Limited UK 100 100 100 45 Jaguar Land Rover Deutschland GmbH Germany 100 100 100 46 Jaguar Land Rover Holdings Limited UK 100 100 100 47 Jaguar Land Rover North America LLC USA 100 100 100 48 Land Rover Ireland Limited Ireland 100 100 100 49 Jaguar Land Rover Nederland BV Netherlands 100 100 100 50 Jaguar Land Rover Portugal - Veiculos e Pecas, Lda. Portugal 100 100 100 51 Jaguar Land Rover Australia Pty Limited Australia 100 100 100 52 Jaguar Land Rover Italia Spa Italy 100 100 100
NOTES FORMING PART OF CONSOLIDATED FINANCIAL STATEMENTS

Statutory ReportsCorporate Overview Financial Statements
F-90
(Consolidated)
72nd Annual Report 2016-17
% of holding either directly orthrough subsidiaries
SrNo. Name of the Subsidiary Company Country of
incorporation As at
March 31, 2017As at
March 31, 2016 As at
April 1, 2015
53 Jaguar Land Rover Espana SL Spain 100 100 100 54 Jaguar Land Rover Korea Company Limited South Korea 100 100 100 55 Jaguar Land Rover (China) Investment Co. Limited (Renamed from Jaguar Land
Rover Automotive Trading (Shanghai) Company Limited w.e.f. November 1, 2016) China 100 100 100
56 Jaguar Land Rover Canada ULC Canada 100 100 100 57 Jaguar Land Rover France, SAS France 100 100 100 58 Jaguar Land Rover (South Africa) (pty) Limited South Africa 100 100 100 59 Jaguar e Land Rover Brasil industria e Comercio de Veiculos LTDA Brazil 100 100 100 60 Limited Liability Company "Jaguar Land Rover" (Russia) Russia 100 100 100 61 Jaguar Land Rover (South Africa) Holdings Limited UK 100 100 100 62 Jaguar Land Rover India Limited India 100 100 100 63 Jaguar Cars Limited UK 100 100 100 64 Land Rover Exports Limited UK 100 100 100 65 Jaguar Land Rover Pension Trustees Limited UK 100 100 100 66 Jaguar Racing Limited UK 100 100 - 67 InMotion Ventures Limited UK 100 100 - 68 InMotion Ventures 1 Limited (incorporated w.e.f. October 25, 2016) UK 100 100 - 69 InMotion Ventures 2 Limited (incorporated w.e.f. October 25, 2016) UK 100 100 - 70 InMotion Ventures 3 Limited (incorporated w.e.f. October 25, 2016) UK 100 100 - 71 Shanghai Jaguar Land Rover Automotive Services Company Limited China 100 100 100 72 Jaguar Land Rover Slovakia s.r.o Slovakia 100 100 - 73 Jaguar Land Rover Singapore Pte. Ltd Singapore 100 100 - 74 Jaguar Land Rover Columbia S.A.S (incorporated w.e.f August 22, 2016) Columbia 100 - - 75 PT Tata Motors Distribusi Indonesia Indonesia 100 100 100 76 Tata Motors Finance Solutions Limited India 100 100 100 77 Sheba Properties Limited India 100 100 100 78 TMNL Motor Services Nigeria Limited Nigeria 100 - - * Effective holding % of the Company directly and through its subsidiaries.
The following jointly controlled companies are considered in the consolidated financial statements:% of equity holding either directly or
through subsidiariesSrNo. Name of the jointly controlled company Country of
incorporation As at
March 31, 2017As at
March 31, 2016 As at
April1, 2015
1 Fiat India Automobiles Private Limited India 50 50 50 2 Tata Cummins Private Limited India 50 50 50 3 Tata HAL Technologies Limited ** India 36.16 36.16 36.16 4 Spark 44 (JV) Limited UK 50 50 50 5 Chery Jaguar Land Rover Automotive Company Limited China 50 50 50 6 JT Special Vehicles Pvt. Limited (incorporated w.e.f July 13, 2016) India 50 - -
** Effective holding % of the Company as it is a Joint Venture of Tata Technologies Ltd
(x) Transition to Ind ASThe Company has prepared the opening balance sheet as per Ind AS as at April 1, 2015 (the transition date) by recognising all assets and liabilities whose recognition is required by Ind AS, not recognising items of assets and liabilities which are not permitted by Ind AS, by reclassifying items from Previous GAAP to Ind AS as required by Ind AS, and applying Ind AS in measurement of recognised assets and liabilities. However, this principle is subject to certain exception and certain optional exemptions availed by the Company as detailed below. (a)Fair valuation as deemed cost for certain items of property, plant and equipment and other intangible assets The Company has elected to measure certain items of its property, plant and equipment and other intangible assets at its fair value and use that fair value as its deemed cost at the date of transition to Ind AS. Other items of property, plant and equipment and intangible assets have been measured as per Ind AS 16 and Ind AS 38, respectively. (b) Business combinationBusiness combination prior to April 1, 2007 have been accounted in accordance with Previous GAAP. Goodwill arising from business combination has been stated at the carrying amount under Previous GAAP. Intangible assets which were subsumed in goodwill under Previous GAAP have not been recognised upto April 1, 2007
NOTES FORMING PART OF CONSOLIDATED FINANCIAL STATEMENTS

F-91
(b) Comprehensive Income reconciliationParticulars Note Year ended
March 31 , 2016Net profit after tax as reported under Previous GAAP 11,023.75
Reversal of exchange gain accumulated in foreign currency monetary item translation difference account (f ) 1,379.23
Effect of adoption of fair value as deemed cost relating to property, plant and equipment and intangibles (net of depreciation and amortisation) (e) 253.63
Gain on fair value of below market interest loan (net of effective interest rate adjustment) (d) 50.50
Effect of cross currency basis spreads on hedge accounting (102.93)
Provision for expected credit losses (c) (237.27)
Reversal of gain on sale of investment in equity instruments classified as fair value through Other Comprehensive Income (a) (80.38)
Fair value gain on investment in mutual funds (a) 13.83
Discounting of provisions (h) (61.93)
Remeasurement losses on defined benefit obligations (net) (i) (82.45)
Impact on depreciation due to retrospective application of business combination (94.62)
Effect of de-recognition of financial instruments (j) (116.00)
Others (net) (213.60)
Tax effect on above adjustments (including tax effect on undistributed earnings of subsidiaries, associates and joint arrangements) (152.45)
Net profit after tax as per Ind AS 11,579.31
Other Comprehensive income (net of tax) attributable to the Shareholders of the Company 3,145.33
Total Comprehensive income after tax as per Ind AS attributable to the Shareholders of the Company 14,724.64
(a) Equity reconciliation (R in crores)
Particulars Note As at March 31, 2016 As at April 1, 2015
Equity as reported under Previous GAAP 80,782.67 56,261.92
Fair value loss through Other Comprehensive Income for investments in quoted equity shares (a) (103.14) (91.50)
Fair value gain on investments in mutual funds (a) 23.40 9.87
Proposed Dividend (b) 73.00 -
Provision for expected credit losses (c) (3,347.90) (3,110.63)
Gain on fair value of below market interest loan (net of effective interest rate adjustment) (d) 447.78 396.98
Effect of de-recognition of financial instruments (j) 12.00 128.00
Effect of adoption of fair value as deemed cost relating to property, plant and equipment and intangibles (e)&(f ) 2,738.92 2,490.49
Effect of hedges for inventory purchases (g) 8.59 312.21
Fair valuation of assets and liabilities on acquisition of business (m) (1,140.98) (1,010.66)
Discounting of provisions (h) 185.57 237.97
Reversal of goodwill recognised in Previous GAAP on common control transactions (322.00) (322.00)
Others (net) (327.40) (129.98)
Tax effect on above adjustments (78.10) 99.91
Equity as per Ind AS 78,952.41 55,272.58
(y) Reconciliation between Previous GAAP and Ind AS:
Notes to reconciliations between Previous GAAP and Ind AS (a) Investments
Under Previous GAAP, investments were classified into current and long term investments. Current investments are carried at the lower of cost or market value, while long term investments are carried at cost less any impairment that is other than temporary. Under Ind AS, equity investments have been classified as Fair Value through Other Comprehensive Income (FVTOCI). Fair value movements are recognized directly in other comprehensive income on such investments. Investments in Mutual Funds have been classified as Fair value through Profit or Loss (FVTPL) and fair value changes are recognised in Statement of Profit and Loss.
(b) DividendsUnder Ind AS, dividends payable are recorded as a liability in the year in which these are declared and approved. Under Previous GAAP, dividends payable were recorded as a liability in the year to which they relate.
(c) Provision for expected credit lossesImpairment of finance receivables is measured at an amount equal to twelve month expected losses if credit risk on such assets has not increased significantly since initial recognition. An allowance equal to lifetime expected losses is provided if credit risks has increased significantly from the date of initial recognition.
NOTES FORMING PART OF CONSOLIDATED FINANCIAL STATEMENTS

Statutory ReportsCorporate Overview Financial Statements
F-92
(Consolidated)
72nd Annual Report 2016-17
Under Previous GAAP, such estimates were determined based on experience of historic losses on such contracts. Impairment for trade receivable is measured in Ind AS based on life time expected credit losses. Expected credit loss allowance is measured based on historical credit loss experience, defaults, bankruptcy and forward looking information where relevant adjusted for probability of recovery. Under Previous GAAP, provision for trade receivable is measured based on factors such as age of receivables, defaults etc. adjusted for probability of recovery.
(d) Gain on fair value of below market interest loansUnder Ind AS, below market interest rate loan received is recorded at fair value by using an appropriate discount rate on date of obtaining the loan. The difference between the fair value and the amount received is recognised as a gain in profit or loss as per Ind AS 20. The interest expense is recorded periodically till the maturity of the loan based on effective interest method. Under Previous GAAP, the loan were recorded same as the amount received.
(e) Property, plant and equipment and intangible assets On the date of transition to Ind AS, the Company has elected to measure certain items of Property, Plant and Equipment and intangible assets at fair value and use that fair value as its deemed cost. The aggregate fair values of Property, Plant and Equipment is R5,859.48 crores and of related intangible assets is R1,891.97 crores. Fair value adjustments recorded to the carrying amounts is R3,593.71 crores for Property, Plant and Equipment and R(1,103.22) crores for related Intangible Assets. Under Ind AS, all foreign exchange transaction gains and losses are included in net income except to the extent these are treated as an adjustment to interest cost and considered for capitalization. Under Previous GAAP, foreign exchange gains and losses arising on foreign currency denominated borrowings that were incurred to acquire property, plant and equipment and intangible assets were included in the cost of the asset and depreciated over their remaining useful life. Further under Previous GAAP, the cost of property, plant and equipment also included indirectly attributable expenses that are incurred before a property, plant and equipment is ready for its intended use. Under Ind AS, such costs are expensed as incurred. Under Ind AS, import duty waivers for capital assets purchased under Export Promotion Credit Guarantee (EPCG) schemes are recorded as deferred revenue and recognized in Profit and Loss on a systematic basis over the periods in which the related performance obligations are fulfilled. On the transition date, the Company, therefore, recorded an adjustment to measure such Property, plant and equipment in accordance with Ind AS 16. Under Previous GAAP, cost of the property, plant and equipment was recorded at the cash price paid to acquire such assets. Consequently, depreciation relating to the above differences in the cost of property, plant and equipment under Ind AS and Previous GAAP has also been adjusted.
(f) Exchange gain/(loss) accumulated in foreign currency monetary item translation difference account Under Ind AS, all exchange differences are accounted for in the Statement of Profit and Loss in the period in which they arise. Under Previous GAAP, exchange differences relating to long term foreign currency monetary assets/liabilities were accounted for in the following manner: a) Differences relating to borrowings attributable to the acquisition of the depreciable capital asset were added to/deducted from the cost of such
capital assets; b) Other differences were accumulated in foreign currency monetary item translation difference account, to be amortized over the period, beginning
April 1, 2011 or date of inception of such item, as applicable, and ending on March 31, 2020 or the date of its maturity, whichever is earlier. (g) Basis adjustment for inventories
The Company have entered into forwards and options to hedge its raw materials inventory purchases. The unrealised gain/(loss) on such hedges are recognised in the hedge reserve. Under Previous GAAP, the gain/(loss) on such hedges are reclassified to profit and loss statement on maturity of such contracts. Under Ind AS, the gain/(loss) are recognised in inventory at the time of purchase of raw materials.
(h) Discounting of warranty provisions Under Previous GAAP, the provision for warranty expenses are not discounted for time value. Under Ind AS, these provisions are discounted and the time value is accreted over the warranty period.
(i) Remeasurement gain/(loss) Under Previous GAAP, the actuarial gain/(loss) on post retirement employee benefit obligations are recognised in the statement of profit and loss. Under Ind AS, such gain/(loss) are recognised in the Other Comprehensive income.
(j) Derecognition of financial instruments The Company transfers finance receivables in securitisation transactions/direct assignments. In such transactions the Company surrenders control over the receivables though continues to act as an agent for the collection of receivables. In most of these transactions, the Company also provides credit enhancement to the transferee. Because of the existence of credit enhancement in such transactions, under Ind AS, such transfer or assignment does not meet the derecognition criteria resulting into the transaction not being recorded as sale. Consequently, the proceeds received from the transfer are recorded as collateralised debt obligation.Under the Previous GAAP, the derecognition criteria were different and are based on surrender of control. The Company meets the criteria under Previous GAAP for derecognition and accordingly records such transfer as sale.
(k) Deferred taxes have been recorded under Ind AS for undistributed earnings of subsidiaries, joint arrangements, associates and inter company adjustments with subsidiaries and joint operations, which were not recorded under Previous GAAP.
(l) Foreign currency translation adjustment: These are consequential translation adjustments on Previous GAAP to Ind AS adjustments.
(m) Under Previous GAAP, Business Combination are accounted at book value whereas under Ind AS, these are accounted at fair value.(n) Cash Flow Statement
Under Ind AS, certain transfer of finance receivables by way of securitisation/direct assignments do not meet the criteria for derecognition. Consequently, proceeds received from these transactions are recorded as collateralized debt obligation. Under Indian GAAP, such transactions meet the criteria for derecognition and accordingly, recorded as sale. As a result, under Ind AS , the cash flows from operating activities and cash outflows from financing activities is higher by R603 crores.
NOTES FORMING PART OF CONSOLIDATED FINANCIAL STATEMENTS

F-93
3. P
rope
rty,
pla
nt a
nd e
quip
men
t(`
in c
rore
s)
Ow
ned
asse
tsG
iven
on
leas
eTa
ken
on le
ase
Tota
l
Land
Build
ings
Plan
t and
eq
uipm
ent
Furn
iture
an
d fix
ture
sVe
hicl
esCo
mpu
ters
Her
itage
A
sset
sLa
ndBu
ildin
gsPl
ant a
nd
equi
pmen
tVe
hicl
esBu
ildin
gsPl
ant a
nd
equi
pmen
t
Furn
iture
an
d fix
ture
s
Com
pute
rs
Cost
as
at A
pril
1, 2
016
7,1
61.5
2 1
2,16
4.18
7
9,47
8.20
1
,241
.33
279
.69
1,6
34.4
2 4
97.7
8 2
3.17
3
4.55
2
1.93
-
144
.06
563
.00
- 1
74.2
5 1
03,4
18.0
8
Add
ition
s 2
1.87
1
,114
.12
9,3
24.7
6 1
36.7
3 4
4.79
3
13.6
4 1
.48
- -
0.0
4 8
.14
12.
43
0.9
9 4
.31
4.6
2 1
0,98
7.92
Curr
ency
tran
slat
ion
diffe
renc
es (4
21.4
1) (1
,175
.59)
(8,8
24.2
5) (1
30.4
6) (1
1.50
) (1
38.3
9) (7
5.91
) (3
.06)
(5.0
9) -
- (6
.73)
(67.
85)
- -
(10,
860.
24)
Dis
posa
l -
(88.
41)
(418
.57)
(29.
47)
(22.
03)
(42.
90)
- -
- (1
3.02
) -
(0.1
9) (7
9.99
) -
- (6
94.5
8)
Cost
as
at M
arch
31,
201
7 6
,761
.98
12,
014.
30
79,
560.
14
1,2
18.1
3 2
90.9
5 1
,766
.77
423
.35
20.
11
29.
46
8.9
5 8
.14
149
.57
416
.15
4.3
1 1
78.8
7 1
02,8
51.1
8
Acc
umul
ated
dep
reci
atio
n as
at
Apr
il 1,
201
6 -
2,1
70.8
6 3
4,13
8.35
5
44.0
5 1
58.5
9 9
10.2
9 -
- 0
.75
9.2
7 -
29.
44
378
.06
- 1
51.3
5 3
8,49
1.01
Dep
reci
atio
n fo
r the
per
iod
- 5
07.7
0 8
,074
.51
133
.78
43.
46
169
.64
- -
0.1
5 2
.15
3.6
6 6
.78
94.
13
0.6
5 1
2.01
9
,048
.62
Wri
teoff
of a
sset
s-
- 1
02.0
4-
--
--
--
--
--
- 1
02.0
4
Curr
ency
tran
slat
ion
diffe
renc
es -
(183
.91)
(3,5
51.5
9) (5
0.77
) (4
.81)
(41.
24)
- -
(0.1
7) -
- (0
.44)
(48.
16)
- -
(3,8
81.0
9)
Dis
posa
l -
(49.
18)
(287
.24)
(26.
16)
(17.
65)
(35.
21)
- -
- (8
.34)
- (0
.19)
(79.
99)
- -
(503
.96)
Acc
umul
ated
dep
reci
atio
n as
at
Mar
ch 3
1, 2
017
- 2
,445
.47
38,
476.
07
600
.90
179
.59
1,0
03.4
8 -
- 0
.73
3.0
8 3
.66
35.
59
344
.04
0.6
5 1
63.3
6 4
3,25
6.62
Net
car
ryin
g am
ount
as
at M
arch
31
, 201
7 6
,761
.98
9,5
68.8
3 4
1,08
4.07
6
17.2
3 1
11.3
6 7
63.2
9 4
23.3
5 2
0.11
2
8.73
5
.87
4.4
8 1
13.9
8 7
2.11
3
.66
15.
51
59,
594.
56
Cost
as a
t Apr
il 1,
201
5 6
,653
.09
9,8
65.6
4 6
4,76
0.52
1
,008
.32
266
.38
1,2
74.2
0 4
82.1
2 2
.93
0.7
3 1
9.70
1
50.9
3 5
18.5
2 -
164
.45
85,
167.
53
Addi
tions
486
.41
2,1
58.2
7 1
4,56
1.59
2
49.4
4 5
7.04
3
80.3
8 -
20.
91
34.
56
3.2
6 6
.08
32.
55
- 9
.80
18,
000.
29
Writ
eoff
of a
sset
s-
- (2
25.7
9)-
--
--
--
--
--
(225
.79)
Curre
ncy
tran
slatio
n di
ffere
nces
43.
27
145
.67
971
.15
16.
33
1.4
5 8
.25
15.
66
(0.6
7) (0
.74)
- 1
.89
11.
93
- -
1,2
14.1
9
Disp
osal
(21.
25)
(5.4
0) (5
89.2
7) (3
2.76
) (4
5.18
) (2
8.41
) -
- -
(1.0
3) (1
4.84
) -
- -
(738
.14)
Cost
as a
t Mar
ch 3
1, 2
016
7,1
61.5
2 1
2,16
4.18
7
9,47
8.20
1
,241
.33
279
.69
1,6
34.4
2 4
97.7
8 2
3.17
3
4.55
2
1.93
1
44.0
6 5
63.0
0 -
174
.25
103
,418
.08
Accu
mul
ated
dep
reci
atio
n as
at
April
1, 2
015
- 1
,724
.45
27,
266.
07
431
.85
153
.11
791
.65
- -
- 6
.86
24.
49
368
.96
- 1
35.4
4 3
0,90
2.88
Dep
reci
atio
n fo
r the
yea
r -
439
.21
7,1
85.9
7 1
36.6
1 4
2.86
1
29.7
6 -
- 0
.75
3.1
7 5
.46
0.2
5 -
15.
91
7,9
59.9
5 W
riteo
ff of
ass
ets
- -
(165
.47)
- -
- -
- -
- -
- -
- (1
65.4
7)Cu
rrenc
y tr
ansla
tion
diffe
renc
es -
19.
11
331
.89
6.1
5 0
.24
5.4
0 -
- -
- 0
.26
8.8
5 -
- 3
71.9
0 D
ispos
al -
(11.
91)
(480
.11)
(30.
56)
(37.
62)
(16.
52)
- -
- (0
.76)
(0.7
7) -
- -
(578
.25)
Accu
mul
ated
dep
reci
atio
n as
at
Mar
ch 3
1, 2
016
- 2
,170
.86
34,
138.
35
544
.05
158
.59
910
.29
- -
0.7
5 9
.27
29.
44
378
.06
- 1
51.3
5 3
8,49
1.01
Net
car
ryin
g am
ount
as a
t Mar
ch
31, 2
016
7,1
61.5
2 9
,993
.32
45,
339.
85
697
.28
121
.10
724
.13
497
.78
23.
17
33.
80
12.
66
114
.62
184
.94
- 2
2.90
6
4,92
7.07
NO
TES
FORM
ING
PA
RT O
F CO
NSO
LID
ATED
FIN
AN
CIA
L ST
ATEM
ENTS

Statutory ReportsCorporate Overview Financial Statements
F-94
(Consolidated)
72nd Annual Report 2016-17
4. Leases
The Company has taken land, buildings, plant and equipment, computers and furniture and fixtures under operating and finance leases. The following is the summary of future minimum lease rental payments under non-cancellable operating leases and finance leases entered into by the Company:
(` in crores)
As at March 31, As at April 1,
2017 2016 2015
Operating Finance Operating Finance Operating Finance
Minimum Lease
Payments
Minimum Lease
Payments
Present value of
minimum lease
payments
Minimum Lease
Payments
Minimum Lease
Payments
Present value of
minimum lease
payments
Minimum Lease
Payments
Minimum Lease
Payments
Present value of
minimum lease
payments
Not later than one year 659.77 25.82 22.12 503.19 61.18 57.22 462.67 75.51 57.17
Later than one year but not later than five years 1,787.14 41.71 33.81 784.36 58.77 53.31 577.56 91.99 90.75
Later than five years 1,464.55 37.22 20.23 1,309.46 38.18 15.73 1,112.72 - -
Total minimum lease commitments 3,911.46 104.75 76.16 2,597.01 158.13 126.26 2,152.95 167.50 147.92
Less: future finance charges (28.61) (31.87) (19.58)
Present value of minimum lease payments 76.14 126.26 147.92
Included in the financial state-ments as:Other financial liabilities - current (refer note 27) 22.13 57.22 57.17
Long-term borrowings (refer note 24) 54.01 69.04 90.75
76.14 126.26 147.92
Total operating lease rent expenses were `822.48 crores and `774.03 crores for the years ended March 31, 2017 and 2016 respectively.
5. Goodwill
As at March 31,
2017 2016
Balance at the beginning 759.80 731.95
Impairment (14.25) -
Currency translation differences (72.23) 27.85
Balance at the end 673.32 759.80
As at March 31, 2017, goodwill of `115.41 crores and `557.91 crores relates to the automotive and related activity segment (Tata and other brand vehicles including financing thereof ) and “others” segment respectively. As at March 31, 2016, goodwill of `130.98 crores and `628.82 crores relates to the automotive and related activity segment (Tata and other brand vehicles including financing thereof ) and “others” segment respectively.As at March 31, 2017, goodwill of `557.91 crores has been allocated to software consultancy and services cash generating unit. The recoverable amount of the cash generating unit has been determined based on value in use. Value in use has been determined based on future cash flows, after considering current economic conditions and trends, estimated future operating results, growth rates and anticipated future economic conditions.As at March 31, 2017, the estimated cash flows for a period of 5 years were developed using internal forecasts, and a pre-tax discount rate of 11.78%. The cash flows beyond 5 years have been extrapolated assuming 2% growth rates. The management believes that any reasonably possible change in the key assumptions would not cause the carrying amount to exceed the recoverable amount of the cash generating unit.
NOTES FORMING PART OF CONSOLIDATED FINANCIAL STATEMENTS

F-95
6. Other intangible assets (R in crores)Particulars Software Patents and
technological know how
Customer related
Intellectual property rights
and other intangibles
Indefinite life trade marks and
patents
Product development
Total
Cost as at April 1, 2016 5,966.68 1,525.56 605.00 82.08 5,902.17 50,681.24 64,762.73
Additions 797.70 1.79 - 129.43 - 7,943.73 8,872.65
Currency translation differences (821.48) (213.67) (88.39) (13.14) (898.67) (7,231.70) (9,267.05)
Disposal - - - (3.38) - - (3.38)
Fully amortized not in use (730.06) - - - - (3,647.18) (4,377.24)
Cost as at March 31, 2017 5,212.84 1,313.68 516.61 194.99 5,003.50 47,746.09 59,987.71
Accumulated amortisation as at April 1, 2016 2,493.19 1,149.93 228.27 39.71 - 19,306.74 23,217.84
Amortization for the period 756.87 131.20 28.97 1.06 - 7,938.27 8,856.37
Fully amortized not in use (730.06) - - - - (3,647.18) (4,377.24)
Currency translation differences (305.22) (183.14) (31.81) (1.15) - (2,862.20) (3,383.52)
Disposal - (1.94) - - - - (1.94)Accumulated amortisation as at March 31, 2017 2,214.78 1,096.05 225.43 39.62 - 20,735.63 24,311.51
Net carrying amount as at March 31, 2017 2,998.06 217.63 291.18 155.37 5,003.50 27,010.46 35,676.20
Cost as at April 1, 2015 4,359.70 1,453.06 586.73 81.14 5,716.47 40,290.54 52,487.64
Additions 1,637.87 28.18 - - - 14,040.89 15,706.94
Writeoff of assets - - - - - (907.72) (907.72)
Currency translation differences 80.11 44.32 18.27 0.94 185.70 716.90 1,046.24
Disposal - - - - - - -
Fully amortised not in use (111.00) - - - - (3,459.37) (3,570.37)
Cost as at March 31, 2016 5,966.68 1,525.56 605.00 82.08 5,902.17 50,681.24 64,762.73
Accumulated amortisation as at April 1, 2015 1,809.88 978.34 195.28 34.94 - 15,561.01 18,579.45
Amortization for the year 751.91 146.37 27.60 3.72 - 7,821.23 8,750.83
Writeoff of assets - - - - - (907.17) (907.17)
Currency translation differences 26.31 25.22 5.39 1.05 - 291.04 349.01
Disposal - - - - - - -
Fully amortised not in use (94.91) - - - - (3,459.37) (3,554.28)
Accumulated amortisation as at March 31, 2016 2,493.19 1,149.93 228.27 39.71 - 19,306.74 23,217.84
Net carrying amount as at March 31, 2016 3,473.49 375.63 376.73 42.37 5,902.17 31,374.50 41,544.89
The useful life of trademarks and brands in respect of the acquired Jaguar Land Rover businesses have been determined to be indefinite as the Company expects to generate future economic benefits indefinitely from these assets.
The indefinite life intangible assets have been allocated to the Jaguar Land Rover businesses. The recoverable amount of the cash generating unit has been determined based on value in use. Value in use has been determined based on future cash flows after considering current economic conditions and trends, estimated future operating results, growth rates and anticipated future economic conditions.
The estimated cash flows for a period of five years were developed using internal forecasts, and a pre-tax discount rate of 10.9%. The cash flows beyond five years have been extrapolated assuming 1.9% growth rate. The management believes that any reasonably possible change in the key assumptions would not cause the carrying amount to exceed the recoverable amount of the cash generating unit.
NOTES FORMING PART OF CONSOLIDATED FINANCIAL STATEMENTS

Statutory ReportsCorporate Overview Financial Statements
F-96
(Consolidated)
72nd Annual Report 2016-17
7. Investments in equity accounted investees:(a) Associates:
The Company has no material associates as at March 31, 2017. The aggregate summarized financial information in respect of the Company’s immaterial associates that are accounted for using the equity method is set forth below.
(R in crores)
As at March 31, As at April 1,
2017 2016 2015
Carrying amount of the Company’s interest in associates 872.63 526.57 571.84
Year ended March 31,
2017 2016
Company’s share of profit/(loss) in associates* 110.93 (21.40)
Company’s share of other comprehensive income in associates (15.51) (8.57)
Company’s share of total comprehensive income in associates 95.42 (29.97)
(i) Fair value of investment in an equity accounted associate for which published price quotation is available, which is a level 1 input, was `192.22 crores and `127.80 crores as at March 31, 2017 and 2016, respectively. The carrying amount as at March 31, 2017 and 2016, was `136.84 crores and `135.04 crores, respectively.
(ii) During the year ended March 31, 2017, - Optionally convertible Preference shares of Tata Hitachi Construction Machinery Pvt Ltd of `160 crores were converted into equity shares.
- The Company purchased 32% of the Ordinary share capital of CloudCar Inc. for GBP 12 million (`105.20 crores). However, the Group has 43% of the voting rights since a number of Ordinary shares are in the form of options either available for issue or assigned to the employees of CloudCar Inc.
- The Company purchased 33% of the Ordinary share capital of Synaptiv Limited for GBP 0.2 million (`1.75 crores).
(b) Joint ventures:
(i) Details of the Company’s material joint venture as at March 31, 2017 are as follows:
% holding as at March 31, % holding as at April 1,
Name of joint venture Principal activity Principal place of the business 2017 2016 2015
Chery Jaguar Land Rover Automotive Co. Limited (Chery)Manufacture and
assembly of vehicles China 50% 50% 50%
Chery is a limited liability company, whose legal form confers separation between the parties to the joint arrangement. There is no contractual arrangement or any other facts and circumstances that indicate that the parties to the joint venture have rights to the assets and obligations for the liabilities of the joint arrangement. Accordingly, Chery is classified as a joint venture. The summarized financial information in respect of Chery that is accounted for using the equity method is set forth below.
As at March 31, As at April 1,
2017 2016 2015Current assets 7,608.28 6,657.81 4,812.23
Non-current assets 8,852.56 7,764.09 5,423.28 Current liabilities (7,565.07) (5,860.96) (3,198.73)Non-current liabilities (1,424.97) (2,058.03) (1,784.26)The above amounts of assets and liabilities include the following: - -
Cash and cash equivalents 5,025.85 4,295.35 2,727.24 Current financial liabilities (excluding trade and other payables and provisions) (1.70) (334.08) (517.71)Non-current financial liabilities (excluding trade and other payables and provisions) (1,416.88) (2,058.03) (1,784.26)Share of net assets of material joint venture 3,735.40 3,251.46 2,626.26 Other consolidation adjustments (66.79) (64.23) (53.01)Carrying amount of the Company's interest in joint venture 3,668.61 3,187.23 2,573.25
NOTES FORMING PART OF CONSOLIDATED FINANCIAL STATEMENTS

F-97
(R in crores)
Year ended March 31,
2017 2016
Revenue 18,960.13 10,904.86
Net income/(loss) 2,732.06 1,186.64
Other comprehensive income - -
Total comprehensive income for the year 2,732.06 1,186.64
The above net income includes the following:
Depreciation and amortization 920.11 572.01
Interest income (99.32) (78.90)
Interest expense (net) 70.66 98.62
Income tax expense 901.44 433.94
Reconciliation of above summarized financial information to the carrying amount of the interest in the joint venture recognized in the consolidated financial statements:
As at March 31, As at April 1,
2017 2016 2015
Net assets of the joint venture 7,470.80 6,502.91 5,252.52
Proportion of the Company's interest in joint venture 3,735.40 3,251.46 2,626.26
Other consolidation adjustments (66.79) (64.23) (53.01)
Carrying amount of the Company's interest in joint venture 3,668.61 3,187.23 2,573.25
During the year ended March 31, 2017, a dividend of GBP 68 million (`592.88 crores) was received by a subsidiary in UK from Chery Jaguar Land Rover Automotive Co. Ltd. (2016: Nil)
(ii) The aggregate summarized financial information in respect of the Company’s immaterial joint ventures that are accounted for using the equity method is set forth below.
As at March 31, As at April 1,
2017 2016 2015
Carrying amount of the Company’s interest in joint ventures 64.77 50.15 28.57
Year ended March 31,
2017 2016
Company’s share of profit/(loss) in joint ventures* 27.65 20.74
Company’s share of other comprehensive income in joint ventures (13.03) -
Company’s share of total comprehensive income in joint ventures 14.62 20.74
NOTES FORMING PART OF CONSOLIDATED FINANCIAL STATEMENTS

Statutory ReportsCorporate Overview Financial Statements
F-98
(Consolidated)
72nd Annual Report 2016-17
(c) Summary of carrying amount of the Company’s interest in equity accounted investees:
(R in crores)
As at March 31, As at April 1,
2017 2016 2015
Carrying amount in immaterial associates 872.63 526.57 571.84
Carrying amount in material joint venture 3,668.61 3,187.23 2,573.25
Carrying amount in immaterial joint ventures 64.77 50.15 28.57
4,606.01 3,763.95 3,173.66
(d) Summary of Company’s share of profit/(loss) in equity accounted investees:
Year ended March 31,
2017 2016
Share of profit/(loss) in immaterial associates 110.93 (21.40)
Share of profit/(loss) in material joint venture 1,366.03 593.32
Share of profit/(loss) on other adjustments in material joint venture (11.61) (15.19)
Share of profit/(loss) in immaterial joint ventures 27.65 20.74
1,493.00 577.47
(e) Summary of Company’s share of other comprehensive income in equity accounted investees:
Year ended March 31,
2017 2016
Share of other comprehensive income in immaterial associates (4.00) (8.57)
Currency translation differences-immaterial associates (11.51) -
Currency translation differences-material joint venture (280.16) 35.85
Currency translation differences-immaterial joint ventures (13.03) 0.84
(308.70) 28.12
* Company’s share of profit/(loss) of the equity accounted investees has been determined after giving effect for the subsequent amortization/depreciation and other adjustments arising on account of fair value adjustments made to the identifiable net assets of the equity accounted investee as at the date of acquisition and other adjustment arising under the equity method of accounting.
NOTES FORMING PART OF CONSOLIDATED FINANCIAL STATEMENTS

F-99
(R in crores)
8. Other Investments - non-current As at March 31, As at April 1,
2017 2016 2015
(a) Investments - measured at Fair value through Other Comprehensive Income
Quoted:
Equity shares 260.29 210.49 210.57
Unquoted:
Equity shares 369.98 373.76 373.25 Total 630.27 584.25 583.82
(b) Investments - measured at Fair value through profit and loss
Quoted:
Mutual fund 25.09 - -Unquoted:
(i) Optionally convertible preference shares - 160.00 160.00
(ii) Non-cumulative redeemable preference shares 1.40 2.90 3.00
(iii) Cumulative redeemable preference shares 6.50 5.00 5.00
(iv) Others 23.62 14.03 13.53
Total 56.61 181.93 181.53
(c) Investments - measured at amortised cost
Unquoted:
Non-convertible debentures 3.88 3.85 3.50
Total 3.88 3.85 3.50
Total (a+b+c) 690.76 770.03 768.85
Aggregate book value of quoted investments 285.38 210.49 210.57
Aggregate market value of quoted investments 285.38 210.49 210.57
Aggregate book value of unquoted investments 405.38 559.54 558.28
NOTES FORMING PART OF CONSOLIDATED FINANCIAL STATEMENTS

Statutory ReportsCorporate Overview Financial Statements
F-100
(Consolidated)
72nd Annual Report 2016-17
(R in crores)
9. Other Investments - current As at March 31, As at April 1,
2017 2016 2015
(a) Investments - measured at Fair value through Other Comprehensive Income
Unquoted:
(i) Equity shares - - 4.68
Total - - 4.68
(b) Investments - measured at Fair value through profit and loss
Unquoted:
(i) Mutual funds 3,040.54 1,889.36 432.10
(ii) Optionally convertible debentures - - 1.49
(iii) Advance against investments 0.40 - 0.30
Total 3,040.94 1,889.36 433.89
(c) Investments - measured at amortised cost
Unquoted:
Mutual funds 12,000.21 17,343.68 13,636.21
Total 12,000.21 17,343.68 13,636.21
Total (a+b+c) 15,041.15 19,233.04 14,074.78
Aggregate book value of unquoted investments 15,041.15 19,233.04 14,074.78
NOTES FORMING PART OF CONSOLIDATED FINANCIAL STATEMENTS

F-101
(R in crores)
10. Loans and advances As at March 31, As at April 1,
2017 2016 2015
Non-current
Secured, considered good:
(a) Loans to channel partners 195.61 - -
Unsecured, considered good:
(a) Loans to employees 27.73 29.31 29.54
(b) Loan to joint operation (FIAT India Automobile Private Ltd) - - 132.50
(c) Loans to others 40.80 33.77 -
(d) Others 489.52 440.80 334.67
Total 753.66 503.88 496.71
Current
Secured, considered good:
(a) Loans to suppliers 25.79 23.51 85.37
Unsecured, considered good:
(a) Advances to supplier, contractors etc. 684.35 930.78 599.10
(b) Inter corporate deposits 0.31 30.31 95.31
(c) Loan to joint operation (FIAT India Automobile Private Ltd) - 132.50 -
Total 710.45 1,117.10 779.78
11. Other financial assets As at March 31, As at April 1,
2017 2016 2015
Non-current
(a) Derivative financial instruments 2,775.34 1,591.26 261.08
(b) Interest accrued on loans and deposits 2.40 0.56 58.81
(c) Restricted deposits 57.19 217.06 226.70
(d) Margin money/cash collateral with banks 74.56 15.63 100.13
(e) Other deposits 1.63 1.00 0.92
Total 2,911.12 1,825.51 647.64
Margin money with banks is restricted cash deposits and consists of collateral provided for transfer of finance receivables. Restricted deposits as at March 31, 2017 and 2016 of R32.37 crores and R181.36 crores is held as a deposit in relation to ongoing legal cases.Restricted deposits as at April1, 2015 of R147.92 crores relate to the Company’s residual risk arising on vehicles sold by dealer under leasing arrangement.
Current
(a) Derivative financial instruments 1,510.18 757.28 1,672.68
(b) Interest accrued on loans and deposits 5.76 73.45 12.12
(c) Term/Fixed deposit other than Banks 40.00 5.00 5.00
Total 1,555.94 835.73 1,689.80
NOTES FORMING PART OF CONSOLIDATED FINANCIAL STATEMENTS

Statutory ReportsCorporate Overview Financial Statements
F-102
(Consolidated)
72nd Annual Report 2016-17
(R in crores)12. Inventories As at March 31, As at April 1,
2017 2016 2015
(a) Raw materials and components 2,159.53 2,418.96 2,325.72 (b) Work-in-progress 3,642.56 4,258.93 3,364.45 (c) Finished goods 28,235.17 24,909.33 22,474.76 (d) Stores and spare parts 216.12 206.97 196.64 (e) Consumable tools 297.66 283.89 215.81 (f ) Goods-in-transit - Raw materials and components 534.27 577.65 466.77 Total 35,085.31 32,655.73 29,044.15
(i) Inventories of finished goods include `2,637.94 crores, `2,386.31 crores and `1,728.79 crores as at March 31, 2017, 2016 and April 1, 2015 respectively, relating to vehicles sold subject to repurchase arrangements.
(ii) Cost of inventories (including cost of purchased products) recognized as expense during the years ended March 31, 2017 and March 31, 2016 amounted to `2,03,087.37 crores and `1,95,875.89 crores, respectively.
(iii) During the year ended March 31, 2017 and 2016, the Company recorded inventory write-down expense of `372.51crores and `328.59 crores (excluding provision for loss of inventory at port of Tianjin in China mentioned below) respectively.
(iv) The exceptional credit of `1,330.10 crores (GBP 151 million) for the year ended March 31, 2017, relates to the explosion at the port of Tianjin (China) in August 2015. This relates to the receipt of insurance proceeds, recovery of import duties and taxes and to an updated assessment of the condition of the remaining vehicles, which led to a reversal of the original provision recorded in the quarter ended September 30, 2015.A provision of `1,638.39 crores (GBP 157 million) (net of insurance recoveries of `534.24 crores (GBP 55 million)) has been recognised against the carrying value of inventory during the year ended March 31, 2016 for the damage due to explosion at the port of Tianjin in China in August 2015.
13. Trade receivables (Unsecured) As at March 31, As at April 1,2017 2016 2015
Trade receivables 15,452.99 14,845.20 13,748.50 15,452.99 14,845.20 13,748.50
Less : Allowances for doubtful trade receivables (1,377.44) (1,274.29) (775.70)Total 14,075.55 13,570.91 12,972.80
14. Cash and cash equivalents As at March 31, As at April 1,
2017 2016 2015
(a) Cash on hand 32.62 40.09 36.97 (b) Cheques on hand 111.31 115.11 51.64 (c) Balances with banks 8,462.76 7,805.03 7,619.95 (d) Deposit with banks 5,380.07 9,193.38 12,034.53
13,986.76 17,153.61 19,743.09
15. Bank balances As at March 31, As at April 1,2017 2016 2015
With upto 12 months maturity:(a) Earmarked balances with banks (refer note below) 238.36 530.82 234.73 (b) Bank deposits 21,852.76 12,775.97 10,434.11 Total 22,091.12 13,306.79 10,668.84 Note:Earmarked balances with banks include R186.14 crores, R361.67 crores and R204.56 crores as at March 31, 2017, 2016 and April 1, 2015, respectively held as security in relation to interest and repayment of borrowings. Out of these deposits, R118.64 crores, R176.67 crores and R204.56 crores as at March 31, 2017, 2016 and April 1, 2015, respectively are pledged till the maturity of the respective borrowings.
16. Finance receivables As at March 31, As at April 1,2017 2016 2015
Finance receivables 21,160.76 20,758.16 20,454.06 Less: Allowance for credit losses (3,597.51) (5,006.69 ) (5,888.01) Total 17,563.25 15,751.47 14,566.05 Current portion 6,810.12 6,079.92 4,959.45 Non-current portion 10,753.13 9,671.55 9,606.60 Total 17,563.25 15,751.47 14,566.05
NOTES FORMING PART OF CONSOLIDATED FINANCIAL STATEMENTS

F-103
(a) Advances and other receivables 402.94 205.57 183.73
(b) VAT, other taxes recoverable, statutory deposits and dues from government 4,904.80 4,464.09 4,118.14
(c) Prepaid expenses 1,106.21 1,117.41 1,058.43
(d) Others 126.04 37.02 51.79
Total 6,539.99 5,824.09 5,412.09
18. Other non-current assetsAs at March 31, As at March 31, As at April 1,
2017 2016 2015
(a) Capital advances 562.52 470.31 234.93
(b) Taxes recoverable, statutory deposits and dues from government 1,125.26 1,008.06 1,190.49
(c) Prepaid rentals on operating leases 326.10 149.08 140.86
(d) Prepaid expenses 631.24 508.05 269.15
(e) Others 202.24 173.52 148.17
Total 2,847.36 2,309.02 1,983.60
19. Other current assetsAs at March 31, As at March 31, As at April 1,
2017 2016 2015
NOTES FORMING PART OF CONSOLIDATED FINANCIAL STATEMENTS
Changes in the allowance for credit losses in finance receivables are as follows:Year ended March 31,
2017 2016
Balance at the beginning 5,006.69 5,888.01 Allowances made/(reversed) during the year (28.15) 220.96 Written off (1,381.03) (1,102.28)Balance at the end 3,597.51 5,006.69
Fair value of collaterals over which the Company has taken possession and held as at March 31, 2017, 2016 and April 1, 2015, amounted to R200.73 crores, R66.06 crores and R356.95 crores, respectively. The collateral represents vehicle financed by the Company and the Company normally undertakes disposal of these vehicles through an auction process.
17. Allowance for trade and other receivables
Change in the allowances for trade and other receivables are as follows:Year ended March 31,
2017 2016
Balance at the beginning 1,483.71 917.71Allowances made during the year 132.93 664.66Written off (134.03) (88.93)Foreign exchange translation differences 34.42 (9.73)Balance at the end 1,517.03 1,483.71
(R in crores)

Statutory ReportsCorporate Overview Financial Statements
F-104
(Consolidated)
72nd Annual Report 2016-17
20. Income taxes The domestic and foreign components of Profit/(loss) before income tax: (R in crores)
Year ended March 31,
2017 2016
Profit/(Loss) before income taxes
India (2,657.73) (954.77)
Other than India 11,972.52 15,080.54
Total 9,314.79 14,125.77
The domestic and foreign components of income tax expense:
Year ended March 31,
2017 2016
Current taxes
India 184.55 101.27
Other than India 2,953.11 1,760.78
Deferred taxes
India 186.00 165.15
Other than India (72.43) 997.85
Total income tax expense 3,251.23 3,025.05
The reconciliation of estimated income tax to income tax expense is as follows:
Year ended March 31,
2017 2016
Profit/(Loss) before income taxes 9,314.79 14,125.77
Income tax expense at tax rates applicable to individual entities 1,621.79 2,857.12
Additional deduction for patent, research and product development cost (745.58) (1,449.40)
Items (net) not deductible for tax/not liable to tax :
- foreign currency (gain)/loss relating to loans and deposits (net) (73.98) 95.27
- interest and other expenses relating to borrowings for investment 53.10 120.37
- Dividend from subsidiaries, joint operations, equity accounted investees and other investments 2.71 134.53
Profit on sale of business to a wholly owned subsidiary 407.89 -
Undistributed earnings of subsidiaries, joint operations and equity accounted investees 389.17 540.52
Deferred tax assets not recognized because realization is not probable 2,243.94 1,186.33
Utilization/credit of unrecognised tax losses, unabsorbed depreciation and other tax benefits (350.90) (126.99)
Impact of change in statutory tax rates (524.96) (593.21)
Others 228.05 260.51
Income tax expense reported 3,251.23 3,025.05
The UK Finance Act 2015 was enacted during the year ended March 31, 2016 which included provisions for a reduction in the UK corporation tax rate from 20% to 19% with effect from April 1, 2017.
The UK Finance Act 2016 was enacted during the year ended March 31, 2017 which included provisions for a further reduction in the UK Corporation tax rate to 17% with effect from April 1, 2020. Accordingly, UK deferred tax has been recognised at the rates applicable when the temporary differences are expected to reverse.
NOTES FORMING PART OF CONSOLIDATED FINANCIAL STATEMENTS

F-105
Significant components of deferred tax assets and liabilities for the year ended March 31, 2017 are as follows:
(R in crores)
Opening balance
Recognized in profit or loss
Recognized in/reclassified from other
comprehensive income
Closing balance
Deferred tax assets:
Depreciation carry forwards 2,010.81 563.75 (0.06) 2,574.50
Business loss carry forwards 3,234.23 293.99 (235.84) 3,292.38
Expenses deductible in future years:
- provisions, allowances for doubtful receivables and others 4,034.57 (1,063.87) (141.98) 2,828.72
Compensated absences and retirement benefits 1,186.90 (1.20) 987.26 2,172.96
Minimum alternate tax carry-forward 58.26 16.66 - 74.92
Property, plant and equipment 216.83 (72.74) (32.19) 111.90
Derivative financial instruments 2,296.64 (35.07) 2,167.37 4,428.94
Inventory 1,223.34 534.47 (148.41) 1,609.40
Others 652.10 205.49 (61.15) 796.44
Total deferred tax assets 14,913.68 441.48 2,535.00 17,890.16
Deferred tax liabilities:
Property, plant and equipment 2,743.13 (41.01) 0.08 2,702.20
Intangible assets 11,258.14 576.72 (1,349.97) 10,484.89
Undistributed earnings in subsidiaries, joint operations and equity accounted investees 1,343.63 23.81* (29.81) 1,337.63
Fair valuation of retained interest in a subsidiary subsequent to disposal of controlling equity interest 16.95 - - 16.95
Derivative financial instruments 4.04 19.32 (0.24) 23.12
Others 65.54 (23.79) 0.28 42.03
Total deferred tax liabilities 15,431.43 555.05 (1,379.66) 14,606.82
Net assets/(liabilities) (517.75) (113.57) 3,914.66 3,283.34
Deferred tax assets 4,457.34
Deferred tax liabilities (1,174.00)
* Net off `365.36 crores reversed on dividend distribution by subsidiaries.
NOTES FORMING PART OF CONSOLIDATED FINANCIAL STATEMENTS

Statutory ReportsCorporate Overview Financial Statements
F-106
(Consolidated)
72nd Annual Report 2016-17
As at March 31, 2017, unrecognized deferred tax assets amount to `3,199.20 crores and ` 5,569.59 crores, which can be carried forward indefinitely and up to a specified period, respectively. These relate primarily to business losses, depreciation carry forwards and other deductible temporary differences. The deferred tax asset has not been recognized on the basis that its recovery is not probable in the foreseeable future.
Unrecognized deferred tax assets expire unutilized based on the year of origination as follows:
March 31, (Rin crores)
2018 26.35
2019 32.73
2020 42.87
2021 300.08
2022 73.85
Thereafter 5,093.71
The Company has not recognized deferred tax liability on undistributed profits of certain subsidiaries amounting to `40,965.53 crores because it is able to control the timing of the reversal of temporary differences associated with such undistributed profits and it is probable that such differences will not reverse in the foreseeable future.
Significant components of deferred tax assets and liabilities for the year ended March 31, 2016 are as follows:
(R in crores)
Opening balance
Recognized in profit or loss
Recognized in/reclassified
from other comprehensive
income
Closing balance
Deferred tax assets:
Depreciation carry forwards 1,584.44 426.37 - 2,010.81
Business loss carry forwards 3,608.90 (459.65) 84.98 3,234.23
Expenses deductible in future years:
- provisions, allowances for doubtful receivables and others 4,108.38 (143.37) 69.56 4,034.57
Compensated absences and retirement benefits 1,869.31 383.13 (1,065.54) 1,186.90
Minimum alternate tax carry-forward 89.87 (31.61) - 58.26
Property, plant and equipment 90.78 128.95 (2.90) 216.83
Derivative financial instruments 2,415.10 (368.46) 250.00 2,296.64
Inventory 1,298.27 (122.14) 47.21 1,223.34
Others 486.62 144.80 20.68 652.10
Total deferred tax assets 15,551.67 (41.98) (596.01) 14,913.68
Deferred tax liabilities:
Property, plant and equipment 2,658.87 83.85 0.41 2,743.13
Intangible assets 9,884.33 1,157.24 216.57 11,258.14
Undistributed earnings of subsidiaries joint operations and equity accounted investees 1,426.54 (111.92)* 29.01 1,343.63
Fair valuation of retained interest in a subsidiary subsequent to disposal of controlling equity interest 16.95 - - 16.95
Derivative financial instruments 10.34 (8.86) 2.56 4.04
Others 64.72 0.71 0.11 65.54
Total deferred tax liabilities 14,061.75 1,121.02 248.66 15,431.43
Net assets/(liabilities) 1,489.92 (1,163.00) (844.67) (517.75)
Deferred tax assets 3,957.03
Deferred tax liabilities (4,474.78)
* Net off R652.44 crores reversed on dividend distributions by subsidiaries.
NOTES FORMING PART OF CONSOLIDATED FINANCIAL STATEMENTS

F-107
NOTES FORMING PART OF CONSOLIDATED FINANCIAL STATEMENTS(R in crores)
As at March 31, 2017
As at March 31, 2016
As at April 1, 2015
21. Equity Share Capital
(a) Authorised :(i) 350,00,00,000 Ordinary shares of R2 each 700.00 700.00 700.00
(as at March 31, 2016: 350,00,00,000 Ordinary shares of R2 each)(as at April 1, 2015: 350,00,00,000 Ordinary shares of R2 each)
(ii) 100,00,00,000 ‘A’ Ordinary shares of R2 each 200.00 200.00 200.00 (as at March 31, 2016: 100,00,00,000 ‘A’ Ordinary shares of R2 each)(as at April 1, 2015: 100,00,00,000 ‘A’ Ordinary shares of R2 each)
(iii) 30,00,00,000 Convertible Cumulative Preference shares of R100 each 3,000.00 3,000.00 3,000.00 (as at March 31, 2016: 30,00,00,000 shares of R100 each)(as at April 1, 2015: 30,00,00,000 shares of R100 each) Total 3,900.00 3,900.00 3,900.00
(b) Issued [Note (k)]:(i) 288,78,43,046 Ordinary shares of R2 each 577.57 577.57 547.44
(as at March 31, 2016: 288,78,43,046 Ordinary shares of R2 each)(as at April 1, 2015: 273,71,98,287 Ordinary shares of R2 each)
(ii) 50,87,36,110 ‘A’ Ordinary shares of R2 each 101.75 101.75 96.44 (as at March 31, 2016: 50,87,36,110 ‘A’ Ordinary shares of R2 each)(as at April 1, 2015: 48,22,05,820 ‘A’ Ordinary shares of R2 each)
Total 679.32 679.32 643.88
(c) Subscribed and called up:(i) 288,73,48,428 Ordinary shares of R2 each 577.47 577.44 547.34
(as at March 31, 2016: 288,72,03,602 Ordinary shares of R2 each)(as at April 1, 2015: 273,67,13,122 Ordinary shares of R2 each)
(ii) 50,85,02,291 ‘A’ Ordinary shares of R2 each 101.70 101.70 96.40 (as at March 31, 2016: 50,84,76,704 ‘A’ Ordinary shares of R2 each)(as at April 1, 2015: 48,19,66,945 ‘A’ Ordinary shares of R2 each) Total 679.17 679.14 643.74
(d) Calls unpaid - Ordinary shares310 Ordinary shares of R2 each (R1 outstanding on each) and 260 Ordinary shares of R2 each (R0.50 outstanding on each)
(0.00)* (0.01) (0.01)
(as at March 31, 2016: 68,490 Ordinary shares of R2 each (R1 outstanding on each) and 260 Ordinary shares of R2 each (R0.50 outstanding on each))(as at April 1, 2015: 68,490 Ordinary shares of R2 each (R1 outstanding on each) and 260 Ordinary shares of R2 each (R0.50 outstanding on each))
(e) Paid-up (c+d): 679.17 679.13 643.73 (f) Forfeited Shares - Ordinary shares 0.05 0.05 0.05
Total ( e + f ) 679.22 679.18 643.78
(g) The movement of number of shares and share capital
Year ended March 31, 2017 Year ended March 31, 2016 (No. of shares) (R in crores) (No. of shares) (R in crores)
(i) Ordinary shares Balance as at April 1 288,72,03,602 577.44 273,67,13,122 547.34 Add: Rights issue of shares - - 15,04,90,480 30.10 Add: Allotment of shares held in abeyance 1,44,826 0.03 - - Balance as at March 31 288,73,48,428 577.47 288,72,03,602 577.44 (ii) ‘A’ Ordinary shares Balance as at April 1 50,84,76,704 101.70 48,19,66,945 96.40 Add: Rights issue of shares - - 2,65,09,759 5.30 Add: Allotment of shares held in abeyance 25,587 0.00* - - Balance as at March 31 50,85,02,291 101.70 50,84,76,704 101.70
(h) The entitlements to 4,94,618 Ordinary shares of R2 each (as at March 31, 2016 : 6,39,444 Ordinary shares of R2 each and as at April 1, 2015 : 4,85,165 Ordinary shares of R2 each) and 2,33,819 ‘A’ Ordinary shares of R2 each (as at March 31, 2016: 2,59,406 ‘A’ Ordinary shares of R2 each and as at April 1, 2015: 2,38,875 ‘A’ Ordinary shares of R2 each) are subject matter of various suits filed in the courts/forums by third parties for which final order is awaited and hence kept in abeyance.
(i) During the year ended, the Company has allotted 68,180 Ordinary Shares each of R2 each, previously unissued on account of unpaid calls.
* amounts less than R50,000/-

Statutory ReportsCorporate Overview Financial Statements
F-108
(Consolidated)
72nd Annual Report 2016-17
NOTES FORMING PART OF CONSOLIDATED FINANCIAL STATEMENTS(j) Rights, preferences and restrictions attached to shares : (i) Ordinary shares and ‘A’ Ordinary shares, both of ₹ 2 each : The Company has two classes of shares – the Ordinary shares and the ‘A’ Ordinary shares both of R2 each (together referred to as shares). In respect of every Ordinary
share (whether fully or partly paid), voting rights shall be in the same proportion as the capital paid up on such Ordinary share bears to the total paid up Ordinary share capital of the Company. In case of every ‘A’ Ordinary share, if any resolution is put to vote on a poll or by postal ballot at any general meeting of shareholders, the holder shall be entitled to one vote for every ten ‘A’ Ordinary shares held as per the terms of its issue and if a resolution is put to vote on a show of hands, the holder of ‘A’ Ordinary shares shall be entitled to the same number of votes as available to holders of Ordinary shares.
The dividend proposed by the Board of Directors is subject to the approval of the shareholders in the ensuing Annual General Meeting. Further, the Board of Directors may also declare an interim dividend. The holders of ‘A’ Ordinary shares shall be entitled to receive dividend for each financial year at five percentage point more than the aggregate rate of dividend declared on Ordinary shares for that financial year.
In the event of liquidation, the shareholders are eligible to receive the remaining assets of the Company after distribution of all preferential amounts, in proportion to their shareholdings.
(ii) American Depository Shares (ADSs) and Global Depository Shares (GDSs) : Each ADS and GDS underlying the ADR and GDR respectively represents five Ordinary shares of R2 each. A holder of ADS and GDS is not entitled to attend or vote
at shareholders meetings. An ADS holder is entitled to issue voting instructions to the depository with respect to the Ordinary shares represented by ADSs only in accordance with the provisions of the Company’s ADSs deposit agreement and Indian Law. The depository for the ADSs and GDSs shall exercise voting rights in respect of the deposited shares by issue of an appropriate proxy or power of attorney in terms of the respective deposit agreements.
Shares issued upon conversion of ADSs and GDSs will rank pari passu with the existing Ordinary shares of R2 each in all respects including entitlement of the dividend declared.
(k) Number of shares held by each shareholder holding more than 5 percent of the issued share capital :
As at March 31, 2017 As at March 31, 2016 As at April 1, 2015
% of Issued share capital
No. of shares % of Issued share capital
No. of shares % of Issued share capital
No. of shares
(i) Ordinary shares :
(a) Tata Sons Limited 28.71% 82,89,70,378 26.98% 77,89,70,378 25.67% 70,23,33,345
(b) Tata Steel Limited * * * * 5.54% 15,16,87,515 (c) Life Insurance Corporation of India 5.18% 14,94,23,428 6.90% 19,91,44,257 * *(d) Citibank N.A. as Depository # 53,04,96,280 # 49,19,64,200 # 58,22,60,190
(ii) ‘A’ Ordinary shares :(a) HDFC Trustee Company Limited-HDFC Equity Fund 8.19% 4,16,71,282 12.95% 6,58,38,405 * *(b) HSBC Global Investment Funds A/C HSBC Global Investment
Funds Mauritius Ltd * * * * 5.16% 2,48,78,664 (c) Franklin Templeton Mutual Fund 5.96% 3,03,29,225 * * * *
# held by Citibank, N.A. as depository for American Depository Receipts (ADRs) and Global Depository Receipts (GDRs)
* Less than 5%
(l) Information regarding issue of shares in the last five years (a) The Company has not issued any shares without payment being received in cash. (b) The Company has not issued any bonus shares. (c) The Company has not undertaken any buy-back of shares.
(m) During the year ended March 31, 2016, the Company alloted 15,04,90,480 Ordinary Shares (including 3,20,49,820 shares underlying the ADRs) of R 2 each at a premium of R448 per share, aggregating R6,772.07 crores and 2,65,09,759 ‘A’ Ordinary Shares of R 2 each at a premium of R 269 per share, aggregating R 718.42 crores pursuant to the Rights issue. 1,54,279 Ordinary Shares and 20,531 ‘A’ Ordinary Shares were kept in abeyance.
Proceeds from the Rights issue have been utilised in the following manner : (R in crores)Particulars Planned Actual
Funding capital expenditure towards plant and machinery 500.00 500.00
Funding expenditure relating to research and product development 1,500.00 1,500.00 Repayment, in full or part, of certain long-term and short-term borrowings availed by the Company 4,000.00 4,000.00 General corporate purposes 1,428.00 1,425.73 Issue related expenses 70.00 64.76 Total 7,498.00 7,490.49 Less : Rights Shares held in abeyance (7.51) - Total 7,490.49 7,490.49

F-109
(` in crores)
22. Other components of equity
(a) The movement of Currency translation reserve is as follows: Year ended March 31,
2017 2016
Balance at the beginning 4,652.20 2,945.89
Exchange differences arising on translating the net assets of foreign operations (net) (9,647.63) 1,677.31
Net change in translation reserve - equity accounted investees (net) (304.70) 29.00
Balance at the end (5,300.13) 4,652.20
(b) The movement of Equity instruments through other comprehensive income is as follows:
Year ended March 31,
2017 2016
Balance at the beginning (102.70) (91.12)
Other comprehensive income/(loss) for the year 83.44 68.80
Profit on sale of unquoted equity investment - (80.38)
Balance at the end (19.26) (102.70)
Year ended March 31,
2017 2016
(c) The movement of Hedging reserve is as follows:
Balance at the beginning (6,152.15) (5,278.28)
Gain/(loss) recognised on cash flow hedges (23,738.38) (1,581.01)
Income tax relating to gain/loss recognized on cash flow hedges 4,558.18 273.69
(Gain)/loss reclassified to profit or loss 10,296.01 (1,365.57)
Income tax relating to gain/loss reclassified to profit or loss (2,059.16) 277.05
Amounts removed from hedge reserve and recognised in inventory (1,020.39) 1,902.67
Income tax related to amounts removed from hedge reserve and recognised in inventory 204.26 (380.70)
Balance at the end (17,911.63) (6,152.15)
(d) The movement of Cost of Hedging reserve is as follows: Year ended March 31,
2017 2016
Balance at the beginning 4.70 -
Gain/(loss) on cash flow hedges of inventory (106.02) 5.00
Gain/(loss) recognised on cash flow hedges of forecast sales 9.50 (0.30)
Income tax relating to gain/loss recognized on cash flow hedges 17.60 -
Balance at the end (74.22) 4.70
(e) Summary of Other Components of Equity: As at March 31,
2017 2016
Currency translation reserve (5,300.13) 4,652.20
Equity instruments through other comprehensive income (19.26) (102.70)
Hedging reserve (17,911.63) (6,152.15)
Cost of hedging reserve (74.22) 4.70
Total (23,305.24) (1,597.95)
NOTES FORMING PART OF CONSOLIDATED FINANCIAL STATEMENTS

Statutory ReportsCorporate Overview Financial Statements
F-110
(Consolidated)
72nd Annual Report 2016-17
23. Notes to reserves and dividends
Capital redemption reserve
The Indian Companies Act, 2013 (the “Companies Act”) requires that where a company purchases its own shares out of free reserves or securities premium account, a sum equal to the nominal value of the shares so purchased shall be transferred to a capital redemption reserve account and details of such transfer shall be disclosed in the balance sheet. The capital redemption reserve account may be applied by the company, in paying up unissued shares of the company to be issued to shareholders of the company as fully paid bonus shares. Tata Motors Limited established this reserve pursuant to the redemption of preference shares issued in earlier years.
Debenture redemption reserve
The Companies Act requires that where a company issues debentures, it shall create a debenture redemption reserve out of profits of the company available for payment of dividend. The company is required to maintain a Debenture Redemption Reserve of 25% of the value of debentures issued, either by a public issue or on a private placement basis. The amounts credited to the debenture redemption reserve may not be utilized by the company except to redeem debentures.
Reserve for research and human resource development
In terms of Article 9 of the Act on Special Taxation Restriction in Korea, Tata Daewoo Commercial Vehicle Company Limited (TDCV, a subsidiary of Tata Motors Limited) is entitled for deferment of tax in respect of expenditures incurred on product development cost subject to fulfillment of certain conditions, by way of deduction from the taxable income, provided that TDCV appropriates an equivalent amount from “Retained Earnings” to “Reserve for Research and Human Resource Development”.
The deferment is for a period of three years and from the fourth year onwards one-third of the reserve is offered to tax and an equal amount is then transferred from the reserve to “Retained earnings available for appropriation”.
Special reserve
The special reserve represents the reserve created by two subsidiaries of Tata Motors Limited pursuant to the Reserve Bank of India Act, 1934 (the “RBI Act”) and related regulations applicable to those companies. Under the RBI Act, a non-banking finance company is required to transfer an amount not less than 20% of its net profit to a reserve fund before declaring any dividend. Appropriation from this reserve fund is permitted only for the purposes specified by the RBI.
Earned surplus reserve
Under the Korean commercial code, TDCV is required to appropriate at least 10% of cash dividend declared each year to a legal reserve until such reserves equal to 50% of capital stock. This reserve may not be utilized for cash dividends, but may only be used to offset against future deficits, if any, or may be transferred to capital stock.
Capital reserve
The capital reserve represents the excess of the Company’s interest in the net fair value of the acquiree’s identifiable assets, liabilities and contingent liabilities over the purchase consideration.
Dividends
The final dividend is recommended by the Board of Directors and is recorded in the books of account upon its approval by the shareholders. For the year ended March 31, 2016, dividend per share of R0.20 per Ordinary share of R2 each and R0.30 per ‘A’ Ordinary share of R2 each was declared.
For the year ended March 31, 2017, considering the losses in the Tata Motors Limited (Standalone), no dividend is permitted to be paid to the Members, as per the Companies Act, 2013 and the Rules framed thereunder.
NOTES FORMING PART OF CONSOLIDATED FINANCIAL STATEMENTS

F-111
(` in crores)
24. Long-term borrowings As at March 31, As at March 31, As at April 1,
2017 2016 2015
Secured:
(a) Privately placed Non-Convertible Debentures 3,045.24 2,305.16 2,489.41
(b) Collateralized debt obligations 453.99 2.72 107.76
(c) Term loans:
(i) from banks 4,062.68 3,169.30 4,453.92
(ii) other parties 141.84 120.14 93.55
(d) Finance lease obligations 54.01 69.04 90.75
Unsecured:
(a) Privately placed Non-Convertible Debentures 8,668.80 6,455.20 8,505.20
(b) Term loans:
(i) from banks 9,475.88 8,347.23 8,588.17
(ii) other parties 54.12 54.82 182.15
(c) Senior notes (note below) 34,227.81 29,541.97 30,085.42
(d) Others 444.81 444.81 10.81
Total 60,629.18 50,510.39 54,607.14
25. Short-term borrowings As at March 31, As at March 31, As at April 1,
2017 2016 2015
Secured:
(a) Loans from banks 4,795.01 5,612.53 6,544.91
(b) Loans from other parties 79.77 98.22 77.06
Unsecured:
(a) Loans from banks 733.58 1,047.29 1,460.13
(b) Loans from other parties 15.91 13.78 49.91
(c) Inter corporate deposits from associates 56.00 27.00 60.00
(d) Commercial paper 8,179.67 4,651.96 4,962.67
Total 13,859.94 11,450.78 13,154.68
NOTES FORMING PART OF CONSOLIDATED FINANCIAL STATEMENTS

Statutory ReportsCorporate Overview Financial Statements
F-112
(Consolidated)
72nd Annual Report 2016-17
CollateralsInventory, trade receivables, finance receivables, other financial assets, property, plant and equipment with a carrying amount of R17,105.18 crores, R17,750.01 crores and R21,056.59 crores are pledged as collateral/security against the borrowing as at March 31, 2017, 2016 and April 1, 2015 respectively.
Notes : Nature of Security (on loans including interest accrued thereon) :(A) Non convertible debentures (i) Rated, Listed, Secured, 9.95% Coupon, Non-Convertible Debentures amounting to R200 crores and 10.25% Coupon, Non-Convertible Debentures amounting to R500 crores are secured by a pari passu charge by way of an English mortgage of the Company’s freehold land together with immovable properties, plant and machinery and other movable assets (excluding stock and book debts) situated at Sanand in the State of Gujarat. (ii) Privately placed non-convertible debentures amounting to R2,345.24 crores are fully secured by : (a) First pari passu charge on residential flat of Sheba Properties Limited (SPL), an indirect subsidiary of the Company (b) Pari passu charge is created in favour of debenture trustee on : - All receivables of SPL arising out of loan and lease transactions, - All book debts, trade advances forming part of movable property of SPL. (c) Any other security as identified by SPL and acceptable to the debenture trustee.(B) Collateralized debt obligations Collateralised debt obligation represent amount received against finance receivables securitised/assigned, which does not qualify for derecognition. (C) Loan from banks/financial institution (i) Term loans from banks amounting to R2,750 crores are secured by a pari passu charge in favour of the security trustee on all receivables of the Company arising out
of loan, lease and hire purchase transactions, all other book debts, receivables from senior and junior pass-through-certificates in which Company has invested; and such other current assets as may be identified by the Company from time to time and accepted by the relevant lender/security trustee.
(ii) The term loan of R581 crores is due for repayment from the quarter ending March 31, 2033 to quarter ending March 31, 2037, along with simple interest at the rate of 0.10% p.a. The loan is secured by a second and subservient charge (creation of charge is under process) over Company’s freehold land together with immovable properties, plant and machinery and other movable assets (excluding stock and book debts) situated at Sanand plant in the State of Gujarat.
(iii) Loans from Banks and External Commercial Borrowings (ECB) are secured by exclusive first charge on building and all moveable fixed assets and also by hypothecation of existing current assets of the Company viz. stock of raw materials, stock in process, semi-finished goods, stores and spares not relating to plant and machinery (consumable stores and spares), bills receivable and book debts including receivable from hire purchase / leasing and all other moveable current assets except cash and bank balances, loans and advances of the Company both present and future.
(D) Senior notes (Euro MTF listed debt) The senior notes of Jaguar Land Rover Automotive Plc (JLR) are listed on the Euro MTF market, which is a listed market regulated by the Luxembourg Stock Exchange.
Details of the tranches of the senior notes outstanding at March 31, 2017 are as follows: (` in crores)
Schedule of repayment of Senior notes : Amount As at March 31, As at March 31, As at April 1,Currency (in million) 2017 2016 2015
5.625% Senior Notes due 2023 USD 500 3,209.63 3,291.85 3,093.63
3.875% Senior Notes due 2023 GBP 400 3,210.84 3,781.40 3,660.02
5.000% Senior Notes due 2022 GBP 400 3,202.76 3,784.60 3,662.96
8.125% Senior Notes due 2021 USD 84 - 550.32 517.07
8.25% Senior Notes due 2020 GBP 58 - - 534.98
3.50% Senior Notes due 2020 USD 500 3,229.86 3,298.02 3,093.06
4.125% Senior Notes due 2018 USD 700 4,518.52 4,647.45 4,357.61
4.25% Senior Notes due 2019 USD 500 3,231.48 3,300.66 3,101.33
2.750% Senior Notes due 2021 GBP 300 2,406.52 - -
2.200% Senior Notes due 2024 EUR 650 4,466.88 - -
27,476.49 22,654.30 22,020.66
Senior notes (SGX-ST listed debt)
The senior notes of Tata Motors Limited and TML Holdings Pte Ltd are listed on the SGX-ST market, which is a listed market regulated by the Singapore Stock Exchange.
Details of the tranches of the senior notes outstanding at March 31, 2017 are as follows:
Schedule of repayment of Senior notes : Amount As at March 31, As at March 31, As at April 1,Currency (in million) 2017 2016 2015
5.750% Senior Notes due 2024 USD 250 1,595.81 1,641.25 1,544.97
5.75% Senior Notes due 2021 USD 300 1,924.98 1,963.91 1,855.71
4.625% Senior Notes due 2020 USD 500 3,230.53 3,282.51 3,089.94
4.25% Senior Notes due 2018 SGD 350 - - 1,574.14
6,751.32 6,887.67 8,064.76
NOTES FORMING PART OF CONSOLIDATED FINANCIAL STATEMENTS

F-113
(` in crores)
26. Other financial liabilities – non-current As at March 31, As at March 31, As at April 1,
2017 2016 2015
(a) Deferred payment liability - 70.08 126.41
(b) Derivative financial instruments 11,259.57 7,744.11 7,721.94
(c) Interest accrued but not due on borrowings - 4.65 25.76
(d) Liability towards employee separation scheme 72.36 77.72 89.42
(e) Others 77.65 47.18 31.32
Total 11,409.58 7,943.74 7,994.85
27. Other financial liabilities – currentAs at March 31, As at March 31, As at April 1,
2017 2016 2015
(a) Current maturities of long-term borrowings (refer note below) 4,114.86 7,398.79 4,949.04
(b) Interest accrued but not due on borrowings 943.24 965.75 1,003.77
(c) Liability towards vehicles sold under repurchase arrangements 2,828.38 2,550.44 1,820.60
(d) Liability for capital expenditure 3,120.40 3,503.13 4,605.24
(e) Deposits and retention money 201.50 219.11 211.21
(f ) Derivative financial instruments 14,257.95 6,482.30 6,445.95
(g) Deferred payment liability 70.08 64.50 59.75
(h) Liability towards Investors Education and Protection Fund
under Section 205C of the Companies Act, 1956 (IEPF) not due 27.75 33.19 40.50
(i) Others 70.67 64.39 36.95
Total 25,634.83 21,281.60 19,173.01
Notes:
Current maturities of long-term borrowings consist of :
(i) Privately placed Non-Convertible Debentures 2,802.30 2,371.37 1,778.16
(ii) Collateralised debt obligation 573.39 37.34 509.04
(iii) Finance lease obligation 22.13 57.22 57.18
(iv) Term loans from banks and others 717.04 4,932.86 2,604.66
4,114.86 7,398.79 4,949.04
NOTES FORMING PART OF CONSOLIDATED FINANCIAL STATEMENTS

Statutory ReportsCorporate Overview Financial Statements
F-114
(Consolidated)
72nd Annual Report 2016-17
(R in crores)
28. ProvisionsAs at March 31,
2017As at March 31,
2016As at April 1,
2015Non-current(a) Employee benefits obligations 732.97 735.52 881.17 (b) Product warranty 7,360.69 6,797.36 5,605.16 (c) Legal and product liability 217.02 - - (d) Provision for residual risk 219.07 123.42 142.55 (e) Provision for environmental liability 178.00 222.15 244.88 (f ) Annual maintenance contract 16.66 9.99 12.57
(g) Other provisions 280.05 2.57 51.94 Total - Non-current 9,004.46 7,891.01 6,938.27 Current(a) Employee benefits obligations 68.93 219.17 216.76 (b) Product warranty 4,670.64 4,719.07 4,373.28 (c) Legal and product liability 605.15 758.37 274.85 (d) Provision for residual risk 54.80 57.42 42.72 (e) Provision for environmental liability 96.58 68.99 44.18 (f ) Annual maintenance contract 33.73 17.79 16.29 (g) Other provisions 277.93 3.70 1.04 Total - Current 5,807.76 5,844.51 4,969.12
Note
Provision movement Year ended March 31,2017
Product warranty
Legal and product liability
Provision for residual risk
Provision for environmental liability
Balance at the beginning 11,516.43 758.37 180.84 291.14 Provision made/(reversal) during the year 7,758.65 347.72 155.16 29.82 Provision used during the year (5,627.93) (161.30) (44.71) - Impact of discounting 199.10 - - - Impact of foreign exchange translation (1,814.92) (122.62) (17.42) (46.38)Balance at the end 12,031.33 822.17 273.87 274.58
Current 4,670.64 605.15 54.80 96.58
Non-current 7,360.69 217.02 219.07 178.00
29. Other non-current liabilitiesAs at March 31,
2017As at March 31,
2016As at April 1,
2015(a) Deferred revenue (refer note below) 5,161.37 4,092.74 2,570.16(b) Employee benefits obligations 11,984.02 5,547.24 8,255.12(c) Others 247.17 246.57 122.72Total 17,392.56 9,886.55 10,948.00
30. Other current liabilitiesAs at March 31,
2017As at March 31,
2016As at April 1,
2015(a) Liability for advances received 1,711.15 2,164.71 2,289.92
(b) Statutory dues (VAT, Excise, Service Tax, Octroi etc) 2,658.93 2,443.43 1,830.50
(c) Deferred revenue (refer note below) 1,764.98 1,517.14 777.17
(d) Others 266.78 61.94 207.66
Total 6,401.84 6,187.22 5,105.25Note:
Deferred revenue include:
R227.92 crores as at March 31, 2017 (R249.22 crores as at March 31, 2016 and R235.19 crores as at April 1, 2015) grants relating to property, plant and equipment relate to duty saved on import of capital goods and spares under the EPCG scheme. Under such scheme, the Company is committed to export prescribed times of the duty saved on import of capital goods over a specified period of time. In case such commitments are not met, the Company would be required to pay the duty saved along with interest to the regulatory authorities.
R2,047.24 crores as at March 31, 2017 (R1,765.87 crores as at March 31, 2016 and R1,007.69 crores as at April 1, 2015) relating to Research and Development Expenditure Credit (RDEC) on qualifying expenditure incurred since April 1, 2013.
NOTES FORMING PART OF CONSOLIDATED FINANCIAL STATEMENTS

F-115
(R in crores)
31. Income from Operations Year ended March 31,
2017 2016(a) Sale of products (including excise duty) (Note below) 2,67,071.80 2,70,642.65
(b) Sale of services 1,727.27 1,292.42
(c) Finance revenues 2,429.23 2,240.03
(d) Other operating revenues 3,263.82 3,485.49
Total 2,74,492.12 2,77,660.59
32. Other income Year ended March 31,
2017 2016(a) Interest income 562.21 718.98
(b) Dividend income 10.51 53.36
(c) Profit on sale of investments at FVTPL 176.14 101.00
(d) MTM-Investments measured at FVTPL 5.68 12.01
Total 754.54 885.35
Note: Includes exchange gain/(loss) (net) on hedges reclassified from hedging reserve to statement of profit and loss (9,928.70) 1,365.57
NOTES FORMING PART OF CONSOLIDATED FINANCIAL STATEMENTS

Statutory ReportsCorporate Overview Financial Statements
F-116
(Consolidated)
72nd Annual Report 2016-17
(R in crores)
33. Employee benefits expenseYear ended March 31,
2017 2016
(a) Salaries, wages and bonus 22,409.51 22,273.90
(b) Contribution to provident fund and other funds 2,826.23 3,412.72
(c) Staff welfare expenses 3,097.15 3,194.27
Total 28,332.89 28,880.89
A subsidiary of the Company operates a Long Term Incentive Plan (LTIP) arrangement for certain employees. The scheme provides a cash payment to the employee based on a specific number of phantom shares at grant and the share price of Tata Motors Limited at the vesting date. The cash payment is dependent upon continued employment for the duration of the 3 year vesting period. The cash payment has no exercise price and therefore the weighted average exercise price in all cases is R Nil. The fair value of the awards is calculated using a Black-Scholes model at the grant date. The fair value is updated at each reporting date as the awards are accounted for as cash-settled plan. The inputs into the model are based on the Tata Motors Limited historic data, the risk-free rate and the weighted average fair value of shares, in the scheme at the reporting date. The amount expensed in relation to the LTIP was R70.13 crores and R29.59 crores for the years ended March 31, 2017 and 2016, respectively. The Company considers these amounts as not material and accordingly has not provided further disclosures.
34. Finance costsYear ended March 31,
2017 2016
(a) Interest 4,778.68 5,281.50
Less: Transferred to capital account* (1,294.10) (1,161.39)
3,484.58 4,120.11
(b) Discounting charges 753.43 768.97
Total 4,238.01 4,889.08
Represents borrowing costs capitalized during the year on qualifying assets (property plant and equipment and product development).
The weighted average rate for capitalization of interest relating to general borrowings was approximately 4.4% and 6.3% for the years ended March 31, 2017 and 2016, respectively.
35. Other expenses Year ended March 31,
2017 2016
(a) Processing charges 1,172.03 1,110.68
(b) Consumption of stores & spare parts 2,419.11 2,096.19
(c) Power and fuel 1,159.82 1,143.63
(d) Information technology/computer expenses 2,202.51 2,379.90
(e) Engineering expenses 4,273.72 6,514.76
(f ) MTM gain/(loss) on commodity derivatives 918.40 (1,155.53)
(g) Warranty and product liability expenses 8,106.37 6,791.49
(h) Freight, transportation, port charges etc. 9,754.71 9,754.67
(i) Publicity 8,698.68 8,768.46
(j) Allowances for trade and other receivables 132.93 664.66
(k) Allowances for finance receivables (28.15) 220.96
(l) Works operation and other expenses 16,619.93 17,393.88
Total 55,430.06 55,683.75
NOTES FORMING PART OF CONSOLIDATED FINANCIAL STATEMENTS

F-117
36. Employee benefitsDefined Benefit PlanPension and post retirement medical plans
The following table sets out the funded and unfunded status and the amounts recognized in the financial statements for the pension and the post retirement medical plans in respect of Tata Motors, its Indian subsidiaries and joint operations:
(₹ in crores)
Pension benefits Post retirement medical benefits
As at March 31,2017 2016 2017 2016
Change in defined benefit obligations :Defined benefit obligation, beginning of the year 923.86 901.81 160.05 155.66
Current service cost 65.71 64.26 8.19 7.68 Interest cost 69.51 66.96 12.33 12.18 Remeasurements (gains)/losses
Actuarial (gains)/losses arising from changes in demographic assumptions (0.96) 1.46 2.17 - Actuarial (gains)/losses arising from changes in financial assumptions 16.01 3.87 21.82 7.84 Actuarial (gains)/losses arising from changes in experience adjustments (6.50) 6.17 (10.46) (16.53)
Benefits paid from plan assets (77.89) (114.91) - - Benefits paid directly by employer (8.98) (5.76) (10.24) (6.78)Defined benefit obligation, end of the year 980.76 923.86 183.86 160.05
Change in plan assets:Fair value of plan assets, beginning of the year 799.69 789.13 - - Interest income 60.05 60.10 - - Remeasurements gains/(losses)
Return on plan assets, (excluding amount included in net Interest expense) 26.41 20.34 - - Employer’s contributions 33.52 45.03 - - Benefits paid (77.89) (114.91) - - Fair value of plan assets, end of the year 841.78 799.69 - -
Pension benefits Post retirement medical benefitsAs at March 31, As at April 1, As at March 31, As at April 1,
2017 2016 2015 2017 2016 2015Amount recognized in the balance sheet consists of:Present value of defined benefit obligation 980.76 923.86 901.81 183.86 160.05 155.66 Fair value of plan assets 841.78 799.69 789.13 - - - Net liability (138.98) (124.17) (112.68) (183.86) (160.05) (155.66)
Amounts in the balance sheet:Non–current assets 6.55 4.91 10.85 - - - Non–current liabilities (145.53) (129.08) (123.53) (183.86) (160.05) (155.66)Net liability (138.98) (124.17) (112.68) (183.86) (160.05) (155.66)
Total amount recognized in other comprehensive income consists of:Pension benefits Post retirement medical benefits
As at March 31,2017 2016 2017 2016
Remeasurements (gains)/losses (26.70) (8.84) 4.84 (8.69)
(26.70) (8.84) 4.84 (8.69)
NOTES FORMING PART OF CONSOLIDATED FINANCIAL STATEMENTS

Statutory ReportsCorporate Overview Financial Statements
F-118
(Consolidated)
72nd Annual Report 2016-17
Information for funded plans with a defined benefit obligation in excess of plan assets:(₹ in crores)
Pension benefitsAs at March 31, As at April 1,
2017 2016 2015Defined benefit obligation 795.37 754.99 733.59 Fair value of plan assets 757.55 729.55 705.75
Information for funded plans with a defined benefit obligation less than plan assets:Pension benefits
As at March 31, As at April 1,2017 2016 2015
Defined benefit obligation 77.69 65.27 72.54 Fair value of plan assets 84.23 70.14 83.38
NOTES FORMING PART OF CONSOLIDATED FINANCIAL STATEMENTS
Information for unfunded plans:Pension benefits Post retirement medical benefitsAs at March 31, As at April 1, As at March 31, As at April 1,
2017 2016 2015 2017 2016 2015Defined benefit obligation 107.70 103.60 95.68 183.86 160.05 155.66
Net pension and post retirement medical cost consist of the following components:Pension benefits Post retirement medical benefits
Year ended March 31,2017 2016 2017 2016
Service cost 65.71 64.26 8.19 7.68 Net interest cost/(income) 9.46 6.86 12.33 12.18 Net periodic cost 75.17 71.12 20.52 19.86
Other changes in plan assets and benefit obligation recognized in other comprehensive income :Pension benefits Post retirement medical benefits
Year ended March 31,2017 2016 2017 2016
RemeasurementsReturn on plan assets, (excluding amount included in net Interest expense) (26.41) (20.34) - - Actuarial (gains)/losses arising from changes in demographic assumptions (0.96) 1.46 2.17 - Actuarial (gains)/losses arising from changes in financial assumptions 16.01 3.87 21.82 7.84 Actuarial (gains)/losses arising from changes in experience adjustments on plan liabilities
(6.50) 6.17 (10.46) (16.53)
Total recognized in other comprehensive income (17.86) (8.84) 13.53 (8.69)Total recognized in Statement of Profit and Loss and other comprehensive income 57.31 62.28 34.05 11.17

F-119
NOTES FORMING PART OF CONSOLIDATED FINANCIAL STATEMENTS
The assumptions used in accounting for the pension and post retirement medical plans are set out below: Pension benefits Post retirement medical
benefitsAs at March 31, As at April 1, As at March 31, As at April 1,
2017 2016 2015 2017 2016 2015Discount rate 6.75%-7.50% 6.75%-8.00% 6.75%-8.00% 7.30% 8.00% 8.00%Rate of increase in compensation level of covered employees 4.00% -11.00% 5.00% - 12.00% 5.00% - 11.00% NA NA NAIncrease in health care cost NA NA NA 6.00% 6.00% 6.00%
Plan AssetsThe fair value of Company’s pension plan asset as at March 31, 2017, 2016 and April 1, 2015 by category are as follows:
Pension benefitsAs at March 31, As at April 1,
2017 2016 2015Asset category: 1% 2% 6%Cash and cash equivalents 72% 77% 67%Debt instruments (quoted) 5% 1% 6%Debt instruments (unquoted) 1% 1% 0%Equity instruments (quoted) 21% 19% 21%Deposits with Insurance companies 100% 100% 100%
The Company’s policy is driven by considerations of maximizing returns while ensuring credit quality of the debt instruments. The asset allocation for plan assets is determined based on investment criteria prescribed under the Indian Income Tax Act, 1961, and is also subject to other exposure limitations. The Company evaluates the risks, transaction costs and liquidity for potential investments. To measure plan asset performance, the Company compares actual returns for each asset category with published benchmarks.
The weighted average duration of the defined benefit obligation as at March 31, 2017 is 16.06 years (2016 : 15.64 years, 2015 : 16.01 years).
The Company expects to contribute R70.92 crores to the funded pension plans in FY 2017-18.The table below outlines the effect on the service cost, the interest cost and the defined benefit obligation in the event of a decrease/increase of 1% in the assumed rate of discount rate, salary escalation and health care cost:
Assumption Change in assumption Impact on defined benefit obligation Impact on service cost and interest costDiscount rate Increase by 1% Decrease by R93.84 crores Decrease by R20.65 crores
Decrease by 1% Increase by R108.63 crores Increase by R22.14 crores
Salary escalation rate Increase by 1% Increase by R77.45 crores Increase by R19.40 croresDecrease by 1% Decrease by R68.09 crores Decrease by R16.76 crores
Health care cost Increase by 1% Increase by R24.91 crores Increase by R6.02 croresDecrease by 1% Decrease by R22.01 crores Decrease by R4.96 crores

Statutory ReportsCorporate Overview Financial Statements
F-120
(Consolidated)
72nd Annual Report 2016-17
Severance indemnity plan Severance indemnity is a funded plan of Tata Daewoo Commercial Vehicles Limited (TDCV), a subsidiary of Tata Motors Limited.The following table sets out, the amounts recognized in the financial statements for the severance indemnity plan.
(₹ in crores)As at March 31,
2017 2016Change in defined benefit obligation:Defined benefit obligation, beginning of the year 333.92 330.72 Service cost 48.62 55.53 Interest cost 6.34 7.61 Remeasurements (gains)/losses
Actuarial (gains)/losses arising from changes in financial assumptions (15.65) (65.32)Actuarial (gains)/losses arising from changes in experience adjustments on plan liabilities (19.53) (4.09)Actuarial (gains)/losses arising from changes in demographic assumption on plan liabilities - 3.31
Benefits paid from plan assets (4.26) (2.11)Benefits paid directly by employer (1.35) (1.20)Foreign currency translation 0.17 9.47 Defined benefit obligation, end of the year 348.26 333.92 Change in plan assets:Fair value of plan assets, beginning of the year 261.76 202.51 Interest income 5.58 5.24 Remeasurements gain/(loss)
Return on plan assets, (excluding amount included in net Interest expense) (2.54) (1.93)Employer’s contributions 64.64 50.95 Benefits paid (4.68) (2.11)Foreign currency translation (0.23) 7.10 Fair value of plan assets, end of the year 324.53 261.76
As at March 31, As at April 1,2017 2016 2015
Amount recognized in the balance sheet consist of:Present value of defined benefit obligation 348.26 333.92 330.72 Fair value of plan assets 324.53 261.76 202.51 Net liability (23.73) (72.16) (128.21)Amounts in the balance sheet:Non- current liabilities (23.73) (72.16) (128.21)
Total amount recognized in other comprehensive income for severance indemnity consists of:As at March 31,
2017 2016Remeasurements (gains)/losses (96.81) (64.17)
(96.81) (64.17)
NOTES FORMING PART OF CONSOLIDATED FINANCIAL STATEMENTS

F-121
Net severance indemnity cost consist of the following components: (₹ in crores)
Year ended March 31,2017 2016
Service cost 48.62 55.53
Net interest cost 0.76 2.37
Net periodic pension cost 49.38 57.90
Other changes in plan assets and benefit obligation recognized in other comprehensive income for severance indemnity plan:Year ended March 31,
2017 2016
Remeasurements (gains)/losses
Return on plan assets, (excluding amount included in net Interest expense) 2.54 1.93
Actuarial (gains) / losses arising from changes in financial assumptions (15.65) (65.32)
Actuarial (gains) / losses arising from changes in experience adjustments on plan liabilities (19.53) (4.09)
Actuarial (gains) / losses arising from changes in demographic assumptions - 3.31
Total recognized in other comprehensive income (32.64) (64.17)
Total recognized in Statement of Profit and Loss and other comprehensive income 16.74 (6.27)
The assumptions used in accounting for the Severance indemnity plan is set out below:As at March 31, As at April 1,
2017 2016 2015
Discount rate 2.30% 1.90% 2.30%Rate of increase in compensation level of covered employees 3.00% 3.00% 5.00%
The table below outlines the effect on the service cost, the interest cost and the defined benefit obligation in the event of a decrease/increase of 1% in the assumed rate of discount rate, salary escalation rate:
Assumption Change in assumption Impact on scheme liabilities Impact on service cost and interest costDiscount rate Increase by 1% Decrease by R34.81 crores Decrease by R10.58 crores
Decrease by 1% Increase by R40.81 crores Increase by R11.75 crores
Salary escalation rate Increase by 1% Increase by R40.10 crores Increase by R12.57 croresDecrease by 1% Decrease by R34.91 crores Decrease by R10.78 crores
Severance indemnity plans asset allocation by category is as follows:As at March 31, As at April 1,
2017 2016 2015
Deposit with banks 100% 100% 100%
The weighted average duration of the defined benefit obligation as at March 31, 2017 is 10.85 years (2016 : 11.80 years, 2015 : 12.60 years )The Company expects to contribute R22.03 crores to the funded severance indemnity plans in FY 2017-18
NOTES FORMING PART OF CONSOLIDATED FINANCIAL STATEMENTS

Statutory ReportsCorporate Overview Financial Statements
F-122
(Consolidated)
72nd Annual Report 2016-17
The following table sets out the disclosure pertaining to employee benefits of Jaguar Land Rover Limited
(₹ in crores)Pension benefitsAs at March 31,
2017 2016Change in defined benefit obligation:
Defined benefit obligation, beginning of the year 73,179.07 72,869.15 Service cost 1,735.73 2,212.58 Interest cost 2,410.74 2,589.71 Remeasurements (gains)/losses
Actuarial (gains)/losses arising from changes in demographic assumptions (666.24) (356.02)Actuarial (gains)/losses arising from changes in financial assumptions 20,469.33 (5,614.53)Actuarial (gains)/losses arising from changes in experience adjustments on plan liabilities (1,867.22) 625.26
Past service cost - 1.38 Plan curtailment - -
Plan settlement - -
Plan combinations - -
Benefits paid (1,972.42) (1,629.23)Member contributions 17.53 16.37 Foreign currency translation (12,638.83) 2,464.40 Defined benefit obligation, end of the year 80,667.69 73,179.07
Change in plan assets:Fair value of plan assets, beginning of the year 67,803.30 64,689.55
Interest Income 2,261.71 2,299.76 Remeasurements gains/(losses)
Return on plan assets, (excluding amount included in net Interest expense) 10,072.49 (507.90)
Plan settlement - Employer’s contributions 1,989.95 885.82 Members contributions 17.53 16.37 Plan settlement - - Benefits paid (1,972.42) (1,629.23)
Expenses paid (78.90) (82.45)Foreign currency translation (11,248.17) 2,131.38 Fair value of plan assets, end of the year 68,845.49 67,803.30
Jaguar Land Rover Pension planJaguar Land Rover Ltd UK, has pension arrangements providing employees with defined benefits related to pay and service as set out in the rules of each fund. The UK defined benefit schemes are administered by a separate fund that is legally separated from the Company. The trustees of the pension schemes are required by law to act in the interest of the fund and of all relevant stakeholders in the scheme and are responsible for the investment policy with regard to the assets of the schemes and all other governance matters. The board of trustees must be composed of representatives of the Company and plan participants in accordance with the plan’s regulations. Through its defined benefit pension plans the Company is exposed to a number of risks, the most significant of which are detailed below :
Asset volatility The plan liabilities are calculated using a discount rate set with references to corporate bond yields; if plan assets under perform compared to the corporate bonds discount rate, this will create or increase a deficit. The defined benefit plans hold a significant proportion of equity type assets, which are expected to outperform corporate bonds in the long-term while providing volatility and risk in the short-term. As the plans mature, the Company intends to reduce the level of investment risk by investing more in assets that better match the liabilities. However, the Company believes that due to the long-term nature of the plan liabilities and the strength of the supporting group, a level of continuing equity type investments is an appropriate element of the Company’s long term strategy to manage the plans efficiently.
Changes in bond yields A decrease in corporate bond yields will increase plan liabilities, although this is expected to be partially offset by an increase in the value of the plans’ bond holdings and interest rate hedging instruments.
Inflation risk Some of the Company’s pension obligations are linked to inflation, and higher inflation will lead to higher liabilities (although, in most cases, caps on the level of inflationary increases are in place to protect the plan against extreme inflation). The plans hold a significant proportion of assets in index linked gilts, together with other inflation hedging instruments and also assets which are more closely correlated with inflation. However an increase in inflation will also increase the deficit to some degree.
Life expectancy The majority of the plan’s obligations are to provide benefits for the life of the member, so increases in life expectancy will result in an increase in the plan’s liabilities. This is particularly significant in the UK defined benefit plans, where inflationary increases result in higher sensitivity to changes in life expectancy.
NOTES FORMING PART OF CONSOLIDATED FINANCIAL STATEMENTS

F-123
(₹ in crores)Pension benefits
Year ended March 31, As at April 1,2017 2016 2015
Amount recognized in the balance sheet consist of:Present value of defined benefit obligation 80,667.69 73,179.07 72,869.15
Fair value of plan Assets 68,845.49 67,803.30 64,689.55
Surplus/(deficit) (11,822.20) (5,375.77) (8,179.60)
Restriction of pension asset - (17.18) (3.51)
Net liability (11,822.20) (5,392.95) (8,183.11)
Amount recognized in the balance sheet consist of:Non-current assets 3.81 4.10 3.61
Non-current liabilities (11,826.01) (5,397.04) (8,186.72)
Net liability (11,822.20) (5,392.94) (8,183.11)
Total amount recognized in other comprehensive income: Pension benefitsAs at March 31,
2017 2016
Remeasurements (gains)/losses 3,018.32 (4,827.53)
3,018.32 (4,827.53)
Net pension and post retirement cost consist of the following components:
Pension benefitsYear ended March 31,
2017 2016Current service cost 1,735.73 2,212.58 Past service cost - 1.38 Administrative expenses 78.90 82.45 Interest cost on Onerous obligations - 0.10 Net interest cost/(income) 149.03 289.95 Net periodic pension cost 1,963.66 2,586.46
Amount recognized in other comprehensive incomePension benefits
Year ended March 31,2017 2016
Remeasurements (gains)/lossesActuarial (gains)/losses arising from changes in demographic assumptions (666.24) (356.02)Actuarial (gains)/losses arising from changes in financial assumptions 20,469.33 (5,614.53)Actuarial (gains)/losses arising from changes in experience adjustments on plan liabilities (1,867.22) 625.26 Return on plan assets, (excluding amount included in net Interest expense) (10,072.49) 507.90 Change in onerous obligation, excluding amounts included in interest expenses (17.53) 9.86 Total recognized in other comprehensive income 7,845.85 (4,827.53)
Total recognized in Statement of Profit and Loss and other comprehensive income 9,809.51 (2,241.07)
NOTES FORMING PART OF CONSOLIDATED FINANCIAL STATEMENTS

Statutory ReportsCorporate Overview Financial Statements
F-124
(Consolidated)
72nd Annual Report 2016-17
The assumptions used in accounting for the pension plans are set out below:
Pension benefitsAs at March 31, As at April 1,
2017 2016 2015Discount rate 2.60% 3.60% 3.40%Expected rate of increase in compensation level of covered employees 3.70% 3.50% 3.60%Inflation increase 3.20% 3.00% 3.10%The assumed life expectations on retirement at age 65 are (years)Retiring today :Males 21.50 21.50 21.40 Females 24.50 24.40 23.90
Retiring in 20 years :
Males 23.30 23.20 23.10 Females 26.30 26.20 25.80
For the valuation as at March 31, 2017 and 2016, the mortality assumptions used are the SAPS base table, in particular S2NxA tables and the Light table for members of the Jaguar Executive Pension Plan. A scaling factor of 120% for males and 110% for females has been used for the Jaguar Pension Plan, 115% for males and 105% for females for the Land Rover Pension Scheme and 95% for males and 85% for females for Jaguar Executive Pension Plan. For the valutation as at March 31, 2015, the mortality assumptions used are the SAPS base table, in particular S1NxA tables and the Light table for members of the Jaguar Executive Pension Plan. A scaling factor of 115% has been used for the Jaguar Pension Plan, 110% for the Land Rover Pension Scheme, and 105% for males and 90% for females for Jaguar Executive Pension Plan.There is an allowance for future improvements in line with the CMI (2014) projections and an allowance for long-term improvements of 1.25% per annum (2016,2015: CMI(2014) projections with 1.25% per annum improvements). The Company noted that on March 27, 2017, a new mortality projection model (CMI (2016)) was released which potentially indicated a small reduction in longevity of, on average, 0.5 years compared to current assumptions. The Company considered adopting the new mortality tables and noted that there was uncertainity about the appropriate level of initial mortality improvements both for the general population and when applying the model to other populations. On this basis, following discussion with and recommendation by the Company’s pension advisor, it is considered that the CMI (2014) mortality tables represent the Company’s best estimate of the future longevity of its defined benefit schemes’ members both during and after employment as at March 31, 2017.
NOTES FORMING PART OF CONSOLIDATED FINANCIAL STATEMENTS
Pension plans asset allocation by category is as follows:
(R in crores)
As at March 31, As at April 1,
2017 2016 2015
Quoted* Unquoted Total Quoted* Unquoted Total Quoted* Unquoted Total
Equity Instruments
Information Technology 1,149.04 - 1,149.04 1,193.15 - 1,193.15 1,090.90 - 1,090.90
Energy 493.60 - 493.60 505.90 - 505.90 647.14 - 647.14
Manufacturing 841.55 - 841.55 935.43 - 935.43 887.51 - 887.51
Financials 1,327.06 - 1,327.06 1,699.05 - 1,699.05 1,701.06 - 1,701.06
Others 3,649.43 - 3,649.43 4,174.79 - 4,174.79 3,858.20 - 3,858.20
7,460.68 - 7,460.68 8,508.32 - 8,508.32 8,184.81 - 8,184.81
Debt Instruments
Government 23,709.13 - 23,709.13 24,722.15 - 24,722.15 24,951.95 110.94 25,062.89
Corporate Bonds (Investment Grade) 161.84 16,758.23 16,920.07 1,508.15 13,945.58 15,453.73 351.31 11,075.37 11,426.68
Corporate Bonds (Non Investment Grade) 995.30 3,350.03 4,345.33 1,574.96 2,672.66 4,247.63 499.22 4,400.57 4,899.79
24,866.27 20,108.26 44,974.53 27,805.26 16,618.25 44,423.51 25,802.48 15,586.88 41,389.36
Property Funds
UK - 1,537.45 1,537.45 639.54 1,097.70 1,737.24 1,211.08 1,044.67 2,255.75
Other - 1,262.33 1,262.33 725.44 458.17 1,183.61 480.73 157.17 637.90
- 2,799.78 2,799.78 1,364.98 1,555.87 2,920.85 1,691.81 1,201.84 2,893.65
Cash and Cash equivalents 752.54 - 752.54 1,622.69 - 1,622.69 1,201.83 - 1,201.83

F-125
The assumptions used in accounting for the pension plans are set out below:
Pension benefitsAs at March 31, As at April 1,
2017 2016 2015Discount rate 2.60% 3.60% 3.40%Expected rate of increase in compensation level of covered employees 3.70% 3.50% 3.60%Inflation increase 3.20% 3.00% 3.10%The assumed life expectations on retirement at age 65 are (years)Retiring today :Males 21.50 21.50 21.40 Females 24.50 24.40 23.90
Retiring in 20 years :
Males 23.30 23.20 23.10 Females 26.30 26.20 25.80
For the valuation as at March 31, 2017 and 2016, the mortality assumptions used are the SAPS base table, in particular S2NxA tables and the Light table for members of the Jaguar Executive Pension Plan. A scaling factor of 120% for males and 110% for females has been used for the Jaguar Pension Plan, 115% for males and 105% for females for the Land Rover Pension Scheme and 95% for males and 85% for females for Jaguar Executive Pension Plan. For the valutation as at March 31, 2015, the mortality assumptions used are the SAPS base table, in particular S1NxA tables and the Light table for members of the Jaguar Executive Pension Plan. A scaling factor of 115% has been used for the Jaguar Pension Plan, 110% for the Land Rover Pension Scheme, and 105% for males and 90% for females for Jaguar Executive Pension Plan.There is an allowance for future improvements in line with the CMI (2014) projections and an allowance for long-term improvements of 1.25% per annum (2016,2015: CMI(2014) projections with 1.25% per annum improvements). The Company noted that on March 27, 2017, a new mortality projection model (CMI (2016)) was released which potentially indicated a small reduction in longevity of, on average, 0.5 years compared to current assumptions. The Company considered adopting the new mortality tables and noted that there was uncertainity about the appropriate level of initial mortality improvements both for the general population and when applying the model to other populations. On this basis, following discussion with and recommendation by the Company’s pension advisor, it is considered that the CMI (2014) mortality tables represent the Company’s best estimate of the future longevity of its defined benefit schemes’ members both during and after employment as at March 31, 2017.
NOTES FORMING PART OF CONSOLIDATED FINANCIAL STATEMENTSAs at March 31, As at April 1,
2017 2016 2015
Other
Hedge Funds - 3,261.02 3,261.02 - 3,560.37 3,560.37 - 3,624.00 3,624.00
Private Markets - 1,407.98 1,407.98 - 763.62 763.62 - 517.71 517.71
Alternatives 2,646.04 3,066.81 5,712.85 3,312.19 839.98 4,152.17 1,571.63 1,349.75 2,921.38
2,646.04 7,735.81 10,381.85 3,312.19 5,163.97 8,476.16 1,571.63 5,491.46 7,063.09
Derivatives
Foreign exchange contracts - 137.56 137.56 - (85.91) (85.91) - (120.18) (120.18)
Interest Rate and inflation - 9,159.98 9,159.98 - 5,498.05 5,498.05 - 4,076.99 4,076.99
- 9,297.54 9,297.54 - 5,412.14 5,412.14 - 3,956.81 3,956.81
Collateralized debt obligations - (6,821.43) (6,821.43) - (3,560.37) (3,560.37) - - -
- (6,821.43) (6,821.43) - (3,560.37) (3,560.37) - - -
Total 35,725.53 33,119.96 68,845.49 42,613.44 25,189.86 67,803.30 38,452.56 26,236.99 64,689.55
* determined on the basis of quoted prices for identical assets or liabilities in active markets.
As at March 31, 2017 and 2016, the schemes held Gilt Repos, reflected as a collateralized debt obligation.
The split of Level 1 assets is 66% (2016: 63%, 2015: 59%), Level 2 assets 27% (2016: 31%, 2015: 37%) and Level 3 assets 7% (2016: 6%, 2015: 4%). Private market holdings are classified as Level 3 instruments. Included in the value for Interest Rate and Inflation derivatives are Repo transactions, as noted above.
The sensitivity analysis below is based on a change in an assumption while holding all other assumptions constant. In practice, this is unlikely to occur, and changes in some of the assumptions may be correlated. When calculating the sensitivity of the defined benefit obligation to significant actuarial assumptions the same methods (present value of the defined benefit obligation calculated with the projected unit credit method at the end of the reporting period) has been applied as when calculating the pension liability recognised within the consolidated balance sheet.
Assumption Change in assumption Impact on defined benefit obligation Impact on service cost and interest costDiscount rate Increase/decrease by 0.25% Decrease/increase by R4,474.80 crores Decrease/increase by R113.96 croresInflation rate Increase/decrease by 0.25% Increase/decrease by R3,997.38 crores Increase/decrease by R113.96 croresMortality rate Increase/decrease by 1 year Increase/decrease by R2,314.27 crores Increase/decrease by R61.36 crores
Jaguar Land Rover contributes towards the UK defined benefit schemes. Following the April 5, 2015 valuations, it is intended to eliminate the pension scheme funding deficits over the 10 years following the valuation date. As at March 31, 2017, there is no additional liability; however, following the changes to the defined benfit schemes’ rules in April 2017, an additional obligation may arise in the future. The current agreed contribution rate for defined benefit accrual is 31% of pensionable salaries in the UK. Deficit contribution levels remain in line with prior expectation for 2016-18 and then increase to R508.45 crores per annum to March 2025.
The average duration of the benefit obligation as at March 31, 2017 is 21.60 years (2016: 20.5 years, 2015: 23.5 years).
On April 3, 2017, Jaguar Land Rover Automotive Plc approved and communicated to its Defined Benefit scheme members that the defined benefit scheme rules were to be amended with effect from April 6, 2017 so that, amongst other changes, retirement benefits will be calculated on a career average basis rather than based upon a member’s final salary at retirement. These changes were effective from April 6, 2017 and as a result of the re-measurement of the scheme’s liabilities, a past service credit of approximately GBP 437 million (R3,536.14 crores) has arisen and will be recognised in quarter ended June 30, 2017.
Excluding this past service credit but allowing for the new benefit structure effective April 6, 2017, the expected net periodic pension cost for the year ended March 31, 2018 is R2,182.81 crores. The Company expects to pay R2,647.43 crores to its defined benefit schemes in the year ended March 31, 2018.
DEFINED CONTRIBUTION PLAN
The Company’s contribution to defined contribution plans aggregated R754.95 crores, R676.85 crores for years ended March 31, 2017 and 2016, respectively.
(₹ in crores)

Statutory ReportsCorporate Overview Financial Statements
F-126
(Consolidated)
72nd Annual Report 2016-17
NOTES FORMING PART OF CONSOLIDATED FINANCIAL STATEMENTS37. Commitments and contingencies In the ordinary course of business, the Company faces claims and assertions by various parties. The Company assesses such claims and assertions and monitors the
legal environment on an ongoing basis, with the assistance of external legal counsel, wherever necessary. The Company records a liability for any claims where a potential loss is probable and capable of being estimated and discloses such matters in its financial statements, if material. For potential losses that are considered possible, but not probable, the Company provides disclosure in the financial statements but does not record a liability in its accounts unless the loss becomes probable.
The following is a description of claims and assertions where a potential loss is possible, but not probable. The Company believes that none of the contingencies described below would have a material adverse effect on the Company’s financial condition, results of operations or cash flows.
Litigation The Company is involved in legal proceedings, both as plaintiff and as defendant. There are claims which the Company does not believe to be of material nature,
other than those described below.
Income Tax The Company has ongoing disputes with Income Tax Authorities relating to tax treatment of certain items. These mainly include disallowed expenses, the tax
treatment of certain expenses claimed by the Company as deductions and the computation of, or eligibility of, the Company’s use of certain tax incentives or allowances.
Most of these disputes and/or disallowances, being repetitive in nature, have been raised by the income tax authorities consistently in most of the years.
The Company has a right of appeal to the Commissioner of Income Tax (Appeals), or CIT (A), the Dispute Resolution Panel, or DRP, and to the Income Tax Appellate Tribunal, or ITAT, against adverse decisions by the assessing officer, DRP or CIT (A), as applicable. The income tax authorities have similar rights of appeal to the ITAT against adverse decisions by the CIT (A) or DRP. The Company has a further right of appeal to the High Court of Bombay or Supreme Court against adverse decisions by the appellate authorities for matters involving substantial question of law. The income tax authorities have similar rights of appeal.
As at March 31, 2017, there are matters and/or disputes pending in appeal amounting to R158.61 crores, which includes R2.18 crores in respect of equity accounted investees (R134.08 crores, which includes R7.47 crores in respect of equity accounted investees as at March 31, 2016 and R134.55 crores, which includes R15.70 crores in respect of equity accounted investees as at April 1, 2015).
Customs, Excise Duty and Service Tax
As at March 31, 2017, there was pending litigation for various matters relating to customs, excise duty and service taxes involving demands, including interest and penalties, of R1,464.22 crores, which includes R5.99 crores in respect of equity accounted investees (R1,421.88 crores, which includes R6.63 crores in respect of equity accounted investees, as at March 31, 2016 and R1465.10 crores, which includes R6.14 crores in respect of equity accounted investees, as at April 1, 2015). These demands challenged the basis of valuation of the Company’s products and denied the Company’s claims of Central Value Added Tax, or CENVAT, credit on inputs. The details of the demands for more than R20 crores are as follows:
As at March 31, 2017, the Excise Authorities had denied a CENVAT credit of R29.43 crores and imposed a penalty of RNil for the period between April 2011 to September 2012 (R52.41 crores and a R23.00 crores CENVAT credit and penalty, respectively, as at March 31, 2016 and R52.41 crores and a R23.00 crores CENVAT credit and penalty, respectively, as at April 1, 2015) in respect of consulting engineering services alleged to have been used exclusively for producing prototypes at the Engineering Research Centre, in Pune. The contention of the Excise Authorities is that since the Company claims exemptions from CENVAT under Notification No.167/71-CE, dated September 11, 1971, the Company is not entitled to avail service tax credits on consulting engineering services used in the Engineering Research Centre. The matter is being contested by the Company before the appellate authorities. The Company believes it has a merit in its case, since the consulting engineering services are not exclusively used in the manufacture of prototypes and they form part of the assessable value of final products manufactured by the Company on which CENVAT is paid.
The Excise Authorities have raised a demand for R90.72 crores as at March 31, 2017 (R90.72 crores as at March 31, 2016 and R90.72 crores as at April 1, 2015), on account of alleged undervaluation’s of ex-factory discounts given by Company on passenger vehicles through invoices. The matter is being contested by the Company before the High Court of Bombay.
As at March 31, 2017, the Excise Authorities have raised a demand and penalty of R218.23 crores, (R198.56 crores as at March 31, 2016 and R187.60 crores as at April 1, 2015), due to the classification of certain chassis (as dumpers instead of goods transport vehicles) which were sent to automotive body builders by the Company, which the Excise Authorities claim requires the payment of the National Calamity Contingent Duty, or NCCD. The Company has obtained a technical expert certificate on the classification. The appeal is pending before the Custom Excise & Service Tax Appellate Tribunal.
The Excise Authorities had denied the Company’s claim of a CENVAT credit of R24.96 crores (R22.74 crores as at March 31, 2016 and R83.67 crores as at April 1, 2015) claimed by the Company from Fiscal 1992 to Fiscal 2013, on technical grounds. The matter is being contested by the Company before the appellate authorities.
As at March 31, 2017, the Excise Authorities had levied penalties and interest amounting to R679.88 crores (R679.88 crores as at March 31, 2016 and R679.88 crores as at April 1, 2015) with respect to CENVAT credit claimed by the Company from March 2010 to November 2012, on inputs, stating that vehicles manufactured at Uttarakhand plant are “Exempted Products” and the Company may not claim a CENVAT credit on these vehicles. The Company has challenged this demand as NCCD and the automobile cess is assessed on those vehicles, which are “duties of excise”. Therefore, the Company asserts that these vehicles are not “Exempted Products”. The matter is being contested by the Company before the appellate authorities.
As at March 31, 2017, the Excise Authorities have raised a demand amounting to R29.54 crores (R29.54 crores as at March 31, 2016 and R29.54 crores as at April 1, 2015) on pre-delivery inspection charges and free after-sales service charges incurred by dealers on certain of the Company’s products on the alleged grounds that the pre-delivery inspection charges and free after-sales services are provided by the dealer on behalf of the Company and should be included in excisable value of the vehicle. The case is pending before Tribunal.
As at March 31, 2017, the Excise Authorities have raised a demand amounting to RNil (R21.89 crores as at March 31, 2016 and R21.89 crores as at April 1, 2015) with respect to customs duties on dies and fixtures imported under the EPCG Scheme and, in the case of the fixtures, are installed at premises of a vendor. The Tribunal has rejected the stay application filed by the department. The department has further filed an appeal with CESTAT.
As at March 31, 2017, the Excise Authorities have raised demand amounting to R34.68 crores (R14.73 crores as at March 31, 2016 and R12.70 crores as at April 1, 2015) with respect to denial of CENVAT credit on service tax availed on freight outward and courier services. The Company asserts that since freight forms part of the services on which the taxes have been paid, CENVAT credit can be availed. The Excise Authorities have raised show cause notice which is being contested.

F-127
Sales Tax
The total sales tax demands (including interest and penalty), that are being contested by the Company amount to R1,057.93 crores, which includes R11.54 crores in respect of equity accounted investees as at March 31, 2017 (R1,251.38 crores, which includes R22.79 crores in respect of equity accounted investees, as at March 31, 2016 and R993.15 crores, which includes R22.65 crores in respect of equity accounted investees, as at April 1, 2015). The details of the demands for more than R20 crores are as follows:
The Sales Tax Authorities have raised demand of R208.59 crores (R403.38 crores as at March 31, 2016 and R120.12 crores as at April 1, 2015) towards rejection of certain statutory forms for concessional lower/nil tax rate (Form F and Form C) on technical grounds such as late submission, single form issued against different months / quarters dispatches / sales, etc. and denial of exemption from tax in absence of proof of export for certain years. The Company has contended that the benefit cannot be denied on technicalities, which are being complied with. The matter is pending at various levels.
In some of the states in India, the Sales Tax Authorities have raised disputes totaling up to R40.80 crores as at March 31, 2017 (R41.10 crores as at March 31, 2016 and R41.10 crores as at April 1, 2015), treating the stock transfers of vehicles from the Company’s manufacturing plants to regional sales offices and the transfers between two regional sales offices as sales liable for levy of sales tax. The Company is contesting this issue.
The Sales Tax Authorities have denied input tax credit and levied interest and penalty thereon due to varied reasons aggregating to R305.46 crores as at March 31, 2017 (R330.17 crores as at March 31, 2016 and R366.45 crores as at April 1, 2015). The reasons for disallowing credit was mainly due to Taxes not paid by Vendors, incorrect method of calculation of set off as per the department, alleging suppression of sales as per the department etc. The matter is contested in appeal.
Sales tax demand aggregating R258.35 crores as at March 31, 2017 (R252.66 crores as at March 31, 2016 and R258.40 crores as at April 1, 2015) has been raised by Sales Tax Authorities disallowing the concessional rate of 2% on certain purchases of raw materials in case the final product is stock transferred for sale outside the state. The matter is pending with various authorities.
Other Taxes and Dues
Other amounts for which the Company may contingently be liable aggregate to R300.01 crores, which includes R1.76 crores in respect of equity accounted investees as at March 31, 2017 (R339.41 crores, which includes R1.59 crores in respect of equity accounted investees, as at March 31, 2016 and R385.09 crores, which includes R1.15 crores in respect of equity accounted investees, as at April 1, 2015). Following are the cases involving more than R20 crores:
The municipal authorities in certain states levy octroi duty (a local indirect tax) on goods brought inside the municipal limits at rates based on the classification of goods. Demands aggregating R61.65 crores as at March 31, 2017 (R61.65 crores as at March 31, 2016 and R61.65 crores as at April 1, 2015) had been raised demanding higher octroi duties on account of classification disputes relating to components purchased for the manufacture of vehicles and retrospective increase in octroi rates relating to past periods. The dispute relating to classification is presently pending before the Supreme Court and the other dispute is pending before the Bombay High Court on remand by the Supreme Court.
As at March 31, 2017, property tax amounting to R53.70 crores (R50.56 crores as at March 31, 2016 and R49.10 crores as at April 1, 2015) has been demanded by the local municipal authorities in respect of vacant land of the Company in the plant in Pimpri, Pune. The Company has filed Special Leave Petition (SLP) before the Supreme Court against an unfavorable decision of the Bombay High Court. The Supreme Court has disposed of the SLP and remanded the matter back to the local municipal corporation for fresh adjudication.
As at March 31, 2017, a penalty of R20.31 crores (R20.31 crores as at March 31, 2016 and R56.21 crores as at April 1, 2015) is likely to be imposed relating to a matter of regularization of construction of certain buildings in respect of which approvals from appropriate authorities are awaited. However, as the buildings were constructed as per the applicable development rules, the Company believes it will be possible to get the waiver of the same.
As at March 31, 2017, Sales tax / VAT amounting to R29.95 crores (R24.10 crores as at March 31, 2016 and R15.10 crores as at April 1, 2015) has been demanded by local authorities on dealers in respect of spare parts used for carrying out warranty repairs. The dispute is pending before the Supreme Court.
As at March 31, 2017, bonus payable to employees amounting to R12.13 crores (R34.84 crores as at March 31, 2016 and Rnil as at April 1, 2015) is due, as a result of retrospective amendment to the notification dated January 1, 2016. Similar cases contesting the retrospective applicability of the said notification is pending in the High Courts of Kerala, Karnataka, Tamil Nadu and Gujarat state.
Other claims
There are other claims against the Company, the majority of which pertain to government body investigations with regards to regulatory compliances, motor accident claims, product liability claims and consumer complaints. Some of the cases also relate to the replacement of parts of vehicles and/or the compensation for deficiencies in the services by the Company or its dealers.
Commitments
The Company has entered into various contracts with vendors and contractors for the acquisition of plant and machinery, equipment and various civil contracts of a capital nature amounting to R19,610.93 crores, which includes R1,403.80 crores in respect of equity accounted investees as at March 31, 2017 (R10,838.44 crores, which includes R1,002.09 crores in respect of equity accounted investees, as at March 31, 2016 and R8,929.10 crores, which includes R184.80 crores in respect of equity accounted investees, as at April 1, 2015), which are yet to be executed.
The Company has entered into various contracts with vendors and contractors for the acquisition of intangible assets of a capital nature amounting to R640.21 crores as at March 31, 2017, (R250.61 crores as at March 31, 2016 and R251.65 crores as at April 1, 2015), which are yet to be executed.
Under the joint venture agreement with Chery Jaguar Land Rover Automotive Co. Limited, the Company is committed to contribute R3,295.60 crores as at March 31, 2017 (R3,593.00 crores as at March 31, 2016 and R3,528.20 crores as at April 1, 2015) towards its share in the capital of the joint venture of which R2,707.10 crores (R2,951.40 crores as at March 31, 2016 and R2,898.20 crores as at April 1, 2015) has been contributed as at March 31, 2017. As at March 31, 2017, the Company has an outstanding commitment of R588.50 crores (R641.60 crores as at March 31, 2016 and R630.00 crores as at April 1, 2015).
The Company has contractual obligation towards Purchase Commitment for R12,186.90 crores (R19,743.80 crores as on March 31, 2016 and R9,127.77 crores as on April 1, 2015).
NOTES FORMING PART OF CONSOLIDATED FINANCIAL STATEMENTS

Statutory ReportsCorporate Overview Financial Statements
F-128
(Consolidated)
72nd Annual Report 2016-17
38. Capital ManagementThe Company’s capital management is intended to create value for shareholders by facilitating the meeting of long-term and short-term goals of the Company.
The Company determines the amount of capital required on the basis of annual operating plans and long-term product and other strategic investment plans. The funding requirements are met through equity, convertible and non-convertible debt securities, senior notes and other long-term/short-term borrowings. The Company’s policy is aimed at combination of short-term and long-term borrowings.
The Company monitors the capital structure on the basis of total debt to equity ratio and maturity profile of the overall debt portfolio of the Company.
Total debt includes all long and short-term borrowings as disclosed in notes 24, 25 and 27 to the consolidated financial statements. Equity comprises all components excluding (profit)/loss on cash flow hedges and foreign currency translation reserve.
The following table summarizes the capital of the Company: (R in crores)
As at March 31,2017 2016
Equity* 81,808.56 80,857.07
Short-term borrowings and current portion of long-term borrowings 17,974.80 18,849.57 Long-term borrowings 60,629.18 50,510.39 Total borrowings 78,603.98 69,359.96 Total capital (Debt + Equity) 160,412.54 150,217.03
* Details of equity : As at March 31,2017 2016
Total equity as reported in balance sheet 58,515.06 79,385.25 Currency translation reserve attributable to
- Shareholders of Tata Motors Limited 5,300.13 (4,652.20) - Non-controlling interests 7.52 (23.43)Hedging reserve 17,985.85 6,147.45 Equity as reported above 81,808.56 80,857.07
NOTES FORMING PART OF CONSOLIDATED FINANCIAL STATEMENTS

F-129
39. Disclosure on financial instruments This section gives an overview of the significance of financial instruments for the Company and provides additional information on balance sheet items that contain financial
instruments. The details of significant accounting policies, including the criteria for recognition, the basis of measurement and the basis on which income and expenses are recognised, in
respect of each class of financial asset, financial liability and equity instrument are disclosed in note 2 to the consolidated financial statements. (a) Financial assets and liabilities The following table presents the carrying amounts and fair value of each category of financial assets and liabilities as at March 31, 2017.
(R in crores)
Cash and other financial assets
at amortised cost
Investments - FVTOCI
Investments - FVTPL
Investments - Amortised
cost
Derivatives other than in hedging
relationship
Derivatives in hedging
relationship
Total carrying
value
Total fair value
Financial assets(a) Other investments - non-current - 630.27 56.61 3.88 - - 690.76 690.76 (b) Investments - current - - 3,040.94 12,000.21 - - 15,041.15 15,041.15 (c) Trade receivables 14,075.55 - - - - - 14,075.55 14,075.55 (d) Cash and cash equivalents 13,986.76 - - - - - 13,986.76 13,986.76 (e) Other bank balances 22,091.12 - - - - - 22,091.12 22,091.12 (f ) Loans and advances - non-current 753.66 - - - - - 753.66 753.66
(g) Loans and advances - current 710.45 - - - - - 710.45 710.45 (h) Finance receivable - current 6,810.12 - - - - - 6,810.12 6,810.12
(i) Finance receivable - non-current 10,753.13 - - - - - 10,753.13 10,718.92
(j) Other financial assets - non-current 135.78 - - - 1,156.97 1,618.37 2,911.12 2,911.12
(k) Other financial assets - current 45.76 - - - 424.00 1,086.18 1,555.94 1,555.94
Total 69,362.33 630.27 3,097.55 12,004.09 1,580.97 2,704.55 89,379.76 89,345.55
Derivatives other than in hedging
relationship
Derivatives in hedging
relationship
Other financial liabilities
Total carrying
value
Total fair value
Financial liabilities(a) Long-term borrowings (including current maturities of long-term borrowings) (note below) - - 64,744.04 64,744.04 66,339.97 (b) Short-term borrowings - - 13,859.94 13,859.94 13,859.94 (c) Trade payables - - 57,698.33 57,698.33 57,698.33
(d) Acceptances - - 4,834.24 4,834.24 4,834.24
(e) Other financial liabilities - non-current 1,169.84 10,089.73 150.01 11,409.58 11,409.58 (f ) Other financial liabilities - current 3,541.10 10,716.85 7,262.02 21,519.97 21,519.97
Total 4,710.94 20,806.58 148,548.58 174,066.10 175,662.03
Note:Includes USD denominated bonds designated as cash flow hedges against forecasted USD revenue amounting to R7,782 crores (USD 1200 million)
NOTES FORMING PART OF CONSOLIDATED FINANCIAL STATEMENTS

Statutory ReportsCorporate Overview Financial Statements
F-130
(Consolidated)
72nd Annual Report 2016-17
The following table presents the carrying amounts and fair value of each category of financial assets and liabilities as at March 31, 2016.
(R in crores)
Cash and other financial assets
at amortised cost
Investments - FVTOCI
Investments - FVTPL
Investments - Amortised
cost
Derivatives other than in hedging
relationship
Derivatives in hedging
relationship
Total carrying
value
Total fair value
Financial assets(a) Other investments - non-current - 584.25 181.93 3.85 - - 770.03 770.03
(b) Investments - current - - 1,889.36 17,343.68 - - 19,233.04 19,233.04 (c) Trade receivables 13,570.91 - - - - - 13,570.91 13,570.91 (d) Cash and cash equivalents 17,153.61 - - - - - 17,153.61 17,153.61 (e) Other bank balances 13,306.79 - - - - - 13,306.79 13,306.79 (f ) Loans and advances - non-current 503.88 - - - - - 503.88 503.88
(g) Loans and advances - current 1,117.10 - - - - - 1,117.10 1,117.10 (h) Finance receivable - current 6,079.92 - - - - - 6,079.92 6,079.92
(i) Finance receivable - non-current 9,671.55 - - - - - 9,671.55 9,750.22
(j) Other financial assets - non-current 234.25 - - - 221.52 1,369.74 1,825.51 1,825.51
(k) Other financial assets - current 78.45 - - - 240.66 516.62 835.73 835.73
Total 61,716.46 584.25 2,071.29 17,347.53 462.18 1,886.36 84,068.07 84,146.74
Derivatives other than in hedging
relationship
Derivatives in hedging
relationship
Other financial liabilities
Total carrying
value
Total fair value
Financial liabilities(a) Long-term borrowings (including current maturities of long-term borrowings) - - 57,909.18 57,909.18 58,848.50 (b) Short-term borrowings - - 11,450.78 11,450.78 11,450.78 (c) Trade payables - - 57,580.46 57,580.46 57,580.46
(d) Acceptances - - 3,981.33 3,981.33 3,981.33
(e) Other financial liabilities - non-current 1,973.06 5,771.05 199.63 7,943.74 7,953.97
(f ) Other financial liabilities - current 1,748.82 4,733.48 7,400.51 13,882.81 13,882.81
Total 3,721.88 10,504.53 138,521.89 152,748.30 153,697.85
NOTES FORMING PART OF CONSOLIDATED FINANCIAL STATEMENTS

F-131
The following table presents the carrying amounts and fair value of each category of financial assets and liabilities as at April 01, 2015.
(R in crores)
Cash and other financial assets
at amortised cost
Investments - FVTOCI
Investments - FVTPL
Investments - Amortised
cost
Derivatives other than in hedging
relationship
Derivatives in hedging
relationship
Total carrying
value
Total fair value
Financial assets(a) Other investments - non-current - 583.82 181.53 3.50 - - 768.85 768.85
(b) Investments - current - 4.68 433.89 13,636.21 - - 14,074.78 14,074.78 (c) Trade receivables 12,972.80 - - - - - 12,972.80 12,972.80 (d) Cash and cash equivalents 19,743.09 - - - - - 19,743.09 19,743.09 (e) Other bank balances 10,668.84 - - - - - 10,668.84 10,668.84 (f ) Loans and advances - non-current 496.71 - - - - - 496.71 496.71
(g) Loans and advances - current 779.78 - - - - - 779.78 779.78 (h) Finance receivable - current 4,959.45 - - - - - 4,959.45 4,959.45
(i) Finance receivable - non-current 9,606.60 - - - - - 9,606.60 9,456.31
(j) Other financial assets - non-current 386.56 - - - 104.84 156.24 647.64 647.64
(k) Other financial assets - current 17.12 - - - 129.71 1,542.97 1,689.80 1,689.80
Total 59,630.95 588.50 615.42 13,639.71 234.55 1,699.21 76,408.34 76,258.05
Derivatives other than in hedging
relationship
Derivatives in hedging
relationship
Other financial liabilities
Total carrying
value
Total fair value
Financial liabilities(a) Long-term borrowings (including current maturities of long-term borrowings) - - 59,556.18 59,556.18 61,006.55 (b) Short-term borrowings - - 13,154.68 13,154.68 13,154.68 (c) Trade payables - - 52,094.70 52,094.70 52,094.70
(d) Acceptances - - 4,076.75 4,076.75 4,076.75
(e) Other financial liabilities - non-current 3,017.22 4,704.72 272.91 7,994.85 8,016.97
(f ) Other financial liabilities - current 1,219.82 5,226.13 7,778.02 14,223.97 14,223.97
Total 4,237.04 9,930.85 136,933.24 151,101.13 152,573.62
NOTES FORMING PART OF CONSOLIDATED FINANCIAL STATEMENTS

Statutory ReportsCorporate Overview Financial Statements
F-132
(Consolidated)
72nd Annual Report 2016-17
The following table provides an analysis of financial instruments that are measured subsequent to initial recognition at fair value, grouped into Level 1 to Level 3, as described below.
Quoted prices in an active market (Level 1): This level of hierarchy includes financial assets that are measured by reference to quoted prices (unadjusted) in active markets for identical assets or liabilities. This category consists quoted equity shares, quoted corporate debt instruments and mutual fund investments.
Valuation techniques with observable inputs (Level 2): This level of hierarchy includes financial assets and liabilities, measured using inputs other than quoted prices included within Level 1 that are observable for the asset or liability, either directly (i.e; as prices) or indirectly (i.e; derived from prices). This level of hierarchy includes Company’s over-the-counter (OTC) derivative contracts.
Valuation techniques with significant unobservable inputs (Level 3): This level of hierarchy includes financial assets and liabilities measured using inputs that are not based on observable market data (unobservable inputs). Fair values are determined in whole or in part, using a valuation model based on assumptions that are neither supported by prices from observable current market transactions in the same instrument nor are they based on available market data.
(R in crores)As at March 31, 2017
Level 1 Level 2 Level 3 TotalFinancial assets measured at fair value(a) Investments 3,326.32 - 401.50 3,727.82
(b) Derivative assets - 4,285.52 - 4,285.52 Total 3,326.32 4,285.52 401.50 8,013.34 Financial liabilities measured at fair value(a) Derivative liabilities - 25,517.52 - 25,517.52
Total - 25,517.52 - 25,517.52
As at March 31, 2016
Level 1 Level 2 Level 3 TotalFinancial assets measured at fair value
(a) Investments 2,099.85 - 555.69 2,655.54
(b) Derivative assets - 2,348.54 - 2,348.54
Total 2,099.85 2,348.54 555.69 5,004.08
Financial liabilities measured at fair value
(a) Derivative liabilities - 14,226.41 - 14,226.41
Total - 14,226.41 - 14,226.41
As at April 1, 2015
Level 1 Level 2 Level 3 TotalFinancial assets measured at fair value
(a) Investments 642.97 - 560.95 1,203.92
(b) Derivative assets - 1,933.76 - 1,933.76
Total 642.97 1,933.76 560.95 3,137.68
Financial liabilities measured at fair value
(a) Derivative liabilities - 14,167.89 - 14,167.89
Total - 14,167.89 - 14,167.89
There have been no transfers between level 1 and level 2 for the year ended March 31, 2017 and 2016, April 1, 2015.
NOTES FORMING PART OF CONSOLIDATED FINANCIAL STATEMENTS

F-133
(F-52 - F-86)
The short-term financial assets and liabilities are stated at amortized cost which is approximately equal to their fair value. Derivatives are fair valued using market observable rates and published prices together with forecast cash flow information where applicable. The fair value of finance receivables has been estimated by discounting expected cash flows using rates at which loans of similar credit quality and maturity would be made and
internal assumptions such as expected credit losses and estimated collateral value for repossessed vehicles as at March 31, 2017, 2016 and April 1, 2015. As unobservable inputs are applied, finance receivables are classified in Level 3.
The fair value of borrowings which have a quoted market price in an active market is based on its market price and for other borrowings the fair value is estimated by discounting expected future cash flows, using a discount rate equivalent to the risk-free rate of return, adjusted for the credit spread considered by the lenders for instruments of the similar maturity.
Costs of certain unquoted equity instruments has been considered as an appropriate estimate of fair value because of a wide range of possible fair value measurements and cost represents the best estimate of fair value within that range. These investments in equity instruments are not held for trading. Instead, they are held for medium or long-term strategic purpose. Upon the application of Ind AS 109, the Company has chosen to designate these investments in equity instruments as at FVTOCI as the directors believe that this provides a more meaningful presentation for medium or long-term strategic investments, than reflecting changes in fair value immediately in profit or loss.
Management uses its best judgment in estimating the fair value of its financial instruments. However, there are inherent limitations in any estimation technique. Therefore, for substantially all financial instruments, the fair value estimates presented above are not necessarily indicative of all the amounts that the Company could have realized or paid in sale transactions as of respective dates. As such, the fair value of the financial instruments subsequent to the respective reporting dates may be different from the amounts reported at each year end.
The following table provides an analysis of fair value of financial instruments that are not measured at fair value on recurring basis, grouped into Level 1 to Level 3 categories:
(R in crores)As at March 31, 2017
Level 1 Level 2 Level 3 TotalFinancial assets not measured at fair value(a) Investments 12,000.21 - 3.88 12004.09
(b) Finance receivables - - 17,529.04 17,529.04 Total 12,000.21 - 17,532.92 29,533.13
Financial liabilities not measured at fair value(a) Long-term borrowings (including current maturities of long term borrowings) 35,323.52 31,016.45 - 66,339.97 (b) Short-term borrowings - 13,859.94 - 13,859.94 Total 35,323.52 44,876.39 - 80,199.91
As at March 31, 2016
Level 1 Level 2 Level 3 TotalFinancial assets not measured at fair value
(a) Investments 17,343.68 - 3.85 17,347.53
(b) Finance receivables - - 15,830.14 15,830.14
Total 17,343.68 - 15,833.99 33,177.67
Financial liabilities not measured at fair value
(a) Long-term borrowings (including current maturities of long term borrowings) 30,123.46 28,725.04 - 58,848.50
(b) Short-term borrowings - 11,450.78 - 11,450.78
Total 30,123.46 40,175.82 - 70,299.28
As at April 1, 2015
Level 1 Level 2 Level 3 TotalFinancial assets not measured at fair value
(a) Investments 13,636.21 - 3.50 13,639.71
(b) Finance receivables - - 14,415.76 14,415.76
Total 13,636.21 - 14,419.26 28,055.47
Financial liabilities not measured at fair value
(a) Long-term borrowings (including current maturities of long term borrowings) 31,169.68 29,836.87 - 61,006.55
(b) Short-term borrowings - 13,154.68 - 13,154.68
Total 31,169.68 42,991.55 - 74,161.23
NOTES FORMING PART OF CONSOLIDATED FINANCIAL STATEMENTS

Statutory ReportsCorporate Overview Financial Statements
F-134
(Consolidated)
72nd Annual Report 2016-17
OffsettingCertain financial assets and financial liabilities are subject to offsetting where there is currently a legally enforceable right to set off recognized amounts and the Company intends to either settle on a net basis, or to realise the asset and settle the liability, simultaneously.Certain derivative financial assets and financial liabilities are subject to master netting arrangements, whereby in the case of insolvency, derivative financial assets and financial liabilities will be settled on a net basis. The following table discloses the amounts that have been offset, in arriving at the balance sheet presentation and the amounts that are available for offset only under certain conditions as at March 31, 2017:
(R in crores)
Gross amount recognized
Gross amount recognized as set off in the
balance sheet
Net amount presented in the balance
sheet
Amounts subject to an enforceable master netting
arrangement
Net amount after
offsetting
Financial instruments
Cash collateral
Financial assets(a) Derivative financial instruments 4,285.52 - 4,285.52 (3,402.13) - 883.39 (b) Trade receivables 14,103.26 (27.71) 14,075.55 - - 14,075.55 (c) Cash and cash equivalents 14,237.61 (250.85) 13,986.76 - - 13,986.76
Total 32,626.39 (278.56) 32,347.83 (3,402.13) - 28,945.70
Financial liabilities
(a) Derivative financial instruments 25,517.52 - 25,517.52 (3,402.13) - 22,115.39 (b) Accounts payable 57,726.04 (27.71) 57,698.33 - - 57,698.33
(c) Short-term borrowings/Current maturities of long-term borrowings
18,225.65 (250.85) 17,974.80 - - 17,974.80
Total 101,469.21 (278.56) 101,190.65 (3,402.13) - 97,788.52
The following table discloses the amounts that have been offset in arriving at the balance sheet presentation and the amounts that are available for offset only under certain conditions as at March 31, 2016:
Gross amount recognized
Gross amount recognized as set off in the
balance sheet
Net amount presented in the balance
sheet
Amounts subject to an enforceable master netting
arrangement
Net amount after
offsetting
Financial instruments
Cash collateral
Financial assets(a) Derivative financial instruments 2,348.54 2,348.54 (2,173.24) - 175.30
(b) Trade receivables 13,609.66 (38.75) 13,570.91 - - 13,570.91 (c) Cash and cash equivalents 18,184.49 (1,030.88) 17,153.61 - - 17,153.61
Total 34,142.69 (1,069.63) 33,073.06 (2,173.24) - 30,899.82
Financial liabilities
(a) Derivative financial instruments 14,226.41 - 14,226.41 (2,173.24) - 12,053.17
(b) Accounts payable 57,619.21 (38.75) 57,580.46 - - 57,580.46
(c) Short-term borrowings/Current maturities of long-term borrowings
19,880.45 (1,030.88) 18,849.57 - - 18,849.57
Total 91,726.07 (1,069.63) 90,656.44 (2,173.24) - 88,483.20
NOTES FORMING PART OF CONSOLIDATED FINANCIAL STATEMENTS

F-135
The following table discloses the amounts that have been offset in arriving at the balance sheet presentation and the amounts that are available for offset only under certain conditions as at April 1, 2015:
(R in crores)
Gross amount recognized
Gross amount recognized as set off in the
balance sheet
Net amount presented in the balance
sheet
Amounts subject to an enforceable master netting
arrangement
Net amount after
offsetting
Financial instruments
Cash collateral
Financial assets(a) Derivative financial instruments 1,933.76 - 1,933.76 (1,830.49) - 103.27
(b) Trade receivables 13,019.23 (46.43) 12,972.80 - - 12,972.80 (c) Cash and cash equivalents 20,602.86 (859.77) 19,743.09 - - 19,743.09
Total 35,555.85 (906.20) 34,649.65 (1,830.49) - 32,819.16
Financial liabilities
(a) Derivative financial instruments 14,167.89 - 14,167.89 (1,830.49) - 12,337.40
(b) Accounts payable 52,141.13 (46.43) 52,094.70 - - 52,094.70
(c) Short-term borrowings/Current maturities of long-term borrowings
18,963.49 (859.77) 18,103.72 - - 18,103.72
Total 85,272.51 (906.20) 84,366.31 (1,830.49) - 82,535.82
NOTES FORMING PART OF CONSOLIDATED FINANCIAL STATEMENTS
(b) Transfer of financial assets
The Company transfers finance receivables in securitization transactions and direct assignments. In such transactions the Company surrenders control over the receivables, though it continues to act as an agent for the collection of receivables. In most of these transactions, the Company also provides credit enhancements to the transferee.
Because of the existence of credit enhancements in such transactions, the Company continues to have the obligation to pay to the transferee, limited to the extent of credit enhancement, even if it does not collect the equivalent amounts from the original asset and continues to retain substantially all risks and rewards associated with the receivables, and hence, such transfer or assignment does not meet the derecognition criteria resulting into the transfer not being recorded as sale. Consequently, the proceeds received from the transfer are recorded as collateralized debt obligation.
Further, the Company transfers certain trade receivables under the debt factoring arrangements. These do not qualify for derecognition, due to the recourse arrangement in place. Consequently the proceeds received from transfer are recorded as loans from banks / financial institutions and classified under short-term borrowings.
The carrying amount of trade receivables and finance receivables along with the associated liabilities is as follows:
As at March 31, As at April 1,
2017 2016 2015
Nature of Asset
Carrying amount of asset sold
Carrying amount of associated
liabilities
Carrying amount of asset sold
Carrying amount of associated
liabilities
Carrying amount of asset sold
Carrying amount of associated
liabilities
(a) Trade receivables 1,494.87 1,494.87 1,514.35 1,514.35 1,715.43 1,715.43 (b) Finance receivables 1,004.38 1 1,027.12 35.51 1 40.07 583.33 1 616.80
1 Net of provision of R29.00 crores, R9.43 crores and R113.72 crores as at March 31, 2017, 2016 and April 1, 2015, respectively.

Statutory ReportsCorporate Overview Financial Statements
F-136
(Consolidated)
72nd Annual Report 2016-17
(c) Cash flow hedges As at March 31, 2017, the Company and its subsidiaries have a number of cash flow hedging instruments in a hedging relationship. The Company and its
subsidiaries uses both U.S. dollar/Pounds sterling forward and option contracts, U.S. dollar/Euro forward contracts and other currency options to hedge future cash flows from sales and purchases. The Company and its subsidiaries have designated some of its U.S. dollar denominated bonds as cash flow hedging instruments of foreign currency risk arising from future anticipated sales. Cash flow hedges are expected to be recognized in profit or loss during the years ending March 31, 2018 to 2022.
The Company and its subsidiaries also have a number of foreign currency derivative contracts, which are entered into as an economic hedge of the financial risks of the Company. These contracts do not meet the hedge accounting criteria of Ind AS 109, hence the change in fair value is recognized immediately in the Statement of Profit and Loss.
Options are designated on spot basis. The time value of options are identified as cost of hedge. Changes in the time value of options are recognised in Cost of Hedge reserve. Cross currency basis spread arising from forward exchange contracts are considered ineffective in the hedge relationship and thus the change in fair value of forward exchange contracts attributable to cross currency basis spread are recognised in the Statement of Profit and Loss.
Changes in fair value of foreign currency derivatives and bonds, to the extent determined to be an effective hedge, is recognized in other comprehensive income and the ineffective portion of the fair value change is recognized in Statement of Profit and Loss.
Accordingly, the fair value change arising from foreign currency derivatives and bonds, designated as cash flow hedges of future anticipated sales (net loss) of R25,861.67 crores, (net loss) R4,006.35 crores, was recognized in other comprehensive income during the years ended March 31, 2017 and March 31, 2016, respectively. Amounts reclassified from hedging reserve of (net loss) R9,928.70 crores and (net gain) R1,365.57 crores during the years ended March 31, 2017 and 2016, respectively, have been recognised as revenue in the Statement of Profit and Loss.
The Company and its subsidiaries have entered into forward exchange contracts and foreign currency options to hedge the exchange rate risk arising from future anticipated purchase of raw materials which are designated as cash flow hedges. The fair value change (net gain) of R2,026.77 crores and (net gain) of R2,430.04 crores was recognised in other comprehensive income during the year ended March 31, 2017 and 2016 respectively.
Amounts recycled from hedging reserve of (net gain) of R1,020.39 crores and (net loss) of R1,902.67 crores was recognized in inventory during the year ended March 31, 2017 and March 31, 2016 respectively in the Balance Sheet.
Changes in fair value attributable to cross currency basis spread in forwards of R231.78 crores (net loss) and R102.93 crores (net loss) during the years ended March 31, 2017 and 2016, respectively, have been classified as foreign exchange gain/loss in the statement of profit and loss. Amounts reclassified from hedging reserve, where forecast sales are no longer expected to occur, amounts to net loss of R367.31 crores and net loss of R19.72 crores during the years ended March 31, 2017 and 2016, respectively, have been classified as foreign exchange gain/loss in the Statement of Profit and Loss.
Changes in fair value of foreign currency derivatives not hedge accounted of R2,041.94 crores (net loss) and R571.27 crores (net gain) during the years ended March 31, 2017 and 2016, respectively, have been classified as foreign exchange gain/loss in the Statement of Profit and Loss.
NOTES FORMING PART OF CONSOLIDATED FINANCIAL STATEMENTS

F-137
(d) Financial risk management In the course of its business, the Company is exposed primarily to fluctuations in foreign currency exchange rates, interest rates, equity prices, liquidity and credit
risk, which may adversely impact the fair value of its financial instruments. The Company has a risk management policy which not only covers the foreign exchange risks but also other risks associated with the financial assets and liabilities
such as interest rate risks and credit risks. The risk management policy is approved by the board of directors. The risk management framework aims to: • Create a stable business planning environment by reducing the impact of currency and interest rate fluctuations on the Company’s business plan. • Achieve greater predictability to earnings by determining the financial value of the expected earnings in advance. (i) Market risk
Market risk is the risk of any loss in future earnings, in realizable fair values or in future cash flows that may result from a change in the price of a financial instrument. The value of a financial instrument may change as a result of changes in the interest rates, foreign currency exchange rates, equity price fluctuations, liquidity and other market changes. Future specific market movements cannot be normally predicted with reasonable accuracy.
(i) - (a) Foreign currency exchange rate risk:The fluctuation in foreign currency exchange rates may have potential impact on the Statement of Profit and Loss and equity, where any transaction references more than one currency or where assets/liabilities are denominated in a currency other than the functional currency of the respective consolidated entities.Considering the countries and economic environment in which the Company operates, its operations are subject to risks arising from fluctuations in exchange rates in those countries. The risks primarily relate to fluctuations in U.S. dollar, Chinese renminbi, Japanese yen, Singapore dollar and Euro, against the respective functional currencies of Tata Motors Limited and its subsidiaries.The Company, as per its risk management policy, uses foreign exchange and other derivative instruments primarily to hedge foreign exchange and interest rate exposure. Furthermore, any movement in the functional currencies of the various operations of the Company against major foreign currencies may impact the Company’s revenues from its international operations. Any weakening of the functional currency may impact the Company’s cost of imports and cost of borrowings and consequently may increase the cost of financing the Company’s capital expenditures.The Company evaluates the impact of foreign exchange rate fluctuations by assessing its exposure to exchange rate risks. It hedges a part of these risks by using derivative financial instruments in accordance with its risk management policies.The foreign exchange rate sensitivity is calculated for each currency by aggregation of the net foreign exchange rate exposure of a currency and a simultaneous parallel foreign exchange rates shift in the foreign exchange rates of each currency by 10%.
NOTES FORMING PART OF CONSOLIDATED FINANCIAL STATEMENTS

Statutory ReportsCorporate Overview Financial Statements
F-138
(Consolidated)
72nd Annual Report 2016-17
The following analysis is based on the gross exposure as of the relevant balance sheet dates, which could affect the Statement of Profit and Loss. There is no exposure to the Statement of Profit and Loss on account of translation of financial statements of consolidated foreign entities. Furthermore, the exposure as indicated below is mitigated by some of the derivative contracts entered into by the Company as disclosed at clause (iv) below.
The following table sets forth information relating to foreign currency exposure (other than risk arising from derivatives disclosed at clause (iv) below) as at March 31, 2017:
(R in crores)
U.S. dollar Euro Chinese Renminbi
Japanese Yen Others 1 Total
(a) Financial assets 10,498.74 9,862.42 4,000.96 127.98 4,432.32 28,922.42(b) Financial liabilities 37,547.87 21,301.83 3,399.19 538.22 2,939.25 65,726.36
1 Others mainly include currencies such as the Russian rouble, Singapore dollar, Swiss franc, Australian dollars, South African rand, Thai baht and Korean won.
10% appreciation/depreciation of the respective foreign currencies with respect to functional currency of the Company would result in decrease/increase in the Company’s profit/(loss) before tax by approximately R2,892.24 crores and R6,572.64 crores for financial assets and financial liabilities respectively for the year ended March 31, 2017.
The following table set forth information relating to foreign currency exposure (other than risk arising from derivatives disclosed at clause (iv) below) as at March 31, 2016:
U.S. dollar Euro Chinese Renminbi
Japanese Yen Others 2 Total
(a) Financial assets 7,341.18 6,620.76 6,392.92 257.76 4,134.87 24,747.49 (b) Financial liabilities 36,779.68 16,536.28 5,450.94 616.39 2,789.65 62,172.94
2 Others mainly include currencies such as the Russian rouble, Swiss franc, Australian dollars, South African rand, Singapore dollars, Thai baht and Korean won.
10% appreciation/depreciation of the respective foreign currencies with respect to functional currency of the Company would result in decrease/increase in the Company’s profit/(loss) before tax by approximately R2,474.75 crores and R6,217.29 crores for financial assets and financial liabilities respectively for the year ended March 31, 2016.
The following table set forth information relating to foreign currency exposure (other than risk arising from derivatives disclosed at clause (iv) below) as at April 1, 2015:
U.S. dollar Euro Chinese Renminbi
Singapore Dollar Others 3 Total
(a) Financial assets 8,950.83 4,544.11 6,860.78 197.79 3,854.21 24,407.72(b) Financial liabilities 30,737.64 10,670.30 6,990.16 2,421.41 2,327.72 53,147.23
3 Others mainly include currencies such as the Russian rouble, Japanese yen, Swiss franc, Australian dollars, South African rand, Thai baht and Korean won.
10% appreciation/depreciation of the respective foreign currencies with respect to functional currency of the Company would result in decrease/increase in the Company’s profit/(loss) before tax by approximately R2,440.77 crores and R5,314.72 crores for financial assets and financial liabilities respectively for the year ended March 31, 2015.
(Note: The impact is indicated on the income/loss before tax basis)
NOTES FORMING PART OF CONSOLIDATED FINANCIAL STATEMENTS

F-139
(i) - (b) Interest rate risk Interest rate risk is measured by using the cash flow sensitivity for changes in variable interest rates. Any movement in the reference rates could have an impact on the Company’s
cash flows as well as costs. The Company is subject to variable interest rates on some of its interest bearing liabilities. The Company’s interest rate exposure is mainly related to debt obligations. The Company
also uses a mix of interest rate sensitive financial instruments to manage the liquidity and fund requirements for its day to day operations like short term non-convertible bonds and short term loans.
In its financing business, the Company enters into transactions with customers which primarily result in receivables at fixed rates. In order to manage this risk, the Company has a policy to match funding in terms of maturities and interest rates and also for certain part of the portfolio, the Company does not match funding with maturities, in order to take advantage of market opportunities.
The Company also enters into arrangements of securitization of receivables in order to reduce the impact of interest rate movements. Futher, Company also enters in to interst rate swap contract with banks to manage its interest rate risk.
As at March 31, 2017, 2016 and April 1, 2015, financial liability of R18,928.36 crores, R22,117.12 crores and R21,583.07 crores respectively, was subject to variable interest rates. Increase/decrease of 100 basis points in interest rates at the balance sheet date would result in an impact (decrease/increase in case of profit/(loss) before tax of R189.28 crores and R221.17 crores on income for the year ended March 31, 2017 and 2016 respectively.
The model assumes that interest rate changes are instantaneous parallel shifts in the yield curve. Although some assets and liabilities may have similar maturities or periods to re-pricing, these may not react correspondingly to changes in market interest rates. Also, the interest rates on some types of assets and liabilities may fluctuate with changes in market interest rates, while interest rates on other types of assets may change with a lag.
The risk estimates provided assume a parallel shift of 100 basis points interest rate across all yield curves. This calculation also assumes that the change occurs at the balance sheet date and has been calculated based on risk exposures outstanding as at that date. The period end balances are not necessarily representative of the average debt outstanding during the period.
This analysis assumes that all other variables, in particular foreign currency rates, remain constant. (Note: The impact is indicated on the income/loss before tax basis).
(i) - (c) Equity price risk Equity price risk is related to the change in market reference price of the investments in equity securities. The fair value of some of the Company’s investments measured at fair value through other comprehensive income exposes the Company to equity price risks. These investments
are subject to changes in the market price of securities. The fair value of Company’s investment in quoted equity securities as at March 31, 2017 and 2016, was R260.29 crores and R210.50 crores, respectively. A 10% change in equity prices as at March 31, 2017 and 2016, would result in an impact of R26.03 crores and R21.05 crores, respectively.
(Note: The impact is indicated on equity before consequential tax impact, if any).
NOTES FORMING PART OF CONSOLIDATED FINANCIAL STATEMENTS

Statutory ReportsCorporate Overview Financial Statements
F-140
(Consolidated)
72nd Annual Report 2016-17
As at March 31, As at April 1,
2017 2016 2015Gross Allowance Net Gross Allowance Net Gross Allowance Net
Finance receivables 2
Period (in months)(a) Not due 3 18,004.78 (1,604.08) 16,400.70 17,515.42 (2,774.06) 14,741.36 17,509.48 (3,988.89) 13,520.59 (b) Overdue up to 3 months 298.24 (20.39) 277.85 217.22 (24.21) 193.01 257.28 (46.44) 210.84 (c) Overdue more than 3 months 2,857.74 (1,973.04) 884.70 3,025.52 (2,208.42) 817.10 2,687.30 (1,852.68) 834.62
Total 21,160.76 (3,597.51) 17,563.25 20,758.16 (5,006.69) 15,751.47 20,454.06 (5,888.01) 14,566.05
2 Finance receivables originated in India.
3 Allowance in the “Not due” category includes allowance against installments pertaining to impaired finance receivables which have not yet fallen due.
Credit quality of financial assets and impairment loss
The ageing of trade receivables and finance receivables as of balance sheet date is given below. The age analysis have been considered from the due date. (R in crores)
As at March 31, As at April 1,
2017 2016 2015Gross Allowance Net Gross Allowance Net Gross Allowance Net
Trade receivablesPeriod (in months)
(a) Not due 11,943.87 (90.99) 11,852.88 11,048.06 (8.46) 11,039.60 11,416.65 (9.09) 11,407.56 (b) Overdue up to 3 months 1,771.82 (31.98) 1,739.84 2,268.93 (272.28) 1,996.65 1,090.00 (28.08) 1,061.92 (c) Overdue 3-6 months 185.93 (25.49) 160.44 420.99 (222.36) 198.63 258.22 (24.11) 234.11
(d) Overdue more than 6 months 1,551.37 (1,228.98) 322.39 1 1,107.22 (771.19) 336.03 1 983.63 (714.42) 269.21 1
Total 15,452.99 (1,377.44) 14,075.55 14,845.20 (1,274.29) 13,570.91 13,748.50 (775.70) 12,972.80
Trade receivables consist of a large number of various types of customers, spread across geographical areas. Ongoing credit evaluation is performed on the financial condition of these trade receivables and where appropriate, allowance for losses are provided. Further, the Company groups the trade receivables depending on the type of customers and accordingly credit risk is determined.
1 Trade receivables overdue more than six months include R212.29 crores as at March 31, 2017 (R230.02 crores as at March 31, 2016 and R152.93 crores as at April 1, 2015) outstanding from state government organizations in India, which are considered recoverable.
(ii) Credit risk Credit risk is the risk of financial loss arising from counterparty failure to repay or service debt according to the contractual terms or obligations. Credit risk encompasses both the
direct risk of default and the risk of deterioration of creditworthiness as well as concentration risks. Financial instruments that are subject to concentrations of credit risk, principally consist of investments classified as fair value through profit or loss, trade receivables, finance
receivables, loans and advances and derivative financial instruments. None of the financial instruments of the Company result in material concentrations of credit risks. Exposure to credit risk The carrying amount of financial assets represents the maximum credit exposure. The maximum exposure to credit risk was R88,716.87 crores as at March 31, 2017 and
R83,443.73 crores as at March 31, 2016, being the total of the carrying amount of balances with banks, short term deposits with banks, trade receivables, finance receivables, margin money and other financial assets excluding equity investments.
Financial assets that are neither past due nor impaired None of the Company’s cash equivalents, including time deposits with banks, are past due or impaired. Regarding trade receivables and other receivables, and other loans or
receivables that are neither impaired nor past due, there were no indications as at March 31, 2017, that defaults in payment obligations will occur.
NOTES FORMING PART OF CONSOLIDATED FINANCIAL STATEMENTS

F-141
(iii)
Liqu
idit
y ri
sk
Liqu
idity
risk
refe
rs to
the
risk
that
the
Com
pany
can
not m
eet i
ts fi
nanc
ial o
blig
atio
ns. T
he o
bjec
tive
of li
quid
ity ri
sk m
anag
emen
t is
to m
aint
ain
suffi
cien
t liq
uidi
ty a
nd e
nsur
e th
at fu
nds
are
avai
labl
e fo
r use
as
per r
equi
rem
ents
.
The
Com
pany
has
obt
aine
d fu
nd a
nd n
on-fu
nd b
ased
wor
king
cap
ital l
ines
from
var
ious
ban
ks. F
urth
erm
ore,
the
Com
pany
has
acc
ess
to fu
nds
from
deb
t mar
kets
thro
ugh
com
mer
cial
pap
er p
rogr
ams,
non-
conv
ertib
le d
eben
ture
s, se
nior
not
es a
nd o
ther
deb
t ins
trum
ents
. The
Com
pany
inve
sts
its s
urpl
us fu
nds
in b
ank
fixed
dep
osit
and
liqui
d an
d liq
uid
plus
sch
emes
of m
utua
l fun
ds, w
hich
car
ry n
o/lo
w m
ark
to
mar
ket r
isks.
The
Com
pany
has
also
inve
sted
15%
of t
he n
on-c
onve
rtib
le d
eben
ture
s (ta
ken/
issue
d by
the
Com
pany
) fal
ling
due
for r
epay
men
t in
the
next
12
mon
ths
in b
ank
depo
sits,
to m
eet t
he re
gula
tory
no
rms o
f liq
uidi
ty re
quire
men
ts.
Th
e Co
mpa
ny a
lso c
onst
antly
mon
itors
fund
ing
optio
ns a
vaila
ble
in th
e de
bt a
nd c
apita
l mar
kets
with
a v
iew
to m
aint
aini
ng fi
nanc
ial fl
exib
ility
.
The
tabl
e be
low
pro
vide
s det
ails
rega
rdin
g th
e co
ntra
ctua
l mat
uriti
es o
f fina
ncia
l lia
bilit
ies,
incl
udin
g es
timat
ed in
tere
st p
aym
ents
as a
t Mar
ch 3
1, 2
017:
(R in
cro
res)
Carr
ying
am
ount
Due
in 1
st Y
ear
Due
in 2
nd Y
ear
Due
in 3
rd to
5th
Yea
rD
ue a
fter
5th
Yea
rTo
tal c
ontr
actu
al
cash
flow
s
Fina
ncia
l lia
bilit
ies
(a)
Trad
e pa
yabl
es 5
7,69
8.33
5
7,69
8.33
-
- -
57,
698.
33
(b)
Acce
ptan
ces
4,8
34.2
4 4
,834
.24
- -
- 4
,834
.24
(c)
Borro
win
gs a
nd in
tere
st th
ereo
n 7
9,54
7.22
2
1,73
3.53
1
3,05
5.95
3
9,61
4.01
1
9,35
8.94
9
3,76
2.43
(d
)O
ther
fina
ncia
l lia
bilit
ies
6,4
68.7
9 6
,318
.78
30.
53
69.
78
78.
89
6,4
97.9
8 (e
)D
eriv
ativ
e lia
bilit
ies
25,
517.
52
15,
791.
87
10,
470.
86
6,0
52.8
3 1
.15
32,
316.
71
Tota
l 1
74,0
66.1
0 1
06,3
76.7
5 2
3,55
7.34
4
5,73
6.62
1
9,43
8.98
1
95,1
09.6
9
Cont
ract
ual m
atur
ities
of b
orro
win
gs in
clud
es c
ash
flow
s re
latin
g to
col
late
raliz
ed d
ebt
oblig
atio
ns. T
his
repr
esen
ts t
he a
mou
nt re
ceiv
ed a
gain
st t
he t
rans
fer o
f fina
nce
rece
ivab
les
in s
ecur
itiza
tion
tran
sact
ions
and
/or d
irect
ass
ignm
ents
, whi
ch d
o no
t qua
lify
for d
erec
ogni
tion.
The
liab
ility
of t
he C
ompa
ny in
suc
h ca
ses
is lim
ited
to th
e ex
tent
of c
redi
t enh
ance
men
ts p
rovi
ded.
The
con
trac
tual
m
atur
ities
of s
uch
colla
tera
lized
deb
t obl
igat
ions
are
as f
ollo
ws: Ca
rryi
ng a
mou
ntD
ue in
1st
Yea
rD
ue in
2nd
Yea
rD
ue in
3rd
to 5
th Y
ear
Tota
l con
trac
tual
ca
sh fl
ows
Colla
tera
lized
deb
t obl
igat
ions
1,0
27.3
8 6
29.6
7 3
67.0
7 1
10.8
2 1
,107
.56
NO
TES
FORM
ING
PA
RT O
F CO
NSO
LID
ATED
FIN
AN
CIA
L ST
ATEM
ENTS

Statutory ReportsCorporate Overview Financial Statements
F-142
(Consolidated)
72nd Annual Report 2016-17
The
tabl
e be
low
pro
vide
s det
ails
rega
rdin
g th
e co
ntra
ctua
l mat
uriti
es o
f fina
ncia
l lia
bilit
ies,
incl
udin
g es
timat
ed in
tere
st p
aym
ents
as o
f Mar
ch 3
1, 2
016:
(₹ in
cro
res)
Carr
ying
am
ount
Due
in 1
st Y
ear
Due
in 2
nd Y
ear
Due
in 3
rd to
5th
Yea
rD
ue a
fter
5th
Yea
rTo
tal c
ontr
actu
al
cash
flow
s
Fina
ncia
l lia
bilit
ies
(a)
Trad
e pa
yabl
es 5
7,58
0.46
5
7,58
0.46
-
- -
57,
580.
46
(b)
Acce
ptan
ces
3,9
81.3
3 3
,981
.33
- -
- 3
,981
.33
(c)
Borro
win
gs a
nd in
tere
st th
ereo
n 7
0,33
0.36
2
2,29
5.86
6
,566
.36
32,
659.
96
23,
117.
45
84,
639.
63
(d)
Oth
er fi
nanc
ial l
iabi
litie
s 6
,629
.74
6,4
34.7
6 1
24.6
8 3
8.90
6
7.82
6
,666
.16
(e)
Der
ivat
ive
liabi
litie
s 1
4,22
6.41
7
,048
.99
6,6
62.5
7 4
,392
.17
7.2
9 1
8,11
1.02
To
tal
1,5
2,74
8.30
9
7,34
1.40
13,
353.
61
37,
091.
03 2
3,19
2.56
1,7
0,97
8.60
Cont
ract
ual m
atur
ities
of b
orro
win
gs in
clud
es c
ash
flow
s re
latin
g to
col
late
raliz
ed d
ebt
oblig
atio
ns. T
his
repr
esen
ts t
he a
mou
nt re
ceiv
ed a
gain
st t
he t
rans
fer o
f fina
nce
rece
ivab
les
in s
ecur
itiza
tion
tran
sact
ions
and
/or d
irect
ass
ignm
ents
, whi
ch d
o no
t qua
lify
for d
erec
ogni
tion.
The
liab
ility
of t
he C
ompa
ny in
suc
h ca
ses
is lim
ited
to th
e ex
tent
of c
redi
t enh
ance
men
ts p
rovi
ded.
The
con
trac
tual
m
atur
ities
of s
uch
colla
tera
lized
deb
t obl
igat
ions
are
as f
ollo
ws: Ca
rryi
ng a
mou
ntD
ue in
1st
Yea
rD
ue in
2nd
Yea
rD
ue in
3rd
to 5
th Y
ear
Tota
l con
trac
tual
ca
sh fl
ows
Colla
tera
lized
deb
t obl
igat
ions
40.
07
38.
73
2.84
- 4
1.57
The
tabl
e be
low
pro
vide
s det
ails
rega
rdin
g th
e co
ntra
ctua
l mat
uriti
es o
f fina
ncia
l lia
bilit
ies,
incl
udin
g es
timat
ed in
tere
st p
aym
ents
as o
f Apr
il 1,
201
5:
Carr
ying
am
ount
Due
in 1
st Y
ear
Due
in 2
nd Y
ear
Due
in 3
rd to
5th
Yea
rD
ue a
fter
5th
Yea
rTo
tal c
ontr
actu
al
cash
flow
s
Fina
ncia
l lia
bilit
ies
(a)
Trad
e pa
yabl
es 5
2,09
4.70
5
2,09
4.70
-
- -
52,
094.
70
(b)
Acce
ptan
ces
4,0
76.7
5 4
,076
.75
- -
- 4
,076
.75
(c)
Borro
win
gs a
nd in
tere
st th
ereo
n 7
3,74
0.39
2
2,16
4.53
1
1,34
5.45
3
2,04
6.48
2
5,42
1.74
9
0,97
8.20
(d
)O
ther
fina
ncia
l lia
bilit
ies
7,0
21.4
0 6
,774
.25
120
.87
120
.42
68.
38
7,0
83.9
2 (e
)D
eriv
ativ
e lia
bilit
ies
14,
167.
89
6,9
67.4
4 5
,703
.53
4,9
45.3
4 1
2.91
1
7,62
9.22
To
tal
1,5
1,10
1.13
9
2,07
7.67
1
7,16
9.85
3
7,11
2.24
2
5,50
3.03
1
,71,
862.
79
Cont
ract
ual m
atur
ities
of b
orro
win
gs in
clud
es c
ash
flow
s re
latin
g to
col
late
raliz
ed d
ebt
oblig
atio
ns. T
his
repr
esen
ts t
he a
mou
nt re
ceiv
ed a
gain
st t
he t
rans
fer
of fi
nanc
e re
ceiv
able
s in
sec
uriti
zatio
n tr
ansa
ctio
ns a
nd/o
r dire
ct a
ssig
nmen
ts, w
hich
do
not
qual
ify fo
r der
ecog
nitio
n. T
he li
abili
ty o
f the
Com
pany
in s
uch
case
s is
limite
d to
the
ext
ent
of c
redi
t en
hanc
emen
ts p
rovi
ded.
The
cont
ract
ual
mat
uriti
es o
f suc
h co
llate
raliz
ed d
ebt o
blig
atio
ns a
re a
s fol
low
s: Carr
ying
am
ount
Due
in 1
st Y
ear
Due
in 2
nd Y
ear
Due
in 3
rd to
5th
Yea
rTo
tal c
ontr
actu
al
cash
flow
s
Colla
tera
lized
deb
t obl
igat
ions
616
.80
536
.44
106
.56
4.4
5 6
47.4
5
NO
TES
FORM
ING
PA
RT O
F CO
NSO
LID
ATED
FIN
AN
CIA
L ST
ATEM
ENTS

F-143
(iv) Derivative financial instruments and risk management
The Company has entered into variety of foreign currency, interest rates and commodity forward contracts and options to manage its exposure to fluctuations in foreign exchange rates, interest rates and commodity price risk. These financial exposures are managed in accordance with the Company’s risk management policies and procedures.
The Company also enters into interest rate swaps and interest rate currency swap agreements, mainly to manage exposure on its fixed rate or variable rate debt. The Company uses interest rate derivatives or currency swaps to hedge exposure to exchange rate fluctuations on principal and interest payments for borrowings denominated in foreign currencies.
Specific transactional risks include risks like liquidity and pricing risks, interest rate and exchange rate fluctuation risks, volatility risks, counterparty risks, settlement risks and gearing risks.
Fair value of derivative financial instruments are determined using valuation techniques based on information derived from observable market data.
The fair value of derivative financial instruments is as follows: (₹ in crores)As at March 31, As at April 1,
2017 2016 2015(a) Foreign currency forward exchange contracts and options (21,685.18) (10,798.79) (11,839.38)(b) Commodity Derivatives 385.66 (962.81) (389.01)(c) Others including interest rate and currency swaps 67.52 (116.27) (5.74)
Total (21,232.00) (11,877.87) (12,234.13)
The gain/(loss) on commodity derivative contracts, recognized in the Statement of Profit and Loss was R918.40 crores and (R1,155.53 crores) for the years ended March 31, 2017 and 2016 respectively.
In respect of the Company’s foreign currency forward and option contracts, a 10% appreciation of the foreign currency underlying such contracts, would have resulted in an approximate gain/(loss) of (R13,011.69 crores)/(R15,934.81 crores) in the Company’s hedging reserve and an approximate gain/(loss) of R816.50 crores/(R1,172.08 crores) respectively, in the Company’s Statement of Profit and Loss for the year ended March 31, 2017 and March 31, 2016 respectively.
In respect of the Company’s foreign forward and option contracts, a 10% depreciation of the foreign currency underlying such contracts, would have resulted in an approximate gain/(loss) of R12,194.42 crores/R16,013.08 crores in the Company’s hedging reserve and an approximate gain/(loss) of (R90.35 crores) and R961.11 crores respectively, in the Company’s Statement of Profit and Loss for the year ended March 31, 2017 and March 31, 2016 respectively.
In respect of the Company’s commodity derivative contracts, a 10% depreciation/appreciation of all commodity prices underlying such contracts, would have resulted in an approximate gain/(loss) of (R461.24 crores)/R461.24 crores and (R496.35 crores)/R496.35 crores in the Statement of Profit and Loss for the years ended March 31, 2017 and 2016 respectively.
Exposure to gain/loss on derivative instruments offset to some extent the exposure to foreign currency risk, interest rate risk as disclosed above.
(Note: The impact is indicated on the income/loss before tax basis).
NOTES FORMING PART OF CONSOLIDATED FINANCIAL STATEMENTS

Statutory ReportsCorporate Overview Financial Statements
F-144
(Consolidated)
72nd Annual Report 2016-17
40. Disclosure on Financial instruments designated as hedging instrument in cashflow hedge
The details of cash flow hedges entered into by one of the Company’s subsidiaries to hedge the currency fluctuation of its functional currency (GBP) against foreign currencies to hedge future cash flows arising from revenue and cost of materials is as follows:
Outstanding contracts Average strike rate Nominal amounts Fair value£ in million Rin crores
As at March 31, As at April 1, As at March 31, As at April 1, As at March 31, As at April 1,2017 2016 2015 2017 2016 2015 2017 2016 2015
Fx ForwardsCash flow hedges - USDSell - USD/ Buy - GBP<1 year 0.667 0.657 0.643 2,767.7 3,458.5 2,920.3 (4,228.80) (1,882.32) (1,458.84)Between 1-5 years 0.668 0.651 0.645 4,850.8 6,253.7 5,341.5 (6,228.30) (3,341.79) (2,180.87)
Cash flow hedges - Chinese YuanSell - Chinese Yuan / Buy - GBP<1 year 0.100 0.100 0.100 3,435.7 3,318.3 2,445.7 (3,874.38) (1,962.50) (1,593.82)Between 1-5 years 0.102 0.099 0.099 4,132.3 4,400.8 3,700.8 (2,096.60) (1,765.87) (1,253.61)
Cash flow hedges -EuroBuy - Euro / Sell - GBP<1 year 0.795 0.794 0.818 1,574.1 1,502.7 1,807.7 977.50 38.18 (1,781.49)Between 1-5 years 0.804 0.764 0.795 2,327.5 2,076.8 2,129.8 1,464.62 1,233.24 (1,158.38)
Cash flow hedges - Other<1 year 0.002 0.002 0.003 1,675.7 1,370.1 1,056.4 (2,483.39) (418.08) 1,150.99 Between 1-5 years 0.003 0.002 0.004 1,829.5 1,148.0 687.4 (1,459.77) (526.90) 45.30
Fx OptionsCash flow hedges - USDSell - USD/ Buy - GBP<1 year 0.760 - - 11.4 - - - - - Between 1-5 years 0.728 - - 127.4 - - 5.66 - -
Cash flow hedges - Chinese YuanSell - Chinese Yuan / Buy - GBP<1 year 0.105 - - 10.5 - - - - - Between 1-5 years 0.103 - - 10.3 - - 1.62 - -
Cash flow hedges -EuroBuy - Euro / Sell - GBP<1 year 0.956 - - 186.5 - - (28.32) - - Between 1-5 years 0.969 - - 1,588.9 - - (158.60) - -
USD denominated Bonds< 1 yearBetween 1-5 years 0.803 - - 963.0 - - (7,964.60) - -
NOTES FORMING PART OF CONSOLIDATED FINANCIAL STATEMENTS

F-145
41. Segment reporting
The Company primarily operates in the automotive segment. The automotive segment includes all activities relating to development, design, manu-facture, assembly and sale of vehicles including financing thereof, as well as sale of related parts and accessories. The Company provides financing for vehicles sold by dealers in India. The vehicle financing is intended to drive sale of vehicles by providing financing to the dealers’ customers and as such is an integral part of automotive business. The financing activity is assessed as an integral part of the overall automotive business. The operating results of the financing activity does not include all of the interest or cost of funds employed for the purposes of financing, and therefore the operating results of this activity is not used to make decisions about resources to be allocated or to assess performance.
The Company’s products mainly include Tata and other brand vehicles and Jaguar and Land Rover vehicles.
As at March 31, 2017, the automotive segment is bifurcated into the following :
Tata and other brand vehicles, including financing thereof and Jaguar Land Rover.
The Company’s other segment comprises primarily activities relating to information technology or IT services, machine tools and factory automation solutions.
The segment information presented is in accordance with the accounting policies adopted for preparing the consolidated financial statements of the Company. Segment revenues, expenses and results include inter-segment transfers. Such transfers are undertaken either at competitive market prices charged to unaffiliated customers for similar goods or at contracted rates. These transfers are eliminated on consolidation.
NOTES FORMING PART OF CONSOLIDATED FINANCIAL STATEMENTS

Statutory ReportsCorporate Overview Financial Statements
F-146
(Consolidated)
72nd Annual Report 2016-17
For t
he y
ear e
nded
/as
at M
arch
31,
201
7 (₹
in c
rore
s)A
utom
otiv
e an
d re
late
d ac
tivit
yTa
ta a
nd
othe
r bra
nd
vehi
cles
(in
clud
ing
finan
cing
th
ereo
f) 1
Jagu
ar L
and
Rove
rIn
tra-
segm
ent
elim
inat
ions
Tota
lO
ther
s In
ter-
segm
ent
elim
inat
ions
T
otal
Rev
enue
s:Ex
tern
al re
venu
e 5
6,29
2.59
2
,16,
388.
82
- 2
,72,
681.
41
1,8
10.7
1 -
2,7
4,49
2.12
In
ter-
segm
ent/
intr
a-se
gmen
t re
venu
e 1
56.1
9 -
(145
.19)
11.
00
1,3
73.3
5 (1
,384
.35)
- To
tal r
even
ues
56,
448.
78
2,1
6,38
8.82
(1
45.1
9) 2
,72,
692.
41
3,1
84.0
6 (1
,384
.35)
2,7
4,49
2.12
Earn
ings
bef
ore
othe
r inc
ome,
fina
nce
cost
an
d ta
x 2
07.0
5 1
5,11
7.07
-
15,
324.
12
471
.90
(202
.22)
15,
593.
80
Reco
ncili
atio
n to
Pro
fit b
efor
e ta
x:O
ther
inco
me
754
.54
Fina
nce
cost
s (4
,238
.01)
Fore
ign
exch
ange
(gai
n)/l
oss
(net
) (3
,910
.10)
Exce
pti
onal
item
s:a)
Em
ploy
ee se
para
tion
cost
(67.
61)
b) O
ther
s 1
,182
.17
Prof
it b
efor
e ta
x 9
,314
.79
Dep
reci
atio
n an
d am
orti
sati
on e
xpen
se3,
157.
7114
,650
.51
- 17
,808
.22
96.7
7 -
17,9
04.9
9C
apit
al e
xpen
ditu
re4,
018.
5827
,783
.03
- 31
,801
.61
124.
12(1
74.9
9)31
,750
.74
Shar
e of
pro
fit/(
loss
) of e
quit
y ac
coun
ted
in
vest
ees
(net
) 2
5.21
1
,384
.37
- 1
,409
.58
83.
42
- 1
,493
.00
Segm
ent
asse
ts 6
4,89
0.05
1
,54,
654.
50
- 2
,19,
544.
55
2,2
05.1
3 (1
,023
.72)
2,2
0,72
5.96
In
vest
men
t in
equ
ity
acco
unte
d in
vest
ees
377
.31
3,8
35.7
2 -
4,2
13.0
3 3
92.9
8 -
4,6
06.0
1 Re
conc
iliat
ion
to to
tal a
sset
s:O
ther
inve
stm
ents
15,
731.
91
Cur
rent
and
non
-cur
rent
tax
ass
ets
(net
) 1
,195
.67
Def
erre
d ta
x as
sets
(net
) 4
,457
.34
Oth
er u
nallo
cate
d fin
anci
al a
sset
s 2
27,
037.
47
Tota
l ass
ets
2,7
3,75
4.36
Se
gmen
t lia
bili
ties
17,
548.
81
89,
478.
99
- 1
,07,
027.
80
747
.75
(250
.44)
1,0
7,52
5.11
R
econ
cilia
tion
to
tota
l lia
bili
ties
:Bo
rrow
ings
78,
603.
98
Cur
rent
tax
liab
iliti
es (n
et)
1,3
92.5
8 D
efer
red
tax
liab
iliti
es (n
et)
1,1
74.0
0 O
ther
una
lloca
ted
finan
cial
liab
iliti
es 3
26,
543.
63
Tota
l lia
bili
ties
2,15
,239
.30
1 Tat
a an
d ot
her
bra
nd v
ehic
les
incl
ude
Tata
Dae
woo
and
Fia
t b
rand
veh
icle
s.2 In
clud
es in
tere
st-b
eari
ng lo
ans
and
dep
osit
s an
d ac
crue
d in
tere
st in
com
e.3 In
clud
es in
tere
st a
ccru
ed a
nd o
ther
inte
rest
bea
ring
liab
iliti
es.
NO
TES
FORM
ING
PA
RT O
F CO
NSO
LID
ATED
FIN
AN
CIA
L ST
ATEM
ENTS

F-147
For t
he y
ear e
nded
/as
at M
arch
31,
201
6(₹
in c
rore
s)A
utom
otiv
e an
d re
late
d ac
tivit
yTa
ta a
nd
othe
r bra
nd
vehi
cles
(in
clud
ing
finan
cing
th
ereo
f) 1
Jagu
ar L
and
Rove
rIn
tra-
segm
ent
elim
inat
ions
Tota
lO
ther
s In
ter-
segm
ent
elim
inat
ions
T
otal
Rev
enue
s:Ex
tern
al re
venu
e 5
3,38
6.49
2
,22,
822.
93
- 2
,76,
209.
42
1,4
51.1
7 -
2,7
7,66
0.59
In
ter-
segm
ent/
intr
a-se
gmen
t re
venu
e 7
6.03
-
(63.
78)
12.
25
1,5
02.7
2 (1
,514
.97)
- To
tal r
even
ues
53,
462.
52
2,2
2,82
2.93
(6
3.78
) 2
,76,
221.
67
2,9
53.8
9 (1
,514
.97)
2,7
7,66
0.59
Earn
ings
bef
ore
othe
r inc
ome,
fina
nce
cost
an
d ta
x 2
,188
.15
19,
056.
29
- 2
1,24
4.44
4
36.2
4 (8
3.95
) 2
1,59
6.73
Reco
ncili
atio
n to
Pro
fit b
efor
e ta
x:O
ther
inco
me
885
.35
Fina
nce
cost
s (4
,889
.08)
Fore
ign
exch
ange
(gai
n)/l
oss
(net
) (1
,616
.88)
Exce
pti
onal
item
s:a)
Em
ploy
ee se
para
tion
cost
(32.
72)
b) O
ther
s (1
,817
.63)
Prof
it b
efor
e ta
x 1
4,12
5.77
Dep
reci
atio
n an
d am
orti
sati
on e
xpen
se2,
527.
5214
,100
.10
- 16
,627
.62
83.1
6 -
16,7
10.7
8C
apit
al e
xpen
ditu
re3,
681.
6127
,616
.04
- 31
,297
.65
211.
54(8
3.80
)31
,425
.39
Shar
e of
pro
fit/(
loss
) of e
quit
y ac
coun
ted
inve
stee
s (n
et)
20.
67
598
.71
- 6
19.3
8 (4
1.91
) -
577
.47
Segm
ent
asse
ts 6
0,55
0.01
1
,59,
802.
80
(10.
00)
2,2
0,34
2.81
2
,286
.84
(939
.31)
2,2
1,69
0.34
In
vest
men
t in
equ
ity
acco
unte
d in
vest
ees
373
.05
3,2
38.0
7 -
3,6
11.1
2 1
52.8
3 -
3,7
63.9
5 R
econ
cilia
tion
to
tota
l ass
ets:
Oth
er in
vest
men
ts20
,003
.07
Cur
rent
and
non
-cur
rent
tax
ass
ets
(net
) 1
,412
.56
Def
erre
d ta
x as
sets
(net
) 3
,957
.03
Oth
er u
nallo
cate
d fin
anci
al a
sset
s2 1
6,31
4.20
To
tal a
sset
s 2
,67,
141.
15
Segm
ent
liab
iliti
es 1
4,33
3.95
8
2,95
7.43
(1
0.00
) 9
7,28
1.38
8
28.4
5 (2
78.5
9) 9
7,83
1.24
R
econ
cilia
tion
to
tota
l lia
bili
ties
:Bo
rrow
ings
69,
359.
96
Cur
rent
tax
liab
iliti
es (n
et)
723
.53
Def
erre
d ta
x lia
bili
ties
(net
) 4
,474
.78
Oth
er u
nallo
cate
d fin
anci
al li
abili
ties
3 1
5,36
6.39
To
tal l
iab
iliti
es 1
,87,
755.
90
1 Tat
a an
d ot
her
bra
nd v
ehic
les
incl
ude
Tata
Dae
woo
and
Fia
t b
rand
veh
icle
s.2 In
clud
es in
tere
st-b
eari
ng lo
ans
and
dep
osit
s an
d ac
crue
d in
tere
st in
com
e.3 In
clud
es in
tere
st a
ccru
ed a
nd o
ther
inte
rest
bea
ring
liab
iliti
es.
NO
TES
FORM
ING
PA
RT O
F CO
NSO
LID
ATED
FIN
AN
CIA
L ST
ATEM
ENTS
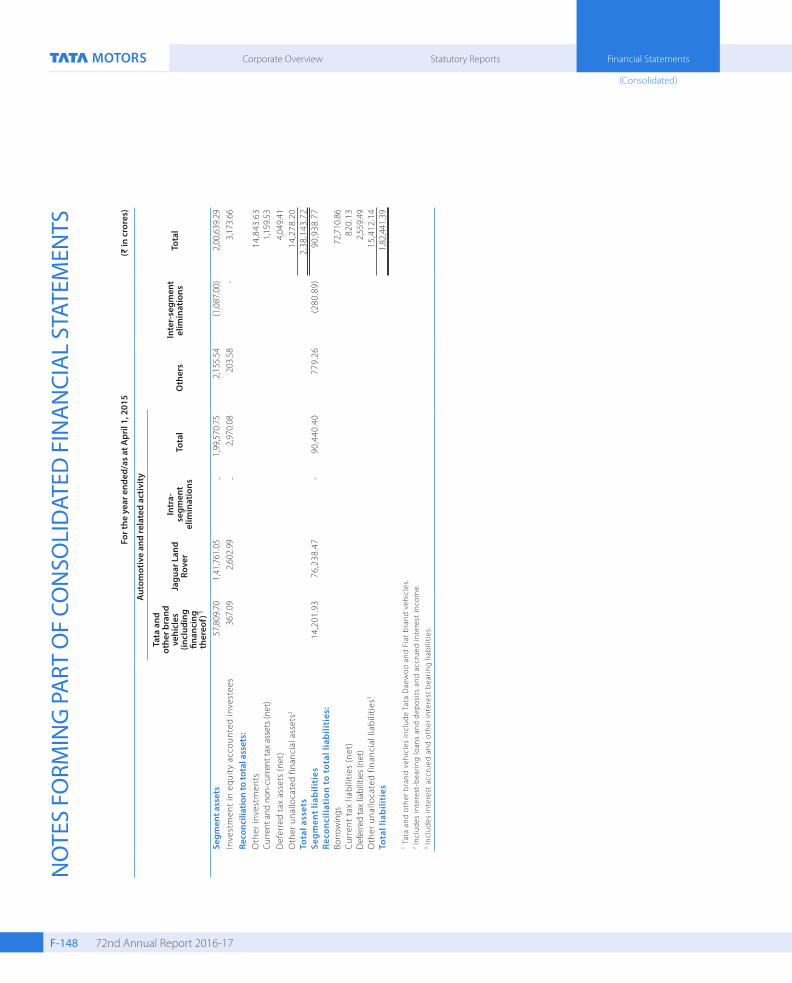
Statutory ReportsCorporate Overview Financial Statements
F-148
(Consolidated)
72nd Annual Report 2016-17
For t
he y
ear e
nded
/as
at A
pril
1, 2
015
(₹ in
cro
res)
Aut
omot
ive
and
rela
ted
activ
ity
Tata
and
ot
her b
rand
ve
hicl
es
(incl
udin
g fin
anci
ng
ther
eof)
1
Jagu
ar L
and
Rove
rIn
tra-
segm
ent
elim
inat
ions
Tota
lO
ther
s In
ter-
segm
ent
elim
inat
ions
T
otal
Segm
ent a
sset
s 5
7,80
9.70
1
,41,
761.
05
- 1
,99,
570.
75
2,1
55.5
4 (1
,087
.00)
2,0
0,63
9.29
In
vest
men
t in
equ
ity
acco
unte
d in
vest
ees
367
.09
2,6
02.9
9 -
2,9
70.0
8 2
03.5
8 -
3,1
73.6
6 Re
conc
iliat
ion
to to
tal a
sset
s:O
ther
inve
stm
ents
14,
843.
63
Curre
nt a
nd n
on-c
urre
nt ta
x as
sets
(net
) 1
,159
.53
Def
erre
d ta
x as
sets
(net
) 4
,049
.41
Oth
er u
nallo
cate
d fin
anci
al a
sset
s2 1
4,27
8.20
To
tal a
sset
s 2
,38,
143.
72
Segm
ent
liab
iliti
es 1
4,20
1.93
7
6,23
8.47
-
90,
440.
40
779
.26
(280
.89)
90,
938.
77
Rec
onci
liati
on t
o to
tal l
iab
iliti
es:
Borro
win
gs 7
2,71
0.86
C
urre
nt t
ax li
abili
ties
(net
) 8
20.1
3 D
efer
red
tax
liabi
litie
s (ne
t) 2
,559
.49
Oth
er u
nallo
cate
d fin
anci
al li
abili
ties
3 1
5,41
2.14
To
tal l
iab
iliti
es 1
,82,
441.
39
1 Tat
a an
d ot
her
bra
nd v
ehic
les
incl
ude
Tata
Dae
woo
and
Fia
t b
rand
veh
icle
s.2 In
clud
es in
tere
st-b
eari
ng lo
ans
and
dep
osit
s an
d ac
crue
d in
tere
st in
com
e.3 In
clud
es in
tere
st a
ccru
ed a
nd o
ther
inte
rest
bea
ring
liab
iliti
es.
NO
TES
FORM
ING
PA
RT O
F CO
NSO
LID
ATED
FIN
AN
CIA
L ST
ATEM
ENTS

F-149
Entity-wide disclosuresInformation concerning principal geographic areas is as follows:
(R in crores)Year ended March 31,
Net sales to external customers by geographic area by location of customers: 2017 2016
(a) India 47,101.21 46,027.25 (b) United States of America 42,935.31 43,809.17 (c) United Kingdom 50,588.18 46,209.94 (d) Rest of Europe 47,122.48 41,575.25 (e) China 41,369.40 48,760.19 (f ) Rest of the World 45,375.54 51,278.79
Total 2,74,492.12 2,77,660.59
Year ended March 31,Information about product revenues: 2017 2016
(a) Tata and Fiat vehicles 48,069.14 46,347.41(b) Tata Daewoo commercial vehicles 5,793.30 4,783.94 (c) Finance revenues 2,429.23 2,240.03(d) Jaguar Land Rover vehicles 2,16,388.82 2,22,822.93 (e) Others 1,811.63 1,466.28
Total 2,74,492.12 2,77,660.59
Non-current assets (Property, plant and equipment, Intangible assets, other non-current assets and Goodwill) by geographic area:
As at March 31, As at April 1,2017 2016 2015
(a) India 28,347.32 27,656.40 26,900.82 (b) United States of America 251.84 354.47 338.10 (c) United Kingdom 96,966.41 1,01,735.19 87,748.93 (d) Rest of Europe 1,306.66 278.63 120.61 (e) China 91.04 154.08 101.71 (f ) Rest of the World 3,005.75 3,121.01 1,843.63
Total 1,29,969.02 1,33,299.78 1,17,053.80
NOTES FORMING PART OF CONSOLIDATED FINANCIAL STATEMENTS

Statutory ReportsCorporate Overview Financial Statements
F-150
(Consolidated)
72nd Annual Report 2016-17
42. Related-Party Transactions
The Company’s related parties principally consist of Tata Sons Limited, subsidiaries and joint ventures of Tata Sons Limited, the Company’s associates and their subsidiaries, joint operations and joint ventures of the Company. The Company routinely enters into transactions with these related parties in the ordinary course of business. The Company enters into transactions for sale and purchase of products and services with its associates, joint operations and joint ventures. Transactions and balances with its own subsidiaries are eliminated on consolidation.
The following table summarizes related-party transactions and balances included in the consolidated financial statements for the year ended/as at March 31, 2017:
(R in crores)
Associates and its
subsidiariesJoint
venturesJoint
operationsTata Sons Ltd, its
subsidiaries and joint ventures
Total
Purchase of products 2,058.52 21.30 2,275.75 66.84 4,422.41
Sale of products 250.49 4,983.53 323.72 461.50 6,019.24
Services received 10.98 1,088.57 0.07 1,970.15 3,069.77
Services rendered 16.64 771.88 16.12 130.13 934.77
Bills discounted - - - 3,202.77 3,202.77
Purchase of property, plant and equipment 13.79 - - 0.11 13.90
Interest (income)/expense, dividend (income)/paid, (net) (11.10) (594.36) (12.12) 64.26 (553.32)
Amounts receivable in respect of loans and interest thereon - - - 9.33 9.33
Amounts payable in respect of loans and interest thereon 56.00 - - 105.55 161.55
Trade and other receivables 49.52 565.86 - 160.01 775.39
Trade payables 39.76 22.63 123.96 471.11 657.46
Loans given/repaid - - 132.50 90.60 223.10
Loans taken/repaid 629.00 - - 1,216.58 1,845.58
Conversion of Optionally Convertible Preference shares into Equity shares 160.00 - - - 160.00
Deposit given as security - - - 3.00 3.00
NOTES FORMING PART OF CONSOLIDATED FINANCIAL STATEMENTS

F-151
The following table summarizes related-party transactions and balances included in the consolidated financial statements for the year ended/as at March 31, 2016:
(R in crores)
Associates and its subsidiaries Joint ventures Joint operations
Tata Sons Ltd, its subsidiaries and joint
venturesTotal
Purchase of products 1,768.73 - 2,781.45 67.40 4,617.58 Sale of products 212.38 3,105.15 597.12 756.68 4,671.33 Services received 9.64 842.70 0.12 1,850.36 2,702.82 Services rendered 21.85 626.35 7.97 112.31 768.48 Bills discounted - - - 2,901.80 2,901.80 Sale of Investments - - - 7.15 7.15 Purchase of property, plant and equipment 11.45 - - 0.92 12.37 Interest (income)/expense, dividend (income)/paid, (net) (11.98) - (14.33) 37.63 11.32 Amounts receivable in respect of loans and interest thereon 160.00 - 191.78 35.34 387.12 Amounts payable in respect of loans and interest thereon 27.00 - - 106.17 133.17 Trade and other receivables 22.27 673.71 - 454.52 1,150.50 Trade payables 58.51 14.81 168.04 162.60 403.96 Loans given/repaid - - - 125.00 125.00 Loans taken/repaid 345.00 - - 918.13 1,263.13 Proceeds from issue of shares - - - 1,966.76 1,966.76 Deposit given as security - - - 3.00 3.00
NOTES FORMING PART OF CONSOLIDATED FINANCIAL STATEMENTS
The following table summarizes related-party balances included in the consolidated financial statements as at April 1, 2015:
Associates and its subsidiaries Joint ventures Joint operations
Tata Sons Ltd, its subsidiaries and joint
venturesTotal
Amounts receivable in respect of loans and interest thereon 25.66 - 183.97 100.64 310.27 Amounts payable in respect of loans and interest thereon 3.49 - - 7.81 11.30 Trade and other receivables 15.22 436.18 - 159.58 610.98 Trade payables 76.49 4.65 143.68 335.87 560.69 Loans given/repaid - - - 95.00 95.00 Loans taken/repaid 94.00 - - - 94.00 Purchase of unquoted equity shares - 1,225.86 - - 1,225.86 Purchase of Optionally Convertible Preference shares 160.00 - - - 160.00 Deposit given as security - - - 3.00 3.00
Compensation of key management personnel:
Year ended March 31,2017 2016
Short-term benefits^ 69.31 55.78
Post-employment benefits* 18.47 11.20
^ Includes R8.08 crores (R4.61 crores for the year 2015 -2016) of managerial remuneration which is subject to the approval of Central Government.
* Excludes provision for encashable leave and gratuity for certain key management personnels as a separate actuarial valuation is not available.
Year ended March 31,
Other transactions with key management personnel: 2017 2016
Issue of shares pursuant to rights issue - 0.08 Sale of products 0.81 1.10 Dividend Paid - ** -
** amount less than R50,000/-Refer note 36 for information on transactions with post-employment benefit plans.
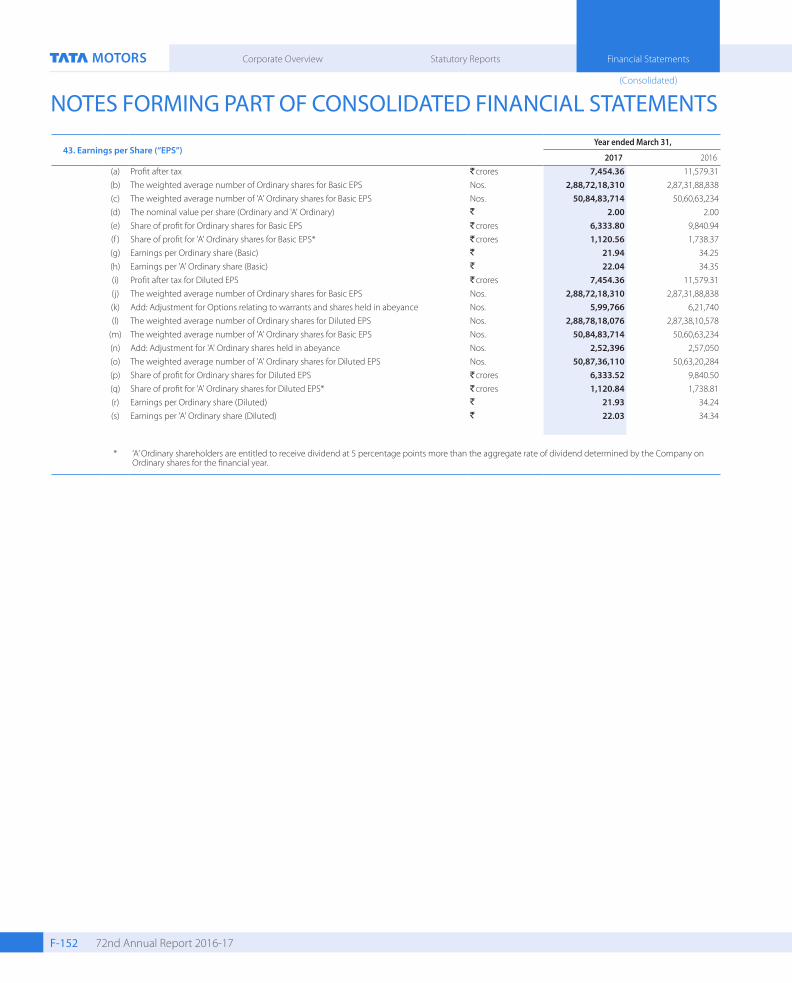
Statutory ReportsCorporate Overview Financial Statements
F-152
(Consolidated)
72nd Annual Report 2016-17
43. Earnings per Share (“EPS”) Year ended March 31,
2017 2016(a) Profit after tax Rcrores 7,454.36 11,579.31 (b) The weighted average number of Ordinary shares for Basic EPS Nos. 2,88,72,18,310 2,87,31,88,838 (c) The weighted average number of 'A' Ordinary shares for Basic EPS Nos. 50,84,83,714 50,60,63,234 (d) The nominal value per share (Ordinary and 'A' Ordinary) R 2.00 2.00 (e) Share of profit for Ordinary shares for Basic EPS Rcroress 6,333.80 9,840.94 (f ) Share of profit for 'A' Ordinary shares for Basic EPS* Rcroress 1,120.56 1,738.37 (g) Earnings per Ordinary share (Basic) R 21.94 34.25 (h) Earnings per 'A' Ordinary share (Basic) R 22.04 34.35 (i) Profit after tax for Diluted EPS Rcrores 7,454.36 11,579.31 (j) The weighted average number of Ordinary shares for Basic EPS Nos. 2,88,72,18,310 2,87,31,88,838 (k) Add: Adjustment for Options relating to warrants and shares held in abeyance Nos. 5,99,766 6,21,740 (l) The weighted average number of Ordinary shares for Diluted EPS Nos. 2,88,78,18,076 2,87,38,10,578
(m) The weighted average number of 'A' Ordinary shares for Basic EPS Nos. 50,84,83,714 50,60,63,234 (n) Add: Adjustment for 'A' Ordinary shares held in abeyance Nos. 2,52,396 2,57,050 (o) The weighted average number of 'A' Ordinary shares for Diluted EPS Nos. 50,87,36,110 50,63,20,284 (p) Share of profit for Ordinary shares for Diluted EPS Rcrores 6,333.52 9,840.50 (q) Share of profit for 'A' Ordinary shares for Diluted EPS* Rcrores 1,120.84 1,738.81 (r) Earnings per Ordinary share (Diluted) R 21.93 34.24 (s) Earnings per 'A' Ordinary share (Diluted) R 22.03 34.34
* ‘A’ Ordinary shareholders are entitled to receive dividend at 5 percentage points more than the aggregate rate of dividend determined by the Company on Ordinary shares for the financial year.
NOTES FORMING PART OF CONSOLIDATED FINANCIAL STATEMENTS

F-153
NOTES FORMING PART OF CONSOLIDATED FINANCIAL STATEMENTS Name of enterprises (Rin crores)
As % of consolidated
net assets
Net Assets (total assets minus total
liabilities)
As % of consolidated profit or loss
Share of profit or
loss
As % of consolidated
OCI
Share of OCI
As % of total comprehensive
income
Total comprehensive
income
Parent Tata Motors Ltd 32.80% 20,553.79 -34.85% (2,597.62) -0.36% 98.68 12.49% (2,498.94)Subsidiaries IndianTAL Manufacturing Solutions Ltd 0.14% 85.35 0.16% 11.89 0.00% 0.55 -0.06% 12.44 TML Drivelines Ltd 1.30% 812.63 0.69% 51.19 0.00% (1.27) -0.25% 49.92 Concorde Motors (India) Ltd 0.20% 123.69 -0.60% (44.91) 0.00% (0.16) 0.23% (45.07)Sheba Properties Ltd -0.49% (308.97) 21.33% 1,590.01 -0.03% 8.98 -7.99% 1,598.99 Tata Technologies Ltd 1.20% 752.71 2.87% 214.05 0.01% (3.39) -1.05% 210.66 Tata Motors Insurance Broking & Advisory Services Ltd 0.04% 22.86 0.14% 10.50 0.00% 0.04 -0.05% 10.54 TML Distribution Company Ltd 0.49% 304.05 0.36% 26.83 0.00% 0.26 -0.14% 27.09 Tata Motors Finance Ltd 4.92% 3,081.42 -16.86% (1,256.58) 0.00% 1.03 6.28% (1,255.55)Tata Motors Financial Solutions Ltd 1.93% 1,207.06 -6.33% (471.61) 0.00% (0.34) 2.36% (471.95)Tata Marcopolo Motors Ltd 0.18% 110.75 0.18% 13.45 0.00% (0.43) -0.07% 13.02 Jaguar Land Rover India Limited 0.41% 254.33 0.90% 67.09 0.00% - -0.34% 67.09 ForeignTata Daewoo Commercial Vehicle Co. Ltd 3.75% 2,347.61 3.90% 290.68 -0.11% 29.43 -1.60% 320.11 Tata Motors European Technical Centre Plc 0.49% 306.12 -0.65% (48.66) 0.00% - 0.24% (48.66)Tata Motors (SA) (Proprietary) Ltd 0.02% 11.42 0.01% 0.84 0.00% 0.45 -0.01% 1.29 Tata Motors (Thailand) Ltd -0.61% (379.84) -1.36% (101.70) 0.00% 0.80 0.50% (100.90)TML Holdings Pte Ltd, Singapore 16.29% 10,209.63 10.87% 810.59 0.00% - -4.05% 810.59 Tata Hispano Motors Carrocera S.A -1.03% (647.94) -0.12% (9.29) -0.20% 53.92 -0.22% 44.63 Tata Hispano Motors Carroceries Maghreb -0.04% (22.46) -0.10% (7.43) 0.18% (49.02) 0.28% (56.45)Trilix S.r.l 0.08% 52.08 0.20% 15.19 0.02% (5.08) -0.05% 10.11 Tata Precision Industries Pte Ltd 0.00% 0.93 0.00% (0.07) 0.00% (0.06) 0.00% (0.13)PT Tata Motors Indonesia 0.25% 158.40 -0.03% (2.00) 0.00% 0.72 0.01% (1.28)INCAT International Plc 0.06% 39.01 -0.01% (0.39) 0.03% (7.03) 0.04% (7.42)Tata Technologies Inc 0.55% 344.89 0.21% 15.91 0.03% (7.40) -0.04% 8.51 INCAT Solutions of Canada Inc. (Liquidated w.e.f December 13, 2016) 0.00% - 0.00% - -0.01% 1.77 -0.01% 1.77 Tata Technologies de Mexico, S.A. de C.V. 0.01% 5.62 0.03% 2.14 0.00% (0.20) -0.01% 1.94 Tata Technologies Europe Ltd 0.92% 573.78 1.47% 109.28 0.40% (109.62) 0.00% (0.34)INCAT GmbH. 0.02% 15.10 0.00% 0.33 0.00% (1.31) 0.00% (0.98)Tata Technologies (Thailand) Ltd 0.01% 7.23 0.00% 0.06 0.00% (0.08) 0.00% (0.02)Tata Technologies Pte. Ltd 1.16% 725.17 -0.05% (3.94) 0.06% (15.34) 0.10% (19.28)Cambric Limited, Bahama 0.03% 19.20 -0.01% (0.50) 0.00% - 0.00% (0.50)Cambric UK Ltd. 0.00% 0.00 -0.05% (3.68) 0.00% (0.25) 0.02% (3.93)Cambric GmbH 0.00% 1.96 0.00% 0.14 0.00% (0.12) 0.00% 0.02 Midwest Managed Services, Utah 0.00% 2.18 0.02% 1.48 0.00% - -0.01% 1.48 Tata Technologies SRL, Romania 0.03% 17.93 0.06% 4.22 0.00% (1.37) -0.01% 2.85 Cambric Manufacturing Technologies (Shanghai) Co. Ltd. 0.04% 25.56 0.27% 20.13 0.01% (1.63) -0.09% 18.50 Jaguar Land Rover Automotive Plc 25.65% 16,073.26 35.11% 2,616.96 0.00% - -13.08% 2,616.96 Jaguar Land Rover Limited 88.06% 55,183.97 106.17% 7,914.08 84.39% (23,174.21) 76.28% (15,260.13)Jaguar Land Rover Holdings Limited (formerly known as Land Rover) 64.55% 40,450.88 26.21% 1,953.81 0.00% - -9.77% 1,953.81 JLR Nominee Company Limited (formerly known as Jaguar Land Rover Exports Ltd) 0.00% - 0.00% - 0.00% - 0.00% -
Jaguar Land Rover North America, LLC 0.97% 607.95 2.32% 172.83 0.00% (0.47) -0.86% 172.36 Jaguar Land Rover Deutschland GmbH 0.90% 566.73 1.23% 91.65 0.00% - -0.46% 91.65 Jaguar Land Rover Austria GmbH 0.13% 79.86 0.18% 13.16 0.00% - -0.07% 13.16 Jaguar Land Rover Italia SpA 0.65% 409.90 1.33% 99.06 0.00% - -0.50% 99.06 Jaguar Land Rover Portugal-Veiculos e Pecas, Lda. 0.00% (0.10) 0.06% 4.42 0.00% - -0.02% 4.42 Jaguar Land Rover France SAS 0.19% 121.44 0.44% 32.45 0.00% - -0.16% 32.45 Jaguar Land Rover Australia Pty Limited 0.17% 106.53 1.46% 108.89 0.00% - -0.54% 108.89 Jaguar Land Rover Automotive Trading (Shanghai) Co. Ltd 13.47% 8,443.53 93.09% 6,939.08 0.00% - -34.69% 6,939.08 Jaguar Land Rover Japan Limited 0.46% 290.64 0.60% 44.43 0.00% - -0.22% 44.43 Jaguar Land Rover Korea Company Limited 0.22% 137.11 1.64% 122.15 0.00% - -0.61% 122.15 Jaguar Land Rover Canada ULC 0.27% 168.63 1.80% 134.53 0.00% - -0.67% 134.53 Jaguar e Land Rover Brasil Indústria e Comércio de Veículos LTDA 0.80% 499.67 -8.48% (631.94) 0.00% - 3.16% (631.94)Limited Liability Company "Jaguar Land Rover" (Russia) 1.01% 634.25 8.59% 640.55 0.00% - -3.20% 640.55 "Jaguar Land Rover (South Africa) (Pty) Ltd 0.38% 241.25 1.78% 132.84 0.00% - -0.66% 132.84 Jaguar Land Rover Belux NV 0.12% 73.08 0.36% 26.79 0.00% - -0.13% 26.79
44. Additional information as required under Schedule III to the Companies Act, 2013, of enterprises consolidated as subsidiary / Associates / Joint Ventures

Statutory ReportsCorporate Overview Financial Statements
F-154
(Consolidated)
72nd Annual Report 2016-17
Name of enterprises (Rin crores)
As % of consolidated
net assets
Net Assets (total assets minus total
liabilities)
As % of consolidated profit or loss
Share of profit or
loss
As % of consolidated
OCI
Share of OCI
As % of total comprehensive
income
Total comprehensive
income
Jaguar Land Rover South Africa Holdings Limited 2.15% 1,344.92 2.42% 180.37 0.00% - -0.90% 180.37 Land Rover Ireland Limited 0.01% 7.12 0.01% 0.53 0.00% - 0.00% 0.53 Jaguar Land Rover Espana SL (formerly known as Land Rover Espana SL) 0.66% 412.48 0.90% 66.79 0.00% 0.14 -0.33% 66.93 Jaguar Land Rover Nederland BV 0.06% 36.80 0.27% 20.49 0.00% - -0.10% 20.49 The Lanchester Motor Company Limited 0.00% - 0.00% - 0.00% - 0.00% - The Daimler Motor Company Limited 0.02% 12.14 0.00% - 0.00% - 0.00% - S S Cars Limited 0.00% - 0.00% - 0.00% - 0.00% - Daimler Transport Vehicles Limited 0.00% - 0.00% - 0.00% - 0.00% - The Jaguar Collection Limited 0.00% - 0.00% - 0.00% - 0.00% - Jaguar Cars (South Africa) (Pty) Ltd 0.00% - 0.00% - 0.00% - 0.00% - Jaguar Cars Ltd 0.00% - 0.00% - 0.00% - 0.00% - Land Rover Exports Ltd (non-trading) 0.00% - 0.00% - 0.00% - 0.00% - Jaguar Land Rover Pension Trustees Limited 0.00% - 0.00% - 0.00% - 0.00% - Shanghai Jaguar Land Rover Automotive Services Company Ltd 0.00% 2.60 -0.02% (1.51) 0.00% - 0.01% (1.51)Jaguar Land Rover Slovakia s.r.o 0.27% 171.68 -0.08% (6.23) -0.05% 14.92 -0.04% 8.69 Jaguar Land Rover Singapore Pte Ltd 0.03% 16.74 0.20% 14.73 0.00% - -0.07% 14.73 Jaguar Racing Limited 0.03% 18.47 0.27% 19.88 0.00% - -0.10% 19.88 Jaguar Land Rover Colombia SAS 0.01% 8.92 0.02% 1.76 0.00% - -0.01% 1.76 InMotion Ventures Limited -0.08% (49.23) -0.71% (52.98) 0.00% - 0.26% (52.98)Tata Daewoo Commercial Vehicle Sales and Distribution Co. Ltd. 0.04% 23.27 0.05% 3.55 0.00% (0.94) -0.01% 2.61 PT Tata Motors Distribusi Indonesia -0.01% (8.53) -0.60% (44.56) 0.00% - 0.22% (44.56)TMNL Motor Services Nigeria Ltd 0.00% (0.07) 0.00% (0.20) 0.00% (0.33) 0.00% (0.53)Minority Interests in all subsidiaries IndianConcorde Motors (India) Ltd 0.00% - 0.00% - 0.00% 0.00% - Tata Marcopolo Motors Ltd -0.09% (54.17) -0.09% (6.59) 0.00% 0.21 0.03% (6.38)Tata Motors Finance Ltd 0.00% - 0.00% - 0.00% 0.00% - Tata Technologies Ltd -0.64% (401.75) -1.30% (97.03) -0.12% 33.25 0.32% (63.78)ForeignTata Motors (SA) (Proprietary) Ltd -0.01% (4.56) 0.00% (0.34) 0.00% (0.18) 0.00% (0.52)Tata Precision Industries Pte Ltd 0.00% (0.22) 0.00% - 0.00% 0.00% - Tata Motors (Thailand) Limited 0.03% 19.57 0.06% 4.80 0.00% (0.03) -0.02% 4.77 Trilix S.r.l -0.02% (12.04) -0.04% (3.04) 0.00% 1.02 0.01% (2.02)Joint operationsIndianFiat India Automobiles Private Limited 2.40% 1,503.66 1.90% 141.32 0.00% (0.83) -0.70% 140.49 Tata Cummins Private Ltd 0.61% 381.87 0.42% 31.12 0.01% (2.38) -0.14% 28.74 Adjustments arising out of consolidation -175.96% (110,269.60) -180.23% (13,434.83) 14.62% (4,014.30) 87.22% (17,449.13)
Sub - total ( a ) 58,061.89 5,961.36 (27,151.60) (21,190.24)
Joint ventures (as per proportionate consolidation/investment as per the equity methodIndianTata HAL Technologies Ltd 0.00% - -0.03% (2.30) 0.00% - 0.01% (2.30)ForeignSpark 44 Ltd 0.10% 64.77 0.40% 29.95 0.05% (13.03) -0.08% 16.92Chery Jaguar Land Rover Automotive Co Ltd 5.85% 3,668.61 18.17% 1,354.42 1.02% (280.16) -5.37% 1,074.26 Sub - total ( b ) 3,733.38 1,382.07 (293.19) 1,088.88 Associates (Investment as per the equity method)IndianTata AutoComp Systems Ltd 0.34% 212.06 0.19% 13.90 0.01% (3.66) -0.05% 10.24 Automobile Corporation of Goa Ltd 0.22% 136.83 0.10% 7.10 0.00% (0.01) -0.04% 7.09 Tata Hitachi Construction Machinery Company Private Ltd 0.63% 392.98 1.15% 85.72 0.01% (3.27) -0.41% 82.45 ForeignNita Company Ltd 0.05% 28.42 0.06% 4.21 0.00% (0.97) -0.02% 3.24 Tata Precision Industries (India) Ltd - - - - 0.00% - 0.00% - Synaptiv Limited 0.00% 1.37 - - 0.00% - 0.00% - CloudCar Inc 0.15% 96.96 - - 0.03% (7.60) 0.04% (7.60)Jaguar Cars Finance Limited 0.01% 3.91 0.00% - 0.00% - 0.00% - Sub - total ( c ) 872.39 110.93 (15.51) 95.42
Total ( b + c ) 4,606.01 100.00% 1,493.00 100.00% (308.70) 100.00% 1,184.30
Total ( a + b ) 100.00% 62,667.90 100.00% 7,454.36 100.00% (27,460.30) 100.00% (20,005.94)

F-155
(Amount in R)
Particulars SBNsOther
denomination notes
Total
Closing cash in hand as on November 8, 2016 9,59,50,250 1,07,28,889 10,66,79,139 (+) Non-permitted receipts 79,500 - 79,500 (+) Permitted receipts - 1,85,09,67,818 1,85,09,67,818 (-) Permitted payments 4,99,500 2,61,55,712 2,66,55,212 (-) Amount deposited in banks 9,55,30,250 1,72,69,17,216 1,82,24,47,466 Closing cash in hand as on December 30, 2016 - 10,86,23,779 10,86,23,779
(b) “Exceptional item VI (b)” of R147.93 crores for the year ended March 31, 2017, relates to provision for inventory of BS III vehicles as at March 31, 2017. This does not include higher level of customer discounts and variable marketing expenses in March 2017, to support higher level of retail sales which have been netted off against “Income from operations”.
(c) The following subsidiaries have been considered on Unaudited basis. Details for the same as per individual entity’s financials are as under :
(R in crores)
Particulars
Net Worth As at
March 31, 2017
Total Revenue for the year ended March 31, 2017
Net Increase / (Decrease) in Cash & Cash equivalent
during 2016-2017
Subsidiaries : Tata Motors European Technical Centre Plc 306.12 216.33 (36.86) Trilix S.r.l 52.09 119.26 8.66 Tata Precision Industries Pte Ltd 0.94 - (0.16) Tata Hispano Motors Carrocera S.A (647.95) 0.56 (0.29) Tata Hispano Motors Carroceries Maghreb S.A (22.46) 0.36 (17.46) Total (311.26) 336.51 (46.11)For the year ended/as at March 31, 2016 (406.42) 398.72 41.83
45. Other Notes (a) Disclosure on Specified Bank Notes (SBNs) As required by MCA notification G.S.R. 308 (E) dated March 30, 2017, details in respect of Specified Bank Notes (SBNs) held and transacted during the period
from November 8, 2016 to December 30, 2016 are given below:
NOTES FORMING PART OF CONSOLIDATED FINANCIAL STATEMENTS
For and on behalf of the Board
R A MASHELKAR [DIN: 00074119]
N MUNJEE [DIN: 00010180]
V K JAIRATH [DIN: 00391684]
O P BHATT [DIN:00548091]
R SPETH [DIN: 03318908]Directors
N CHANDRASEKARAN [DIN: 00121863]
Chairman
GUENTER BUTSCHEK [DIN: 07427375] CEO & Managing Director R PISHARODY [DIN: 01875848] Executive Director S B BORWANKAR [DIN: 01793948] Executive Director C RAMAKRISHNAN Group Chief Financial Officer
H K SETHNA [FCS: 3507]Company Secretary
Mumbai, May 23, 2017
(d) The Company has a process whereby periodically all long term contracts (including derivative contracts) are assessed for material foreseeable losses. At the year end, the Company has reviewed and ensured that adequate provision are required under any law/accounting standards for material foreseeable losses on such long term contracts (including derivative contracts) has been made in the books of account.
(e) Current period figures are shown in bold prints.
Name of enterprises (Rin crores)
As % of consolidated
net assets
Net Assets (total assets minus total
liabilities)
As % of consolidated profit or loss
Share of profit or
loss
As % of consolidated
OCI
Share of OCI
As % of total comprehensive
income
Total comprehensive
income
Jaguar Land Rover South Africa Holdings Limited 2.15% 1,344.92 2.42% 180.37 0.00% - -0.90% 180.37 Land Rover Ireland Limited 0.01% 7.12 0.01% 0.53 0.00% - 0.00% 0.53 Jaguar Land Rover Espana SL (formerly known as Land Rover Espana SL) 0.66% 412.48 0.90% 66.79 0.00% 0.14 -0.33% 66.93 Jaguar Land Rover Nederland BV 0.06% 36.80 0.27% 20.49 0.00% - -0.10% 20.49 The Lanchester Motor Company Limited 0.00% - 0.00% - 0.00% - 0.00% - The Daimler Motor Company Limited 0.02% 12.14 0.00% - 0.00% - 0.00% - S S Cars Limited 0.00% - 0.00% - 0.00% - 0.00% - Daimler Transport Vehicles Limited 0.00% - 0.00% - 0.00% - 0.00% - The Jaguar Collection Limited 0.00% - 0.00% - 0.00% - 0.00% - Jaguar Cars (South Africa) (Pty) Ltd 0.00% - 0.00% - 0.00% - 0.00% - Jaguar Cars Ltd 0.00% - 0.00% - 0.00% - 0.00% - Land Rover Exports Ltd (non-trading) 0.00% - 0.00% - 0.00% - 0.00% - Jaguar Land Rover Pension Trustees Limited 0.00% - 0.00% - 0.00% - 0.00% - Shanghai Jaguar Land Rover Automotive Services Company Ltd 0.00% 2.60 -0.02% (1.51) 0.00% - 0.01% (1.51)Jaguar Land Rover Slovakia s.r.o 0.27% 171.68 -0.08% (6.23) -0.05% 14.92 -0.04% 8.69 Jaguar Land Rover Singapore Pte Ltd 0.03% 16.74 0.20% 14.73 0.00% - -0.07% 14.73 Jaguar Racing Limited 0.03% 18.47 0.27% 19.88 0.00% - -0.10% 19.88 Jaguar Land Rover Colombia SAS 0.01% 8.92 0.02% 1.76 0.00% - -0.01% 1.76 InMotion Ventures Limited -0.08% (49.23) -0.71% (52.98) 0.00% - 0.26% (52.98)Tata Daewoo Commercial Vehicle Sales and Distribution Co. Ltd. 0.04% 23.27 0.05% 3.55 0.00% (0.94) -0.01% 2.61 PT Tata Motors Distribusi Indonesia -0.01% (8.53) -0.60% (44.56) 0.00% - 0.22% (44.56)TMNL Motor Services Nigeria Ltd 0.00% (0.07) 0.00% (0.20) 0.00% (0.33) 0.00% (0.53)Minority Interests in all subsidiaries IndianConcorde Motors (India) Ltd 0.00% - 0.00% - 0.00% 0.00% - Tata Marcopolo Motors Ltd -0.09% (54.17) -0.09% (6.59) 0.00% 0.21 0.03% (6.38)Tata Motors Finance Ltd 0.00% - 0.00% - 0.00% 0.00% - Tata Technologies Ltd -0.64% (401.75) -1.30% (97.03) -0.12% 33.25 0.32% (63.78)ForeignTata Motors (SA) (Proprietary) Ltd -0.01% (4.56) 0.00% (0.34) 0.00% (0.18) 0.00% (0.52)Tata Precision Industries Pte Ltd 0.00% (0.22) 0.00% - 0.00% 0.00% - Tata Motors (Thailand) Limited 0.03% 19.57 0.06% 4.80 0.00% (0.03) -0.02% 4.77 Trilix S.r.l -0.02% (12.04) -0.04% (3.04) 0.00% 1.02 0.01% (2.02)Joint operationsIndianFiat India Automobiles Private Limited 2.40% 1,503.66 1.90% 141.32 0.00% (0.83) -0.70% 140.49 Tata Cummins Private Ltd 0.61% 381.87 0.42% 31.12 0.01% (2.38) -0.14% 28.74 Adjustments arising out of consolidation -175.96% (110,269.60) -180.23% (13,434.83) 14.62% (4,014.30) 87.22% (17,449.13)
Sub - total ( a ) 58,061.89 5,961.36 (27,151.60) (21,190.24)
Joint ventures (as per proportionate consolidation/investment as per the equity methodIndianTata HAL Technologies Ltd 0.00% - -0.03% (2.30) 0.00% - 0.01% (2.30)ForeignSpark 44 Ltd 0.10% 64.77 0.40% 29.95 0.05% (13.03) -0.08% 16.92Chery Jaguar Land Rover Automotive Co Ltd 5.85% 3,668.61 18.17% 1,354.42 1.02% (280.16) -5.37% 1,074.26 Sub - total ( b ) 3,733.38 1,382.07 (293.19) 1,088.88 Associates (Investment as per the equity method)IndianTata AutoComp Systems Ltd 0.34% 212.06 0.19% 13.90 0.01% (3.66) -0.05% 10.24 Automobile Corporation of Goa Ltd 0.22% 136.83 0.10% 7.10 0.00% (0.01) -0.04% 7.09 Tata Hitachi Construction Machinery Company Private Ltd 0.63% 392.98 1.15% 85.72 0.01% (3.27) -0.41% 82.45 ForeignNita Company Ltd 0.05% 28.42 0.06% 4.21 0.00% (0.97) -0.02% 3.24 Tata Precision Industries (India) Ltd - - - - 0.00% - 0.00% - Synaptiv Limited 0.00% 1.37 - - 0.00% - 0.00% - CloudCar Inc 0.15% 96.96 - - 0.03% (7.60) 0.04% (7.60)Jaguar Cars Finance Limited 0.01% 3.91 0.00% - 0.00% - 0.00% - Sub - total ( c ) 872.39 110.93 (15.51) 95.42
Total ( b + c ) 4,606.01 100.00% 1,493.00 100.00% (308.70) 100.00% 1,184.30
Total ( a + b ) 100.00% 62,667.90 100.00% 7,454.36 100.00% (27,460.30) 100.00% (20,005.94)

Statutory ReportsCorporate Overview Financial Statements
(Subsidary companies)
F-156 72nd Annual Report 2016-17
Statement pursuant to first proviso to sub-section (3) of section 129 of the Companies Act 2013, read with rule 5 of Companies (Accounts) Rules, 2014 in the prescribed Form AOC-1 relating to subsidiary companiesPart - A
(` in crores)
Sr.
No
Subsidiary Country Reporting currency
Exchange Rate
Share capital (incl.
advances towards
capital where applicable)
Reserves and
Surplus
Total Assets
Total Liabilities
Turnover Profit/ (Loss)
Before Tax
Tax Expense/ (Credit)
Profit/(Loss) after tax
Profit/ (Loss)for
the period/ year *
Proposed dividend and tax thereon
Investments (except in case of investment
in the subsidiaries)
% of
shareholding
1 TAL Manufacturing Solutions Ltd (subsidiary w.e.f March 13, 2000) India INR 1.00 115.00 (29.65) 519.80 434.45 329.80 11.89 - 11.89 11.89 - - 100.00
2 TML Drivelines Ltd (subsidiary w.e.f March 13, 2000) India INR 1.00 77.00 735.63 1,037.42 224.79 524.03 65.14 13.95 51.19 51.19 - 36.50 100.00
3 Concorde Motors (India) Ltd (subsidiary w.e.f July 3, 1999) India INR 1.00 126.38 (2.69) 702.03 578.34 1,126.46 (44.91) - (44.91) (44.91) - - 100.00
4 Sheba Properties Ltd (subsidiary w.e.f January 24, 1989) India INR 1.00 491.49 (800.46) 16,326.92 16,635.89 479.11 1,589.80 (0.21) 1,590.01 1,590.01 - 189.81 100.00
5 Tata Daewoo Commercial Vehicle Co. Ltd (subsidiary w.e.f March 30, 2004) South Korea KRW 0.06 57.57 2,290.04 3,808.19 1,460.58 6,034.32 382.67 91.99 290.68 290.68 - - 100.00
6 Tata Technologies Ltd (subsidiary w.e.f September 10, 1997) India INR 1.00 43.03 709.68 1,043.61 290.90 1,112.08 264.51 50.46 214.05 214.05 - 210.44 72.32
7 Tata Motors Insurance Broking & Advisory Services Ltd (subsidiary w.e.f October 21, 2004) India INR 1.00 2.50 20.36 30.22 7.36 45.16 15.98 5.48 10.50 10.50 - 10.66 100.00
8 Tata Motors European Technical Centre Plc (subsidiary w.e.f September 1, 2005) UK GBP 80.92 474.57 (168.45) 406.49 100.37 216.33 (42.07) 6.59 (48.66) (48.66) - - 100.00
9 TML Distribution Company Ltd (subsidiary w.e.f March 28, 2008) India INR 1.00 225.00 79.05 673.60 369.55 2,573.76 41.90 15.07 26.83 26.83 - - 100.00
10 Tata Motors (SA) (Proprietary) Ltd (subsidiary w.e.f December 5, 2007) South Africa ZAR 4.81 12.98 (1.56) 106.25 94.83 87.35 1.07 0.23 0.84 0.84 - - 60.00
11 Tata Motors Finance Ltd (subsidiary w.e.f June 1, 2006) India INR 1.00 1,319.02 1,762.40 5,508.15 2,426.73 1,850.12 (856.29) 400.28 (1,256.57) (1,256.57) - 178.03 100.00
12 Tata Motors Finance Solutions Ltd (subsidiary w.e.f January 19, 2015) India INR 1.00 1,700.50 (493.44) 5,161.03 3,953.97 395.61 (466.36) 5.25 (471.61) (471.61) - 769.58 100.00
13 Tata Marcopolo Motors Ltd (subsidiary w.e.f September 20, 2006) India INR 1.00 170.00 (59.25) 420.31 309.56 572.25 13.45 - 13.45 13.45 - - 51.00
14 Tata Motors (Thailand) Ltd (subsidiary w.e.f February 28, 2008) Thailand THB 1.89 525.41 (905.25) 416.68 796.52 108.03 (101.70) - (101.70) (101.70) - - 95.28
15 TML Holdings Pte Ltd, Singapore (subsidiary w.e.f February 4, 2008) Singapore GBP 80.92 10791.87 (582.24) 17609.82 7400.19 - 817.63 7.04 810.59 810.59 - - 100.00
16 Tata Hispano Motors Carrocera S.A (subsidiary w.e.f October 16, 2009) Spain EUR 69.30 2.88 (650.82) 44.57 692.51 0.56 (9.29) - (9.29) (9.29) - - 100.00
17 Tata Hispano Motors Carroceries Maghreb (subsidiary w.e.f June 23, 2014) Morocco MAD 6.45 146.30 (168.76) 43.51 65.97 0.36 (7.43) - (7.43) (7.43) - - 100.00
18 Trilix S.r.l (subsidiary w.e.f October 4, 2010) Italy EUR 69.30 0.61 51.47 75.08 23.00 119.26 21.78 6.59 15.19 15.19 - - 80.00
19 Tata Precision Industries Pte Ltd (subsidiary w.e.f February 15, 2011) Singapore SGD 46.42 41.56 (40.63) 0.94 0.01 - (0.07) - (0.07) (0.07) - - 78.39
20 PT Tata Motors Indonesia(subsidiary w.e.f December 29, 2011 Indonesia IDR 0.00 209.55 (51.15) 162.82 4.42 - (1.98) 0.02 (2.00) (2.00) - - 100.00
21 INCAT International Plc (subsidiary w.e.f October 3, 2005) UK GBP 80.92 2.07 36.94 40.77 1.76 0.05 (0.39) - (0.39) (0.39) - - 72.32
22 Tata Technologies Inc (subsidiary w.e.f October 3, 2005) USA USD 64.85 776.28 (431.39) 452.87 107.98 760.17 27.62 11.71 15.91 15.91 - - 72.37
23INCAT Solutions of Canada Inc. (Liquidated w.e.f December 13, 2016) (Tata Technologies Canada Inc) (subsidiary w.e.f October 3, 2005)
USA CAD 48.59 - - - - - - - - - - - 72.37
24 Tata Technologies de Mexico, S.A. de C.V.(subsidiary w.e.f October 3, 2005) USA MXN 3.46 1.01 4.62 10.87 5.24 22.64 2.14 - 2.14 2.14 - - 72.37
25 Tata Technologies Europe Ltd (subsidiary w.e.f October 3, 2005) UK GBP 80.92 0.09 573.68 953.75 379.97 1,161.98 137.55 28.27 109.28 109.28 - - 72.32
26 INCAT GmbH. (subsidiary w.e.f October 3, 2005) Germany EUR 69.30 0.95 14.15 15.61 0.51 0.35 0.33 - 0.33 0.33 - - 72.32
27 Tata Technologies (Thailand) Ltd (subsidiary w.e.f October 10, 2005) Thailand THB 1.89 4.58 2.65 8.82 1.59 12.19 0.06 - 0.06 0.06 - - 72.32
28 Tata Technologies Pte. Ltd (subsidiary w.e.f December 7, 2005) Singapore USD 64.85 251.56 473.62 731.03 5.86 35.62 (4.04) (0.10) (3.94) (3.94) - - 72.32
29 Cambric Limited, Bahama (subsidiary w.e.f May 1, 2013) USA USD 64.85 17.51 1.69 21.02 1.82 3.31 (0.50) - (0.50) (0.50) - - 72.32
30 Cambric UK Ltd.(subsidiary w.e.f May 1, 2013) UK EUR 69.30 0.00 0.00 0.00 - (0.04) (3.43) 0.25 (3.68) (3.68) - - 72.32
31 Cambric GmbH (subsidiary w.e.f May 1, 2013) Germany EUR 69.30 0.20 1.77 1.96 - 0.07 (0.10) (0.24) 0.14 0.14 - - 72.32
32 Midwest Managed Services, Utah (subsidiary w.e.f May 1, 2013) USA USD 64.85 0.00 2.18 2.38 0.20 5.40 1.48 - 1.48 1.48 - - 72.32
33 Tata Technologies SRL, Romania (subsidiary w.e.f May 1, 2013) Romania RON 15.16 8.79 9.13 22.20 4.28 56.91 4.59 0.37 4.22 4.22 - - 72.32
34 Cambric Manufacturing Technologies (Shanghai) Co. Ltd.(subsidiary w.e.f March 10, 2014) China CNY 9.42 3.05 22.51 56.09 30.53 134.46 28.72 8.59 20.13 20.13 - - 72.32
35 Jaguar Land Rover Automotive Plc (subsidiary w.e.f June 2, 2008) UK GBP 80.92 12,145.87 3,940.73 44,092.51 28,005.91 - 2,431.60 (8.09) 2,439.69 2,439.69 - - 100.00
36 Jaguar Land Rover Limited (subsidiary w.e.f June 2, 2008) UK GBP 80.92 28,815.09 18,425.15 182,309.47 135,069.23 169,394.87 6,772.88 89.01 6,683.87 6,683.87 - 12,000.21 100.00
37 Jaguar Land Rover Holdings Limited (formerly known as Land Rover) (subsidiary w.e.f June 2, 2008) UK GBP 80.92 40.46 40,933.45 44,610.39 3,636.48 - 1,941.24 125.42 1,815.81 1,815.81 - - 100.00
38 JLR Nominee Company Limited (formerly known as Jaguar Land Rover Exports Ltd)(subsidiary w.e.f June 2, 2008) UK GBP 80.92 - - - - - - - - - - - 100.00
39 Jaguar Land Rover North America, LLC (subsidiary w.e.f June 2, 2008) USA USD 64.85 259.40 407.91 10,435.02 9,767.71 44,938.46 262.64 99.87 162.77 162.77 - - 100.00
40 Jaguar Land Rover Deutschland GmbH (subsidiary w.e.fJune 2, 2008 Germany EUR 69.30 18.02 398.48 3,213.44 2,796.95 12,374.21 130.98 39.50 91.48 91.48 - - 100.00
41 Jaguar Land Rover Austria GmbH (subsidiary w.e.f June 2, 2008) Austria EUR 69.30 1.39 82.47 542.62 458.77 1,933.47 17.33 3.47 13.86 13.86 - - 100.00
42 Jaguar Land Rover Italia SpA (subsidiary w.e.f June 2, 2008) Italy EUR 69.30 173.25 278.59 2,036.03 1,584.20 8,451.14 81.77 26.33 55.44 55.44 - - 100.00
43 Jaguar Land Rover Portugal-Veiculos e Pecas, Lda.(subsidiary w.e.f June 2, 2008) Portugal EUR 69.30 83.16 (9.70) 221.76 148.30 584.89 5.54 3.47 2.08 2.08 - - 100.00
44 Jaguar Land Rover France SAS (subsidiary w.e.f February 1, 2009) France EUR 69.30 29.11 107.42 1,294.52 1,158.00 6,079.00 73.46 27.03 46.43 46.43 - - 100.00
45 Jaguar Land Rover Australia Pty Limited (subsidiary w.e.f June 2, 2008) Australia AUD 49.57 3.47 84.77 1,919.51 1,831.27 5,923.11 120.96 36.19 84.77 84.77 - - 100.00
46 Jaguar Land Rover Automotive Trading (Shanghai) Co. Ltd (subsidiary w.e.f June 2, 2008) China CNY 9.42 63.09 6,062.96 11,482.53 5,356.48 42,483.01 7,070.29 1,038.49 6,031.80 6,031.80 - - 100.00
47 Jaguar Land Rover Japan Limited (subsidiary w.e.f October 1, 2008) Japan JPY 0.58 27.85 259.77 976.04 688.42 2,442.48 30.44 9.42 21.02 21.02 - - 100.00
48 Jaguar Land Rover Korea Company Limited (subsidiary w.e.f June 2, 2008) Korea KRW 0.06 0.29 117.78 1,833.76 1,715.69 5,333.39 91.55 10.19 81.35 81.35 - - 100.00
49 Jaguar Land Rover Canada ULC (subsidiary w.e.f June 2, 2008) Canada CAD 48.59 - 22.35 1,289.20 1,266.85 4,730.65 28.18 5.83 22.35 22.35 - - 100.00
50 Jaguar e Land Rover Brasil Indústria e Comércio de Veículos LTDA (subsidiary w.e.f June 2, 2008) Brazil BRL 20.71 304.59 (176.83) 628.64 500.89 529.46 159.23 8.90 150.33 150.33 - - 100.00
51 Limited Liability Company "Jaguar Land Rover" (Russia) (incorporated on 25-5-2008) (subsidiary w.e.f May 15, 2009) Russia RUB 1.15 5.56 638.90 1,368.56 724.10 5,915.80 720.56 151.79 568.77 568.77 - - 100.00
52 Jaguar Land Rover (South Africa) (Pty) Ltd (subsidiary w.e.f February 2, 2009) South Africa ZAR 4.81 - 266.90 1,137.07 870.17 2,201.30 145.49 41.64 103.86 103.86 - - 100.00
53 Jaguar Land Rover Belux NV (subsidiary w.e.f June 2, 2008) Belgium EUR 69.30 8.66 72.07 891.20 810.46 3,604.99 35.34 13.86 21.48 21.48 - - 100.00
54 Jaguar Land Rover South Africa Holdings Limited (subsidiary w.e.f September 9, 2011) UK ZAR 4.81 937.58 15.39 977.49 24.52 - 41.83 12.02 29.81 29.81 - - 100.00
55 Land Rover Ireland Limited (subsidiary w.e.f June 2, 2008) Ireland EUR 69.30 - 10.40 14.55 4.16 - 0.35 - 0.35 0.35 - - 100.00
56 Jaguar Land Rover Espana SL (formerly known as Land Rover Espana SL) (subsidiary w.e.f June 2, 2008) Spain EUR 69.30 306.31 124.05 1,473.32 1,042.97 3,999.30 40.19 10.40 29.80 29.80 - - 100.00
57 Jaguar Land Rover Nederland BV (subsidiary w.e.f June 2, 2008) Netherlands EUR 69.30 0.31 41.58 469.16 427.27 1,347.19 13.17 3.47 9.70 9.70 - - 100.00
58 Jaguar Land Rover India Limited (subsidiary w.e.f October 25, 2012) India INR 1.00 280.25 (12.16) 696.17 428.08 1,482.83 96.56 6.49 90.07 90.07 - - 100.00
59 The Lanchester Motor Company Limited (subsidiary w.e.f June 2, 2008) UK GBP 80.92 - - - - - - - - - - - 100.00
60 The Daimler Motor Company Limited (subsidiary w.e.f June 2, 2008) UK GBP 80.92 12.14 - 12.14 - - - - - - - - 100.00
61 S S Cars Limited (subsidiary w.e.f June 2, 2008) UK GBP 80.92 - - - - - - - - - - - 100.00
62 Daimler Transport Vehicles Limited (subsidiary w.e.f June 2, 2008) UK GBP 80.92 - - - - - - - - - - - 100.00
63 The Jaguar Collection Limited (subsidiary w.e.f June 2, 2008) UK GBP 80.92 - - - - - - - - - - - 100.00
64 Jaguar Cars (South Africa) (Pty) Ltd (subsidiary w.e.f June 2, 2008) South Africa ZAR 4.81 - - - - - - - - - - - 100.00
65 Jaguar Cars Ltd (subsidiary w.e.f June 2, 2008) UK GBP 80.92 - - - - - - - - - - - 100.00
66 Land Rover Exports Ltd (non-trading) (business transferred to JLR Exports Ltd 1.4.2012 (subsidiary w.e.f June 2, 2008) UK GBP 80.92 - - - - - - - - - - - 100.00
67 Jaguar Land Rover Pension Trustees Limited (subsidiary w.e.f June 2, 2008) UK GBP 80.92 - - - - - - - - - - - 100.00
68 Shanghai Jaguar Land Rover Automotive Services Company Ltd (subsidiary w.e.f March 10, 2014) China CNY 9.42 15.07 (16.48) 76.46 77.87 106.21 3.01 11.49 (8.47) (8.47) - - 100.00
69 Jaguar Land Rover Slovakia s.r.o (Incorporated w.e.f. August 27, 2015) (subsidiary w.e.f August 27, 2015) Slovakia EUR 69.30 207.90 (36.73) 1,282.74 1,111.57 - 5.54 - 5.54 5.54 - - 100.00
70 Jaguar Land Rover Singapore Pte Ltd (incorporated w.e.f November 25,2015)(subsidiary w.e.f November 25, 2015) Singapore SGD 46.42 3.25 7.43 173.59 162.91 446.05 8.82 1.39 7.43 7.43 - - 100.00
71 Jaguar Racing Limited (Incorporated w.e.f. February 2, 2016) (subsidiary w.e.f February 2, 2016) UK GBP 80.92 - 14.57 42.89 28.32 126.23 18.61 4.05 14.57 14.57 - - 100.00
72 Jaguar Land Rover Colombia SAS (subsidiary w.e.f August 22, 2016) Colombia COP 0.02 8.06 (0.47) 102.62 95.04 32.28 (1.02) (0.55) (0.47) (0.47) 100.00
73 InMotion Ventures Limited (Incorporated w.e.f. March 18, 2016) (subsidiary w.e.f March 18, 2016) UK GBP 80.92 - (39.65) 18.61 58.26 18.61 49.36 9.71 39.65 39.65 - - 100.00
74 TMNL Motor Services Nigeria Ltd (incorporated w.e.f September 2, 2015)(subsidiary w.e.f September 2, 2015) Nigeria NGN 0.21 0.21 (0.29) 0.17 0.24 - (0.20) (0.00) (0.20) (0.20) - - 100.00
75 Tata Daewoo Commercial Vehicle Sales and Distribution Co. Ltd. (subsidiary w.e.f April 9, 2010) South Korea KRW 0.06 4.00 19.27 64.02 40.75 178.42 5.19 1.64 3.55 3.55 - - 100.00
76 PT Tata Motors Distribusi Indonesia (subsidiary w.e.f February 11, 2013) Indonesia IDR 0.00 161.03 (169.56) 49.18 57.71 42.83 (44.56) - (44.56) (44.56) - - 100.00

Finacial Highlights
F-157
Sr. No Name of Associates/Joint Arrangements Shares of Associate/Joint Arrangements held by the Company at the year end Profit/(loss) for the year
Latest audited Balance Sheet
Date
No. of shares Amount of Investment
in Associates/ Joint
Arrangements (₹ in crores)
Extent of Holding/
voting power %
Networth attributable
to Shareholding as per latest
audited Balance
Sheet (` in crores)
Considered in
consolidation (` in crores)
Not considered
in consolidation
(` in crores)
Description of how there is
significant influence
Reason why the
associate/ joint
arrangements are not
consolidated
Joint Operations1 Fiat India Automobiles Private Limited March 31,2017 122,257,983 1,567.04 50% 1,503.66 141.32 - Note (a) -
2 Tata Cummins Private Ltd March 31,2017 90,000,000 90.00 50% 381.87 31.12 - Note (a) - Joint Ventures
1 Tata HAL Technologies Ltd March 31,2017 10,140,000 5.07 50% - (2.30) - Note (a) - 2 Spark 44 Ltd (subsidiary w.e.f June 27, 2011) March 31,2017 500,000 3.40 50% 64.77 29.95 - Note (a) - 3 Chery Jaguar Land Rover Automotive Co Ltd (subsidiary w.e.f
November 16, 2012)March 31,2017 2,748.28 50% 3,668.61 1,354.42 - Note (a) -
Associates1 Tata AutoComp Systems Ltd March 31,2017 52,333,170 77.47 26% 212.06 13.90 - Note (b) - 2 Nita Company Ltd March 31,2017 16,000 1.27 40% 28.42 4.21 - Note (b) - 3 Automobile Corporation of Goa Ltd (subsidiary w.e.f May 21, 2007) March 31,2017 3,030,529 109.63 47.19% 136.83 7.10 - Note (b) - 4 Jaguar Cars Finance Limited March 31,2017 49,900 3.91 33% 3.91 - - Note (b) - 5 Synaptiv Limited March 31,2017 1.37 33% 1.37 - - Note (b) -
6 CloudCar Inc March 31,2017 96.96 43% 96.96 - - Note (b) -
7 Tata Hitachi Construction Machinery Company Private Ltd March 31,2017 45,714,286 240.20 39.99% 392.98 85.72 - Note (b) -
Note : (a) - These are jointly controlled companies. (b) - There is a significant influence due to percentage (%) of share capital/voting power.
Statement pursuant to Section 129 (3) of the Companies Act, 2013 related to Associate Companies and Joint ArrangementsPart - B
Statement pursuant to first proviso to sub-section (3) of section 129 of the Companies Act 2013, read with rule 5 of Companies (Accounts) Rules, 2014 in the prescribed Form AOC-1 relating to subsidiary companiesPart - A
(` in crores)
For and on behalf of the Board
R A MASHELKAR [DIN: 00074119]
N MUNJEE [DIN: 00010180]
V K JAIRATH [DIN: 00391684]
O P BHATT [DIN:00548091]
R SPETH [DIN: 03318908]Directors
N CHANDRASEKARAN [DIN: 00121863]
Chairman
GUENTER BUTSCHEK [DIN: 07427375] CEO & Managing Director R PISHARODY [DIN: 01875848] Executive Director S B BORWANKAR [DIN: 01793948] Executive Director C RAMAKRISHNAN Group Chief Financial Officer
H K SETHNA [FCS: 3507]Company Secretary
Mumbai, May 23, 2017
Sr.
No
Subsidiary Country Reporting currency
Exchange Rate
Share capital (incl.
advances towards
capital where applicable)
Reserves and
Surplus
Total Assets
Total Liabilities
Turnover Profit/ (Loss)
Before Tax
Tax Expense/ (Credit)
Profit/(Loss) after tax
Profit/ (Loss)for
the period/ year *
Proposed dividend and tax thereon
Investments (except in case of investment
in the subsidiaries)
% of
shareholding
Details of Direct subsidiaries, on consolidated basis including their respective subsidiaries included above
1 Tata Technologies Limited (subsidiary w.e.f September 10, 1997) 43.03 1,403.30 2,152.45 706.12 2,810.06 452.15 98.24 353.91 353.91 - 220.42 72.32
2 Tata Motors Finance Ltd (subsidiary w.e.f June 1, 2006) 1,319.02 (2,249.72) 21,591.83 22,522.53 2,712.87 677.43 394.37 283.06 283.06 - 1,146.49 100.00
3 TML Holdings Pte Ltd, Singapore (subsidiary w.e.f February 4, 2008) - - - - - - - - - - - 100.00
4 PT Tata Motors Indonesia (subsidiary w.e.f December 29, 2011) 220.38 (231.49) 51.55 62.66 38.67 (46.31) 0.11 (46.42) (46.15) - - 100.00
TML Holdings Pte Ltd, Singapore holds fully Jaguar Land Rover Automtive Plc and Tata Daewoo Commercial Vehicle Co. Ltd., the consolidated accounts of which are given below :
1 Jaguar Land Rover Automotive Plc Consolidated (subsidiary w.e.f June 2, 2008) 12,142.96 40,939.04 199,112.85 146,030.85 216,318.01 12,964.50 2,757.18 10,207.32 10,207.32 - 12,000.22 100.00
2 Tata Daewoo Commercial Vehicle Co. Ltd (subsidiary w.e.f March 30, 2004) 0.03 2,029.97 3,646.23 1,616.23 5,802.81 387.86 93.63 294.23 294.23 - - 100.00
* Profit for the year is after share of minority interest and share of profit/(loss) in respect of investment in associate companies.

Notes
____________________________________________________________________________
____________________________________________________________________________
____________________________________________________________________________
____________________________________________________________________________
____________________________________________________________________________
____________________________________________________________________________
____________________________________________________________________________
____________________________________________________________________________
____________________________________________________________________________
____________________________________________________________________________
____________________________________________________________________________
____________________________________________________________________________
____________________________________________________________________________
____________________________________________________________________________
____________________________________________________________________________
____________________________________________________________________________
____________________________________________________________________________
____________________________________________________________________________
____________________________________________________________________________
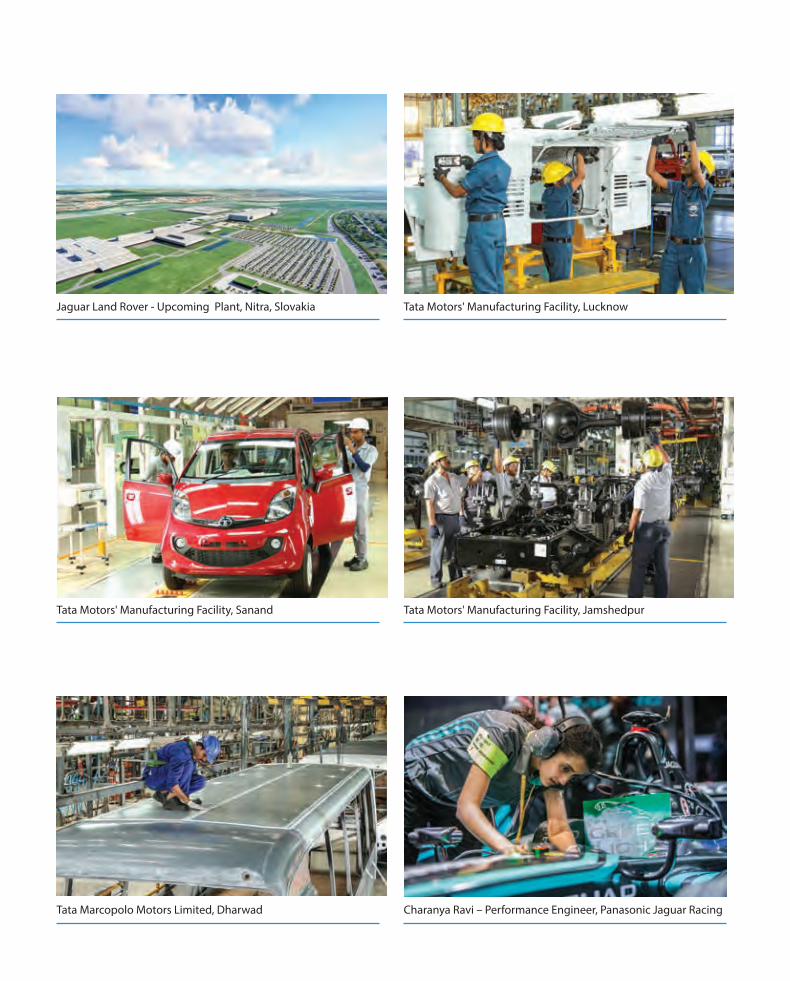
Jaguar Land Rover - Upcoming Plant, Nitra, Slovakia
Tata Motors' Manufacturing Facility, Sanand
Tata Motors' Manufacturing Facility, Lucknow
Tata Motors' Manufacturing Facility, Jamshedpur
Tata Marcopolo Motors Limited, Dharwad Charanya Ravi – Performance Engineer, Panasonic Jaguar Racing

Registered Office:Bombay House, 24 Homi Mody Street,Mumbai - 400 001Tel: +91-22- 66658282Fax: +91-22- 66657799Email: [email protected]
Corporate Identity NumberL28920MH1945PLC004520
www.tatamotors.com