Embed Size (px)
Citation preview

Ncorr: Open-Source 2D Digital Image CorrelationMatlab Software
J. Blaber1 & B. Adair1 & A. Antoniou1
Received: 14 August 2014 /Accepted: 9 March 2015# Society for Experimental Mechanics 2015
Abstract Digital Image Correlation (DIC) is an importantand widely used non-contact technique for measuring materialdeformation. Considerable progress has been made in recentdecades in both developing new experimental DIC techniquesand in enhancing the performance of the relevant computa-tional algorithms. Despite this progress, there is a distinct lackof a freely available, high-quality, flexible DIC software. Thispaper documents a new DIC software package Ncorr that ismeant to fill that crucial gap. Ncorr is an open-source subset-based 2D DIC package that amalgamates modern DIC algo-rithms proposed in the literature with additional enhance-ments. Several applications of Ncorr that both validate it andshowcase its capabilities are discussed.
Keywords Digital image correlation . Large deformation .
Complex ROI . Nickel superalloy . Crack
Introduction
Digital Image Correlation (DIC) is a robust non-contact tech-nique for measuring material deformation [1–3]. DIC usesimage registration algorithms to track the relative displace-ments of material points between a reference (typically, the
undeformed) image and a current (typically, the deformed)image [4, 5]. The scale agnostic nature of DIC allows for thestudy of deformation at different length scales from meters tothe nanoscale [6–11], as long as the material can be properlypatterned and imaged. The behavior of diverse systems hasbeen studied such as biological materials [12–15], metal al-loys [16–18], shape memory alloys [19, 20], porous metals[21–23], polymers [24] and polymer foams [25]. Each mate-rial system presents challenges that may require modificationof standard DIC algorithms, such as highly localized deforma-tion, large strains, etc.
In recent years, several improvements to the core compu-tation algorithms have been proposed and implemented[26–31]. However, there appears to be a distinct lack of amodern, adaptable, and accessible DIC code (although olderpackages exist on theMatlab File Exchange [32, 33]). In orderto accelerate innovation and to introduce DIC to a wide com-munity of researchers, we have developed an open-source,freely available 2D subset-based digital image correlationsoftware package (Ncorr) that amalgamates modern algo-rithms proposed in the literature [28, 31, 34–37], as well asmany additional improvements and changes. Ncorr is meantto be a well-documented flexible code that users can freelyadapt to suit their needs. The package is implemented inMATLAB (http://www.mathworks.com/products/matlab/), awidely used general purpose numerical computingenvironment for engineers. For greater efficiency, computeintensive algorithms are written in C++ and incorporatedinto MATLAB through the MEX interface (http://www.mathworks.com/help/matlab/share-mex-files.html). A highquality Graphical User Interface (GUI) can assist in theanalysis.
The purpose of this paper is to document the algorithmsimplemented in Ncorr, as well as the validation and verifica-tion tests. We also demonstrate application of Ncorr to several
Electronic supplementary material The online version of this article(doi:10.1007/s11340-015-0009-1) contains supplementary material,which is available to authorized users.
* A. [email protected]
1 The Woodruff School of Mechanical Engineering, 801 Ferst Drive,Atlanta, GA 30332, USA
Experimental MechanicsDOI 10.1007/s11340-015-0009-1

common problems in experimental mechanics that showcasesome of the code capabilities.
The significance of DIC for experimental mechanics com-munity is exemplified by the recent Society of ExperimentalMechanics (SEM) DIC challenge (http://www.sem.org/dic-challenge/). The aim of the challenge is to cross validateexisting DIC codes and to document their performance on awell documented set of standard tests. The analysis of severalexamples from the DIC challenge using Ncorr is discussed inthis paper.
The paper is organized as follows: 1) description of funda-mental DIC algorithms used in Ncorr, 2) extensions and im-provements of the code specific to Ncorr, 3) validation and 4)representative applications.
Core DIC Algorithm Description
Subset Deformation
In subset-based DIC algorithms, the reference image ispartitioned into smaller regions referred to as subsets orsubwindows. The deformation is assumed to be homogeneousinside each subset, and the deformed subsets are then trackedin the current image. In Ncorr, subsets are initially a contigu-ous circular group of points that are on integer pixel locationsin the reference configuration. The transformation of the co-ordinates of these points from the reference to the currentconfiguration is constrained to a linear, first order transforma-tion
excuri ¼ xre f i þ urc þ ∂u∂xrc
xre f i−xre f c� �þ ∂u
∂yrcyre f j
−yre f c� �
eycur j ¼ yre f jþ vrc þ ∂v
∂xrcxre f i−xre f c� �þ ∂v
∂yrcyre f j
−yre f c� �
i; jð Þ∈S
ð1Þ
p ¼ u v∂u∂x
∂u∂y
∂v∂x
∂v∂y
� �T
ð2Þ
Here xre f i and yre f jare the x and y coordinates of an
initial reference subset point, xre f c and yre f c are the coor-
dinates of the center of the initial reference subset, andexcuri and eycur j are the coordinates of a current subset point.The deformation is parameterized by displacements u andv and their derivatives, all of which are constant for agiven subset. Equation (2) defines a generalized deforma-tion vector p. The indices (i,j) are used for the relativelocation of the points with respect to the center of thesubset, as well as to establish correspondences betweensubset points in the current and reference configurationand S is a set which contains all of the subset points.The subscript “rc” used in equation (1) is meant to signifythat the transformation is from the reference to current
coordinate system. Equation (1) can also be written inmatrix form
ξre f c þ w Δξre f ; prc� � ¼ xTre f c
yTre f c1
8<:9=;þ
1þ du
dxrc
du
dyrcurc
dv
dxrc1þ dv
dyrcvrc
0 0 1
2666437775* ΔxTre f
ΔyTre f1
8<:9=;
ð3Þwhere ξ is an augmented vector containing the x and ycoordinates of subset points, Δx and Δy are the distancesbetween subset points and the center of the subset, and wis a so-called warp function.
For purposes of computational efficiency (more specifical-ly, to accommodate the inverse compositional method de-scribed later), we also allow the reference subset to deformwithin the reference configuration as follows:
exre f i ¼ xre f i þ urr þ ∂u∂xrr
xre f i−xre f c� �þ ∂u
∂yrryre f j
−yre f c� �
eyre f j ¼ yre f jþ vrr þ ∂v
∂xrrxre f i−xre f c� �þ ∂v
∂yrryre f i−yre f c� �
i; jð Þ∈S
ð4Þ
whereexre f i andeyre f jare the x and y coordinates of a deformed
reference subset point. The “rr” subscript in equation (4) ismeant to signify that the transformation is between two differ-ent coordinate systems in the reference image.
Correlation Criteria
In order to find the deformation of a subset, DIC algorithmsfind the extremum of a correlation (cost) function. Figure 1shows a schematic of this process. In Ncorr, two differentcorrelation criteria are used to find the initial guess and itssubsequent refinement. The initial guess is found by comput-ing at integer locations the normalized cross correlation(NCC) (see Fig. 2)
Ccc ¼X
i; jð Þ∈S f exre f i ;eyre f j
� �− f m
� �g excuri ;eycur j� �
−gm� �
ffiffiffiffiffiffiffiffiffiffiffiffiffiffiffiffiffiffiffiffiffiffiffiffiffiffiffiffiffiffiffiffiffiffiffiffiffiffiffiffiffiffiffiffiffiffiffiffiffiffiffiffiffiffiffiffiffiffiffiffiffiffiffiffiffiffiffiffiffiffiffiffiffiffiffiffiffiffiffiffiffiffiffiffiffiffiffiffiffiffiffiffiffiffiffiffiffiffiffiffiffiffiffiffiffiffiffiffiffiffiffiffiffiffiffiffiffiffiXi; jð Þ∈S f exre f i ;eyre f j
� �− f m
h i2Xi; jð Þ∈S g excuri ;eycur j� �
−gmh i2r ð5Þ
Here f and g are respectively the reference and currentimage grayscale intensity functions at a specified location (x,y). Functions fm and gm correspond to the mean grayscalevalues of the reference and current subset
f m ¼X
i; jð Þ∈S f exre f i ;eyre f j
� �n Sð Þ ð6Þ
gm ¼X
i; jð Þ∈Sg excuri ;eycur j� �n Sð Þ ð7Þ
where n(S) is the number of data points in subset S. The
Exp Mech

initial guess thus yields u and v with integer (pixel) accu-racy. The next step uses a nonlinear optimizer to refinethese results with sub-pixel resolution by finding the min-imum of
CLS ¼Xi; jð Þ∈S
f exre f i ;eyre f j
� �− f mffiffiffiffiffiffiffiffiffiffiffiffiffiffiffiffiffiffiffiffiffiffiffiffiffiffiffiffiffiffiffiffiffiffiffiffiffiffiffiffiffiffiffiffiffiffiffiffiffiffiffiffiffiffiffiffiffiffiffiffiX
i; jð Þ∈S g exre f i ;eyre f j
� �− f m
h i2r −g excuri ;eycur j� �
−gmffiffiffiffiffiffiffiffiffiffiffiffiffiffiffiffiffiffiffiffiffiffiffiffiffiffiffiffiffiffiffiffiffiffiffiffiffiffiffiffiffiffiffiffiffiffiffiffiffiffiffiffiffiffiffiffiffiffiffiXi; jð Þ∈S g excuri ;eycur j� �
−gmh i2r
266437752
ð8Þ
Correlation criteria CCC and CLS are directly related [38].
Non-Linear Optimization Scheme
Ncorr uses the Inverse Compositional Gauss-Newton (IC-GN) method as the nonlinear optimizer [39, 40]. IC-GN is acomputationally efficient iterative method that seeks to find anoptimal value of prc (denoted as prc
∗ ) that minimizes CLS whenprr=0. In each iteration, IC-GN method finds a small defor-mation Δp (prr in equation (4)) of the initial reference subsetthat best matches the deformed reference subset described byprc. The resulting prr is then used to update prc (see Fig. 3). Thecompact form of CLS for the IC-GN iterations is:
Fig. 1 The basic steps of DIC algorithm implemented in Ncorr. First, theinitial guess for the displacement pg={u
(g),v(g),0,0,0,0}T is found. Thisguess is used as the initial input to the iterative optimization scheme,
which finds a refined solution pr={u,v,∂u/∂x,∂u/∂y,∂v/∂x,∂v/∂y}T
allowing for subwindow deformation
(a)
(c)(b)
(d)Fig. 2 The procedure for findingthe initial guess. A referencesubset (a) is padded to thefull-size (b) and is convolved withthe current image to find thenormalized cross correlation (c).The output is an array ofcorrelation coefficient values. Thelocation of the subset is recoveredwith respect to the currentconfiguration by locating themaximum correlation coefficient(d)
Exp Mech

CLS Δpð Þ ¼X f ξre fc þ w Δξre f ;Δp
� �� �− f mffiffiffiffiffiffiffiffiffiffiffiffiffiffiffiffiffiffiffiffiffiffiffiffiffiffiffiffiffiffiffiffiffiffiffiffiffiffiffiffiffiffiffiffiffiffiffiffiffiffiffiffiffiffiffiffiffiffiffiffiffiffiffiffiffiffiffiffiffiffiffiffiX
f ξre fc þ w Δξre f ;Δp� �� �
− f m 2r −
g ξre fc þ w Δξre f ; pold� �� �
−gmffiffiffiffiffiffiffiffiffiffiffiffiffiffiffiffiffiffiffiffiffiffiffiffiffiffiffiffiffiffiffiffiffiffiffiffiffiffiffiffiffiffiffiffiffiffiffiffiffiffiffiffiffiffiffiffiffiffiffiffiffiffiffiffiffiffiffiffiffiffiffiffiXg ξre fc þ w Δξre f ; pold
� �� �−gm
2r2664
37752
ð9Þ
where pold is the value of prc found from the previous iteration.In order to find the minimum of CLS, we employ an iterativeprocedure based on the Taylor series expansion
∇∇CLS 0ð ÞΔp ¼ −∇CLS 0ð Þ ð10Þwhere ∇CLS(0) is the gradient of CLS at p=0 and ∇∇CLS(0) isthe hessian of CLS at p=0. The explicit form of these quanti-ties is shown in Appendix A1. Note that the computationrequires an interpolation scheme. Ncorr uses Biquintic B-splines, as described in Appendix A2. In each iteration, Δpis solved using Cholesky decomposition since the initial guessensures that parameters are in the vicinity of a minimum,where the hessian should be symmetric positive definite. Ifthe Cholesky decomposition fails, then the hessian is not pos-itive definite and the point is rejected. The next approximationto prc
∗ is found by composing the old value with the inverse ofΔp, which is justified so long as the displacements inΔp aresmall inmagnitude. A graphical representation of the update isshown in Fig. 3. This update can be written in matrix form asfollows
1þ du
dxnew
du
dynewunew
dv
dxnew1þ dv
dynewvnew
0 0 1
2666437775 ¼
1þ du
dxold
du
dyolduold
dv
dxold1þ dv
dyoldvold
0 0 1
2666437775
*
1þΔdu
dxΔdu
dyΔu
Δdv
dx1þΔ
dv
dyΔv
0 0 1
2666437775−1
ð11Þw Δξre f ; pnew� � ¼ w w Δξre f ;Δp
� �−1; pold
� �ð12Þ
Here pold is set to pnew at the beginning of every iteration.The inverse compositional method gets its name from howpold is updated in equations (11–12). The crucial advantageof the method is that the hessian is computed at ξre f c þ w
Δξre f ; 0� �
and does not change during iterations, i.e. it only
needs to be computed once. This results in large computation-al savings [39].
A summary of the inverse compositional method is shownbelow (the steps follow from Ref. [39] but have been adaptedfor DIC):
Precomputation for entire DIC Analysis:
1) (Optional) Precompute QK½ � c½ � x f −2:x fþ3;y f −2:y f þ3ð ÞQK½ �T ([QK] is defined in equation (34) and [c] inequation (35)) for the entire current image.
2) Evaluate ∂∂exre f i f exre f i ;eyre f j
� �and ∂
∂eyre f j f exre f i ;eyre f j
� �for
the entire reference image using equation (37) and
equation (38).Precomputation per subset:
3) Compute “steepest descent images”, equation (25).4) Compute the GN-Hessian in equation (24).5) Set initial pold to initial guess from NCC or neighbor-
ing deformation dataComputation per iteration per subset:
6) Compute warped f ina l cu r r en t subse t gξre f c þ w Δξre f ; pold
� �� �using equation (33)
7) Compute gradient, ∇CLS(0), using equation (21)8) Compute Δp using equation (10) with Cholesky
decomposition9) Update pold using equation (11)10) Exit iteration when norm of Δp is small.
Reliability Guided DIC
The steps described previously allow for the calculation ofdisplacement data of a single material point located at thecenter of a reference subset. In order to obtain displacementvalues for all subsets, Ncorr uses the Reliability Guided (RG-DIC) method [41]. For completeness, a brief summary of themethod is given below, although the reader is directed to Ref.[41] for an in depth description.Fig. 3 A graphical representation of the inverse compositional update
Exp Mech

The overall method is shown in Figs. 4 and 5. The compu-tation begins by selecting a seed point. This is the location ofthe center of the initial reference subset used in the analysisand is shown as the green cross with “Seed” in Fig. 5. Thispoint is the only one which uses NCC to obtain an initialguess. The rest of the subsets will use neighboring informationas an initial guess.
After calculating the corresponding deformation parame-ters and CLS for the seed point, it is “inactivated,” which isdone by forming a logical mask initialized to false; analyzedpoints are set to true. A queue is formed (as a heap data struc-ture) and then CLS, the six deformation parameters, and the
location of the center of the subset, xre f c ; yre f c
� �, are stored in
the queue, which is shown as the 2nd step in the flow diagramof Fig. 4. The program enters a while loop and at each iterationthe top entry (this entry will have the lowest CLS since thequeue is a heap) is popped from the queue. The data for thequeue point is then added to the data plots. Next, the foursurrounding material points, if they are still active or withinthe region of interest (ROI), are analyzed using the displace-ment data from the queue point as the initial guess for thenonlinear optimization scheme. The process is repeated untilthe queue is empty; at this stage all contiguous points of inter-est will be analyzed. The aforementioned process is summa-rized in the flow diagram of Fig. 4.
The benefits of this process are two-fold. First of all, it isrobust in that bad data points (i.e. data points with high CLS)are processed last, which prevents this data from being used asthe initial guess for neighboring points. In addition, it is com-putationally efficient because only the seedpoint needs to useNCC (which is computationally expensive) to obtain an initialguess. Moreover, the initial guess provided by adjacent subsetis typically quite good (as long as the subset spacing is rela-tively small) because displacement fields are, in general, rela-tively smooth. One negative aspect of this algorithm is that itmust be done serially, although in Ncorr this has beencircumvented by partitioning the ROI into spatial domains thatare calculated in parallel. This process is described in moredetail in “Multithreaded RG-DIC” section.
Computation of Strains
Strains are more difficult to resolve than the displacementfields because strains involve differentiation, which is sensi-tive to noise. This means any noise in the displacement fieldwill magnify errors in the strain fields. Ncorr uses the Green-Lagrangian strains, which are obtained by using the four dis-placement gradients as follows
Exx ¼ 1
22∂u∂x
þ ∂u∂x
� �2
þ ∂v∂x
� �2 !
ð13Þ
Fig. 4 Flow chart of the RG-DIC algorithm. In the neighbor calculationphase, the central white cross is the material point loaded from the queue.The three black crosses are unanalyzed points which are added to thequeue. The green cross has already been analyzed and is skipped
Exp Mech

Exy ¼ 1
2
∂u∂y
þ ∂v∂x
þ ∂u∂x
∂u∂y
þ ∂v∂x
∂v∂y
� �ð14Þ
Eyy ¼ 1
22∂v∂y
þ ∂u∂y
� �2
þ ∂v∂y
� �2 !
ð15Þ
The displacement gradients are directly obtained throughthe IC-GN scheme. But these values are noisy, and thus mustbe “smoothed” in some way before calculating the strainfields. Instead, Ncorr uses the strain window algorithm pro-posed in Ref. [35] to calculate the displacement gradients andthe subsequent Green-Lagrangian strains. A least squaresplane fit on a subset of displacement data is used to find theplane parameters in equations (13–15) and thus the displace-ment gradient data from the RG-DIC algorithm is not utilized
uplane x; yð Þ ¼ au;plane þ ∂u∂xplane
� �xþ ∂u
∂yplane
!y ð16Þ
vplane x; yð Þ ¼ av;plane þ ∂v∂xplane
� �xþ ∂v
∂yplane
!y ð17Þ
The strains are found as a solution of an over-constrainedsystem of equations [42]
1 xre f first i−xre f c yre f first j
−yre f c⋮ ⋮ ⋮1 xre f last i
¼ xre f c yre f last j−yre f c
24 35au;plane∂u
∂xplane
� �∂u
∂yplane
!8>>>>><>>>>>:
9>>>>>=>>>>>;¼
u*rc xre f first i; yre f first j
� �⋮
u*rc xre f last i; yre f last j
� �8><>:
9>=>;
ð18Þ
The size of the subset window for computing the strainscan be independently controlled. Once these parameters aresolved, they can be used in equations (13–15) to determineExx, Exy, and Eyy. The process is applied to the entire displace-ment field in order to obtain a corresponding strain field.
New Algorithms Implemented in Ncorr
New algorithms implemented in Ncorr are: 1) a multithreadedversion of RG-DIC, 2) a method for large strain calculation byautomatically updating the ROI and adding displacements,and 3) an Eulerian to Lagrangian conversion algorithm toanalyze discontinuous displacement fields.
Multithreaded RG-DIC
Ncorr extends RG-DIC to multithreading by forming aBthread-diagram^ (an integer array) based on seed point loca-tions within a 4-way connected region in the ROI. This idea isdemonstrated in Fig. 6. It starts by growing subregions aroundeach seed, one point at a time per iteration, until the entire ROIhas been segmented. This ensures the region around each seedis contiguous, and also divides the work relatively evenly. Anexample thread diagram is shown on the right side of Fig. 6. Itis an array that is same size as the original ROI, but has valueswhich correspond to each thread. For example, the regionmarked Bthread 0^ on Fig. 6 contains zeros within that region,and for Bthread 1^, the array has ones, etc., while the blackregion outside the ROI contains negative ones (an impossiblevalue for a thread). This idea is well suited for multithreadingbecause it scales well, in that as the limit of the number ofseeds approach the number of points within the region ofinterest, it simply approaches the older methods of DIC,wherein every subset’s initial guess is found through NCC.
ROI Updating for Large Deformations
A challenging problem in DIC involves material undergoinglarge deformations. The deformed sample may change so dra-matically that a good correlation of DIC subsets between
Fig. 5 The approach used by RG-DIC algorithm when determining de-formation parameters for a grid within a region of interest. The directionproceeds in the direction of the lowest CLS value
Exp Mech

current and reference image will not be possible. At the sametime, there is significant interest in applying DIC to materialsthat can undergo large deformations such as soft materials,polymers, elastomers as well as biological materials. A strat-egy to monitor deformation of such materials involves a wellpatterned sample and a dataset of images at intermediatestages of the deformation so that the deformation within twoadjacent images is not large enough to cause problems. Ncorrhas been properly modified to create composite displacementmaps that can subsequently be used to obtain the strain field.An important part of this process involves updating the ROI.The method implemented in Ncorr works by forming aboundary around the ROI. This boundary is then updatedbased on displacement values obtained through the last calcu-lated displacement field for the last reference image. This hap-pens by sampling the last calculated displacement field at thevalues at the boundary. These displacement values are thenadded to the boundary coordinates. The boundary coordinatesare treated as a polygon, and are used through a polygon fillalgorithm [43] to update the ROI. Updates occur either whenthe seeds placed on the original reference image either exceedcertain cutoffs (i.e. correlation coefficient or the number ofallowable iterations for convergence) or through a preset num-ber, known as a Bleapfrog^ parameter. The boundary updatingprocedure is demonstrated in Fig. 7.
It’s important to note that most of the compounding errorwill occur for datapoints near the boundary of the ROI. This isbecause the displacement fields are interpolated with biquinticB-splines, so the fields actually need to be extrapolated firstbefore obtaining the B-spline coefficients for datapoints nearthe border. Therefore, interpolated values near the border willbe the most affected. However, one of the positive aspects ofthis update scheme is that because the ROI itself is updatedwhen the reference image is updated (unlike the approach ofRef. [27]), the subset deformations are not perpetuated. Thismeans that although this method might result in worse perfor-mance for boundary displacement points, it’s possible to ana-lyze samples undergoing large deformations, provided
enough intermediate pictures are provided and the pattern onthe updated reference images is sufficient enough to allow forthe tracking algorithms to perform correctly.
Eulerian to Lagrangian Conversion
This technique is used to analyze discontinuous displacementfields in Ncorr. It relies on the fact that discontinuities (i.e.cracks) are clearly visible in the current image. The idea is tocreate the ROI for the current image (rather than the referenceimage), perform DIC, and then use an Eulerian to Lagranianalgorithm to convert the displacements back to the Lagrangianperspective.
The ROI is updated through a similar technique used in thelarge strain calculation algorithm. Once the ROI is updated(shown in Fig. 8), every point in the updated ROI is analyzed
(a) (b)Fig. 6 Ncorr implementation ofmultithreaded RG-DIC. (a) Fourseeds are placed within an ROI,which is then partitioned based onseed placement. (b) Each partitionis then assigned a thread through aBthread diagram^
Fig. 7 A graphical example of ROI updating and displacement Badding^scheme. Here, there is a single update between the current image rotated10° and the current image rotated 20°.When the reference image needs toupdate, the boundary (highlighted in green) is used to sampledisplacement values (shown in the bottom row) in order to update theboundary. This boundary is then used to form the updated ROI through apolygon fill routine. The displacements are then Badded^ by samplingdisplacement values using the original reference image and then findingtheir corresponding position in subsequent displacement fields (note thatthis requires interpolation). The end result is shown on the bottom right
Exp Mech
by first determining which integer point in the current dis-placement field maps closest to that point. This is fed as aninitial guess to a nonlinear optimizer to determine the subpixel displacements using biquintic B-spline interpolation onthe displacement field. This initial point also acts as a seed andinitiates a queue. The algorithm then proceeds to use neigh-boring points as the initial guess to the nonlinear optimizer inmuch the same way as the RG-DIC algorithm described in theBCore DIC Algorithm Description^ section. The routine fin-ishes when all the points in the updated ROI have been ana-lyzed, which results in a displacement field with respect to theLagrangian perspective.
Validation and Verification
The code was verified and validated using a variety of tests.The first set of tests involved idealized simulated images,where results could be verified to numerical precision. Furthertests involved analysis of the Society for ExperimentalMechanics’s (SEM) 2D-DIC challenge simulated datasets.The DIC challenge provides a number of tests that simulatemany of the problems and issues encountered in applications,such as noisy images and patterns of limited resolution andcontrast. The full analysis of simulated SEM 2D-DIC imagescan be found in the Supplementary Material section accom-panying the online version of this article. The analysis of onerepresentative example, Sample 14 from the DIC challenge, isshown in this section.
Uniaxial Strain State and Rigid Body Rotation
Numerically simulated images were used to demonstrate thecorrectness of the implementation of the algorithms. The sim-ulated images were resampled using biquintic B-splines inorder to match the interpolation scheme used by Ncorr. Thisis a stringent test of parts of the algorithm, since the results
should be Bexact.^ The current image was set as the unde-formed image (taken previously with a generic speckle pat-tern). Then, the inverse of the desired transformation is ap-plied to the current image using biquintic B-splines in order toobtain the reference image. If the undeformed image is set asthe reference image and then a forward transformation is ap-plied to it, the results will not be Bexact,^ even if biquintic B-splines are used, since in the forward transformation the ref-erence image is being interpolated. The images were saved as.mat files since any standard image formats (jpg, png, tif,etc.…) use either unsigned integers or a form of data compres-sion which will alter the data.
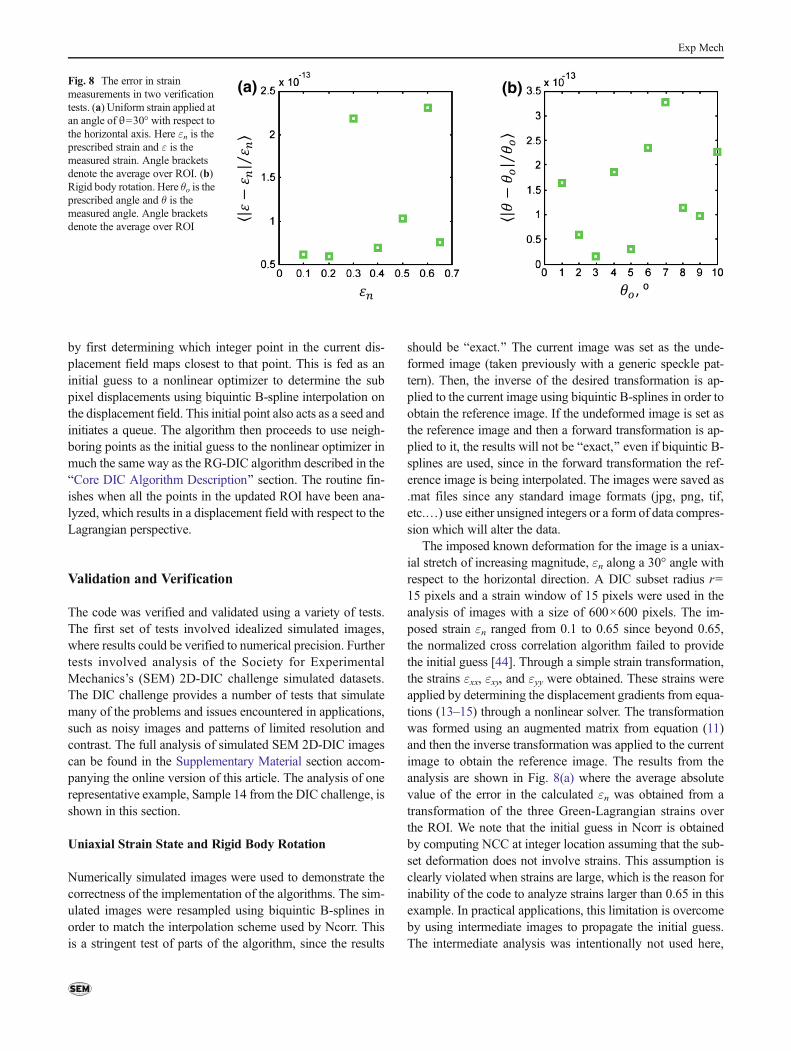
The imposed known deformation for the image is a uniax-ial stretch of increasing magnitude, εn along a 30° angle withrespect to the horizontal direction. A DIC subset radius r=15 pixels and a strain window of 15 pixels were used in theanalysis of images with a size of 600×600 pixels. The im-posed strain εn ranged from 0.1 to 0.65 since beyond 0.65,the normalized cross correlation algorithm failed to providethe initial guess [44]. Through a simple strain transformation,the strains εxx, εxy, and εyy were obtained. These strains wereapplied by determining the displacement gradients from equa-tions (13–15) through a nonlinear solver. The transformationwas formed using an augmented matrix from equation (11)and then the inverse transformation was applied to the currentimage to obtain the reference image. The results from theanalysis are shown in Fig. 8(a) where the average absolutevalue of the error in the calculated εn was obtained from atransformation of the three Green-Lagrangian strains overthe ROI. We note that the initial guess in Ncorr is obtainedby computing NCC at integer location assuming that the sub-set deformation does not involve strains. This assumption isclearly violated when strains are large, which is the reason forinability of the code to analyze strains larger than 0.65 in thisexample. In practical applications, this limitation is overcomeby using intermediate images to propagate the initial guess.The intermediate analysis was intentionally not used here,
,
(a) (b)Fig. 8 The error in strainmeasurements in two verificationtests. (a) Uniform strain applied atan angle of θ=30° with respect tothe horizontal axis. Here εn is theprescribed strain and ε is themeasured strain. Angle bracketsdenote the average over ROI. (b)Rigid body rotation. Here θo is theprescribed angle and θ is themeasured angle. Angle bracketsdenote the average over ROI
Exp Mech

even though it is implemented in Ncorr (as described in BROIUpdating for Large Deformations^ section).
A similar analysis was performed for images undergoingrigid body rotation (RBR) and their analyzed Ncorr result wascompared to the prescribed value. The synthesized rotatedimage was formed using the same set as the uniaxial stretchand the analysis was done with the same subset and strainradius sizes as the uniaxial strain. The rotation images weregenerated up until a rotation of about 10°, because after that,the normalized cross correlation algorithm failed to providethe initial guess. This is related to the assumed form of dis-placement, equations (1) and (2), which can only describesmall rotations. In practice, this limitation can again be over-come using intermediate images. The present analysis inten-tionally did not employ the intermediate images. Figure 8(b)shows a comparison of the calculated rotation value versus theprescribed rotation. For both Figs. 8(a) and (b), the errors areon the order of 10−13 (essentially the numerical precision),indicating the correct implementation of the relevant parts ofthe overall DIC algorithm.
Case Study: Heterogeneous Deformation
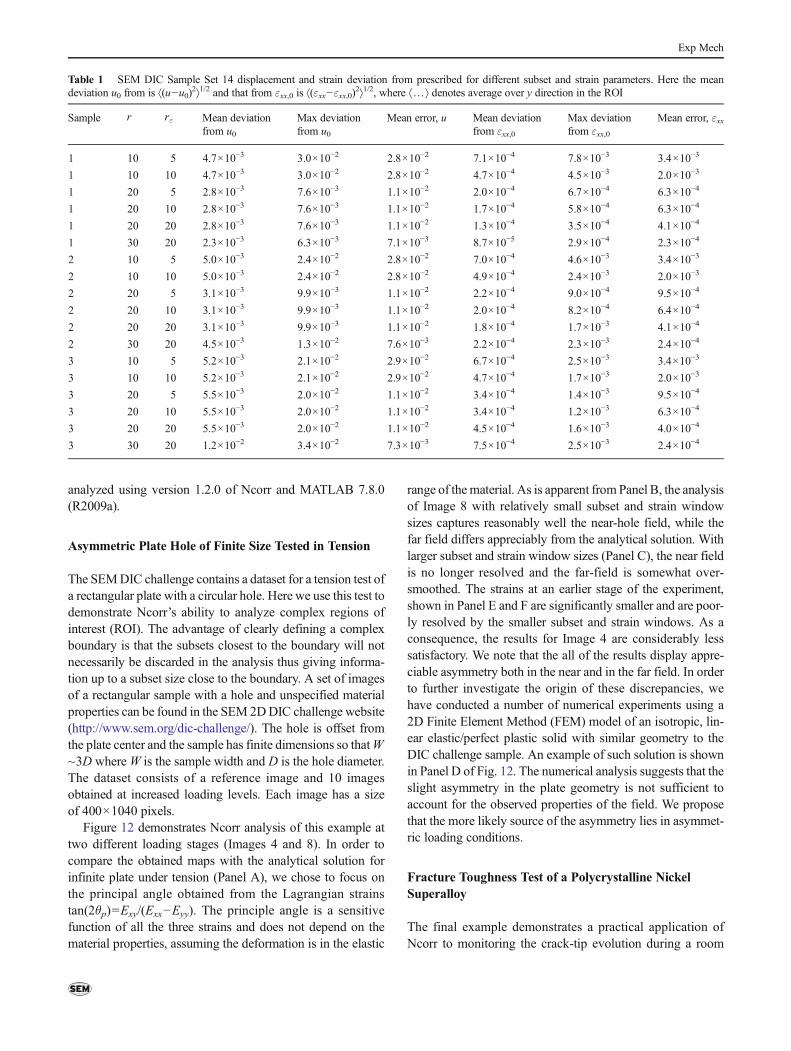
Ncorr was validated using the entire set of simulated imagesfrom SEM 2D-DIC challenge (see Supplementary Materialsection). Sample Set 14 is a representative example that con-sists of a reference image as well as three deformed imageswith a known sinusoidal deformation with increasing straingradient and imposed noise. Figure 9 shows the horizontaldisplacement (u) of Sample 1 and 3 with the smallest andlargest strain gradient respectively. The analysis was per-formed using a subset radius of 20 pixels.
Sample 14 highlights many of the issues encountered inapplications of DIC. A typical size of the speckle pattern, asassessed from the reference image power spectrum, is approx-imately 8 pixels (see Supplementary Material). This poses alimitation on the subset size, since the latter must containenough distinct features to yield a good correlation. Further-more, smaller subset radii tend to be affected by the noisepresent in each simulated image. On the other hand, largesubset or strain window sizes tend to smoothen the field tothe extent that the localized deformation may not be correctlycaptured. Table 1 shows a summary of the errors obtainedusing various subset and strain window sizes for each of thethree samples in Set 14. To further illustrate this analysis,Fig. 10 shows the profiles of the horizontal displacementu(x) of Sample 1 and Sample 3 averaged over y for threedifferent subset radii r=10, 20 and 30pixels together withthe prescribed displacement. The error bars show the standarddeviation along the y-direction. The smallest subset radius of10 pixels contains on average 2.5 distinct features and yields arather noisy field, as evidenced by the large error bars for bothSample 1 and Sample 3. The effect of the superimposed noise
decreases with increasing subset radius with the subset size of30 pixels having the smallest deviation from the prescribeddisplacement. While such large subset sizes are perfectly ac-ceptable for relatively smooth displacement fields in Sample1, they tend to over-smooth sharp gradients at large x in Sam-ple 3. The effect of subset and strain size on the calculatedstrains along the horizontal direction is shown in Fig. 11 forSample 1 and Sample 3. The strain field is significantly noisierthan the displacement field with a substantial reduction of thestandard deviation with increasing subset and strain windowsize. However, at the largest subset/strain window (r=30 andrE=20pixels) the highly localized deformation of Sample 3 isagain not adequately captured. As is so often the case, the DICanalysis involves a trade-off between spatial resolution andresolving small displacements and strains. Therefore, a carefulexamination of the displacement and strain field for differentsubset and strain window sizes is necessary in applications tofully assess the quality of the analysis. Ncorr provides thenecessary flexibility to vary parameters so that the optimumset for each experiment can be identified.
Case Studies: Experimental Datasets
In this section we demonstrate applications of Ncorr to anal-ysis of experimental datasets from the SEM 2D-DIC chal-lenge and from our own experiments on Compact Tension(CT) polycrystalline nickel superalloy sample under tension.These illustrative examples were chosen because they high-light many of the interesting features of the code (e.g. theability to analyze complex shaped samples and capability toanalyze discontinuous displacement fields), while highlight-ing the difficulties frequently encountered in the analysis ofexperimental data. The above images (available for downloadon the Bdownloads^ section of http://www.ncorr.com) were
(a)
(b)
Fig. 9 Horizontal displacement (u) of the heterogeneous deformation ofSample 14 in the SEM 2DDIC challenge. (a) Sample 1 and (b) Sample 3with a subset radius r=20 pixels
Exp Mech
analyzed using version 1.2.0 of Ncorr and MATLAB 7.8.0(R2009a).
Asymmetric Plate Hole of Finite Size Tested in Tension
The SEMDIC challenge contains a dataset for a tension test ofa rectangular plate with a circular hole. Here we use this test todemonstrate Ncorr’s ability to analyze complex regions ofinterest (ROI). The advantage of clearly defining a complexboundary is that the subsets closest to the boundary will notnecessarily be discarded in the analysis thus giving informa-tion up to a subset size close to the boundary. A set of imagesof a rectangular sample with a hole and unspecified materialproperties can be found in the SEM 2DDIC challenge website(http://www.sem.org/dic-challenge/). The hole is offset fromthe plate center and the sample has finite dimensions so thatW~3D whereW is the sample width and D is the hole diameter.The dataset consists of a reference image and 10 imagesobtained at increased loading levels. Each image has a sizeof 400×1040 pixels.
Figure 12 demonstrates Ncorr analysis of this example attwo different loading stages (Images 4 and 8). In order tocompare the obtained maps with the analytical solution forinfinite plate under tension (Panel A), we chose to focus onthe principal angle obtained from the Lagrangian strainstan(2θp)=Exy/(Exx−Eyy). The principle angle is a sensitivefunction of all the three strains and does not depend on thematerial properties, assuming the deformation is in the elastic
range of the material. As is apparent from Panel B, the analysisof Image 8 with relatively small subset and strain windowsizes captures reasonably well the near-hole field, while thefar field differs appreciably from the analytical solution. Withlarger subset and strain window sizes (Panel C), the near fieldis no longer resolved and the far-field is somewhat over-smoothed. The strains at an earlier stage of the experiment,shown in Panel E and F are significantly smaller and are poor-ly resolved by the smaller subset and strain windows. As aconsequence, the results for Image 4 are considerably lesssatisfactory. We note that the all of the results display appre-ciable asymmetry both in the near and in the far field. In orderto further investigate the origin of these discrepancies, wehave conducted a number of numerical experiments using a2D Finite Element Method (FEM) model of an isotropic, lin-ear elastic/perfect plastic solid with similar geometry to theDIC challenge sample. An example of such solution is shownin Panel D of Fig. 12. The numerical analysis suggests that theslight asymmetry in the plate geometry is not sufficient toaccount for the observed properties of the field. We proposethat the more likely source of the asymmetry lies in asymmet-ric loading conditions.
Fracture Toughness Test of a Polycrystalline NickelSuperalloy
The final example demonstrates a practical application ofNcorr to monitoring the crack-tip evolution during a room
Table 1 SEM DIC Sample Set 14 displacement and strain deviation from prescribed for different subset and strain parameters. Here the meandeviation u0 from is ⟨(u−u0)2⟩1/2 and that from εxx,0 is ⟨(εxx−εxx,0)2⟩1/2, where ⟨…⟩ denotes average over y direction in the ROI
Sample r rε Mean deviationfrom u0
Max deviationfrom u0
Mean error, u Mean deviationfrom εxx,0
Max deviationfrom εxx,0
Mean error, εxx
1 10 5 4.7×10⁻³ 3.0×10⁻² 2.8×10⁻² 7.1×10⁻⁴ 7.8×10⁻³ 3.4×10⁻³
1 10 10 4.7×10⁻³ 3.0×10⁻² 2.8×10⁻² 4.7×10⁻⁴ 4.5×10⁻³ 2.0×10⁻³
1 20 5 2.8×10⁻³ 7.6×10⁻³ 1.1×10⁻² 2.0×10⁻⁴ 6.7×10⁻⁴ 6.3×10⁻⁴
1 20 10 2.8×10⁻³ 7.6×10⁻³ 1.1×10⁻² 1.7×10⁻⁴ 5.8×10⁻⁴ 6.3×10⁻⁴
1 20 20 2.8×10⁻³ 7.6×10⁻³ 1.1×10⁻² 1.3×10⁻⁴ 3.5×10⁻⁴ 4.1×10⁻⁴
1 30 20 2.3×10⁻³ 6.3×10⁻³ 7.1×10⁻³ 8.7×10⁻⁵ 2.9×10⁻⁴ 2.3×10⁻⁴
2 10 5 5.0×10⁻³ 2.4×10⁻² 2.8×10⁻² 7.0×10⁻⁴ 4.6×10⁻³ 3.4×10⁻³
2 10 10 5.0×10⁻³ 2.4×10⁻² 2.8×10⁻² 4.9×10⁻⁴ 2.4×10⁻³ 2.0×10⁻³
2 20 5 3.1×10⁻³ 9.9×10⁻³ 1.1×10⁻² 2.2×10⁻⁴ 9.0×10⁻⁴ 9.5×10⁻⁴
2 20 10 3.1×10⁻³ 9.9×10⁻³ 1.1×10⁻² 2.0×10⁻⁴ 8.2×10⁻⁴ 6.4×10⁻⁴
2 20 20 3.1×10⁻³ 9.9×10⁻³ 1.1×10⁻² 1.8×10⁻⁴ 1.7×10⁻³ 4.1×10⁻⁴
2 30 20 4.5×10⁻³ 1.3×10⁻² 7.6×10⁻³ 2.2×10⁻⁴ 2.3×10⁻³ 2.4×10⁻⁴
3 10 5 5.2×10⁻³ 2.1×10⁻² 2.9×10⁻² 6.7×10⁻⁴ 2.5×10⁻³ 3.4×10⁻³
3 10 10 5.2×10⁻³ 2.1×10⁻² 2.9×10⁻² 4.7×10⁻⁴ 1.7×10⁻³ 2.0×10⁻³
3 20 5 5.5×10⁻³ 2.0×10⁻² 1.1×10⁻² 3.4×10⁻⁴ 1.4×10⁻³ 9.5×10⁻⁴
3 20 10 5.5×10⁻³ 2.0×10⁻² 1.1×10⁻² 3.4×10⁻⁴ 1.2×10⁻³ 6.3×10⁻⁴
3 20 20 5.5×10⁻³ 2.0×10⁻² 1.1×10⁻² 4.5×10⁻⁴ 1.6×10⁻³ 4.0×10⁻⁴
3 30 20 1.2×10⁻² 3.4×10⁻² 7.3×10⁻³ 7.5×10⁻⁴ 2.5×10⁻³ 2.4×10⁻⁴
Exp Mech

temperature fracture toughness test of a polycrystalline nickelsuperalloy.
A Compact Tension (CT) sample of polycrystalline IN100nickel superalloy [45–47] with an average grain size of 3–5 μm and composition shown on Table 2 was prepared bywire electrical discharge machining (EDM). The CTspecimenwas polished using 6.5 μm diamond lapping paste. The sam-ple had a width of 30.5 mm, thickness of 2.54 mm, and notchlength of 9.5 mm. The sample was cyclically loaded (Pmin=170 N; Pmax~1700 N and R=0.1) until a fatigue crack wasinitiated. The cyclic experiment continued until the total cracklength to sample width ratio was a/W~0.5, where a is thecrack length and W is the sample width. For this sample, thefatigue crack was tilted 6° with respect to the horizontal axis.
The sample was subsequently patterned using an in-housepatterning apparatus with Montana Gold white acrylic paint. Along distance microscope (LDM) (Questar 100) mounted on atripod and attached to a camera SBIG 8300M,which has a highquality full-frame CCD sensor (Kodak KAF-8300) with 16-bit
read out and 3326×2504 pixel resolution. The field of view is5 mm and was aligned so that the crack tip end was close to thecenter left side of the image. The pattern and microscope opticsallowed for both dark-field images and bright field images to beobtained. The dark field images were used in the DIC analysiswhereas the bright field images allowedmonitoring of the cracktip size and texture to be acquired during a test.
The CT sample was loaded in tension using anMTS servo-hydraulic load frame. At a small load of 90 N the referenceimage and a rigid body translation (RBT) image were obtain-ed. The RBT image was used to assess the quality of thepattern. The load was increased and bright field and dark fieldimages were obtained at several intervals until fracture oc-curred at a load of ~6400 N. Bright field images showed thatthe crack tip length did not change substantially until the sam-ple was close to fracture.
In order to perform the DIC analysis, a mask was formedby uploading a bright field image in Image J software [48] andmanually outlining the crack tip length (shown as a red line in
Sample 1 Sample 3
r=10 pixels
r=30 pixels
r=20 pixels
r=10 pixels
r=30 pixels
r=20 pixels
Fig. 10 Horizontal displacement(u) of the heterogeneousdeformation of Sample 14 in theSEM 2D DIC challenge. Left:Sample 1 and Right: Sample 3 fordifferent subset radii r=10–30 pixels. The red line is theprescribed displacement. Blueline shows the calculateddisplacement averaged over the y-direction with the standard devia-tion along y-direction
Exp Mech

Fig. 13 with the crack tip indicated by the red arrow). Thismask was then used as a complex region of interest (ROI) inthe DIC analysis. We note that Ncorr has the capability ofperforming an Eulerian to Lagragian conversion to obtain datawithin a subset diameter closer to the crack tip region. How-ever, in this example such analysis does not provide substan-tially different results since the crack-tip length did not changeappreciably during loading.While it is still possible to analyzecracked samples by using the Bregular^ analysis and thenfiltering out bad points through a correlation coefficient cutoff,any subset that borders a crack will be removed from the dataplot. There is a tradeoff between the amount of time required
Sample 1 Sample 3r=10 pixels; rE=5 pixels
r=10 pixels; rE=5 pixels
r=20 pixels; rE=10 pixels
r=20 pixels; rE=10 pixels
r=30 pixels; rE=20 pixels
r=30 pixels; rE=20 pixels
Fig. 11 Normal strain alonghorizontal direction(εxx) forSample 14 in the SEM 2D DICchallenge. Left: Sample 1 andRight: Sample 3 for differentsubset radii (r) and strain sizes(rE). The red line is the prescribedstrain, the blue line shows theaverage strain from Ncorr
p
x/a
x/a
y/a y/a y/a
(a) (b) (c)
(f)(e)(d)
Fig. 12 The near field principal angle parameter for (a) analyticalsolution; (b) Image 8 of sample 12 analyzed with subset radius 10 andstrain window of 10; (c) the same as (b), but with subset radius 15 andstrain windows of 15; (d) FEM model; (e),(f) Image 4 of sample 12analyzed with the same parameters as in (b) and (c). The x, ycoordindates are normalized with a, the hole radius
Table 2 Chemical Composition of IN100 Compact Tension Specimen(% weight)
Al B C Co Cr Mo Ti V Zr Ni
IN100 4.90 0.02 0.07 18.20 12.10 3.22 4.20 0.70 0.07 56.52
Exp Mech

for the analysis and the amount of time needed to trace acomplex ROI so that an additional layer of data could beadded near the discontinuity.
The effective strain, Eeff along with the respective brightfield image is shown in Fig. 13(a) and (b) for F~3025N and inFig. 13(c) and (d) for F~4100 N. The effective strain is de-
fined as follows: Eeff ¼ffiffiffiffiffiffiffiffiffiffiffiffiffiffiffiffiffiffiffiffiffi2=3 ei jei j� �q
where eij=Eij−Ekkδij/3
is the deviatoric component of the Langrangian strain. Bothanalyses were done with a subset window radius of SR=80 pixels (~110 μm), an overlap of 1 pixel, and a strain win-dow radius of 40 pixels. The noise level of the strain field isfound to be 10−3 as assessed from an RBT image obtained at asmall applied load (F~90 N).
As the loading increases, there are two distinct sectorswhere deformation is localized as seen in the effectivestrain plot of Fig. 13(c). The largest Eeff component
occurs at 22° with respect to the horizontal (x-axis). Thiscontinues up to r/a=0.01 where the direction of the larg-est Eeff becomes nearly horizontal. The correspondingbright field optical image obtained at F~4100 N showsthe two highly localized deformation zones. In this exam-ple, the pattern is a limiting factor in the analysis of thestrain field. A more refined pattern could be used to re-solve the strain near the crack tip and provide more quan-titative information on the crack tip evolution.
Summary
This paper documents the core algorithms of Ncorr, a modernopen-source DIC software package. Ncorr is freely availableto the scientific community and can be easily adapted to suit a
Eeff Eeff(a)
(d)
(c)
(b)
Fig. 13 Polycrystalline nickel superalloy crack tip deformation at (a–b)F~3025N and (c–d) F~4100N. The effective strain component is shownon the top row and the corresponding bright field optical image is shown
in the bottom row. The contrast and brightness of the bright-field imageshas been digitally enhanced
Exp Mech

wide range of applications. Several verification tests and sam-ple applications have been described.
Acknowledgments This work has been partially supported by the Na-tional Science Foundation (NSF) Graduate Research Fellowship underGrant No. DGE-1148903 and an NSF CAREER Grant No. CMMI-1351705. The fracture toughness test described in this paper was per-formed at the Mechanical Properties Research Lab at Georgia Tech.
Appendix A1. The Gradient and Hessian Quantities
In order to simplify the calculations, the following assump-tions are used
d
dpf mð Þ≈0 ð19Þ
d
dp
ffiffiffiffiffiffiffiffiffiffiffiffiffiffiffiffiffiffiffiffiffiffiffiffiffiffiffiffiffiffiffiffiffiffiffiffiffiffiffiffiffiffiffiffiffiffiffiffiffiffiffiffiffiffiffiffiffiffiffiffiffiffiffiffiffiffiffiXf ξre f c þ w Δξre f ; 0
� �� �− f m
2r !≈0 ð20Þ
The gradient for the IC-GN method based on equation (10)is
∇ CLS 0ð Þ ¼ dCLS 0ð Þdp
≈2ffiffiffiffiffiffiffiffiffiffiffiffiffiffiffiffiffiffiffiffiffiffiffiffiffiffiffiffiffiffiffiffiffiffiffiffiffiffiffiffiffiffiffiffiffiffiffiffiffiffiffiffiffiffiffiffiffiffiffiffiffiffiffiffiffiffiffiX
f ξre f c þ w Δξre f ; 0� �� �
− f m 2r X f ξre f c þ w Δξre f ; 0
� �� �− f mffiffiffiffiffiffiffiffiffiffiffiffiffiffiffiffiffiffiffiffiffiffiffiffiffiffiffiffiffiffiffiffiffiffiffiffiffiffiffiffiffiffiffiffiffiffiffiffiffiffiffiffiffiffiffiffiffiffiffiffiffiffiffiffiffiffiffiX
f ξre f c þ w Δξre f ; 0� �� �
− f m 2q
264264
−g ξre f c þ w Δξre f ; pold
� �� �−gmffiffiffiffiffiffiffiffiffiffiffiffiffiffiffiffiffiffiffiffiffiffiffiffiffiffiffiffiffiffiffiffiffiffiffiffiffiffiffiffiffiffiffiffiffiffiffiffiffiffiffiffiffiffiffiffiffiffiffiffiffiffiffiffiffiffiffiffiffiffiffiX
g ξre f c þ w Δξre f ; pold� �� �
−gm 2r
3775 d
dpf ξre f c þ w Δξre f ; 0
� �� � �3775ð21Þ
The hessian is
∇∇CLS 0ð Þ ¼ d2CLS 0ð Þdp2
≈2ffiffiffiffiffiffiffiffiffiffiffiffiffiffiffiffiffiffiffiffiffiffiffiffiffiffiffiffiffiffiffiffiffiffiffiffiffiffiffiffiffiffiffiffiffiffiffiffiffiffiffiffiffiffiffiffiffiffiffiffiffiffiffiffiffiffiffiX
f ξre f c þ w Δξre f ; 0� �� �
− f m 2q X d
dpf ξre f c þ w Δξre f ; 0
� �� �ffiffiffiffiffiffiffiffiffiffiffiffiffiffiffiffiffiffiffiffiffiffiffiffiffiffiffiffiffiffiffiffiffiffiffiffiffiffiffiffiffiffiffiffiffiffiffiffiffiffiffiffiffiffiffiffiffiffiffiffiffiffiffiffiffiffiffiX
f ξre f c þ w Δξre f ; 0� �� �
− f m 2q
26643775 d
dpf ξre f cþ� 8>><>>: w Δξre f ; 0
� ��T
þX f ξre f c þ w Δξre f ; 0
� �� �− f mffiffiffiffiffiffiffiffiffiffiffiffiffiffiffiffiffiffiffiffiffiffiffiffiffiffiffiffiffiffiffiffiffiffiffiffiffiffiffiffiffiffiffiffiffiffiffiffiffiffiffiffiffiffiffiffiffiffiffiffiffiffiffiffiffiX
f ξre f c þ w Δξre f ; 0� �� �
− f m q −
g ξre f c þ w Δξre f ; pold� �� �
−gmffiffiffiffiffiffiffiffiffiffiffiffiffiffiffiffiffiffiffiffiffiffiffiffiffiffiffiffiffiffiffiffiffiffiffiffiffiffiffiffiffiffiffiffiffiffiffiffiffiffiffiffiffiffiffiffiffiffiffiffiffiffiffiffiffiffiffiffiffiffiffiXg ξre f c þ w Δξre f ; pold
� �� �−gm
2r2664
3775 d2
dpf ξre f c þ w Δξre f ; 0
� �� � ��ð22Þ
Using the Gauss-Newton assumption
(a) (b)
Fig. 14 (a) Schematic of the B-spline coefficient calculation. Top-left:original grayscale values array. Top-right: Copy and pad data; paddingparameter here is set to 2. Bottom-left: Deconvolution via the DFT foreach row and then each column. Bottom-right: The associated B-spline
coefficients for the top-left image. (b) Extension of (a) with the same grayscale and B-spline coefficients. Black crosses represent integer pixel lo-cations and the black circle (top-left) is the subpixel point beinginterpolated
Exp Mech

X f ξre f c þ w Δξre f ; 0� �� �
− f mXf ξre f c þ w Δξre f ; 0
� �� �− f m
2− g ξre f c þ w Δξre f ; pold� �� �
−gmffiffiffiffiffiffiffiffiffiffiffiffiffiffiffiffiffiffiffiffiffiffiffiffiffiffiffiffiffiffiffiffiffiffiffiffiffiffiffiffiffiffiffiffiffiffiffiffiffiffiffiffiffiffiffiffiffiffiffiffiffiffiffiffiffiffiffiffiffiffiffiXg ξre f c þ w Δξre f ; pold
� �� �−gm
2q264
375 d2
dp2f ξre f c þ w Δξre f ; 0
� �� � �≈0 ð23Þ
yields the hessian in the final form
∇∇CLS 0ð Þ≈dCLS 0ð Þdp2
≈2X
f ξre f c þ w Δξre f ; 0� �� �
− f m 2X d
dpf ξre f c�
þ w Δξre f ; 0� �� d
dpf ξre f c þ w Δξre f ; 0
� �� � �Tð24Þ
Appendix A2. Biquintic B-Spline Interpolation
T h e q u a n t i t i e s ddp f ξre f c þ w Δξre f ; 0
� �� �a n d g
ξre f c þ w Δξre f ; pold� �� �
require some form of estimation
through interpolation. Using the chain rule on ddp f
ξre f c þ w Δξre f ; 0� �� �
and equation (4), we obtain:
d
dpf exre f i ;eyre f j
� �¼ ∂
∂exre f i f exre f i ;eyre f j
� �*dexre f idp
þ ∂∂eyre f j
f exre f i ;eyre f j
� �*deyre f j
dp
ð25Þ
The only two quantities we need to specifically compute
for equation (25) are ∂∂exre f i f exre f i ;eyre f j
� �and
∂∂eyre f j f exre f i ;eyre f j
� �. These can be computed in various ways
(sobel filter, finite difference, etc.), but in Ncorr, biquintic B-spline interpolation is used.
The quantity g ξre f c þ w Δξre f ; pold� �� �
also requires inter-
polation. Once ∂∂exre f i f exre f i ;eyre f j
� �and ∂
∂eyre f j f exre f i ;eyre f j
� �are precomputed for the entire reference image, and g
ξre f c þ w Δξre f ; pold� �� �
is computable, equation (19) and
equation (22) can be computed and iterated with equation(10) to find a closer approximation to prc
∗ .The main idea behind B-spline interpolation is to approxi-
mate the image grayscale surface with a linear combination ofB-spline basis Bsplines.^ These splines are scaled via the B-spline coefficients and then the linear combination of thesescaled splines forms an approximation of the surface. Oncethis approximation is complete, points can be interpolatedthrough 1-D convolutions (since biquintic B-spline interpola-tion is separable [49]), which reduces to a series of simple dotproducts. The equation for interpolation for the 1D case is
g xð Þ ¼Xk∈Z
c kð Þβn x−kð Þ ð26Þ
where c(k),βn(x−k), and g(x) are the B-spline coefficient val-ue at integer k, the B-spline kernel value at x−k, and theinterpolated signal value at x, respectively. Here n is the B-spline kernel order, which is set to 5 (the quintic kernel) and Zis the set of integers. Note that the B-spline coefficients are notequivalent to the data samples (unlike in other forms of inter-polation—i.e. bicubic keys [50]), and thus must be solved fordirectly. The equation for the B-spline kernel is
βn xð Þ ¼ 1
n!
Xnþ1
k¼0
nþ 1k
� �−1ð Þk x−k þ nþ 1
2
� �n
þð27Þ
When solved for the quintic case, this equation yields:
β5 xð Þ ¼
1
120x5 þ 1
8x4 þ 3
4x3 þ 9
4x2 þ 27
8xþ 81
40−2≥x≥−3
−1
24x5 −
3
8x4 −
5
4x3 −
7
4x2 −
5
8x2 þ 17
40−1≥x≥−2
1
12x5 þ 1
4x4 −
1
2x2 þ 11
200 x ≥ −1
−1
12x5−
3
8x4 þ 5
4x3−
7
4x2 þ 5
8x þ 17
401 x ≥ 1
1
24x5 −
3
8x4 þ 5
4x3 −
7
4x2 þ 5
8x þ 17
402 x ≥ 1
−1
120x5 þ 1
8x4−
3
4x3 þ 9
4x2−
27
8x þ 81
4030 x ≥ 2
8>>>>>>>>>>>>>>>><>>>>>>>>>>>>>>>>:
ð28Þ
The first step of the interpolation process is to determinethe B-spline coefficients. They can be found by usingdeconvolution. Applying Discrete Fourier Transform (DFT)to equation (26) yields:
F gf g ¼ F cf g*F βnf g ð29Þwhere F{…} is the DFT. The goal is to solve for c, the B-spline coefficients. This can be done by dividing the Fouriercoefficients of the B-spline kernel element-wise with the
Exp Mech

Fourier coefficients of the signal as shown:
F cf g ¼ F βnf gF gf g ð30Þ
Taking the inverse DFT of equation (30) will thenyield the B-spline coefficients, although caution shouldbe exercised when using this method due to the circularnature of the DFT. To mitigate wrap-around errors, pad-ding should be used.
After obtaining the B-spline coefficients, the image arraycan be interpolated point-wise by using equation (26). This iscarried out by taking a series of dot products with the columnsof the B-spline coefficient array and B-spline kernel, and thentaking a single dot product across the resulting row of inter-polated B-spine coefficient values (note that the order of thisoperation doesn’t matter). The first step of the aforementionedprocess can be thought of as interpolating the 2DB-spline gridto obtain 1D B-spline coefficient values, and then the secondstep as interpolating the grayscale value from these 1D B-spline coefficient values.
The steps for obtaining the B-spline coefficients areoutlined below:
1. Make a copy of the grayscale array and pad it (anymethodcan be used; Ncorr uses the border values to expand thedata as shown in the top right of Fig. 14(a)). Then, samplethe B-spline kernel at −2,−1,0,1, 2, and 3. This will formthe quintic B-spline vector
bo ¼ 1=120 13=60 11=20 13=60 1=120 0f gT ð31Þ
2. Pad the kernel with zeros to the same size as thenumber of columns (the width) of the image gray-scale array. Take the FFT of the padded kernel, andthen store it in place.
3. Take the FFT of an image row, then divide the Fouriercoefficients element-wise of the padded B-spline withthe Fourier coefficients from the image row. After-ward, take the inverse FFT of the results and storethem in place (in the padded grayscale array). Thisis done for all the image rows as shown on the bottomright of Fig. 14(a).
4. Repeat steps 2–3, except column-wise, with the array ob-tained at the end of step 3. The result will be the B-splinecoefficients of original image array as shown on the bot-tom right of Fig. 14(a).
Now that the B-spline coefficients have been obtained, wecan interpolate values at sub pixel locations. The steps areoutlined below:
1. Pick a subpixel point, excur;eycurð Þ, within the image arrayto interpolate.
2. Calculate Δx and Δy, where:
Δx ¼ excur −x fΔy ¼ eycur−y f
ð32Þ
where xf = floor(excur) and yf = floor( cur).3. Perform the operation in equation (32) to obtain the inter-
polated grayscale value.
g excur;eycurð Þ
¼ 1 Δy Δy2 Δy3 Δy4 Δy5
QK½ � c½ � x f −2:x fþ3;y f −2:y fþ3ð Þ QK½ �T
1ΔxΔx2
Δx3
Δx4
Δx5
26666664
37777775ð33Þ
where [QK] is the array defined:
QK½ � ¼
1
120
13
60
11
20
13
60
1
1200
−1
24−
5
120
5
12
1
240
1
12
1
6−1
2
1
6
1
120
−1
12
1
60 −
1
6
1
120
1
24−1
6
1
4−1
6
1
240
−1
120
1
24−
1
12
1
12−
1
24
1
120
26666666666666664
37777777777777775ð34Þ
and c½ � x f −2:x f þ3;y f −2:y f þ3ð Þ are the B-spline coefficients as
shown:
c½ � x f −2:x f þ3;y f −2:y f þ3ð Þ
¼
c x f −2;y f −2ð Þ c x f −1;y f −2ð Þ c x f ;y f −2ð Þ c x f þ1;y f −22ð Þ c x f þ2;y f −2ð Þ c x f þ3;y f −2ð Þc x f −2;y f −1ð Þ c x f −1;y f −1ð Þ c x f þ1;y f −1ð Þ c x f þ1;y f −1ð Þ c x f þ2;y f −1ð Þ c x f þ3;y f −1ð Þc x f −2;y fð Þ c x f −1;y fð Þ c x f ;y fð Þ c x f þ1;y fð Þ c x f þ2;y fð Þ c x f þ3;y fð Þc x f −2;y f þ1ð Þ c x f −1;y f þ1ð Þ c x f þ1;y f þ1ð Þ c x f þ1;y f þ1ð Þ c x f þ2;y f þ1ð Þ c x f þ3;y f þ1ð Þc x f −2;y f þ2ð Þ c x f −1;y f þ2ð Þ c x f ;y f þ2ð Þ c x f þ1;y f þ2ð Þ c x f þ2;y f þ2ð Þ c x f þ3;y f þ2ð Þc x f −2;y f þ3ð Þ c x f −1;y f þ3ð Þ c x f ;y f þ3ð Þ c x f þ1;y f þ3ð Þ c x f þ2;y f þ3ð Þ c x f þ3;y f þ3ð Þ
26666664
37777775ð35Þ
The position of the required B-spline coefficients withinthe B-spline array ultimately depends on the amount of pad-ding used. Figure 14(b) gives an example of the location of thecoefficients within the B-spline array for a given xf and yf anda padding of 2.
The left portion containing the Δy vector and the [QK]matrix is the matrix form of resampling the quintic B-splinekernel with a shift of Δy. Right multiplying this quantity byc½ � x f ¼2:x f þ3;y f −2:y f þ3ð Þ yields the interpolated B-spline coeffi-
cients which form a row of values, as shown in the top right ofFig. 14(b). When this quantity is right multiplied by [QK] and
Exp Mech
the Δx vector, it interpolates the gray-scale value we needfrom the interpolated row of B-spline coefficients as shownon the bottom left of Fig. 14(b).
Lastly, examining the portion central portion containing:
QK½ � c½ � x f −2:x f þ3;y f −2:y f þ3ð Þ QK½ �T ð36Þ
this term can be precomputed to increase the speed of theprogram [37]. This precomputation for biquintic B-splineinterpolation requires a very large amount of storage (36times the size of the padded B-spline coefficient array).But, the space required may be worth the trade off for thespeed improvement. The largest computational bottleneckin the DIC analysis is the interpolation step when calcu-lating the components of the hessian, so the reduction incomputational time is worth the expensive memoryrequirement.
At this point, the g excuri ;eycur j� �quantity is calculable. The
last quantities to address are ∂∂exre f f exre f i ;eyre f j
� �and
∂∂eyre f f exre f i ;eyre f j
� �. These quantities can be computed by tak-
ing the partial derivatives of an equation of the same form asequation (33) and setting Δx and Δy to zero (because theseare integer pixel locations) to obtain
∂∂exre f f exre f i ;eyre f j
� �¼ 1 0 0 0 0 0½ �* QK½ �* c½ � x f −2:x f þ3;y f −2:y f þ3ð Þ* QK½ �T*
010000
26666664
37777775ð37Þ
∂∂eyre f f exre f i ;eyre f j
� �¼ 0 1 0 0 0 0½ �* QK½ �* c½ � x f −2:x f þ3;y f −2:y f þ3ð Þ* QK½ �T*
100000
26666664
37777775ð38Þ
These quantities are precomputed for the entire referenceimage before beginning the IC-GN method.
References
1. Peters W, Ranson W (1982) Digital imaging techniques in experi-mental stress analysis. Opt Eng 21(3):213427
2. Chu T, Ranson W, Sutton M (1985) Applications of digital-image-correlation techniques to experimental mechanics. ExpMech 25(3):232–244
3. Vendroux G, Knauss W (1998) Submicron deformation field mea-surements: Part 2. Improved digital image correlation. Exp Mech38(2):86–92
4. Bruck HA, McNeill SR, Sutton MA, Peters WH III (1989) Digitalimage correlation using Newton–Raphson method of partial differ-ential correction. Exp Mech 29:261–267
5. Cheng P, Sutton MA, Schreier HW, McNeill SR (2002) Full-fieldspeckle pattern image correlation with B-spline deformation func-tion. Exp Mech 42:344–352
6. Kammers AD, Daly S (2011) Small-scale patterning methods fordigital image correlation under scanning electronmicroscopy. MeasSci Technol 22:125501
7. Scrivens WA, Luo Y, Sutton MA, Collette SA, Myrick ML, MineyP, Colavita PE, Reynolds AP, Li X (2007) Development of patternsfor digital image correlationmeasurements at reduced length scales.Exp Mech 47(1):63–77. doi:10.1007/s11340-006-5869-y
8. Sutton MA, Li N, Joy DC, Reynolds AP, Li X (2007) Scanningelectron microscopy for quantitative small and large deformationmeasurements. Part I: SEM imaging at magnifications from 200 to10,000. Exp Mech 47(6):775–787. doi:10.1007/s11340-007-9042-z
9. Wang JW, He Y, Fan F, Liu XH, Xia S, Liu Y, Harris CT, Li H,Huang JY, Mao SX (2013) Two-phase electrochemical lithiation inamorphous silicon. Nano Lett 13(2):709–715
10. Van Puymbroeck N, Michel R, Binet R, Avouac J-P, Taboury J(2000) Measuring earthquakes from optical satellite images. ApplOpt 39(20):3486–3494
11. Rubino V, Lapusta N, Rosakis A, Leprince S, Avouac J (2014)Static laboratory earthquake measurements with the digital imagecorrelation method. Exp Mech 1–18
12. Dickinson AS, Taylor AC, Ozturk H, Browne M (2011)Experimental validation of a finite element model of the proximalfemur using digital image correlation and a composite bone model.Engineering, Journal of Biomechanical
13. Zhang D, Eggleton C, Arola D (2002) Evaluating the mechanicalbehavior of arterial tissue using digital image correlation. ExpMech42(4):409–416. doi:10.1007/BF02412146
14. Franck C, Maskarinec SA, Tirrell DA, Ravichandran G (2011)Three-dimensional traction force microscopy: a new tool for quan-tifying cell-matrix interactions. PLoS One 6(3):e17833
15. Wang H, Lai W, Antoniou A, Bastawros A (2014) Application ofdigital image correlation for multiscale biomechanics. In: CoreyNeu GG (ed) CRC handbook of imaging in biological mechanics.CRC Press, Oxfords, pp 141–151
16. Carroll JD, Abuzaid W, Lambros J, Sehitoglu H (2013) High reso-lution digital image correlation measurements of strain accumula-tion in fatigue crack growth. Int J Fatigue 57:140–150
17. TongW (1997) Detection of plastic deformation patterns in a binaryaluminum alloy. Exp Mech 37(4):452–459. doi:10.1007/BF02317313
18. Rehrl C, Kleber S, Antretter T, Pippan R (2011) A methodology tostudy crystal plasticity inside a compression test sample based onimage correlation and EBSD. Mater Charact 62(8):793–800. doi:10.1016/j.matchar.2011.05.009
19. Daly S, Ravichandran G, Bhattacharya K (2007) Stress-inducedmartensitic phase transformation in thin sheets of Nitinol. ActaMater 55(10):3593–3600
20. Reedlunn B, Daly S, Hector L, Zavattieri P, Shaw J (2013)Tips and tricks for characterizing shape memory wire part 5:full-field strain measurement by digital image correlation. ExpTech 37(3):62–78
21. Bastawros A, Bart-Smith H, Evans A (2000) Experimental analysisof deformation mechanisms in a closed-cell aluminum alloy foam. JMech Phys Solids 48(2):301–322
22. Bart-Smith H, Bastawros A-F, Mumm D, Evans A, Sypeck D,Wadley H (1998) Compressive deformation and yielding mecha-nisms in cellular Al alloys determined using X-ray tomography andsurface strain mapping. Acta Mater 46(10):3583–3592
23. Antoniou A, Onck P, Bastawros AF (2004) Experimental analysisof compressive notch strengthening in closed-cell aluminum alloyfoam. Acta Mater 52(8):2377–2386
Exp Mech

24. Jerabek M, Major Z, Lang R (2010) Strain determination of poly-meric materials using digital image correlation. Polym Test 29(3):407–416
25. Wang Y, Cuitiño AM (2002) Full-field measurements of heteroge-neous deformation patterns on polymeric foams using digital imagecorrelation. Int J Solids Struct 39(13):3777–3796
26. Poissant J, Barthelat F (2008) A novel Bsubset splitting^ procedurefor digital image correlation on discontinuous displacement fields.Exp Mech 50:353–364
27. Pan B, Dafang W, Yong X (2012) Incremental calculation for largedeformation measurement using reliability-guided digital imagecorrelation. Opt Lasers Eng 50:586–592
28. Pan B, Wang Z, Lu Z (2010) Genuine full-field deformation mea-surement of an object with complex shape using reliability-guideddigital image correlation. Opt Express 18:1011–1023
29. Lu H, Cary PD (2000) Deformation measurements by digital imagecorrelation: implementation of a second-order displacement gradi-ent. Exp Mech 40:393–400
30. Helm JD, McNeill SR, Sutton MA (1996) Improved three-dimensional image correlation for surface displacement measure-ment. Soc Photo Opt Instrum Eng 35(7):1911–1920
31. Pan B (2009) Reliability-guided digital image correlation for imagedeformation measurement. Appl Opt 48:1535–1542
32. Eberl C (2010) Digital image correlation and tracking. http://www.mathworks.com/matlabcentral/fileexchange/12413-digital-image-correlation-and-tracking
33. Jones E (2013) Improved digital image correlation (DIC). http://www.mathworks.com/matlabcentral/fileexchange/43073-improved-digital-image-correlation–dic-
34. Pan B, Li K, TongW (2013) Fast, robust and accurate digital imagecorrelation calculation without redundant computation. Exp Mech53:1277–1289
35. Pan B, Asundi A, Xie H, Gao J (2009) Digital image correlationusing iterative least squares and pointwise least squares for dis-placement field and strain field measurements. Opt Lasers Eng47(7):865–874
36. Schreier HW, Braasch JR, Sutton MA (2000) Systematic errors indigital image correlation caused by intensity interpolation. SocPhoto Opt Instrum Eng 39(11):2915–2921
37. Pan B, Li K (2011) A fast digital image correlation method fordeformation measurement. Opt Lasers Eng 49:841–847
38. Pan B, Xie H, Wang Z (2010) Equivalence of digital image corre-lation criteria for pattern matching. Appl Opt 49:5501–5509
39. Baker S, Matthews I (2004) Lucas-kanade 20 years on: a unifyingframework. Int J Comput Vis 56(3):221–255
40. Baker S, Matthews I (2004) Lucas-kanade 20 years on: a unifyingframework. Int J Comput Vis 56:221–255
41. Pan B (2009) Reliability-guided digital image correlation for imagedeformation measurement. Appl Opt 408(8):8
42. Eberly D (2000) Least squares fitting of data. Magic Software,Chapel Hill
43. Finley DR (2007) Efficient polygon fill algorithm44. Nair D, Rajagopal R, Wenzel L (2000) Pattern matching based on a
generalized Fourier transform. In: International symposium on op-tical science and technology. International Society for Optics andPhotonics, Bellingham, pp 472–480
45. Milligan W, Orth E, Schirra J, Savage M (2004) Effects of micro-structure on the high temperature constitutive behavior of IN100,Superalloys, pp 331–339
46. Jha S, Caton M, Larsen J (2007) A new paradigm of fatigue vari-ability behavior and implications for life prediction. Mater Sci EngA 468:23–32
47. Barker VM, Johnson SW, Adair BS, Antolovich SD, Staroselsky A(2013) Load and temperature interaction modeling of fatigue crackgrowth in a Ni-base superalloy. Int J Fatigue 52:95–105
48. Abràmoff MD, Magalhães PJ, Ram SJ (2004) Image processingwith ImageJ. Biophoton Int 11(7):36–43
49. Tevenaz P (2000) Interpolation revisited. IEEE Trans Med Imaging19(7):739–758
50. Keys RG (1981) Cubic convolution interpolation for digital imageprocessing. IEEE Trans Acoust Speech Signal Process 29(6):1153–1160
Exp Mech