Embed Size (px)
Citation preview

8/6/2019 NCM Report May 2011- Proshare
http://slidepdf.com/reader/full/ncm-report-may-2011-proshare 1/81
The Monthly NCM Report for May 2011 www.proshareng.com Page1
ISSN 1597 - 8842 Vol. 1 No. 69
The Monthly NCM Report for May 11
Issued on June 03, 2011

8/6/2019 NCM Report May 2011- Proshare
http://slidepdf.com/reader/full/ncm-report-may-2011-proshare 2/81
The Monthly NCM Report for May 2011 www.proshareng.com Page2
Executive Summary 3
Introduction 5
All-Share Index Movement 10
Market Dynamics 12
Comparison of 2009 and 2010 Market Performance 13
Sectoral Index Movements 15
NSE -30 Index, NSE -Food Index, NSE -Banking Index, NSE -Insurance Index &
NSE -Oil Index
Transactions Volume and Value Trend 20
Top Ten Trades for Q3 2010 22
Top Ten Traded Sectors for Q3 2010 22
Top Ten Gainers for Q3 2010 24
Top Ten Losers/Decliners for Q3 2010 25
Supplementary Listing for Q3 2010 26
Corporate Declarations for Q3 2010 27
Forecast Results for Q3 2010 55
Dividends Declared 59
Sectoral Analysis 62Outlook/ Analyst Opinion 68
Time Lines ( May Market News/Information) 70

8/6/2019 NCM Report May 2011- Proshare
http://slidepdf.com/reader/full/ncm-report-may-2011-proshare 3/81
The Monthly NCM Report for May 2011 www.proshareng.com Page3
The Monthly NCM Report for May 2011
ISSN 1597 - 8842 Vol. 1 No. 69
Executive Summary
The Nigerian Capital Market sustained the uptrend recorded in the previous month, as
market experienced consistent and steady bargain with improved market sentiments and
enthusiasm, reflecting optimistic reaction of investors to the dearth of politicaluncertainties in the country following the peaceful general election.
A cursory look at the market trend in the month revealed dominance of bulls activities
against the weak drive of the bears while low valuation of equities and quarter one
earning reports contributed to the steady rally experienced in the early stage of the
month i.e. from May 3rd, to 16th 2011. The month however experienced less institutional
buying as against active institutional buying witnessed considerably in the previous
month.
During the first ten trading sessions i.e. from May 3rd, to 16th 2011, the key benchmark
indices appreciated by 2.95% as against 0.64% appreciation recorded in the previous
month comparable period i.e. April 1st
to 14th
, 2011 on the back of sustained optimisticrally due to improved atmosphere in the political terrain.
The low speculative tendency witnessed in the early stage of the month buttressed the
improved sentiment noted above as market recorded two negative positions in the first
10 trading sessions as against 4 negative positions recorded in the previous month
comparable period.
Further analysis revealed that blue chip stocks particularly in Banking, Food & Beverages
sectors dictated the pace in the early stage of the month as revealed in the movement of
NSE sectoral indices. The trend also revealed that investors maintained the value-
investing approach witnessed in the previous month. – The cautious treading revealing
low risk appetite while buttressing the less speculative tendency stated above.
In addition, it was observed that the key benchmark indices stirred into bullish trend
during the period stated above as ASI was observed trading comfortably above its 20,
50, and 200days moving averages on 6th of May, 2011 while it peaked above its 50days
high on 16th May 2011 at 25,826.50 with YTD and MTD of 2.88% and 2.95%
respectively.
Performance Outlook in F irst Ten days is May 2011
Indicators May 3rd - 16th 2011 April 1st - 14th 2011
ASI +2.95% +0.67%
Volume traded 3.0 billion units 5.8 billion units
Proshare
However, market pulled back on 17th May 2011 on the back of profiteering, a kind of
market correction as market had appreciated by 4.64%, moving from 12 th April to 16th
May 2011 .i.e. 21days of less volatility while ASI remained resilient to bag N368.09
billion gain.

8/6/2019 NCM Report May 2011- Proshare
http://slidepdf.com/reader/full/ncm-report-may-2011-proshare 4/81
The Monthly NCM Report for May 2011 www.proshareng.com Page4
In the process of market correction, market shed N66.44 billion in 7days i.e. from 17th to
25th May 2011. During this period, market traded 2.55 billion units of share as against
3.00 billion shares traded in the first 10days-this buttress our position on the market
correction as stated above, though some institutional buying witnessed during the period
aided the huge volume recorded.
Short Term Market Correction in May, 2011
Date ASI %Change
17/05/2011 25,821.85 -0.02
18/05/2011 25,788.06 -0.13
19/05/2011 25,717.73 -0.27
20/05/2011 25,790.64 +0.28
23/05/2011 25,762.67 -0.11
24/05/2011 25,738.80 -0.09
25/05/2011 25,618.53 -0.47
Aggregate Loss -0.81
Proshare
During the short term market correction, the intense sell activities cut across the board
but the NSE major sectors recorded more hit as reflected in the trend of NSE sectoral
indices. Banking sector remained the worst hit, dipping by -3.99% within the 7days
correction. However, NSE 30, NSE Food & Beverages and NSE Oil & Gas retained positive
MTD performance of 1.80%, 2.21% and 0.86% respectively as at May 25th 2011 while
NSE Banking & Insurance dipped by -1.17% and -3.47%.
Nevertheless, the market sustained its bullish outlook and strong footing above its
50days and 200days moving averages of 25,134.35 and 25,137.68 to retrace at
25,829.75 while embarking on 3days northward trends to close the month on positive
note with 3.11% aggregate gain for the month on the back of improved positive
sentiments.
Furthermore, updates and follow ups on the rescued banks revealed that the group
experienced intense sell activities but closed with improved performance outlook of
aggregate loss of -48.38% when compared with aggregate loss of -62.6% recorded in
the previous month.
Rescued Banks: Improved Performance Outlo ok in May, 2011
Symbol
3rd
May
31st
May %Change Symbol
Apr-
01
Apr-
29 %Change
INTERCONT 1.3 1.35 3.85% FIRSTINLND 0.68 0.69 1.5%OCEANIC 1.71 1.76 2.92% UNITYBNK 1.23 1.2 -2.4%
PLATINUM 1.2 1.16 -3.33% PLATINUM 1.23 1.19 -3.3%
FIRSTINLND 0.69 0.65 -5.80% INTERCONT 1.4 1.31 -6.4%
AFRIBANK 1.71 1.60 -6.43% WEMABANK 1.27 1.18 -7.1%
UBN 3.01 2.77 -7.97% AFRIBANK 1.93 1.78 -7.8%
SPRINGBANK 1.19 1.09 -8.40% UBN 3.29 3.01 -8.5%
UNITYBNK 1.18 1.05 -11.02% SPRINGBANK 1.33 1.19 -10.5%
WEMABANK 1.23 1.08 -12.20% OCEANIC 1.99 1.63 -18.1%

8/6/2019 NCM Report May 2011- Proshare
http://slidepdf.com/reader/full/ncm-report-may-2011-proshare 5/81
The Monthly NCM Report for May 2011 www.proshareng.com Page5
Aggregate Loss/Gain -48.38% Aggregate Loss/Gain -62.6%
Proshare
In addition, the merger and acquisition talks in the banking sector sustained the mixed
outlook recorded in the previous month with another cancelled or void MoU betweenFCMB Plc and Finbank Plc. http://www.proshareng.com/news/13837 while few other
rescued banks are still battling with due diligence towards recapitalisation of the banks.
In the same vein, the status of the MoU between Vine Capital and Afribank Plc is
insecure as series of uncertainties seem to have beclouded the progress made so far on
deal between vine Capital Partners Ltd and Afribank.
https://www.proshareng.com/news/13913
In our opinion, this is likely to have negative impact on the recapitalisation in the
banking sector as the process tends to take more time than expected which might
negatively affect timing and enthusiasm of the prospective buyers while it slows down
activity in the sector.
On the other hand, Access Bank Plc maintained the memorandum of understanding
signed with intercontinental Bank Plc while African Alliance Capital sustained the
memorandum of understanding signed with Union bank Plc
https://www.proshareng.com/news/singleNews.php?id=13646.
On new banking model, more banks embarked on divesting from non banking business
as new banking regime stipulates. More so, Oceanic Bank Plc sold its subsidiary in Sao
Tome to Global Fleet Group owned by Jimo Ibrahim as part of the process by the bank to
secure new banking licence for the new banking regime in the country.
https://proshareng.com/news/13880
To this regard, we want to reiterate that timely conclusion of the mergers and acquisition
in the banking sector is likely to return positive activities to market with certain degree
of market confidence if the processes are transparent to the investing community.
On the final note, the month of May conformably closed with impressive gains of
3.11%, putting year to date market performance higher at 3.04%. The performance
recorded positioned the month second best so far in the year 2011. However, the
outlook recorded in the month is in line with position for the entire Q2, 2011 as
envisaged in our previous NCM reports.
https://proshareng.com/reports/view.php?id=3329

8/6/2019 NCM Report May 2011- Proshare
http://slidepdf.com/reader/full/ncm-report-may-2011-proshare 6/81
The Monthly NCM Report for May 2011 www.proshareng.com Page6
A number of developments we believed should have impact in the month aspredicted in the past monthly reports. Some of which are:
Factors expected to impact Market Outcomes
Better economic outlook as politicaltension and power play ceased
Investors reacted positively as political tensionwaned and remained moderated.
Positive corporate actionsInvestors reacted positively to impressivecorporate actions from key companies
Liquidity challenges The liquidity challenges remained the same
Increased lending into real sectorBanks are yet to resume full lending to realsector
Increased efforts towards infrastructurerevamping
Government sustained momentum
Recapitalization process in the bankingsector
The process is experiencing some set backs
Merger & Acquisition in the bankingsector
sustains mixed outlook as another MoU wasnullified by court of law
Conclusion of bids on rescued banks Still on course but none is concluded yet
Monetary Policy Rates will be adjustedpositively
The hike in the MPR by CBN in the monthencouraged assets relocation due to attractiveinterest rate in money market
Inflation outlook Inflation outlook improved but had no impact
New banking regime- likely to haveeffect on the market as more banks willdivest from their subsidiaries
more banks continued to divest from theirnon-banking subsidiaries.
Increased institutional investingLow institutional buying witnessed in themonth
Continued cleanup of marketirregularities by NSE NSE maintained strict position
Developments in the coming months:
Direction of policy by new government
continued effort towards infrastructure development
Sustained support towards real and agricultural growth
Portfolio restructuring
Anticipation of impressive Q2 corporate actions
Liquidity challenges
Change in Monetary Policy Rates
Recapitalization in the banking sector
Conclusion of bids on rescued banks

8/6/2019 NCM Report May 2011- Proshare
http://slidepdf.com/reader/full/ncm-report-may-2011-proshare 7/81
The Monthly NCM Report for May 2011 www.proshareng.com Page7
Thank you for reading and do take time to share with us your thoughts on the market,
analyst at [email protected].
We value your feedback and comments.

8/6/2019 NCM Report May 2011- Proshare
http://slidepdf.com/reader/full/ncm-report-may-2011-proshare 8/81
The Monthly NCM Report for May 2011 www.proshareng.com Page8
Introduction
Equity Market sustains bargain sentiments by 3.11% upbeat on cautioustrading.
Market activities in the month of May sustained the positive trend recorded in theprevious month to close on positive. The month experienced impressive bargain position
with growing and sustainable enthusiasm while the fading of political tension and the
smooth transition into new government have been the major driving elements.
More so, less speculative trading was observed while active position of the bargain
hunters revealed the dominance of the bulls in the month, though there were traces of
low risk appetite and fragile market confidence as investors maintained cautious bargain
outlook throughout the month.
The impressive uptrend in the NSE 30 index which basically measures the performance
of blue chips in the market coupled with active performance of big and mid cap stocks
suggested active value investing in the month which buttressed our cautious treadingand low risk appetite noted above.
Furthermore, the early stage of the month experienced steady bargain sentiments as
against unstable and speculative tendency witnessed in the previous month comparable
period.
The first 10 trading sessions in the month of May (May 3rd, to 16th 2011,) recorded
2.95% appreciation against 0.64% recorded in the previous month comparable period
on the back of active and optimistic bargain position driven by moderated political risk,
low valuation of valued stocks and impressive Q1 corporate actions from key companies.
During the early bullish period, the key benchmark indices hit above its 50 days high at
25,826.50 while trading above its 50 and 200days moving averages comfortably, puttingmonth to date performance as May 16th 2011 at 2.95% against 0.67% performance
recorded in the previous month comparable period. This buttressed our position on
growing enthusiasm observed in the month as noted above.
In addition, there was significant fall of -48% in the volume traded during the period
highlighted above which signifies hold positions of value investors during the consistent
rally, although absence of institutional buying was observed during the period compared
with active positions of institutional investors witnessed in previous month comparable
period.
However, market experienced correction on the back of profit taking due to impressive
growth of 4.64% (N368.09billion gain) recorded between 12th
April and 16th
May2011- a 21 days resilient uptrend as revealed by further analysis. As a result of profit
taking, market CAP shed N66.44 billion between 17th and 25th May 2011 while ASI pulled
back from its 50 days high to stand at 25,618.53. Also, blue chip stocks particularly in
Banking and Food & Beverages sectors witnessed intense sell activities during the
market correction.

8/6/2019 NCM Report May 2011- Proshare
http://slidepdf.com/reader/full/ncm-report-may-2011-proshare 9/81
The Monthly NCM Report for May 2011 www.proshareng.com Page9
Subsequently, bargain activities resumed on the bourse as the bulls consolidated
positions while ASI maintained strong footing above its moving averages comfortably as
market recorded three days uninterrupted northward trend to close the month on
impressive note with 3.11% aggregate growth as against 1.17% recorded in the
previous month.
Market pattern basically reveals that market is technically bullish as could be seen fromthe NSE ASI moving averages trend with index of 25,866.62 as at May 31st 2011 trading
above its 20 days, 50 days and 200days of 25,594.02, 25,159.84 and 25,141.02
respectively. This suggests market trend is technically bullish in mid and long term.
The Market – Game On
The market this month recorded a total volume of 6.58 billion units valued at N48.79
billion (US$330.69 million) exchanged in 110,439 deals compared with 8.24bn units
valued at N76.00bn (US$515.08million) exchanged in 180,388 deals in May 2010.
Comparing, the volume and value traded in the month reveals a - 20 . 13% and -
35 . 80% below the volume and value recorded in the previous year’s comparable period
respectively.

8/6/2019 NCM Report May 2011- Proshare
http://slidepdf.com/reader/full/ncm-report-may-2011-proshare 10/81
The Monthly NCM Report for May 2011 www.proshareng.com Page10
During the month, All-Share index recorded a positive trend of 3.11%, a significant
positive growth from -2.44% negative growth recorded in the May 2010.
However, the trend is significantly lower when compared with the +38.51% recorded in
the preceding year’s May closed at 29,700.24.
Market capitalisation this month increased by N269.59 billion (US$1.82 billion) as
against depreciation by –N29.59 billion (US$300.58million) recorded in May 2010.
Market capitalisation gained higher figures of N1.87 trillion (US$12.71bn) in the
preceding year’s comparable period.

8/6/2019 NCM Report May 2011- Proshare
http://slidepdf.com/reader/full/ncm-report-may-2011-proshare 11/81
The Monthly NCM Report for May 2011 www.proshareng.com Page11
The Market – Game Changers:
The significant drop in political tension coupled with smooth transition into new and freshgovernment could be responsible for the sustained enthusiasm and optimistic bargaintendency towards equity investment while the impressive corporate actions from keylisted companies impacted the consistent rally witnessed in the month. The major factorsremained the improved bargain position, value investing, drop in political tension, lowvaluation of big CAPs and blue chips and quarter one earnings report.
The market is on the bullish mode and is likely to continue as market would sustain thepositive outlook in which stable political atmosphere, friendly monetary policy andcontinued economic reforms would play a dominant role in the anticipated positive trend.
The contributory factors for the month of May 2011 performance can be located in the
following indices as outlined below:
Negative Factors in the market
Liquidity squeezeFragile Investor’s confidenceLow risk appetite as cautious investing dominated market atmosphereNo lending to the private sectorBanks are yet to resume active lendingRelocation of assets due to hike in monetary ratesHigh monetary policy ratesAbsence of Margin loans
Positive Factors in the market
Drop in political tension and uncertaintiesSmooth transition into new governmentConsistent value investingModerate institutional buyingInvestment by fund managersThe Federal Government commitment to revive economic infrastructures Low valuation position of big and mid cap stocks

8/6/2019 NCM Report May 2011- Proshare
http://slidepdf.com/reader/full/ncm-report-may-2011-proshare 12/81
The Monthly NCM Report for May 2011 www.proshareng.com Page12
Impressive corporate actions from key listed companiesSustained progress in recapitalisation by shareholders
Market Concerns: The investors’ confidence and commitment level seemed to beimproved, low risk appetite was observed in the month as cautious trading was seenthroughout the month. The low valuation of blue chips and drop in political tension
impacted the sustained value investing observed. More so, liquidity level is still lowwhich might not get better anytime soon as banks remained cautious with lending.
8/6/2019 NCM Report May 2011- Proshare
http://slidepdf.com/reader/full/ncm-report-may-2011-proshare 13/81
The Monthly NCM Report for May 2011 www.proshareng.com Page13
The NSE All-Share Index Movement
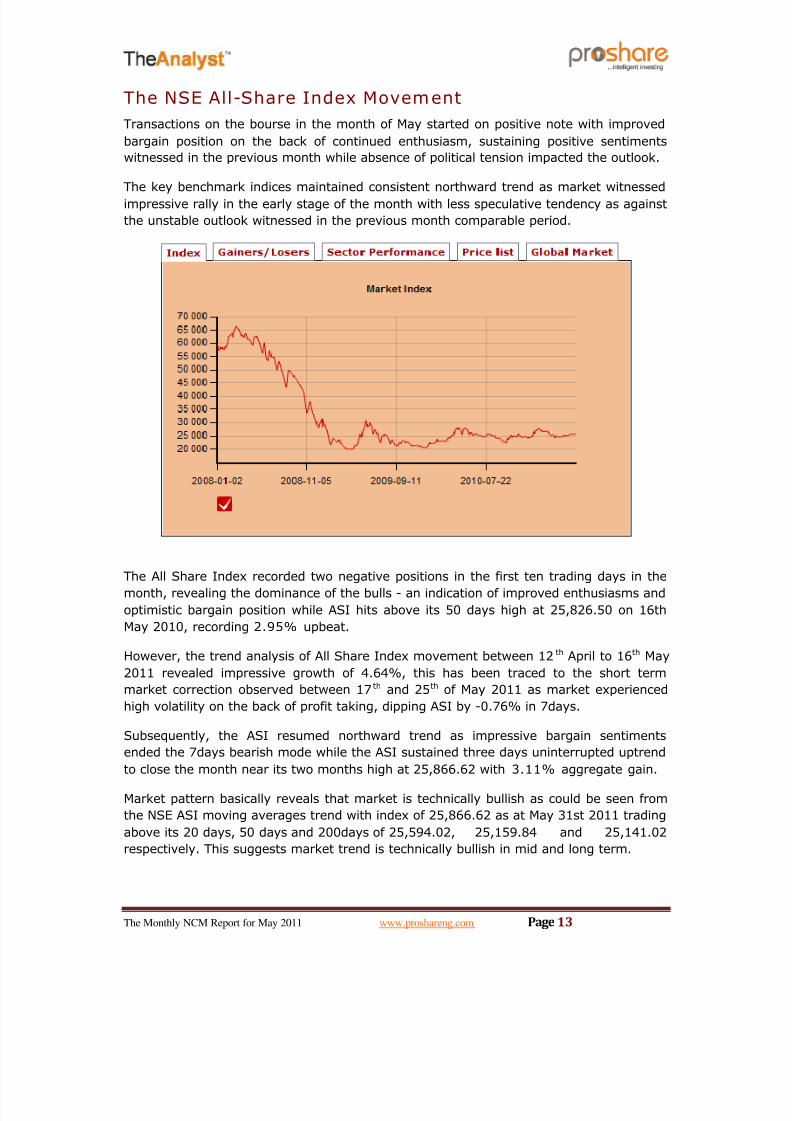
Transactions on the bourse in the month of May started on positive note with improved
bargain position on the back of continued enthusiasm, sustaining positive sentiments
witnessed in the previous month while absence of political tension impacted the outlook.
The key benchmark indices maintained consistent northward trend as market witnessed
impressive rally in the early stage of the month with less speculative tendency as against
the unstable outlook witnessed in the previous month comparable period.
The All Share Index recorded two negative positions in the first ten trading days in the
month, revealing the dominance of the bulls - an indication of improved enthusiasms and
optimistic bargain position while ASI hits above its 50 days high at 25,826.50 on 16th
May 2010, recording 2.95% upbeat.
However, the trend analysis of All Share Index movement between 12th April to 16th May
2011 revealed impressive growth of 4.64%, this has been traced to the short term
market correction observed between 17th and 25th of May 2011 as market experienced
high volatility on the back of profit taking, dipping ASI by -0.76% in 7days.
Subsequently, the ASI resumed northward trend as impressive bargain sentiments
ended the 7days bearish mode while the ASI sustained three days uninterrupted uptrend
to close the month near its two months high at 25,866.62 with 3.11% aggregate gain.
Market pattern basically reveals that market is technically bullish as could be seen from
the NSE ASI moving averages trend with index of 25,866.62 as at May 31st 2011 trading
above its 20 days, 50 days and 200days of 25,594.02, 25,159.84 and 25,141.02
respectively. This suggests market trend is technically bullish in mid and long term.

8/6/2019 NCM Report May 2011- Proshare
http://slidepdf.com/reader/full/ncm-report-may-2011-proshare 14/81
The Monthly NCM Report for May 2011 www.proshareng.com Page14
Source: NSE, Proshare Research
At the close of the last trading day of the month, All-Share Index traded above its 20
days, 50 days and 200days of 25,594.02, 25,159.84 and 25,141.02 respectively. This
suggests market trend is technically bullish in mid and long term
Source: NSE, Proshare Research
MAY 2011 MARKET DYNAMICS
The market dynamics as graphically illustrated below showed the appreciation anddepreciations on the daily basis.
Sustained positive sentiments, improved bargain enthusiasm, illiquidity, low risk
appetite, value investing, low institutional buying, drop in political tension and continued
cautious bargain approach from investors were responsible for the dynamics recorded.

8/6/2019 NCM Report May 2011- Proshare
http://slidepdf.com/reader/full/ncm-report-may-2011-proshare 15/81
The Monthly NCM Report for May 2011 www.proshareng.com Page15
Source: NSE, Proshare Research
MARKET DYNAMICS IN THE PRECEDING YEAR COMPARABLE PERIOD (MAY,
2010)
Source: NSE, Proshare Research
COMPARI SON OF 2010 AND 2011 MARKET PERFORMANCE
The market performance in May 2011, when compared with the 2010 comparable
period; showed an upward trend. In the period under review, ASI recorded 3.11%
appreciation compared with -2 . 44% depreciations recorded in May 2010. The scenario
revealed that the performance in the current year’s comparable period was relatively

8/6/2019 NCM Report May 2011- Proshare
http://slidepdf.com/reader/full/ncm-report-may-2011-proshare 16/81
The Monthly NCM Report for May 2011 www.proshareng.com Page16
above the previous year trend but the market closed at approximately in the range of
25,000.
Source: NSE, Proshare Research
Dates NSE ASIMarket
Capitalisation(trillion)
MarketCapitalisation($
billions)
Jan-04-1020,838.90
4.99 31.19
May-04-1026,873.03
6.49 40.56
May-28-1026,183.21
6.37 39.81
Yearly Return 25.65% 27.66% 27.66%
Monthly Return -2.57% -1.85% -1.85%
Jan-04-11 25,102.93 8.02 53.47
May-03-11 25,085.59 8.01 53.40
May-31-11 25,866.62 8.27 55.13
Yearly Return 3.04% 3.12% 3.12%
Monthly Return 3.11% 3.25% 3.25%
Source: NSE, Proshare Research
From the table above, the year to date performance as at 31 st May, 2011 closing at+3 .04% during the previous year comparable period as at 31st May, 2010 closed with25 . 65 % appreciation indicating a significant decline over the trend recorded last year.

8/6/2019 NCM Report May 2011- Proshare
http://slidepdf.com/reader/full/ncm-report-may-2011-proshare 17/81
The Monthly NCM Report for May 2011 www.proshareng.com Page17
SECTORAL INDEX MOVEMENTS
DatesNSE-30
%
Change
NSE-Food %
Change
NSE-Banking %
Change
NSE-Insurance
% Change
NSE- Oil & Gas %
Change
03/05/2011 0.23 0.199 0.82 0.59 -1.89804/05/2011 0.31 -0.775 1.63 -1.75 0.000
05/05/2011 0.94 1.445 0.90 -0.31 -0.372
06/05/2011 0.57 0.956 0.08 -0.69 0.000
09/05/2011 -0.09 0.400 -0.97 -0.20 -0.407
10/05/2011 0.89 -0.063 1.89 -0.48 0.246
11/05/2011 0.32 0.255 0.61 -0.24 0.568
12/05/2011 -0.10 1.131 -1.06 0.27 0.381
13/05/2011 0.54 0.841 0.26 0.80 0.021
16/05/2011 0.20 -0.642 -0.39 0.32 0.559
17/05/2011 -0.14 -0.558 0.46 -0.33 0.867
18/05/2011 -0.09 0.290 -1.23 0.80 -0.533
19/05/2011 -0.38 -0.432 -0.35 -0.25 0.000
20/05/2011 -0.21 -0.113 -0.87 0.01 0.268
23/05/2011 -0.41 0.215 -0.36 -1.44 0.132
24/05/2011 -0.03 -0.462 -0.29 -0.68 -1.362
25/05/2011 -0.52 -0.268 -1.41 0.67 0.508
26/05/2011 0.62 0.202 1.12 1.09 0.448
27/05/2011 1.07 0.683 0.34 -1.35 0.000
31/05/2011 0.33 0.099 0.12 -1.13 0.780
Monthly
Return4.05 3.40 1.30 -4.29 0.21
Source: NSE, Proshare Research

8/6/2019 NCM Report May 2011- Proshare
http://slidepdf.com/reader/full/ncm-report-may-2011-proshare 18/81
The Monthly NCM Report for May 2011 www.proshareng.com Page18
In the month under review, four sectoral index closed positive with NSE 30 leading
gainers’ chart by +3.87%, followed by NSE Food & Beverages by +3.22% and NSE Oil &
Gas by 2.10%, NSE Banking by 0.40% while NSE Insurance dropped -4.82%.
APRIL AND MAY SECTORAL INDEXES COMPARED
Source: NSE, Proshare Research
When compared sectoral performance in the current month of May with April 2011, the
outlook recorded in May is quite impressive with four positive positions as against three
positive positions recorded in the previous month.

8/6/2019 NCM Report May 2011- Proshare
http://slidepdf.com/reader/full/ncm-report-may-2011-proshare 19/81
The Monthly NCM Report for May 2011 www.proshareng.com Page19
NSE -30 INDEX
Source: NSE, Proshare Research
The trend recorded in the blue chip stocks is reflected in the NSE 30 index movement.
The outlook suggested less speculative trading towards the blue chip stocks while the
index experienced steady uptrend movement with less fluctuation in the month of May.
This is attributable to the value investing approach employed by investors on the back of
cautious treading.
The blue chips recorded significant steady rally in the early part of the month but laterexperienced slight profit taking. Consequently, the index closed positive with improved
points of 3.87% due to significant buying activities as against 3.68% recorded in the
previous month.
NSE -FOOD INDEX

8/6/2019 NCM Report May 2011- Proshare
http://slidepdf.com/reader/full/ncm-report-may-2011-proshare 20/81
The Monthly NCM Report for May 2011 www.proshareng.com Page20
Source: NSE, Proshare Research
The value investing witnessed during the period under review impacted the impressive
outlook recorded in the sector. More so, the sector experienced active bargain, though
high turbulence was observed as against low fluctuation witnessed in the previous
month.
However, the sector ranked second best with 3.22% gain as against the leading of
+3.89% upbeat recorded in the previous month. A lower performance when compared
with previous position.
NSE -BANKING INDEX
Source: NSE, Proshare Research

8/6/2019 NCM Report May 2011- Proshare
http://slidepdf.com/reader/full/ncm-report-may-2011-proshare 21/81
The Monthly NCM Report for May 2011 www.proshareng.com Page21
The banking sector witnessed extensive sell activities inherited from the previous month,
this bearish sentiments witnessed towards the rescued banks contributed to this outlook.
However, the sector recorded marginal growth as the NSE-Banking index retraced by
0.44% against -0.90% decline recorded in the previous month.
The mixed outlook of recapitalisation process of rescued banks could be a contributory
factor while the unsettled and inconclusive mergers & acquisitions in the sector impacted
the negative performance considerably.
NSE -INSURANCE INDEX
Source: NSE, Proshare Research
The unrelenting cautious trading and value investing tendency witnessed in the market
during the period under review contributed to the negative trend observed in the
insurance sector. This reveals a significant drop in risk appetite of the investors.
Consequently, the insurance sector witnessed huge selling activities, though profit taking
contributed to the downtrend in the sector due to the sizeable price appreciation
recorded in the previous month. As a result, the sector recorded the worst performance,
dipping by -4.82% as against +2.11% gain recorded in the previous month while the
outlook recorded does not align with our expectation as envisaged in our previous NCM
report.
Nevertheless, we envisage the trend is likely to retrace as the depressed outlook in the
sector suggests bargain opportunities for traders.
8/6/2019 NCM Report May 2011- Proshare
http://slidepdf.com/reader/full/ncm-report-may-2011-proshare 22/81
The Monthly NCM Report for May 2011 www.proshareng.com Page22
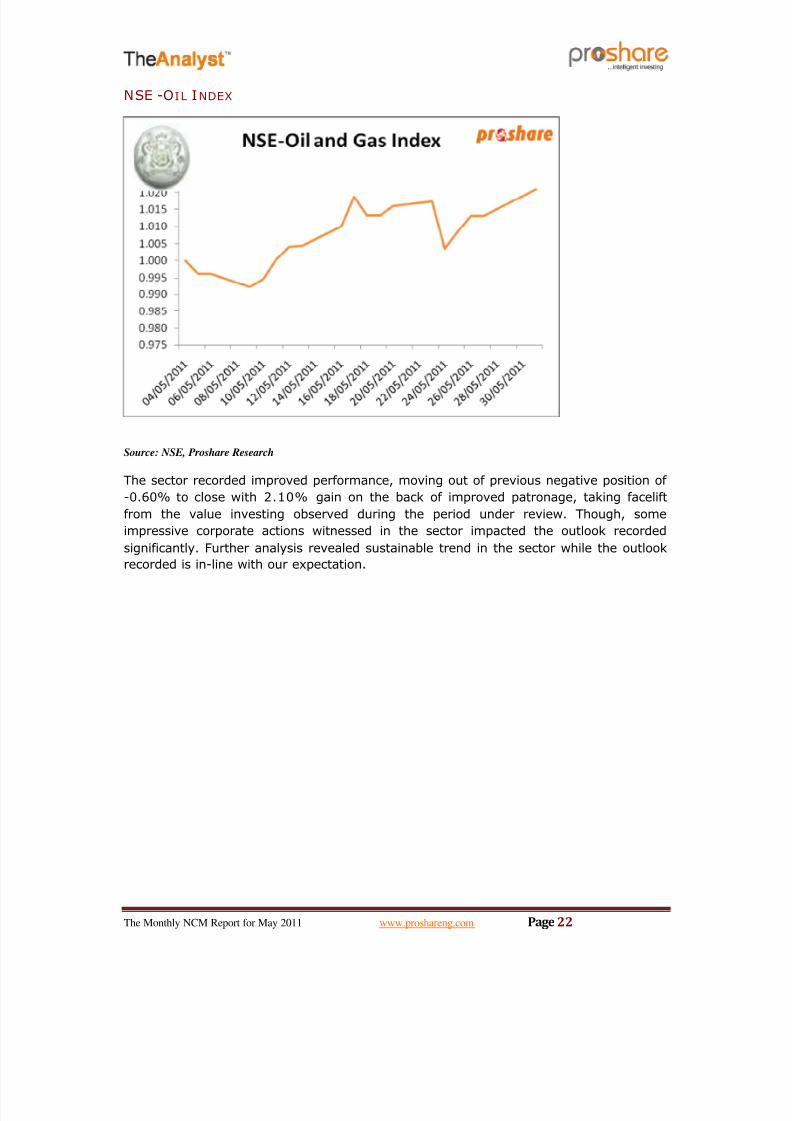
NSE -OIL INDEX
Source: NSE, Proshare Research
The sector recorded improved performance, moving out of previous negative position of
-0.60% to close with 2.10% gain on the back of improved patronage, taking facelift
from the value investing observed during the period under review. Though, some
impressive corporate actions witnessed in the sector impacted the outlook recorded
significantly. Further analysis revealed sustainable trend in the sector while the outlook
recorded is in-line with our expectation.

8/6/2019 NCM Report May 2011- Proshare
http://slidepdf.com/reader/full/ncm-report-may-2011-proshare 23/81
The Monthly NCM Report for May 2011 www.proshareng.com Page23
Transactions Volume and Value Trend
Market May '10' May '11'%
Change
Average Daily Volume of stocks Traded( in millions) 458.19 328.29 -28.35%
Average Daily Value of stocks Traded( in N'millions) 4,228.47 2,440.43 -42.29%
-38.44%Average Daily Value of stocks Traded( in US $millions) 26.43 16.27
Total Volume of stocks Traded (in millions) 8247.57 6585.72 -20.15%
Total Value of stocks Traded (in N'millions) 76,112.51 48,808.57 -35.87%
Total Value of stocks Traded (in $ billion) 475.70 325.39 -31.60%
New Listing and Delisting May '10' May '11'
Number of Equities Delisted 0
Number of New Listings 0
Source: NSE, Proshare Research
The transaction volume in May when compared with the preceding year comparable
period closed lower by -20.15% to close at 6.58 billion units compared with 8.24
billion units traded in May 2010. This could be an indication that the investors’ patronage of the market in the month under review was significantly different.
Also, the transaction value in the month under review closed lower by -35.87% at N48.
80 billion ($325.39 million) compared with N76.11 billion ($475.70 million) of
May 2010.
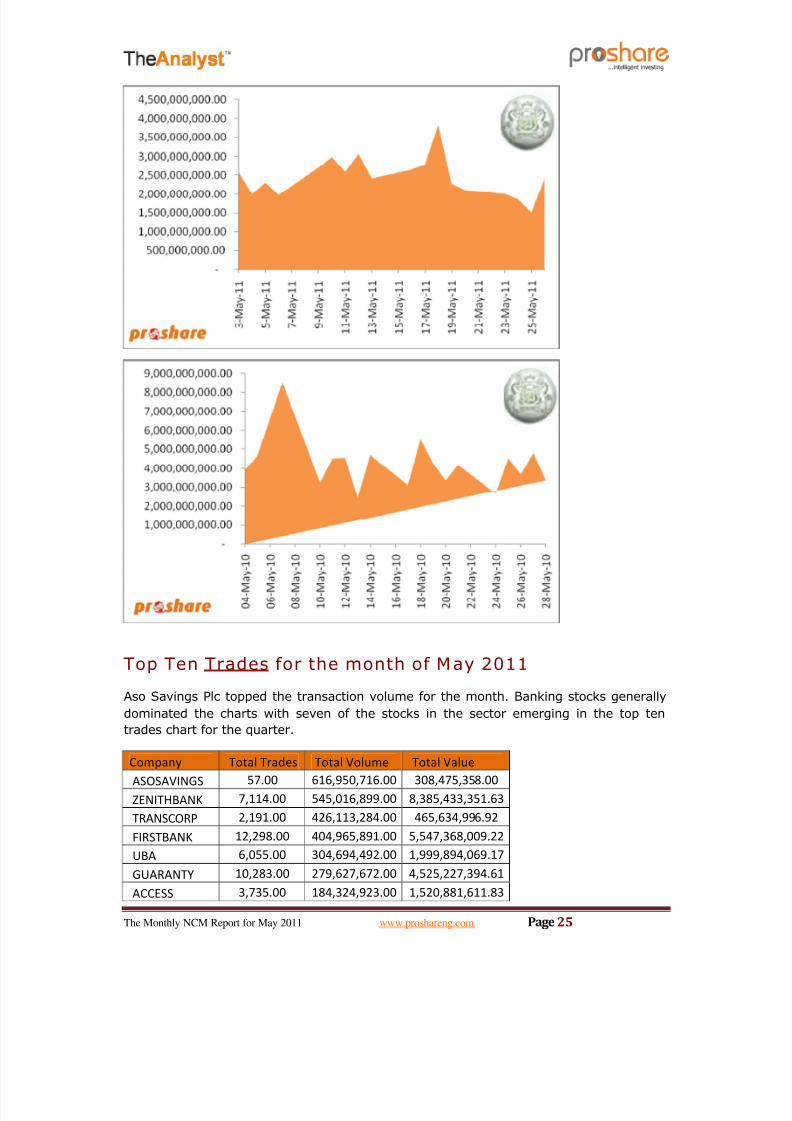
May 2011 vs. 2010 Daily Volume Chart

8/6/2019 NCM Report May 2011- Proshare
http://slidepdf.com/reader/full/ncm-report-may-2011-proshare 24/81
The Monthly NCM Report for May 2011 www.proshareng.com Page24
Source: NSE, Proshare Research
8/6/2019 NCM Report May 2011- Proshare
http://slidepdf.com/reader/full/ncm-report-may-2011-proshare 25/81
The Monthly NCM Report for May 2011 www.proshareng.com Page25
Top Ten Trades for the month of May 2011
Aso Savings Plc topped the transaction volume for the month. Banking stocks generally
dominated the charts with seven of the stocks in the sector emerging in the top ten
trades chart for the quarter.
Company Total Trades Total Volume Total Value
ASOSAVINGS 57.00 616,950,716.00 308,475,358.00ZENITHBANK 7,114.00 545,016,899.00 8,385,433,351.63
TRANSCORP 2,191.00 426,113,284.00 465,634,996.92
FIRSTBANK 12,298.00 404,965,891.00 5,547,368,009.22
UBA 6,055.00 304,694,492.00 1,999,894,069.17
GUARANTY 10,283.00 279,627,672.00 4,525,227,394.61
ACCESS 3,735.00 184,324,923.00 1,520,881,611.83

8/6/2019 NCM Report May 2011- Proshare
http://slidepdf.com/reader/full/ncm-report-may-2011-proshare 26/81
The Monthly NCM Report for May 2011 www.proshareng.com Page26
FIRSTINLND 1,834.00 176,779,853.00 130,536,869.70
DIAMONDBNK 1,678.00 176,568,049.00 1,243,692,016.12
TOURIST 3.00 168,147,728.00 761,743,095.25
Recall Top Ten Trades for the month of May 2010
CompanyTotal
TradesTotal Volume Total Value
UBA 5358 469,753,677.00 6,013,219,257.08
FIDELITYBK 2934 442,863,022.00 1,280,267,633.91
FIRSTBANK 15034 421,278,493.00 6,316,284,872.78
ZENITHBANK 7751 419,228,067.00 6,192,635,654.97
SKYEBANK 3504 398,694,812.00 3,374,639,323.05
GUARANTY 9346 360,879,172.00 6,245,833,158.40
GTASSURE 907 355,123,657.00 918,478,794.13
ACCESS 3933 235,373,484.00 2,180,073,454.39
CAPHOTEL 56 201,473,445.00 727,059,718.63DIAMONDBNK 1690 185,139,874.00 1,513,703,192.30
Top Ten Traded Sectors for the Month o f May
Sector Total Trades Total Volume Total Value % Contribution
BANKING 61,011.00 3,295,520,989.00 27,721,919,586.72 50.04%
MORTGAGE COMPANIES 654.00 711,501,631.00 366,403,900.99 10.80%
INSURANCE 4,011.00 527,769,825.00 396,975,770.80 8.01%
CONGLOMERATES 5,781.00 484,382,276.00 2,359,689,200.16 7.36%
INFORMATION &COMMUNICATION TECHNOLOGY
668.00 209,583,684.00 133,789,807.25 3.18%
HOTEL & TOURISM 302.00 179,343,535.00 778,651,659.40 2.72%
FOOD/BEVERAGES & TOBACCO 10,213.00 171,985,041.00 4,380,899,051.36 2.61%
THE FOREIGN LISTINGS 595.00 139,422,308.00 2,149,537,535.65 2.12%
BREWERIES 4,560.00 131,441,055.00 3,701,274,456.33 2.00%
PETROLEUM(MARKETING) 6,130.00 112,530,171.00 2,766,232,836.70 1.71%
Top 10 Traded Sectors 93,925.00 5,963,480,515.00 44,755,373,805.36
Total Traded Sectors 110,447.00 6,585,723,642.00 48,808,572,272.20
Recall Top Ten Traded Sectors for the month of May 2010
Sector
Total
Trades Total Volume Total Value
%
Contribution
BANKING 66186 3,877,294,313.00 36,284,551,830.73 47.03%
INSURANCE 8978 1,601,882,144.00 2,001,088,129.51 19.43%
FOOD/BEVERAGES & TOBACCO 17533 389,760,448.00 8,334,730,930.11 4.73%

8/6/2019 NCM Report May 2011- Proshare
http://slidepdf.com/reader/full/ncm-report-may-2011-proshare 27/81
The Monthly NCM Report for May 2011 www.proshareng.com Page27
MORTGAGE COMPANIES 1440 317,770,923.00 176,615,132.35 3.85%
INFORMATION &
COMMUNICATION
TECHNOLOGY
1496 260,566,945.00 489,910,438.24 3.16%
HOTEL & TOURISM 568 247,483,305.00 830,201,288.86 3.00%
MARITIME 3533 176,266,173.00 332,682,247.19 2.14%
HEALTHCARE 2648 164,232,397.00 617,067,774.02 1.99%
CONGLOMERATES 5035 131,242,564.00 3,407,920,490.78 1.59%
BREWERIES 5160 125,177,704.00 7,629,508,152.70 1.52%
Total 180388 8,244,365,064.00 76,090,630,415.75
Source: NSE, Proshare Research
Top Ten Gainers in the month
COMPANY
3-May-
11
31-May-
11 Change
%
ChangeNEIMETH 1.47 1.87 0.4 27.21%
GUINNESS 205 251 46 22.44%
CONOIL 34.3 41.89 7.59 22.13%
JBERGER 48 58.49 10.49 21.85%
ABCTRANS 0.58 0.7 0.12 20.69%
NASCON 5.31 6.4 1.09 20.53%
NIWICABLE 0.5 0.6 0.1 20.00%
Presco 6.7 7.99 1.29 19.25%
ETERNAOIL 4.68 5.55 0.87 18.59%
PZ 30.5 36 5.5 18.03%
Source: NSE, Proshare Research
Top Ten Gainers in the month May 2010
COMPANY
04-May-
10
28-May-
10 Change
%
Change
GLAXOSMITH 21.89 27.55 5.66 25.86%
CADBURY 24.79 30.8 6.01 24.24%
TOTAL 195 242 47 24.10%
IBTC9.43 10.85 1.42 15.06%
INTBREW 5.4 6.06 0.66 12.22%
NESTLE 314 350 36 11.46%CHEVRON 69.79 76.93 7.14 10.23%
JAPAULOIL 1.62 1.78 0.16 9.88%LIVESTOCK 0.86 0.94 0.08 9.30%CUSTODYINS 3.55 3.86 0.31 8.73%

8/6/2019 NCM Report May 2011- Proshare
http://slidepdf.com/reader/full/ncm-report-may-2011-proshare 28/81
The Monthly NCM Report for May 2011 www.proshareng.com Page28
Source: NSE, Proshare Research
Top Ten Decliners in the month
COMPANY
3-May-
11
31-May-
11 Change
%
Change
DNMEYER 2.25 1.52 -0.73 -32.44%
STARCOMMS 0.83 0.58 -0.25 -30.12%
TRANSCORP 1.24 0.97 -0.27 -21.77%
JAPAULOIL 1.6 1.26 -0.34 -21.25%
FIDSON 2.29 1.95 -0.34 -14.85%
PAINTCOM 2.32 2 -0.32 -13.79%
DIAMONDBNK 6.72 5.88 -0.84 -12.50%WEMABANK 1.23 1.08 -0.15 -12.20%STERLNBANK 2.36 2.08 -0.28 -11.86%
COSTAIN5.34 4.72 -0.62 -11.61%
Top Ten Decliners in the month of May 2010
COMPANY
04-May-
10
28-May-
10 Change
%
Change
DAARCOMM 1.09 0.7 -0.39 -35.78%BECOPETRO 1.63 1.1 -0.53 -32.52%WAPIC 0.97 0.66 -0.31 -31.96%
OANDO 120 83.02 -36.98 -30.82%MAYBAKER 7.98 6.01 -1.97 -24.69%
TANTALIZER 1.18 0.89 -0.29 -24.58%
UACN 52.82 42.02 -10.8 -20.45%
ABCTRANS 1.1 0.88 -0.22 -20.00%
Presco 7.79 6.31 -1.48 -19.00%
CHELLARAM 11.53 9.41 -2.12 -18.39%
Supplementary Listing in the month:
There were two supplementary listings in quarter one. A total of 452,542,314 shares
were added to the shares outstanding in the name of Oando Plc during the month of May 2011 following the bonus of 1 for 4.
Also, total of 2,327,485,380 of shares were added to the shares outstanding in the nameof Great Nigeria Insurance Plc in the same May 2011 following the conclusion of placing.
Supplementary Listing in May 2011

8/6/2019 NCM Report May 2011- Proshare
http://slidepdf.com/reader/full/ncm-report-may-2011-proshare 29/81
The Monthly NCM Report for May 2011 www.proshareng.com Page29
Company
Additional
Shares Reason
Oando Plc 452,542,314 Bonus of I for 4
Great Nigeria Insurance Plc 2,327,485,380 Conclusion of Placing
Source: NSE, Proshare Research

8/6/2019 NCM Report May 2011- Proshare
http://slidepdf.com/reader/full/ncm-report-may-2011-proshare 30/81
The Monthly NCM Report for May 2011 www.proshareng.com Page30
Corporate Declarations in the month
3rd May, 2011: Wema Bank Plc 3rd May, 2011: UAC NIGERIA PLC
AUDITED REPORT FOR THE PERIOD ENDED 31-DEC-10
FIRST QUARTER REPORT FOR THE PERIOD ENDED 31-MAR-
11
2010N'm
2009N'm
% Change
2011N'm 2010 N'm %Change
Gross Earning 21,796 18,994 14.75% Gross Earnings 12,533 10,912 14.86%
Profit/Loss Before Tax 13,141 (8,868) 248.18%Profit Before Tax &
Minority Interest 1,182 1,024 15.43%
Taxation 4,313 1,337 222.59% Taxation (351.288) (299.952) -17.11%
Profit/Loss After Tax 17,455 (7,530) 331.81% Minority Interest (367.397) (302.797) -21.33%
Balance Sheet Information Profit/Loss After Tax 464.296 422.088 10.00%
Fixed Assets 13,922 14,285 -2.54% Balance Sheet Information
Treasury bills 8,176 5,049 61.93% Fixed Assets 29,169 30,355 -3.91%
Loans and Advances 42,793 30,001 42.64% Stock 9,325 8,440 10.49%
Cash and Bank Balances 6,567 6,354 3.35% Trade Debtors 2,702 5,373 -49.71%
Other Debit Balances 110,328 95,246 15.83%Cash and BankBalances 7,096 7,246 -2.07%
Deposits 145,524 95,246 52.79% Other Debit Balances 55,697 50,957 9.30%
Other Credit Balances 80,331 102,715 -21.79% Trade creditors 4,822 7,707 -37.43%
Net Assets 15,769(45,837
) 134.40%Short TermBorrowings 9,834 7,081 38.88%
http://www.proshareng.com/investors/company.php?ref=WEMABANK Other Credit Balances 45,997 41,995 9.53%

8/6/2019 NCM Report May 2011- Proshare
http://slidepdf.com/reader/full/ncm-report-may-2011-proshare 31/81
The Monthly NCM Report for May 2011 www.proshareng.com Page31
Working Capital 14,493 16,486 -12.09%
Net Assets 43,337 45,587 -4.94%
http://www.proshareng.com/investors/company.php?ref=UACN
3rd May, 2011: NIGERIAN BOTTLING COMPANY PLC 3rd May, 2011: PRESCO PLC
FIRST QUARTER REPORT FOR THE PERIOD ENDED 31-MAR-11FIRST QUARTER REPORT FOR THE PERIOD ENDED 31-MAR-
11
2011N'm
2010N'm %Change
2011N'm 2010 N'm %Change
Gross Earnings 29,140 26,780 8.81% Gross Earning 1,500 1,100 36.36%
Profit Before Tax 434 332 30.72% Profit Before Tax 693 457.000 51.64%
Taxation(103.00
) (91.00) -13.19% Taxation (153.700) (148.500) -209.41%
Profit/Loss After Tax 331 241 37.34% Profit/Loss After Tax 539.600 309.100 74.57%
Balance Sheet Information Balance Sheet Information
Fixed Assets 46,690 46,350 0.73% Fixed Assets 6,090 5,914 2.98%
Stocks 22,530 22,420 0.49% Stock 970.000 828.482 17.08%
Trade Debtors 405.00 366.00 10.66% Trade Debtors 362.000 172.384 110.00%
Cash and Bank Balances 862.000 1,070 -19.44%Cash and BankBalances 472.000 161.524 192.22%
Other Debit Balances 10,540 9,200 14.57% Other Debit Balances 189.000 304.333 -37.90%
Trade Creditors 12,780 5,400 136.67% Trade Creditors 79.000 136.977 -42.33%
Short Term Borrowings 9,200 4,300 113.95%
Short Term
Borrowings 30.000 Nil 0.00%
Other Credit Balances 28,520 38,637 -26.18% Other Credit Balances 4,100 3,725 10.07%

8/6/2019 NCM Report May 2011- Proshare
http://slidepdf.com/reader/full/ncm-report-may-2011-proshare 32/81
The Monthly NCM Report for May 2011 www.proshareng.com Page32
Working Capital
(13,600
)
(13,740
) 1.02% Working Capital 1,200 932.588 28.67%
Net Assets 30,500 30,800 -0.97% Net Assets 4,050 3,518 15.12%
http://www.proshareng.com/investors/company.php?ref=NBC http://www.proshareng.com/investors/company.php?ref=PR
ESCO
3rd May, 2011: FIDELITY BANK PLC 3rd May, 2011: NESTLE NIGERIA P LC
FIRST QUARTER REPORT FOR THE PERIOD ENDED 31-MAR-11FIRST QUARTER REPORT FOR THE PERIOD ENDED 31-MAR-
11
2011
N'm
2010
N'm %Change
2011
N'm 2010 N'm %Change
Gross Earnings 5,351 14,167 -62.23% Gross Earnings 20,501 16,968 20.82%
Profit Before Tax 1,760 1,886 -6.68% Profit Before Tax 3,100 4,176 -25.77%
Taxation (341) (382) 10.73% Taxation (883.675) (1,413) -37.46%
Profit/Loss After Tax 1,418 1,505 -5.78% Profit/Loss After Tax 2,216 2,763 -19.80%
Balance Sheet Information Balance Sheet Information
Fixed Assets 25,446 25,469 -0.09% Fixed Assets 43,742 40,241 8.70%
Treasury Bills 82,491 64,223 28.44% Stock 9,328 8,494 9.82%
Loans & Advances 166,714 159,560 4.48% Trade Debtors 4,334 4,970 -12.80%
Cash and Bank Balances 23,735 25,505 -6.94% Cash and Bank Balances 1,276 3,092 -58.73%
Other Debit Balances 177,566 206,857 -14.16% Other Debit Balances 3,237 3,548 -8.77%
Deposits 313,245 326,741 -4.13% Trade creditors 2,780 4,085 -31.95%
Other Credit Balances 25,062 18,696 34.05%Short TermBorrowing 3,619 3,398 6.50%

8/6/2019 NCM Report May 2011- Proshare
http://slidepdf.com/reader/full/ncm-report-may-2011-proshare 33/81
The Monthly NCM Report for May 2011 www.proshareng.com Page33
Net Assets 475,972 481,614 -1.17% Other Credit Balances 38,438 37,997 1.16%
http://www.proshareng.com/investors/company.php?ref=FIDEKITYBK Working Capital (66.290) 650.024 -110.20%
Net Assets 17,082 14,865 14.91%
http://www.proshareng.com/investors/company.php?ref=NESTLE
3rd May, 2011: BETA GLASS PLC 3rd May, 2011: Chemical & Allied Products Plc
FIRST QUARTER REPORT FOR THE PERIOD ENDED 31-MAR-11FIRST QUARTER REPORT FOR THE PERIOD ENDED 31-MAR-
11
2011
N'm
2010
N'm %Change
2011
N'm 2010 N'm %Change
Gross Earnings 3,330 1,681 98.10% Gross Earnings 1,033 838 23.24%
Profit Before Tax 488.813 161.183 203.27% Profit Before Tax 296.659 220.017 34.83%
Taxation(105.50
8)(39.403
) 167.77% Taxation (94.931) (70.405) -34.84%
Profit/Loss After Tax 383.305 121.780 214.75% Profit/Loss After Tax 201.728 149.611 34.84%
Balance Sheet Information Balance Sheet Information
Fixed Assets 8,410 8,751 -3.90% Fixed Assets 254.624 247.875 2.72%
Stocks 2,676 2,378 12.53% Stock 309.415 307.498 0.62%
Trade Debtors 2,824 2,011 40.43% Trade Debtors 214.886 295.236 -27.22%
Cash and Bank Balances 197.370 438.543 -54.99%Cash and BankBalances 1,741 1,401 24.27%
Other Debit Balances 2,051 2,378 -13.75% Other Debit Balances 117.736 117.736 0.00%
Trade Creditors 867.247 662.088 30.99% Trade creditors 1,079 740.377 45.74%
Short Term Borrowings 24.578 99.19 -75.22%Short TermBorrowings Nil Nil 0.00%

8/6/2019 NCM Report May 2011- Proshare
http://slidepdf.com/reader/full/ncm-report-may-2011-proshare 34/81
The Monthly NCM Report for May 2011 www.proshareng.com Page34
Other Credit Balances 5,067 4,547 11.44% Other Credit Balances 242.084 609 -60.22%
Working Capital 4,736 3,998 18.46% Working Capital Nil Nil 0.00%
Net Assets 10,200 9,816 3.91% Net Assets 1,316 1,021 28.89%
http://www.proshareng.com/investors/company.php?ref=BETAGLAS http://www.proshareng.com/investors/company.php?ref=CAP
4th May, 2011: LAW UNION AND ROCK INSURAN CE PLC 4th May, 2011: CUSTODIAN & ALLI ED INSURANCE PLC
FIRST QUARTER REPORT FOR THE PERIOD ENDED 31-MAR-11FIRST QUARTER REPORT FOR THE PERIOD ENDED 31-MAR-
11
2011
N'm
2010
N'm %Change
2011
N'm 2010 N'm %Change
Gross Earnings 1,642 1,239 32.53% Gross Earnings 3,068 2,248 36.48%
Profit before tax 163.923 145.843 12.40% Profit before tax 804.870 701 14.78%
Taxation(24.588)
(21.876) 12.40% Taxation (104.633) (91.163) -14.78%
Profit/Loss After Tax 139.334 123.966 12.40% Profit/Loss After Tax 700.237 610.093 14.78%
Balance Sheet Information Balance Sheet Information
Fixed Assets 805.619 859.995 -6.32% Fixed Assets 510.747 526.211 -2.94%
Stocks 1,273 1,348 -5.56% Stock 7,794 9,154 -14.86%
Trade Debtors 2,170 1,738 24.86% Trade Debtors 837.504 251.664 232.79%
Cash and Bank Balances 209.84 111.762 87.75% Cash and Balances 844.132 351.677 140.03%
Other Debit Balances4,869.00 3,308 47.19% Other Debit Balances 8,261 5,720 44.42%
Short Term Borrowings Nil 88.476 0.00% Insurance Funds 4,068 2,775 46.59%

8/6/2019 NCM Report May 2011- Proshare
http://slidepdf.com/reader/full/ncm-report-may-2011-proshare 35/81
The Monthly NCM Report for May 2011 www.proshareng.com Page35
Insurance Funds 837.645 648.999 29.07% Other Credit Balances 1,449 1,198 20.95%
Other Credit Balances 2,206 1,864 18.35% Net Assets 12,729 120,029 -89.40%
Net Assets 5,011 4,765 5.16%http://www.proshareng.com/investors/company.php?ref=CUSTODYIN
S
http://www.proshareng.com/investors/company.php?ref=LAWUNION
4th May, 2011: UACN PROPERTY DEV. COMPANY PLC 4th May, 2011: OKOMU OIL PALM PLC
FIRST QUARTER REPORT FOR THE PERIOD ENDED 31-MAR-11FIRST QUARTER REPORT FOR THE PERIOD ENDED 31-MAR-
11
2011
N'm
2010
N'm %Change
2011
N'm 2010 N'm %Change
Gross Earnings 1,700 1,153 47.44% Gross Earnings 2,947 6,087 -51.59%
Profit Before Tax 391.184 305.686 27.97% Profit Before Tax 1,910 1,971 -3.09%
Taxation(125.179)
(102.108) -22.59% Taxation (99.174) (341.806) 70.99%
Profit/Loss After Tax 266.005 203.579 30.66% Profit/Loss After Tax 1,810 1,629 11.11%
Balance Sheet Information Balance Sheet Information
Fixed Assets 16,869 16,852 0.10% Fixed Assets 6,574 6,415 2.48%
Stock 367.081 366.224 0.23% Stock 1,063 998.123 6.50%
Trade Debtors 325.308 2,914 -88.84% Trade Debtors 191.833 197.197 -2.72%
Cash and Bank Balances 1,336 1,792 -25.45%Cash and BankBalances 1,955 544.891 258.79%
Other Debit Balances 49,000 47,605 2.93% Other Debit Balances 189.480 512.495 -63.03%
Trade creditors 1,696 5,429 -68.76% Trade Creditors 9.203 214.903 -95.72%
Short Term Borrowings (6,446) (6,036) -6.79% Other Credit Balances 2,287 2,586 -11.56%

8/6/2019 NCM Report May 2011- Proshare
http://slidepdf.com/reader/full/ncm-report-may-2011-proshare 36/81
The Monthly NCM Report for May 2011 www.proshareng.com Page36
Other Credit Balances
(30,536
)
(28,176
) -8.38% Working Capital 2,149 1,421 51.23%
Working Capital(11,645) (9,435) -23.42% Net Assets 7,677 5,866 30.87%
Net Assets 29,218 29,889 -2.24% http://www.proshareng.com/investors/company.php?ref=OKOMUOIL
http://www.proshareng.com/investors/company.php?ref=UAC-PROP
4th May, 2011: VITAFOAM NIGERIA P LC 4th May, 2011: AG LEVENTIS PLC
FIRST QUARTER REPORT FOR THE PERIOD ENDED 31-MAR-11
FIRST QUARTER REPORT FOR THE PERIOD ENDED 31-MAR-
112011
N'm
2010
N'm %Change
2011
N'm 2010 N'm %Change
Gross Earnings 6,802 5,227 30.13% Turnover 4,284 3,247 31.9%
Profit Before Tax 684.256 612.020 11.80% Profit Before Tax 241.888 120 102.2%
Taxation(218.96
2)(195.84
6) -11.80% Taxation (120.429) (38.285) -214.6%
Profit/Loss After Tax 465.294 416.174 11.80% Profit/Loss After Tax 121.459 81.357 49.3%Balance Sheet Information Balance Sheet Information
Fixed Assets 1,706 1,686 1.19% Fixed Assets 9,366 9,717 -3.6%
Stocks 2,274 2,145 6.01% Stocks 4,033 4,786 -15.7%
Trade Debtors 627.198 745.838 -15.91% Trade Debtors 1,068 712.402 49.9%
Cash and Bank Balances 311.986 431.705 -27.73%Cash and BankBalances 669.469 1,227 -45.4%
Other Debit Balances 2,940 1,117 163.21% Other Debit Balances 4,190 3,112 34.6%
Trade Creditors 2,188 798.580 173.99% Trade Creditors 1,651 3,153 -47.6%

8/6/2019 NCM Report May 2011- Proshare
http://slidepdf.com/reader/full/ncm-report-may-2011-proshare 37/81
The Monthly NCM Report for May 2011 www.proshareng.com Page37
Short Term Borrowings 1,195 1,162 2.84%Short TermBorrowings 955.244 895.308 6.7%
Other Credit Balances 1,757 1,666 5.46% Other Credit Balances 6,178 4,988 23.9%
Net Assets 2,719 2,499 8.80% Working Capital 1,487 1,406 5.8%
http://www.proshareng.com/investors/company.php?ref=VITAFOAM Net Assets 10,543 10,518 0.2%
http://www.proshareng.com/investors/company.php?ref=AGLEVENT
4th May, 2011: BOC GASES PLC 4th May, 2011: CONTINENTAL REINSURANCE PLC
FIRST QUARTER REPORT FOR THE PERIOD ENDED 31-MAR-11FIRST QUARTER REPORT FOR THE PERIOD ENDED 31-MAR-
11
2011N'm
2010N'm %Change
2011N'm 2010 N'm %Change
Gross Earnings 609.024 555.686 9.60% Gross Premium 2,086 1,573 32.61%
Profit Before Tax 143.971 112.468 28.01% Profit Before Tax 420.249 481.698 -12.76%
Taxation(48.430
)(43.908
) -10.30% Taxation (84.05) (96.340) 12.76%
Profit/Loss After Tax 95.541 77.560 23.18% Profit/Loss After Tax 336.199 385.358 -12.76%
Balance Sheet Information Balance Sheet Information
Fixed Assets 1,146 1,026 11.70% Fixed Assets 144.047 115.926 24.26%
Stocks 394.889 363.045 8.77% Stocks 5,577 6,006 -7.14%
Trade Debtors 258.114 280.936 -8.12% Trade Debtors 4,915 4,090 20.17%
Cash and Bank Balances 406.435 301.587 34.77%Cash and BankBalances 583.561 221.119 163.91%
Other Debit Balances 193.754 146.694 32.08% Other Debit Balances 8,505 8,357 1.77%

8/6/2019 NCM Report May 2011- Proshare
http://slidepdf.com/reader/full/ncm-report-may-2011-proshare 38/81
The Monthly NCM Report for May 2011 www.proshareng.com Page38
Trade Creditors 72.649 86.223 -15.74% Insurance Funds 3,816 3,533 8.01%
Other Credit Balances 1,104 892.175 23.74% Other Credit Balances 3,747 3,638 3.00%
Net Assets 1,222 1,140 7.19% Net Assets 12,162 11,619 4.67%
http://www.proshareng.com/investors/company.php?ref=BOCGAS http://www.proshareng.com/investors/company.php?ref=CO
NTINSURE
4th May, 2011: DANGOTE CEMENT PLC 4th May, 2011: Nigerian Breweries Plc
FIRST QUARTER REPORT FOR THE PERIOD ENDED 31-MAR-11FIRST QUARTER REPORT FOR THE PERIOD ENDED 31-MAR-
11
2011N'm
2010N'm %Change
2011N'm 2010 N'm %Change
Turnover 54,507 49,872 9.3% Gross Earning 52,029 40,574 28.23%
Cost of Sales(25,681
)(23,140
) -22.8% Profit Before Tax 11,856 9,426 25.78%
Profit Before Tax 27,899 25,286 10.3% Taxation (3,936) (2,969) -32.57%
Taxation
(433.62
0)
(569.00
0) 23.8% Profit/Loss After Tax 7,919 6,456 22.66%
Profit/Loss After Tax 27,466 24,717 11.1% Balance Sheet Information
Balance Sheet Information Fixed Assets 72,806 73,800 -1.35%
Fixed Assets 285,139 285,442 -0.11% Stocks 27,471 21,231 29.39%
Investments 50,000 50,000 0.00% Trade debtors 4,563 3,491 30.71%
Stocks 20,288 14,865 36.48%Cash and BankBalances 13,214 12,607 4.81%
Trade Debtors 2,949 11,378 -74.08% Other Debit Balances 3,133 3,259 -3.87%
Cash and Bank Balances 80.92% Trade Creditors -16.48%

8/6/2019 NCM Report May 2011- Proshare
http://slidepdf.com/reader/full/ncm-report-may-2011-proshare 39/81
The Monthly NCM Report for May 2011 www.proshareng.com Page39
38,492 21,276 17,909 21,444
Other Debit Balances 74,670 69,077 8.10% Short TermBorrowing Nil 95.308 0.00%
Trade Creditors 3,526 5,163 -31.71% Other Credit Balances 54,602 42,677 27.94%
Short Term Borrowings 26,000 37,637 -30.92% Working Capital -5,092 -4,595 10.82%
Other Credit Balances 153,037 147,730 3.59% Net Assets 48,676 50,172 -2.98%
Working Capital 57,286 26,736 114.27% http://www.proshareng.com/investors/company.php?ref=NB
Net Assets 238,975 211,509 12.99%
http://www.proshareng.com/investors/company.php?ref=DANGCEM
4th May, 2011: FIN BANK PLC 4th May, 2011: Lafarge Cement P lc
AUDITED REPORT FOR THE PERIOD ENDED 31-DEC-10
FIRST QUARTER REPORT FOR THE PERIOD ENDED 31-MAR-
11
2010N'm
2009N'm
%
Change
2011N'm 2010 N'm %Change
Gross Earning 24,314 72,386 -66.41% Gross Earnings 14,198 12,035 17.97%
Profit Before Tax & Extra-Ordinary Items 14,317(111,22
8)-
112.87% Exceptional Items (4) (21) -80.95%
Exceptional Items Nil(38.597
) 0.00% Profit before tax 2,098 2,758 -23.93%
Profit Before Tax 14,317(149,82
5) 109.56% Taxation (477) (1,045) 54.35%
Taxation (444) (272) -63.24% Profit/Loss After Tax 1,621 1,713 -5.37%
Profit/Loss After Tax 14,497(149,77
0) 109.68% Balance Sheet Information

8/6/2019 NCM Report May 2011- Proshare
http://slidepdf.com/reader/full/ncm-report-may-2011-proshare 40/81
The Monthly NCM Report for May 2011 www.proshareng.com Page40
Balance Sheet Information Fixed Assets 110,381 100,751 9.56%
Fixed Assets 15,318 16,056 -4.60% Stock 8,392 9,728 -13.73%
Treasury Bills 5,854 7,076 -17.27% Trade Debtors 108.611 569.576 -80.93%
Loans and Advances 28,963 44,485 -34.89% Cash and Balances 6,310 5,248 20.24%
Cash and Bank Balances 10,397 9,278 12.06% Other Debit Balances 2,622 2,182 20.16%
Other Debit Balances 131,296 80,300 63.51% Trade Creditors 4,439 2,113 110.08%
Deposits 208,382 197,041 5.76%
Short Term
Borrowings Nil 46,594 0.00%
Other Credit Balances 96,069 86,650 10.87% Other Credit Balances 72,445 21,480 237.27%
Net Assets(112,62
3)(126,49
6) 10.97% Working Capital 530.399 (40,401) 101.31%
https://www.proshareng.com/investors/company.php?ref=FIRSTINLND Net Assets 49,912 48,291 3.36%
http://www.proshareng.com/investors/company.php?ref=WAPCO
4th May, 2011: Julius Berger Niger ia Plc 4th May, 2011: BECO PETROLEUM PLC
FIRST QUARTER REPORT FOR THE PERIOD ENDED 31-MAR-11 AUDITED REPORT FOR THE PERIOD ENDED 31-JUL-10
2011N'm
2010N'm %Change
2010N'm 2009 N'm
% Change
Gross Earning 31,967 31,414 1.76% Gross Earning 2,780 3,995 -30.41%
Profit/Loss Before Tax 1,663 1,420 17.11% Profit Before Tax (228.519) (216.718) -5.45%
Taxation
(74.843
)
(640.00
) 88.31% Taxation (21.970) (36.908) 40.47%
Profit/Loss After Tax 915.765 780.959 17.26% Profit/Loss After Tax 316.447 176.810 78.98%

8/6/2019 NCM Report May 2011- Proshare
http://slidepdf.com/reader/full/ncm-report-may-2011-proshare 41/81
The Monthly NCM Report for May 2011 www.proshareng.com Page41
Balance Sheet Information Balance Sheet Information
Fixed Assets 57,111 60,220 -5.16% Fixed Assets 3,079 3,133 -1.72%
Stock 16,350 15,015 8.89% Stock 220.822 242.030 -8.76%
Trade debtors 32,064 30,469 5.23% Trade debtors 386.659 469.570 -17.66%
Cash and Bank Balances 13,086 5,590 134.10% Other Debit Balances 10.766 4.210 155.72%
Other Debit Balances 38,844 38,588 0.66%Cash and BankBalances 27.820 3.193 771.28%
Trade creditors 10,122 6,784 49.20% Trade Creditors 28.614 12.662 125.98%
Short Term Borrowing 14,715 16,729 -12.04%Short TermBorrowing 393.63 308.091 27.76%
Other Credit Balances 113,611 108,417 4.79% Other Credit Balances 367.565 242.466 51.59%
Working Capital -38,300 -42,464 9.81% Working capital -154.450 151.572 -201.90%
Net Assets 8,531 7,617 12.00% Net Assets 2,935 2,971 -1.21%
http://www.proshareng.com/investors/company.php?ref=JBERGER http://www.proshareng.com/investors/company.php?ref=BE
COPETRO
4th May, 2011: EVANS MEDICAL PLC
4th Ma y, 2011: GLAXOSMITHKLINE CONSUMER NIG
PLC
FIRST QUARTER REPORT FOR THE PERIOD ENDED 31-MAR-11FIRST QUARTER REPORT FOR THE PERIOD ENDED 31-MAR-
11
2011N'm
2010N'm %Change
2011N'm 2010 N'm %Change
Gross Earnings 1,100 775.656 41.82% Gross Earnings 4,962 4,166 19.11%
Profit Before Tax 4.094(111.54
5) 103.67% Profit Before Tax 882.488 979.918 -9.94%
Taxation (0.435) Nil 0.00% Taxation (273.571) (303.775) 9.94%
Profit/Loss After Tax 3.659 (111.54 103.28% Profit/Loss After Tax 608.917 676.143 -9.94%
8/6/2019 NCM Report May 2011- Proshare
http://slidepdf.com/reader/full/ncm-report-may-2011-proshare 42/81
The Monthly NCM Report for May 2011 www.proshareng.com Page42
5)
Balance Sheet Information Balance Sheet Information
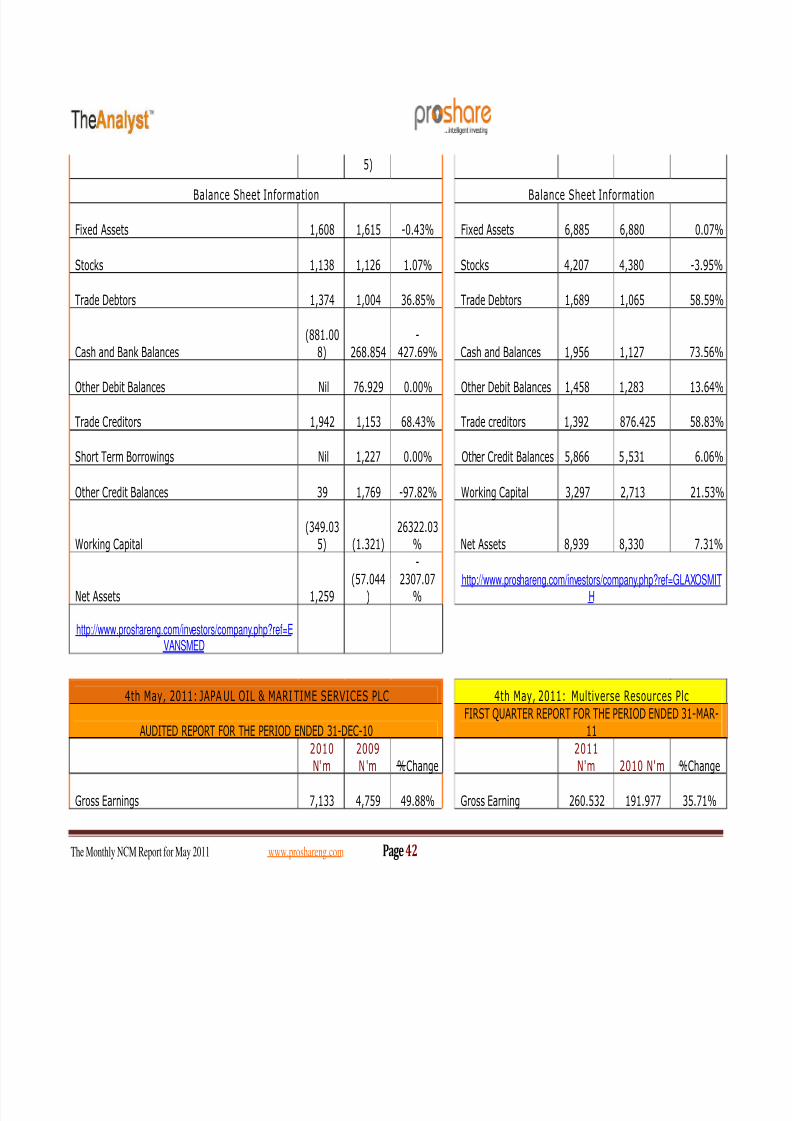
Fixed Assets 1,608 1,615 -0.43% Fixed Assets 6,885 6,880 0.07%
Stocks 1,138 1,126 1.07% Stocks 4,207 4,380 -3.95%
Trade Debtors 1,374 1,004 36.85% Trade Debtors 1,689 1,065 58.59%
Cash and Bank Balances(881.00
8) 268.854-
427.69% Cash and Balances 1,956 1,127 73.56%
Other Debit Balances Nil 76.929 0.00% Other Debit Balances 1,458 1,283 13.64%
Trade Creditors 1,942 1,153 68.43% Trade creditors 1,392 876.425 58.83%
Short Term Borrowings Nil 1,227 0.00% Other Credit Balances 5,866 5,531 6.06%
Other Credit Balances 39 1,769 -97.82% Working Capital 3,297 2,713 21.53%
Working Capital(349.03
5) (1.321)26322.03
% Net Assets 8,939 8,330 7.31%
Net Assets 1,259(57.044
)
-2307.07
%http://www.proshareng.com/investors/company.php?ref=GLAXOSMIT
H
http://www.proshareng.com/investors/company.php?ref=EVANSMED
4th May, 2011: JAPAUL OIL & MARI TIME SERVICES PLC 4th May, 2011: Multiverse Resources Plc
AUDITED REPORT FOR THE PERIOD ENDED 31-DEC-10FIRST QUARTER REPORT FOR THE PERIOD ENDED 31-MAR-
11
2010N'm
2009N'm %Change
2011N'm 2010 N'm %Change
Gross Earnings 7,133 4,759 49.88% Gross Earning 260.532 191.977 35.71%

8/6/2019 NCM Report May 2011- Proshare
http://slidepdf.com/reader/full/ncm-report-may-2011-proshare 43/81
The Monthly NCM Report for May 2011 www.proshareng.com Page43
Profit Before Tax 1,071
1,025.0
0 4.49% Profit Before Tax 49.656 30.792 61.26%
Taxation(278.93
1)(294.80
2) 5.38% Taxation (14.90) (1.20) 1141.33%
Profit/Loss After Tax 792.753 730.703 8.49% Profit/Loss After Tax 34.759 29.592 17.46%
Balance Sheet Information Balance Sheet Information
Fixed Assets 20,790 17,885 16.24% Fixed Assets 3,721 3,803 -2.16%
Stocks 630.421 623.431 1.12% Stock 630.207 408.469 54.29%
Trade Debtors 2,755 1,851 48.84% Trade debtors 0.310 16.422 -98.11%
Cash and Bank Balances 632.106 1,499 -57.83%Cash and BankBalances 4.214 6.782 -37.86%
Other Debit Balances 209.865 2,222 -90.56% Other Debit Balances 106.480 105.154 1.26%
Trade Creditors 489.65 293.89 66.61% Trade creditors 37.649 35.551 5.90%
Short Term Borrowings 200.11 282.92 -29.27%Short TermBorrowings 305.264 178.312 71.20%
Other Credit Balances 2,749 2,218 23.94% Other Credit Balances 312.552 608.993 -48.68%
Working Capital 2,718 3,293 -17.46% Working Capital 94.993 102.963 -7.74%
Net Assets 21,579 21,287 1.37% Net Assets 3,807 3,706 2.73%
http://www.proshareng.com/investors/company.php?ref=JAPAUL http://www.proshareng.com/investors/company.php?ref=MULTIVERS
E
5th May, 2011: CAPITAL HOTELS PLC 5th May, 2011: NPF MICROFINA NCE BANK PLC
FIRST QUARTER REPORT FOR THE PERIOD ENDED 31-MAR-11
FIRST QUARTER REPORT FOR THE PERIOD ENDED 31-MAR-
112011N'm
2010N'm %Change
2011N'm 2010 N'm %Change

8/6/2019 NCM Report May 2011- Proshare
http://slidepdf.com/reader/full/ncm-report-may-2011-proshare 44/81
The Monthly NCM Report for May 2011 www.proshareng.com Page44
Gross Earning 1,235 1,205 2.49% Gross Earning 300.250 225.852 32.94%
Profit Before Tax 308.750 336.331 -8.20% Profit Before Tax 103.552 87.480 18.37%
Taxation(98.800
)(107.62
6) 8.20% Taxation Nil Nil 0.00%
Profit/Loss After Tax 209.950 228.705 -8.20% Profit/Loss After Tax 103.552 87.480 18.37%
Balance Sheet Information Balance Sheet Information
Fixed Assets 1,793 1,845 -2.82% Fixed Assets 175.399 320.911 -45.34%
Trade Debtors 682.57 658.99 3.58% Treasury Bills 100 100 0.00%
Cash and Bank Balances 877.867 768.870 14.18% Loans and Advances 3,416 2,892 18.12%
Other Debit Balances 2,542 2,367 7.39%Cash and BankBalances 860.774 108.425 693.89%
Trade Creditors 313.289 297.742 5.22% Other Debit Balances 2,505 3,012 -16.83%
Other Credit Balances 912.223 843.102 8.20% Deposits 2,403 2,389 0.59%
Working Capital 4,670 4,499 3.80% Other Credit Balances 1,193 612.142 94.89%
Net Assets 3,184 2,974 7.06% Net Assets 3,365 3,433 -1.98%
http://www.proshareng.com/investors/company.php?ref=CAPHOTEL http://www.proshareng.com/investors/company.php?ref=NPFM
CRFBK
5th May, 2011: OCEANIC BANK INTERNAT IONAL PLC 5th May, 2011: OCEANIC BANK INTERNAT IONAL PLC
AUDITED REPORT FOR THE PERIOD ENDED 31-DEC-10FIRST QUARTER REPORT FOR THE PERIOD ENDED 31-MAR-
11
2010N'm
2009N'm %Change
2011N'm 2010 N'm %Change
Gross Earning 110,497 196,407 -43.74% Gross Earning 27,173 30,351 -10.47%

8/6/2019 NCM Report May 2011- Proshare
http://slidepdf.com/reader/full/ncm-report-may-2011-proshare 45/81
The Monthly NCM Report for May 2011 www.proshareng.com Page45
Profit Before Tax 32,946
(116,14
7) 128.37% Profit Before Tax 2,703 2,561 5.54%
Taxation (4,263) 27,139 115.71% Taxation (801.011) (884.427) 9.43%
Profit/Loss After Tax 28,682(89,007
) 132.22% Profit/Loss After Tax 1,902 1,676 13.48%
Minority Interest 1,111 388.115 186.26% Balance Sheet Information
Profit Attributable To The Group 29,793(88,619
) 133.62% Fixed Assets 57,713 59,775 -3.45%
Balance Sheet Information Treasury Bills 21,922 27,331 -19.79%
Fixed Assets 59,775 66,213 -9.72% Loans and Advances 261,309 280,270 -6.77%
Treasury Bills 27,331 30,447 -10.23%Cash and BankBalances 27,967 47,351 -40.94%
Loans and Advances 280,270 387,802 -27.73% Other Debit Balances 623,798 563,868 10.63%
Cash and Bank Balances 47,351 54,707 -13.45% Deposits 605,907 658,169 -7.94%
Other Debit Balances 563,868 361,916 55.80% Other Crebit Balances 472,729 410,197 15.24%
Deposits 658,169 556,781 18.21% Net Assets -86,925 -89,768 -3.17%
Other Crebit Balances 410,197 460,232 -10.87%http://www.proshareng.com/investors/company.php?ref=OC
EANIC
Net Assets -89,768-
115,924 -22.56%
http://www.proshareng.com/investors/company.php?ref=OCEANIC
5th May, 2011: R .T. Briscoe Nigeria Plc 5th May, 2011: NCR (NIGERIA) P LC
FIRST QUARTER REPORT FOR THE PERIOD ENDED 31-MAR-11FIRST QUARTER REPORT FOR THE PERIOD ENDED 31-MAR-
10

8/6/2019 NCM Report May 2011- Proshare
http://slidepdf.com/reader/full/ncm-report-may-2011-proshare 46/81
The Monthly NCM Report for May 2011 www.proshareng.com Page46
2011N'm
2010N'm %Change
2011N'm 2010 N'm
%
Change
Gross Earning 4,589 4,265 7.60% Gross Earnings 395.530 573.620 -31.05%
Profit/Loss Before Tax 91.091 117.447 -22.44% Cost of Sales (108.209) (133.883) 19.18%
Taxation(29.149
)(37.583
) 22.44% Profit Before Tax 240.951 374.351 -35.64%
Profit/Loss After Tax 61.942 79.864 -22.44% Taxation (77.105) (119.793) 35.63%
Balance Sheet Information Profit/Loss After Tax 163.845 254.557 -35.64%
Fixed Assets 885.48 886.281 -0.09% Balance Sheet Information
Stock 3,726 3,376 10.37% Fixed Assets 55.507 51.180 8.45%
Trade debtors 3,103 2,375 30.65% Stocks 258.565 259.114 -0.21%
Cash and Bank Balances 197.409 1,177 -83.23% Trade Debtors 1,405 1,329 5.72%
Other Debit Balances 1,663 1,581 5.19%Cash and BankBalances 368.669 616.573 -40.21%
Trade creditors 528.286 733.696 -28.00% Other Debit Balances 799.563 189.414 322.12%
Short Term Borrowings 3,958 4,122 -3.98% Trade Creditors 772.084 867 -11.00%
Other Credit Balances 1,679 1,192 40.86% Net Assets 1,346 1,183 13.78%
Working Capital 2,608 2,545 2.48%http://www.proshareng.com/investors/company.php?ref=NC
R
Net Assets 3,409 3,348 1.82%
http://www.proshareng.com/investors/company.php?ref=RTBRISCOE
6th May, 2011: Wema Bank Plc 6th May, 2011: ETERNA OIL PLC

8/6/2019 NCM Report May 2011- Proshare
http://slidepdf.com/reader/full/ncm-report-may-2011-proshare 47/81
The Monthly NCM Report for May 2011 www.proshareng.com Page47
FIRST QUARTER REPORT FOR THE PERIOD ENDED 31-MAR-10 AUDITED REPORT FOR THE PERIOD ENDED 31-DEC-10
2011N'm 2010N'm % Change 2010N'm 2009 N'm % Change
Gross Earning 6,835 8,432 -18.94% Gross Earning 14,138 9,225 53.26%
Profit/Loss Before Tax 1,043 795.012 31.19% Cost of Sales (12,585) (8,286) -51.88%
Taxation(156.59
4)(119.25
2) -31.31% Profit Before Tax 1,159 (1,962) 159.07%
Profit/Loss After Tax 887.369 675.760 31.31% Taxation (436.979) 466.98 -193.58%
Balance Sheet Information Profit/Loss After Tax 722.751 (1,495) 148.34%
Fixed Assets 14,380 13,922 3.29% Balance Sheet Information
Investments 4,237 4,296 -1.37% Fixed Assets 1,107 1,181 -6.27%
Treasury bills 11,390 8,176 39.31% Trade debtors 1,448 1,024 41.41%
Loans and Advances 49,165 43,689 12.53%Cash and BankBalances 261.798 1,030 -74.58%
Cash and Bank Balances 8,331 6,567 26.86% Other Debit Balances 6,460 7,036 -8.19%
Other Debit Balances 130,313 144,628 -9.90% Trade Creditors 787.164 97.877 704.24%
Deposits 125,369 120,883 3.71%Short TermBorrowings 261.798 (870.927) 130.06%
Other Credit Balances 25,610 39,574 -35.29% Other Credit Balances 3,867 4,371.000 -11.53%
Working Capital 201,162 201,215 -0.03% Working capital -465.516 -2,090 -77.73%
Net Assets 16,656 15,769 5.62% Net Assets 4,623 3,902 18.48%
http://www.proshareng.com/investors/company.php?ref=WEMABANK http://www.proshareng.com/investors/company.php?ref=ETERNAOIL
6th May, 2011: NAHCO AVIA NCE PLC 10th May, 2011: ALUMACO PLC
8/6/2019 NCM Report May 2011- Proshare
http://slidepdf.com/reader/full/ncm-report-may-2011-proshare 48/81
The Monthly NCM Report for May 2011 www.proshareng.com Page48
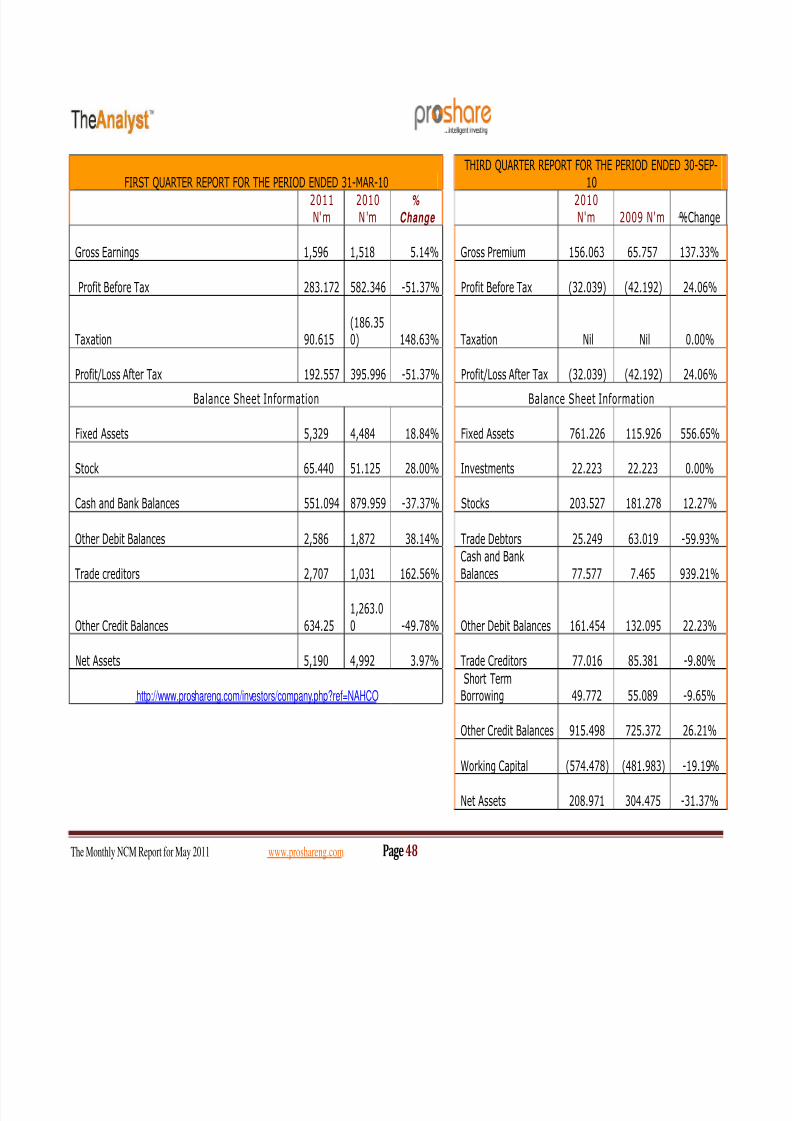
FIRST QUARTER REPORT FOR THE PERIOD ENDED 31-MAR-10THIRD QUARTER REPORT FOR THE PERIOD ENDED 30-SEP-
10
2011N'm
2010N'm
% Change
2010N'm 2009 N'm %Change
Gross Earnings 1,596 1,518 5.14% Gross Premium 156.063 65.757 137.33%
Profit Before Tax 283.172 582.346 -51.37% Profit Before Tax (32.039) (42.192) 24.06%
Taxation 90.615(186.350) 148.63% Taxation Nil Nil 0.00%
Profit/Loss After Tax 192.557 395.996 -51.37% Profit/Loss After Tax (32.039) (42.192) 24.06%
Balance Sheet Information Balance Sheet Information
Fixed Assets 5,329 4,484 18.84% Fixed Assets 761.226 115.926 556.65%
Stock 65.440 51.125 28.00% Investments 22.223 22.223 0.00%
Cash and Bank Balances 551.094 879.959 -37.37% Stocks 203.527 181.278 12.27%
Other Debit Balances 2,586 1,872 38.14% Trade Debtors 25.249 63.019 -59.93%
Trade creditors 2,707 1,031 162.56%
Cash and Bank
Balances 77.577 7.465 939.21%
Other Credit Balances 634.251,263.00 -49.78% Other Debit Balances 161.454 132.095 22.23%
Net Assets 5,190 4,992 3.97% Trade Creditors 77.016 85.381 -9.80%
http://www.proshareng.com/investors/company.php?ref=NAHCO Short Term
Borrowing 49.772 55.089 -9.65%
Other Credit Balances 915.498 725.372 26.21%
Working Capital (574.478) (481.983) -19.19%
Net Assets 208.971 304.475 -31.37%
8/6/2019 NCM Report May 2011- Proshare
http://slidepdf.com/reader/full/ncm-report-may-2011-proshare 49/81
The Monthly NCM Report for May 2011 www.proshareng.com Page49
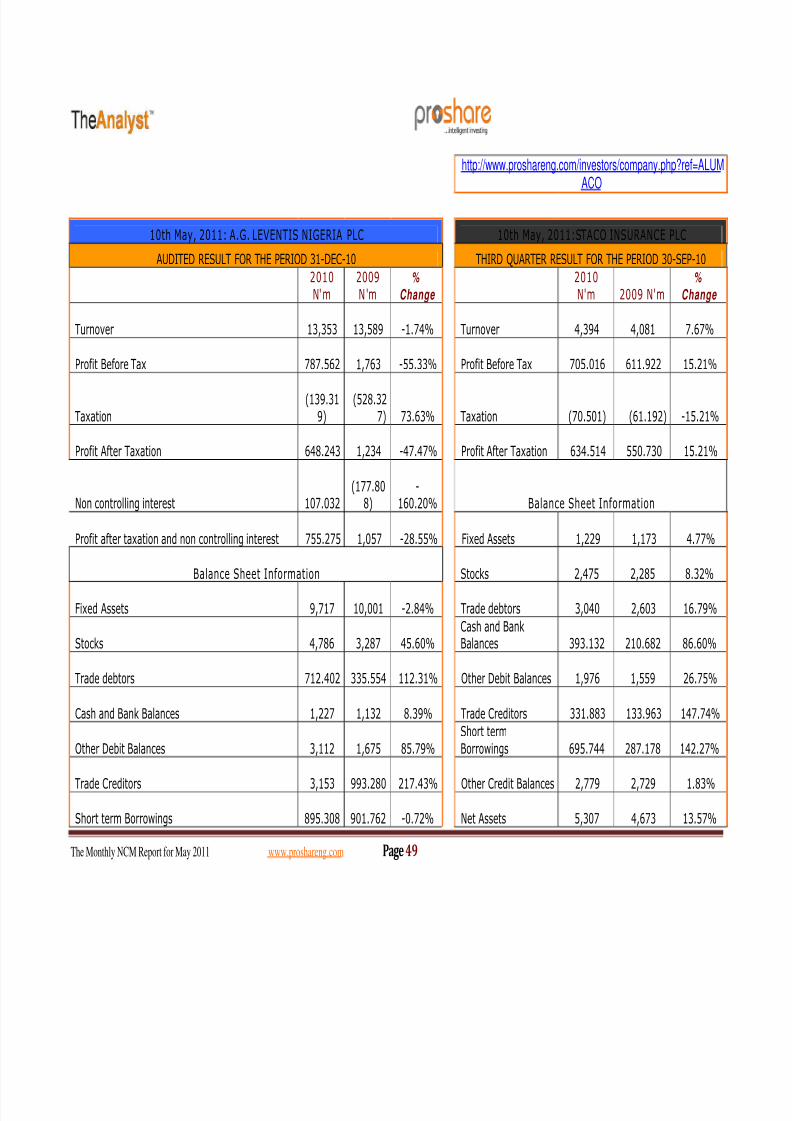
http://www.proshareng.com/investors/company.php?ref=ALUMACO
10th May, 2011: A.G. LEVENTIS NIGERIA PLC 10th May, 2011:STACO INSURANCE PLC
AUDITED RESULT FOR THE PERIOD 31-DEC-10 THIRD QUARTER RESULT FOR THE PERIOD 30-SEP-10
2010N'm
2009N'm
%
Change
2010N'm 2009 N'm
%
Change
Turnover 13,353 13,589 -1.74% Turnover 4,394 4,081 7.67%
Profit Before Tax 787.562 1,763 -55.33% Profit Before Tax 705.016 611.922 15.21%
Taxation(139.31
9)(528.32
7) 73.63% Taxation (70.501) (61.192) -15.21%
Profit After Taxation 648.243 1,234 -47.47% Profit After Taxation 634.514 550.730 15.21%
Non controlling interest 107.032(177.80
8)-
160.20% Balance Sheet Information
Profit after taxation and non controlling interest 755.275 1,057 -28.55% Fixed Assets 1,229 1,173 4.77%
Balance Sheet Information Stocks 2,475 2,285 8.32%
Fixed Assets 9,717 10,001 -2.84% Trade debtors 3,040 2,603 16.79%
Stocks 4,786 3,287 45.60%Cash and BankBalances 393.132 210.682 86.60%
Trade debtors 712.402 335.554 112.31% Other Debit Balances 1,976 1,559 26.75%
Cash and Bank Balances 1,227 1,132 8.39% Trade Creditors 331.883 133.963 147.74%
Other Debit Balances 3,112 1,675 85.79%Short termBorrowings 695.744 287.178 142.27%
Trade Creditors 3,153 993.280 217.43% Other Credit Balances 2,779 2,729 1.83%
Short term Borrowings 895.308 901.762 -0.72% Net Assets 5,307 4,673 13.57%

8/6/2019 NCM Report May 2011- Proshare
http://slidepdf.com/reader/full/ncm-report-may-2011-proshare 50/81
The Monthly NCM Report for May 2011 www.proshareng.com Page50
Other Credit Balances 5,028 4,269 17.78% https://www.proshareng.com/investors/company.php?ref=STACO
Working Capital 1,406 1,352 3.99%
Net Assets 10,518 10,308 2.04%
https://www.proshareng.com/investors/company.php?ref=AGLEVENT
11th May, 2011:BIG TREAT PLC 11th May, 2011: GUINNESS NIGERIA PLC
AUDITED RESULT FOR THE PERIOD 31-DEC-09THIRD QUARTER REPORT FOR THE PERIOD ENDED 31-MAR-
11
2009N'm
2008N'm
% Change
2011N'm 2010 N'm %Change
Turnover 4,214 3,932 7.17% Turnover 89,801 80,576 11.45%
Profit Before Tax(402.41
8) 494.568-
181.37% Profit Before Tax 17,562 13,754 27.69%
Taxation(38.088
)(88.229
) 56.83% Taxation (5,620) (4,704) -19.74%
Profit After Taxation
(440.50
6) 406.339
-
208.41% Profit After Tax 11,942 9,049 31.97%
Balance Sheet Information Balance Sheet Information
Fixed Assets 5,498 5,253 4.66% Fixed Assets 44,579 40,069 11.26%
Stocks 1,045 1,558 -32.93% Stocks 18,773 16,152 16.23%
Trade debtors 76.893 69.178 11.15% Trade Debtors 13,707 6,685 105.04%
Cash and Bank Balances 135.695 69.720 94.63%Cash and BankBalances 3,620 12,705 -71.51%
Other Debit Balances 136.957 138.438 -1.07% Other Debit Balances 6,203 2,783 122.89%
Trade Creditors -21.34% Trade Creditors 93.88%

8/6/2019 NCM Report May 2011- Proshare
http://slidepdf.com/reader/full/ncm-report-may-2011-proshare 51/81
The Monthly NCM Report for May 2011 www.proshareng.com Page51
212.956 270.713 13,467 6,946
Short term Borrowings 685.214 733.414 -6.57% Other Credit Balances 39,442 37,251 5.88%
Other Credit Balances 4,442 3,802 16.83% Working Capital 25,256 28,972 -12.83%
Working Capital 79.308 587.147 -86.49% Net Assets 86,883 783,996 -88.92%
Net Assets 1,552 2,282 -31.99%
https://www.proshareng.com/investors/company.php?ref=GUINNESS
https://www.proshareng.com/investors/company.php?ref=BIGTREAT
11th May, 2011: ADSWITCH PLC 12th M ay, 2011: SECURE ELECTRONIC TECH PLC Pl c
THIRD QUARTER REPORT FOR THE PERIOD ENDED 31-JAN-11FIRST QUARTER REPORT FOR THE PERIOD ENDED 31-MAR-
11
2011N'm
2010N'm %Change
2011N'm 2010 N'm %Change
Turnover 26.57 131.28 -79.76% Turnover 762.637 606.522 25.74%
Profit Before Tax (16.95) 14.18-
219.53% Profit Before Tax 7.869 60.363 -86.96%
Taxation Nil (4.25) 0.00% Taxation Nil 3.000 0.00%
Profit After Tax (16.95) 9.92 -270.87% Profit After Tax 7.869 57.363 -86.28%
Balance Sheet Information Balance Sheet Information
Fixed Assets 26.13 27.38 -4.57% Fixed Assets 5,688 5,711 -0.40%
Stocks 56.08 60.76 -7.70% Investment 0.994 0.994 0.00%
Trade Debtors 0.908 18.62 -95.12% Trade debtors 223.614 181.620 23.12%
Cash and Bank Balances 0.592 0.508 16.54%Cash and BankBalances 90.509 88.475 2.30%
Other Debit Balances 14.79 13.87 6.63% Other Debit Balances 6,040 6,039 0.02%

8/6/2019 NCM Report May 2011- Proshare
http://slidepdf.com/reader/full/ncm-report-may-2011-proshare 52/81
The Monthly NCM Report for May 2011 www.proshareng.com Page52
Trade Creditors 4.17 4.421 -5.68% Trade creditors 197.733 124.115 59.31%
Short term Borrowing 21.37 27.98 -23.62%Short TermBorrowings 202.692 176.950 14.55%
Other Credit Balances 42.16 1.073840.19
% Other Credit Balances 4,554 4,638 -1.81%
Net Assets 28.16 47.61 -40.85% Working Capital 5,762 5,732 0.52%
https://www.proshareng.com/investors/company.php?ref=ADSWITCH Net Assets 7,090 7,082 0.11%
https://proshareng.com/investors/company.php?ref=NSLTECH
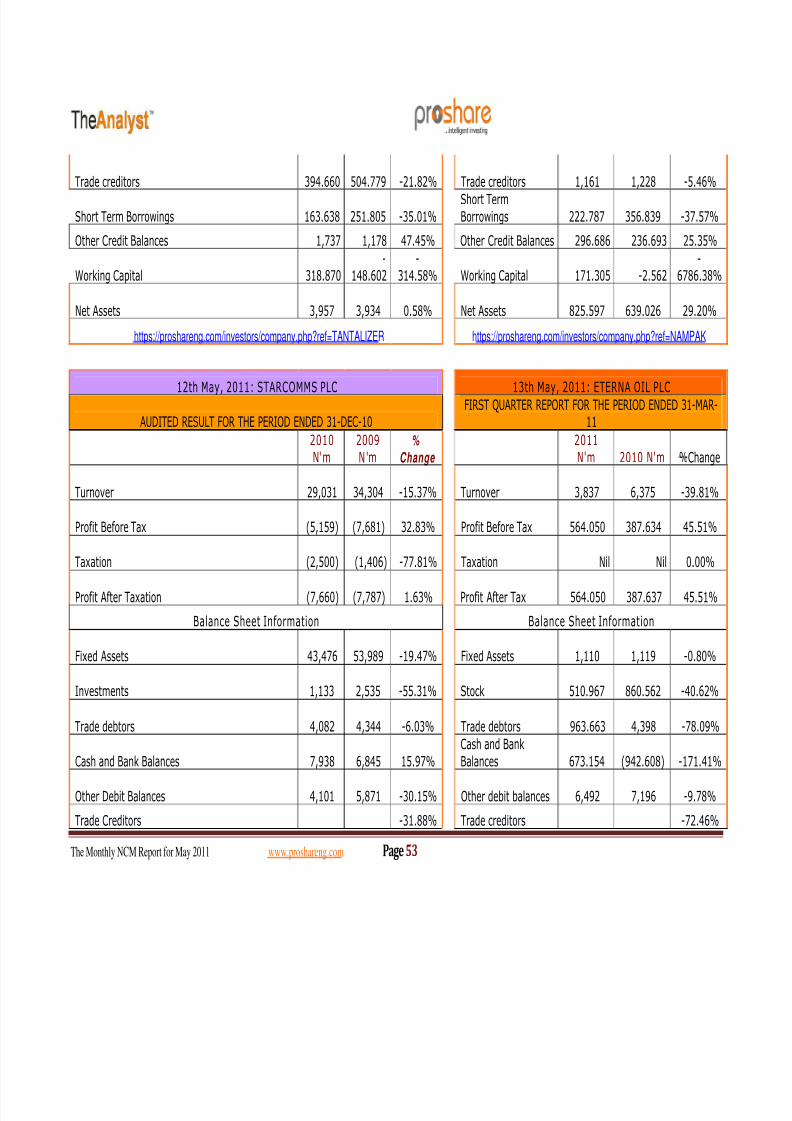
12th May, 2011: TANTALI ZERS PLC Plc 12th May, 2011: NAMPAK NIG. PLC Plc
FIRST QUARTER REPORT FOR THE PERIOD ENDED 31-MAR-11SECOND QUARTER REPORT FOR THE PERIOD ENDED 31-
MAR-11
2011N'm
2010N'm %Change
2011N'm 2010 N'm %Change
Turnover 1,150 1,267 -9.23% Turnover 2,332 2,215 5.28%
Profit Before Tax 33.058 40.749 -18.87% Profit Before Tax 280.769 203.514 37.96%
Taxation (9.432) (4.482)-
110.44% Taxation (89.846) (59.193) -51.78%
Profit After Tax 23.626 36.267 -34.86% Profit After Tax 190.923 144.321 32.29%
Balance Sheet Information Balance Sheet Information
Fixed Assets 4,895 4,858 0.76% Fixed Assets 751.062 738.357 1.72%
Investment 131.326 98.009 33.99% Investment 994.683 979.411 1.56%
Trade debtors 138.594 89.265 55.26% Trade debtors 544.137 536.158 1.49%
Cash and Bank Balances 372.969 233.660 59.62%Cash and BankBalances 61.370 43.863 39.91%
Other Debit Balances 714.896 591.638 20.83% Other Debit Balances 155.163 163.647 -5.18%
8/6/2019 NCM Report May 2011- Proshare
http://slidepdf.com/reader/full/ncm-report-may-2011-proshare 53/81
The Monthly NCM Report for May 2011 www.proshareng.com Page53
Trade creditors 394.660 504.779 -21.82% Trade creditors 1,161 1,228 -5.46%
Short Term Borrowings 163.638 251.805 -35.01%Short TermBorrowings 222.787 356.839 -37.57%
Other Credit Balances 1,737 1,178 47.45% Other Credit Balances 296.686 236.693 25.35%
Working Capital 318.870-
148.602-
314.58% Working Capital 171.305 -2.562-
6786.38%
Net Assets 3,957 3,934 0.58% Net Assets 825.597 639.026 29.20%
https://proshareng.com/investors/company.php?ref=TANTALIZER https://proshareng.com/investors/company.php?ref=NAMPAK
12th May, 2011: STARCOMMS PLC 13th May, 2011: ETERNA OIL PLC
AUDITED RESULT FOR THE PERIOD ENDED 31-DEC-10FIRST QUARTER REPORT FOR THE PERIOD ENDED 31-MAR-
11
2010N'm
2009N'm
%
Change
2011N'm 2010 N'm %Change
Turnover 29,031 34,304 -15.37% Turnover 3,837 6,375 -39.81%
Profit Before Tax (5,159) (7,681) 32.83% Profit Before Tax 564.050 387.634 45.51%
Taxation (2,500) (1,406) -77.81% Taxation Nil Nil 0.00%
Profit After Taxation (7,660) (7,787) 1.63% Profit After Tax 564.050 387.637 45.51%
Balance Sheet Information Balance Sheet Information
Fixed Assets 43,476 53,989 -19.47% Fixed Assets 1,110 1,119 -0.80%
Investments 1,133 2,535 -55.31% Stock 510.967 860.562 -40.62%
Trade debtors 4,082 4,344 -6.03% Trade debtors 963.663 4,398 -78.09%
Cash and Bank Balances 7,938 6,845 15.97%Cash and BankBalances 673.154 (942.608) -171.41%
Other Debit Balances 4,101 5,871 -30.15% Other debit balances 6,492 7,196 -9.78%
Trade Creditors -31.88% Trade creditors -72.46%

8/6/2019 NCM Report May 2011- Proshare
http://slidepdf.com/reader/full/ncm-report-may-2011-proshare 54/81
The Monthly NCM Report for May 2011 www.proshareng.com Page54
(11,472)
(8,699) 1,240 4,503
Short term Borrowings(18,439
)(11,761
) -56.78%Short TermBorrowings 1,169 1,808 -35.34%
Other Credit Balances(886.14
7)(270.95
5)-
227.05% Other Credit Balances 268.882 225.243 19.37%
Working Capital(30,797
)(20,732
) -48.55% Working Capital -192.538 1,522 -112.65%
Net Assets 23,588 31,249 -24.52% Net Assets 5,187 4,321 20.04%
https://proshareng.com/investors/company.php?ref=STARCOMMS https://proshareng.com/investors/company.php?ref=ETERNAOIL
13th May, 2011:UNILEVER NIG. PLC 13th May, 2011:JAPUAL OIL & MARIT IME PLC
FIRST QUARTER REPORT FOR THE PERIOD ENDED 31-MAR-11FIRST QUARTER REPORT FOR THE PERIOD ENDED 31-MAR-
11
2011N'm
2010N'm %Change
2011N'm 2010 N'm %Change
Turnover 13,042 10,931 19.31% Turnover 2,496 1,615 54.55%
Profit Before Tax 2,353 1,384 70.01% Profit Before Tax 599.099 631.894 -5.19%
Taxation(723.83
2)(426.78
5) -69.60% Taxation (59.910) (126.379) 52.59%
Profit After Tax 1,629 957.994 70.04% Profit After Tax 539.189 505.515 6.66%
Balance Sheet Information Balance Sheet Information
Fixed Assets 12,451 11,739 6.07% Fixed Assets 20,946 20,790 0.75%
Stock 6,958 6,286 10.69% Investments 13.954 13.954 0.00%
Trade debtors 2,945 2,813 4.69% Stock 585.224 630.421 -7.17%

8/6/2019 NCM Report May 2011- Proshare
http://slidepdf.com/reader/full/ncm-report-may-2011-proshare 55/81
The Monthly NCM Report for May 2011 www.proshareng.com Page55
Cash and Bank Balances 2,452 2,233 9.81% Trade debtors 2,978 2,951 0.91%
Other debit balances 4,558 4,312 5.71%Cash and BankBalances 500.564 4,214 -88.12%
Trade creditors 4,033 3,655 10.34% Other Credit Balances -1,799 -1,943 7.41%
Short Term Borrowings 381.851 730.809 -47.75% Working Capital 2,957 23,522 -87.43%
Other Credit Balances 12,211 11,227 8.76% Net Assets 22,118 21,579 2.50%
Working Capital 713.296-
199.410-
457.70% https://proshareng.com/investors/company.php?ref=JAPAULOIL
Net Assets 9,964 8,335 19.54%
https://proshareng.com/investors/company.php?ref=UNILEVER
17th May , 2011: ARBICO PLC 17th May, 2011: OANDO PLC
AUDITED REPORT FOR THE PERIOD ENDED 31-DEC-10FIRST QUARTER REPORT FOR THE PERIOD ENDED 31-MAR-
11
2010N'm
2009N'm
% Change
2011N'm 2010 N'm %Change
Turnover 841.042 722.379 16.4% Gross Earning 114,979 91,316 25.91%
Profit Before Tax(107.99
0) 24.288 -544.6% Profit Before Tax 5,697 5,082 12.10%
Taxation Nil(26.414
) 0.0% Taxation (2,499) (1,948) -28.29%
Profit/Loss After Tax(107.99
0) (2.126)-
4979.5% Profit/Loss After Tax 3,198 3,134 2.04%
Balance Sheet Information Balance Sheet Information
Fixed Assets 935.551 891.433 4.9% Fixed Assets 155,586 130,667 19.07%
Stocks 337.888 1,203 -71.9% Stock/Short Term 20,363 22,411 -9.14%

8/6/2019 NCM Report May 2011- Proshare
http://slidepdf.com/reader/full/ncm-report-may-2011-proshare 56/81
The Monthly NCM Report for May 2011 www.proshareng.com Page56
Investmen
Trade debtors 468.826 664.019 -29.4% Trade Debtors 92,599 57,088 62.20%
Cash and Bank Balances 168.108 270.640 -37.9%Cash and BankBalances 36,089 49,665 -27.34%
Other Debit Balances 541.400 238.007 127.5% Other Debit Balances 54,913 43,257 26.95%
Trade Creditors 229.753 135.544 69.5% Trade Creditors 70,246 59,897 17.28%
Short Term Borrowings 131.421 388.068 -66.1%
Short Term
Borrowing 82,676 149,457 -44.68%
Other Credit Balances 1,419 10,735 -86.8% Other Credit Balances 107,766 35,451 203.99%
Working Capital(261.45
3) 123.988 -310.9% Working Capital -11,954 -85,189 -85.97%
Net Assets 670.935 1,009 -33.5% Net Assets 98,864 58,282 69.63%
http://www.proshareng.com/investors/company.php?ref=ARBICO http://www.proshareng.com/investors/company.php?ref=OA
NDO
17h May, 2011: FIDSON HEALTHCARE PLC 17th May, 2011: STARCOMMS PLC
THIRD QUARTER REPORT FOR THE PERIOD ENDED 31-MAR-11
FIRST QUARTER REPORT FOR THE PERIOD ENDED 31-MAR-
112011
N'm
2010
N'm %Change
2011
N'm 2010 N'm %Change
Gross Earnings 3,448 3,969 -13.13% Turnover 6,051 7,936 -23.75%
Profit Before Tax 380.043 543.096 -30.02% Profit Before Tax (2,047) (1,439) -42.25%
Taxation(121.61
4)(173.79
1) 12.18% Taxation (13.507) (91.814) 85.29%
Profit/Loss After Tax 258.429 369.305 -30.02% Profit After Taxation (2,061) (1,530) -34.71%Balance Sheet Information Balance Sheet Information

8/6/2019 NCM Report May 2011- Proshare
http://slidepdf.com/reader/full/ncm-report-may-2011-proshare 57/81
The Monthly NCM Report for May 2011 www.proshareng.com Page57
Fixed Assets 2,390 2,224 7.46% Fixed Assets 41,688 43,476 -4.11%
Investments 2,803 2,813 -0.36% Investments 828.965 1,133 -26.83%
Stocks 574.140 714.317 -19.62% Trade debtors 1,517 282 438.71%
Trade Debtors 1,717 1,262 36.05%Cash and BankBalances 4,216 7,938 -46.89%
Cash and Bank Balances 490.407 232.831 110.63% Other Debit Balances 6,587 7,803 -15.58%
Other Dedit Balances 801.649 654.612 22.46% Trade Creditors 2,490 2,623 -5.07%
Trade Creditors 163.914 253.070 -35.23%
Short term
Borrowings 15,462 18,439 -16.15%
Short Term Borrowings 577.881 938.630 -38.43% Other Credit Balances (15,356) (16,080) 4.50%
Other Credit Balances 2,165 14,797 -85.37% Working Capital (18,223) (17,642) -3.29%
Working Capital 1,176 521.154 125.65% Net Assets 21,527 23,588 -8.74%
Net Assets 5,428 5,230 3.79% https://proshareng.com/investors/company.php?ref=STARCOMMS
http://www.proshareng.com/investors/company.php?ref=FIDSON
18th May, 2011: MAY & BAKER PLC 19th May, 2011: MAY & BAKER PLC
AUDITED REPORT FOR THE PERIOD ENDED 31-DEC-10FIRST QUARTER REPORT FOR THE PERIOD ENDED 31-MAR-
11
2010N'm
2009N'm
%
Change
2011N'm 2010 N'm %Change
Turnover 4,639 4,604 0.8% Turnover 957.309 856.684 11.7%
Profit Before Tax 307.790 344.162 -10.6% Cost of Sales (561.064) (489.333) -14.7%
Taxation(114.81
3)(112.08
1) -2.4% Profit Before Tax (34.329) (32.918) -4.3%

8/6/2019 NCM Report May 2011- Proshare
http://slidepdf.com/reader/full/ncm-report-may-2011-proshare 58/81

8/6/2019 NCM Report May 2011- Proshare
http://slidepdf.com/reader/full/ncm-report-may-2011-proshare 59/81
The Monthly NCM Report for May 2011 www.proshareng.com Page59
Taxation
(125.00
0)
(150.00
0) 16.67% Taxation (70.00) (84.00) 67.88%
Profit/Loss After Tax 669.000 274.000 144.16% Profit/Loss After Tax 53.00 161.00 -67.08%
Balance Sheet Information Balance Sheet Information
Fixed Assets 5,300 5,413 -2.09% Fixed Assets 9,600 9,164 4.76%
Stocks 3,600 3,448 4.41% Stocks 3,200 3,762 -14.94%
Trade Debtors 393.000 427.888 -8.15% Trade Debtors 5,800 5,479 5.86%
Cash and Bank Balances 844.000 767.000 10.04%
Cash and Bank
Balances 1,300 1,866 -30.33%
Other Debit Balances 918.000 663.000 38.46% Other Debit Balances 4,400 6,001 -26.68%
Trade Creditors 2,200 2,080 5.77% Trade Creditors 1,300 2,141 -39.28%
Short Term Borrowings 166.000 1,098 -84.88%Short TermBorrowings 77.00 10,399 -99.26%
Other Credit Balances 3,190 2,680 19.03% Other Credit Balances 12,500 3,155 296.20%
Working Capital 1,600 908.408 76.13% Working Capital 8,400 (810)-
1137.04%
Net Assets 5,500 4,847 13.47% Net Assets 10,500 10,578 -0.74%
http://www.proshareng.com/investors/company.php?ref=CCNN http://www.proshareng.com/investors/company.php?ref=IHS
19th May, 2011: IHS PLC 19th May, 2011: INTERNATI ONAL BREWERIES PLC
SECOND QUARTER REPORT FOR THE PERIOD ENDED 31-OCT-10FIRST QUARTER REPORT FOR THE PERIOD ENDED 31-MAR-
11
2010N'm
2009N'm
% Change
2011N'm 2010 N'm %Change
Gross Earnings 6,989 6,730 3.85% Turnover 2,378 777.524 205.8%
Profit Before Tax -21.76% Profit Before Tax -98.1%

8/6/2019 NCM Report May 2011- Proshare
http://slidepdf.com/reader/full/ncm-report-may-2011-proshare 60/81
The Monthly NCM Report for May 2011 www.proshareng.com Page60
230.008 293.98 7.432 390.277
Taxation(100.36
1)(132.63
2) 24.33% Taxation Nil Nil 0.0%
Profit/Loss After Tax 129.647 161.346 -19.65% Profit After Tax 7.432 390.277 -98.1%
Balance Sheet Information Balance Sheet Information
Fixed Assets 10,169 9,164 10.97% Fixed Assets 6,723 6,754 -0.5%
Stocks 3,030 3,762 -19.46% Stocks 1,880 1,888 -0.4%
Trade Debtors 6,137 5,479 12.01% Trade Debtors 635.043 328.379 93.4%
Cash and Bank Balances 1,256 1,866 -32.69%Cash and Bank
Balances 377.052 209.282 80.2%
Other Debit Balances 4,930 6,001 -17.85% Other Debit Balances 1,009 731.079 38.0%
Trade Creditors(197.81
1) 2,141-
109.24% Trade Creditors 1,001 629.191 59.1%
Short Term Borrowings 65.527 10,399 -99.37%Short TermBorrowings Nil 225.601 0.0%
Other Credit Balances 15,073 3,155 377.75%Other Credit
Balances 9,700 9,141 6.1%
Working Capital 9,588(810,51
9) 101.18% Working Capital 1,483 684.592 116.6%
Net Assets 10,583 10,578 0.05% Net Assets (76.789) (84.221) -8.8%
http://www.proshareng.com/investors/company.php?ref=IHS https://www.proshareng.com/investors/company.php?ref=INTB
REW
20th May, 2011: CONOIL PLC 20th May, 2011: CONOIL PLC
AUDITED RESULT FOR THE PERIOD 31-DEC-10 FIRST QUARTER RESULT FOR THE PERIOD 31-MAR-112010N'm
2009N'm
% Change
2011N'm 2010 N'm
% Change

8/6/2019 NCM Report May 2011- Proshare
http://slidepdf.com/reader/full/ncm-report-may-2011-proshare 61/81
The Monthly NCM Report for May 2011 www.proshareng.com Page61
Gross income 102,787 101,853 0.92% Turnover 37,301 21,071 77.03%
Profit Before Tax 4,020 3,784 6.24% Profit After Taxation 1,185 145.69 713.37%
Taxation (1,230) (1,472) 16.44% Balance Sheet Information
Profit After Taxation 2,789 2,312 20.63% Net Assets 18,045 15,260 18.25%
Balance Sheet Information
http://www.proshareng.com/investors/company.php?ref=CONOIL
Fixed Assets 7,670 8,139 -5.76%
Stocks 6,871 4,095 67.79%
Trade debtors 9,365 8,777 6.70%
Cash and Bank Balances 10,153 10,571 -3.95%
Other Debit Balances 7,326 8,190 -10.55%
Trade Creditors 5,252 5,296 -0.83%
Short term Borrowings 6,202 9,021 -31.25%
Other Credit Balances 14,672 11,944 22.84%
Working Capital 9,699 7,634 27.05%
Net Assets 15,260 13,511 12.95%
http://www.proshareng.com/investors/company.php?ref=CONOIL
20th May, 2011: MRS OIL NIGERIA PLC 20th May, 2011: E-TRANSACT INTERNATI ONAL PLC
AUDITED RESULT FOR THE PERIOD 31-DEC-10
FIRST QUARTER REPORT FOR THE PERIOD ENDED 31-MAR-
112010N'm
2009N'm
% Change
2011N'm 2010 N'm %Change

8/6/2019 NCM Report May 2011- Proshare
http://slidepdf.com/reader/full/ncm-report-may-2011-proshare 62/81
The Monthly NCM Report for May 2011 www.proshareng.com Page62
Gross income 74,781 74,603 0.24% Turnover 145.744 61.547 136.80%
Profit Before Tax 2,887 1,721 67.75% Profit Before Tax 31.696 (23.109) -237.16%
Taxation (1,040)(670.37
3) -55.14% Taxation 9.508 (2.773) -442.88%
Profit After Taxation 1,847 1,050 75.90% Profit after tax 22.187 (25.882) -185.72%
Balance Sheet Information Balance Sheet Information
Fixed Assets 18,209 3,036 499.77% Fixed Assets 745.818 743.466 0.32%
Stocks 8,637 4,844 78.30% Investment 590.600 590.600 0.00%
Trade debtors 2,504 2,231 12.24% Stocks 143.448 135.312 6.01%
Cash and Bank Balances 2,899 2,208 31.30% Trade Debtors 220.534 223.048 -1.13%
Other Debit Balances 8,747 5,986 46.12%Cash and BankBalances 856.405 853.121 0.38%
Trade Creditors 11,479 5,055 127.08% Other Debit Balances 228.458 237.707 -3.89%
Short term Borrowings 517.346 934.044 -44.61% Trade Creditors 40.485 70.172 -42.31%
Other Credit Balances 10,472 9,351 11.99% Other Credit Balances 65.173 55.664 17.08%
Working Capital 2,860 1,069 167.54% Working Capital 1,167 1,142 2.19%
Net Assets 18,528 2,965 524.89% Net Assets 2,679 2,657 0.83%
http://www.proshareng.com/investors/company.php?ref=CHEVRONhttp://www.proshareng.com/investors/company.php?ref=ET
RANZACT
23rd May, 2011:BIG TREAT PLC 23rd May, 2011: PRESTIGE ASSURANCE PLC
AUDITED RESULT FOR THE PERIOD 31-DEC-09FIRST QUARTER REPORT FOR THE PERIOD ENDED 31-MAR-
11

8/6/2019 NCM Report May 2011- Proshare
http://slidepdf.com/reader/full/ncm-report-may-2011-proshare 63/81
The Monthly NCM Report for May 2011 www.proshareng.com Page63
2009N'm
2008N'm
%
Change
2011N'm 2010 N'm %Change
Turnover 4,214 3,932 7.17% Gross premium 1,109 1,215 -8.72%
Cost of sales (2,527) (1,654) -52.78% Profit Before Tax 243.448 490.266 -50.34%
Profit Before Tax(402.41
8) 494.568-
181.37% Taxation (78.690) (158.469) 50.34%
Taxation(38.088
)(88.229
) -56.83% Profit after tax 164.758 331.796 -50.34%
Profit After Taxation(440.50
6) 406.339-
208.41% Balance Sheet Information
Balance Sheet Information Fixed Assets 765.396 917.053 -16.54%
Fixed Assets 5,498 5,253 4.66% Stock 1,848 2,213 -16.49%
Stocks 1,045 1,558 -32.93% Trade Debtors 1,884 1,468 28.34%
Trade debtors 76.893 69.178 11.15%Cash and BankBalances 311.209 343,973 -99.91%
Cash and Bank Balances 135.695 69.720 94.63% Other Debit Balances 2,292 2,610 -12.18%
Other Debit Balances 136.957 138.438 -1.07% Trade Creditors 1,176 1,379 -14.72%
Trade Creditors 212.956 270.713 -21.34% Other Credit Balances 1,018 1,418 -28.21%
Short term Borrowings 685.214 733.414 -6.57% Net Assets 4,907 4,755 3.20%
Other Credit Balances 4,442 3,802 16.83%https://proshareng.com/investors/company.php?ref=PRESTI
GE
Working Capital 79.308 587.147 -86.49%
Net Assets 1,552 2,282 -31.99%
https://www.proshareng.com/investors/company.php?ref=BIGTREAT

8/6/2019 NCM Report May 2011- Proshare
http://slidepdf.com/reader/full/ncm-report-may-2011-proshare 64/81
The Monthly NCM Report for May 2011 www.proshareng.com Page64
24th May, 2011: COSTAIN PLC 24th May , 2011: SMART PRODUCTS PLC
FIRST QUARTER REPORT FOR THE PERIOD ENDED 30-JUN-10 AUDITED REPORT FOR THE PERIOD ENDED 31-DEC-10
2010N'm
2009N'm %Change
2010N'm 2009 N'm
%
Change
Turnover 1,436 2,030 -29.26% Turnover 24.102 17.355 38.9%
Cost of sales (1,039) (1,732) 40.01% Profit Before Tax 6.401 4.514 41.8%
Profit Before Tax(81.937
) 89.966-
191.08% Taxation (1.449) (0.867) -67.1%
Taxation 1.984 1.799 10.28% Profit After Tax 5.368 3.500 53.4%
Profit After Tax(83.921
) 88.167-
195.18% Balance Sheet Information
Balance Sheet Information Fixed Assets 75.275 73.222 2.8%
Fixed Assets 5,895 5,449 8.18% Investments 26.583 12.074 120.2%
Investment 2,004 2,004 0.00% Trade debtors 3.618 0.160 2161.3%
Stocks 2,812 2,937 -4.26%Cash and BankBalances 5.181 0.768 574.6%
Trade Debtors 85.570 3.0582698.23
% Trade creditors 6.735 6.033 11.6%
Cash and Bank Balances 80.507 1,093 -92.63% Other Credit Balances -7.744 -10.514 26.3%
Other Debit Balances 2,383 2.68688619.29
% Net Assets 76.541 57 34.8%
Trade Creditors 1,132 1,124 0.71% https://proshareng.com/investors/company.php?ref=SMURFIT
Short Term Borrowings 870.305 714.363 21.83%
Other Credit Balances 3,481 4,473 -22.18%
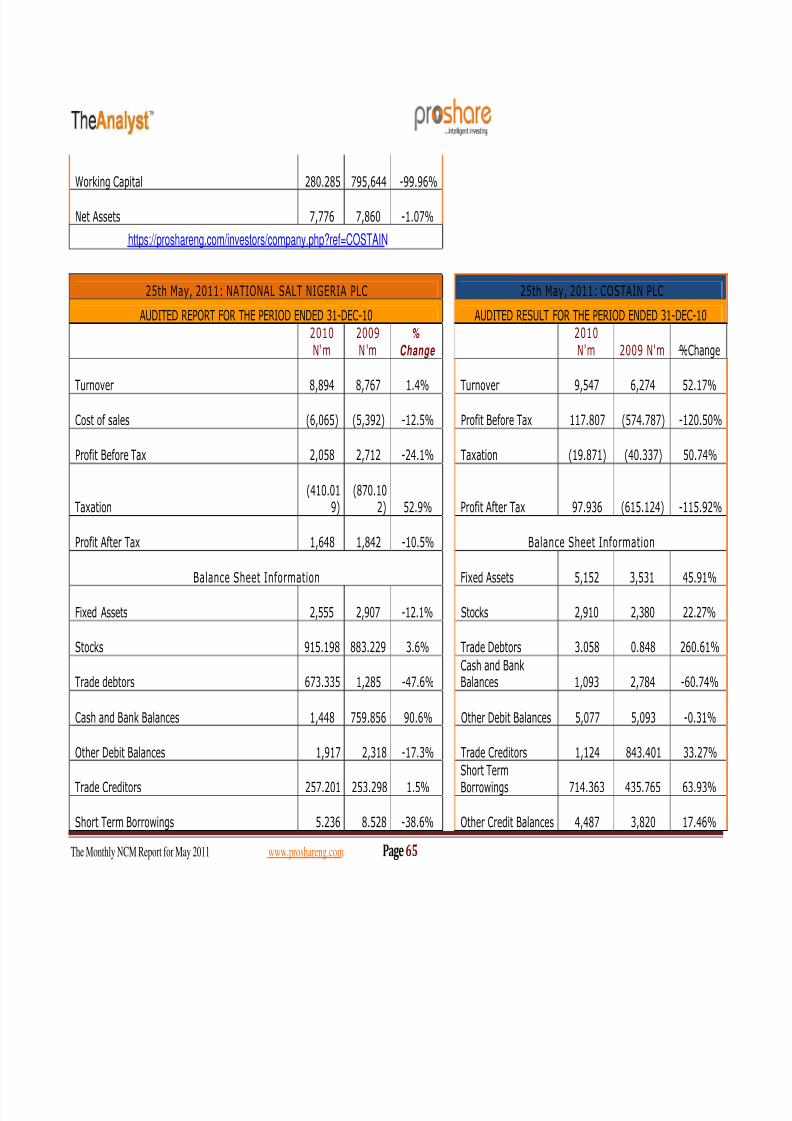
8/6/2019 NCM Report May 2011- Proshare
http://slidepdf.com/reader/full/ncm-report-may-2011-proshare 65/81
The Monthly NCM Report for May 2011 www.proshareng.com Page65
Working Capital 280.285 795,644 -99.96%
Net Assets 7,776 7,860 -1.07%
https://proshareng.com/investors/company.php?ref=COSTAIN
25th May, 2011: NATIONAL SALT NIGERIA PLC 25th May, 2011: COSTAIN PLC
AUDITED REPORT FOR THE PERIOD ENDED 31-DEC-10 AUDITED RESULT FOR THE PERIOD ENDED 31-DEC-10
2010N'm
2009N'm
%
Change
2010N'm 2009 N'm %Change
Turnover 8,894 8,767 1.4% Turnover 9,547 6,274 52.17%
Cost of sales (6,065) (5,392) -12.5% Profit Before Tax 117.807 (574.787) -120.50%
Profit Before Tax 2,058 2,712 -24.1% Taxation (19.871) (40.337) 50.74%
Taxation(410.01
9)(870.10
2) 52.9% Profit After Tax 97.936 (615.124) -115.92%
Profit After Tax 1,648 1,842 -10.5% Balance Sheet Information
Balance Sheet Information Fixed Assets 5,152 3,531 45.91%
Fixed Assets 2,555 2,907 -12.1% Stocks 2,910 2,380 22.27%
Stocks 915.198 883.229 3.6% Trade Debtors 3.058 0.848 260.61%
Trade debtors 673.335 1,285 -47.6%Cash and BankBalances 1,093 2,784 -60.74%
Cash and Bank Balances 1,448 759.856 90.6% Other Debit Balances 5,077 5,093 -0.31%
Other Debit Balances 1,917 2,318 -17.3% Trade Creditors 1,124 843.401 33.27%
Trade Creditors 257.201 253.298 1.5%
Short Term
Borrowings 714.363 435.765 63.93%
Short Term Borrowings 5.236 8.528 -38.6% Other Credit Balances 4,487 3,820 17.46%

8/6/2019 NCM Report May 2011- Proshare
http://slidepdf.com/reader/full/ncm-report-may-2011-proshare 66/81
The Monthly NCM Report for May 2011 www.proshareng.com Page66
Other Credit Balances 2,292 3,261 -29.7% Working Capital 1,140 3,455 -67.00%
Working Capital 2,930 2,446 19.8% Net Assets 7,910 8,692 -9.00%
Net Assets 4,955 4,631 7.0% https://proshareng.com/investors/company.php?ref=COSTAIN
https://proshareng.com/investors/company.php?ref=NASCON
25th May, 2011: ABC Plc 25th May , 2011: SMART PRODUCTS PLC
FIRST QUARTER REPORT FOR THE PERIOD ENDED 31-MAR-11SECOND QUARTER REPORT FOR THE PERIOD ENDED 30-
JUN-10
2011
N'm
2010
N'm %Change
2010
N'm 2009 N'm
%
Change
Turnover 1,216 1,011 20.28% Turnover 9.94 17.355 -42.7%
Profit Before Tax(60.384
)(12.920
)-
367.37% Profit Before Tax 2.38 4.51 -47.2%
Taxation(10.038
)(10.433
) 3.79% Taxation (0.1500) (0.867) -82.7%
Profit After Tax
(70.422
)
(23.353
)
-
201.55% Profit After Tax 2.38 3.51 -32.2%Balance Sheet Information Balance Sheet Information
Fixed Assets 3,756 3,100 21.16% Fixed Assets 72.81 73.22 -0.6%
Investmets 21.372 21.372 0.00% Investments 22.50 12.074 86.4%
Stocks 146.754 139.443 5.24% Trade debtors 0.160 0.160 0.0%
Trade debtors 238.150 198.722 19.84%Cash and BankBalances 3.56 0.768 363.5%
Cash and Bank Balances 269.091 43.195 522.97% Trade creditors 5.24 6.033 -13.1%
Other Debit Balances 713.023 252.405 182.49% Other Credit Balances 5.41 5.41 0.0%
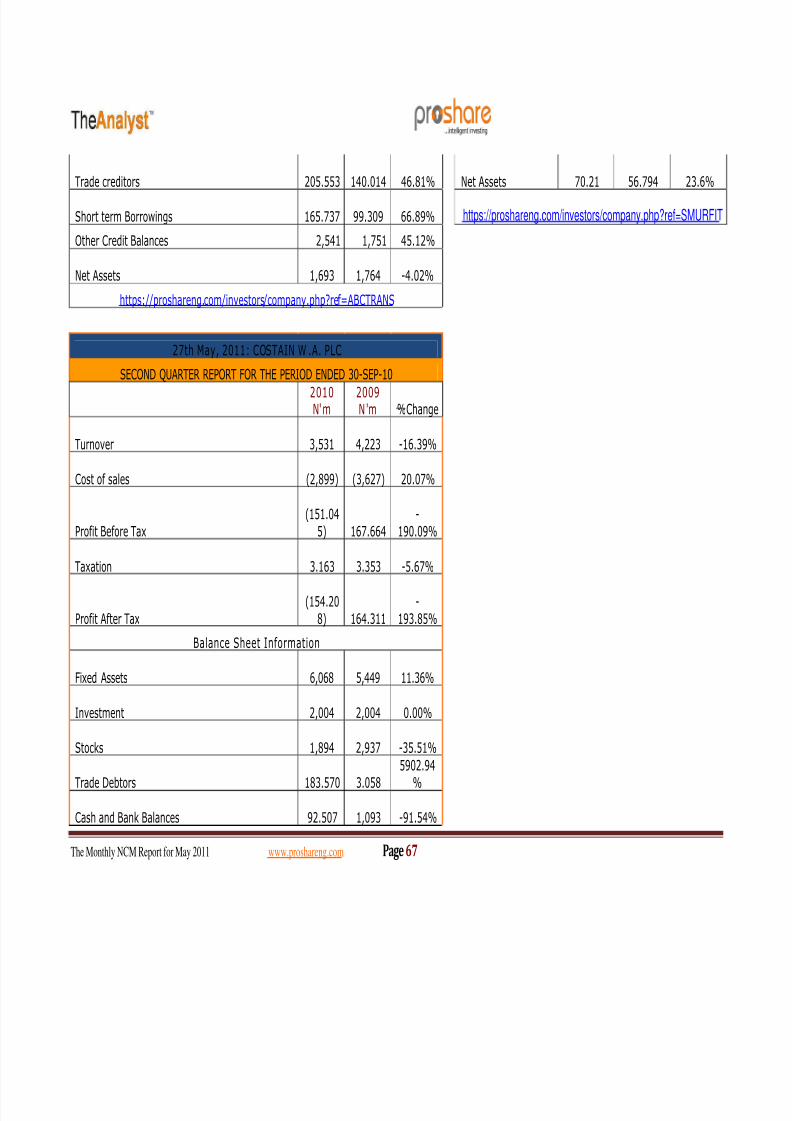
8/6/2019 NCM Report May 2011- Proshare
http://slidepdf.com/reader/full/ncm-report-may-2011-proshare 67/81
The Monthly NCM Report for May 2011 www.proshareng.com Page67
Trade creditors 205.553 140.014 46.81% Net Assets 70.21 56.794 23.6%
Short term Borrowings 165.737 99.309 66.89% https://proshareng.com/investors/company.php?ref=SMURFIT
Other Credit Balances 2,541 1,751 45.12%
Net Assets 1,693 1,764 -4.02%
https://proshareng.com/investors/company.php?ref=ABCTRANS
27th May, 2011: COSTAIN W .A. PLC
SECOND QUARTER REPORT FOR THE PERIOD ENDED 30-SEP-10
2010N'm
2009N'm %Change
Turnover 3,531 4,223 -16.39%
Cost of sales (2,899) (3,627) 20.07%
Profit Before Tax(151.04
5) 167.664-
190.09%
Taxation 3.163 3.353 -5.67%
Profit After Tax(154.20
8) 164.311-
193.85%
Balance Sheet Information
Fixed Assets 6,068 5,449 11.36%
Investment 2,004 2,004 0.00%
Stocks 1,894 2,937 -35.51%
Trade Debtors 183.570 3.058
5902.94
%
Cash and Bank Balances 92.507 1,093 -91.54%

8/6/2019 NCM Report May 2011- Proshare
http://slidepdf.com/reader/full/ncm-report-may-2011-proshare 68/81
The Monthly NCM Report for May 2011 www.proshareng.com Page68
Other Debit Balances 1,808 2,686 -32.69%
Trade Creditors 1,020 1,124 -9.25%
Short Term Borrowings 769.305 714.363 7.69%
Other Credit Balances 2,554 4,488 -43.09%
Working Capital 59.131 780.779 -92.43%
Net Assets 7,691 7,846 -1.98%
https://proshareng.com/investors/company.php?ref=COSTAIN

8/6/2019 NCM Report May 2011- Proshare
http://slidepdf.com/reader/full/ncm-report-may-2011-proshare 69/81
The Monthly NCM Report for May 2011 www.proshareng.com Page69
Forecast Results in the monthSource: NSE, Proshare Research
DECLARED FORECASTS FOR MAY 2011
Company Year End Period
GrossEarnings
in N'
billion
PAT in
N'
billion
BOC Gases Plc December Q2 2011 1,189 0.193
FCMB Plc December Q2 2011 17.737 2.632
International Breweries Plc December Q2 2011 4.426 0.327
Lafarge WAPCO Plc December Q2 2011 13.521 1.399
Capital Hotels Plc December Q2 2011 1.225 0.219
Briscoe Plc December Q2 2011 3.212 0.40
Oceanic Bank Plc December Q2 2011 57.174 5.650
Adswitch Plc April Q1 2011 36.215 4.981
Livestock Feeds Plc December Q3 2011 0.877 0.35
Starcomms Plc December Q2 2011 6.558 -2.169
Unilever Plc December Q3 2011 39.456 3.607
Oando Plc December Q2 2011 138.553 2.926
Academy Press Plc March Q1 2011 0.742 0.46
FTN Cocoa Processors Plc September Q2 2011 0.474 0.29
Costain WA Plc March Q1 2011 4.350 0.111
Dividends DeclaredDIVIDENDS DECLARED MAY 2011
Company
Dividend
Declared
Bonus
Declared AGM Date Price Adjustment Date
Japaul Oil & Maritime Plc 30-Jun-11Ecobank Transnational
Incorporated 30-Jun-11
Julius Berger Plc 2.00 07-Jul-11 20th - 23rd June, 2011
Total Nigeria Plc 600k 30-Jun-11 9th – 13th May 2011
Conoil Plc 2.00 24-Jul-11 06 – 10 June 2011
DN Meyer Plc 30-Jun-11
Oando Plc 30-Jun-11
Great Nigeria Insurance Plc 30-Jun-11 9th – 17th June, 2011
MRS Oil Plc 1.25k 26-Jul-11 11th - 15th July, 2011
Smart Products Plc 0.12k 1 for 4 30-Jun-11 17th - 27th June, 2011
Unity Bank Plc 0.5k 1 for 20 29-Jul-11 10th - 14th, June, 2011National Salt Coy of Nigeria Plc 50k 30-Jun-11 20th - 24th June, 2011
Costain WA Plc 13-Jul-11
29th June- 6th July2011
Universal Insurance Plc 22-Jun-11
Source: NSE, Proshare Research

8/6/2019 NCM Report May 2011- Proshare
http://slidepdf.com/reader/full/ncm-report-may-2011-proshare 70/81
The Monthly NCM Report for May 2011 www.proshareng.com Page70
Analyst Opinion
The outlook recorded in the month of May is quite impressive and is in line with our
expectation. The drop in political tension and impressive corporate actions from key
companies coupled with low valuation of blue chip stocks remained the major drivers.
Apart from persistent liquidity challenge that is facing the market, we observed that
market is still experiencing low risk appetite while the improved investors' confidence
appeared fragile.
The sustained cautious treading observed in the month while value investing approach
was religiously employed buttressed the wary position of investors.
More so, the MTD performance is ranked second best in the year to close at 3.11% as
against -2.44% recorded in May 2010. However, the YTD of 3.04% is far below 25.65%
recorded in the previous year comparable period. This is an indication that the regulatory
bodies and stakeholders need to maintain sustainable and collective efforts towardsreviving market confidence in which lasting solution to low liquidity position and proper
handling of sensitive market related issues will go a long way.
However, the smooth transition into new and fresh government would layoff investors’
wariness to some extent while our market remained the toast of portfolio managers who
are likely to leave markets in the mid East and North Africa due to troubles and
uncertainties in those economies.
To this regard, we believe that the performance of government and the new incoming
cabinet members must not fall short of expectations. Timely and well tailored economic
plans and policies that will support the ongoing infrastructural development and
economic reforms will have robust impact on the market performance in the coming
periods.
In our opinion, this will also impact investment decisions, market confidence and
increase participation of foreign investors accordingly while we expect low volatility in
the coming periods with improved rally as large numbers of big and mid CAP stocks still
trading below their intrinsic value with ample of opportunities for price growth.
Nevertheless, we remained optimistic as market has ability to sustain the current
bargain sentiments and enthusiasm as we foresee a growing risk appetite on the back of
supportive readings from government policies and economic plans.

8/6/2019 NCM Report May 2011- Proshare
http://slidepdf.com/reader/full/ncm-report-may-2011-proshare 71/81
The Monthly NCM Report for May 2011 www.proshareng.com Page71
Time Lines - (New s/ In formation in the month and Reaction of Market)
Date Timelines Gaine
rs
Losers ASI and Market Capitalisation Remarks
May 3NSE: Stockbrokers call for compulsory listing of multinationals:
Stockbrokers have called on the Federal Government to compel telecommunications
and multinational companies to list their shares on the Nigerian Stock Exchange.
Mixed reactions trail CBN’s limit on cash withdrawal: Stakeholders in the
financial sector of the economy have expressed divergent views on the directive by
the Central Bank of Nigeria and Bankers’ Committee to limit the cumulative daily
cash withdrawals and lodgements in the country from June next year.
Stockbroking: Analysts caution regulators on capital requirement: Market
analysts have urged capital market regulators to review the idea of increasing the
minimum capital requirement for the operations of stockbroking firms in Nigeria.
27 27 At the close of trading session, the NSE All-Shar
Index gained by 0.18% to close at 25,085.59 a
against an offbeat by 0.99% recorded previou
session to close at 25,041.68. In the same vei
market capitalization appreciated b
N14.03billion (US$90.52million) to close
N8.02trillion (US$51.71billion) as again
depreciation by N80.34billion (US$518.33million
recorded on preceding session to close
N8.00trillion (US$51.61billion). Market report for th
day was titled: NSE All-Share Index inches up b
+0.18% as Neimeth tops gainers’ char
(https://www.proshareng.com/news/singlen
ws.php?id=13726)
May 4 Africa’s FDI to Hit $150bn by 2015: Ernst & Young, a global accounting firm has
predicted that Africa may attract billions of dollars in new investments over the
next few years which is expected to significantly raise Foreign Direct Investment
(FDI) in the continent to $150 billion by 2015 from the $84 billion attained last
year.
Govt moves to reduce 2011 budget deficit to 3.6 per cent of GDP: The
Federal Government may have commenced talks with the National Assembly in a
move to reduce fiscal deficit of over N700 million of the N4.6 trillion budget this
year.
Risk management: The travails of Nigerian banks: There is a great correlation
between a banker and the non-immigrant visa issuer: Power of prediction. Howdoes the issuer predict that a non – immigrant visa applicant (especially the first-
32 27 At the close of trading session, the NSE All-Shar
Index dropped by 0.05% to close at 25,072.92 a
against upbeat by 0.18% recorded previous sessio
to close at 25,085.59. In the same vein, marke
capitalization depreciated by N3.62billio
(US$23.41million) to close at N8.02trillio
(US$51.69billion) as against appreciation b
N14.03billion (US$90.52million) recorded o
preceding session to close at N8.02trillio
(US$51.71billion). Market report for the day wa
titled: Equity market lost marginally b y -0.05%
with YTD standing at -0.12%
(https://www.proshareng.com/news/singlen
ws.php?id=13741)

8/6/2019 NCM Report May 2011- Proshare
http://slidepdf.com/reader/full/ncm-report-may-2011-proshare 72/81
The Monthly NCM Report for May 2011 www.proshareng.com Page72
timer) will come back: He will have to be convinced before he foretells the
outcome. But in the case of a banker, he will not only depend on seeming
predictability but will also adopt good risk management skills.
May 5 CAC investigates Okomu Oil - Owing to a petition from Shareholders Association,
the Corporate Affairs Commission (CAC) in Abuja has commenced investigation into
the affairs of the agricultural produce processing company, Okomu Oil Palm Plc
located at Udo in Ovia Southwest Local Government Area of Edo state.
Reforms: Fitch Threatens to Downgrade Nigeria’s Ratings - Global ratings
agency, Fitch Ratings has threatened to downgrade Nigeria’s rating to B+ from BB-
if the newly-elected government fails to implement badly needed reforms post-elections, to improve the country’s outlook.
Foreign investment firm contests acq uisition of Afribank by Vine Capital - A
private investment partner, Intangis Holdings, with main offices in New York and
London is claiming exclusive rights of acquisition on Afribank, saying that the
negotiations to that effect have almost been completed for consummation of
transactions.
36 20 At the close of trading session, the NSE All-Shar
Index moved up by 0.59% to close at 25,219.69 a
against offbeat by 0.05% recorded previous sessio
to close at 25,072.92. In the same vein, marke
capitalization appreciated by N46.99billio
(US$302.57million) to close at N8.06trillio
(US$51.99billion) as against depreciation b
N3.62billion (US$23.41million) recorded o
preceding session to close at N8.02trillio
(US$51.69billion). Market report for the day watitled: NSE ASI recorded +0.59% gain after
day profiteering
(https://www.proshareng.com/news/singlen
ws.php?id=13768)
May 6 Botched deals: AMCON may recapitalise Oceanic, Bank PHB – Sanusi - The
Governor of the CBN, Mr. Lamido Sanusi, has said that the AMCON may recapitalise
Oceanic Bank International Plc and Bank PHB Plc to prepare them for sale in the
near future if they don’t get good recapitalisation deals.
CBN to sell N134bn T-bills - The CBN has said that it plans to sell N134.27bn
($867m) in 91-182- and 364-day treasury bills next Wednesday at its usual bi-
monthly auction.
CBN to limit interest-rate increases to spur lending - CBN Governor Sanusi
Lamido Sanusi has indicated the apex bank may limit interest-rate increases to help
spur lending, especially as demand for foreign currency eases, reducing pressure on
the naira.
New investors coming for eight rescued banks, says CBN - The Governor of
35 19 The key benchmark indices moved up by 0.18% open the week on positive note with positive bread
while market indicators closed mixed. The secon
session recorded increased sell mandates as markpulled back marginally by-0.05%.
However, the bulls reclaimed the centre stage
bargain hunters maintained steamed efforts wh
sentiments remained positive on Thursday an
Friday with resilient market breadth as ke
benchmark indices sustained the uptrend by 0.59
and 0.32% respectively to close above 20, 50 an
200days moving averages at 25, 300.46- a bullis
trend. Market report for the week was titled: NS
ASI sustains uptrend, trading above 50 and 20

8/6/2019 NCM Report May 2011- Proshare
http://slidepdf.com/reader/full/ncm-report-may-2011-proshare 73/81
The Monthly NCM Report for May 2011 www.proshareng.com Page73
the CBN, Sanusi Lamido Sanusi, has said all the eight banks rescued with N620
billion bailout funds will find new investors, with four of them already agreeing in
principle to merge.
days moving average
(https://www.proshareng.com/news/singlen
ws.php?id=13779)
May 9 AMCON intervention yet to stimulate bank lending - Growth in lending by
banks is still low in spite of the successful takeover of their non-performing loans
by the AMCON, a development that is partly attributed to the low economic
activities in the first quarter and banks’ cautious steps at growing loan portfolio.
NSE: Stockbrokers express confidence in new management - The Association
of Stockbroking Houses of Nigeria has expressed confidence in the new
administration of the NSE.
Inter-bank rates fall on inflow from AMCON - The Nigerian inter-bank lendingrates fell to an average of 8.41 per cent from 10.41 per cent on Friday, after
liquidity from repurchased AMCON’s bonds raised cash level in the system, a trader
told Reuters.
33 21 At the close of trading session, the NSE All-Shar
Index dropped by -0.15% to close at 25,262.50 a
against an upbeat by 0.32% recorded previou
session to close at 25,300.46. In the same vei
market capitalization depreciated b
N12.13billion (US$82.21million) to close
N8.07trillion (US$54.70billion) as again
appreciation by N25.80billion (US$174.89million
recorded on preceding session to close
N8.08trillion (US$54.78billion). Market report for thday was titled: NSE ASI pulls back by -0.15% a
heavy weight stocks experienced volatilit
(https://www.proshareng.com/news/singlen
ws.php?id=13784)
May 10 RenCap : Nigerian Banks Sitting on Excess Liquidity - Following the cautious
loan portfolio growth adopted by banks after the crisis that rocked the industry,
analysts at Renaissance Capital (RenCap) have speculated that Nigerian banks are
sitting on too much liquidity.
Nigerian naira eases after Central Bank forex auction - The Nigerian naira
eased against the U.S dollar on the interbank market on Monday after the CBN sold
dollars at a higher rate than last week at its foreign exchange auction.
FGN bonds record N3.2tr transactions in four months - Between January and
April 2011, transactions on FGN bonds through the Over-The-Counter (OTC) market
of NSE were 3.54 billion units valued at N3.2 trillion in 25,082 deals.
32 19 At the close of trading session, the NSE All-SharIndex gained by 0.67% to close at 25,432.93 a
against a decline by -0.15% recorded previousession to close at 25,262.50. In the same vei
market capitalization appreciated bN54.45billion (US$369.07million) to close
N8.12trillion (US$55.07billion) as againdepreciation by N12.13billion (US$82.21million
recorded on preceding session to close N8.07trillion (US$54.70billion). Market report for th
day was titled: Equity Market gains by 0.68% aUACN Plc leads gainers’ char
(https://www.proshareng.com/news/singlenws.php?id=13787)
May 11 Inflation huge challenge for Nigeria, says CBN - Fighting inflation is likely to
be a challenge for Nigeria this year, but growth could top 7 percent if power and
36 22 At the close of trading session, the NSE All-Shar
Index gained by 0.18% to close at 25,478.17 aagainst an upbeat by 0.67% recorded previou
session to close at 25,432.93. In the same vei

8/6/2019 NCM Report May 2011- Proshare
http://slidepdf.com/reader/full/ncm-report-may-2011-proshare 74/81
The Monthly NCM Report for May 2011 www.proshareng.com Page74
other reforms go ahead, Sanusi Lamido Sanusi, CBN governor said yesterday.
Banks may shrink to 20, says CBN - The number of banks (24) in the country
may shrink to 21 or 20 after the reforms, the CBN Governor, Sanusi Lamido Sanusi,
said yesterday.
SEC to Facilitate Single W’African Stock Exchange - The Chairman of the
Board of the SEC, Senator Udoma Udo Udoma, has said SEC was working with
other regulators in the West African region to facilitate the formation of a single
stock exchange in order to take care of the challenges of cross border listings on
exchanges in the region.
market capitalization appreciated bN14.45billion (US$97.96million) to close
N8.14trillion (US$55.17billion) as againappreciation by N54.45billion (US$369.07millionrecorded on preceding session to close N8.12trillion (US$55.07billion). Market report for thday was titled: NSE ASI climbs further b y 0.18%
as Guinness Plc grows its Q3’11 PAT b31.97%.
(https://www.proshareng.com/news/singlenws.php?id=13803)
May 12 Sovereign wealth fund to check profligacy, say analysts - The Senate
yesterday passed a bill to create a sovereign wealth fund, paving the way for the
three-tiers of government to improve the management of windfall crude oil
earnings
Sale of Banks: Shareholders Lose Bid to Stop CBN - Attempt by a group of
shareholders of banks under the auspice of Registered Trustees of Proactive
Shareholders Association of Nigeria to stop the proposed sale of some sick and
distressed banks by CBN to private investors has suffered a setback as a Federal
High Court in Abuja has struck out their suit for incompetence.
Senate approves N150bn take-off grant for Sovereign Wealth Fund -
Apparently jolted by THE PUNCH’s exclusive reports that some members of the
National Assembly had demanded a N2.5bn bribe for the passage of the Petroleum
Industry and Sovereign Wealth Fund bills, the Senate, on Wednesday, hurriedly
passed the latter.
28 30 At the close of trading session, the NSE All-Shar
Index gained by 1.01% to close at 25,736.37 aagainst an upbeat by 0.18% recorded previou
session to close at 25,478.17. In the same veimarket capitalization appreciated b
N82.50billion (US$559.13million) to close N8.22trillion (US$55.73billion) as again
appreciation by N14.45billion (US$97.96millionrecorded on preceding session to close N8.14trillion (US$55.17billion). Market report for thday was titled: ASI maintains strong hold abov
moving averages as YTD strengthens at 2.52%(https://www.proshareng.com/news/singlenws.php?id=13813)
May 13 How we’ll run Sovereign Wealth Fund, by Aganga - The Minister of Finance,
Mr. Segun Aganga, yesterday, described the Sovereign Wealth Fund, SWF, as a
win-win situation and explained that it would be managed in a transparent, prudent
and accountable manner to create an avenue for an accelerated transformation of
the nation’s economy.
Cadbury refuses dividend to shareholders - Shareholders of Cadbury Nigeria
29 32 The All-Share Index in the week under review gaine
by 2.03% to close at 25,813.71 as against a
upbeat of 1.03% recorded last week to close
25,300.46.
In the same vein, the market capitalization in th
week appreciated by N163.99 billion (US$1.11billio

8/6/2019 NCM Report May 2011- Proshare
http://slidepdf.com/reader/full/ncm-report-may-2011-proshare 75/81
The Monthly NCM Report for May 2011 www.proshareng.com Page75
Plc were jolted on Thursday when the board and management of the company said
there is no dividend payment despite huge earnings, about N29.17 billion recorded
by the confectionary company in the 2010 financial year.
Electronic trading platform debuts in Nigeria - The Financial Markets Dealers
Association (FMDA) in collaboration with ICAP of South Africa, has concluded plans
to launch the Inter-Dealer Brokerage Service (IDB), designed to accommodate
voice and electronic trading.
to close at N8.24 trillion (US$ 55.89billion) a
against appreciation of N83.10 billio
(US$563.23million) recorded last week to close
N8.08 trillion (US$ 54.78billion). Market report f
the week was titled: NSE ASI strengthen
position with 2.03% gain for the week as ral
continues.
(https://proshareng.com/news/singlenews.p
p?id=13822)
May 16 Onyema, Brokers to Meet Over Progress of N SE-Preparatory to the unveiling of
his agenda that will transform the Nigerian Stock Exchange (NSE), the Chief
Executive Officer of the Exchange, Mr. Oscar Onyema is set to meet with Chief
Executive officers (CEOs) of dealing member firms of the Exchange this week.
Onyema Restates Promise to Transform NSE- The Chief Executive Officer of
the Nigerian Stock Exchange (NSE), Mr. Oscar Onyema, has reiterated the
commitment of the new management of the Exchange to transform the nation’s
capital market into the gateway to African frontier markets.
Banks Increase Rates on Risk Assets- Banks have increased lending rates in
response to the ever-increasing high cost of operations in the country.
24 23 At the close of trading session, the NSE All-SharIndex gained by 0.05% to close at 25,826.50 a
against an upbeat by 0.30% recorded previousession to close at 25,813.71. In the same veimarket capitalization appreciated by N4.08billio(US$27.68million) to close at N8.25trillio
(US$55.92billion) as against appreciation bN24.71billion (US$167.49million) recorded o
preceding session to close at N8.24trillio(US$55.89billion). Market report for the day wa
titled: Nigerian Capital Market records modegain of 0.05% as weak bargain sets in
(https://proshareng.com/news/13833)
May 17 Court stops CBN, others from selling Finbank - A FederaL High Court, Lagos,
yesterday restrained the CBN, Finbank Plc, First City Monument Bank (FCMB) and
directors of Finbank from “selling or howsoever taking any steps and/or further
steps to dispose and /or sell in any manner whatsoever Finbank Plc to FCMB.
CBN spends $2.2bn defending naira in April - The CBN in April spent $2.2
billion dollar defending the naira as it battles to contain rising inflation and maintain
a decent foreign reserve level.
Naira appreciates on CBN dollar supp ort - The naira strengthened against the
24 31 At the close of trading session, the NSE All-SharIndex dropped by -0.02% to close at 25,821.85 aagainst an upbeat by 0.05% recorded previou
session to close at 25,826.50. In the same veimarket capitalization depreciated by N1.48billio(US$10.06million) to close at N8.25trillio(US$55.91billion) as against appreciation b
N4.08billion (US$27.68million) recorded opreceding session to close at N8.25trillio
(US$55.92billion). Market report for the day watitled: Profiteering ends five days rall y as Cono
Plc rewards investors with N2.00 dividendhttps://www.proshareng.com/news/singleNe
ws.php?id=13838)

8/6/2019 NCM Report May 2011- Proshare
http://slidepdf.com/reader/full/ncm-report-may-2011-proshare 76/81
The Monthly NCM Report for May 2011 www.proshareng.com Page76
dollar on the interbank market yesterday, after the CBN increased dollar supply
from its bi-weekly auction, traders said.
May 18 Inflation Drops to 11.6%, Says NBS - The year-on-year inflation rate in the
country declined to 11.6 per cent in April from 12.8 per cent, it recorded in March,
a report from the National Bureau of Statistics (NBS).
Divestment Order: NAICOM Moves to Shore-up Stakeholders’ Confidence -
NAICOM has explained why it had to set up an eight-man committee to review the
divestment of banks from insurance companies, saying it was meant to ensure that
the exercises will not lead to loss of confidence in the insurance industry.
Dangote Group to build additional 10 cement plants in Africa - Dangote
Group’s recent $4 billion investment agreement with Sinoma International
Engineering Company of China is expected to add another 10 cement plants to
boost production capacity in Africa
32 25 At the close of trading session, the NSE All-Shar
Index dropped by -0.12% to close at 25,788.06 a
against a decline by -0.02% recorded previou
session to close at 25,821.85. In the same vei
market capitalization depreciated b
N10.79billion (US$73.17million) to close
N8.23trillion (US$55.84billion) as again
depreciation by N1.48billion (US$10.06million
recorded on preceding session to close
N8.25trillion (US$55.91billion). Market report for th
day was titled: NSE ASI dips further by -0.13%
as profiteering continue
(https://www.proshareng.com/news/singleN
ws.php?id=13849)
May 19 AMCON to buy bad loans at punitive prices - Determined to stall a recurrence
of the banking crisis that led to the sack of eight bank CEOs and almost brought the
entire industry to its knee, the Asset AMCON, in conjunction with the CBN, has
declared that any bank whose non-performing loans (NPLs) exceed five percent of
total loans will henceforth have i ts bad loans bought at punitive prices.
Lafarge’s expansion drive brightens profitability prospect - Lafarge Cement
WAPCO Nigeria Plc has said that its recent investment in projects aimed at
expanding the business would translate to huge profitability for its shareholders
soon.
12 banks gave out N5.24tn loans in 2010 - The total value of loans and
advances of the 12 publicly-quoted banks that passed the Central Bank of Nigeria’s
stress test increased by 7.82 per cent, from N4.86tn in 2009 to N5.24tn in 2010.
19 31 At the close of trading session, the NSE All-SharIndex dropped by -0.27% to close at 25,717.73 a
against a decline by -0.12% recorded previousession to close at 25,788.06. In the same vei
market capitalization depreciated b
N22.47billion (US$152.31million) to close N8.21trillion (US$55.69billion) as againdepreciation by N10.79billion (US$73.17million
recorded on preceding session to close N8.23trillion (US$55.84billion). Market report for th
day was titled: Market CAP sheds N34.75 billioin 3days as Aso Savings Plc tops volume
(https://www.proshareng.com/news/singleNws.php?id=13859)
May 20 NSE Moves to Deepen Capital Market- In a bid to ensure good corporate
governance and attract multinational companies to list their shares, the NigerianStock Exchange (NSE) has strengthened its Council by appointing 10 new
25 32 The All-Share Index in the week under revie
dropped by -0.09% to close at 25,790.64 a
against an upbeat of 2.03% recorded last week

8/6/2019 NCM Report May 2011- Proshare
http://slidepdf.com/reader/full/ncm-report-may-2011-proshare 77/81
The Monthly NCM Report for May 2011 www.proshareng.com Page77
members.
Experts Predict Boom for African Economies- With the current position of things in some African countries, the continent will, in the nearest futureoutpace
the growth enjoyed by Asiaand many continents of the world, Chief Executive
Officer of Renaissance Capital, Mr. Stephen Jennings has said.
NSE Council co-opt Rew ane, Ufot, Ogunbanjo, others- THE Council of Nigerian
Stock Exchange (NSE) has co-opted ten members into its fold as part of strategies
to boost its oversight functions.
close at25,813.71.
In the same vein, the market capitalization in thweek depreciated by N7.37 billion (US$49.96millio
to close at N8.24 trillion (US$ 55.84billion) a
against appreciation of N163.99 billio
(US$1.11billion) recorded last week to close at N8.2
trillion (US$ 54.89billion). Market report for the wee
was titled: Profiteering dips Market by -0.09%
for the week as MRS Plc rewards investors wit
N1.25kobo.
(https://www.proshareng.com/news/singleN
ws.php?id=13874)
May 23 N584bn corporate debt financing tied down in pension asse ts- There may be
as much as N584 billion in pension assets that could be deployed to corporate debt
financing lying idle in pension assets.
Capacity utilisation in food, beverage, tobacco sector drops- The average
capacity utilisation in food, beverage and tobacco sector of the Nigerian economy
dropped in year 2010 to 63 percent from 66 percent in 2009.
Global Fleet takes over Oceanic Bank Sao Tome- GLOBAL Fleet Group, at the
weekend, took over 100 per cent shareholding of Oceanic Bank, Sao Tome. The
bank was handed over to Global Fleet’s Chief Executive Officer, Jimoh Ibrahim, as
the new Chairman, at a completion board meeting in Sao Tome, on Friday.
21 29 At the close of trading session, the NSE All-Shar
Index dropped by -0.11% to close at 25,762.67 a
against an upbeat by 0.28% recorded previou
session to close at 25,790.64. In the same vei
market capitalization depreciated by N8.93billio
(US$60.56million) to close at N8.23trillio
(US$55.78billion) as against appreciation b
N23.29billion (US$157.89million) recorded o
preceding session to close at N8.24trillio
(US$55.84billion). Market report for the day wa
titled: : NSE ASI pulls back by -0.11% a
Sterling Bank Plc leads decliners’ chart
https://www.proshareng.com/news/singleNe
ws.php?id=13885)
May 24 Investor Dump OTC Bonds for New Issues- The Over-the-Counter (OTC) bond
market of the NSE, again suffered a setback last week as investors dump their
holding to participate in new issues by the Debt Management Office (DMO).
Corporate Trustees hail SEC on market development-The President of the
Association of Corporate Trustees (ACT), Mrs. Oluwatoyin Sanni has commended
the Securities and SEC on its efforts in the area of market development,
21 30 At the close of trading session, the NSE All-Shar
Index dropped by -0.09% to close at 25,738.80 a
against a decline by -0.1% recorded previous sessio
to close at 25,762.67. In the same vein, marke
capitalization depreciated by N7.62billio
(US$51.69million) to close at N8.22trillio
(US$55.73billion) as against depreciation b
N8.93billion (US$60.56million) recorded o
preceding session to close at N8.23trillio

8/6/2019 NCM Report May 2011- Proshare
http://slidepdf.com/reader/full/ncm-report-may-2011-proshare 78/81
The Monthly NCM Report for May 2011 www.proshareng.com Page78
monitoring, supervision and rules making.
CBN may nullify Vine Capital, Afribank MoU - The Memorandum of
Understanding recently signed by Afribank Plc and Vine Capital Partners Limited as
regards the recapitalisation of the former may be cancelled, following the
disapproval of the deal by the Central Bank of Nigeria.
(US$55.78billion). Market report for the day wa
titled: NSE ASI dips further by -0.09% a s Wem
Bank Plc leads decliners’ chart
https://www.proshareng.com/news/singleNe
ws.php?id=13888)
May 25 MPC tightens further, raises MPR to 8% - The Central Bank of Nigeria (CBN) on
Tuesday, for the third time this year, raised the Monetary Policy Rate (MPR) by 50
basis points to 8 percent in what it described as “its continued efforts at checking
excess liquidity in the economy.”
Foreign investment: US tells Nigeria to tackle bribery - Nigeria needs to
address the issue of bribery to sustain the interest of foreign investors in its
economy, the United States Consul-General in Nigeria, Mr. Joseph Stafford, has
said.
Direct Payment of Investors for Shares Under Threat-The new initiative called
Straight Through Process (STP), in which the CSCS Limited credits investors’
accounts directly with the proceeds of sale of the shares is under threat.
15 36 At the close of trading session, the NSE All-Shar
Index dropped by -0.47% to close at 25,618.53 aagainst a decline by -0.09% recorded previou
session to close at 25,738.80. In the same veimarket capitalization depreciated b
N38.42billion (US$260.43million) to close N8.18trillion (US$55.47billion) as again
depreciation by N7.62billion (US$51.69millionrecorded on preceding session to close
N8.22trillion (US$55.73billion). Market report for thday was titled: Market CAP dips by N54.99bn i
3days as Unity Bank Plc rewards investors witcash & bonu
(https://www.proshareng.com/news/singleNws.php?id=13895)
May 26 Bank stocks decline on back of MPC decisions - Bank stocks fell to a six-week
low yesterday in response to tight monetary measures reeled out by the Monetary
Policy Committee (MPC) on Tuesday.
MPC hike will enhance forex exchange stability-Khan - The 50 basis points
increase in the Monetary Policy Rate (MPC) to 8.0 per cent and the increase in the
cash reserve requirement of banks would enhance stability of the foreign exchange
markets, says Razia Khan In a bid to further tighten money supply in the economy,
the Central Bank of Nigeria (CBN on Tuesday announced the second increase in the
MPR to 8.0 per cent from 7.5 per cent, citing “need to address inflationary
expectations associated with excessive liquidity and pressure on foreign exchange
market”.
‘New interest rate will have little effect on stocks' - The new interest rate
announced recently by the nation's Monetary Policy Committee (MPC) will have
little effect on the trading performance at the Nigerian Stock Exchange (NSE),
31 26 At the close of trading session, the NSE All-Shar
Index gained by 0.38% to close at 25,716.84 a
against a decline by -0.47% recorded previousession to close at 25,618.53. In the same vei
market capitalization appreciated b
N36.94billion (US$250.51million) to close
N8.22trillion (US$55.72billion) as again
depreciation by N38.42billion (US$260.43million
recorded on preceding session to close
N8.18trillion (US$55.47billion). Market report for th
day was titled: : NSE ASI snaps a three-da
losing streak as AG Leventis Plc leads gainer
chart.(
https://www.proshareng.com/news/singleNews.php?id=13904)

8/6/2019 NCM Report May 2011- Proshare
http://slidepdf.com/reader/full/ncm-report-may-2011-proshare 79/81
The Monthly NCM Report for May 2011 www.proshareng.com Page79
analysts at Cordros Capital, a stockbroking firm, have said.
May 27 Tourist company's shares hold investors' interest - Trading activities in theshares of Tourist Company of Nigeria boosted market volume yesterday as the
quantity of shares transacted during the day rose by 169.64 per cent, as against
the decline recorded in the last three trading days.
Crisis: Rescued banks’ cumulative share price drops by 71% –
Investigation - The cumulative share price of the nine Deposit Money Banks
rescued by the Central Bank of Nigeria between August and October 2009 has
depreciated by 71 per cent from its pre-crisis level, an investigation by our
correspondent has revealed.
Banks spend N114.5bn on cash manageme nt — CBN - The Governor, CentralBank of Nigeria, Mr. Lamido Sanusi, has said that the Nigerian banking industry
spends N114.5bn annually on cash management.
21 36 The All-Share Index in the week under review gaine
by 0.15% to close at 25,829.75 as against
decline of -0.09% recorded last week to clos
at25,790.64.
In the same vein, the market capitalization in th
week appreciated by N18.07 billio
(US$122.49million) to close at N8.25 trillion (US
55.97billion) as against depreciation of N7.37 billio
(US$49.96million) recorded last week to close
N8.24 trillion (US$ 54.84billion). Market report f
the week was titled: NSE ASI turns green b0.15% for the week ahead presidenti
inauguration(https://www.proshareng.com/n
ws/singlenews.php?id=13905)
May 31 Banks’ recapitalisation under threat as more merger talks collapse - The
recapitalisation process of Deposit Money Banks that failed the CBN’s stress test
may be under threat, following the inability of some of the rescued banks to finalise
their different merger deals.
MPR increase may discourage capital market investors – Analysts - The
recent increase in the Monetary Policy Rate by the Monetary Policy Committee of
the CBN may affect investment on the NSE, analysts have said. The analysts said
that the rate increase could make investors abandon the capital market for the
money market.
Court restrains CBN from sacking Afribank’s chairman - A Federal High Court
in Lagos has restrained the CBN and its governor, Sanusi Lamido Sanusi from
giving effect to a letter purporting to remove Osa Osunde as Chairman of Afribank
Nigeria Plc.Justice James Tsoho, in a ruling on an ex-parte application by Osunde
last week, also suspended the purported letter dated May 12, 2011 and held that
Osunde was at liberty to remain in office as a director and Chairman of Afribank.
24 29 At the close of trading session, the NSE All-Shar
Index gained by 0.14% to close at 25,866.62 a
against an upbeat by 0.44% recorded previou
session to close at 25,829.75. In the same vei
market capitalization appreciated b
N11.78billion (US$79.88million) to close
N8.27trillion (US$56.05billion) as again
appreciation by N36.10billion (US$244.68million
recorded on preceding session to close
N8.25trillion (US$55.97billion). Market report for th
day was titled: NSE ASI climbs further b y 0.14%
as MTD stands at 3.11%
(http://www.proshareng.com/news/singlene
ws.php?id=13914)

8/6/2019 NCM Report May 2011- Proshare
http://slidepdf.com/reader/full/ncm-report-may-2011-proshare 80/81
The Monthly NCM Report for May 2011 www.proshareng.com Page80
ADVICE TO USERS OF THIS REPORTYou are given the limited right to print this report and todistribute it by any means. You can print out pages and usethem in your private discussion groups as long as youacknowledge PROSHARE and you do not alter the reportin any way. Most importantly, you should not charge for it.
Stock trading is inherently risky and you agree to assumecomplete and full responsibility for the outcomes of alltrading decisions that you make, including bu t not limitedto loss of cap ital. None o f the stock trading cal ls made byProshare, its analyst board, employees, contributingpartners and companies associated with it should be
construed as an offer to buy o r sell securities, nor advice todo so. Proshare is not responsible for any errors,omissions or representations on any of the pages in thisreport. Proshare does not endorse in anyway anyadvertisers or firm(s) used as case studies in the report.Please verify the veracity of all information on your ownbefore undertaking any alliance.
Our opinions and analyses are based on sources believedto be reliable and are written in good faith, but norepresentation or warranty, expressed or impli ed, is madeas to their accuracy or completeness. The information inthis report is updated from time to time. Proshare howeverexcludes any warranties (whether expressed or implied),as to the quality, accuracy, efficacy, completeness,performance, fitness or any of the contents of the report,including (but not limited) to any comments, feedback,interviews, articles reproduced and advertisementscontained in the report.
All information contained in our report or on our websiteshould be independently verified with the companiesmentioned.
The editor and publisher a re not responsible for errors oromissions. You should consult a qualified broker or otherfinancial advisor prior to making any actual investment ortrading decisions. You agree to not make actual stocktrades based on comments in the report, nor on anytechniques presented nordiscussed in this report or anyother form of information presentation. All information is
for educational and informational use only. You agree toconsult with a registered investment advisor, which we arenot, prior to making any trading decision of any kind.Hypothetical or simulated performance results havecertain inherent limitations. Unlike an actual pe rformancerecord, simulated results do not represent actual trading.Since the trades have no t been executed, the results mayhave under or over compensated for the impact. Norepresentation is being made that any account will or islikely to achieve profits or losses similar to those shown inthe report.
Proshare receives no compensation of any kind from anycompanies that may be mentioned in our reports or on ourweb site. Any opinions expressed are subject to changewithout notice. Owners, employees and writers may holdpositions in the securities that are discussed in our reportor on our web site. Any reference to a trade mentioned inthe report or website, e-mail, publication or material is
hypothetical and is not an actual trade. Hypotheticalperformances and results do no t represent actual cost of atrade.
We encourage all investors to use the information in thereport as a resource only to further their own research onall featured companies, stocks, sectors, markets andinformation presented in the report and on our site.
Nothing published in this report and on our site should beconsidered as investment advice. Any prediction made onthe direction of the stock market or on the direction ofind iv idual s tocks may prove to be incor rectReaders/Users/visitors are expected to refer to other
investment resources to verify the accuracy of the data
published in the report on their own. Neither Proshare noits principals, agents, associates, employees or licensedstockbrokers, are licensed to provide investment advicethrough this publication.
No materials in the report, either on behalf of Proshare, o
any participant in The Analyst Network should be taken ainvestment advice directly, indi rectly, implicitly, or in a nymanner whatsoever, including but not limited to trading ofstocks on a short term or long term basis, or trading of anfinancial instruments whatsoever. Past Performance IsNot Indicative of Future Returns. All analyst commentaryprovided in this report is provided for information purposesonly. This information is NOT a recommendation orsolicitation to buy or sell any securities. Your use of thisand all in formation contained in this report is governed bythis Terms and Cond itions of Use. This material is basedupon information that we consider reliable, but we do notrepresent that it is accurate or complete, and that it shouldbe relied upon , as such.
You should not rely solely on the Information in making anyinvestment. Rather, you should use the Information onlyas a starting point for doing additional independentresearch in order to allow you to form your own opinionregarding investments. By using this report including anysoftware and content contained therein, you agree thatuse of the Service is entirely at your own risk. Anyinformation, opinions, advice o r offers posted
by any person or entity logged in to the Proshare websiteor any of its associated sites is to be construed as publicconversation only. Proshare makes no warranties andgives no assurances regarding the truth, timeliness,reliability, or good faith of any material posted at Proshare.
Proshare Nigeria is the country's premier investor
relations/education and analyst services platformproviding a critical role in ensuring that market confidenc& safety is enshrined in the conduct of/and market relianceon the information and activities of firms quoted on theNigerian Stock Exchange; as a wealth creator for theinvesting public. In delivering this service, the firm workswith and through organisations with distinct servicecompetencies in stock investment analysis, investor toolsand solutions and capital market practices; all designed toprovide investors with a credible resource for intelligendecision making.
The firm takes extra steps to ensure that informationprovided by it are accurate, fact checked and valida ted focompliance with internationally acceptable standards andpractices. While this report is checked for accuracy, we arenot liab le for any incorrect information included. Werecommend that you make enquiries based on your owcircumstances and, if necessary, seek professional advice
before entering into transactions. We are always happy toreceive your comments on how we can improve ouservices and make it more meaningful to the investingpublic. Should you be interested in contacting us fofurther discussions on how such reports can be mademore meaningful to you or your organisation/investmentclub; kindly [email protected]

8/6/2019 NCM Report May 2011- Proshare
http://slidepdf.com/reader/full/ncm-report-may-2011-proshare 81/81
irs
AnalystService
news & investigations
OnlineOnline
Training