Embed Size (px)
Citation preview

Manual for Emulsion-Based Chip Seals for Pavement
Preservation
NATIONALCOOPERATIVE HIGHWAYRESEARCH PROGRAMNCHRP
REPORT 680

TRANSPORTATION RESEARCH BOARD 2011 EXECUTIVE COMMITTEE*
OFFICERS
CHAIR: Neil J. Pedersen, Administrator, Maryland State Highway Administration, Baltimore VICE CHAIR: Sandra Rosenbloom, Professor of Planning, University of Arizona, TucsonEXECUTIVE DIRECTOR: Robert E. Skinner, Jr., Transportation Research Board
MEMBERS
J. Barry Barker, Executive Director, Transit Authority of River City, Louisville, KYLarry L. Brown, Sr., Executive Director, Mississippi DOT, JacksonDeborah H. Butler, Executive Vice President, Planning, and CIO, Norfolk Southern Corporation, Norfolk, VAWilliam A.V. Clark, Professor, Department of Geography, University of California, Los AngelesEugene A. Conti, Jr., Secretary of Transportation, North Carolina DOT, RaleighJames M. Crites, Executive Vice President of Operations, Dallas-Fort Worth International Airport, TXPaula J. Hammond, Secretary, Washington State DOT, OlympiaAdib K. Kanafani, Cahill Professor of Civil Engineering, University of California, BerkeleySusan Martinovich, Director, Nevada DOT, Carson CityMichael R. Morris, Director of Transportation, North Central Texas Council of Governments, ArlingtonTracy L. Rosser, Vice President, Regional General Manager, Wal-Mart Stores, Inc., Mandeville, LASteven T. Scalzo, Chief Operating Officer, Marine Resources Group, Seattle, WAHenry G. (Gerry) Schwartz, Jr., Chairman (retired), Jacobs/Sverdrup Civil, Inc., St. Louis, MOBeverly A. Scott, General Manager and CEO, Metropolitan Atlanta Rapid Transit Authority, Atlanta, GADavid Seltzer, Principal, Mercator Advisors LLC, Philadelphia, PA Lawrence A. Selzer, President and CEO, The Conservation Fund, Arlington, VAKumares C. Sinha, Olson Distinguished Professor of Civil Engineering, Purdue University, West Lafayette, INDaniel Sperling, Professor of Civil Engineering and Environmental Science and Policy; Director, Institute of Transportation Studies; and Interim
Director, Energy Efficiency Center, University of California, DavisKirk T. Steudle, Director, Michigan DOT, LansingDouglas W. Stotlar, President and CEO, Con-Way, Inc., Ann Arbor, MIC. Michael Walton, Ernest H. Cockrell Centennial Chair in Engineering, University of Texas, AustinCarolann D. Wicks, Secretary, Delaware DOT, Dover
EX OFFICIO MEMBERS
Peter H. Appel, Administrator, Research and Innovative Technology Administration, U.S.DOTJ. Randolph Babbitt, Administrator, Federal Aviation Administration, U.S.DOTRebecca M. Brewster, President and COO, American Transportation Research Institute, Smyrna, GAGeorge Bugliarello, President Emeritus and University Professor, Polytechnic Institute of New York University, Brooklyn; Foreign Secretary,
National Academy of Engineering, Washington, DCAnne S. Ferro, Administrator, Federal Motor Carrier Safety Administration, U.S.DOT John T. Gray, Senior Vice President, Policy and Economics, Association of American Railroads, Washington, DCJohn C. Horsley, Executive Director, American Association of State Highway and Transportation Officials, Washington, DCDavid T. Matsuda, Deputy Administrator, Maritime Administration, U.S.DOTVictor M. Mendez, Administrator, Federal Highway Administration, U.S.DOTWilliam W. Millar, President, American Public Transportation Association, Washington, DCTara O’Toole, Under Secretary for Science and Technology, U.S. Department of Homeland Security, Washington, DCRobert J. Papp (Adm., U.S. Coast Guard), Commandant, U.S. Coast Guard, U.S. Department of Homeland Security, Washington, DCCynthia L. Quarterman, Administrator, Pipeline and Hazardous Materials Safety Administration, U.S.DOTPeter M. Rogoff, Administrator, Federal Transit Administration, U.S.DOTDavid L. Strickland, Administrator, National Highway Traffic Safety Administration, U.S.DOTJoseph C. Szabo, Administrator, Federal Railroad Administration, U.S.DOTPolly Trottenberg, Assistant Secretary for Transportation Policy, U.S.DOTRobert L. Van Antwerp (Lt. Gen., U.S. Army), Chief of Engineers and Commanding General, U.S. Army Corps of Engineers, Washington, DCBarry R. Wallerstein, Executive Officer, South Coast Air Quality Management District, Diamond Bar, CA
*Membership as of February 2011.

TRANSPORTAT ION RESEARCH BOARDWASHINGTON, D.C.
2011www.TRB.org
N A T I O N A L C O O P E R A T I V E H I G H W A Y R E S E A R C H P R O G R A M
NCHRP REPORT 680
Subscriber Categories
Maintenance and Preservation
Manual for Emulsion-Based Chip Seals for Pavement
Preservation
Scott Shuler Anthony Lord
COLORADO STATE UNIVERSITY
Fort Collins, CO
Amy Epps-MartinDenise Hoyt
TEXAS A&M UNIVERSITY
College Station, TX
Research sponsored by the American Association of State Highway and Transportation Officials in cooperation with the Federal Highway Administration

NATIONAL COOPERATIVE HIGHWAYRESEARCH PROGRAM
Systematic, well-designed research provides the most effective
approach to the solution of many problems facing highway
administrators and engineers. Often, highway problems are of local
interest and can best be studied by highway departments individually
or in cooperation with their state universities and others. However, the
accelerating growth of highway transportation develops increasingly
complex problems of wide interest to highway authorities. These
problems are best studied through a coordinated program of
cooperative research.
In recognition of these needs, the highway administrators of the
American Association of State Highway and Transportation Officials
initiated in 1962 an objective national highway research program
employing modern scientific techniques. This program is supported on
a continuing basis by funds from participating member states of the
Association and it receives the full cooperation and support of the
Federal Highway Administration, United States Department of
Transportation.
The Transportation Research Board of the National Academies was
requested by the Association to administer the research program
because of the Board’s recognized objectivity and understanding of
modern research practices. The Board is uniquely suited for this
purpose as it maintains an extensive committee structure from which
authorities on any highway transportation subject may be drawn; it
possesses avenues of communications and cooperation with federal,
state and local governmental agencies, universities, and industry; its
relationship to the National Research Council is an insurance of
objectivity; it maintains a full-time research correlation staff of
specialists in highway transportation matters to bring the findings of
research directly to those who are in a position to use them.
The program is developed on the basis of research needs identified
by chief administrators of the highway and transportation departments
and by committees of AASHTO. Each year, specific areas of research
needs to be included in the program are proposed to the National
Research Council and the Board by the American Association of State
Highway and Transportation Officials. Research projects to fulfill these
needs are defined by the Board, and qualified research agencies are
selected from those that have submitted proposals. Administration and
surveillance of research contracts are the responsibilities of the National
Research Council and the Transportation Research Board.
The needs for highway research are many, and the National
Cooperative Highway Research Program can make significant
contributions to the solution of highway transportation problems of
mutual concern to many responsible groups. The program, however, is
intended to complement rather than to substitute for or duplicate other
highway research programs.
Published reports of the
NATIONAL COOPERATIVE HIGHWAY RESEARCH PROGRAM
are available from:
Transportation Research BoardBusiness Office500 Fifth Street, NWWashington, DC 20001
and can be ordered through the Internet at:
http://www.national-academies.org/trb/bookstore
Printed in the United States of America
NCHRP REPORT 680
Project 14-17ISSN 0077-5614ISBN 978-0-309-15539-7Library of Congress Control Number 2011921469
© 2011 National Academy of Sciences. All rights reserved.
COPYRIGHT INFORMATION
Authors herein are responsible for the authenticity of their materials and for obtainingwritten permissions from publishers or persons who own the copyright to any previouslypublished or copyrighted material used herein.
Cooperative Research Programs (CRP) grants permission to reproduce material in thispublication for classroom and not-for-profit purposes. Permission is given with theunderstanding that none of the material will be used to imply TRB, AASHTO, FAA, FHWA,FMCSA, FTA, or Transit Development Corporation endorsement of a particular product,method, or practice. It is expected that those reproducing the material in this document foreducational and not-for-profit uses will give appropriate acknowledgment of the source ofany reprinted or reproduced material. For other uses of the material, request permissionfrom CRP.
NOTICE
The project that is the subject of this report was a part of the National Cooperative HighwayResearch Program, conducted by the Transportation Research Board with the approval ofthe Governing Board of the National Research Council.
The members of the technical panel selected to monitor this project and to review thisreport were chosen for their special competencies and with regard for appropriate balance.The report was reviewed by the technical panel and accepted for publication according toprocedures established and overseen by the Transportation Research Board and approvedby the Governing Board of the National Research Council.
The opinions and conclusions expressed or implied in this report are those of theresearchers who performed the research and are not necessarily those of the TransportationResearch Board, the National Research Council, or the program sponsors.
The Transportation Research Board of the National Academies, the National ResearchCouncil, and the sponsors of the National Cooperative Highway Research Program do notendorse products or manufacturers. Trade or manufacturers’ names appear herein solelybecause they are considered essential to the object of the report.

The National Academy of Sciences is a private, nonprofit, self-perpetuating society of distinguished scholars engaged in scientific
and engineering research, dedicated to the furtherance of science and technology and to their use for the general welfare. On the
authority of the charter granted to it by the Congress in 1863, the Academy has a mandate that requires it to advise the federal
government on scientific and technical matters. Dr. Ralph J. Cicerone is president of the National Academy of Sciences.
The National Academy of Engineering was established in 1964, under the charter of the National Academy of Sciences, as a parallel
organization of outstanding engineers. It is autonomous in its administration and in the selection of its members, sharing with the
National Academy of Sciences the responsibility for advising the federal government. The National Academy of Engineering also
sponsors engineering programs aimed at meeting national needs, encourages education and research, and recognizes the superior
achievements of engineers. Dr. Charles M. Vest is president of the National Academy of Engineering.
The Institute of Medicine was established in 1970 by the National Academy of Sciences to secure the services of eminent members
of appropriate professions in the examination of policy matters pertaining to the health of the public. The Institute acts under the
responsibility given to the National Academy of Sciences by its congressional charter to be an adviser to the federal government
and, on its own initiative, to identify issues of medical care, research, and education. Dr. Harvey V. Fineberg is president of the
Institute of Medicine.
The National Research Council was organized by the National Academy of Sciences in 1916 to associate the broad community of
science and technology with the Academy’s purposes of furthering knowledge and advising the federal government. Functioning in
accordance with general policies determined by the Academy, the Council has become the principal operating agency of both the
National Academy of Sciences and the National Academy of Engineering in providing services to the government, the public, and
the scientific and engineering communities. The Council is administered jointly by both Academies and the Institute of Medicine.
Dr. Ralph J. Cicerone and Dr. Charles M. Vest are chair and vice chair, respectively, of the National Research Council.
The Transportation Research Board is one of six major divisions of the National Research Council. The mission of the Transporta-
tion Research Board is to provide leadership in transportation innovation and progress through research and information exchange,
conducted within a setting that is objective, interdisciplinary, and multimodal. The Board’s varied activities annually engage about
7,000 engineers, scientists, and other transportation researchers and practitioners from the public and private sectors and academia,
all of whom contribute their expertise in the public interest. The program is supported by state transportation departments, federal
agencies including the component administrations of the U.S. Department of Transportation, and other organizations and individu-
als interested in the development of transportation. www.TRB.org
www.national-academies.org

CRP STAFF FOR NCHRP REPORT 680
Christopher W. Jenks, Director, Cooperative Research ProgramsCrawford F. Jencks, Deputy Director, Cooperative Research ProgramsAmir N. Hanna, Senior Program OfficerEileen P. Delaney, Director of PublicationsDoug English, Editor
NCHRP PROJECT 14-17 PANELField of Maintenance—Area of Maintenance of Way and Structures
Edward J. Denehy, The Gorman Group, Great Barrington, MA (formerly New York State DOT) (Chair)John Vance, Mississippi DOT, Jackson, MS John W. Collins, John W. Collins, LLC, Baton Rouge, LA (formerly Louisiana DOTD)F. M. “Rick” Harvey, Wyoming DOT, Cheyenne, WY Kevin Kennedy, Michigan DOT, Lansing, MI Joseph A. Mickes, Quixote Transportation Safety, Jefferson City, MO Luis Rodriguez, FHWA Liaison Frank N. Lisle, TRB Liaison
C O O P E R A T I V E R E S E A R C H P R O G R A M S
AUTHOR ACKNOWLEDGMENTS
The research reported herein was performed under NCHRP Project 14-17 by the Department of Con-struction Management at Colorado State University (CSU) and the department of civil engineering atTexas A&M University (TAMU). CSU was the prime contractor with TAMU as a subcontractor.
The work was done under the general supervision of Dr. Scott Shuler, Associate Professor of Construc-tion Management at CSU, who served as the Principal Investigator. The other authors of this report areAnthony Lord, Ph.D. candidate and Research Assistant at CSU, Amy Epps-Martin, Associate Professor atTAMU, and Denise Hoyt, M.S. candidate and Research Assistant at TAMU. Additional contributors to thiswork include Charles Leudders, FHWA Federal Lands Division, Ben Vagher, A-1 Chip Seal, William Tru-dahl, Washington state DOT, and Roy Guevera, Colorado Department of Transportation. The authors grate-fully acknowledge the work and technical assistance of Nikornpon Prapaitrakul, Rongbin Han, Xin Jin, andCharles J. Glover of the Artie McFerrin Department of Chemical Engineering, Texas A&M University, andof Rick Canatella of the Texas Transportation Institute McNew Laboratory, Texas A&M University.

This report presents a manual for the use of emulsion-based chip seals for pavementpreservation. The manual addresses the factors affecting chip performance, discusses designand construction considerations, and identifies procedures for selecting the appropriatechip seal materials. The report also contains recommended test methods for use in thedesign and quality control of chip seals. The test methods are presented in AASHTO formatto facilitate incorporation into the AASHTO Standard Specifications for TransportationMaterials and Methods of Sampling and Testing. The material contained in the report shouldbe of immediate interest to state maintenance engineers and others involved in the mainte-nance and preservation of flexible pavements.
Emulsion-based chip seals are the most commonly used chip seal type in the UnitedStates. These seals are frequently used as pavement preservation treatments on flexible pave-ments to seal fine cracks in the underlying pavement’s surface and prevent water intrusioninto the base and subgrade. Because chip seals are not expected to provide additional struc-tural capacity to the pavement, benefits ideally are accrued by their application early in apavement’s life before a great degree of distress is exhibited. Although a large body ofresearch is available on chip-seal design practices, the design process in the United Statesremains empirical in nature—based on experience and judgment. Procedures that considerthe surface condition of the existing pavement, traffic volume, environment, and other rel-evant factors in determining the characteristics and application rates of aggregates andbinder have not been widely used in the United States.
In spite of their apparent benefits, the use of chip seals for pavement preservation in theUnited States is hampered by the lack of nationally accepted guidance on their design andconstruction and appropriate specifications and testing procedures for constituent materi-als. Thus, research was needed to identify the factors that influence chip-seal design and per-formance and to develop a manual that documents design and construction practices anddelineates necessary testing and specifications. Such a manual will provide highway agen-cies with the information necessary for designing and constructing long-lasting chip sealsand preserving pavements.
Under NCHRP Project 14-17, “Manual for Emulsion-Based Chip Seals for PavementPreservation,” Colorado State University of Fort Collins conducted a review of availableinformation relevant to design and construction practices of emulsion-based chip seals,conducted laboratory tests and field investigations to evaluate the factors affecting chip sealperformance, and prepared a manual for designing and constructing chip seals over hot-mix asphalt pavements together with test methods for evaluating some aspects of chip sealconstruction. In addition to the manual and test methods, the report includes a summary
F O R E W O R D
By Amir N. HannaStaff OfficerTransportation Research Board

of the research performed, related findings and recommendations, and appendices that pro-vide further elaboration on the research.
The manual and test methods presented in this report will be particularly useful to high-way agencies because the manual provides a rational approach for the design of chip sealsused in the preservation of pavements and the test methods provide appropriate means forcontrol of chip seal construction. The adoption of this manual and test methods byAASHTO is, therefore, suggested.
The appendices contained in the research agency’s final report provide further elabora-tion on the work performed in this project. These appendices are not published herein butare available on the NCHRP Report 680 summary webpage at http://www.trb.org/Main/Blurbs/164090.aspx.

C O N T E N T S
1 Manual for Emulsion-Based Chip Seals for Pavement Preservation
2 Chapter 1 Introduction2 1.1 Definition of Chip Seals
3 Chapter 2 Factors Affecting Chip-Seal Performance3 2.1 Pavement Behavior and Condition4 2.2 Traffic Characteristics4 2.3 Geometry4 2.4 Highway, Residential, Urban, or Rural5 2.5 Materials6 2.6 Construction Preparation6 2.7 Maintenance
7 Chapter 3 Design and Construction Considerations7 3.1 Identifying Appropriate Pavements to Chip Seal7 3.2 Type of Seal7 3.3 Chip Seal Selection7 3.4 Selecting the Aggregate Size8 3.5 Evaluating the Pavement8 3.6 Materials
13 Chapter 4 Selecting the Appropriate Chip Seal13 4.1 Single Seal13 4.2 Single Seal with Choke Stone13 4.3 Double Seal
14 Chapter 5 Chip Seal Materials Selection14 5.1 Chip Gradation14 5.2 Modified or Unmodified Emulsion14 5.3 Fog Seal After Chip Seal14 5.4 Emulsion–Aggregate Compatibility
15 Chapter 6 Chip-Seal Design15 6.1 Emulsion Application Rate20 6.2 Aggregate Application Rate20 6.3 Time Until Sweeping and Traffic20 6.4 Other Considerations20 6.5 Example Design
22 Chapter 7 Construction22 7.1 Equipment Calibrations23 7.2 Operations

26 Chapter 8 Quality Control26 8.1 Aggregate Sieve Analysis26 8.2 Moisture Content of System26 8.3 Embedment Depth Measurement During Construction26 8.4 Field Viscosity
27 Chapter 9 Performance27 9.1 Less Than One Year27 9.2 Greater Than One Year
28 References
29 Appendix Recommended Test Methods
66 Attachment Manual for Emulsion-Based Chip Seals for Pavement Preservation: Research Report
Note: Many of the photographs, figures, and tables in this report have been converted from color to grayscalefor printing. The electronic version of the report (posted on the Web at www.trb.org) retains the color versions.

1
This proposed manual, prepared as part of NCHRP Proj-ect 14-17, Manual for Emulsion-Based Chip Seals for Pave-ment Preservation, is a recommendation by NCHRP Project
14-17 staff at Colorado State University. This manual has notbeen approved by NCHRP or any AASHTO committee orformally accepted for adoption by AASHTO.
Manual for Emulsion-Based Chip Seals for Pavement Preservation

2
This manual was developed for use in designing and con-structing chip seals over hot mix asphalt pavements. It docu-ments best practices based on the findings of research duringNCHRP Project 14-17, Manual for Emulsion-Based Chip Sealsfor Pavement Preservation. A summary of the research per-formed in this project is provided in the attachment. Also, testmethods developed in this research for use in conjunctionwith this manual are provided in the appendix. In addition,certain subjective or qualitative judgments previously neededduring chip-seal construction have been eliminated in favorof field and laboratory testing. These include the moisture con-tent of the seal before traffic can be released, judging surfacecondition so emulsion application rate can be adjusted forsurface demand, and measuring the emulsion consistency inthe field. The introduction of these new techniques should
improve the probability of success when designing and con-structing chip seals, but they do not replace the significantjudgment required. Also, the success of any chip seal dependson conformance to best practices, and variance or eliminationof these practices often leads to disappointing performance.
1.1 Definition of Chip Seals
Chip seals described in this manual are based on emulsi-fied asphalt binders and natural mineral aggregate chips. Thechip seal is constructed by spraying the asphalt emulsion ontothe existing asphalt pavement and then dropping the aggre-gate chips into the asphalt emulsion. The purpose of the chipseal is to seal minor cracks in the surface of the asphalt pave-ment and provide additional friction.
C H A P T E R 1
Introduction

3
The performance of a chip seal depends on many factors,including the condition of the pavement to which the chipseal is to be applied, pavement geometry, traffic volume andtype, materials, and construction practices. The followingdiscussion describes these factors and their effects on the per-formance of the chip seal.
2.1 Pavement Behavior and Condition
2.1.1 Deflection of Substrate
The amount of deflection is an indication of whether fu-ture fatigue can be expected. If deflection is significant, a chipseal may be inappropriate. The maximum level of deflectionwill vary depending on the traffic volume; however, if fatiguecracking is already present, chip-seal performance may bereduced. However, a chip seal may reduce moisture infil-tration into the subgrade, thus reducing the potential forfuture fatigue. Therefore, the decision to chip seal over exist-ing fatigue cracking requires judgment depending on theperformance expectation of the existing pavement.
2.1.2 Cracking Severity
Chip seals are most effective as a pavement preservationtechnique before cracks are ranked as high severity (Peshkinet al. 2004), defined as a crack width of 3⁄8 in. Although the chip-seal binder has the ability to seal cracks greater than this width,as crack width increases, the emulsion residue is less effectiveat bridging the gap across the crack and sealants should be usedto fill these cracks prior to chip sealing.
2.1.3 Flushing/Bleeding
Chip seals may be applied to remedy friction loss, but pen-etration of chips into flushed pavement surfaces may limiteffectiveness unless chips can be retained with lower emulsion
application rates. Flushing and bleeding of the existing surfaceoften occurs in wheel paths. If this occurs, the emulsion appli-cation rate must be reduced in the wheel paths to preventfuture flushing and bleeding. This can only be accomplishedwith variable spray rate distributors or by varying the size ofthe nozzles in the distributor spray bar.
2.1.4 Texture
Surface roughness affects the amount of emulsion neededto hold aggregate chips in place. The texture of the substratepavement should be evaluated using the sand patch test or CTmeter prior to chip sealing to determine whether an adjust-ment to the design emulsion application rate is appropriateand to what level.
2.1.5 Soft Substrate Surface
A soft substrate surface can allow chips to be embedded inthe surface after trafficking, resulting in possible flushing. Theball penetration test has been shown to be an effective tool formeasuring this potential.
2.1.6 Uniformity
The amount of emulsion applied to the substrate may needto be varied if the substrate surface does not have the same tex-ture and compliance along the alignment. Uniformity shouldbe mapped prior to construction to identify locations whereemulsion application rates should vary from design. Unifor-mity can also vary transverse to the centerline, which oftenoccurs when wheel paths are flushed. In this case the emul-sion application rate should be reduced in the wheel paths byusing a distributor equipped with a variable application spraybar or placing smaller nozzles in the conventional distributorspray bar in locations that will affect the wheel paths (Shuler1991, Martin 1989).
C H A P T E R 2
Factors Affecting Chip-Seal Performance

2.2 Traffic Characteristics
The traffic volume and type of traffic affect the selection ofmaterials used on chip seals. Generally, higher traffic volumeand a higher percentage of heavy trucks on an undivided road-way present a greater likelihood for vehicle damage if traffic isnot adequately controlled during construction. In addition, thevolume and type of the traffic are directly related to the poten-tial for chip embedment in the substrate. Also, traffic accelera-tion affects chip-seal performance as chips are more likely to bedislodged under these loads than at constant speeds, which canlead to flushing and bleeding of the surface. This section dis-cusses the factors that influence the material’s selection processdepending on traffic volume, type of traffic, and speeds.
2.2.1 Chip Selection
Larger chips provide more tolerance for emulsion applica-tion variance and are less likely to become totally embeddedby traffic if the substrate is resistant to embedment. Largerchips require higher emulsion application rates for properembedment, thus increasing the sealing ability of the chipseal. However, large chips are noisier and provide higher riskof vehicular damage during construction.
2.2.2 Emulsion Selection
Emulsions modified with elastomeric polymers providehigher adhesion for aggregate chips, often both during con-struction and later in the life of the seal. Also, research (Shuler1991) indicates that on high traffic facilities (i.e., greater than7,500 vehicles per day per lane), modified asphalt emulsionsare required to hold chips in place due to reduced emulsionapplication rates that are necessary to reduce the potential forembedment in the substrate and consequent flushing.
2.2.3 Fog Seal
The application of a fog seal over a fresh chip seal provideshigh color contrast that improves visibility of striping, andshort-term performance improvement (Shuler 2007). Careshould be taken whenever applying a fog seal since pavementfriction could be reduced if the fog seal is applied at too highan application rate, the fog seal emulsion has a high residuecontent, or the fog seal has not broken sufficiently to supportuncontrolled traffic.
2.3 Geometry
2.3.1 Divided/Undivided
Divided alignments generally reduce the possibility forvehicle damage caused by loose, flying chips because of theseparation of opposing traffic.
2.3.2 Gradient/Curves
Steep inclines and curves may adversely affect performancedue to tractive forces and slower moving vehicles. Therefore,traffic control may need to remain in place until the emulsionhas cured sufficiently to retain the chips.
2.3.3 Intersections
Turning, acceleration, and deceleration can cause chip lossand flushing. Therefore, traffic control may need to remain inplace until the emulsion has cured sufficiently to retain the chips.
2.3.4 Width
Vehicle movement tends to be more concentrated on nar-row, secondary roads than on wider primary facilities. Thisresults in a greater tendency for flushing in the wheel pathson these types of pavements.
2.4 Highway, Residential, Urban, or Rural
2.4.1 Highway
Chip seals can be successfully constructed on highwayswith over 7,500 vehicles per day per lane with little or noconsequences with respect to vehicle damage (Shuler 1991)if important principles are followed. However, other fac-tors should be considered regarding the use of chip seals onhigh traffic highway pavements. Because noise increases withincreasing traffic volume and chip size, smaller aggregatesare often desired for high traffic facilities. However, moreaccuracy relative to emulsion spray rate is needed when usingsmaller aggregates because the smaller embedment depthincreases the potential for chip loss.
2.4.2 Residential
Chip seals constructed with larger aggregates are roughtextured. This rough surface texture is often unpopular amongresidential users such as roller skaters and skateboarders orindividuals who need to lie on the pavement to repair vehicles.
2.4.3 Rural
Rural settings are the most appropriate for chip seals. Traf-fic tends to move more consistently with less stopping andstarting, and volumes are often lower, creating wider vehicleseparation providing less possibility for vehicle damage.
2.4.4 Urban
Urban environments are often the most challenging envi-ronment for chip seals because of the higher traffic volumes
4

and frequent turning, stopping, and starting. Although chipseals can be constructed in such environments with success,the time required for emulsions to gain sufficient strength toresist the turning, acceleration, and deceleration of vehicles inlarge volumes is often long enough to preclude their use.
2.5 Materials
2.5.1 Aggregate Chips
Aggregate properties, including size, shape, and gradation;cleanliness; moisture content; toughness and durability; andporosity influence chip-seal performance.
2.5.1.1 Size, Shape, and Gradation
Aggregates that interlock after construction rolling andearly trafficking provide higher stability under loads. Thisinterlocked aggregate surface is more resistant to displace-ment and thus has a lower potential for dislodgement of chipsand vehicle damage and flushing.
Larger aggregates require higher emulsion application ratesin order to provide an equivalent embedment percentage tosmaller aggregates. This higher application rate allows slightlymore tolerance during construction with respect to depth ofchip embedment in the binder. Also, the higher binder appli-cation provides greater sealing ability.
Aggregates retained between two adjacent sieve sizes providethe best interlock, followed by aggregates that occupy the spacebetween three adjacent sieve sizes; these are often described asone- and two-sized aggregate chips, respectively. The perfor-mance of the one- and two-sized chips is related to the mannerby which the chips are embedded in the emulsion. If well-graded aggregates are used, the fine aggregate often enters theemulsion before the coarse aggregate, causing the coarse aggre-gate to have less binder available for adhesion and resulting inloss of the coarse fraction, vehicle damage, and flushing.
2.5.1.2 Cleanliness
Emulsified asphalts can be produced with the ability to coataggregate chips containing small quantities of minus no. 200aggregate. The maximum amount of this fine aggregate isdependent on the emulsion. For example, medium settingemulsions can tolerate a higher percentage than most rapidsetting emulsions; this is often related to the demulsibilityof the emulsion. The higher the demulsibility, the less minusno. 200 can be tolerated before setting occurs and there is lossof adhesion to the coarse chips.
2.5.1.3 Moisture Content
Aggregates in the saturated surface dry condition providebetter resistance to sweeping than dry aggregates when asphalt
emulsions are used. Therefore, construction aggregates shouldbe moistened by spraying water on the stockpile and mixingwith a front-end loader before chip-seal operations begin.
2.5.1.4 Toughness and Durability
Aggregates must have enough strength to resist crushingduring construction and trafficking. Breakdown of the aggre-gate during construction and trafficking could lead to inunda-tion and flushing if the coarse particles are reduced to fineparticles.
2.5.1.5 Porosity
Porous aggregates will absorb more asphalt than nonporousaggregates. Therefore, the amount of asphalt absorbed mustbe accounted for during the design stage.
2.5.2 Asphalt Emulsion
The performance of a chip seal is largely dependent on theasphalt emulsion. Performance is related to the adhesive abil-ity of the binder for the aggregate chips and the underlyingpavement, the durability and flexibility of the binder, and theability of the binder to maintain these properties over a widerange of environmental conditions and snowplow action.
2.5.2.2 Emulsion Type
Emulsified asphalts should be rapid setting types. Althoughrapid setting emulsions allow faster removal of traffic control,they can set too quickly in very hot weather or even form askin on the surface after application, creating a barrier to chipembedment. Medium setting emulsions require more timeto set, requiring traffic control to remain in place longer andincreasing the possibility for vehicle damage. However, whilerapid setting emulsions are the most desirable as a chip-sealbinder, medium setting emulsions have been used success-fully on low volume roads when strict traffic control is main-tained. Medium setting emulsions have also been successfulwhen chips are more uniformly graded or contain higherquantities of minus no. 200 particles.
2.5.2.3 Emulsion Class
Emulsions are classified based on the particle charge of theasphalt droplets within the water phase of the suspension.Anionic emulsions have a negative charge and cationic emul-sions a positive charge. There are also a limited number ofemulsions classified as nonionic with no appreciable charge.These emulsions can be considered interchangeable as bothclassifications should provide equal performance with respectto adhesion to aggregate chips. Research has shown no
5

difference in the adhesion of different classes of emulsionsto aggregates (Shuler and Lord 2009). However, the selec-tion of emulsion should take into consideration the environ-mental conditions present during construction. For example,anionic emulsions break by evaporation so humid site con-ditions could lead to longer setting times for anionic com-pared with cationic materials. High float emulsions are a classof emulsion that can be either anionic or cationic and are for-mulated with a gel structure to produce a thicker asphaltcoating on aggregate chips. Some high float emulsions con-tain oil distillates that increase setting time, so increased traf-fic control may be needed for these products.
2.5.2.4 Viscosity Grade
Emulsions are produced in two viscosity categories, desig-nated “−1” and “−2” for low and high viscosity, respectively.Because aggregate chips require approximately 40% initialembedment during construction, the high viscosity emul-sions should always be used since the low viscosity emulsionswould flow off the substrate.
The viscosity of the emulsion during construction is animportant factor. Emulsions with too low viscosity couldflow off the pavement before the aggregate chips are embed-ded, resulting in a loss of chips under traffic and potentialenvironmental issues. Emulsions with too high viscosity maynot provide adequate coating of the aggregate chips, leadingto a loss of chips.
2.5.2.5 Application Rate
The binder application rate must be correct during con-struction to achieve optimum performance of the chip seal.Too little emulsion will not retain chips in place under traf-fic, and too much emulsion will lead to flushing and loss offriction. The optimal application rate is a function of the vol-ume of voids in the compacted aggregate chip layer, the volumeand type of traffic, the pavement gradient, and the conditionof the substrate pavement.
2.5.2.6 Emulsion Application Temperature
Emulsion application temperature should be within a rangeto provide uniform transverse and longitudinal spraying butshould not exceed 185°F (85°C).
2.6 Construction Preparation
Preparation of the pavement surface prior to chip-sealoperations can influence performance of the chip seal. Thispreparation varies depending on the condition of the exist-ing pavement but at a minimum should include sweeping thesurface to remove loose debris, dust, or other contaminants.
2.6.1 Fog Seal Pre-Treatment of Substrate
If the pavement surface is extremely dry or porous or thereis possible loss of some of the chip-seal binder to the pavement,a light fog seal application should be considered prior to chipsealing. Sometimes hot mix asphalt patches are needed to re-pair the existing pavement prior to chip sealing. These patchedareas should be sprayed with a light fog seal prior to applyingthe chip seal since fresh hot mix asphalt can absorb the emul-sion after chip sealing, resulting in significant loss of chips.
2.6.2 Repairs
Alligator cracking, potholes, failing patches, and activecracks greater than 1⁄4 in. in width should be repaired to pro-vide a stable surface for the new chip seal.
2.7 Maintenance
Fog seals are often applied to a new chip seal to provideadditional binder and higher contrast for pavement strip-ing paint. Care should be taken whenever applying a fog sealsince pavement friction could be reduced if the fog seal isapplied at too high an application rate, the fog seal emulsionhas a high residue content, or the fog seal has not brokensufficiently to support uncontrolled traffic.
6

7
Before a chip seal can be designed, there are certain factorsthat must first be known about the project. The first part ofthis process involves selecting the pavement to chip seal. Thesecond part is selection of the type of seal to be placed.
3.1 Identifying AppropriatePavements to Chip Seal
Chip seals are most effective for pavement preservationwhen applied to pavements with limited or no distress (i.e.,cracking has not begun or is less than 1⁄8-in. wide, rutting isless than 3⁄8 in., and structural distress is isolated with low-severity fatigue). Pavements with severe cracking and ruttingmay require multiple patches and crack sealing prior to chipsealing. In general, pavements in poor condition will achieveshorter service lives than pavements in good condition.
3.2 Type of Seal
The types of chip seal include single, double, and singlechip seal with choke stone; any of these chip seals may have afog seal applied afterward.
3.2.1 Single Chip Seal
A single chip seal consists of a spray application of asphaltemulsion followed by an application of aggregate chips, prefer-ably one stone layer thick.
3.2.2 Double Chip Seal
A double chip seal is two applications of a single chip seal.The first chip seal is constructed with aggregate one sieve sizelarger than the second chip seal.
3.2.3 Single Chip Seal with Choke Stone
This type of seal is a single chip seal but with crushed fineaggregate applied to the surface of the chip seal prior to rolling.
3.2.4 Fog Seal Applied to Chip Seals
A fog seal may be applied to a fresh chip seal to provideslightly more asphalt to account for possible deficiencies inemulsion application rate, to provide a higher contrast betweenpavement markings and the surrounding surface, and to pro-vide possible improved cracking performance. Care shouldbe taken whenever applying a fog seal since pavement fric-tion could be reduced if the fog seal is applied at too high anapplication rate, the fog seal emulsion has a high residue con-tent, or the fog seal has not broken sufficiently to supportuncontrolled traffic.
3.3 Chip Seal Selection
The type of chip seal used depends on many factors. Underhigh traffic volumes, double seals or seals with choke stonehave lower potential for chip loss and vehicle damage. Dou-ble and choke stone seals should provide less tire–pavementnoise due to smaller aggregate size. The life expectancy of dou-ble seals and seals with choke stone should be higher and thesealing ability should also be greater than single seals under thesame conditions. However, the cost of double seals is obvi-ously higher.
3.4 Selecting the Aggregate Size
The chip seals described in this manual are single chip sealsconsisting of one application of asphalt emulsion and onelayer of aggregate chips. The gradation of the chips shouldconsist of one or two consecutive sieve sizes with little or nomaterial passing the 0.075-mm sieve (no. 200). The maximumaggregate size in the chip seal influences the performance ofthe chip seal. Larger aggregates provide greater sealing per-formance because of the higher asphalt volume needed toretain the chips in place. However, larger aggregates producemore traffic noise, have rougher texture, and have greater po-tential to damage vehicles. These advantages and disadvantages
C H A P T E R 3
Design and Construction Considerations

must be considered when making decisions regarding chip-seal selection.
3.5 Evaluating the Pavement
Some aspects of the pavement surface can have an effect onthe performance of the chip seal. For example, texture of thesurface, resistance of the pavement surface to penetrationof the chips under traffic, variability of the pavement surfacealong the alignment, and pavement gradient all affect chip-seal performance. These factors must be considered duringthe chip-seal design process.
3.5.1 Surface Texture
The texture of the pavement surface must be known prior tochip sealing so that an adjustment can be made for the designemulsion spray rate. Texture of the surface can be measuredusing either sand patch (ASTM E 965) or CT meter (ASTM E2157) to obtain the texture depth. The correlation betweenthese two tests has been established. An adjustment to emul-sion spray rate needs to be applied to account for the texture.
3.5.2 Penetration of Chips into Surface
The pavement surface should be tested using the ball pen-etration test to determine if chips are likely to penetrate thesubstrate pavement after trafficking and to what level. If pen-etration is possible, adjustment to the emulsion applicationrate will be required.
3.5.3 Variability of Surface along Alignment
The surface of the pavement affects the emulsion appli-cation rate. Therefore, if the surface varies along the alignment,the application rate must change to match these conditions.A thorough map should be made indicating where materialapplication rates should change in accordance with the chang-ing surface conditions. These changes can be communicatedto equipment operators by painting on the pavement surfacein front of the distributor truck.
3.6 Materials
The suitability of all materials to be used in the chip sealshould be evaluated before construction begins.
3.6.1 Aggregates
Aggregate properties relevant for chip seals include grada-tion, toughness, soundness, cleanliness, fracture, and polishresistance.
3.6.1.1 Gradation
The gradation of the aggregate used in the chip seal is criticalto performance. Generally, the more one-sized the aggregate,the better the performance potential. One-sized aggregatesinclude those materials retained within two consecutive sievesizes. Two-sized aggregates are materials retained betweenthree consecutive sizes. Good performance should be expectedfor any chip seal with up to two-sized gradations. However,as the gradation becomes less uniform (a wider variety of sizes),obtaining good performance will be more difficult to achieve.Uniformity can be quantified by using the coefficient of uni-formity (Cu) used for soil and aggregate classification (ASTMD 2487).
Cu is defined as the ratio of the size for which 60% passesdivided by the size for which 10% passes. Thus, a more one-sized material will have a smaller Cu.
An example of how the Cu value can be used to judge uni-formity is provided in Table 1 for hypothetical aggregategradations. Aggregates 1, 2, and 3 are examples of one-sizedmaterials, and Aggregates 4, 5, and 6 are two-sized. Aggre-gate 7 has many sizes. A Cu value less than 4.0 is defined asuniformly graded (ASTM D 2487). The first six aggregatesall have Cu values of less than 2.0 and, therefore, would bedefined as uniformly graded. The seventh aggregate, with Cu
of 7.2, would be considered well graded.Another approach has been proposed which evaluates the
ratio of material passing 70% of the median size to that pass-ing 140% of the median size, termed the performance-baseduniformity coefficient (PUC) (Lee and Kim 2008). It is ex-pected that particles at 70% of the median size will be sub-merged in asphalt when fully compacted, and particles at140% of the median size will not have enough binder to holdthem in place. Thus, the closer the PUC ratio is to zero, themore one-sized the gradation. For aggregates in Table 1, thePUC ratios for the first six aggregates range from 0 to 0.21,with 0.58 for the seventh aggregate.
Aggregate gradations A, B, and C in Table 2 are recom-mended for chip-seal aggregates. While they are not as uni-form as those for Aggregates 1 through 6 in the hypotheticalexample, they present practical materials suitable for chip-seal construction. These aggregates have PUC ratios of 0.04to 0.31 and Cu values of 1.18 to 3.28.
3.6.1.2 Toughness
Toughness is defined as the ability of an aggregate to resistcrushing forces. Toughness is an important consideration dur-ing aggregate processing to ensure that the gradation produceddoes not change during handling by loaders or other construc-tion equipment while stockpiling, loading, or spreading onthe pavement during construction. Crushing resistance is alsoimportant during service when vehicles travel over the chip-
8

seal aggregate. Crushing resistance historically was judgedusing the Los Angeles Abrasion test (AASHTO T 96), but morerecently the Micro-Deval test (AASHTO T 327) has been in-cluded as an indicator of toughness. Specifications often limitthe abrasion loss to 35%, but this value should vary depend-ing on traffic level. Several state specifications have stipulatedthe values shown in Table 3.
Lightweight aggregates manufactured from expandedshale, clay, and other materials have been used in chip sealson low-traffic facilities for many years (Gallaway 1966). Al-though Los Angeles Abrasion test results indicate the ma-terials are acceptable, on high-traffic facilities they degradeprematurely (Shuler 1991). This suggests the Los AngelesAbrasion test is not an appropriate measure of toughnessfor such materials.
3.6.1.3 Soundness
Freeze–thaw resistance and weathering are not common per-formance issues for chip-seal aggregates because water shoulddrain freely from the surface of chip seals. However, magne-sium and sodium sulfate loss tests (AASHTO T 104) are rou-tinely used to evaluate soundness of concrete and hot mixasphalt aggregates and, therefore, should be included forevaluating chip-seal aggregate suitability. A limit of 10% lossis considered appropriate for chip-seal aggregates.
3.6.1.4 Cleanliness
Although asphalt emulsions have the ability to coat dustyaggregates, the fraction passing the no. 200 (0.075 mm) sieve
9
1 2 3 4 5 76Sieve, mm Sieve
19 3/4 100 10012.5 1/2 0
00
060
60 100 100 1009.5 3/8 0 60 100 100 75
4.75 4 0 452.38 8 251.19 16 120.60 300.30 50
0.075 200 216.33 12.5 11.2 9.5 7.5 4.75 7.213.1 9.9 9.8 5.5 5.1 2.7 1
1.25 1.26 1.14 1.73 1.47 1.76 7.20
15.75 12 11 8.7 7.2 4.3 5.50 0 0 18 7.5 15 37
100 88 100 95 100 71 640.00 0.00 0.00 0.19 0.08 0.21 0.58
% Passing @ 0.7M >% Passing @ 1.4M >
PUC >
D60 >D10 >
Cu >Median (M) >
Hypothetical Aggregate Gradations
Passing, %
Table 1. Coefficient of uniformity for selected chip-seal aggregates.
Sieve, mm Sieve19 3/4 100 100
12.5 1/2 90 100 100 1009.5 3/8 5 30 90 100 100 100
4.75 4 0 10 5 30 90 1002.38 8 0 10 5 301.19 16 0 2 0 100.60 30 0
0 0
220.30 50 0
0.075 200 0 1 1 111.4 10.8 7.8 6.8 3.9 3.49.65 4.75 2.38 2.38 2.5 1.19
1.18 2.27 3.28 2.86 1.56 2.86
11.1 10.3 7.3 6.15 3.7 3.13.5 20 11 27 11 2695 100 92 86 91 89
0.04 0.20 0.12 0.31 0.12 0.29
Passing, %Gradation A Gradation B Gradation C
% Passing @ 0.7M >% Passing @ 1.4M >
PUC >
D60 >D10 >
Cu >
Median (M) >
Table 2. Recommended aggregate gradations.

should be limited to 1% or less. However, higher values canbe tolerated by many emulsions, especially if medium settingmaterials are used. Adhesive ability of the emulsion should beevaluated in the laboratory using the sweep test; the aggregateshould be considered suitable for use when 90% retention ofthe aggregate can be achieved. Sieve analyses should be con-ducted using washed samples since the material passing theno. 200 sieve often adheres to coarse aggregates. Sieve analysis(AASHTO T 27) must be done in conjunction with the wash-ing procedure (AASHTO T 11).
3.6.1.5 Angularity
The amount of interlock present in a chip-seal aggregatesurface is directly related to the amount of angularity of the individual aggregate particles. The higher the interlock,the greater the resistance to dislodgement of particles and thepotential for vehicle damage and flushing of the surface. Theforces present at the chip-seal surface are directly related to the amount and type of traffic expected. Therefore, agreater percentage of mechanically fractured particles shouldbe used for roads with high traffic volumes and truck per-centages. The literature provides some guidance, summarizedin Table 4, regarding fracture requirements for chip-seal aggregates.
3.6.1.6 Polish Resistance
Because vehicular traffic may cause aggregates to polish andreduce friction, the aggregates used for chip seals should be
evaluated if polishing is suspected. The polished stone valueobtained using the British Wheel (AASHTO T 279) is the mostcommon test used for this purpose. A limit of 31 is recom-mended (Utah DOT 2008).
3.6.2 Aggregate Properties for Design
The size and shape of the aggregates used for chip sealsdetermine the spread rate of the aggregate and spray rate ofthe emulsion. Aggregate gradation is determined during sieveanalysis to ensure that materials meet the specifications forthe roadway to be sealed. The shape of the particles is neededto make sure they are not too flat or elongated and for inputinto the design process. These properties are discussed below.
3.6.2.1 Flakiness
The flakiness index, a measure of the percentage of par-ticles that are long and slender in comparison to the width,is used in many designs of chip seals. A low flakiness indexis desired because it indicates cubical-shaped aggregates.Aggregates with a high flakiness index tend to lie flat andbecome submerged in the binder during construction andlater under traffic, resulting in flushing. Limits on flakinessindex recommended in Table 5 (Austroads 2006, South AfricanRoads Agency 2007, Wood et al. 2006) are based on the expe-rience of several agencies.
3.6.2.2 Average Least Dimension
It is assumed that the aggregates will orient to the flattestdirection after construction and trafficking. Therefore, to besure the aggregate chips are not submerged in binder dur-ing service, the average of the least dimension of the aggre-gates is used to determine aggregate spread rate and emul-sion spray rate. The median aggregate size determined fromsieve analysis and the flakiness index is needed to determinethe average least dimension (ALD). Although ALD can be
10
Traffic,veh/day/lane
L.A. Abrasion Loss, % max
Micro-Deval Loss, % max
<500 40 15 500–1,500 35 13
>1,500 30 12
Table 3. Los Angeles Abrasion andMicro-Deval loss versus traffic level.
Vehicles per Day per Lane Parameter Test Method <500 500–1,500 >1,500
One Fractured Face ASTM D 5821 90 95 100 Two Fractured Faces ASTM D 5821 85 90 90
Table 4. Mechanically fractured requirements for chip-seal aggregates.
Vehicles per Day per Lane Parameter Test Method <500 500–1,500 >1,500
Flakiness Index Tex 224-F (Tx DOT 2004) FLH T508 (Mn/DOT 2005)
35 30 25
Table 5. Flakiness index requirements for chip-seal aggregates.

Min. Max. Min. Max. Min. Max. Min. Max. Min. Max. Min. Max.Viscosity SSF,@ 122°F AASHTO T 59 100 300 100 300 100 400 100 400 100 300 100 300Storage Stability, 1 day, % AASHTO T 59 1 1 1 1 1 1Sieve Test, % AASHTO T 59 0.1 0.1 0.1 0.1 0.1 0.1Demulsibility, % AASHTO T 59 60 95 60 95 60 95 60 95 60 95 60 95Particle Charge AASHTO T 59 Positive PositiveOil distillate by volume of emulsion, % AASHTO T 59 3 3Residue by Evaporation, % Appendix D 63 63 65 65 63 63Float Test, 140F, s AASHTO T50 1200 1200Penetration, 77F, 100g, 5s AASHTO T49 100 200 100 200 100 250 100 250 100 200 100 200Ductility, 77F, 5cm/min, cm AASHTO T5 40 40 40 40 40 40Torsional Recovery, % CT-332* 18 18 18Toughness, in-lbs CPL-2210** 70 70 70Tenacity, in-lbs CPL-2210** 45 45 45Elastic Recovery, % CPL-2211** 58 58 58* California Test Method** Colorado Test Methods
Polymer ModifiedHFRS-2RS-2
Polymer Modified RS-2 CRS-2 HFRS-2
Polymer ModifiedCRS-2
Table 6. Asphalt emulsions used for chip seals.

measured directly (Austroads 2005), the following relationshipcan be used to estimate ALD more quickly (Jackson 1963):
WhereM = median particle size from sieve analysis andFI = flakiness index.
An alternative method has been proposed (Dumas 2004)that uses five sieves in the aggregate gradation to obtain ALDinstead of just one, the median. When this method was used,the calculated ALD values were within the 98% confidence lim-its for ALD determined using the equation above.
3.6.2.3 Loose Unit Weight, Specific Gravity, and Absorption
Loose unit weight (AASHTO T 19) and specific gravity(AASHTO T 85) are used to estimate the volume of voidsin the loose aggregate chips and to determine how much as-phalt to apply to the pavement surface so that the appropri-ate embedment of chips occurs during construction. Ag-gregate absorption is also needed and is obtained at the
ALD M FI= +( ) ×[ ]1 139285 0 011506. .
same time as specific gravity measurements. A correctionin the residue application rate of 0.02 gallons per squareyard has been suggested (McLeod 1969) if absorption is1%. However, for cubical aggregates embedded to 50% initially, a correction of approximately 0.014 gallons persquare yard is estimated for absorption of 1%. Therefore,an adjustment of 0.01 to 0.02 seems reasonable for eachpercent of aggregate absorption.
3.6.3 Emulsion Properties
The properties of the emulsion used for chip seals are im-portant and should be checked to ensure compliance withrequirements. Desirable emulsion properties are providedin Table 6.
These properties are based on current state specifications forboth conventional and polymer modified emulsions, includ-ing anionic, cationic, and high-float emulsions. Because ofthe wide array of emulsions available in the United States, notevery combination of conventional and modified emulsioncould be included. However, those included in Table 6 havebeen successfully used in chip-seal construction over a rangeof environments and traffic conditions.
12

13
Selecting the appropriate chip seal to use on a specific facil-ity is important. For example, a chip seal using 3⁄4-inch maxi-mum size aggregate may be appropriate for a rural farm-to-market road with 500 vehicles per day per lane but not for anurban street carrying 10,000 vehicles per day per lane. The fol-lowing discussion will provide information regarding the sealthat is most appropriate for a given project.
4.1 Single Seal
The single application chip seal is the most commonly usedchip-seal process. These chip seals have been used with successon all pavement types. However, potential disadvantages, in-cluding vehicle damage, tire noise, and roughness, are reasonsfor considering variations from the single seal. In addition, thesealing ability of a single chip seal is limited based on chip size.An increase in chip size increases sealing ability because of thegreater binder volume required to hold the stone in place, butit also increases the potential for the noted disadvantages.
4.2 Single Seal with Choke Stone
This type of seal is a single chip seal with choke stone ap-plied to the chip seal prior to rolling. The choke stone shouldmeet the same physical requirements of the chip-seal aggregateand the gradation shown in Table 7 when used with chip sealswith aggregate maximum size exceeding 3⁄8 inch (9.5 mm).
The choke stone helps lock the chip-seal aggregate in placeand produces a surface that is less likely to produce dislodgedlarger chip-seal aggregates under traffic. It results in less riskof loose stones and a quieter and smoother surface.
4.3 Double Seal
The double chip seal is used when pavement conditionsrequire substantially higher sealing ability, such as for facili-ties with higher traffic volume. The first chip-seal applicationuses a maximum size aggregate that is one sieve size larger thanthat of the second chip seal. In comparison to other seal types,double chip seals provide higher sealing capability, longerservice life, less risk of dislodgement of the larger aggregates,smaller aggregate in contact with traffic and snow plows, anda quieter surface. However, double seals are higher in cost andrequire longer to construct.
C H A P T E R 4
Selecting the Appropriate Chip Seal
Sieve Passing, % ¼-inch 100 No. 4 85–100 No. 8 10–40
No. 40 0–5 No. 200 0–1
Table 7. Exampleof choke stonegradation.

14
The performance of a chip seal is largely dependent on thematerials used. Therefore, selecting the appropriate aggre-gates and asphalt emulsion and deciding whether to applya fog seal to the surface play a significant role in the successof the project. The following discussion provides guidanceregarding these factors.
5.1 Chip Gradation
The gradation of the chip should be one- or two-sized,but the maximum size should be selected based on trafficvolume, pavement texture, and the required level of sealing.Generally, larger aggregate provides greater ability to sealbecause of the higher volume of binder required to hold thechips in place, and depending on traffic volume, provideslonger life expectancy. However, larger aggregates increasethe chances for vehicle damage, noise, and roughness.
5.2 Modified or UnmodifiedEmulsion
Modified emulsions usually refer to some sort of elastomericpolymer or rubber added to the emulsion or to the base asphaltbinder prior to emulsification. Because modified emulsionsshould offer greater adhesivity and potentially shorter timerequired before opening to traffic, they are generally used onhigher traffic pavements, where vehicle damage potential is
greater and where limited time under traffic control is usu-ally desirable.
5.3 Fog Seal After Chip Seal
A fog seal may be applied to any completed chip seal as ameans of providing a high color contrast for paint stripes.There are also some preliminary indications that the fog sealprovides some additional waterproofing (Shuler 2007). Careshould be taken whenever applying a fog seal since pavementfriction could be reduced if the fog seal is applied at too highan application rate, the fog seal emulsion has a high residuecontent, or the fog seal has not broken sufficiently to supportuncontrolled traffic.
5.4 Emulsion–Aggregate Compatibility
There is anecdotal evidence of apparent incompatibilityarising from use of anionic or cationic emulsions with siliceousor calcareous aggregates, respectively. This incompatibilitymanifests itself with a loss of aggregate from the chip seal. Thisbehavior was not observed during the NCHRP Project 14-17research, in which 20 combinations of aggregates and emul-sions were represented. Therefore, unless impractical, anionicemulsions should be pared with positively charged aggregates(i.e., calcareous), and cationic emulsions should be matchedwith negatively charged aggregates (i.e., siliceous) to avoid pos-sible incompatibility between the materials.
C H A P T E R 5
Chip Seal Materials Selection

15
The basic chip-seal design methods proposed by Hanson(1934–1935) and by Kearby (1953) provided the basis for futuredesign methods. From the original Hanson concepts evolvedthe McLeod procedure (McLeod 1960, 1969) that was lateradopted by the Asphalt Institute (Asphalt Institute MS19) andthe Austroads and South African methods (South AfricanRoads Agency 2007). The Kearby method was later improved(Benson and Gallaway 1953, Epps et al. 1981) and adopted byTexas. The United Kingdom designs “surface dressings” orchip seals using some of the Hanson concepts combined withideas of Jackson (1963).
Several methods have been used for the design of chip seals.The following discussion describes a design method based onthe Austroads method.
The purpose of chip-seal design is to select aggregate andasphalt emulsion application rates that will result in a durablepavement seal. The quantity of binder required depends onthe size, shape, and orientation of the aggregate particles;embedment of aggregate into the substrate; texture of thesubstrate; and absorption of binder into either the substrateor aggregate.
This design method is based on the following assumptionsfor aggregate, traffic, and embedment:
• Aggregate: one-sized aggregates with a flakiness index of15% to 25%
• Traffic: 10%, or less, heavy vehicles• Embedment: 50% to 65% chip embedment after two years
6.1 Emulsion Application Rate
The emulsion application rate is the spray quantity of asphaltemulsion applied during construction; it is determined asfollows:
B B EF PF A A A Ad b s e as aa= [ ]+ + + +� �
WhereBd = design binder application rate, gal/yd2
(L/m2);Bb = basic binder application rate, gal/yd2 (L/m2);EF = emulsion factor;PF = polymer factor (for polymer modified
emulsions, only); andAs, Ae, Aas, Aaa = adjustments for substrate texture, embed-
ment, absorption into substrate, andabsorption into cover aggregate, gal/yd2
(L/m2).
WhereBb = VF × ALD;
VF = design voids factor, gal/yd2/in (L/m2/mm); andALD = average least dimension of cover aggregate.
WhereVF = Vf + Va + Vt,Vf = basic voids factor,Va = aggregate shape adjustment factor, andVt = traffic effects adjustment factor.
Thus the design binder application rate is:
Each of these parameters is discussed below.
6.1.1 Basic Voids Factor, Vf
The basic voids factor depends on traffic level because traf-fic determines how much of the aggregate is embedded in thebinder. Figures 1a and 1b use English and SI units, respec-tively, for traffic of less than 500 vehicles per day per lane. Fig-ures 2a and 2b use English and SI units, respectively, for traf-fic of greater than 500 vehicles per day per lane. The threecurves in each figure represent a range of basic voids factors
B Vf Va Vt ALD EF PF A A A Ad s e as aa= + +( )[ ]{ }+ + + +� � �
C H A P T E R 6
Chip-Seal Design

16
0.80
0.90
1.00
1.10
1.20
1.30
1.40
1.50
1.60
1.70
1.80
0 50 100 150 200 250 300 350 400 450 500
Traffic, Veh/day/lane
Bas
ic V
oid
s F
acto
r, V
f, g
al/y
d2 /in
.Bleeding Limit
Raveling Limit
Target
(a)
0 50 100 150 200 250 300 350 400 450 500
Traffic, Veh/day/lane
0.15
0.17
0.19
0.21
0.23
0.25
0.27
0.29
Bas
ic V
oid
s F
acto
r, V
f, L
/m2 /m
m
Bleeding Limit
Raveling LimitTarget
(b)
Figure 1. Basic voids factor versus traffic for 0 to 500 vehicles/lane/day(Austroads 2006).
from a low binder content (raveling limit) to a high bindercontent (bleeding limit), which should not be exceeded.
6.1.2 Adjustment for Aggregate Shape, Va
The design method assumes the flakiness index will bebetween 15 and 25; an adjustment must be made for aggre-gates outside this range. Table 8 provides suggested adjust-ment factors.
6.1.3 Adjustment for Traffic, Vt
The basic voids factor, Vf, was developed for an average mixof light and heavy vehicles in a free traffic flow situation. Whenthis is not the case due to composition; non-trafficked areas;overtaking lanes with few heavy vehicles or for large propor-tions of heavy vehicles; channelization and slow-moving,heavy vehicles in climbing lanes; or stop/start conditions, an
adjustment, Vt, needs to be made. Table 9 shows recom-mended adjustments.
6.1.4 Average Least Dimension
The volumetric design of a chip seal is based on the assump-tion that aggregate particles tend to lie with the least dimensionvertical. The least dimension is defined as the smallest dimen-sion of a particle when placed on a horizontal surface, the par-ticle being most stable when lying with the least dimensionvertical. Thus in a chip seal, the final orientation of most par-ticles is such that the least dimension is near vertical, providingthere is sufficient room for the particles to realign. This aver-age least dimension, ALD, is as follows:
ALD mm M mm FI
ALD
, , or,
,
= + ×( )[ ]1 139285 0 011506. .
iin ALD mm. .= , 25 4

17
(a)
0.50
0.60
0.70
0.80
0.90
1.00
1.10
500 1500 2500 3500 4500 5500 6500 7500 8500 9500
Traffic, Veh/day/lane
Bas
ic V
oid
s F
acto
r, V
f, g
al/y
d2 /in
.
Bleeding Limit
Raveling Limit
Target
(b)
0
0.05
0.1
0.15
0.2
0.25
500 1500 2500 3500 4500 5500 6500 7500 8500 9500
Traffic, Veh/day/lane
Bas
ic V
oid
s F
acto
r, V
f, L
/m2 /m
m
Bleeding Limit
Raveling Limit
Target
Figure 2. Basic voids factor versus traffic for 500 to 10,000 vehicles/lane/day(Austroads 2006).
WhereM = median size of the aggregate (mm) andFI = flakiness index.
6.1.5 Emulsion Factor
An emulsion factor is applied to the basic binder applicationrate (before allowances) when using asphalt emulsions. This
factor allows a greater volume of binder around the aggregateparticles to compensate for reduced aggregate reorientationas a result of rapid increase in binder stiffness after the initialbreaking of the emulsion.
The basic binder application rate for emulsions, Bbe, is cal-culated as follows:
WhereBbe = basic binder emulsion application rate rounded to
the nearest 0.2 gal/yd2 [0.1 L/m2];Bb = basic binder application rate, gal/yd2 (L/m2); andEF = emulsion factor = 1.0 for emulsions with less than
67% residue and 1.1 to 1.2 for emulsions with residuesgreater than 67%.
Binder application rates are for residual binder and do notinclude the water content of emulsion.
B B EFbe b= ×
AggregateType
AggregateShape
FlakinessIndex, FI, %
Va,gal/yd2/in. [L/m2/mm]
Very Flaky >35 Too flaky, not recommended
Flaky 26–35 0 to –0.056 [0 to –0.01] Angular 15–25 0 Cubic <15 +0.056 [+0.01]
Crushed
Rounded – 0 to +0.056 [0 to +0.01] Uncrushed Rounded – +0.056 [+0.01]
Table 8. Suggested adjustment for aggregate shape,Va (after Austroads 2006).

6.1.6 Polymer Modified Emulsion Factor
When polymer modified emulsions are used, the appli-cation rate should be adjusted using the factor PF listed inTable 10.
The basic binder polymer modified emulsion applicationrate is calculated as follows:
Binder application rates are for residual binder and do notinclude the water content of emulsion.
6.1.7 Correction Factors
Corrections should be considered to account for the fol-lowing factors:
a) Texture of existing surface,b) Aggregate embedment into substrate,c) Binder absorption into the substrate, andd) Binder absorption into the chip-seal aggregate.
B B EF PFbpme b= × ×
a) Texture of Existing Surface, As
The surface texture of the existing substrate may havesome demand for emulsion and should be accounted for.This depends on the texture depth of the substrate, the typeof substrate (existing chip seal, hot mix asphalt, or slurryseal), and the size of cover aggregate to be applied. The cor-rection ranges from 0 gal/yd2 (L/m2) for chip seals over hotmix asphalt with texture depth no more than 0.1 mm to+0.11 gal/yd2 (L/m2) for 1⁄4-in. to 3⁄8-in. (5 to 7 mm) chip sealsover a surface with texture greater than 2.9 mm. A guide forestimating this correction is shown in Figures 3a and 3b forU.S. customary and SI units, respectively.
The pavement texture is commonly measured by thesand patch test (ASTM E 965). The test is accurate but is slow, exposes personnel to traffic, and wind effects canaffect results. The sand patch test was correlated to the circular track meter (ASTM E 1845) test method that isfaster, less susceptible to variation, and poses fewer safetyconcerns.
The sand patch test is a volumetric method for determiningthe average depth of pavement surface macrotexture. A knownvolume of small particles (either sieved sand or small glassbeads) is poured onto the pavement surface and spread evenlyinto a circle using a spreading tool. Four diameters of the cir-cle are measured, and an average profile depth is calculatedfrom the known material volume and the averaged circle area.This depth is reported as the MTD in millimeters. The methodis designed to provide an average depth value and is consideredinsensitive to pavement microtexture characteristics.
The CT meter test method (ASTM E 2157) is used to mea-sure and analyze pavement macrotexture profiles with a laser
18
Traffic Adjustment, Vt, gal/yd2/in. [L/m2/mm] Flat or Downhill Slow-Moving Climbing Lanes Traffic
Normal Channelized Normal Channelized Overtaking lanes of multilane rural
roads where traffic is mainly cars with
HV <=10%
+0.056 [+0.01] 0 0 0
Non-traffic areas such as shoulders,
medians, and parking
+0.112 [+0.02] 0 0 0
0–15 0 –0.056 [–0.01] –0.056 [–0.01] –0.112 [–0.02] 16–25 –0.056 [–0.01] –0.112 [–0.02] –0.112 [–0.02] –0.168 [–0.03] 26–45 –0.112 [–0.02] –0.168 [–0.03] –0.168 [–0.03] –0.224 [–0.04]**
EHV*,%
>45 –0.168 [–0.03] –0.224 [–0.04]** –0.224 [–0.04]** –0.281 [–0.05]*** Equivalent heavy vehicles, EHV, % = HV% + LHV% x 3
Where HV = vehicles over 3.5 tons and LHV = vehicles with seven or more axles ** If adjustments for aggregate shape and traffic effects result in a reduction in basic voids factor, Vf, of
0.224 gal/yd2/in [0.4 L/m2/mm] or more, special consideration should be given to the suitability of the treatment and the selection of alternative treatments. Note that a minimum design voids factor, Vf, of 0.56 gal/yd2/in [0.10 L/m2/mm] is recommended for any situation.
Table 9. Traffic adjustment, Vt (after Austroads 2006).
Traffic,veh/day/lane PF
<500 1.0
500 to 2,500 1.1
>2,500 1.2
Table 10. Polymer modifiedemulsion factors.

19
0.00
0.02
0.04
0.06
0.08
0.10
0.12
0 5 10 15 20 25
Sand Patch Diameter (based on 1.5 in3 sand volume)
Co
rrec
tio
n, g
al/y
d2
(a)
0.00
0.10
0.20
0.30
0.40
0.50
0.60
0 100 200 300 400 500 600
Sand Patch Diameter (based on 25,000 mm3 sand volume)
Co
rrec
tio
n, A
s, L
/m2
(b)
Figure 3. Surface texture correction factor, As versus sand patch diameter.
displacement sensor. The laser sensor is mounted on an armwhich follows a circular track that has a diameter of 284 mm(11.2 in.). Depth profiles are measured at a sample spacingof 0.87 mm, and the data are segmented into eight 111.5-mm(4.39-in.) arcs of 128 samples each. A MPD is calculated foreach segment, and an average MPD is then calculated for theentire circular profile.
Recent research under NCHRP Project 14-17 developed thefollowing relationship between sand patch texture depth andCT meter texture depth:
b) Embedment into Substrate, Ae
The embedment correction factor compensates for loss ofvoids in the chip seal under traffic due to chips being forcedinto the surface of the substrate. The depth of embedmentdepends on the volume and type of traffic and resistance of thesubstrate. The corrections shown in Figure 4 are recommended
Sand patch texture, mm CT meter textu= 0 9559. � rre( )+ 0 1401.
using the results from the ball penetration test method. In thismethod, a 3⁄4-in. (19-mm) ball bearing is driven into the sub-strate surface with one blow of a Marshall compaction ham-mer and several tests are conducted and averaged. When ballpenetration exceeds 3 mm, the pavement is considered toosoft to chip seal; alternative preventive maintenance tech-niques should be considered.
c) Absorption of Emulsion into Substrate, Aas
The correction for potential loss of emulsion to the substrateby absorption is applied primarily to chip seals constructedover surfaces other than hot mix asphalt pavements or previ-ous chip seals. The following corrections are suggested:
• Granular unbound pavements +0.04 to +0.06 gal/yd2
(+0.2 to +0.3 L/m2)• Pavements using +0.02 to +0.04 gal/yd2
cementitious binders (+0.1 to +0.2 L/m2)• Asphalt stabilized surfaces −0.04 to 0 gal/yd2
(−0.2 to 0.0 L/m2)

20
d) Absorption of Emulsion into Aggregate Chips, Aaa
Absorption of emulsion into the chips requires a cor-rection of +0.02 gal/yd2 (+0.1 L/m2) for each 1% of waterabsorption.
6.2 Aggregate Application Rate
The aggregate application rate is determined based on ALD,traffic volume, and chip size.
The aggregate spread rate for 3⁄8-in. (10-mm) and largerchips depends on the traffic.
a) For pavements with less than 200 vehicles/day/lane:
Where W is loose unit weight, lb/yd3.
b) For pavements with more than 200 vehicles/day/lane:
The range of spread rates for 3⁄8-in. (9-mm) and smallerchips depends on whether there are one or two layers of chipsplaced. It ranges from 0.104W to 0.093W (290 to 260 m2/m3)for a single layer to 0.089 W to 0.072W (250 to 200 m2/m3) fortwo layers.
Aggregate spread rate, lbs yd ALD, in. W2 = [ ]� 25.227
700Aggregate spread rate, m m ALD, mm2 3 = .
Aggregate spread rate, lbs yd ALD, in. W2 = [ ]� 27.008
750Aggregate spread rate, m m ALD, mm2 3 =
6.3 Time Until Sweeping and Traffic
The time required before sweeping or before traffic can be al-lowed on the fresh chip seal is related to the moisture content inthe chip seal (Shuler 2009). The laboratory test method inNCHRP Project 14-17 may be used to determine when the chipseal can withstand sweeping and traffic stresses. In this method,test specimens of the emulsion and chips are fabricated in thelaboratory and tested at three moisture contents. The moistureat which less than 10% of the chips are dislodged during the testis the target moisture content to be achieved in the field beforesweeping or traffic operations should commence.
6.4 Other Considerations
6.4.1 Chips Required to Avoid Roller Pickup
Additional aggregates than are actually estimated to pro-duce a one-stone layer should be spread during chip-seal con-struction to aid in reducing the potential for embedded chipsto be picked up by pneumatic rollers. The amount of addi-tional material will vary, but generally is between 5% and 10%.
6.5 Example Design
An example of how to use the design method to determinethe binder and aggregate spread rates follows.
If
Maximum aggregate size = 1⁄2 in.;Median aggregate size = 3⁄8 in.;Flakiness index = 30%;
0
0.5
1
1.5
2
2.5
3
3.5
4
0 500 1000 1500 2000 2500 3000 3500 4000 4500 5000
Traffic, Veh/day/lane
Bal
l Pen
etra
tio
n, m
m
B CA
Above Line CCorrection =-0.06 gal/yd2
(-0.30 L/m2)From Line B to CCorrection =-0.04 gal/yd2
(-0.20 L/m2)From Line A to B Correction =-0.02 gal/yd2
(-0.1 L/m2)No Correction Needed this side of Line A
Surface Too Soft for Chip Seal Above this Line
Figure 4. Correction factors for chip penetration into substrate (Austroads 2006).

Loose unit weight, W = 110 lbs/ft3;Traffic = 1,500 veh/day/lane, channelized, with equivalent
heavy vehicles, EHV%=16;Polymer modified emulsion binder with 70% residue;Sand patch diameter for texture = 18 in.;Ball penetration = 0.5 mm;Substrate is old chip seal with no expected absorption poten-
tial; andChip-seal aggregate has 1% water absorption
Design binder application rate (from Section 6.1) is:
Vf = 0.85 gal/yd2/in., from Figure 2b;Va = −0.028 gal/yd2/in., from Table 8;Vt = −0.112 gal/yd2/in., from Table 9;
B Vf Va Vt ALD EF PF A A A Ad s e as aa= + +( )[ ]+ + + +� � �
ALD = 0.328 in.;EF = 1.2, from Section 6.1.5;PF = 1.1, from Table 10;As = 0.02 gal/yd2, from Figure 3a;Ae = 0, from Figure 4;
Aas = 0, from Section 6.1.7c; andAaa = +0.02 gal/yd2, from Section 6.1.7d.
Aggregate spread rate (from Section 6.2)
AL= DD, in W, lbs yd
25.27
3�
� �
[ ]= =
25 27
0 328 110 27 38
.
. .55 lbs yd2.
Bd = − −( )[ ]+ +
0 85 0 028 0 112 0 328 1 2 1 1
0 02
. . . . . .
.
� � �
00 0 0 02 0 352+ + =. . gal yd
21

22
7.1 Equipment Calibrations
7.1.1 Distributor
Because a uniform application of material laterally and lon-gitudinally on the pavement is required, the machines used forthis purpose, whether controlled by computer or not, mustbe calibrated prior to arrival on the project. First, the nozzlesinstalled in the spray bar should be the appropriate size forthe planned transverse application rate. Nozzles of equal sizeare required for a uniform transverse application rate. Whenthe transverse rate is lower in the wheel paths, the nozzlesshould be sized accordingly. However, the number designa-tion of the nozzle should be checked for flow rate against thepublished flow rate of the manufacturer using a laboratoryflow bench. Nozzles used in the spray bar should be checkedas a group. Nozzles deviating by more than 10% of the aver-age flow rate of the group should be discarded, replaced, orcorrected to allow flow that conforms to the average flow rate.
Nozzles that are calibrated to provide uniform lateral flowmust be re-installed in the spray bar following manufacturer’srecommendations and ensuring that each nozzle is alignedat the correct angle to provide desired spray overlap. Noz-zle angle can usually be adjusted using the wrench providedby the distributor manufacturer, an adjustable wrench, orappropriate-sized open-end wrench. Nozzle angle usuallyranges between 15 and 30 degrees.
After the nozzle angle is set properly, the height of the spraybar must be adjusted. If the bar is not set to the proper height,an excess or lack of emulsion will form ridges or streaks onthe pavement, as depicted in Figure 5.
This adjustment process is accomplished by shutting offthe appropriate nozzles to determine where the spray patterncontacts the pavement, as shown in Figure 6. Every other noz-zle should be turned off for a double-lap application, and twonozzles should be turned off for every one that is left on for atriple-lap application. The distributor operator should sprayemulsion onto the pavement surface for as short an interval
as possible while an observer watches where the emulsion hitsthe pavement from each nozzle left open. Emulsion overlapsindicate that the bar is too high, and a gap indicates that thebar is too low. Note that the bar will rise as the distributorempties during spraying, but this rise does not usually causesignificant streaking that requires spray bar adjustment.
Uniformity of lateral flow from the spray bar should bedetermined by collecting a measured volume of emulsionin containers placed under each nozzle. This process can bedone using standard 6-in. by 12-in. concrete cylinder moldslined with one-gallon freezer bags (Shuler 1991). One bag ispositioned under each nozzle and emulsion is sprayed into thelined cans until approximately 75% full. Flow is then stoppedand each lined can is weighed. The weight of each lined canshould be within 10% of the average for all of the nozzles. Anynozzles that deviate from this should be replaced and the testrerun. The cylinder molds can be re-used and the bags withthe contents discarded appropriately.
Longitudinal calibration of the distributors is done bymeasuring the volume of the distributor before sprayingand after spraying 70% to 90% of the distributor volume.The volume sprayed can be determined using the dipsticksupplied with the distributor. The longitudinal spray ratecan then be calculated by determining the area sprayed. Thisvalue should then be compared to that displayed by the dis-tributor computer, if equipped, to evaluate computer accu-racy; if the rate applied differs from design by more than 5%,corrective action should be taken and the calibration rerun.This calibration should be made each day. The following isan example of such a calibration:
Assuming:1,800-gal capacity asphalt distributor, 12-ft-wide spraywidth, trial spray distance = 4,630 fe, 0.32 gal/yd2 designspray rate, dipstick reading beginning of shot = 1,765 gal,dipstick reading end of shot = 185 gal
1. Check volume shot. 1,765 − 185 = 1,580 gala. 1,580/1,765 = 89.5% > 70% and < 90%. OK.
C H A P T E R 7
Construction

23
Bar Set Too High
Streaks from Excess Emulsion
Bar Set Too Low
Streaks from Lack of Emulsion
Figure 5. Streaks caused by incorrect bar adjustment(after Wood et al. 2006).
Emulsion Contact for Double Lap Application
Turn Off These Nozzles
Emulsion Contact for Triple Lap Application
Turn Off These Nozzles
Figure 6. Obtaining no streaking for double and triple lapapplication.
2. Calculate spray rate = 1,580 gal/(12 ft × 4,630 ft/9 ft2/yd2)= 0.26 gal/yd2
a. 0.32 − 0.26 = 0.06 gal/yd2, which is greater than 5%of the difference between the actual spray rate andthe design.
3. Therefore, make adjustments to distributor speed orspray bar until the rate applied is within 5% of 0.32.
7.1.2 Chip Spreader
The chip spreader should be checked for uniform applica-tion both laterally and transversely. Lateral distribution isbest checked using ASTM D 5624, “Standard Test Methodfor Determining the Transverse-Aggregate Spread Rate forSurface Treatment Applications.” Once accomplished andany spreader gates have been adjusted for variations, the lon-gitudinal spread rate can be measured by applying the entirespreader capacity to the pavement and measuring the appli-cation rate. The mass of chips applied can be determined fromweigh tickets of trucks loading the chip spreader. Conduct thecalibration for three trucks and average the results. An exam-ple follows.
For 12-ton capacity tandem dump trucks, 12-ft-wide pave-ment, and 28 lbs/yd2 design spread rate:
1. For truck no. 1:a. Load = 23,803 lbsb. Spreader distance = 213 ftc. Rate = 23,803/213 × 12/3 = 27.9 lbs/yd2
2. For truck no. 2:a. Load = 23,921 lbsb. Spreader distance = 211 ftc. Rate = 23,921/211 × 12/3 = 28.3 lbs/yd2
3. For truck no. 3:a. Load = 23,848 lbsb. Spreader distance = 213 ftc. Rate = 23,848/213 × 12/3 = 28.0 lbs/yd2
4. Average rate = (27.9 + 28.3 + 28.0)/3 = 28.1 lbs/yd2
5. No adjustment needed (measured rate is within 1% ofdesign).
Compensation for moisture on chips must be taken intoaccount when calibrating chip spreaders.
7.2 Operations
7.2.1 Pavement Preparation
The substrate pavement should be structurally sound beforechip sealing. Areas exhibiting alligator cracking should bepatched the full depth of the pavement section using hot mixasphalt. The surface of these areas should be sprayed with alight application of slow-setting asphalt emulsion diluted50:50 with water at the rate of 0.10 gallons per square yardand allowed to cure thoroughly before chip sealing so that thenew chip-seal binder will not be absorbed into the surface ofthe new patch. Failure to do this could lead to loss of chipsunder traffic.
The substrate pavement should be clean before commenc-ing chip-seal operations. Dust and debris on the surface shouldbe removed by power brooms. Pickup type brooms should beused in urban areas to avoid spreading surface contaminantsonto adjacent properties. Push brooms may be used in ruralareas when spreading excess chips onto shoulders does notaffect property owners. The surface of the substrate pavementshould be damp to dry. A damp surface is acceptable as long as

moisture is present only in surface aggregate voids and is notpresent as free moisture between aggregates.
7.2.2 Environmental Conditions
The pavement temperature for chip-seal operations shouldbe a minimum of 70°F with little or no wind. However, chip-seal operations may commence before the pavement tem-perature reaches 70°F as long as pavement temperatures areexpected to be 70°F and rising within 60 minutes after com-mencing work.
Wind speeds in excess of 20 mph transverse to the pavementalignment can blow asphalt emulsion onto opposing trafficon two-lane facilities; therefore, chip-seal operations shouldbe avoided under these conditions.
Chip-seal operations should not be pursued if rain isthreatening. A rain storm could wash asphalt emulsion ontoconcrete gutters or into roadside ditches.
Ambient air temperatures in excess of 110°F with the sunshining or with moderate winds can cause emulsified as-phalts to form a skin on the surface such that the emulsiondoes not set adequately. This situation may require thespread of chips closer to the distributor to obtain properembedment. However, high air temperatures may lead tolower viscosity emulsion residue, resulting in higher poten-tial for pickup on rubber tire rollers. Increasing the demul-sibility of anionic emulsions may help remedy this situation(Shuler 1991).
There is anecdotal evidence to support limiting the seasonfor chip sealing so chip seal construction does not occurwhen there may be periods of cool to cold weather.
7.2.3 Emulsion Application
Each emulsion application should start and stop by spray-ing on top of 15 lb/yd2 roofing paper or similar dimensioned,equally heavy craft paper placed transverse to the centerline ofthe pavement. This creates a neat, sharp transverse joint. Thedistributor operator should position the spray bar at the rearof the paper on takeoff so that by the time the bar reaches thepavement the distributor speed is appropriate for the desiredspray rate. Another sheet of roofing paper should be placedacross the pavement before the distributor stops. Sprayingshould stop when the spray bar has passed over the paper. Cal-culating when approximately 90% of the distributor volumehas been sprayed is a good method to determine the distancewhere the second strip of roofing paper should be placed.
7.2.4 Chip Application
Chips should be applied to the surface of the fresh emulsionbefore it begins to set but not necessarily immediately after
spraying. If the chips are applied too early, there is risk that thechips will roll over in the emulsion due to momentum createdby the forward movement of the chip spreader. Thus, lessbinder will be available to hold the chips in place and theexposed binder becomes susceptible to being picked up onroller tires. Therefore, the adhesive quality of the emulsionshould be checked to determine when to apply the chips. Thismay be determined by throwing a handful of chips onto theemulsion and observing whether they stick to the surface ortend to roll over. Some experimentation is necessary to es-timate the proper timing, which can be accomplished dur-ing the first distributor application. In many cases, changesin environmental conditions during construction will requirethis test be repeated during the day because humidity, chipmoisture, emulsion properties, and ambient air temperatureaffect the adhesive quality of the emulsion.
7.2.5 Rolling
Different types of rollers have been used to embed chips onchip seals. Pneumatic rollers have a tendency to pick up chipsdue to the affinity of asphalt residues for rubber tires. How-ever, these rollers do not crush chips in situ as do steel-wheeled rollers. Although lightweight steel rollers of three tonsor less may provide a means of leveling the surface of a newchip seal after pneumatic rolling, caution must be applied toavoid breaking aggregate chips. Steel rollers with rubber-coated drums are also a good tool for embedding chips. How-ever, any rigid drum roller will bridge over areas of the pave-ment with permanent deformation, causing these areas to beinadequately rolled.
Rollers must be able to keep up with the distributor andchip spreader and provide enough passes to embed the chips.If the rollers travel too fast, embedment will not be achieved.Therefore, the number of rollers used depends on roller speed,roller width, distributor and chip spreader speed, and thenumber of passes required to achieve embedment. The fasterthe rollers move, the more rollers will be required to achieveembedment. This is because rollers need to linger over an areaof chip seal to obtain the desired chip embedment (Bensonand Gallaway 1953, Elmore et al. 1995). The number of rollersrequired can be calculated based on this linger time and theassumption that the rollers should match the production of the distributor and chip spreader as follows (Gransberget al. 2004):
WhereN = number of rollers;P = distributor speed, fpm;x = lane width, ft; and
N Px A= 6 67.
24

A = area covered in one hour by rollers to get minimum“linger,” yd2.
As an example, for a distributor traveling at 200 fpm andspraying 12-ft wide at a conservative 5000 square yards perhour coverage rate, N = 3.20 (i.e., use 4 rollers). Fewer rollerswill not be able to keep up with the distributor and spreaderwhile maintaining the 5000 yd2/hr rolling rate. If they do keepup, the rollers will not spend enough time embedding aggre-gates because they are traveling too fast.
7.2.6 Initial Sweeping After Rolling
Light brooming should occur as soon as possible afterrolling and before vehicular traffic is allowed on the surface toremove any excess chips. This should be possible when themoisture content of the chip seal reaches the level where 10%chip loss occurs after the laboratory sweep test. This moisturecontent, measured by the moisture loss test, was found to beapproximately 15% to 25% of the total moisture present in thechip seal and indicated that total moisture consists of water inthe emulsion plus moisture in the aggregate chips, but notmoisture in the pavement (see attachment). Moisture contentof the chip seal should be measured in areas of the projectwhere moisture loss is expected to be least rapid, such as shadyor cooler locations. Caution should be exercised when imple-menting this practice since it is based on limited research. Usingvacuum brooms or push brooms with nylon (not steel) bris-
tles should be applied with much care to avoid damage tothe fresh seal.
7.2.7 Vehicular Traffic Under Traffic Control
Vehicular traffic may be allowed on the fresh seal after ini-tial sweeping if speeds can be controlled to less than 20 mphusing pilot vehicles. If speeds cannot be controlled to thisspeed, vehicles should not be allowed on the seal until finalsweeping has been completed. Traffic control using pilot ve-hicles should be applied following the Manual on UniformTraffic Control Devices for Streets and Highways (2009).
7.2.8 Removing Traffic Control
Traffic control may be removed and vehicular traffic allowedon the fresh chip seal after brooming has been completedto remove excess or loose chips and the moisture contentof the seal reaches the level that results in less than 10% chiploss after the laboratory sweep test. This moisture content,measured by the moisture loss test, is approximately 15%to 25% of the total moisture present in the chip seal (whichconsists of the water in the emulsion plus moisture in the ag-gregate chips, but not moisture in pavement). Moisture con-tent of the chip seal should be measured in areas of the proj-ect where moisture loss is expected to be slowest (e.g., shadyor cooler locations).
25

26
Quality control is required to ensure desired performance.The following section describes procedures that should befollowed to improve the likelihood of good performance fora chip-seal project.
8.1 Aggregate Sieve Analysis
Aggregate gradation should be checked whenever there ispotential for significant variation in the chip gradation. Forexample, if chips have been stockpiled near the project andthere is sufficient quantity to supply the entire project, a com-plete gradation analysis before construction begins, and every100 tons thereafter, should be adequate. Also, loader opera-tions at the stockpile can produce excess material passing theno. 200 screen and should, therefore, be monitored. Aggregategradation should not deviate from the target design gradationby more than the following tolerances:
Tolerance,Sieve ±, %
3⁄4 51⁄2 53⁄8 4No. 4 3No. 8 1No. 200 0.5
When chips are supplied from multiple locations, sam-pling and testing for gradation should be done with morefrequency, including checking each truck if high variabilityis suspected. Because a full sieve analysis may not be practical,hand sieving in the field using only the coarse aggregate screenscan provide information on the suitability of the material orhelp determine if more laboratory testing is needed.
8.2 Moisture Content of System
The moisture content of the chips should be measured at thebeginning and the end of the day for (1) calculating aggregatespread rate and (2) determining when sweeping can be done
and when traffic control can be removed. Moisture content canbe determined by complete moisture evaporation from thechips using a forced draft oven or a microwave oven. By weigh-ing the chips before and after removing moisture, the moisturecontent (w) can be determined as follows:
8.3 Embedment Depth MeasurementDuring Construction
Embedment depth is usually determined during construc-tion by pulling several chips out of the binder and visually esti-mating the amount of embedment. This is difficult and oftensubjective even if chips have a very low flakiness index. There-fore, a new method is recommended of spreading a volume of50 cm3 of glass beads over the surface of the embedded chipsand measuring the diameter. During the chip-seal design, therelationship between glass bead diameter and aggregate embed-ment is determined. During construction the glass beads arespread on the pavement and the diameter measured. Embed-ment is then determined using the relationship between glassbead diameter and embedment from the design measurements.
8.4 Field Viscosity
The viscosity of the emulsion should be checked for eachtransport load. This can be done in the absence of a field lab-oratory using a Wagner flow cup. Flow times of 20 to 70 s at85 to 150°F for a 6-mm orifice or 10 to 60 s at 85 to 140°F fora 7.5-mm orifice have been found to provide satisfactory flowrates. If flow rates using a Wagner cup are not within theselimits, the temperature of the emulsion should be checked todetermine if emulsion temperature is the cause. If tempera-ture of the emulsion is not causing unacceptable flow rates,other causes should be investigated.
w,wet weight dry weight
wet weight% = − ×100
C H A P T E R 8
Quality Control

27
9.1 Less Than One Year
Performance during the very early life of the chip seal isjudged based on chip loss or flushing. Chip loss can happenas soon as a few hours after removing traffic control. If theloss is greater than 10% of the applied chip quantity (assuminga one-layer chip application), the cause should be investigated.Often, early failures of this type are due to high chip applica-tion rates, low emulsion application rates, or both. Early chiploss can also be due to excess material passing the no. 200screen, or aggregate not meeting gradation requirements.Unexpected low temperatures, wet weather, or opening to traf-fic before adequate residue adhesion has developed can causeearly chip loss.
Inundation of chips occurs because of high emulsion appli-cation rate, embedment of chips in the substrate, or both.
Streaking or roping is caused by the spray bar on the as-phalt distributor being either too high or too low. Correctionafter construction is not possible without the application ofanother seal.
9.2 Greater Than One Year
Performance after one year can be measured using texturedepth. Some specifications (Austroads 2006) limit design lifebased on texture of less than 0.9 mm on pavements with speedsgreater than 43 mph. The following relationship has been pro-posed as a means of predicting approximate texture after oneyear (Gransberg et al. 2005):
WhereTd1 = texture depth in 1 year, mm;
Yd = design life in years; andALD = average least dimension of the aggregate, mm.
Texture depth is determined using sand patch or CT metertests. If texture is less than the predicted value, the textureshould be monitored to determine if a loss of texture beyond0.9 mm is expected.
Td ALD log Yd1 0 07 0 9= +. .
C H A P T E R 9
Performance

28
Austroads. Austroads Test Method AG:PT/T051, Average Least Dimen-sion of Aggregate by Direct Measurement (Nominal Size 10 mm orGreater). June 2005.
Austroads. Austroads Technical Report AP-T68/06, Update of theAustroads Sprayed Seal Design Method. Alan Alderson, ARRBGroup, ISBN 1 921139 65 X, 2006.
Benson, F. and B. Gallaway. Retention of Cover Stone by Asphalt Sur-face Treatments. Texas Engineering Experiment Station, 133,1–58, 1953.
Dumas, B. Proceedings of the 8th Conference on Asphalt Pavements forSouthern Africa (CAPSA’04), September 12–16, 2004, Sun City,South Africa. ISBN 1-920-01718-6.
Elmore, W. E., M. Solaimanian, R. B. McGennis, C. Phromson, andT. W. Kennedy. Performance-Based Seal Coat Specifications. CTRResearch Report No. 1367-1, Center for Transportation Research,Austin, Texas, 1995.
Epps, J. A., B. M. Gallaway, and C. H. Hughes. Field Manual on Designand Construction of Seal Coats, Research Report 214-25, TexasTransportation Institute, July 1981.
Gallaway, B. M. and W. J. Harper, A Laboratory and Field Evaluationof Lightweight Aggregates as Coverstone for Seal Coats and SurfaceTreatments, Research Report 51-2, Texas Transportation Institute,Texas A&M University, College Station, 1966.
Gransberg, D., I. Karaca, and S. Senadheera. Calculating Roller Require-ments for Chip Seal Projects. Journal of Construction Engineeringand Management, 130 (3), May/June 2004, 378–384.
Gransberg, D., B. Pidwerbesky, R. Stemprok, and J. Waters. MeasuringChip Seal Surface Texture with Digital Imagery. International Con-ference on Surface Friction of Roads and Runways, Christchurch, NZ,May 2005.
Hanson, F. M. Bituminous Surface Treatments on Rural Highways.Proceedings of the New Zealand Society of Civil Engineers, Vol. 21,1934–1935, p. 89.
Jackson G. P. Surface Dressing. Bitumen Division, Shell InternationalPetroleum Co. Ltd., London, 1963.
Kearby, J. P. Tests and Theories on Penetration Surfaces. HighwayResearch Record 271, HRB, National Research Council, Washington,D.C., 1953, pp. 232–237.
Lee, J. S. and Y. R. Kim. Understanding the Effects of Aggregate andEmulsion Application Rates on the Performance of Asphalt SurfaceTreatments. In Transportation Research Record: Journal of the Trans-portation Research Board, No. 2044. Transportation Research Boardof the National Academies, Washington, D.C., 2008, pp. 71–78.
Manual on Uniform Traffic Control Devices for Streets and Highways(MUTCD 2009), U.S. Department of Transportation, FHWA.
Martin, R. District Maintenance Engineer, Texas DOT, personal obser-vations of distributor spray nozzle calibration and practice, 1989.
Minnesota DOT. Laboratory Manual Test for Flakiness Index, FLH T508.January 3, 2005.
McLeod, N. Basic Principles for the Design and Construction of SealCoats and Surface Treatments. Proceedings of the Association ofAsphalt Paving Technologists, 29, 1–150, 1960.
McLeod, N. W. Seal Coat Design. Proceedings of the Association of AsphaltPaving Technologists, Vol. 38, February 1969.
Peshkin, D. G., T. E. Hoerner, and K. A. Zimmerman. NCHRP Report523: Optimal Timing of Pavement Preventive Maintenance TreatmentApplications. Transportation Research Board of the National Acad-emies, Washington, D.C., 2004.
Shuler, S. High Traffic Chip-Seal Construction: The Tulsa Test Road.Transportation Research Record 1300. TRB, National Research Coun-cil, Washington, D.C., 1991.
Shuler, S. Interim Report: Pavement Preventive Maintenance Treatments.Project 10.50, Colorado Department of Transportation, Denver,CO, 2007.
Shuler, S. and A. Lord. A New Laboratory Test for Predicting Very EarlyChip Seal Performance, Journal of the Association of Asphalt PavingTechnologists, Vol. 78, 2009.
South African National Roads Agency, Ltd. Design and Construction ofSurfacing Seals. Technical Recommendations for Highways, TRH32007, Pretoria, South Africa, pp. 1–276.
Texas DOT. Tex-224-F, Test Procedures for Determining FlakinessIndex. Consumer Division, December 2004.
Utah DOT, Open-Graded Friction Course (OGFC) Specification, 02786,January 1, 2008.
Wood, T. J., D. W. Janisch, and F. S. Gaillard. Minnesota Seal Coat Hand-book 2006, Report No. MN/RC-2006-34, June 2006.
References

29
The proposed test methods, prepared as part of NCHRP Project 14-17, Manual for Emulsion-Based Chip Seals for PavementPreservation, are the recommendations of the NCHRP Project 14-17 staff at Colorado State University. These test methods havenot been approved by NCHRP or any AASHTO committee nor have they been accepted as AASHTO specifications.
A P P E N D I X
Recommended Test Methods
CONTENTS
Recommended Standard Method of Test for Embedment Depth of Chip-Seal Aggregates in the Lab and the Field, 30Recommended Standard Method of Test for Laboratory Chip Loss from Emulsified Asphalt Chip Seal Samples, 39Recommended Standard Method of Test for Measuring Moisture Loss from Chip Seals, 53Recommended Standard Method of Test for Recovery of Asphalt from Emulsion by Stirred-Can Method, 59Recommended Standard Method of Test for Determining the Strain Sensitivity of Asphalt Emulsion Residue Using Strain Sweeps Performed on a Dynamic Shear Rheometer (DSR), 63

Recommended Standard Method of Test for Embedment Depth of Chip-Seal Aggregates in the Lab and the Field
AASHTO Designation: Txxx-xx
1. SCOPE
1.1 This test method provides the average aggregate embedment depth, in asphalt, of field chip seals and laboratory specimens.
1.2 The values stated in SI units are to be regarded as the standard unless otherwise indicated.
1.3 A precision and bias statement for this standard has not been developed at this time. Therefore, this standard should not be used for acceptance or rejection of a material for purchasing purposes.
This standard does not purport to address all of the safety concerns, if any, associated with its use. It is the responsibility of the user of this standard to establish appropriate safety and health practices and determine the applicability of regulatory limitations prior to use.
2. REFERENCED DOCUMENTS
2.1 ASTM Standard:
• D 8, Terminology Relating to Materials for Roads and Pavements
3. SUMMARY OF TEST METHOD
3.1 Where the void ratio of an area of chip seal may be estimated with acceptable accuracy, and where voids (Note 1) between all chip-seal particles are filled with a given mass of glass beads of known packing density, the average height of beads within the chip seal layer may be determined. This average height of beads between the surface level of the asphalt and the average height level of the chip-seal particles would reflect the chip seal’s texture height. Given the average particle height of the chip-seal aggregate, one may perform a calculation, using the evaluated texture height, to yield the chip-seal embedment depth.
30

Figure 1. Undulating profile over particle peaks and voids.
Figure 2. Profile remains unchanged at all embedments.
ChipSealBeddingPlane
Height of averageparticle
Asphalt Aggregate
Imaginary undulating surface: upper bound of
chip seal voids
H E
Volume of chip seal voids
T
Voidsfilled by asphalt
Profile of voids remains unchanged at all embedments
ChipSealBeddingPlane
Height of averageparticle
Asphalt Aggregate
Imaginary undulating surface: upper bound of
chip seal voids
H
E
T
Volume of chip seal voids
Note 1—For the purposes of this test method, it is assumed that the actual chip-seal voids are those that exist above the asphalt surface and below the profile of an imaginary, three-dimensionally undulating, flexible membrane that is draped over aggregate particles and forced to come into contact with the peak of each particle (see Figure 1 and Figure 2).
31

32
Two procedures are provided, each of which ma y be used to evaluate a field chip seal or a specimen chip seal for embedment depth. In the first, the “spreading procedure,” a known, fixed volume of glass beads is spread into a circular area over the surface of a chip seal to fill th e voids between the particles, which are illustrated in Figure 1. The glass beads bridge between the peaks of the chip-seal particles in all directions and form an undulating profile. Effectively the average height of glass beads covering the specimen is the same as the height of the chip seal’s average particle (Note 2). The circular area, achieved with the fixed volume of glass beads, is used to evaluate embedment depth.
Note 2— For simplification, it is assumed that an “equivalent” chip seal, constructed with one-sized, identical particles, each with height equal to the average particle height, may be substituted for the actual chip seal that contains voids as defined in Note 1. It is further assumed that the constituents of such an equivalent chip seal, of the same area as the actual chip seal, would precisely reflect the height of asphalt and the volumes of asphalt, aggregate particles, and voids that exist in the actual chip seal. In this regard, the texture height is the height between the level of the asphalt surface and the level of the top of particles in the equivalent chip seal (Figure 3).
Figure 3. Equivalent chip seal.
ChipSealBeddingPlane
Height of averageparticle
Volume of chip seal voids
H
E
T
Asphalt Aggregate
In the second procedure, the “submerging procedure,” a known, variable volume of glass beads is used to completely cover all chip-seal particles within a fixed area to a fixed level above the height level of the chip seal’s average particle (Figure 4). In order to determine the volume of beads within the chip-seal voids, a calculation is first performed using the concept of the flat-topped equivalent chip seal (Note 2) to determine the excess volume of beads that occupies the space above the chip seal (Figure 5). The void volume is obtained by subtracting the excess volume of beads from the total volume of glass beads on the chip-seal area. This allows for evalua-tion of the embedment depth.

33
Figure 4. Submerging procedure.
Figure 5. Equivalent model for the submerged chip seal.
ChipSealBeddingPlane
Height of averageparticle
S
H
E
T
“C” is the volume of all beads deposited directly on the chip
seal of fixed area “A”
M
Base (optional), of area “R,” under
laboratory chip seal
Top of mold
Mold of area “W”
Excess beads, “C – B,”
above chip sealGlass beads, “B,” in voids
Asphalt Aggregate
ChipSealBeddingPlane
Height of averageparticle
Asphalt Aggregate
Glass beads, “C – B,”
above voids
S
M
Base (optional), of area “R,” under
laboratory chip seal
Top of mold
Imaginary undulating surface: upper bound of
chip seal voids
H
E
T
“C” is the volume of all beads deposited directly on the chip
seal of fixed area “A”
Mold of area “W”
Glass beads, “B,” in voids
Note 3—The submerging procedure, which may be used for any degree of embedment, has been devised primarily to account for the situation, at very high embedment depths, where the asphalt surface intersects the imaginary membrane defined in Note 1. In this situation, where some particle peaks are covered, it may become difficult to spread the beads to follow the required profile illustrated in Figure 2.

34
4. SIGNIFICANCE AND USE
4.1 This test method is intended to be used in the evaluation of embedment depth in field and specimen chip seals.
4.2 In predicting future performance of a chip seal, embedment depth evaluation is critical. This is because performance, in certain aspects such as reduced aggregate loss, is likely to increase as embedment depth increases. Performance in terms of high skid resistance and reduced construction cost, on the other hand, is likely to decrease with increased embedment beyond a certain level.
4.3 Additionally, embedment depth evaluation is important simply because it is often the only practical means by which an apparently sound field chip seal may be evaluated.
4.4 Ultimately, the results of embedment depth evaluations enable better quantification of the relative risk associated with apparently sound roads.
5. APPARATUS
5.1 Balance – The balance must be capable of weighing approximately 10,000 g of glass beads per square meter of chip seal to within +0.1 g.
5.2 Glass Cylinder/Container – A smooth-bottomed glass cylinder is to be used for the spreading procedure. A drinking glass (a shot glass) used for this purpose also doubles as a container for weighing glass beads and pouring them onto the chip-seal surface.
5.3 Measuring Tape – This is used to measure the diameter of glass bead circles achieved using the spreading procedure. The tape is to be graduated in millimeters.
5.4 Laboratory Mold – Used in the submerging procedure in the laboratory, the mold is to have a constant height (M) and a constant cross sectional area (W) large enough to accommodate the specimen chip seal. Additionally, when filled to its rim, the mold must provide for complete submergence of the specimen chip seal.
the tallest chip seal particle in order to allow smooth screeding of the surface.
5.5 Working Platform – For precision, the specimen chip seal and laboratory mold should always be prepared and configured on a flat and level platform.
Note 4—The top elevation of the mold needs only to be some 3 mm higher than

35
5.6 Offset Spacers – To perform the submergence procedure in the field, offset spacers of known height are used to establish an offset distance from the bedding plane of the chip seal. The tops of the spacers are equidistant from the bedding plane and higher than the average particle height in order to achieve submergence of chip-seal particles.
Note 5—The submerging procedure is not a suitable candidate on steeply sloping roadways or where the level of the bedding plane is unknown. The procedure is suitable on areas where the bedding plane level has been recorded and where the plane is flat and approximately level in the area to be tested.
5.7 Field Mold – When carrying out the submerging procedure in the field, a field mold is to be used to form the glass beads over a fixed area of chip seal. The field mold is to be built up using a perimeter gasket wall and a flat metal surface with a cutout. The vertical-faced gasket wall, which may consist of moldable putty or silicone, must be shaped such that it dams the spaces between chip-seal particles and finishes flush with the cut-out area of the metal surface. Placement of the metal surface is to be accommodated by the use of offset spacers such that it is flat, at a known height above the average chip-seal particle, and allows full submergence of the chip seal.
6. PREPARATION OF MATERIALS
6.1 Specimen Chip Seal – For the purposes of this test method, a specimen chip seal is constructed on a flat and level base, or sheet, of known thickness (S) and area (R).Additionally, for the submerging procedure, it must be possible to place the specimen into a mold or to form a mold around the chip seal.
6.2 Area of Chip Seal – Precisely measure the chip seal area (A), which is being evaluated for embedment.
6.3 Glass Beads – These are fine particles of glass that are able to fit between chip-seal particles and, en masse, follow the contours of the particles’ surface.
6.4 Packing Density of Glass Beads – Fill the tared mold, of known volume (K), with glass beads and weigh the filled container. Establish the packed glass beads’ mass per unit volume (P) for use in the following procedures.
7. SPREADING PROCEDURE IN THE LAB AND IN THE FIELD
7.1 Using the tared glass cylinder/container, weigh out a pre-calculated mass of glass beads that will provide a chosen volume (B) at a packed density (P) (defined in section 6). Record the mass to the nearest 0.1 g.

36
7.2 Pour the glass beads onto the center of the specimen to form a pile. Position the glass cylinder on the pile of glass beads and move it in a circle to spread the beads into a circular area.
7.3 Use the fingers to continue spreading the beads outward in a circle while allowing the beads to accumulate between particle peaks, completely and exactly filling the void volume (Note 1). This is achieved when only the highest point of each aggregate particle (not otherwise submerged by asphalt) is exposed.
7.4 Place a marker at the approximate center of the circular area of beads. Rotating about the marker, take four diameter measurements, with the measuring tape, in line with the marker and rotationally offset 45 degrees from each other. Calculate the average circle diameter (D).
8. SUBMERGING PROCEDURE IN THE LAB AND IN THE FIELD
8.1 Weigh and record, to the nearest 0.1 g, the mass of a volume (Y) of glass beads, which will be more than enough to cover the chip seal and fill the mold.
8.2 For the lab procedure, place the specimen chip seal into the mold or form the mold around the specimen, ensuring that the mold and the specimen are flat and level and that complete submergence of the chip seal will be achieved.
8.3 For the field procedure, install the offset spacers such that they are elevated a known height above the bedding plane of the chip seal as a guide for the installation height of the field mold.
8.4 Sweep the field chip seal clean and install the mold over the area to be evaluated such that the mold’s top surface is flat and at a known offset distance above the bedding plane of the chip seal.
8.5 Pour glass beads into the mold and screed the surface of the beads flush with the top of the mold. The chip-seal aggregate particles should be completely covered by glass beads.
8.6 Carefully recover the glass beads that were screeded off the mold. Weigh the unused portion of beads and calculate the total mass of beads deposited into the mold. In turn, use this result along with the packing density (P) to calculate the total volume (G) of beads deposited into the mold.
8.7 For laboratory molds that are larger in area than the specimen chip seal, also calculate the volume of beads (C) (section 9), which is deposited directly on the chip seal surface area under evaluation.

37
9. CALCULATIONS
9.1 The chip seal’s texture height ( T ) is the average height dimension of the un-embedded portion of particles. The average height level of this un-embedded portion is the same as the average height level of the chip-seal particles. Therefore, the texture height is equivalent to the dimension difference between the depth of asphalt ( E ) and the average particle height ( H ). Where a volume of beads ( B ) is shaped such that it fills the chip seal voids, the texture height can be calculated from the following:
aggregate and beads of area plan
surface asphalt the above aggregate and beads of volume T =
That is:
T = { B + [ T (1 – V ) A ]}/ A ; T = B /( A * V ) (1)
And the embedment is obtained using the following:
E = H – T (2)
Where
Where
T = texture height (mm), B = volume of glass beads (mm 3 ) on the chip seal surface, filling only voids between particles, A = plan area of chip seal covered by beads (mm 2 ), V = the void ratio, E = the particle embedment depth in asphalt (mm), and H = the average particle height (mm).
the submerging procedure has been used, whether in the lab or in the field, obtain B by subtracting the volume of beads that would lay above the top level of an equivalent chip seal (Note 2) from the total volume ( C ) of beads filling the voids and submerging the chip seal (Figures 4 and 5).
B = C – [ ( M – S – H ) * A ] (3)
Where B = volume of glass beads (mm 3 ) on the chip-seal surface, filling only voids between particles ; C = total volume of beads (mm 3 ) deposited directly on the chip-seal surface area; S = thickness of base, or sheet, on which specimen chip seal has been constructed (mm)
(Note: S = 0 for field chip seals); M = height of top of mold (mm) above bottom level of chip-seal base; H = the average particle height (mm); and A = plan area of chip seal covered by beads (mm 2 ).

38
For laboratory specimens where the plan area of the mold is larger than that of the chip seal under evaluation, obtain C using the following:
C = G – [(WM) – (RS) – (A{M – S})] (4)
WhereC = total volume of beads (mm3) deposited directly on the chip-seal surface area; G = total volume of beads (mm3) deposited into the mold; W = area of mold (mm2);M = height of top of mold (mm) above bottom level of chip seal base; S = thickness (mm) of base, or sheet, on which specimen chip seal has been constructed; R = area of base (mm2); and A = plan area of chip seal covered by beads (mm2).

39
Recommended Standard Method of Test for Laborator y Chip Loss from Emulsified Asphalt Chip Seal Samples
AASHTO Designation: Txxxx-xx
1. SCOPE
1.1 This test method measures the quantity of aggregate lost, at variable moisture levels of systems of asphalt emulsion and aggregate chips, by simulating the brooming of a chip seal in the laboratory.
1.2 The values stated in SI units are to be regarded as the standard unless otherwise indicated.
1.3 A precision and bias statement for this standard has not been developed at this time. Therefore, this standard should not be used for acceptance or rejection of a material for purchasing purposes.
1.4 This standard does not purport to address all of the safety concerns, if any, associated with its use. It is the responsibility of the user of this standard to establish appropriate safety and health practices and determine the ap plicability of regulatory limitations prior to use.
2. REFERENCED DOCUMENTS
2.1 AASHTO Standards:
• T 19, Standard Test Method for Bulk Density (“Unit Weight”) and Voids in Aggregate
2.2 ASTM Standards:
• Coarse Aggregate
• T 27, Sieve Analysis of Fine and Coarse Aggregates
• T 2, Practice for Sampling Aggregates
• T 40, Practice for Sampling Bituminous Materials
• M 140, Specification for Emulsified Asphalt
• M 208, Specification for Cationic Emulsified Asphalt
• D 226, Specification for Asphalt-Saturated Organic Felt Used in Roofing and Waterproofing
T 85, Test Method for Density, Relative Density (Specific Gravity), and Absorption of
• D 7000, Standard Test Method for Sweep Test of Bituminous Emulsion Surface Treatment Samples

40
2.3 ISSA Document: ISSA Technical Bulletin No. 100 Test Method for Wet Track Abrasion of
2.4 Texas Transportation Institute: Field Manual on Design and Construction of Seal Coats, Research Report 214-25, July 1981
Slurry Surfaces
2.5 Hanson, F. M. Bituminous Surface Treatments on Rural Highways, Proceedings of the New Zealand Society of Civil Engineers, Vol. 21, 1934–1935, p. 89.
3. SUMMARY OF TEST METHOD
3.1
4. SIGNIFICANCE AND USE
4.1 This test method is useful for classifying the interaction of rapid-setting asphalt emulsions with various aggregate types and is applicable to surface treatments that require a quick return to traffic. The test has the ability to predict the relative speed with which a binder–aggregate combination will develop a traffic-sustaining bond in comparison with other combinations. It also has the capability to predict surface treatment performance in the formative stage using project materials. This performance test is intended to evaluate the potential curing characteristics of a binder–aggregate combination to ensure that the surface treatment is sufficiently cured before allowing traffic onto the chip seal.
This test is effective for defining the film formation stage and relative binding ability of asphalt emulsions interacting with aggregates when the result of this test is compared to that produced by other combinations of emulsions and aggregates. A brush (designed to closely replicate the sweeping action of a broom) exerts a force on the aggregate used on surface treatments. Asphalt emulsion and a single layer of aggregate chips are applied to an asphalt felt disk. The sample is then conditioned in an oven to arrive at a prescribed emulsion/chip moisture content before testing. A mixer abrades the surface of the sample using a nylon brush. After 1 min of abrasion, the test is stopped, any loose aggregate is removed, and the percent mass loss is calculated.
5. APPARATUS
5.1 Mixer – Use to abrade the sample.
5.2 Quick-Clamp Mounting Base – This base must be an adequate and level support for clamping the sample in place. The test sample should not move during abrasion.
5.3 Pan – An appropriate pan will contain the test sample on the mixer and hold dislodged aggregate.

41
5.4 Oven – The conditioning oven shall be a constant-temperature, forced-draft oven meeting the requirements given in Table 1 and containing shelves with at least 65% voids. The shelves shall be placed at least 120 mm apart and 100 mm away from the top and floor.
Table 1. Oven specifications.
Oven Type Forced-draft oven Min. Inside D x W x H 460 x 460 x 460 mm Accuracy + 1.0º C
5.5 Balance – A balance capable of weighing 800 g or more to within +0.1 g. A minimum platform length and width of 240 mm is required.
5.6
Dimensions
ID Name mm
A Collar diameter 36
B Collar height 76
C Brush head length 128
D Overall brush head height 19
E Groove height 17
F Groove width 18
H Slot height 19
W Slot width 7
Removable Brush Holder – The brush holder (Figure 1) shall be attachable to the mixer and capable of a free-floating vertical movement of 19 ± 1 mm and having the dimensions listed in the table below. The total mass of the brush head and the attached weight shall be 1,500 ± 15 g. The collar and nylon strip brush are not included in this mass. The brush clamping system shall hold the nylon strip brush in place so that it will not move or dislodge during testing.
Figure 1. Brush holder.

42
5.7 Nylon Strip Brush – The brush shall conform to the specifications given in Table 2.
Table 2. Brush specifications.
Overall Trim 25.4 mm Overall Length 127 + 1 mm Backing Size # 7 Fill Material Crimped black nylon Nylon Type 6.0 Fill Diameter 0.254 mm Weight 35 + 2 g
5.8 Strike-Off Template – The template should consist of a flat, stainless steel metal plate with approximate overall dimensions of 600 mm x 450 mm to allow for accumulation of excess (struck-off) emulsion on the template surface. It shall include a 280 + 3-mm diameter circular cutout with a flush edge. A template fabricated from 16-gauge U.S.Standard (plate and sheet metal) material will suffice in most cases. Where several templates are to be used, it is helpful to fabricate all templates with the same overall dimensions and location of the circular cutout.
Note 1—Emulsion mass may vary according to emulsion viscosity and applied strike-off pressure. Alternative gauges may be necessary for emulsion mass correction for varying aggregate sizes and shapes. See Appendix A2 for guidelines to calculate the required emulsion volume (and, therefore, the required template gauge) for varying emulsion residual contents and aggregate sizes.
5.9 Strike-Off Rod – The 750 + 100-mm-long rod shall be made of 12.5-mm electrical metal conduit or 12.5-mm wide x 3-mm thick metal for striking off emulsion from the template surface. See Note 2 for other recommendations.
Note 2—Emulsion viscosity and the cross-sectional thickness of the strike-off rod directly affect the formed emulsion volume. In this regard, it is prudent to experiment with differently shaped strike-off rods in order to arrive at a tool that is compatible with the emulsion in producing an emulsion volume that is consistently related to the template volume. A more viscous emulsion is recommended for this test since it enables easier handling and specimen manufacture. Additionally, a narrow area of contact, such as that between a 3-mm thick, rounded-edged strike-off rod and the emulsion, is recommended to allow for a more consistent strike-off result with a wide range of emulsion viscosities. The rod must be approximately 12.5-mm wide to avoid emulsion mounting over the top edge. It is crucial that the rod be stiff and resistant to flexure and be handled in a manner in order to avoid flexure.
6.0 Sweep Test Compactor – A suitable compaction device with a minimum curved surface radius of 550 + 30 mm and weighing 7,500 + 500 g. A picture of this apparatus can be seen in Figure 2.

43
Figure 2. Sweep test compactor. Figure 3. Working platform.
table. It should be placed at a corner of the work table such that it is comfortablyaccessible from the two perpendicular sides at the corner of the table. A circular etchingis made on the platform surface to allow positioning of the asphalt disks. A metal stripwith appropriate markings is permanently fixed to the platform at a location such that the strike-off template may be quickly and easily positioned with its cutout centered over the asphalt disk. The platform also has markings and keyholes for positioning and temporarily fixing the sliding-plate chip-dropper apparatus. See Figure 3.
6.1 Working Platform – Specimens are manufactured on the 600-mm x 600-mm working platform, which shall be made horizontally level and shall be fixed to a stationary work
6.2 Sliding-Plate Chip-Dropper – It consists of rails elevating two sliding plates above the formed emulsion. This apparatus is temporarily attached to the working platform and centered over the emulsion previously formed on the asphalt disk. The plates are used to position and suspend aggregate chips. When pulled away, the sliding plates no longer suspend the aggregate chips and these fall onto the asphalt emulsion. See Figure 4.
6.3 Aggregate Former – A circular metal hoop of the same internal diameter as the circular cutout in the strike-off template. This device is positioned centrally on the sliding plates of the chip dropper and is used to form a pre-calculated mass of aggregate chips into a circular horizontal area one stone deep. See Figure 5.
6.4 Pin Grabber – After aggregate chips have been formed into a single layer, the aggregate former is removed and the pin grabber is positioned over the aggregate chips and attached to the chip dropper. The grabber consists of thousands of pins spaced apart from each other by uniformly perforated plates. The plates prevent any appreciable lateral motion of the pins and, practically, allow only vertical motion of the pins. As the grabber is

44
lowered, by means of guides fixed to the chip dropper, over the aggregate chips, the pins come into contact with the aggregate chips. When the chip-dropper plates are slid horizontally, the pins prevent aggregate chips from moving horizontally. As the plates are
Figure 6. Pin grabber.
slid from beneath aggregate chips, the chips fall vertically onto the asphalt emulsion and assume the same orientations that were given to them on the plates prior to sliding. See Figure 6.
6.5 Glass Bowl – A glass container with a secure and airtight cover that will allow mixing of the moisture with aggregate, thus enabling absorption.
Figure 4. Sliding-plate chip-dropper. Figure 5. Aggregate former.

45
7. MATERIALS
7.1 Aggregates – The job aggregates should be sampled and split according to practice D 75. They shall be placed in an oven and dried to a constant weight. Unless naturally sourced aggregate samples are being tested, the aggregates shall be dry sieved to obtain a test sample that has 100% passing the 9.5-mm sieve and <1% passing the 4.75-mm sieve. The amount of aggregate used (Note 3) shall be calculated such that a single layer of aggregate is applied to the specimen.
Note 3—Aggregate mass will vary according to bulk specific gravity (BSG), flakiness index, and size and shape of the aggregate particles. Aggregate coverage rates are to be calculated for each source. See Appendix A1 for guidelines to calculate the required aggregate mass.
7.2 Asphalt Emulsion – The asphalt emulsion should meet all applicable specifications for the surface treatment application. The asphalt emulsion shall be equilibrated to a temperature of 60ºC for sample production.
Note 4—Emulsion volume will vary according to the void volume that exists between aggregate particles and the residual content of the emulsion. Asphalt emulsion coverage rates are to be calculated for each source and for each combination with different aggregates. See Appendix A2 for guidelines to calculate the required emulsion volume.
7.3 Asphalt Felt Disk – Produce sample disks from 30-lb asphalt felt paper, specification D 226, Type II. The asphalt felt disks shall not have breaks, cracks, tears, protuberances, indentations, or splices. The felt shall be cut to make 300 + 10-mm diameter disks. The disks shall be placed in a 50°C oven for 24 to 72 h to flatten. Manipulate the disks until they are flat and store at room temperature at least three days before use.
8. TEST SPECIMENS
8.1 Pre-weigh and record the aggregate as dry aggregate mass. In a glass bowl, add sufficient water, of known mass (corrected for water loss during specimen production), to the pre-weighed aggregate, targeting the prescribed moisture content for the completed specimen. Immediately cover the bowl to prevent moisture loss. Gently shake, overturn, and orient the covered bowl and its contents to coat the particles with moisture and let stand for at least 5 min to enable absorption of the moisture by the aggregate. Weigh the asphalt felt disk to the nearest 0.1 g and record as the asphalt sample disk mass. Place the asphalt felt
emulsion, the disk is moved to the scale and back to the working platform for application of aggregate chips. Where the disks are not perfectly circular or uniform, a system must be developed to enable accurate repositioning of the asphalt disk in its initial position when it is moved back to the platform for application of aggregate chips. A strike-off template is placed over the felt disk, centering the hole of the template over the felt disk.
disk on a table. Manipulate the felt disk so that it lies flat against the surface. Replacethe disk if the edges curl or bubble or the disk contains foreign matter. Position the diskon the working platform. During specimen manufacture and after the application of

46
Using the aggregate former, the pre-weighed (and moistened) aggregate is now formed on the sliding-plate chip-dropper apparatus, which is assembled near the working platform. The fingertips are used for spreading the aggregate one stone deep, compactly filling the circular area of the former. Next, the aggregate former is removed and the pin grabber is attached to the chip dropper to hold the aggregate in place. Asphalt emulsion in the amount of 83 + 5 g (application rate of 1.42 kg/m2) at 60°C is poured along the top arc of the exposed felt disk. With the thickness of the strike-off rod in contact with the surface of the template, and the width of the strike-off rod held approximately vertically (the top edge of the strike-off rod leaning toward the user), excess asphalt emulsion is removed with the strike-off rod in a gentle side-to-side continuous motion. This shall be completed within a 3 + 1 s period. The strike-off motion should not be stopped until the excess materials are off of the felt disk. The template is quickly removed (Note 5). The asphalt disk is moved to a scale to determine the applied emulsion mass and then accurately repositioned on the working platform. A picture of the strike-off procedure can be seen in Figure 7.
Note 5—Downward pressure, strike-off speed, and template thickness can be adjusted to ensure correct emulsion mass. Neat removal of the template is often difficult when low viscosity emulsions are used. In such cases, a bubble forms between the emulsion and the circular edge of the template. When this bubble pops, it splatters, irregularly, onto the asphalt disk. This problem is usually not encountered with the use of thicker-bodied emulsions.
8.2 Immediately position the sliding-plate chip-dropper on the working platform, over the asphalt disk, and apply the pre-weighed aggregate sample onto the asphalt emulsion. Once the aggregate has been placed on the sample, compact the aggregates using the sweep test compactor three half cycles in one direction and three half cycles in a perpendicular direction to set the aggregate. Care should be taken not to apply any additional manual downward force to the compactor. Immediately weigh the sample and
Figure 7. Emulsion strike-off in template.
record as sample weight. Place the specimen in the forced-draft oven. Sample production and weighing should take no more than 4 min.

47
9.3 When the specimen has achieved the desired cure level ±2%, it is removed from the oven and allowed to cool to a convenient prescribed temperature. The weight is recorded in order to verify the cure level that is actually achieved. At the end of conditioning, the specimen is turned vertically and any loose aggregate is removed by gentle hand brushing of the technician’s fingers back and forth across the sample. The specimen is then weighed, and the mass recorded to the nearest 0.1 g as the initial specimen mass. The time from end of conditioning to being placed in the test apparatus should be no greater than 2 min.
Note 8—Brushing using the technician’s fingers across the sample has proven to be the preferred method versus a brush for removing any loose aggregate that has not fallen off when the specimen is turned vertically.
9. CONDITIONING
9.1 The specimen is immediately placed in a forced-draft oven for the specified time, temperature (Note 6), and relative humidity based on desired field performance.
Note 6— Typically, where the performance of the binder–aggregate combination is being tested at various emulsion cure levels, specimens are cured at any convenient temperature and for any time period that provides the required specimen cure level.
9.2 The oven temperature shall be kept to a tolerance of 10% of the desired values (Note 7). The tolerance of the relative humidity shall be 25% of the desired value unless otherwise specified.
Note 7— To maintain constant curing conditions, the oven door should only be opened once within a 20-min period.
10. PROCEDURE
10.1 Attach and then leave the specimen in the clamping device for 180 + 30 s. During the equilibration time, the brush is secured into the brush head, and the brush head with the weight is attached to the mixer. At the end of the equilibrating time, put the brush head into contact with the sample, making sure there is free-floating vertical movement of the brush head. The mixer is then turned on to setting #1 (0.83 gyrations per second) for 60 s. After the brush head has come to a complete stop, the table is lowered and the sample is removed from the clamping device. The specimen is held vertically, and any loose aggregate is removed by gentle brushing of the technician’s fingers back and forth across the sample (Note 8). The abraded sample is weighed to the nearest 0.1 g, and this is recorded as the final specimen weight. A picture of the configured apparatus, with test specimen, can be seen in Figure 8.

48
APPENDICES The laboratory specimen simulates a chip-seal layer. Aggregate, which is dropped onto the binder, is intended to be placed one stone thick and held in place by a combination of particle interaction, brought on by compaction, and binder–aggregate adhesion. The preceding manufacture and testing procedures account for and test the relative strength of the bond developed between asphalt binder and aggregate particles within the chip seal itself.
The required aggregate mass and asphalt cement volume depend on the average aggregate particle dimensions, on an assumed eventual de gree of compaction of the aggregate particles, and on the assumption that each particle will eventually lay on its widest face. In the laboratory specimen, the degree of compaction of the aggregate simulates that which exists in a newly and properly built chip seal. The assumptions made with regard to calculation of the required binder volume (the residual asphalt content of the em ulsion) intend to avoid bleeding by accounting for the compaction of the aggregate over time.
11. CALCULATION
11.1 This equation represents the total mass loss based on the initial aggregate sample weight. The mass loss as a percentage of the area exposed to the abrading force is
33 . 1 100 % ××C A
B A Loss Mass
− − = (1)
Where A = initial specimen mass, B = final specimen mass, and C = asphalt sample disk mass.
Figure 8. Specimen under test in configured apparatus.

49
A1.2 Physical properties of the aggregate are experimentally determined, including oven dry bulk specific gravity ( G ), loose unit weight ( W ), void volume ( V ), and particle size characteristics.
A1.3 Dry bulk specific gravity ( G ) is determined according to ASTM C 127, and dry loose unit weight ( W ) is determined according to ASTM C 29. These allow calculation of the initial void volume ( V ) between particles of the loose aggregate from V = (1 – W /62.4 G ) (A1)
A1.4 F. M. Hanson (1935) observed that the void volume between aggregate particles is approximately 50% (the loose condition) when the aggregate is dropped onto the asphalt binder. He theorized that due to reorientation, this reduces to approximately 30% (60% of 50% voids) immediately after rolling and to 20% (40% of 50% voids) after plenty of traffic. Hanson’s theory, as it relates to surface treatment densification, is reflected in the following outline of the noted chip-seal design methods.
A1.5 Although one-sized and cubical aggregate performs best in chip seals and may simplify the design process, graded and non-cubical aggregate sources often find use. In these cases, it is often helpful to make use of the design method proposed by McLeod (1969), which calculates the required volume of aggregate at an assumed ma ximum density. This calculation is possible after approximating the ultimate average mat thickness (average le ast particle dimension) and through the assumption that, at the ultimate average mat thickness, voids have reduced, after considerable traffic, to 40% of the initial loose-aggregate void volume. Although
density. The following useful guidelines for the calculation of required aggregate and em ulsion masses used in the manufacture of laboratory specimens are taken from the McLeod and the modified Kearby single-surface-treatment design methods respectively referenced in the FHWA Asphalt Emulsion Manual , FHWA-IP-79-1, and the USDOT Field Manual on Design and Construction of Seal Coats , Research Report 214-25, July 1981.
APPENDIX A1. AGGREGATE MASS
A1.1 Although the laboratory compaction of specimen aggregate according to this standard is not equal to that possible in the field with rolling equipment, in the manufacture of the laboratory specimen, care should be taken to ensure that the appropriate mass of aggregate particles is positioned on the working platform as compactly as possible and such that the center of gravity of each particle is as low as possible, or such that a particle’s stability against rotation is maximized.
In determining the required chip-seal aggregate c overage, it is necessary to evaluate the proposed aggregate for its ability to compact. In this regard, our calculated required aggregate mass and asphalt volume will only be approximations since it is not possible to conclusively determine what will be the aggregate void volume immediately after construction or at ultimate aggregate

50
i. A sample of the aggregate material is first sieved according to ASTM C 136. From the aggregate gradation curve, the median size is determined as the theoretical sieve size through which 50% by mass of the aggregate would pass. The flakiness of the material is then determined by testing representative sample particles, taken from the various gradation fractions, on the appropriate slot of a slotted sieve. The flakiness index is the combined mass proportion of the total mass of tested material that passes through the slots.
ii. The median size and flakiness index results are used in conjunction with a chart for determining average least dimension to arrive at the approximate ultimate mat height of the chip seal.
A1.8 Refer to FHWA-IP-79-1 for a more detailed review of this procedure and its relevant modification factors.
A1.9
A1.10 Where the maximum beneficial effect of aggregate chip/asphalt binder adhesion is being tested, the aggregate should be washed and dried prior to use.
In applying the McLeod procedure for use with lab specimens, since it is assumed that specimen aggregate particles are placed on their widest sides, the average mat depth of the specimen is assumed to be equal to the average least dimension (H). However, since compact particle placement and specimen compaction in the lab is not as effective as what is possible in the field, it is usually necessary to modify the assumed ultimate void volume to a more practical value approaching that associated with the compact bulk density of the aggregate according to ASTM C 29.
A1.6 The oven dry bulk specific gravity (G), the void volume (V ) of the loose aggregate, and the ultimate average mat depth (H ), in conjunction with an assumed ultimate void volume (0.4V ), are used to calculate the required coverage mass per unit area at ultimate density. It is important to note that the procedure anticipates that the densification is due to particle reorientation and average mat depth reduction to H as a limit. The coverage mass per unit area, therefore, is assumed to remain practically constant as densification progresses.
A1.7 Using the assumption that particles will ultimately orient themselves on their widest sides, with the vertical dimension being the smallest, an approximation of the ultimate average mat height is made by determining the average least dimension of a representative sample of particles. The procedure involves determination of the median particle size and the flakiness index.
the ultimate density is not achieved immediately after construction, this assumed ultimate state of the aggregate is also used to determine the asphalt requirement. In calculating the actual aggregate mass to be dropped from a spreader truck, the user may also use modifying factors to suit local conditions.

51
A2.3 The thickness of the strike-off template used in the manufacture of laboratory specimens is specified based on the average particle height and degree of compaction of the aggregate, such that it provides the appropriate struck emulsion volume with the required asphalt residual content.
Refer to FHWA-IP-79-1 for a more detailed treatment of this procedure and for further references.
A2.4 The McLeod method employs factors for surface correction (S) and seasonality (K) in an effort to avoid flushing. Specifically, however, the McLeod method applies a traffic factor to ensure that the ultimate void volume is filled a maximum of 60% to 85%, the higher percentage being applicable to lower volume roads. Additionally, the McLeod procedure assumes that the ultimate void volume is 40% of the initial void volume of the cover aggregate in the loose weight condition.
A2.5 In laboratory specimens, calculation of the required asphalt binder quantity should follow determination of the aggregate quantity and should reflect the void volume that exists in the specimen aggregate. It may be helpful to assume that the applied specimen aggregate has a void volume of 80% of that in the loose weight condition.
A2.6 The preceding standard is intended to allow performance evaluation of a combination of asphalt emulsion and aggregate chips as well as relative performance of several combinations of asphalt emulsions with aggregate chips at a certain level of cure. In this regard, it is up to the user to determine the required asphalt quantity based
APPENDIX A2. ASPHALT EMULSION VOLUME
A2.1 Asphalt emulsion is determined by volume, as opposed to by mass, since the required amount depends primarily on the void volume available, between aggregate particles, to be filled with asphalt cement.
A2.2 A balance must be struck so that the young chip seal is bound sufficiently by asphalt, such that it will endure its early life while avoiding the use of too much binder since this will cause the early onset of flushing, reducing the useful life of the chip seal to a shorter time period than otherwise possible. In the field, after a few years when the aggregate particles have been oriented by traffic and the ultimate aggregate density has been achieved, it is typically desired, for good road surface performance, that 70% of the voids be filled with asphalt binder. In this regard, depending on the road traffic volume and aggregate chip shape, which imply a certain compacted state of the aggregate in a few years, and also depending on the nominal size of aggregate chips, the requirements for initial embedment immediately following construction of the chip seal may vary between 20% and 40%. In the manufacture of laboratory specimens, observing these field principles will enable the construction of a representative specimen.

52
A2.8 It is important to note that prior to using a template for a recorded test, several trials should be performed in order to determine the rate and repeatability of asphalt emulsion application using the template and the adopted striking-off technique.
A2.7 This standard is not intended to determine the potential for chip-seal flushing due to densification and reorientation of the cover aggregate. It provides the relative performance of chip-seal treatment materials, specifically those of a single surface treatment exhibiting compactly placed and oriented aggregate particles one stone in depth. Through the use of this standard, and as a result of the ability to precisely place a predetermined aggregate mass, it becomes possible to calculate the precise volume of required asphalt emulsion. Additionally, it is possible to repeatedly combine chip-seal materials in constant proportions.
on the use of a constant percent embedment or, alternatively, a constant asphalt volume with different chip types and sizes.

53
Recommended Standard Method of Test for Measuring Moisture Loss from Chip Seals
AASHTO Designation: Txxxx-xx
1. SCOPE
1.1 This test method approximates the asphalt emulsion moisture content of a newly built chip seal as it cures by close mo nitoring of an equivalently constructed and cured specimen chip seal.
1.2 The values stated in SI units are to be regarded as the standard unless otherwise indicated.
1.3 A precision and bias statement for this standard has not been developed at this time. Therefore, this standard should not be used for acceptance or rejection of a material for purchasing purposes.
1.4 It is the responsibility of the user of this standard to establish appropriate safety and health practices and determine the applicability of regulatory limitations prior to use .
2. REFERENCED DOCUMENTS
2.1 ASTM Standards :
• D 7000, Standard Test Method for Sweep Test of Bituminous Emulsion Surface Treatment Samples
3. SUMMARY OF TEST METHOD
3.1 By quantifying the mass loss of a specimen chip seal, which is significantly equivalent to a field chip seal, and where the emulsion spray rate, the emulsion residual content, and initial aggregate moisture content can be approximated, it becomes possible to estimate the specimen’s cure level at different monitoring points throughout a workday.
3.2 In this test, a chip-seal specimen is manufactured by site equipment on a board placed on the roadway while the field chip seal is being built. The water-mass loss of materials on the board is then monitored th roughout the day to gauge the specimen’s cure level. These results are projected in evaluating the moisture content of the field chip seal’s asphalt emulsion.

54
asphalt emulsion, and films of water evaporate, the bond can be more readily developed and a chip seal is said to be curing.
4.2 This test method aims at estimating the mass of water that has evaporated from a field chip seal by monitoring a specimen chip seal that is significantly equivalent in material composition to the field chip seal. Where periodic monitoring is performed, the test indicates the approximate rates of curing that may be present in a field chip seal cured under particular environmental conditions. This information is usually intended to track curing throughout a workday and up to the point where the chip seal materials are bound. Additionally, when performance results from sweep tests (ASTM D 7000) at known moisture contents are available, moisture content tracking can assist in decision making regarding the capacity of the chip seal to safely accept traffic at certain moisture contents.
5. APPARATUS
5.1 Balance and (Optional) Pedestal – The balance must be capable of weighing 10 kg or more to within +1 g. A tared pedestal, some 10 in. in height and placed on the scale, is usually required to raise the specimen enough above the scale to avoid the specimen area obstructing view of the scale reading.
Note 1—The mass of a configured specimen board is on the order of 1,500 g. In addition to the board mass, the masses of the pedestal and the expected chip seal materials must be considered when determining the adequacy of a scale to bear the full specimen mass (with pedestal).
5.2 Weighing Platform and (Optional) Wind Shield – The platform is any convenient flat surface, shimmed as necessary for levelness, on which the balance is placed for weighing specimens. This is usually sited on top of another stationary structure in the field or in the tray of a parked vehicle. Additionally, where windy conditions are expected, the ability to obtain reliable mass readings may depend on the use of a lightweight enclosure to shield the specimen and prevent wind-induced flutter.
5.3 Pocket Level – This is a portable bubble level that is placed on the weighing platform to check for approximate levelness.
5.4 Infrared Thermometer – This is used to check temperatures of the field chip seal and the specimen chip seal.
5.5 Drying Pan – This metal pan is used to dry sampled aggregate where the moisture content appears to be high or in question.
4. SIGNIFICANCE AND USE
4.1 The rate at which the bond is developed between asphalt and aggregate in a chip seal depends on the chip seal’s curing characteristics. When asphalt breaks with water in an

55
light gauge, z-shaped metal strip is fixed to the perimeter of the board. The vertical legs of the z-shaped metal strip are oriented such that the board is suspended ¼ in. above the pavement by one leg (the inner) of the z-shaped metal edging (for easy removal from the roadway) while the other leg forms a vertical lip protruding above the surface of the board (to prevent the loss of any specimen material as the board is moved).
Figure 1. Configured specimen board.
6.2 Aggregate and Asphalt Emulsion – The chip-seal specimens are laid down by the distributor and chipper in the course of placing the actual field chip seal. In this regard, the properties of the specimen aggregate and asphalt emulsion are those of the field chip seal.
6.3 Aggregate – Sample the aggregate from the stockpile that is to be used in the manufacture of the chip seal and store in an airtight container. Where moisture content tracking is to be performed without the need for immediate results on site, laboratory determination of aggregate moisture content (W) may be performed. Alternatively, estimate moisture content (W) according to Note 2 where immediate moisture content results are required and where available time, sufficient resources, and the need for higher on-site accuracy warrant extra care.
Note 2—An acceptable on-site approximation of the aggregate moisture content may be obtained by drying a representative sample of chip-seal aggregate over a few hours of the workday. Place approximately 3 kg of aggregate (in its sample state) on the tared drying
18 inch square plywood board
z- shaped metal edging on board- perimeter
pan and record the wet aggregate mass. Place the drying pan and its contents in a warm (and, preferably, windy) location. When the aggregate becomes dry to the touch, record the mass loss of the aggregate. The aggregate moisture content (W) is the mass loss expressed as a percentage of the dried aggregate mass.
6.4 Asphalt Emulsion – Usually, a good approximation of the project asphalt emulsion’s residual content (R) may be obtained from key site personnel. Where dependable figures are not available, the cure level of the chip seal must be based on conservative and conventional figures (approximately 70% residual content) until a simple lab experiment can be performed such as that outlined in Note 3.
6. MATERIAL PREPARATION
6.1 Specimen Board – Each chip-seal specimen is manufactured on an 18-in. square and 3/16-in. thick plywood board (Figure 1) with an unconditioned surface. A continuous,

56
Note 3—To evaluate the residual content of the asphalt emulsion that was used on site, dry approximately 50 g of the material, weighed to the nearest 0.1 g, in a 100°C oven, in the laboratory, to obtain the residual asphalt. The asphalt emulsion should be placed in a thin layer in an approximately 11-in.-diameter aluminum foil pan. Monitor the mass of the material until it no longer continues to lose mass over two consecutive readings taken 8 h apart. Record the mass loss and the final residual asphalt mass to the nearest 0.1 g. Estimate the moisture content of the asphalt emulsion to be the mass loss expressed as a percentage of the initial asphalt emulsion mass. The asphalt emulsion’s residual content (R) is the final residual asphalt mass expressed as a percentage of the initial asphalt emulsion mass.
7. SPECIMEN MANUFACTURE AND WEIGHING
7.1 Set up the weighing platform (with optional wind shield) in an off-road location within short walking distance of the location where the specimen is intended to be manufactured. Level the platform and position the scale on the platform (with optional pedestal).
7.2 Record the tare mass (B) of an unused specimen board.
7.3 Place the weighed specimen board at a chosen location on the roadway (Note 4) that is to be chip sealed. Ensure that the board is not positioned in the wheel paths of the distributor, chipper, or other trucks.
Note 4—Locations at which specimen chip seals are to be made should be chosen based on the availability of similar off-road locations, in terms of temperature and exposure, to where the specimen may be cured. Additionally, at selected manufacture locations, manufacture should be fast and allow for removal and weighing of the specimens within 5 min of the asphalt emulsion being sprayed onto the board. When monitoring the field chip seal, observations should be made at a location immediately adjacent to where the specimen is manufactured.
7.4 Immediately after chips have been dropped onto the specimen board, move the specimen from the roadway and obtain its initial total mass reading (S).
7.5 Obtain the asphalt emulsion spray rate (E) from appropriate site personnel.
7.6 Throughout the workday, maintain a log of the temperatures and other environmental conditions affecting the cure rates of the specimen and the field chip seals. Relocate the specimen as necessary to ensure similar curing conditions relative to those of the field chip seal.

57
7.7 Record the total mass (C) of the specimen as it cures throughout the day to various cure levels.
Note 5—Record the specimen mass as often as practical but at least once per hour until a desired cure level has been achieved.
7.8 Where curing conditions throughout the workday are similar for the specimen and the field chip seal, it may be assumed that the chip-seal moisture content at a certain time after construction is approximated by that of the specimen.
8. CALCULATIONS
8.1 The mass of asphalt emulsion in the specimen is obtained from the following:
O = 3785 (UEAG) (1)
8.2 The mass of dry specimen aggregate is obtained from the following:
D = (S – B – O)/(1 + W) (2)
8.3 The initial mass of all specimen moisture is obtained from the following:
I = S – B – D – (OR) (3)
8.4 The mass of all specimen moisture at cure level (L) is obtained from:
F = C – B – D – (OR) (4)
8.5 The percent moisture content of asphalt emulsion at cure level (L) is obtained from:
M = [100F]/[(OR) + F] (5)
8.6 The cure level of the specimen asphalt emulsion is obtained from:
L = 1 – {F/[O (1 – R)]} (6)

58
WhereO = mass of asphalt emulsion on the specimen board (g), U = unit weight of water (g/ml), E = reported emulsion spray rate (gal/sy), A = specimen board area (sy), G = specific gravity of the asphalt emulsion, D = mass of dry specimen aggregate (g), S = initial specimen mass (including board) (g), B = mass of the specimen board (g), W = initial percentage moisture content of specimen aggregate (as percentage of dry
aggregate mass), I = initial mass of all specimen moisture (emulsion and aggregate moisture) (g), F = moisture mass in specimen at cure level (L) (g), C = specimen mass (including board) at cure level (L) (g), L = the cure level at which specimen moisture content is being evaluated,M = percentage specimen moisture content at cure level (L) (as percentage mass of
current asphalt emulsion), and R = percentage residual asphalt content of emulsion (as percentage mass of initial asphalt
emulsion).

59
Recommended Standard Method of Test for Recover y of Asphalt from Emulsion by Stirred-Can Method
AASHTO Designation: Txxxx-xx
1. SCOPE
1.1 This method covers the recovery of asphalt from a water-based emulsion by the stirred- can evaporation method. The recovered asphalt reproduces the asphalt with the same properties as those used as the asphalt base in the em ulsion and in quantities sufficient for further testing.
2. SUMMARY OF METHOD
2.1 The water in the asphalt emulsion is evaporated under a nitrogen atmosphere at an elevated temperature. Initially, the set point for the emulsion temperature is above the boiling point of water, but the temperature of the emulsion would stay at the boiling point of water while the evaporating process occurs. After most of the water has been evaporated, the temperature of the emulsion will increase to the initial set point and the remaining water will be completely removed. The recovered asphalt (evaporation residue) can then be subjected to further testing as required.
3. APPARATUS
3.1 Laboratory Mixer – The standard laboratory mixer with mixing blade and shaft that is capable of reaching a mixing speed of 1,000 to 2,000 rpm.
3.2 Tin Ca n – The can should have a volume capacity of 1 gal with a 6½-in. diameter to allow adequate access of mixing head, thermocouple, and nitrogen outlet.
3.3 Heating Unit – The heating unit consists of the heati ng tape and the Variac, which is used to control output power. The length of heating tape should be adequate to wrap around the tin can until it fully covers the bottom half of the can.
3.4 Nitrogen Purge and Nitrogen Blanket System – As shown in Figure 1, these should consist of a nitrogen piping system, nitrogen purge blanket, nitrogen sparge ring, and rotameters that are capable of measuring the gas flow up to 8.5 to 10 L/min.
3.5 Temperature Controlling Unit – The temperature control an d thermocouple must be able to operate at the maximum temperature of 325 ° F.
3.6 Heat Insulator – The insulator pad should be large enough to cover the tin can that is wrapped with heating tape to prevent the heat from the tape escaping to the atmosphere.
4. REAGENTS AND MATERIALS
4.1 Liquid Nitrogen – A pressurized tank, with regulator or pressure-reducing valve.

60
5. SAMPLE
5.1 The sample must be a water-based asphalt emulsion. If a solvent-based emulsion is used, the set point temperature may need to be changed to ensure completion of solvent removal. Also, the properties of the recovered binder may not agree with the base asphalt if there is solvent residue left in the recovered binder.
5.2 Generally, asphalt binder will progressively harden when exposed to air, especially if the asphalt is placed in a high-temperature environment. Therefore, during the recovery process, the emulsion must be under a nitrogen atmosphere when the solvent is evaporated at a high temperature.
1
2 3 4 5
6
7
Figure 1. Schematic view of stirred-can setup: (1) Gallon can, (2) Thermocouple, (3) Impellor and shaft, (4) N 2 blanket tube, (5) N 2 sparger, (6) Heat tape, and (7) Thermal insulation.
6. PROCEDURE
6.1 The experimental setup for the stirred-can procedure is shown in Figure 1.
6.2 Weigh 1,250 ± 0.5 g of asphalt emulsion and add to the gallon can, then wrap the heating tape around the can until the tape covers the bottom half. Cover the side of the can with the heat insulation pad and place the container underneath the laboratory mixer.
6.3 Place the sparge ring into the can, but to prevent overflow due to foaming, do not turn the nitrogen sparge on at the beginning.

61
how thick the emulsion is. After that, insert the thermocouple into the can. To ensure accurate temperature controlling, the thermocouple should not touch the side of the can or mixer head.
6.5 Turn on and adjust nitrogen flow to 8.5 to 10 L/min for the nitrogen blanket tube, then place the nitrogen blanket outlet on the emulsion surface to create a nitrogen blanket.
6.6 Connect the heating tape with the Variac and turn the Variac on to begin the heating process, then set the temperature controller to 163 ° C (325 ° F). The Variac providing power for the heating tape is set to 140 V, with corresponding power of approximately 430 W. After the heat is supplied to the system, the foaming process will start to occur.
6.7 Change the voltage on the Variac to about 100 V (corresponding power is 260 W) when the emulsion temperature reaches 10 0 ° C (212 ° F). The time from the beginning of the experiment to the time to change the voltage is approximately 20 to 30 min. Also, if foaming stops, start the nitrogen flow into the sparge ring (8.5 to 10 L/min). The emulsion temperature should stay at the boiling point of water until the majority of the water is evaporated; the emulsion temperature will then start to increase.
6.8recovery time is approximately 180 min). After 10 min, turn off the Variac, remove the heat insulation, and loosen the heat tape, but maintain the nitrogen flows and stirring while the sample is cooling.
6.9
Let the emulsion temperature reach 325°F and wait for 10 min at this temperature (total
Figure 2 shows a typical temperature versus time evolution curve. Four regions are evident. The first one is from the beginning to about 18 min. In this region, the temperature increases rapidly and nearly linearly from room temperature (around 72°F, or 22°C) to
6.4 Lower the mixer head into the emulsion can and turn the mi xer on. Then place the lid on top of the container and increase the mixi ng rate to 1,000 to 2,000 rpm, depending on
6.10 As the sample starts to cool (<200°F), take out the nitrogen sparge ring but keep nitrogen flowing through the tube to prevent clogging. Then stop the mixer and move the mixer head upward.
6.11 Store the sample in a cool room (25°C). The recovered sample can be used for further testing.
212°F (100°C). The water evaporation rate is low in this region, and power input primarily increases the temperature. The second region is between 18 min to 110 min where the temperature increases slowly from 212°F (100°C) to 250°F (121°C) in about 90 min. Here the power input mainly provides water evaporation. The third region is between 110 min to 135 min, where the temperature increases linearly from 250°F (121°C) to 325°F (163°C) in about 25 min, a slower rate than in the first region. In this region, much of the water has evaporated and the power input primarily increases the temperature. In the fourth region, from 135 min to the end of the experiment at 170 min, the temperature is controlled at 325°F (163°C). (In Figure 2, the temperature evolution after 150 min is not shown because it changes little.)

62
50
100
150
200
250
300
350
0 50 100 150
Temperature (F)
Time (min)
Figure 2. Temperature evolution of the recovery system.

63
Recommended Standard Method of Test for Determining the Strain Sensitivity of Asphalt Emulsion Residue Using Strain Sweeps Performed on a Dynamic Shear Rheometer (DSR)
AASHTO Designation: Txxxx-xx
1. SCOPE
1.1 This test method covers the determination of strain sensitivity of asphalt residue from a water-based emulsion from changes in the dynamic shear modulus obtained from strain sweeps performed using the dynamic shear rheometer (DSR). This test method is
method, the asphalt binder is the residue obtained by removing the water from a water- based asphalt emulsion.
1.2 This standard is appropriate for unaged material or material aged in accordance with R28.
2. REFERENCED DOCUMENTS
2.1 AASHTO Standards: • T 315, Determining the Rheological Properties of Asphalt Binder
Using a Dynamic Shear Rheometer • M 320, Performance-Graded Asphalt Binder • R 28, Accelerated Aging of Asphalt Binder Using a Pressure Aging Vessel
(PAV) • R 29, Grading or Verifying the Performance Grade (PG) of an Asphalt
Binder • T40, Sampling of Bituminous Materials
2.2 ASTM Standard: • E1, Specification for ASTM Thermometers
3. SUMMARY OF TEST METHOD
3.1 This standard contains the procedure used to me asure the complex shear modulus (G*) of asphalt residues from water-based em ulsions using a DSR and parallel plate test geometry.
3.2 The standard is suitable for unaged material or material aged in accordance with R28.
3.3 The standard is suitable for use when the emulsion residue is not too stiff to be torqued by the DSR .
supplementary to AASHTO T 315 and incorporates all of that standard. For this test

64
4. SIGNIFICANCE AND USE
4.1 The temperature for this test is related to the test temperature experienced by the pavement maintenance treatment in the geographical area for which the asphalt emulsion is to be applied. Typically the maintenance treatment is applied at moderate ambient temperature, and a default temperature of 25ºC can be used for the strain sweep evaluation.
4.2 A plot of dynamic shear modulus G* versus time will be generated and compared as an indication of strain sensitivity of the residue.
4.3 The complex shear mo dulus is an indication of the stiffness and the resistance of the asphalt residue to deformation under load and also is an indication of the ability of the residue to hold aggregate.
5. APPARATUS
5.1 Dynamic Shear Rheometer Test System – Consisting of parallel metal plates, an environmental control system, a loading device, and a control and data acquisition system.
5.2 Test Plates – The 8-mm plates are used for this test with a 2-mm gap. The preliminary gap before trimming must be set to achieve an acceptable bulge in the material after trimming.
6. REAGENTS AND MATERIALS
6.1 Varsol or another suitable agent for cleaning the plates.
6.2 Acetone for removal of all remaining residue from the plates.
7. SAMPLE
7.1 The sample is the residue after the water is removed from the water-based asphalt emulsion. The properties of recovered binder may not agree with the base asphalt since other substances have been added to the base binder in the emulsification process.
8. PROCEDURE
8.1 Procedure is as described in AASHTO T 315 using the 8-mm plates with a 2-mm gap.
8.2 Prepare the emulsion residue specimen according to AASHTO T 315.
8.3 Place the sample in the DSR and trim it according to AASHTO T 315.

65
8.5 Perform the strain sweep.
8.6 Use the following parameters for the strain sweeps: • Intermediate test temperature, with 25ºC being the default temperature. • For strain sweeps, the DSR is set in oscillation mode for amplitude sweeps. • DSR is set for auto-stress so that stress will be automatically adjusted to
achieve desired strain. • Frequency is set to 10 radians per second. • Initial stress is set to the lowest stress that the DSR is capable of applying. • Strain is set to increment between 1% and 50%, or between 1% and the
highest strain that the DSR can achieve with the material being tested. A preliminary test may be needed, especially with stiff residues, to estimate the highest strain percent that can be set for the test.
• Steady shear rate is set to zero and is not used in this test. • Number of periods is set to 1. • Number of points is set to 256. • Number of samples can be between 20 and 30. Determine the number of
samples to test at enough points to define the strain sweep curve when plotting G* versus time.
• Strain control sensitivity is set to medium or better. • Shear strain sequence is set for “up” so that strains are incremented from low
to high. • Time increments are set to linear so that the time increments between
measurements are approximately linearly chosen (not logarithmically). • Delay time is set to 1 s. • Check that integration time is between 1 and 2 s, and total test time for the
strain sweeps is less than 2 min.
8.7 Visually inspect the sample after the test when removing the sample from the plates. Note whether the sample is wholly or partially adhered to the plates, and note whether the sample has a ductile or a brittle break when the plates are pulled apart.
8.8 Generate a plot of dynamic shear modulus versus time. A flat curve indicates a strain- resilient material. A steep curve indicates a strain-sensitive material.
8.4 Bring the sample and the environmental system to thermal equilibrium according to the manufacturer’s directions and AASHTO T 315.

66
A T T A C H M E N T
Manual for Emulsion-Based Chip Seals forPavement Preservation: Research Report

67
C O N T E N T S
68 Chapter 1 Introduction68 1.1 Background68 1.2 Project Objectives and Scope68 1.3 Organization of the Report
69 Chapter 2 Research Methodology69 2.1 Introduction69 2.2 Chip Adhesion to Emulsion and Residue72 2.3 Time Required Before Brooming or Traffic73 2.4 Emulsion Consistency in the Field74 2.5 Pavement Texture Testing76 2.6 Residue Recovery Methods and Properties79 2.7 Estimating Chip Embedment Depth During Construction
81 Chapter 3 Results and Analysis81 3.1 Sweep Test81 3.2 Field Moisture Tests81 3.3 Laboratory Sweep Test for Field Materials85 3.4 Emulsion Consistency in the Field87 3.5 Pavement Texture Measurement87 3.6 Residue Recovery Methods and Properties93 3.7 Estimating Embedment in the Field
95 Chapter 4 Practical Application of the Research95 4.1 Modified Sweep Test and Critical Moisture Contents95 4.2 Field Consistency Test95 4.3 Pavement Texture95 4.4 Residue Recovery and Desirable Properties95 4.5 Measuring Aggregate Embedment in the Field
96 Chapter 5 Conclusions and Recommendations96 5.1 Conclusions96 5.2 Recommendations
98 References
100 Appendices A through J

68
1.1 Background
Emulsion-based chip seals are the most commonly usedtype of chip seal in the United States for preserving asphaltpavements. The purpose of these preservation treatments is toseal fine cracks in the underlying pavement surface and pre-vent water intrusion into the base and subgrade. Chip seals arenot expected to provide additional structural capacity to thepavement. Benefits are obtained by reducing pavement dete-rioration before significant distress is exhibited. A large bodyof research is available on chip-seal design practices (NCHRPSynthesis 342: Chip Seal Best Practices), and they were furtherinvestigated in this project. However, chip-seal design in theUnited States has not been developed significantly beyondearly work (McLeod 1960, 1969; Epps 1981).
In spite of their apparent benefits, the use of chip seals forpavement preservation in the United States has been hamperedby the lack of nationally accepted guidance on their design andconstruction and appropriate specifications and testing proce-dures for constituent materials. Therefore, research was neededto develop a manual that identifies factors that influence chip-seal design, construction, and performance and provides guide-lines that enable practitioners to improve the opportunity forsuccess when building these systems.
1.2 Project Objectives and Scope
This research was conducted to develop a manual describ-ing the best methods to use for designing and constructing
chip seals placed on hot mix asphalt pavements. A signifi-cant body of knowledge existed about chip-seal design andconstruction before this research, much of which is con-tained in this manual. However, other practices in chip-sealtechnology have been subjective for many years and areconsidered an art by some. Therefore, the research con-ducted in this study focused on elements of chip-seal tech-nology that were subjective or not practiced in the UnitedStates. The research presented in this report includes a rec-ommended manual that could replace the subjective orqualitative judgments previously used during chip-sealdesign and construction with field and laboratory testing,and thus can be used to improve the opportunity for successwhen building chip seals.
1.3 Organization of the Report
This research report has five chapters. Chapter 1 is theintroduction and describes the purpose of the research andthe scope of the work. Chapter 2 describes the state of thepractice of chip-seal design and construction. Chapter 3describes the results and analysis of a series of laboratory andfield tests. Chapter 4 discusses the application of research find-ings. The final chapter presents the study conclusions andrecommendations. Further elaborations on the research areprovided in Appendices A through J, which are not publishedherein but are available on the TRB website at http://www.trb.org/Main/Blurbs/164090.aspx.
C H A P T E R 1
Introduction

69
2.1 Introduction
Research conducted in this project focused on aspects ofchip-seal technology that have been qualitative in the past orwere based on material properties that did not necessarilyrelate to chip-seal performance. Quantitative methods weredeveloped to help replace past subjective practices and allowimproved prediction of chip-seal behavior in the field. Thefollowing issues were addressed in the research through lab-oratory and field experiments:
• Chip adhesion to emulsion and residue,• Time required before sweeping and uncontrolled traffic,• Emulsion consistency in the field,• Surface texture measurement, and• Residue recovery and properties.
2.1.1 Chip Seal Definition
Chip seals considered in this research are based on emulsi-fied asphalt binders and natural mineral aggregate chips. Thechip seal is constructed by spraying the asphalt emulsion ontothe existing asphalt pavement, dropping the aggregate chipsinto the asphalt emulsion, and embedding the chips in theemulsion using pneumatic-tired rollers. The purposes of thechip seal are to preserve existing asphalt pavement by sealingthe surface before cracking occurs or after minor cracks haveemerged and to provide additional surface friction.
2.2 Chip Adhesion to Emulsion and Residue
The required adhesive and cohesive strength of the emul-sion residue used as the binder in a chip seal directly influ-ences when the chip seal can be opened to traffic afterconstruction. This strength is usually judged subjectivelyduring construction by experienced personnel who decide
based on how easily chips can be dislodged from the emul-sion. This experience is often gained by trial and error, some-times leading to vehicle damage when residues that have notgained sufficient strength release chips under traffic loads(Gransberg and James 2005; Shuler 1998). Several tests suchas Vialit (Vialit plate shock test), frosted marble (Howard et al. 2009), and the sweep test (Cornet 1999; Barnat 2001;ASTM D7000) attempt to quantify this adhesive behaviorand identify when chip seals are ready to accept uncontrolledtraffic. However, these tests have shown high variability andhave therefore not been widely adopted. One method uses ahand broom to sweep the chips, and the chip seal is judgedready for traffic when the amount of chips dislodged duringthis procedure is less than 10%. This test is attractive since ituses actual construction materials and with practice could be a means to evaluate adhesion. The sweep test described by ASTM D7000, Standard Test Method for Sweep Test ofBituminous Surface Treatment Samples, appeared to be areasonable approach to simulating the forces that dislodgeaggregate chips from chip seals. This procedure is relativelyeffective at evaluating differences in adhesive abilities of dif-ferent emulsions with a single aggregate. This test utilizes atemplate for specific aggregate gradations to establish theemulsion application rate. While a single emulsion applica-tion rate is suitable for relative comparison between emul-sions, when aggregate sizes differ, the embedment percentagechanges, which affects chip retention. In addition, the testdescribes a procedure of “hand casting” the aggregates onto theemulsion prior to testing. Attempts to repeatedly place preciseamounts of aggregate on test samples during this researchproved difficult to replicate. Therefore, the test apparatus wasmodified so that the exact amount of chips was placed on thetest pad each time. To determine if the modified test proce-dure would be useful to evaluate the adhesive ability of dif-ferent emulsions and different aggregate chips under varyingmoisture conditions, a controlled laboratory experiment wasconducted.
C H A P T E R 2
Research Methodology

70
2.2.1 Experiment Design
Because of variability associated with the manner withwhich aggregate chips are prepared for testing according toASTM D7000, a modification to the procedure was made to precisely control how chips are placed on the test pad priorto sweeping. To determine if the modified procedure was animprovement over the ASTM procedure, an experiment wasconducted to measure the ability of the modified sweep test todiscriminate between four independent variables believed toaffect early chip-seal performance. These variables were aggre-gate source, emulsion type, emulsion cure level, and aggregatechip moisture content.
2.2.1.1 Independent Variables
Independent variables in this experiment are the following:
Aggregate source: basalt, granite, limestone, alluvialEmulsion type: RS-2, RS-2P, CRS-2, CRS-2P, HFRS-2PEmulsion cure level: 40%, 80%Aggregate chip
moisture content: dry, saturated surface dry (SSD)
A full-factorial, randomized experiment was designedfor each emulsion according to the model shown below(Anderson 1993):
WhereYikl = chip loss, %;
μ = mean loss, %;Ai = effect of aggregate i on mean loss;
Wk = effect of water removed k on mean loss;Ml = effect of aggregate moisture l on mean loss;
AWik, etc. = effect of interactions on mean loss; and�ikl = random error for the ith aggregate, kth water
removed, and lth replicate.
This experiment design was chosen because results can beeasily evaluated using conventional analysis of variance tech-
Y A W M AW AM WM AWMikl i k l ik il kl ikl ikl= + + + + + + + +μ �
niques (ANOVA). The experiment was repeated for each emul-sion to eliminate potential variability that could be associatedwith differences in emulsion behavior due to aging.
2.2.2 Materials
A variety of emulsions were selected to represent the rangeavailable for construction. These included conventionaland polymer modified anionic (RS-2 and RS-2P), high float(HFRS-2P), and cationic types (CRS-2 and CRS-2P). Pro-duction of these emulsions using a laboratory emulsion millin close proximity to the research laboratory was desirablesince emulsions have limited shelf life. These factors helpedto reduce variability of the emulsion materials. Properties ofthe emulsions are shown in Table 1.
A variety of aggregates were used to determine if the mod-ified sweep test could discriminate between different miner-alogy, shape, and texture. These were a limestone (LSTN)aggregate from Colorado Springs, CO, granite (GRNT) fromPueblo, CO, basalt (BSLT) from Golden, CO, and an alluvialsource (ALLV) from Silverthorne, CO. The properties ofthese materials are presented in Table 2.
2.2.3 Sweep Test Procedure
The test procedure is described in detail in Appendix B.Differences between the procedure conducted in the researchand that described by ASTM D7000 include the following:
• 40% initial embedment of the aggregate chips,• 40% and 80% emulsion moisture loss, and• Consistent, uniform application of the aggregates to the
test pad.
In this procedure, asphalt emulsion is applied to a 15-poundper square yard roofing felt substrate in a circle by means ofa steel template with an 11-in. diameter cutout. Emulsifiedasphalt is screeded level with the template by means of a strike-off rod as shown in Figure 1. Aggregate is then placed mechan-ically using a dropping apparatus as shown in Figure 2. The
Emulsion Tests RS-2P RS-2 CRS-2 CRS-2P HFRS-2P Viscosity, SFS 122F 108 96 78 119 132 Storage Stability, 1 day, % 0.1 0.1 0.2 Sieve Test, % 0.0 0.0 0.0
0.1 0.2 0.0 0.0
Demulsibility, 35 ml 65 72 76 76 42 Residue, by evaporation, % 65.1 68.0 67.9 67.7 65.3
Residue Tests Penetration, 77F, 100g, 5s 115 112 125 121 115 Ductility, 77F, 5cm/min 100+ 100+ 55 65 60 Float, 140F, s na na na na 1290
Table 1. Emulsion properties.

71
aggregate is then set in place, one stone thick, by means of acompactor as shown in Figure 3. The specimen is then placedin a 160°F oven to allow the emulsified asphalt to cure to 40%moisture loss or 80% moisture loss after which the specimen isremoved from the oven. It is then cooled, and any loose parti-cles are removed. The specimen is then swept under the action
of a weighted brush which is spun by a planetary motion mixerfor 1 min as shown in Figure 4. The specimen is then removedfrom the machine and brushed by hand to remove all particlesthat were mechanically dislodged from the specimen surface.The mass loss is then determined, which is expressed as percentloss of the original aggregate mass.
Sieve No.(in.)
Sieve Size(mm) LSTN GRNT BSLT ALLV
3/4 19.0 100 100 100 1001/2 12.5 100 100 100 1003/8 9.5 100 99 100 995/16 8.0 100 50 79 731/4 6.3 48 9 30 334 4.75 1 1 1 2
1 1 1 21 1 1 21 1 1 21 1 1 21 1 1 21 1 1 2
8 2.3616 1.1830 0.6050 0.30100 0.15200 0.075
2.615 2.612 2.773 2.56678.3 84.0 92.2 86.126.3 27.8 20.1 22.0
Flakiness Index 33.8 5.8 13.1 10.5
Passing, %
Los Angeles Abrasion Loss, %
Bulk specific gravityLoose unit weight, lbs/cf
Table 2. Aggregate properties.
Figure 1. Emulsion strike-off apparatus.

72
Figure 2. Dropping apparatus placing aggregate on test pad.
Figure 3. Compactor setting aggregates on test pad.
2.3 Time Required Before Broomingor Traffic
Determining when the first brooming can be accomplishedto remove excess chips or when to open a fresh chip seal totraffic is one of the most subjective decisions that must bemade. Releasing traffic too soon can lead to vehicle damagedue to flying aggregate particles. Releasing traffic too late can
lead to delays and congestion. Also, if light brooming results indamage to the chip seal, the chip seal is often left unbroomeduntil binder strength increases. However, allowing traffic on thefresh, unswept chip seal can lead to flying chips and potentialdamage.
The modified sweep test, which measures the relativeadhesive strength of emulsions and emulsion residues in thelaboratory, was used to evaluate materials from full-scale

73
chip seals. The objective of this experiment was to deter-mine if the moisture content of the chip seal in the fieldaffects the ability of the chip seal to withstand brooming andtraffic stresses.
2.3.1 Full-Scale Field Tests
Three full-scale chip-seal projects were included in thisresearch. Test pavements were located on County Road 11 nearFrederick, Colorado, approximately 30 miles north of Denver,Colorado; the Main Entrance Road in Arches National Park,Utah, approximately 15 miles north of Moab, Utah; and US-101 near Forks, Washington, on the western edge of OlympicNational Park.
2.3.2 Moisture Tests
Moisture in a chip seal comes from two sources: the chipsand the asphalt emulsion. In addition, on some projects addi-tional moisture may be present in the roadway. If the amountof moisture in the chips and the emulsion is known at the timethe chip seal is constructed, the amount of moisture that evap-orates after emulsion and chip application can be measured.The objective of this part of the research was to measure themoisture loss in the three chip-seal projects and develop arelationship to chip adhesion.
The amount of moisture remaining in each chip seal wasmeasured and compared with the relative strength of the
residue on a scale of 1 (no strength) to 10 (ready for traffic),judged by pulling three chips out of the fresh seal and qualita-tively judging dislodgement potential. This qualitative evalua-tion was conducted after rolling. Moisture remaining in theemulsion was determined by placing plywood pads coveredwith aluminum foil measuring 24 in. by 24 in. in front of theasphalt distributor prior to spraying with emulsion. The padswere weighed before and after spraying and chipping, and theloss in weight was determined periodically during the day untilapproximately 95% of the water had evaporated. Figure 5 showsthe setup used to measure the tare weight of the apparatus priorto spraying and chipping.
The tared pad was placed in front of the asphalt distribu-tor and chip spreader before chip-seal operations began.After the emulsion and chips were applied to the pavementand tared pad, the pad was removed from the pavement andre-weighed. As moisture evaporated from the pad the weightwas recorded and the strength of the emulsion residue wasevaluated using the 1 to 10 scale. The resulting relationshipbetween emulsion strength and moisture loss was developed.
2.4 Emulsion Consistency in the Field
The consistency of the emulsion is an important factor thatinfluences performance of the chip seal. An emulsion withviscosity too low may not have the ability to hold chips in placeor could flow off the pavement. An emulsion with viscosity
Figure 4. Modified sweep test mixer.

74
too high could be difficult to spray evenly or may not havethe wetting ability needed to coat chips. Emulsions are oftentested at the point of manufacture and a certificate of compli-ance is issued by the manufacturer indicating compliance tostate, local, ASTM, or AASHTO specifications. However,because changes to physical properties of emulsions used forchip seals can occur during transportation, a means of mea-suring the consistency of the emulsion at the construction siteis desirable. Some highway agencies have portable laborato-ries capable of conducting viscosity tests in the field (Santi2009). However, most agencies do not have laboratories ortrained personnel to conduct such tests. Therefore, a simplemethod of verifying the ability of the emulsion to be used asa chip-seal binder was identified in this research.
2.4.1 Full-Scale Field Tests
Two simple methods for measuring the consistency of asphaltemulsions in the field were evaluated. One method based on a procedure developed by Wyoming DOT (Morgenstern2008) requires a Wagner Part #0153165 funnel, wind protec-tion, 16-ounce plastic cups, thermometer, and a stop watch.The other method was a falling cylinder viscometer which
was found to be cumbersome to operate and time consumingto clean and not appropriate for use in the field.
The first tests were conducted at the Arches site using theWagner funnel with a 4 mm orifice. However, the emulsionrequired over 90 s to empty the funnel. This resulted in largedifferences between test results because the emulsion viscosityincreased as the temperature decreased, increasing the time toempty the Wagner cup. Therefore, the orifice was drilled outto increase the diameter until the cup emptied in approxi-mately 60 s or less. This process was repeated for the Frederick,CO, and Forks field tests.
The test proved simple to conduct, low cost, and requireda simple apparatus. Although this test would require moredevelopment to be used for determining specification com-pliance in the field, the test will help a field inspector rapidlydetermine the suitability of an emulsion upon delivery to theconstruction site.
2.5 Pavement Texture Testing
Adjusting the emulsion spray rate to compensate for dif-ferences in pavement surface texture is one of the most sub-jective adjustments made during chip-seal construction.
Figure 5. Moisture test pads prior to spraying/chipping.

75
Except for the sand patch test used in South Africa andAustralia/New Zealand (Austroads 2006, South AfricanRoads Agency 2007), adjustments in the United States aremade using judgment based on past experience. The objec-tive of this experiment was to provide a more quantitativemethod for evaluating pavement texture and adjustment ofemulsion application rate.
Macrotexture is the texture type that is relevant to chip seals.Macrotexture is surface roughness that is caused by the mixtureproperties of an asphalt concrete surface or by the finishing/texturing method of a portland cement concrete surface (Hallet al. 2006).
Previous work has indicated that either the sand patchtest (ASTM E 965) or the circular texture meter (CT meter)profile (ASTM E 2157) can be used to effectively evaluatepavement macrotexture (Abe et al. 2001, Hall et al. 2006,Hanson and Prowell 2004). Both of these measurements areeasily performed in the field, but traffic control is neededduring these measurements. The sand patch test has beenused for texture measurement because it requires inexpen-sive equipment that is easy to obtain, and it provides accept-able measurements (Austroads 2006, South African RoadsAgency 2007). However, conducting the test is slow andexposes personnel to traffic, and results are influenced bywind and moisture.
The CT meter evaluation of surface macrotexture can bemade more quickly than sand patch testing and thereforeexposes the technician to less traffic and accident risk. Also,the CT meter measurements do not depend upon operatorskill. Figure 6 shows the interior of the CT meter, which facesthe pavement when taking measurements.
2.5.1 Laboratory Texture Testing
One part of this research involved testing three slabs ofvarying surface texture. These test slabs provided a range oftextures for evaluating three texture measurement techniques.The slabs were fabricated to simulate three surfaces rangingfrom very rough, simulating a highly raveled and pocked sur-face, to very smooth, simulating a very flushed surface.
The slabs were cast over asphalt pavements using a very lowviscosity self-consolidating concrete. The self-consolidatingconcrete was used to make the texture specimens because ofthe concrete’s ability to flow into the smallest voids in thesurface of the asphalt pavements. This created texture testspecimens that mimicked the texture of the three pavementsurfaces. Texture of the three slabs was measured using sandpatch, CT Meter, and the Aggregate Imaging System (AIMS).
2.5.1.1 Sand Patch Test
The sand patch test (ASTM E 965) is a volumetric techniquefor determining the average depth of pavement surface macro-texture. A known volume of small particles (either sieved sandor small glass beads) is poured onto the pavement surface andspread evenly into a circle using a spreading tool. Four diame-ters of the circle are measured and an average profile depth iscalculated from the known material volume and the averagedcircle area. This depth is reported as the mean texture depth(MTD). The method provides an average depth value and isinsensitive to pavement microtexture characteristics.
The CT meter test method (ASTM E 2157) is used tomeasure and analyze pavement macrotexture profiles with
Figure 6. CT meter.

76
a laser displacement sensor. The laser sensor is mounted onan arm which follows a circular track of 284 mm (11.2 in.)diameter. Depth profiles are measured at a sample spacingof 0.87 mm, and the data are “segmented into eight 111.5 mm(4.39 in.) arcs of 128 samples each” (ASTM E 2157). A meanprofile depth (MPD) is calculated for each segment, and an average MPD is then calculated for the entire circularprofile.
2.5.1.2 AIMS
The AIMS was created to quantitatively describe the charac-teristics of aggregates (Masad 2005). The system consists of acamera mounted above a table with several lighting arrange-ments. Using AIMS, coarse aggregate is characterized by parti-cle shape, angularity, and texture. Samples of coarse aggregateare placed on the AIMS table under the camera and lightedfrom above, below, or both, and camera images are used toquantify the aggregate characteristics. Analyzing macrotextureof coarse aggregates can be compared to measuring macro-texture of a pavement surface.
Using AIMS, microtexture or macrotexture of coarseaggregate surfaces can be quantified using wavelet analysis ofa grayscale digital photo. Camera focal length can be adjusteddepending on whether macrotexture or microtexture is ofinterest. Using AIMS, depth measurements were generatedevery 1 mm for four scanlines of 100 mm length each, 20 mmapart, and in two perpendicular directions, for a total of eightscanlines per test slab. The total of eight scanlines at 100 mmlength each was chosen to be similar to the eight segments ofthe CT meter profile. The two sets of four scanlines eachwere taken in perpendicular directions to account for direc-tional differences in pavement texture. This arrangementcould be used to estimate directional differences in texture,which is texture in the direction of traffic versus textureperpendicular to the direction of traffic. Profiles were gen-erated for the scanlines and analyzed in a procedure simi-lar to the CT meter analysis (ASTM E 1845). A mean profiledepth, MPD, was calculated from the AIMS data for each ofthe three test slabs.
2.6 Residue Recovery Methods and Properties
The performance grading (PG) asphalt binder grading sys-tem (Asphalt Institute, SP-1) is widely used as the specificationfor grading and selecting asphalt binders. The PG specificationwas developed for use in hot mix asphalt concrete (HMAC)pavement layers. However, the PG system is not applicable toclassifying and choosing binders for use in pavement chip seals.Chip seals differ from full-depth HMAC layers in construction
methods, structural functions, behavioral responses, distresstypes, and effects of environmental exposure. Therefore, thebinder grading system, surface performance grading (SPG),was first suggested to classify emulsion residues or hot-appliedbinders for use in chip seals (Epps et al. 2001, Barcena et al.2002). This grading system utilizes the same test methods as thePG system, but applies limits on test parameters that are con-sistent with the mechanics of chip seals rather than hot mixasphalt.
An emulsion residue specification requires a standardizedemulsion residue recovery method that produces a materialrepresentative of the emulsion residue in situ. Currently, emul-sion residues are recovered by distillation (ASTM D 6997) thatexposes the material to high temperatures and may destroy orchange any polymer networks present in modified emulsionresidues.
This section describes the experiment used to compareemulsion residue recovery methods, characterizes the emul-sion residues by both the PG and SPG grading systems andsome additional tests, and recommends an emulsion residuerecovery method and emulsion residue specification.
2.6.1 The Surface Performance-GradedSpecification
The tests used in the SPG grading system are conductedwith standard PG testing equipment and the analyses areperformance-based and consistent with chip-seal design, con-struction, behavior, in-service performance, and associateddistresses (Epps et al. 2001, Barcena et al. 2002). Field validationof the initial SPG system was completed in Texas (Walubita et al. 2005, Walubita et al. 2004) and resulted in the proposedthree SPG grades shown in Table 3.
2.6.2 Residue Recovery Experiment
The standard PG system (Asphalt Institute, SP-1) and themodified SPG system (Epps et al. 2001, Barcena et al. 2002,Walubita et al. 2005, Walubita et al. 2004) were both used tograde all base binders and corresponding recovered emulsionresidues in this experiment.
2.6.2.1 Materials
Eight emulsions were included in this research, five of which,identified as emulsions 1 through 5, were laboratory prepared.The other three emulsions were obtained from the full-scale testpavements in Utah Arches National Park; Frederick, Colorado,CR-11; and Forks, Washington, US-101. Table 4 lists the typesof emulsions and, when known, the PG grades of the basebinders as reported by the supplier.

77
Surface Performance Grade*
SPG 58 SPG 61 SPG 64
10 16 22 28 10 16 22 28 10 16 22 28
Average 7-day Maximum Surface Pavement Design Temperature, °C
<58 <61 <64
Minimum Surface Pavement Design Temperature, °C
≥10 ≥16 ≥22 ≥28 ≥10 ≥16 ≥22 ≥28 ≥10 ≥16 ≥22 ≥28
Original Binder
Viscosity ASTM D 4402 Maximum: 0.15 Pa·s; Minimum: 0.10 Pa·s Test Temperature, °C
205 205 205
Dynamic Shear, AASHTO TP5
*
Sin
G, minimum: 0.65
kPa Test Temperature @10 rad/s, °C
58 61 64
PAV Residue (AASHTO PP1)
PAV Aging Temperature, °C
90 100 100
Creep Stiffness, AASHTO TP1 S, Maximum: 500 MPa m-value, minimum: 0.240 Test Temperature @ 8 s, °C
−10 −16 −22 −28 −10 −16 −22 −28 −10 −16 −22 −28
*The table presents only three SPG grades as an example, but the grades are unlimited and can be extended in both directions of the temperature spectrum using 3 oC and 6oC increments. For illustration, SPG 58−10 indicates a material suitable for construction in an environment from 58oC to 10oC.
Table 3. Criteria for SPG grades for emulsion residues (Walubita et al. 2005, Walubita et al. 2004).

78
2.6.2.2 Emulsion Residue Recovery Methods
Hot oven (with nitrogen blanket) and stirred can (withnitrogen purge) emulsion residue recovery (SCERR) methodswere used to extract the water from the emulsions and to sup-ply dewatered residue for the material properties testing. Athird residue recovery method known as “warm oven” or “lowtemperature evaporative technique” (Kadrmas 2008, Hanz
et al. 2009) was also compared with the hot oven and stirredcan techniques (Prapaitrakul et al. 2009).
2.6.2.3 Laboratory Tests
Rheology Tests. Binder characterization tests utilizedthe same equipment and some of the same tests as specified
Emul-sion
AASHTO Emulsion
Type
Expected Base
Grade
Batch #
Recovery Method
PG Grade from Tests
Continuous PG Grade
SPG Grade
from Tests
Continuous SPG Grade
1 RS-2P PG 64 28
1 Base Asphalt
PG 64−34 67.8 34.2 SPG 70 24 71.7 24.0
6 Stirred Can with N
PG 64−34 69.3 34.1 SPG 73 18 73.0 21.3
11 Hot Oven-N Blnkt
PG 64−34 69.5 34.1 SPG 73 18 73.4 21.1
2 CRS-2 n/a
2 Base Asphalt
PG 58−28 60.2 30.7 SPG 61 18 63.1 19.4
7 Stirred Can with N
PG 58−28 62.9 31.0 SPG 64 18 66.4 19.2
12 Hot Oven-N Blnkt
PG 58−28 61.9 32.1 SPG 64 18 64.5 20.7
3 RS-2 PG 64−22
3 Base Asphalt
PG 64−22 66.9 27.1 SPG 67 12 69.7 14.7
8 Stirred Can with N
PG 64−22 68.2 26.8 SPG 70 12 71.4 15.9
13 Hot Oven-N Blnkt
PG 64−22 68.5 26.5 SPG 70 12 71.7 15.1
4 CRS-2P PG 64−28
4 Base Asphalt
PG 64−28 67.6 32.9 SPG 70 18 70.8 22.2
9 Stirred Can with N
PG 64−28 68.6 33.2 SPG 70 18 72.3 22.9
14 Hot Oven-N Blnkt
PG 64−28 69.2 33.7 SPG 70 18 72.9 23.4
5 HFRS-2P PG 70−28
5 Base Asphalt
PG 58−28 62.3 30.4 SPG 64 18 65.7 18.7
10 Stirred Can with N
PG 58−28 63.4 31.6 SPG 67 18 67.0 20.1
15 Hot Oven-N Blnkt
PG 58−28 63.3 31.8 SPG 64 18 66.9 20.0
6 − UT LMCRS-2 n/a
16 Stirred Can with N
PG 70−22 74.7 26.4 SPG 76 12 78.7 15.3
17 Hot Oven-N Blnkt
PG 76−22 76.7 26.3 SPG 79 12 80.9 15.7
7 − CO HFRS-2P n/a
18 Stirred Can with N
PG 70−28 72.0 32.0 SPG 76 18 76.6 21.1
19 Hot Oven-N Blnkt
PG 70−28 72.7 31.6 SPG 76 18 77.0 20.3
8 − WA CRS-2P PG 64−22
20 Hot Oven-N Blnkt
PG 64−28 64.1 28.0 SPG 67 18 67.6 18
21 Stirred Can with N
PG 64−
−
−
−
−
−
−
−
−
−
−
−
−
−
−
−
−
−
−
−
−
−
− −
−
−
−
−
−
−
−
−
−
−
−
−
−
−
−
−
−
−
−
−
−
−
−
−
−
−
−
−
−
−
−
−
−
−
−
−
−
−
−
−22 64.0 27.9 SPG 67 12 67.1 17.1
Table 4. Binders and PG and SPG grades.

79
in the PG system (Asphalt Institute, SP-1), but with differentlimiting criteria and test conditions as shown in Table 4.
All of the binders in this experiment were aged using thepressure aging vessel (PAV), as described in the PG grading sys-tem (Asphalt Institute, SP-1). Rolling thin film oven (RTFO)aging was not used because emulsion binders are not exposedto this type of heating in chip-seal construction. Unagedbinder was tested at the high temperature that is the criticalcondition for early strength development in the chip seals.PAV aged binder was used in the bending beam rheometer(BBR) to simulate long-term in-service aging that may causefailure at cold temperatures for chip seals. PAV aging simu-lates approximately the first hot and cold seasons of a chipseal, which is when most chip-seal failures occur (Epps et al.2001, Barcena et al. 2002).
Strain Sweep Tests. Strain sweep tests using a dynamicshear rheometer have been correlated to the chip-seal sweeptest, ASTM D 7000 (Kucharek 2007). Therefore, strain sweep information collected in this research supplementsthe SPG system for evaluating strain tolerance and resis-tance to raveling of emulsion residues during curing and atearly ages.
The strain sweeps were conducted using a dynamic shearrheometer (DSR) at 25°C with 8 mm plates and 2 mm gap onboth unaged and PAV aged material to show the change inthe complex modulus (G*) with increasing strain. Test resultsare affected by how the test is performed and by the parame-ters input into the DSR. The DSR is continually oscillatingduring strain sweep testing. Input to the DSR requestedstrains of 1% to 50%, and the strain sweeps were initiated at1%. A 10 min period was allowed after mounting the sampleand before testing started for thermal equilibrium to occur.An angular loading frequency of 10 radians/second and a lin-ear loading sequence with time was applied. A delay time of1 s after the load (strain) was incremented but before themeasurements were taken was chosen, and 20 to 30 strainmeasurements were taken during each test. The test time foreach strain sweep was approximately 1 to 2 min (after ther-mal equilibrium).
Chemical Tests. Gel permeation chromatography (GPC)was performed on each recovered residue to determine if allof the water had been removed during the residue recoveryprocess. Presence or absence of a peak at a time of 35 to 37.5 min
on the GPC chromatogram indicates the presence or absenceof water in the residue.
Fourier transform infrared (FT-IR) spectroscopy was per-formed on the residues from the five laboratory emulsions toobtain an indication of whether the recovery methods causedoxidation of the materials. The infrared spectra were plotted,and then the area under the wavenumber band from 1,820 to1,650 cm−1 was integrated to determine the carbonyl area,which is carbonyl used to represent the extent of oxidation inthe materials (Epps et al. 2001, Prapraitrakul et al. 2009, Wooet al. 2006).
2.7 Estimating Chip EmbedmentDepth During Construction
Embedment depth is usually determined during construc-tion by pulling several chips out of the binder and visually esti-mating the amount of the chip embedment in the binder.Because it is generally difficult to accurately assess chip embed-ment using this procedure, two methods based on the sandpatch test were developed to provide a quantitative measure ofembedment depth: the constant volume method and the con-stant diameter method.
Both methods were developed using the LSTN and GRNTaggregates from the laboratory sweep test experiment. Theseaggregates were used because they represent a range of flaki-ness from a high of approximately 34% for the limestone to alow of 6% for the granite.
2.7.1 Constant Volume Method
The objective of this experiment was to determine if thediameter of a constant volume of glass beads spread in a cir-cular shape onto the surface of a new chip seal could be usedto estimate the embedment of chips in the binder.
The aggregate chips (LSTN and GRNT) were oriented ontheir widest faces so that the average particle heights were theiraverage least dimensions. Embedment percentage was deter-mined for each specimen based on the aggregate average leastdimension, weight-to-volume relationships of the materials,and the diameter of the glass bead circle from equation 1.
The texture depth (T) is the average distance the aggre-gate chip is exposed above the surface of the asphalt (orALD − Embedment depth) as shown in Figure 7.
Glass Beads
Binder Chip
Embedment ALDT Agg
Chip
Figure 7. Embedment depth by constant volume model.

80
Volume of beads between binder surface and the top of thechip, Vbb = Wbb/γb
WhereWbb = weight of beads between binder surface and top of
chip andγb = unit weight of beads
So
Since
This relationship assumes the volume of glass beads isspread over the chip seal up to the peak of each particle suchthat the glass beads follow the profile of the particle peaks.Therefore, the average height of the glass beads on the chipseal is equivalent to the void height that would be seenbetween equal-height particles of a chip seal that is built withexactly one-sized aggregate.
Equation 1 can be used to calculate the percent embedmentof a chip seal for a known volume of glass beads spread in a cir-cle of a measured diameter. This procedure was used for lime-stone and granite aggregates, and the results were comparedwith the actual embedment depths to determine if the proce-dure yields appropriate results.
2.7.2 Constant Diameter Method
This method uses a constant diameter mold and measuresthe amount of glass beads necessary to fill the mold above thechip seal. Constant diameter chip-seal specimens were cov-
Embedment, %
Embedment, %
= −( )=
100
100
� ALD T ALD
�� �ALD W A ALDbb b− ( )[ ]{ }γ ( )1
T W Abb b= ( )γ �
T =
volume of beads between the binder surfaceeand the top of the chip
area of glass beadd circle (A)
ered with glass beads until the peaks of the largest chips werecompletely submerged in glass beads. A mold was used toconfine the glass beads to a constant diameter. By subtractingthe volume of beads above the average particle height fromthe total volume of glass beads used, the volume of beadsbelow the average particle height can be determined. Figure 8represents the apparatus used in this experiment.
To determine embedment percent, the chip-seal specimenis placed in the mold, and the mold is filled with glass beadsto the top of the mold. The total mass of beads which fills thespace above the specimen is determined and its volume is cal-culated using its density. Knowing the average height of thechip-seal aggregate, the volume of glass beads between the topof the mold and the top of the average particle is calculatedfrom the following:
Where:M = mold height, mm,
ALD = average particle height, mm, andA = mold cross-sectional area, mm2.
The volume of beads between the chips is determined bysubtracting Vba from the total volume of beads to fill themold. This value is used to determine the distance the chipsextend above the binder.
Where:Vbt = total volume of beads to fill the mold, cm3 = (Wbt/γb)
− Vba,Wbt = weight of beads to fill mold, gm, and
γb = unit weight of beads, gm/cm3.
Percent embedment is calculated as follows:
Embedment depth, % (2)= − ( )[ ]ALD V A ALDbb .
Volume of beads between the chips, mm3Vbb , == −V Vbt ba
Volume of beads above chips to top of mold, mm3V
M ALD A
ba ,
= −( )�
Glass Beads
Binder Chip
Embedment ALDT M Agg
Chip
Figure 8. Embedment depth by constant diameter model.

81
This chapter describes the results of the laboratory and fieldstudies conducted during this project that were used to developthe “Manual for Emulsion-Based Chip Seals for PavementPreservation” provided with this report. Details of the labora-tory and field testing are provided in the Appendices.
3.1 Sweep Test
Chip loss measured after the sweep test is shown in Figures 9through 12 for each of the dry, SSD, 40% and 80% moistureloss test conditions. Results of ANOVA shown in Table 5 andthe Newman-Keuls (Anderson and McLean 1993) multiplecomparison test in Table 6 indicate statistically significant dif-ferences between the 40% and 80% moisture loss test speci-mens for all five emulsions. Chip loss with dry aggregatesaveraged approximately 70% and 15% at 40% and 80% mois-ture loss, respectively. Chip loss for SSD aggregates averagedapproximately 65% and 10% moisture loss, also respectively.
The sweep test indicates a statistically significant differencein chip loss between aggregates that were dry when embed-ded in the emulsion and those that were in the SSD conditionwhen embedded. The Newman-Keuls multiple range com-parison from Table 6 indicates that dry aggregate has signifi-cantly higher loss than SSD aggregates except when the CRS-2emulsion is the binder used because damp aggregates allowthe emulsion to wick into the aggregate pores and provideimproved adhesion and cohesion properties.
There are statistically significant differences in chip lossbetween the emulsions. The RS-2P showed aggregate losssimilar to the other emulsions at 40% moisture loss witheither dry or SSD chips but higher chip loss at 80% moistureloss with either dry or SSD chips. The CRS-2P performedsimilarly to the other emulsions under all conditions exceptat 80% moisture loss with SSD chips, where it showed lessaggregate loss than the other binders except the HFRS-2P.
The particle charge on the emulsion appears to have littleeffect on chip loss at 40% moisture loss as shown in Figures 10
and 11. That is, the anionic RS-2 adheres equally well to thelimestone as to the granite and basalt, and the cationic CRS-2 adheres equally well to all of the aggregates. Some differencemay be significant with respect to the polymer modified RS-2P, where adhesion appears much better on the limestone.However, in general, the anionic emulsions do not appear tohave a greater affinity to limestone, and the cationic do notappear to have a greater affinity to the granite nor basalt. Table6 shows an opposite trend for the CRS-2P, which adheredbetter to the limestone (25% loss) than the granite (38% loss)at α = 0.05. Also, the basalt had the least chip loss and thealluvial had the most loss regardless of the emulsion. Thisindicates that factors other than surface chemistry affectadhesion.
3.2 Field Moisture Tests
The results of this experiment indicate that chip adhesionreaches the point where significant force is required to dis-lodge the chip at approximately 75% to 85% moisture loss. Atthat time sweeping can commence and traffic can be allowedto travel on the new surface. Figures 13, 14, and 15 show therelationship between chip-seal binder strength and moistureloss for each test pavement. The chip-seal binder strength wasjudged subjectively by pulling three chips out of the emulsionand rating the relative strength with respect to how difficultthe chips were to pull out of the emulsion residue on a scaleof 1 (no strength) to 10 (ready for traffic). This qualitative rat-ing was made after rolling.
3.3 Laboratory Sweep Test for Field Materials
The sweep test was conducted for aggregates and emul-sions obtained from the three field test pavements. Aggre-gates were tested using two moisture contents and a range ofmoisture loss percentages. Results are presented in Table 7,
C H A P T E R 3
Results and Analysis

82
0%
20%
40%
60%
80%
100%
RS-2 RS-2P CRS-2 CRS-2P HFRS-2P
LSTN Average
GRNT Average
B S LT Average
ALLVL Average
C h ip L o s s , %
Figure 9. Sweep test results for dry chips at 40% cure.
0%
20%
40%
60%
80%
100%
RS-2 RS-2P CRS-2 CRS-2P HFRS-2P
LSTN Average
GRNT Average
B S LT Average
ALLVL Average
C h ip L o s s , %
Figure 10. Sweep test results for dry chips at 80% cure.
0%
20%
40%
60%
80%
100%
RS-2 RS-2P CRS-2 CRS-2P HFRS-2P
LSTN Average
GRNT Average
B S LT Average
ALLVL Average
C h ip L o s s , %
Figure 11. Sweep test results for SSD chips at 40% cure.

83
Alpha Level for Significant Differences VariableTested
RS-2 RS-2P CRS-2 CRS-2P HFRS-2P
aggregate <0.0001* <0.0001* 0.3887 0.0049* <0.0001* moisture 0.0169* 0.0220* 0.1597 0.0003* 0.0335* cure <0.0001* <0.0001* <0.0001* <0.0001* <0.0001* agg x ** moist 0.2468 0.3618 0.0994 0.7574 0.5873 agg x cure 0.0001* 0.0020* 0.3927 0.0005* 0.0032* moist x cure 0.5425 0.0136* 1.0000 0.9546 0.6490 agg x moist x cure
0.1064 0.2088 0.8805 0.0114* 0.2366
* Statistical significance at α = 0.05 or less **x indicates the interaction effect of the variables shown on the mean chip loss
Table 5. Results of ANOVA for laboratory sweep tests.
EmulsionAggregateRS-2 RS-2P CRS-2 CRS-2P HFRS-2P
ALL A*(47)** A(57) A(50) A (38) A (44) GRN B(39) A(51) A(49) AB (33) AB (37) LS B(36) A(51) A(47) AB (32) B (28)
BST C(29) B(18) A(47) B (25) B (25) *Letters indicate different levels of statistical significance in chip loss average at α = 0.05 for the
different aggregates and the same emulsion. For example, there is a significant difference in chip loss between the alluvial (ALL) and the granite (GRN) for the RS-2 (47% vs. 39%), but not for the RS-2P (57% vs. 51%).
**Numbers in parentheses are the average percent chip loss after the sweep test
Table 6. Results of Student Newman-Keuls multiple comparison test for aggregate.
0%
20%
40%
60%
80%
100%
RS-2 RS-2P CRS-2 CRS-2P HFRS-2P
LSTN Average
GRNT Average
B S LT Average
ALLVL Average
C h ip L o s s , %
Figure 12. Sweep test results for SSD chips at 80% cure.
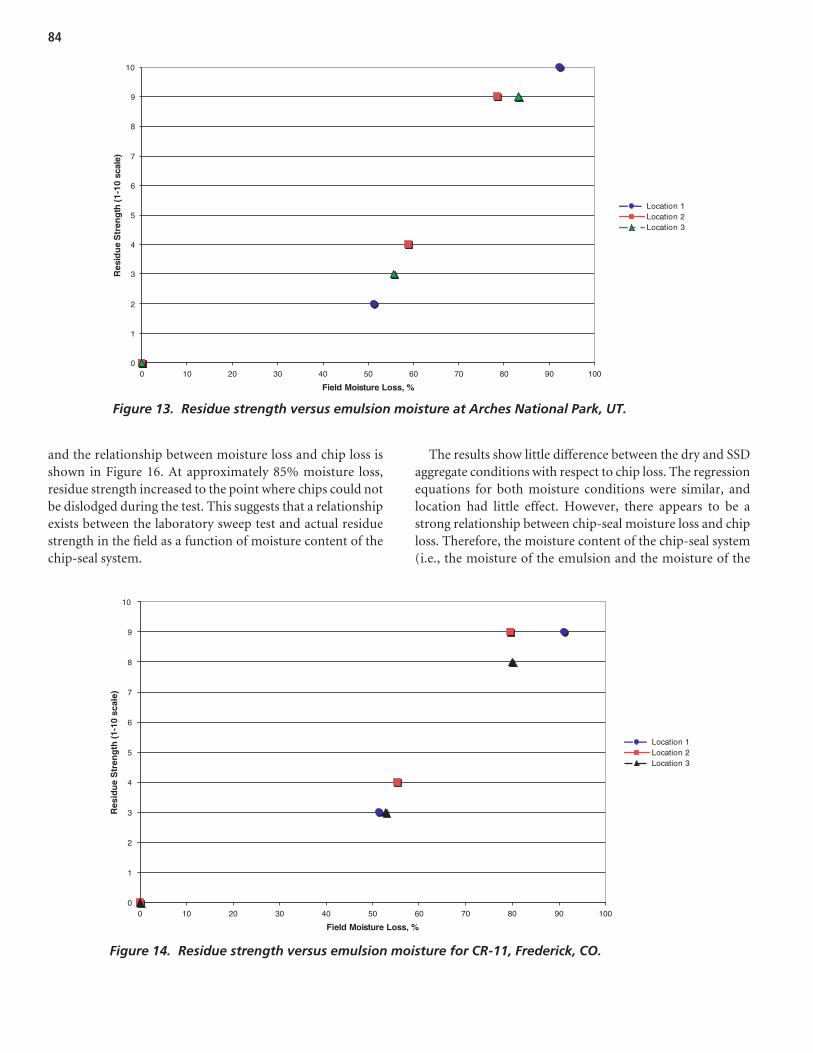
84
and the relationship between moisture loss and chip loss isshown in Figure 16. At approximately 85% moisture loss,residue strength increased to the point where chips could notbe dislodged during the test. This suggests that a relationshipexists between the laboratory sweep test and actual residuestrength in the field as a function of moisture content of thechip-seal system.
The results show little difference between the dry and SSDaggregate conditions with respect to chip loss. The regressionequations for both moisture conditions were similar, andlocation had little effect. However, there appears to be astrong relationship between chip-seal moisture loss and chiploss. Therefore, the moisture content of the chip-seal system(i.e., the moisture of the emulsion and the moisture of the
0
1
2
3
4
5
6
7
8
9
10
0 10 20 30 40 50 60 70 80 90 100
Field Moisture Loss, %
Res
idu
e S
tren
gth
(1-
10 s
cale
)
Location 1Location 2Location 3
Figure 13. Residue strength versus emulsion moisture at Arches National Park, UT.
0
1
2
3
4
5
6
7
8
9
10
0 10 20 30 40 50 60 70 80 90 100
Field Moisture Loss, %
Res
idu
e S
tren
gth
(1-
10 s
cale
)
Location 1Location 2Location 3
Figure 14. Residue strength versus emulsion moisture for CR-11, Frederick, CO.

85
chips) could be used to determine when the chip seal hasdeveloped enough adhesive strength to resist the stresses ofsweeping and uncontrolled traffic.
3.4 Emulsion Consistency in the Field
Results of the tests at Arches National Park, CR-11–Frederick, and US-101–Forks are shown in Figures 17 and 18for the 6-mm and 7.5-mm orifices, respectively. Arches testingdid not include the 7.5-mm orifice.
The emulsion consistency at all three test sites was consid-ered acceptable for constructing chip seals, i.e., it remainedon the pavement surface and did not flow off but was not soviscous as to prevent wetting of the aggregate chips. Based onthis observation, Wagner cup flow times of 20 to 70 s at emul-sion temperatures of 85 to 150°F for a 6-mm orifice or 10 to60 s at emulsion temperatures of 85 to 140°F for the 7.5-mmorifice may be appropriate for use as a guide for evaluatingemulsion flow.
A correlation between Wagner cup flow time and Sayboltviscosity was developed by Wyoming DOT (Morgenstern
0
1
2
3
4
5
6
7
8
9
10
0 10 20 30 40 50 60 70 80
Field Moisture Loss, %
Res
idu
e S
tren
gth
(1-
10 S
cale
)
Location 1
Location 2
Figure 15. Residue strength versus emulsion moisture at US-101, Forks, WA.
Site AggregateMoisture
Chip-SealMoisture Loss, %
Avg. Sweep Test Chip Loss, %
Arches Dry 41.0 32.3 Arches Dry 84.0 0.05 Frederick Dry 45.9 39.3 Frederick Dry 81.6 0.00 Forks Dry 40.6 68.2 Forks Dry 75.7 0.05 Arches SSD 38.9 63.3 Arches SSD 80.3 0.21 Frederick SSD 41.6 40.6 Frederick SSD 81.6 0.04 Forks SSD 42.9 47.6 Forks SSD 71.3 0.41
Table 7. Chip loss for test pavement materials.

86
Dry AggregateChip Loss, % =
-1.2179(Moisture Loss, %) + 98.203
R2 = 0.8254
SSD AggregateChip Loss, % =
-1.3453(Moisture Loss, %) + 105.33
R2 = 0.9283
0
10
20
30
40
50
60
70
80
30 40 50 60 70 80 90 100
Emulsion Moisture Loss, %
Ch
ip L
oss
, %
Figure 16. Chip loss versus emulsion moisture loss.
0
10
20
30
40
50
60
70
80
80 90 100 110 120 130 140 150 160
Temperature, F
Tim
e, s Forks
Arches
Frederick
Figure 17. Field flow time for 6-mm orifice Wagner cup.

87
2008) and is presented in Figure 19 for a CRS-2P. Similarcurves could be developed at different temperatures.
3.5 Pavement TextureMeasurement
Texture of three concrete texture slabs was measured in thelaboratory using the sand patch test, the CT meter, and theAIMS apparatus. Texture measurements were also made onthe test pavements at Arches–Utah; Frederick, Colorado; andForks, Washington. Multiple measurements of within-wheelpath and between-wheel path textures were made on eachproject; an average texture depth at each measurement loca-tion was calculated.
3.5.1 Laboratory Texture Measurements
The results of texture measurements for the laboratorytexture slabs using the sand patch, CT meter, and AIMS testmethods are shown in Figure 20. Both the CT meter andAIMS test methods correlate fairly well to the sand patch test.Further testing using the CT meter and sand patch were madeat each of the three field test sites.
3.5.2 Field Texture Measurements
Texture measurements for the three field test sites and thethree laboratory test slabs are shown in Figure 21. Texturesranged from 0.1 mm for one of the test slabs to nearly 3 mmat the Arches site. Linear regression using all data resulted inan R2 of 0.96 with slope of 0.96 and intercept of 0.14 indicat-ing nearly a one-to-one relationship between sand patch andCT meter texture measurements when laboratory and fielddata are combined.
3.6 Residue Recovery Methods and Properties
Rheological Properties
At the high temperatures, the base binders in every caseexhibited lower G*/sin δ than did the recovered residues, pos-sibly due to stiffening and aging of the residues during eitherthe emulsification process or the residue recovery process.The BBR test results indicated that the base binders and therecovered emulsion residues had similar cold temperatureproperties, probably due to deterioration of the polymeradditive structure over time and with aging (Woo et al. 2006).
0
10
20
30
40
50
60
70
80
80 90 100 110 120 130 140 150 160
Temperature, F
Flo
w T
ime,
s
Forks
Frederick
Figure 18. Field flow time for 7.5-mm orifice Wagner cup.

88
All of the materials met the PG (G*sin δ) criterion at the SP-1 specified intermediate temperatures.
PG and SPG Grading
Both PG and SPG grades were determined for all of thebase binders and recovered residues, and the results are shownin Table 4. Interpolation was used to determine the continu-
ous grades. In general, the PG and SPG grades were consis-tent for the base binder and the residues from both recoverymethods. However, examination of the continuous gradesindicated that the base binder grades were slightly differentfrom the grades of the recovered residues. The SPG systemresulted in a higher continuous grade at both the high and thelow temperature ends than the continuous grade with the PGsystem. The average differences in the high and low tempera-
R2 = 0.5438
30
40
50
60
70
80
90
100
100 120 140 160 180 200 220 240 260
Saybolt Viscosity, s
Wag
ner
Cu
p F
low
Tim
e
Figure 19. Saybolt viscosity versus Wagner cup flow time (Morgenstern 2008).
AIMSy = 0.8413x + 0.0339
R2 = 0.8625
CT Metery= 0.7808x + 0.1105
R2 = 0.9203
0
0.2
0.4
0.6
0.8
1
1.2
0 0.2 0.4 0.6 0.8 1 1.2 1.4
AIMS and CT Meter Texture, mm
San
d P
atch
Tex
ture
, mm
Figure 20. Laboratory test slab texture by sand patch and AIMS.

89
ture continuous grades (SPG minus PG) were +3.6° C and+11.3° C, respectively.
Chemical Properties
The GPC chromatograms for all of the residues from bothof the recovery processes indicated that water was absentfrom the recovered emulsion residues and had therefore beencompletely removed from the emulsions during the recoveryprocedures.
The carbonyl areas calculated from FT-IR spectra for thefive laboratory emulsions indicated that the recovered binderswere all slightly more oxidized than the base binders. Thisoxidation could have occurred during emulsification or duringthe residue recovery process.
Statistical Analyses Summary
The rheological data collected with the DSR and the BBRwere analyzed statistically to determine if there were statis-tical differences between the emulsions and between therecovery methods. ANOVA and Tukey’s honestly signifi-cant differences (HSD) multiple comparison techniqueswith a level of confidence of α = 0.05 were used in all of theanalyses.
When comparing the DSR data by recovery method, theanalysis results statistically grouped the recovery methodsof stirred can and hot oven together, and the base binder(“no recovery”) was grouped separately for the emulsionswith base binders available (1 through 5). Both recoveredresidues were stiffer, with larger values of G*, than the basebinders, but not stiff enough to change the high-temperature
PG grade for emulsions 1 through 5 as shown in Table 8.With smaller temperature increments, the high-temperatureSPG grade did change to a larger value for four of emulsions 1through 5.
Analysis of the BBR measurements showed that the recov-ery procedure (with base binders included as “no recovery”)did not affect the response variables S or m-value of the recov-ered residues. This result seems to indicate that after PAVaging, the polymers and additives no longer have an effect onstiffness properties.
The spectroscopic data were also analyzed statistically usingANOVA and Tukey’s HSD multiple comparison techniquesfor a level of confidence of α = 0.05. Statistical analyses of car-bonyl areas did not differentiate the recovery methods. Thebase binders and the recovered residues were statistically dif-ferent, but the two recovery methods were similar to eachother in terms of oxidative effects.
Strain Sweep Results
Strain sweeps were conducted on unaged and PAV agedmaterials. The unaged material represented the binder residueafter the chip seal was constructed and the binder had curedwith complete water removal. The PAV aged material repre-sented the binder residue after the chip seal would have beenin place for approximately one summer (high temperature)and one winter (low temperature). The majority of chip-sealfailures occur during either the first summer or the first winter(Epps et al. 2001).
Review of the plots of G* versus strain percentage indicatethat the magnitudes of the G* and strain values and the shapesand rates of change of the curves can be used to compare
0.00
0.50
1.00
1.50
2.00
2.50
3.00
0.00 1.00 2.00 3.00
CT Meter MPD, mm
San
d P
atch
MTD
, mm Colorado
Frederick
Utah Arches
WashingtonHwy 101
Test Slabs
Figure 21. CT meter versus sand patch texture.

90
materials and characterize strain tolerance. For comparison,the strain sweep data from the stirred can recovery residues foraged and unaged materials are shown in Figure 22.
Materials with high strain tolerance exhibit slow deteriora-tion of G* with increasing strain level, indicating that thematerial maintains stiffness and holds together under repeatedand increasing loads. Emulsions 1, 2, 4, and 5 in the unagedstate exhibited this behavior and were visibly more adhesiveand elastic when handled in the laboratory. After PAV aging,some materials exhibit less strain tolerance and develop a steepdecrease in G* with increasing strain. Emulsions 2, 3, and UtahArches are examples of this type of behavior. These materialswere very stiff and broke off of the test plates in a brittle mannerafter the strain sweep testing was completed.
An asphalt binder must develop enough stiffness (G*) to beable to carry vehicle loads before the chip-sealed pavement isbroomed or opened to traffic. The amount of moisture remain-ing in the chip seal has been shown to relate to binder strengthdevelopment. This moisture level could be correlated with G*from strain sweep testing to determine a minimum G* fortraffic bearing capacity.
Researchers have conducted testing on binders during cur-ing and have recommended the following criteria for deter-mining strain tolerance and failure of the emulsion residueduring curing (Hanz et al. 2009):
• 10% reduction in G*, or 0.10Gi* characterizes strain toler-ance and indicates that the material is behaving nonlinearlyand is accumulating damage;
• 50% reduction in G* or 0.50Gi* defines failure of thematerial.
Hanz et al. (2009) found that stiffer emulsion residues afterPAV aging are difficult to induce 50% Gi* and even 90% Gi*in strain sweep testing. Most of the unaged and only a few ofthe PAV aged materials reached 80% Gi*, as shown in Table 8,and none reached 50% Gi*. It is possible that intermediatereductions in Gi* could be used to characterize behavior of thefully cured residues when 50% or 90% Gi* cannot be attained.
Besides differing in the rate at which G* decreased withincreasing strain, the materials differed in their original stiff-ness, Gi*, and the rate of change of Gi* between the unaged and
Emul-sion
Recovery UNAGED Gi* (Pa, at 1% )
% at 0.90Gi*
% at 0.80Gi*
% at 0.50Gi*
AGED Gi*(Pa, at 1% )
% at 0.98Gi*
% at 0.90Gi*
% at 0.80Gi*
% at 0.50Gi*
1 base 241,120 21.23 34.74 n/a 987,120 4.95 10.88 12.67* n/a 1 stirred can 326,460 19.20 31.22 n/a 883,620 5.01 11.86 14.15* n/a 1 hot oven 337,500 19.79 32.67 60.06* 844,030 5.53 11.46 14.82* n/a
2 base 248,290 25.72 6.18 84.03* 1,448,300 3.93 7.31 8.62* n/a 2 stirred can 298,170 22.17 38.31 n/a 1,948,300 2.77 5.29 6.40* n/a 2 hot oven 318,660 21.32 36.98 63.37* 1,385,600 4.33 7.68 9.01* n/a
3 base 747,630 14.84 16.71 n/a 3,329,800 2.31 n/a n/a n/a 3 stirred can 825,740 13.26 15.13 n/a 2,811,300 3.62 n/a n/a n/a 3 hot oven 813,970 13.64 15.35 n/a 3,163,400 2.14 n/a n/a n/a
4 base 219,060 25.41 44.14 n/a 954,040 5.24 10.92 13.11* n/a 4 stirred can 289,860 20.77 34.51 n/a 905,480 5.58 11.27 13.82* n/a 4 hot oven 257,750 24.35 34.26 n/a 778,100 4.84 11.11 16.10* n/a
5 base 266,850 22.03 38.45 n/a 1,260,200 4.92 8.81* 9.91* n/a 5 stirred can 297,360 17.79 31.46 67.95* 765,620 5.18 10.76 16.35* n/a 5 hot oven 286,680 17.27 30.57 70.53* 801,740 3.96 10.38 15.54 n/a
6 – UT stirred can 1,182,300 9.18 10.56* n/a 2,486,600 2.45 4.46 n/a n/a 6 – UT hot oven 1,203,200 9.21* 10.37* n/a 2,886,400 3.33 3.84* n/a n/a
7 - CO stirred can 440,260 18.16 28.36 45.86* 1,235,400 3.36 8.41 10.11 n/a 7 - CO hot oven 444,800 17.92 28.20 45.42* 1,198,900 3.06 7.51 10.36 n/a * Max DSR stress was reached; n/a = test didn’t run that far
Table 8. Strain sweep test results.

91
the PAV aged states as shown in Table 8. The stiffest materialin the unaged state was Emulsion residue 6, a latex-modified,rapid-setting emulsion. The stiffest material in the aged statewas the Emulsion 3 residue, a rapid-setting unmodified emul-sion. G* increased the most from the unaged to the aged statefor the Emulsion 3 residue. It was followed by the Emulsion 2residue, also a rapid-setting unmodified emulsion, and thenby the Emulsion 6 residue. Residues for polymer modifiedEmulsions 1, 4, 5, and 7 increased in G* and exhibited agedbehavior after the PAV aging, but not by as much as the residuesfor Emulsions 2, 3, and 6. Also, for Emulsions 1, 4, and 5, thebase binder increased in G* considerably more than the recov-ered residue did, possibly indicating that either the emulsifi-cation process or the residue recovery process reduced thesusceptibility of these materials to the PAV aging process.
Based on the results of the strain sweep testing, Emulsions1, 2, 4, 5, and 7 would be expected to resist raveling due to theirhigh strain tolerances. Emulsions 3 and 6, which had very stiffunaged residues, would be expected to resist flushing and alsomight be able to be opened to traffic earlier. However, theseemulsions became more brittle with aging and could thereforeexhibit raveling with age.
A comparison between the emulsion residues used at thethree field tests and those recommended by the SPG criteriaare shown in Table 9. In all three cases the materials used werehigher temperature grades than the SPG recommended criteria,and in the case of Washington and Utah, lower temperaturegrades, as well.
The proposed emulsion residue criteria shown in Table 10are based on those originally proposed in previous research
0
500,000
1,000,000
1,500,000
2,000,000
2,500,000
3,000,000
0 5 10 15 20 25 30 35 40 45 50
Strain (%)
Co
mp
lex
Mo
du
lus
G*
(Pa)
Emulsion 3 PAV Aged
Utah Arches PAV Aged
Emulsion 2 PAV Aged
Emulsions 1, 2, 4, and 5 Unaged
Figure 22. G* versus shear strain from stirred can recovery method.
Field Site SPGRecommendation
ActualMaterial
UsedForks, WA 52–12 67–15 Arches NP, Utah 61–12 79–15 Frederick, CO 58–24 76–18
Table 9. Recommended SPG temperature ranges (°C).

Performance Grade*
SPG 61 SPG 64 SPG 70
–12 –18 –24 –30 –12 –18 –24 –30 –12 –18 –24 –30
Average 7-day Maximum Surface Pavement Design Temperature, °C
<61 <64 <70
Minimum Surface Pavement Design Temperature, °C
>–12 >–18 >–24 >–30 >–12 >–18 >–24 >–30 >–12 >–18 >–24 >–30
Original Binder
Dynamic Shear, AASHTO TP5
δ
*
Sin
G, Minimum: 0.65 kPa
Test temperature @10 rad/s, °C
61 64 70
Shear Strain Sweep % strain @ 0.8Gi*, Minimum: 25 Test Temperature @10 rad/s linear loading from 1–50% strain, 1 s delay time with measurement of 20–30 increments, °C
25 25 25
PAV Residue (AASHTO PP1)
PAV Aging Temperature, °C 100 100 100
Creep Stiffness, AASHTO TP1 S, Maximum: 500 MPa m-value, Minimum: 0.240 Test Temperature @ 8 s, °C
–12 –18 –24 –30 –12 –18 –24 –30 –12 –18 –24 –30
Shear Strain Sweep Gi*, Maximum: 2.5 MPa Test Temperature @10 rad/s linear loading at 1% strain and 1 s delay time, °C
25 25 25
*This table presents only three SPG grades as an example, but the grades are unlimited and can be extended in both directions of the 3oC and 6oC increments for the high temperature and low temperature grades, respectively.temperature spectrum using
Table 10. Proposed emulsion residue criteria.

93
shown in Table 3, including equivalent testing and perfor-mance thresholds for parameters measured in the dynamicshear rheometer and bending beam rheometer for unaged,high-temperature and aged, low-temperature properties,respectively. Additional testing and performance thresholdswere added based on strain sweep testing conducted as partof this project and other research (Hanz et al. 2010) and the significantly different performance of Emulsion 3 and theUtah Arches emulsion. The thresholds provided for the DSRand BBR parameters are based on validation with Texas fieldtest sections adjusted for climates in Utah and Colorado.
3.7 Estimating Embedment in the Field
Embedment depth is usually determined during construc-tion by pulling several chips out of the binder and visuallyestimating the amount of embedment. This practice is prob-lematic even if chips have a very low flakiness index because itis difficult to assess quantitatively with any precision. There-fore, two methods based on the sand patch test were developedto estimate embedment depth: the constant volume methodand the constant diameter method.
3.7.1 Constant Volume Method
Glass beads were spread out in a circle on top of chips embed-ded to 20% and 80% of the chip average least dimension. Thediameter of the circle was compared with the theoretical diam-eter that should result based on weight-to-volume characteris-tics of the materials presented in Section 2.7.1. Results of thisexperiment are shown in Figure 23.
At 20% embedment, the measured diameters are reasonablyclose to the theoretical diameters. However, at 82% embed-ment, the measured diameters are significantly less than thecalculated values.
At 20% embedment, voids are deep, requiring many beads,and the procedure of spreading the beads from particle peakto peak contributes less to error than it does at higher embed-ment percentages when the amount of beads between theaggregate voids is relatively less. At 80% embedment, manyparticles were fully covered by asphalt, making it impossibleto spread the glass beads between these aggregates.
Test results indicate this procedure to be useful when chip-seal particle embedments are closer to 50% or not submergedand chips have low flakiness index.
3.7.2 Constant Diameter Method
This method of estimating embedment depth used a moldof constant diameter in which glass beads were poured ontop of the aggregate chips and the volume measured. Usingweight-to-volume relationships for the materials, the volumeof glass beads required to fill the mold was calculated as afunction of the aggregate embedment depth. A comparisonbetween the calculated volume of glass beads required to fillthe mold and the actual volume measured for the limestoneand granite aggregates embedded to 20% and 82% is shownin Figure 24.
At 20% embedment, measured values deviate 10% fromthe theoretical values. At 82% embedment, the deviation isless at 5% from theoretical. Deviations were similar for thelimestone and the granite at both levels of embedment.
LimestoneTheoretical
Sand Patch Diameterat 82% Embedment
GraniteTheoretical
Sand Patch Diameterat 82% Embedment
0.0%
10.0%
20.0%
30.0%
40.0%
50.0%
60.0%
70.0%
80.0%
90.0%
100.0%
0.00 5.00 10.00 15.00 20.00 25.00 30.00 35.00
Sand Patch Diameter (Dia), cm
Ag
gre
gat
e E
mb
edm
ent,
%
Granite and Limestone SandPatch Diameter at Actual 82%Embedment
Figure 23. Comparison of calculated to measured embedment depth.

94
Limestone-Calculated
Granite-Calculated
0.0%
10.0%
20.0%
30.0%
40.0%
50.0%
60.0%
70.0%
80.0%
90.0%
100.0%
0 20 40 60 80 100 120 140 160 180
Volume of Sand below ALD ht, cm3
Ag
gre
gat
e E
mb
edm
ent,
%
Limestone-Actual
Granite-Actual
Figure 24. Embedment depth from constant diameter method.
95
Five new products were identified in this research to improvethe design and construction of chip seals. This chapter describesthese products and their application.
4.1 Modified Sweep Test and Critical Moisture Contents
This test provides a method to determine the timing forchip-seal brooming and opening to uncontrolled traffic. Thetest determines the moisture content of the chip seal, whichcorresponds to adhesion needed to retain chips under trafficloads. The moisture content of the chip seal can be monitoredduring construction to determine when the desired moisturecontent is reached. This moisture content ranged from about15% to 25% of the total chip-seal moisture. A description ofthe test method is provided in the appendix to the manual.
Results of the modified sweep test indicated that an aggre-gate in the saturated surface dry condition provides betteradhesion than dry aggregates. This finding suggests that chip-seal aggregates be moistened prior to construction.
4.2 Field Consistency Test
A Wagner cup viscometer was used in this research tomeasure the consistency of emulsions.
By conducting the test at a variety of temperatures in the lab-oratory, a temperature versus flow time relationship can beproduced. Flow in the field can then be measured and com-pared with laboratory results to determine actual viscosity atthe field temperature. The test method is described in theappendix to the manual.
4.3 Pavement Texture
A direct correlation between the sand patch test and the CTmeter indicates that pavement texture measurements can bemade with the CT meter and used as a substitute for the sandpatch test results in the design process. This texture measure-ment can then be used to adjust emulsion spray rates duringconstruction. Recommended adjustments are provided in themanual.
4.4 Residue Recovery and Desirable Properties
The SCERR method is recommended for obtaining emul-sion residues for use in tests proposed for measuring physicalproperties. Proposed emulsion residue criteria are listed inTable 10. The test method is provided in the appendix to themanual.
4.5 Measuring AggregateEmbedment in the Field
Two methods for measuring aggregate embedment in thefield have been developed. The constant volume method is asimple method, using a constant volume of glass beads spreadon the pavement surface in a circle. By measuring the diameterof the circle, the embedment of the aggregate can be estimated.However, this procedure becomes less accurate at embedmentover 50%. An alternative procedure, the constant diametermethod, can be used to estimate embedment up to 80%. Thesetest methods are provided in the appendix to the manual.
C H A P T E R 4
Practical Application of the Research

96
5.1 Conclusions
This report documents laboratory testing and field evalu-ation of several new procedures suitable for use by highwayagencies, consultants, contractors, and others involved in thedesign and construction of chip seals. These new procedureswere developed to add objective measurement capability tosome of the largely subjective judgments made during chip-seal design and construction.
A laboratory test that simulates the sweeping action ofrotary brooms during chip-seal construction was developed.This test simulates the shear forces applied by brooms anduncontrolled traffic to fresh chip seals, and can be used topredict the time required before brooms or uncontrolled traf-fic can be allowed on the surface of the chip seal. The test indi-cated the following:
• The moisture content at which 90% of the aggregate chipsare retained during the sweep test is the “critical moisturecontent” corresponding to very high residue adhesivestrength at which traffic could be allowed onto the chip-sealsections.
• Significantly higher chip loss was measured for sweep testspecimens fabricated with dry aggregates than with satu-rated surface dry aggregates.
• No significant difference in chip loss was measured eitherat 40% or 80% moisture loss between cationic and anionicemulsions used with either calcareous or siliceous aggregates.
The Wagner cup viscometer for measuring the consistencyof paints was successfully adapted to measuring viscosity ofemulsions. The test is inexpensive, field portable, repeatable,simple to operate, and can be correlated to laboratory tests.
An adjustment to the emulsion spray quantity should bemade to account for pavement surface texture. This processis often done subjectively or measured using the sand patchtest in other countries. Although the sand patch test can mea-
sure texture effectively, the CT meter and AIMS apparatuswere found to be faster and provide very similar results.
Extensive testing was done to evaluate new methods ofemulsion residue recovery. The methods included hot oven(with nitrogen blanket), stirred can (with nitrogen purge),and warm oven. Residues recovered using these methods weretested using the Superpave PG test methods and chemicalanalysis to determine which recovery technique mimickedthe base asphalts closest and resulted in the least amount ofwater remaining in the samples. These tests indicated that theSCERR method is rapid and provides a good simulation ofthe base asphalt material properties. Also, recovered emul-sion residues were shown to be different from their basebinders at high temperatures before PAV aging, but similar tothe base binders at cold temperatures after PAV aging.
The residues obtained from the emulsions used in the threefield test sites were characterized using the Superpave PGbinder tests. The result of this work is a performance-basedcriterion for chip-seal residues. Initially, this SPG criterionwas calibrated using field test sections in Texas. However,results of this research indicated that adjustments to the orig-inal criteria should be made to accommodate other climates.Therefore, characterization of residues should be done byevaluating the complex shear modulus, G*, over a range ofshear strains to evaluate strain resistance. These results couldbe used to predict when emulsion-based chip seals will developresistance to raveling and enough stiffness to be opened totraffic, both in newly constructed chip seals and after weather-ing and aging.
5.2 Recommendations
The findings of this project were based on a significantamount of field and laboratory measurement. However,additional studies would help improve upon these findingsand the recommendations. Such studies may include thefollowing:
C H A P T E R 5
Conclusions and Recommendations

97
• Further sweep testing with other sources of aggregateand emulsion to verify the validity of the test as a means ofmeasuring chip adhesion.
• Evaluation of grayscale photography and image analysisfor quantifying macrotexture of pavement surfaces (Pid-werbesky et al. 2009) to possibly provide a viable and rela-
tively inexpensive alternative to the sand patch test and theCT meter measurements.
• Monitoring the performance of the three test sites con-structed as part of this research to provide additional validation for setting thresholds in the proposed SPG spec-ification.

98
Abe, H., T. Akinori, J. J. Henry, and J. Wambold. Measurement of Pave-ment Macrotexture with Circular Texture Meter. TransportationResearch Record: Journal of the Transportation Research Board, No.1764, TRB, National Research Council, Washington, D.C., 2001.
Anderson, V. I. and R. A. McLean. Design of Experiments: A RealisticApproach, Marcel Dekker, ISBN: 0824761316, 1993.
Asphalt Institute. Superpave Performance Graded Asphalt Binder Specsand Testing, SP-1, ISBN: 978193415416.
Austroads. Austroads Technical Report AP-T68/06, Update of the Aus-troads Sprayed Seal Design Method. Alan Alderson, ARRB Group,ISBN 1 921139 65 X, 2006.
Barcena, R., A. E. Martin, and D. Hazlett. Performance Graded BinderSpecification for Surface Treatments. Transportation Research Record:Journal of the Transportation Research Board, No. 1810, Transporta-tion Research Board of the National Academies, Washington, D.C.,2002.
Barnat, J., W. McCune, and V. Vopat. The Sweep Test: A PerformanceTest for Chip Seals. Asphalt Emulsion Manufacturers Association,San Diego, CA, February, 2001.
Cornet, E. ESSO Abrasion Cohesion Test: A Description of the Cohe-sive Breaking Emulsions for Chip Seal. International Symposiumon Asphalt Emulsion Technology: Manufacturing, Application andPerformance, 346–355, 1999.
Epps, A. L., C. J. Glover, and R. Barcena. A Performance-Graded BinderSpecification for Surface Treatments, Report No. FHWA/TX-02/1710-1, Texas Department of Transportation and U.S. Depart-ment of Transportation, Federal Highway Administration (FHWA),Washington, D.C., 2001.
Epps, J. A., B. M. Gallaway, and C. H. Hughes. Field Manual on Designand Construction of Seal Coats. Texas Transportation Institute,Research Report 214-25, July 1981.
Gransberg, D. and D. M. B. James. NCHRP Synthesis 342: Chip Seal BestPractices, Transportation Research Board of the National Academies,Washington, D.C., 2005.
Hall, J. W., K. L. Smith, L. Titus-Glover, J. C. Wambold, T. J. Yager, andZ. Rado. NCHRP Web-Only Document 108: Guide for PavementFriction, Final Report, Project 1-43, Transportation Research Boardof the National Academies, Washington, D.C., 2006. http://www.trb.org/Main/Blurbs/161756.aspx.
Hanson, D. I. and B. D. Prowell, Evaluation of Circular Texture Meterfor Measuring Surface Texture of Pavements. National Center forAsphalt Technology (NCAT), Auburn, AL, 2004.
Hanz, A., Z. A. Arega, and H. U. Bahia. Rheological Evaluation ofEmulsion Residues Recovered Using Newly Proposed Evaporative
Techniques, Paper #09-2877, Presented at the 88th Annual Meet-ing of the Transportation Research Board, Washington, D.C., 2009.
Hanz, A., Z. A. Arega, and H. U. Bahia. Rheological Behavior of Emul-sion Residues Recovered Produced by an Evaporative RecoveryMethod, Paper #10-3845 [CD-ROM], Presented at the 89thAnnual Meeting of the Transportation Research Board, 2010.
Howard, I. L., M. Hemsley, Jr., G. L. Baumgardner, W. S. Jordan, III.Chip and Scrub Seal Binder Evaluation by Frosted Marble Aggre-gate Retention Test, Paper #09-1662, Presented at the 88th AnnualMeeting of the Transportation Research Board, 2009.
Kadrmas, A. Report on Comparison of Residue Recovery Methods andRheological Testing of Latex and Polymer Modified Asphalt Emul-sions. Annual Meeting of the American Emulsion ManufacturersAssociation, Report #4-AEMA ISAET 08, 2008.
Kucharek, A. Measuring the Curing Characteristics of Chip Sealing Emul-sions. Paper Presented at the Joint ARRA-ISSA-AEMA Meeting,Asphalt Emulsion Manufacturers Association and McAsphalt, 2007.
Masad, E. Aggregate Imaging System (AIMS): Basics and Applications,Implementation Report FHWA/TX-05/5-1707-01-1, Texas Trans-portation Institute (TTI), College Station, TX, 2005.
McLeod, N. Basic Principles for the Design and Construction of SealCoats and Surface Treatments. Proceedings of the Association ofAsphalt Paving Technologist, Vol. 29, 1960, 1–150.
McLeod, N. W. Seal Coat Design. Proceedings of the Association ofAsphalt Paving Technologists, Vol. 38, February 1969.
Morgenstern, B. Wyoming 538.0 (under review), Field Emulsion Viscos-ity Test, 2008.
Pidwerbesky, B., J. Waters, D. Gransberg, and R. Stemprok. Road Sur-face Texture Measurement Using Digital Image Processing andInformation Theory, Land Transport New Zealand Research Report290, New Zealand, 2009.
Prapaitrakul, N., R. Han, X. Jin, C. J. Glover, D. Hoyt, and A. E. Martin.The Effect of Three Asphalt Emulsion Recovery Methods on Recov-ered Binder Properties. Petersen Asphalt Research Conference, 2009.
Santi, M. Case Study of a State Emulsion QA Program. Presentation tothe Rocky Mountain Pavement Preservation Partnership, AirportHilton, Salt Lake City, UT, October 30, 2009.
Shuler, S. Design and Construction of Chip Seals for High Traffic Vol-ume. Flexible Pavement Rehabilitation and Maintenance. ASTM Spe-cial Technical Publication (STP) Number 1348. American Societyfor Testing and Materials. West Conshohocken, PA, 1998.
South African National Roads Agency. Technical Recommendationsfor Highways, TRH3 2007, Design and Construction of SurfacingSeals, May 2007.
References

99
Walubita, L. F., A. E. Martin, D. Hazlett, and R. Barcena. Initial Validationof a New Surface Performance-Graded Binder Specification. Trans-portation Research Record: Journal of the Transportation ResearchBoard, No. 1875, Transportation Research Board of the NationalAcademies, Washington, D.C., 2004.
Walubita, L. F., A. E. Martin, and C. J. Glover. A Surface Performance-Graded (SPG) Specification for Surface Treatment Binders: Devel-opment and Initial Validation, Report No. FHWA/TX-05/0-1710-2.
Texas Department of Transportation and U.S. Department of Trans-portation, FHWA, 2005.
Washington State Department of Transportation. Asphalt Seal. Technol-ogy Transfer, March 2003, 1–30.
Woo, J. W., E. Ofori-Abebresse, A. Chowdhury, J. Hilbrich, Z. Kraus,A. E. Martin, and C. Glover. Polymer Modified Asphalt Durabilityin Pavements, Report #FHWA/TX-07/0-4688-1, Texas Transporta-tion Institute, 2006.

100
Appendices A through J of the contractor’s final report for NCHRP Project 14-17 are availableon the TRB website at http://www.trb.org/Main/Blurbs/164090.aspx.
A P P E N D I X A T H R O U G H A P P E N D I X J

Abbreviations and acronyms used without definitions in TRB publications:
AAAE American Association of Airport ExecutivesAASHO American Association of State Highway OfficialsAASHTO American Association of State Highway and Transportation OfficialsACI–NA Airports Council International–North AmericaACRP Airport Cooperative Research ProgramADA Americans with Disabilities ActAPTA American Public Transportation AssociationASCE American Society of Civil EngineersASME American Society of Mechanical EngineersASTM American Society for Testing and MaterialsATA Air Transport AssociationATA American Trucking AssociationsCTAA Community Transportation Association of AmericaCTBSSP Commercial Truck and Bus Safety Synthesis ProgramDHS Department of Homeland SecurityDOE Department of EnergyEPA Environmental Protection AgencyFAA Federal Aviation AdministrationFHWA Federal Highway AdministrationFMCSA Federal Motor Carrier Safety AdministrationFRA Federal Railroad AdministrationFTA Federal Transit AdministrationHMCRP Hazardous Materials Cooperative Research ProgramIEEE Institute of Electrical and Electronics EngineersISTEA Intermodal Surface Transportation Efficiency Act of 1991ITE Institute of Transportation EngineersNASA National Aeronautics and Space AdministrationNASAO National Association of State Aviation OfficialsNCFRP National Cooperative Freight Research ProgramNCHRP National Cooperative Highway Research ProgramNHTSA National Highway Traffic Safety AdministrationNTSB National Transportation Safety BoardPHMSA Pipeline and Hazardous Materials Safety AdministrationRITA Research and Innovative Technology AdministrationSAE Society of Automotive EngineersSAFETEA-LU Safe, Accountable, Flexible, Efficient Transportation Equity Act: A Legacy for Users (2005)TCRP Transit Cooperative Research ProgramTEA-21 Transportation Equity Act for the 21st Century (1998)TRB Transportation Research BoardTSA Transportation Security AdministrationU.S.DOT United States Department of Transportation