Embed Size (px)
Citation preview
NBER WORKING PAPER SERIES
LABOR MARKET INSTITUTIONS, CONSTRAINTS, AND PERFORMANCE
Richard B. Freeman
Working Paper No. 2560
NATIONAL BUREAU OF ECONOMIC RESEARCH
1050 Massachusetts Avenue
Cambridge MA 02138
April 1988
Edward Funkhauser, Alida Castillo, and Francoise Carre provided invaluable research
assistance. The research reported here is part of the NBERs research program in Labor Studies. Any opinions expressed are those of the author and not those
of the National Bureau of Economic Research. Support from The Lynde and Harry
Bradley Foundation is gratefully acknowledged.

NBER Working Paper #2560
April 1988
Labor Market Institutions, Constraints, arid Performance
ABSTRACT
This study examines the changes in labor market institutions and outcomes
across (ECD countries in the past two decades and relates indicators of the
institutions to outcomes. It has four findings. First, there has been an
increased divergence in labor market institutions, with unionisation growing or
remaining at high levels of density in some countries while declining in
others. Second, changes in the two major outcomes on which analysts and policy-
makers focus -- employment and real wages -- are substantially negatively
correlated across countries, conditional on growth of GDP. Countries that had
rapid growth of employment in the l9]Os or 1980s, and high employment to
working age population rates, such as the U.S. or Sweden, had relatively slow
Crowth of real wages; while by contrast countries with relatively slow growth
of employment, such as Spain, had rapid growth of real wages, indicative of a
labor demand type constraint on outcomes, Third, there is a moderate nonlinear
relation between labor market outcomes and institutions: countries with either
relatively centralized wage-setting (as evidenced by little inter-industry
dispersion of wages) such as the Scandinavian countries and countries with
decentralized wage-setting (as indicated by high inter-industry dispersion of
wages) had better performances in employment than countries with intermediate
types of labor market structures and institutions. Fourth, even among countries
with comparable institutions, there is a considerable diversity of performance.
Richard B. Freeman National Bureau of Economic Research
1050 Massachusetts Avenue
Cambridge, MA 02138
A

Labor Market Institutions, Constraints, and Economic Performance
The labor market experiences of advanced economies diverged sharply in the
1970s and l980s: employment increased in North America, Australia, and Japan
while stagnating in many western European countries; real wages grew rapidly in
most OECD countries but not in the United States, then generally stabilized or
declined but not in the United Kingdom. Many analysts (largely European) blame
Europe's stagnant employment on union policies and government labor regulations
that reduce wage and employment flexibility and extol the US as the paragon of
a flexible efficient market. Other observers (largely American) bemoan the
slow growth of productivity and shift of jobs to low wage industries in the US
and view Japan as the exemplar economy. Still other analysts blame high
unemployment on decentralized wage-setting that permits real wage growth
despite joblessness and see a solution in Swedish-style 'corporatism'
Do labor market institutions in OECD countries differ sufficiently to have
caused the observed differences in economic performances of the 1970s-l980s?
Do claims that labor market flexibility, unionism, centralised or decentralized
wage-setting affect outcomes stand up to critical investigation?
To answer these questions I analyse data on changes in wages and
employment pooled across countries and industries and relate these changes to
indicators of the institutional structures of labor markets. In the first
section I compare two indicators of labor market arrangements - - union density
and dispersion of wages among industries - - and find large differences and
increasing polarization among OECD countries, as some countries have moved to
near universal unionisation/collective bargaining coverage and narrow wage
differentials while others have moved to weak unionism and wider differentials.
In the second section I document the existence of a substantial tradeoff
between growth of employment and real wages across countries and industries.

2
in the third section I relate measures of performance to labor market structure
and find that economios at the extremes - - with highly centralized or highly
decentralised labor msrket arrangements - - had better employment records than
economies 'betwixt and between' . While this is consistent with theories that
decentralized and highly structured labor markets may produce similar outcomes
(Olson,1982; Calmfors and Driffill), there is sufficient diversity in outcomes
among countries to indicate thst specific institutional arrangements are
neither necessary nor sufficient for adoption of employment-creating policies.
I. Differences in Labor Markets: Union Density and Wage Structures
Labor market institutions, wage-setting systems, and the wage structures
that reflect those systems changed in different wsys in developed countries in
the lPiOs and lPSOs. The proportion of workers represented by unions fell in
the US, Japan, and, after a period of growth, in the UK and Netherlands while
increasing or stabilizing in most OECD countries. Wage differentials by
industry and skill, which historically narrow with develop-ment, rose in some
countries but not in those with centralized wage setting.
Union density/collective bargaining representation
Table 1 records figures on the proportion of nonagricultural wage and
salary workers in the traditionally most important labor market institution in
capitalism -- trade unions. As unionism has different meanings across settings
(it reflects representation at the company level and the Shunto offensive in
Japan; collective bargaining to a written agreement in the US; national wage-
aerting in Scandinavia, etc.) and is measured differently (1), the figures
mhould be viewed as crude indicators of patterns and changes. The question
marks next to France and Italy reflect the particularly weak measures of
unionisation in those countries (2), though data for other countries are also
imperfect. In Australia the arbitration wage-setting system places unions at
the center of wage determination despite moderate density. In the UK the drop

Table 1: Levels and Changes in Union Density as a percent of Non Agricultural Wage and Salary Employees Across Countries, 1970-85
Countries with Sharp Rises in Density
1970 1979 1984/5 1970-79 1979-85
66 86 98 +20 56 84 85 +23 79 89 95 +10 66 77 -- +11
Countries with Moderate Rises in Density
Countries with Stable/Declinj7g_Density
Norway United Kingdom Austria *
Japan * Netherlands United States
59 60 61 51 58 52 64 59 61 35 32 29 39 43 37 31 25 18
+1 +1 +7 -6 -5 +2 - 3 -3 +4 -6 - 6 -7
53 54 19 22 36 40
Note: Union Density as a percent of nonagricultural wage and salary employees.
Source: U.S. Department of Labor, Bureau of Labor Statistics, Office of
Productivity and Technology, Division of Foreign Labor Statistics and Trade, July 1986. Center for Labour Economics OECD Data Set upcaated with respective Country Statistical Abstracts.
a) My figures on density 'isagree with those of WK Foche and Joe Larragy (1987)
because they divide union membership by labor force while I divide by
employment.
Do n:no r k Finland Sweden
Belgium
+12 +1
Italy (7)
Germany France (7)
Switer1and Canada Australia New Zealand Ireland L4)
39 51 45 +12 - 6 37 42 42 + 5 0
22 28 28 + 6 0 31 36 35 ÷5 -1 32 36 37 + 4 ÷ 1
52 58 57 + 6 - 1
43 46 .- ÷ 3 --
44 49 51 + 5 + 2
Mean Standard Deviation Coeficient of Variation
15 32
No Change in union share of total employment employment.
due to fall in agriculture

epresentation exceeds tier shown in the ThIle because official union
tatis0i,s appear to exaggerate rerborship in tie rid 1980a (1,. In the US
nrivae sector density plurrctetted to 14% in 1924, with total density falling
less beca'se unloina organized traditiorallv nonunion public sector workers.
Theee and ohet xseas cozen: issuec notwithrtanding Table I reveals a
clear divergence it unioricatior rates actors countries that is unlikely to
change with better daa, Frs 1970 to 1179 dreita :noteaset in many
nr:c, with riser ci In r core point: i five. nu° declined in h' If tpan ann Puo:ie Proc 1970 o 1921 oenaity stabilized in n st oo-jntriee
bc° rr:p7c: srp the '72, 'KThpsr nd t Netherlands. Ciff0rert
'----en ---'. v't °otm ouraI raits 10 and Ce-'ada, ?olg'un ao
fir' ,lan°s :' ond Trefind ennw 'es t' e flanging untonisatlon
ruo ett' anne - - epe -te devclrpee's oa°tg oountties with dIfferent
fotca of cnio—Ioir : a result of the dIvergent trenos the orefffiiect of
;eclation in 4r _siy r:eascd from 0 02 in 1970 to OcO in 198:
efvaaC5-n'r.4lrdu5trles
10t: rr,,k tnotl nti'ns ,azaif ot age 0°d mgI 'rn—t utr me
lIe': -11:-'-;' of :e-& -vs wee : nrn it' pt 0 u:tker -1'.
v -ku -- r otinc dimensions Recent discussion of flexihil.1 II ha
fn '•u-o-L - rh ii'-- cr1 :n -—f wares errors in 'us'-r es I Nfl 192 1997a, - wI°n
rne:ys'c viewins '-ncs wish greater dirpersior as being more flexiole. ic ntrn i' chat deoen'railzed flcxubse wage setting allows unduatry-sperff
fsctora aodoue greater I nduatty dfferenoea nhen is alloaed by acre
cent: eli cdlnettcutiona 4) Following t is line of thinking, in this ;egec I use fortcrry wsge ds rson cc an 5odfiattr cf labor 'natket so" route. I
ion by aoend:cd do' : i a :a of In wage" ftc:. ii- r data se°s: the
'Jnired N,-"; o'e f r"c - f ndun cial Statistics; a data iil° from thc
Euroean cc .n"uf- "oootc4ty Eurrsnai figures; the International lsbot

Table 2: Variances of Ln Industry Earnings (xlOO) Anion OECD Countries 1970-86
Be I gium
Ireland
Germany
Netherlands
Switzerland
Decreasing Dispersion
24 - 13 48 - 37
16 - 13 34 - 34
Low Dispersion
11 - 09 26 - 16
—— 09-08
- - 17 19 - 19
C
10-
19 - 16 19 20
19-22 19-20
14 - 14 17 - 19
13 - 14 15 - 16
—— -ç 19-17
19 - 10(1 22 - 13
13 - 14 15 - 14
12 - 12 10 - 10
09-09 9-10
14-14 ——
Country UN 1973-83 Eurostat EEC 1970-83 ILO 1975-84 —______ - 1972-81
0 ELS 1975-86
c,s-
Japan
Canada
Austria
N, Zealand
U Kingdom
Australia
Norway
25 - 26
24 - 25
24 - 26
21 - 22
25 - 28
26 - 29
22 - 26
21 - 25
High/Increasing Dispersion 23 - 28 — — 28 - 33
25-26 25-28
21 - 25
21 - 27
Increasing Dispersion
17 - 21 — -
20 - 27 16 - 16 17 - 20
21 - 24 — —
19 - 25 — — — —
Moderate/Stable Dispersion
25 - 24 18 - 17 24 - 30
22 - 21 16 - 16 — —
19 - 20 12 - 13 23 - 23
— — e 13 - 11 29 - 23
Italy 32 - 19
France(?)
Denmark
Sweden
Finland
15 - 14
12 - 13
17 - 15

a. Data for Netherlands and Belgium for 1985. b. N. Zealand data from national statisical source shows increase in
dispersion from 13 - 17. c. Australia Reports too few industries for results to be ttustworthy. d, Males only. e. Netherlands has figures for 17 industrtes, with diap of 41 in 1973 and 29 in 1983. f. Switzerland figures for males, with diap of 8 in 1975 and 11 in 1984.
g. Italy's figures for 1982 based on a smaller number of industries. h. Klau and Mittelstadt show a decline in dispersion in France from 1966 to 1982 from 155 to 133 based on data from the Swedish Employer's Federation.
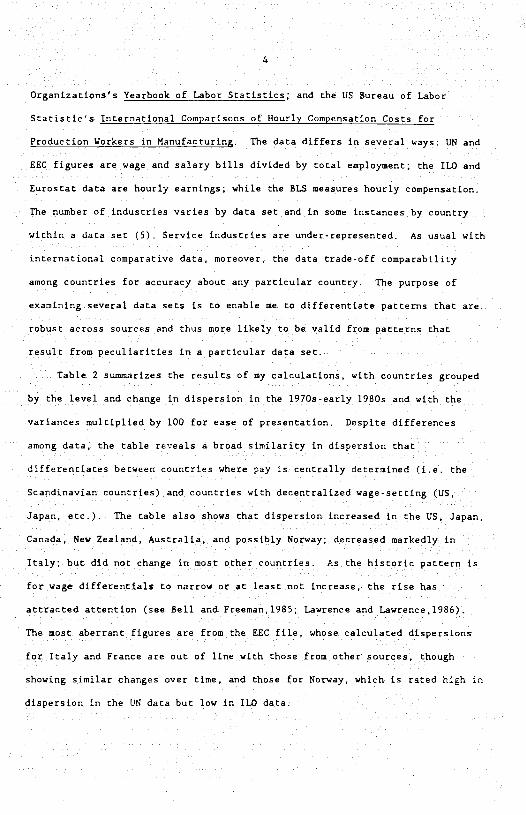
Organizations's Yearbook of Labor Statistics; and the US Bureau of Labor
Statistic's International Comparisons of Hourly Compensation Costs for
Production Workers in Manufacturing. The data differs in several ways: UN and
EEC figures are wage and salary bills divided by total employment; the ILO and
Eurostat data are hourly earnings; while the BLS measures hourly compensation.
The number of industries varies by data set and in some instances by country
within a data Set (5). Service industries are under-represented. As usual with
international comparative data, moreover, the data trade-off comparability
among countries for accuracy about any particular country. The purpose of
examining several data sets is to enable me to differentiate patterns that are
robust across sources and thus more likely to be valid from patterns that
result from peculiarities in a particular data set.
Table 2 summarizes the results of my calculations, with countries grouped
by the level and change in dispersion in the l97Os-early l9BOs and with the
variances multiplied by 100 for ease of presentation. Despite differences
among data, the table reveals abroad similarity in dispersion that
differentiates between countries where pay is centrally determined (i.e. the
Scandinavian countries) and countries with decentralized wage-setting (US,
Japan, etc.). The table also shows that dispersion increased in the US, Japan,
Canada, New Zealand, Australia, and possibly Norway; decreased markedly in
Italy; but did not change in most other countries. As the historic pattern is
for wage differentials to narrow or at least not increase, the rise has
attracted attention (see Bell and Freeman,l985; Lawrence and Lawrence,1986).
The most aberrant figures are from the EEC file, whose calculated dispersions
for Italy and France are out of line with those from other sources, though
showing similar changes over time, and those for Norway, which is rated high in
dispersion in the UN data but low in ILO data.

other wage differentials
As a check on the extent to which industry wage dispersion reflects the
overall wage-setting system in a country I have also examined pay differentials
by skill, sex, and age, and find that they follow patterns similar to industry
differentials. Consider, for example, the patterns of change in skill premia.
During the 1970s premia by years of schooling or occupation narrowed in moat
developed countries, often substantially, as the influx of young educated
workers created by the baby boom and post-world war II expansion of higher
education reduced the pay of the more educated (Freeman,198l). The 1980s
experience has been more varied: education and white collar/manual pay ratios
widened sharply in the U.S. and U.K. to pre-l970s levels while maintaining
levels much narrower than in the early l970s in many other OECD countries
(Sweden, Denmark, Italy, Norway, Australia, Finland, and Japan, according to
OECD, 1987b). As for differentials by sex, the ratio of female to male pay is
higher and increased more in economies with centralized wage-setting such as
Sweden or with special centralized features such as Australia than in
decentralized economies such as the U.S. (Gregory and Ho,l985; OECD,1985).
Finally, differentials by age also changed across countries, steepening in the
U.S. and some other countries with baby-boom induced increases in the supply of
young workers, narrowing in Japan, which had a shortfall of youth, while
remaining stable in countries with centralized wage-setting (Bloom and Freeman,
1986; OECD,l984; Leroy,1987). In short, the pattern of wage differentials
along dimensions other than industry across countries is sufficiently similar
to that in industry differentials to make industry dispersion a reasonable
indicator of differences in overall wage-setting systems.
When one contrasts specific countries with less pronounced- institutional
differences, however, these broad-based measures can be misleading. Consider,
for instance,-relative wage flexibility by geographic area in the US, which

6
ranks low in unionism arid high in dispersion in Tables 1 and 2 and is generally
viewed as the archetypal flexible labor market and in the UK, which ranks in
the middle of the unionism category and has a modestly narrower industry wage
structure, As can be seen in Table 3, in the US wages are high in areas of
high unemployment and show little response to increases in unemployment whereas
in the UK wages declined in the 1980s in high unemployment areas, These
patterns imply greater rather than smaller responsiveness of pay to area
unemployment in the UK. Relative pay by skill and age also appear to have been
no less flexible in the UK than in the US in the 1980s, with premium rising in
both countries, as noted earlier. The implication is that while dispersion,
union density, and other broad indicators of labor market institutions may
accurately reflect gross differences between centralized and decentralized
labor markets, they may not depict accurately differences in the operation of
markets between specific countries, Caveat esptor.
comparing measures of labor market_structure
This said, how closely linked are union density and industry dispersion to
one another and to widely used indices of corporatism or other categorizations
of labor market institutions?
As a first step to answering these questions I calculated correlation
coefficients between the union densities in table 1 and industry wage
dispersions in Table 2, obtaining values ranging from -030 to -056, and
calculated correlations between 1970-1980 changes in density and in 1973-84
changes in dispersion, obtaining a coefficient of 0.36. The correlations show
that wage dispersion contains information beyond that captured by union
density and conversely. Second, I compared dispersion and union density
across countries according to widely used corporatist indices. Most countries
classified by Cohn Crouch (1985) as corporatist and, ipso facto, by Bruno and
Sachs (1986), who rely on Crouch's work, have high union density and low wage

Table 3: Regression Coefficients and Standard Errors For the Relation ofg5oUnemper
Area: US vs UK
UK (61 counties) US (50 states) dependant log Rate log Rate variables weekly wage of average of
of male unemployment hourly mfg unemployment manual 1985 earnings 1985 workers 1979-85 1979-85
pendant variables
t unemployment - .92 - .43 rate (.27) (.30)
log wage/earnings .03 .11 1985 (.06) (.02)
Other variables
% employed mfg x x x x
education of x x x x workforce a)
2 R .39 .51 .25 .51
Source: UK data from
US data from US Statistical Abstract various editions.
Notes: a) UK education measured by
US education measured by median years of schooling

dispersion, producing a sizeable positive correlation between a corporatist
dummy variable and density (r— 0.45) and a negative correlation between it and
dispersion (r— -0.47). Still, the relations are far from perfect: Relgium and
Australia, rated low in corporatism, are high in unionism while 'corporatist'
Austria has high wage dispersion. Third, I correlated union density in 1980
and industry dispersion in 1984/5 with Calmfors and Driffills' ranking of
countries by centralization of wage-setting and found that those at the top of
their list (with low ratings) were more unionised (r — -0.71) and had lower
wage dispersion (r — 0.37). The relatively small correlation between wage
dispersion and centralization is due to Austria, which they rank as number one
in centralization while it has, as noted, high wage dispersion. (6)
The union density and dispersion of industry wage indicators of labor
market structures have three advantages over judgmental categorisations: they
are based on hard' statistics; they vary over time in a natural way: and they
lead one to look in close at actual wage outcomes and union representation.
The disadvantage is that they are a step removed from the corporatist/central-
ized wage setting and flexible market concepts that underlie the debate over
alternative labor market arrangements. As they have both advantages and
disadvantages, in ensuing analyses I use them and judgmental categorisations of
institutions to indicate the nature of the labor market structures that may
affect outcomes, First, however, it is necessary to delineate country
differences in outcomes and examine the labor demand relation that constrains
employment and wage outcomes,
II. Outcomes and Constraints
As the divergent views of American/European economic success given at the
outset indicates, choice of Outcomes tS critical in comparing performance. One
can get different pictures of economic performance by focusing on growth as
opposed to levels of outcomes; selecting one indicator rather than another;

10010 4
Indtrators of 'Se icrco1. Ferfaroanre
Erny/ Change 1Q-8Clange flyL 15-64 roy 1' 64 Corey JOarge Indee of COP 0100 rICO Rate ir inc real ODP/ real hourly 1164 19'3-84 0064 1073.84 real COP ranker jflnsef L!pjta Per employee
00 66.0 3 3 74 2 6 27 .05 04 100 100
7.00 64.6 -6.1 13.0 10.0 15 .16 19 72 71
Japan 70.7 -0.1 2.7 14 .46 32 .39 60 75
Ceroany 59.4 -6.7 8.5 7.8 22 .27 .18 86 94
France 56 6 -6 4 9 7 7.1 25 .25 .32 82 95
Italy 53 9 -2 2 10 2 4.0 .23 .13 25 65 79
Canada 64.7 0.2 11.2 57 33 .06 .09 99 101
Australia 63.8 -4.6 8.9 7.6 34 19 11 81 87
Austria 63 1 -5.0 3.8 2.7 .28 .18 .30 79
Belgium 55.3 -6.7 14.0 11.3 .20 .22 .35 79
lreuearb 73.5 -3.7 8.5 6.8 .23 .17 .20 87 81
FInland 73 4 3.4 6.1 3.8 33 .19 18 80 72
Ireland 52.5 -7.4 15.5 9.8 .42 .35 .29 52 73
Netherlands 53.7 -4.6 14.0 3.8 .17 .09 .12 76 94
New Zealand 61.3 -3.1 5.7 5.5 .20 .07 .09 69 28
Norway 74.3 7.5 3.0 3.5 .46 .24 .19 500 95
Spain 43.7 -16.2 20.1 17.6 .24 dO .61 54 87
Sweden 78 8 4.2 3.1 0 3 .21 .10 .00 99 88
Iwitrerland 70 6 -7.1 1.1 0.7 .08 12 .13 103 96
SOURCES: Parebasing Power Parity from DECO. See HOard, (19853 and P. Hill.
(1986).
DECO, Historical St.tistles 1960-84. (i986.c)
006, Cenrer for Labor Economics. DECO Sara Set (revised and
updated, 1987).
NOTES a. Unemployment rates are standardized DECO rates where available.
narlonai rates otherwise. Swiss onemploymenr,i9?S-84.
B. Hourly earnings is verified, deflated by GOP deflator.
o. Purchasing power parry dollars, see Ward and Hill.
8
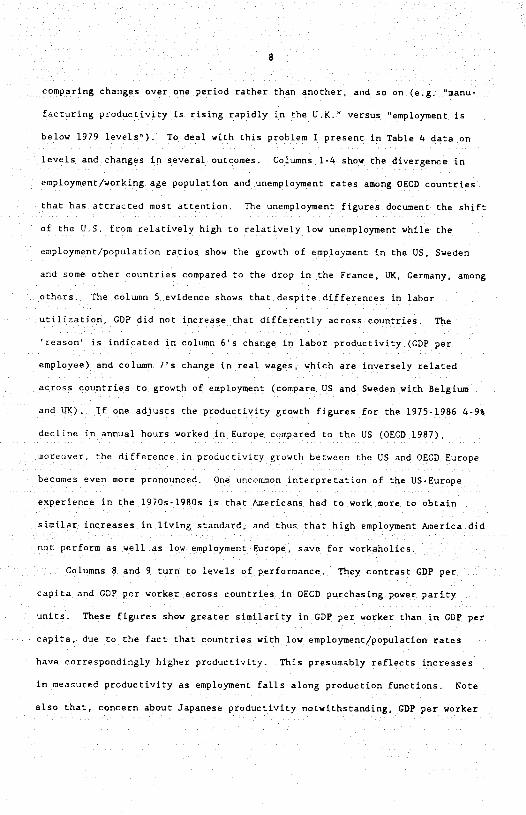
comparing changes over one period rather than another, and so on (e.g. "manu-
facturing productivity is rising rapidly in the U.K." versus "employment is
below 1979 levels"). To deal with this problem I present in Table 4 data on
levels and changes in several outcomes, Columns 1-4 show the divergence in
employment/working age population and unemployment rates among OECD countries
that has attracted most attention. The unemployment figures document the shift
of the U.S. from relatively high to relatively low unemployment while the
employment/population ratios show the growth of employment in the US, Sweden
and some other countries compared to the drop in the France, UK, Germany, among
others. The column 5 evidence shows that despite differences in labor
utilization, GD? did not increase that differently across countries. The
'reason' is indicated in column 6's change in labor productivity (GDP per
employee) and column 7's change in real wages, which are inversely related
across countries to growth of employment (compare US and Sweden with Belgium
and UK). If one adjusts the productivity growth figures for the 1975-1986 4-9%
decline in annual hours worked in Europe compared to the US (OECD 1987),
moreover, the difference in productivity growth between the US and OECD Europe
becomes even more pronounced, One uncommon interpretation of the US-Europe
experience in the 1970s-],980s is that Americans had to work more to obtain
similar increases in living standard, and thus that high employment America did
not perform as well as low employment Europe, save for workaholics.
Columns 8 and 9 turn to levels of performance. They contrast GD? per
capita and GD? per worker across countries in OECD purchasing power parity
units. These figures show greater similarity in GD? per worker than in GD? per
capita, due to the fact that countries with low employment/population rates
have correspondingly higher productivity. This presumably reflects increases
in measured productivity as employment falls along production functions. Note
also that, concern about Japanese productivity notwithstanding, GDP per worker

9
is lower in Japan than in Europe and the US. As Americans (and Japanese) work
more hours than Europeans (7). moreover, Europe looks even better in output per
hour: British hourly output, for example exceeded Japanese by 8% while French
and German hourly outputs were virtually the same as American.
From the perspective of labor market analysis it is the relations between
employment/unemployment performance and productivity/real wages in Table 4 that
are most intriguing. In a period in which GDP growth did not differ greatly
among countries (could not differ much because of economic and technological
interdependence?) the differing performance of countries along these two
dimensions raises the possibility that their economies faced similar wage/
employment trade-off schedules, of the sort often modelled by labor demand,
though also explicable in other ways (Solow 1986) and thus that thfferences in
employment reflect in part the position of countries along that schedule.
wage employment trade-off: aggregate evidence
The standard method for analysing the impact of wages on employment across
countries is to estimate time series demand relations for individual countries,
and to use differences in estimated response parameters to account for
differences in performances (e.g. the 1986 Unemployment Economica Supplement).
My approach in this section is different. I take changes in wages and
employment across countries (industries) over the same period rather than time
series changes within a country as units of observation. I use the same
equation for all countries, and thus attribute differing Outcomes among
countries to different changes in explanatory variables rather than to
differing response parameters. To finesse issues of dynamic adjustments,
moreover, I take changes over long periods.
Formally, my analysis can be represented by the following employment
(demand) equation:
dlnEc — a dln%Jc + b dlnXc + uc, (1)

10
where din is the log change operator; E is employment; Wc are wages; X is a
demand-shift variable; u is a residual; the subscript c indexes country.
If one assumes that each country has its own response parameters, a + ac
and b + bc, where a and b are the mean responses and ac and bc are the country-
specific components, then the latter are subsumed into the residual:
dinEc — (a + ac) dlnWc + (b + bo) dlnXc # uc — (2)
a DlnWc + b DlnXc + at DlnWc + bc DlnXc +uc,
where a and b are average response parameters.
In (2) heterogeneity in responses creates heteroskedastic errors but does
not bias estimates of parameters as long as the country components are
independent of the other variables in the equation. Material and related
prices that are determined on world markets and whose changes are likely to be
similar across countries are subsumed in the constant term.
results
Table 5 presents the results of estimating relations between changes in
employment, real wages, and output for the entire economy in 19 OECD countries
and for manufacturing in 12 countries over different time periods. In panels A
and & the dependent variable is total employment, output is real GD?, and wages
are manufacturing earnings (A) or compensation of employees from national
product accounts per employee deflated by the GDP deflator (E); and changes are
measured as in changes over the entire period. In Panel C the dependent
variable is total hours worked in manufacturing, output is value added in
manufacturing, and wages are total compensation for manufacturing production
workers deflated by GDP deflator; because the BLS publishes the data as
compound annual changes, changes are measured in those units.
All three Sets of calculations show that, conditional on the growth of
output, changes in wages and employment were significantly inversely related,
The US and Sweden, for example, with below-average real wage growth had above-

Table 5: Regression Coefficients and Standard Errors For the Impact of Real Wages and OupU.on Employment
.. period
Change in Ln Change in Real 1age In GD?
1960-73 -.57 (.11) .62 (.14) 1973-79 -.45 (.11) .71 (.17) 1979-84 - .54 (.15) .62 (.19)
B) Dependent Variable: Change in Ln
Change in ln Real Change in R2 Labor Costs in GD?
Source: Panels A and B, 19 OECD countries from CLE-OECD data set, as in table 4. Panel C, 12 Countries (US, Canada, Japan, France, Germany, Italy, UK, Belgium, Denmark, Netherlands, Norway, and Sweden) as given by A. Neef (1986), with wages deflated by GNP deflator, using OECD data.
A) Decendent Variable: Chane in Ln Employment in
R2
.65
.59 56
1960-73 -.76 (.05) .90 (.07) .94 1973-79 -.62 (.10) .75 (.13) .74
1979-84 -.53 (.16) .88 (.22) .53
C) Dependent Variable: Compound Annual Change in Total Hours in Mfg in period
Compound Annual Compound Annual R2
Change in Mfg Change in Mfg Compensation Output
1960-73 -.53 (.08) .62 (.08) .86
1973-79 -.89 (.22) .36 (.22) .67
1979-85 -.75 (.24) .80 (.13) .81

11
average growth of employment. Eecause rates of growth of GDF vary less than
rates of growth of real wages, moreover, the wage-employment trade-off tells a
greater part of the story of variation in employment performance across
countries than do differences in rates of GDP growth although the latter are
critical in explaining differences, as well.
8y directly linking changes in employment and wages across countries, the
calculations in Table S provide a potentially firmer basis for attributing
differences in employment growth to differences in wage-settlements than time-
series regressions that rely on differences in estimated response parameters of
questionable robustness. Still, one must take care in interpreting the
results. With output fixed, the estimates neglect the 'scale' effect of wages
on output and employment and thus may understate the employment consequences of
wages. To gage the importance of this I correlated changes in real wages and
GD? across countries, obtaining positive coefficients inconsistent with the
notion that wage-induced output expansion is a major determinant of different
country experiences. A second potential error arises because labor costs are a
major share of value added, possibly producing a spurious negative employment.
wage tradeoff (8). As regressions using industry data with gross output (where
labor's share is small) or value added minus labor costs as the measure of
production yield results similar to those in the table, I also doubt that this
is a major problem. Finally, as Solow (1986) has stressed, there are other
ways to interpret the observed wage-employment trade-off beyond wage-induced movements along demand curves. One such interpretation is in terms of the
joint determination of wages and employment on an aggregate production function
due to changes in GD?. As this implies a negative correlation between changes
in GDP and wages, contrary to fact, I reject it as the primary explanation of
the observed relations. Another possibility is that the trade-off reflects the
impact of exogenous changes in productivity on real wages or on money wages and

12
prices through both labor aod product market behavior. While I believe
observed cross-country differecces in growth of output per worker are roo large
to represeot longrun differences fn technology among rhe countries, the problem
of endogeneity of wages remains, for factors that influence wages (and the
markup of prices over wages) are unlikely to be independent of growth of GD?
and employment and unemployment. In sum, although none of the criticisms
gainseys the empirical 'trade-off', they raise questions about its
interpretation and meaning. To probe these issues I examine wage and
employment changes with more disaggregate data.
induendence
There are three advantages to studying changes in wages and employment
across disaggregated industries, First, it allows us to analyse employment and
wages among fndustries within countriea and thus to probe rhe postulated
similarity of demand behavior that underlies equation I, Second, it offers
ways to deal with the problem of endogeneiry of output and prices by exploiting
developments in foreign countries. Third, it makes the interpretation of the
tradeoff as joint wage and employment determination along a production function
less plausible, given the differing situations of specific industries.
Accordingly, I obtained data on wages, employment, value added, and production
for 10 countries and up to 37 industries from an EEC file (9); and on
employment, wages, value added and gross output in producers prices for up to
35 industries in 17 countries from the UN Yearbook of Industrial Statistics.
The UN ssisple consists primarily of manufacturing industries, while the EEC
data includes some other sectors. As in the country comparisons, I examine
changes over long periods.
alternative models
I use the following three equation model of price, output, and employment
determination to analyse the industry data:
13
Wage-Price Relation:
dinPic — dinPiw; (3A)
dinPic — vicdl,nWic-dlnTic, (33)
where P Is price; v is labor's cost share; T represents neutral technological
progress; i indexes industry; c indexes country; and w indexes the world.
In (3A) the price in industry I in country c depends on world market
prices and is thus exogenous to the labor market.
In (38), by contrast, the price in an Industry responds to wages according
to labor's share in value added.
Which assumption Is more plausible? For some industries and countries,
prices are presumably largely exogeneous to the labor market because of inter-
national competition (or other reasons); for others, the opposite may be true.
In the absence of a detailed pricing model, prudence dictates analysis of both.
Demand for Output: dinQic — -y dinPic + dlnXic, (4)
where y is the elasticity of product demand; and X is a shift in demand for
output in Industry 1 in country c taken as exogenous.
SubstitutIng 33 into 4 yields a relation between wages and output: dlnQic
-yvdlnWic + ydlnlic + dlnXic. In 3A wages have no impact on output.
Demand for Labor: dlnEic — -hdlnWic + dlnXic + cdlnTic, (5)
where the elasticity h embodies substitution and scale effects; X is an
exogeneous shift due to shifts in product demand; T reflects technology.
The major problem with models of this type is the absence of measures of
shifts in demand, which forces researchers to use actual output or instruments
to proxy shifts. This creates problems due to the endogeneity of output
through the production function and the uncertain quality of instruments,
Cross-country data on the same industries allows us to treat the problem by
decomposing the shift component into country-specific, industry-specific, and
residual interaction effects:

14
dinTic — dlnTc + dlnTi + vie; dlnxic — dlnxc + dlnxi + eic (6)
Then, pooling industry snd country data, one can use industry dummy
variables to identify industry shifts (dlnTi and dlnxi) and country dummies to
identify country shifts (dlnTc and dlnXc), eliminating endogenous output:
dlnEic -hdlnWic + D' + C'+ residual, (7)
where D' is a vector of industry dummies, C' is a vector of country dummies and
the ic subscripts relate to industry and country respectively.
With two countries this is equivalent to comparing differences in changes
in employment and differences in changes in wages. If labor demand behavior
dominates the data, the country whose industry has a greater increase in wsges
will have a smaller increase in employment.
Alternatively, the change in industry production in all countries can be
used to proxy shifts in demand in an industry, yielding:
dlnEic — -hdlnWic + edlnQi'+ C', (8)
where Qi' is the sum of production in industry i in the countries under study.
This equation asks "what is the impact of changes in wages on employment given
world expansion of the industry, and employment trends in the country?"
results
Analysis of thE relation between chsnges in employment and wages by
industry in the EEC and UN data sets confirms the existence of a significant
wage-employment tradeoff across and within countries. Specifically:
(1) Regressions of changes in employment on changes in wages and output by
industry within countries, auzsissrized in appendix tables Al and A2, yield
negative coefficients on wages of similar magnitudes among countries in both
the EEC and UN data sets. The similarity justifies pooling the dats into s
single cross-country industry file in ensuing analysis. As wage-setting
institutions are more likely to differ across countries than labor demand

15
behavior moreover, I interpret the results as reflecting similar demand
elasticities rather than some other similarity in behavior.
(2) Whether one assumes that industry prices are exogeneously set on world
markets or depend on industry wages in a country does not affect the inverse
employment/wage relation. This is shown in the EEC regressions in table Al,
where the regressions on the left hand side use wages and value added deflated
by sector prices as explanatory variables (on the assumption that prices are
determined on world markets> while the regressions on the right hand side use
wages and value added in current values as explanatory variables (on the
assumption that prices depend on wages). Both regressions yield compatable
negative coefficients on wages.
(3) Regression estimates of the impact of relative wages on eniployrnent
using pooled country-industry data yield a significant inverse employment/wage
relation when output is replaced by industry and country dummy variables or by
'world' output and country dummy variables. This is documented in Table 6 for
the EEC (lines 1-4> and UN (lines 5-8> data sets, Lines I and S give
baseline' estimates from regression of changes in employment on changes in
wages and output. Lines 2 and 6 give results when country and industry dummy
variables have been added to allow for differences across countries and
industries. Lines 3 and 7 show the results whenindustry output is excluded as
endogenous. Here, the estimated elasticity falls rather than rises, possibly
because industry-country specific technological or demand shifts lead to
expanded production and higher wages as workers share in industry prosperity,
Finally, lines 4 and 8 replace industry dummy variables with changes in output
in the countries in the sample, with little effect on the estimates,
In sum, regardless of whether one uses domestic output, industry and
country dummies or 'world' output to control for shifts in demand, the data
reveal a substantial wage-employment trade-off in industries across countries,

Pooled Cross-Country Estimates of
JmptofRea1 Wages on Employment Among Industries
A. EEC Data Set
dlnW/Pc dlnQ)C dlnw Country Industry Dummies Dummies
1. '—0.46 0.68 e.65 (0.07) (0.04
2. —0.53 0.50 / 0.83 (0.09) (0.05)
—0.30 0.69 (0, ii)
4 —034 0.60 / 0.55 (&l2 (0.07)
. UN Data Set
5. —0.50 0.61 Q.61 (0.05) (0.02)
6. —0.60 O.72 (O.07 (0.03)
38
8. —0.22 .62 o.32 (0.12) ..05)
Note: All industry wages, value added, and gross output are deflated by country GD? deflator.

16
international competitiveness
The pooled industry-country data also allow us to examine the effects of
exchange rates and unit labor cost on employment by regressing changes in
employment on changes in wages, exchange rates (nominal units of currency per
dollar) (10), and world output in an industry (measured in dollar terms) or
industry dusrinies; and on changes in unit labor costs (wages x employment/real
value added), exchange rates, aid world output or industry dummies, As
exchange rates are country-specific I replaced country dummy variables with
changes in country GDP to measure domestic market developments. I limit
analysis to the EEC data because the UN data has no sectoral prices.
The estimated positive coefficients on exchange rates in lines 1 and 2 of
Table 7 indicate that, as one would expect, industries in countries where the
currency depreciated relative to the dollar increased employment. The similar
magnitudes of the wage and exchange rate coefficients suggest, furthur, that
wages have to change by roughly the same rate as exchange rates to offset
currency fluctuations on employment. As labor is only part of costs, this may
understate the required wage adjustment unless other costs move with wages.
Lines 3-4 yield very different results for unit labor costs, as declines
in unit labor costs either reduce (line 3) or have no effect (line 4) on
employment. The implication is that measure declines in unit labor costs,
widely viewed as an indicator of increased competitiveness and thus something
'good', are more likely to reflect extensive shedding of labor than
technological advance or wage declines that raise employment. Indicative of
this, Ireland and e1gium, whose employment fell sharply, are among the
countries with the greatest 'improvement' in unit labor costs,
To sum up, the evidence in this section reveals that the major differences
in labor market performance among countries in the l970s and l980s - - in
employ9nent and growth of real wages - - were inversely related in a labor demand

Table7; Estimates of the Impact of Exchange Rates and Wages on Employment Crowth Across Countries (EEC Data)
dInW d1nULC dinER d1nGNP d1nWVA Industry Dummies
1. —0,23 C.19 .l2 .62 0.33 (.08) (.06) (.10) (.09)
2. —0.17 0.18 .05
(.06) (.05) (.07) 0,65
0.02 0.09 0.73 0.59 (.05) (.04) (.19) (09)
4. o.12 0.07 0.63 / 0.67 (.05) (.03) (.14) V
Note : W = earnings; ULC — unit labor costs, defined as (wages x employment)/Value added in constant prices. ER = exchange rate in units of currency per dollar; CNP = Cross National Product in country; WVA = 'world value added' defined as sum of value added in industry in all countries in the data set.
17
type trade-off. Countries like the U.S. or Sweden where real wages increased
slowly had more rapid growth of employment and higher employment-population
rates than countries with rapid growth of real wages. While it is possible to
interpret this finding in ways other than that suggested here, the trade-off
represents the basic fact that any explanation of the divergence in outcomes
must address.
III. Institutional Differences and Outcomes
The question that arises next is whether the differences in outcomes
across countries examined in section II are related to the labor market
institutions examined in section I? Do countries with one set of institutions
perform differently than countries with other institutions?
Extant empirical analyses offer, as noted, conflicting answers. Some
studies interpret the post oil-shock economic record as showing the success of
'corporatist' economies (Crouch,1985; Bruno and Sachs 1986; Tarantelli 1986;
Bean, Layard, and Nickell,1986; Newell and Symons 1986). Others see better
economic performances among countries with decentralized flexibility or with
particular kinds of flexible labor market arrangements (Klau and Mittelstadt
1986; Freeman and Weitzman,l986; Bruno and Sachs,1986 with respect to nominal
wage responsiveness). The failure of several follow-up analyses to confirm
initial claims about the effect of institutions, seemingly because of modest
differences in performance measures and periods covered (Van Poeck,l987;
Summers and Wadwhani,1987; my calculations (11)), suggest the danger of
generalizing from results based on a particular model and data set,
Accordingly, in this section I eschew estimating structural models of behavior
under constraints in favor of 'reduced form' regressions designed simply to
identify the links between indicators of labor market institutions and
employment and wage outcomes. My analysis suggests that one reason for
conflicting interpretations of the 1970s-1980s experience is that there is an

18
element of truth to hoth sides of the corporatist/flexible msrket debate: OECD
countries with the most highly sttuctured labor markets and those with the most
decentralized Isbor markets turned in better employment performances thsn
others. My analysis also reveals, however, a wide range of experience among
countries with 'similar' institutiona thst suggests that even statistically
significant and robust findings be interpreted with caution.
empirical finding
Table 8 presents the results of regression estimates of the relation
between labor market arrangements and employment and real wage outcomes in the
l9SOs. Lines 1-3 are based on the OECD country data whilie lines 4 and 5 are
based on the BLS data used in Table 5. In each calculation I relate outcome
variables to: industry wage dispersion figures from Table 2 and the aquare of
those figures, the 1979 percentage unioniaed from Table 1, a 0-I corporatist
dummy variable and the In change in output in the country. The key
coefficients are those on dispersion, as they are designed to reflect the
impact of both highly centralized (low dispersion) and decentralized (high
dispersion) labor market arrangements on outcomes. If the two labor market
structures produce similar outcomes, the equation will have a parabolic form,
with linear and squared terms obtaining opposite signs in the regressions.
The regressions for employment/population in line 1 show that in fact this
is the case for overall labor utilisation: the level of dispersion has a
negative impact on employment while its square has a positive impact,
indicating that increases in dispersion are first associated with falling then
with rising employment/population rates, and thus that both countries with
centralized and those with decentralized labor markets generated more
employment than others. The unemployment regression in line 2 shows the same
pattern with oppositely signed coefficients, as one would expect, though the
parabolic form has less statistical significance. That the cross-section

19
pattern is not simply the result of long-standing country differences in labor
utilization is indicated by the coefficients on the dispersion terms in the
change in employment/population regression in line 3. At least part of the
198(e cross-Section differences result from differential country responses to
the l980s economic environment.
As for the other labor market indicators, the percentage union has modest
generally insignificant effects on the three outcomes while the corporatist
dummy obtains generally significant coefficients, indication that those
economies did better in employment and unemployment, even with the levels of
di ersion and unionism held fixed. Itt all cases, finally, changes in output
raised employment or reduced unemployment
To provide a better picture of the parabolic pattern in the data and to
show the variation among countries around fitted values, I graph in Figure 1
the predicted and actual 1984 employment/population rates against the level of
dispersion. The figure shows the cross-country differences that underlie the
regression results and the substantial variation around the regression fit that
leads me to be circumspect in drawing conclusions. In regressions with country
observations residuals like those shown in the graph cannot be ignored on the
principle that 'social science always has residuals': an aberrant country is a
genuine counter-example (unlike an outlier in individual data files); and there
are several in the scatter,
Turning to the 8LS data, the regression in line 4 shows that changes in
total hours in manufacturing is related parabolically to dispersion while
having no connection to the other indicators of labor market structure. Line
5 shows the opposite relation between dispersion and changes in real
compensation in manufacturing, with the level of dispersion entering with a
positive coefficient and its square entering with a negative coefficient. This
pattern implies that increased dispersion is associated first with rising, then
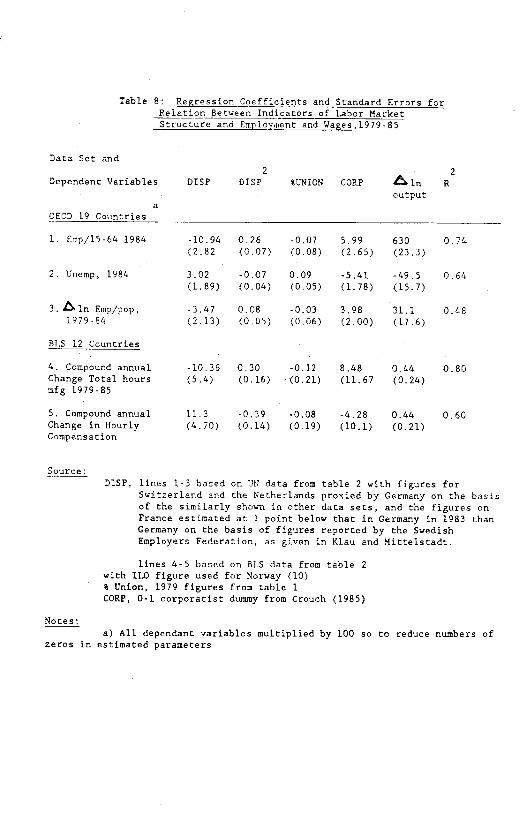
Table 8: Regression Coefficients and Standard Errors for Relation Between Indicators of Labor Market Structure and Employuent and Wages 1979-85
Data Set and 2 2
Dependent Variables DISP DISP %UNION CORP ln R output
a OECD 19 Countries _______________________________________________________________
1. Emp/15-614 1984 -10.94 0.26 -0.07 5.99 630 0.74 (2.82 (0.07) (008) (2.65) (23.3)
2. Unernp, 1984 3.02 -0.07 0.09 -5.41 -49.5 0.64 (1.89) (0.04) (0.05) (1.78) (15.7)
3. 1n Rap/pop, -3.47 0.08 -0.03 3.98 31.1 0.48 1979-84 (2.13) (0.05) (0.06) (2.00) (17.6)
BLS 12 Countries
4. Compound annual -10.36 0.30 -0.12 8.48 0.44 0.80 Change Total hours (5.4) (0.16) (0.21) (11.67 <0.24) mfg 1979-85
5. Compound annual 11.3 -0.39 -0.08 -4.28 0.44 0.60 Change in Hourly <4.70) (0.14) <0.19) (10.1) (0.21) Compensation
Source:
DISP, lines 1-3 based on UN data from table 2 with figures for Switzerland and the Netherlands proxied by Germany on the basis of the similarly shown in other data sets, and the figures on France estimated at 1 point below that in Germany in 1983 than Germany on the basis of figures reported by the Swedish Employers Federation, as given in Klau and Mittelstadt.
lines 4-5 based on BLS data from table 2 with ILO figure used for Norway (10) % Union, 1979 figures from table 1
CORP, 0-1 corporatist dummy from Crouch <1985)
Notes:
a) All dependant variables multiplied by 100 so to reduce numbers of zeros in estimated parameters

Ernployncnt/PopulatiOn 16—64
80 Swedon
79
78
77
76
75
74
73
72
71
70
69
68
67
66
65
64
63
62
61
60
59
58
57
56
55
54
53
52
51
50
Where:
FlL8 1:
The Relation Between the Dispersion
of Eirings Across Industries and
EmpLoyment/PopulatiOn.
No ray
Fini Switzerland
Japan
X United States
United Kingdom
Austria
New Zealand
*Belgium
Italy Netherlands
Ireland
13 14 15 16 17 13 19 20 21 22 23 24 25 26 27 28
Dispersion in Wages (xIOO)
x represents actual Employment/PoPulation 16—64 IZ/P)
represents predicted El? (from flegression Equation)

20
with falling real wage, as one would expect if the lahoc market institutions
affect employment along the employment-real wage trade-off schedule. As I
could find no such pattern in the hourly pay figures in the OECD data, I am
unwilling to make much of this result. Even the ELS data show, moreover,
greater divergence in changes in real wages than in employment across countries
with 'similar' labor market inatitutions, suggesting that the existence of
country differences in the teal wage-employment trade-off that are subsumed in
error terms in our regreasions.
IV Summary
This paper has four messages regarding labor market institutions,
constraints, and outcomes in DECO countries in the l970s and lYEOs:
1) Labor market institutions diverged markedly in the period under study:
union density increased in many countries but declined sharply in the US and
moderately in some others; industrial wage dispersion rose in several less
unionised countries, including the US, fell in Italy, while holding steady in
several highly unionised countries.
2) The level and change in employment-to-population rates and change in
real wages differed among countries and among industries within countries along
a trade-off schedule that suggests that movements along demand curves were an
important factor in the divergence in outcomes in the period.
3) Labor market institutions were related to outcomes in a nonlinear way,
with countries having centralized institutions/low wage dispersion and
countries having decentralized institutions/high wage dispersion doing better
in limiting unemployment and maintaining employment than countries with
intermediate labor market institutions.
4) There is sufficient diversity among countries with 'comparable'
inatitutiona to indicate that desireable, or undesireable, outcomes are not the
exclusive property of any single labor market arrangement, possibly because all

21
have the potential for adopting the 'right' or 'wrong' policies to attain
feasible outcomes.
Finally, it is important to recognize that the cross-country analysis in
this and other studies leaves open the issue of exportability' of institutions
- - the extent to which labor market arrangments developed in one country can be
transferred to others. Centralized corporatist labor markets are found
primarily in small countries. Decentralized markets characterize larger
economies, Perhaps whatever its virtue, 'corporatist' wage-setting could not
flourish in economies like the US or the UK as it does in Sweden and Denmark;
and conversely for ducentralized systems in smaller economic settings. If this
is the case, the issue to be addressed in the future ought not to be which
broad set of labor market arrangements 'work better' but rather which specific
policies and programs work and can be transfered to other countries.

22
Endnotes
I) There are several sources of data on unionisation: union reports of
membership, enterpise reports on collective bargaining; household surveys; and
union financial records. Among the problems with these different data are: the
tendency for unions to exaggerate membership in some periods (recognized as a
problem with U.K. statistics in the 1980s); lack of knowledge of collective
bargaining status (by household recipients reporting on other recipients);
unwillingness to make data public (in countries where dual unions compete) . In
the U.S. the Department of Labor terminated its survey of unions and now
reports figures from household data.
2) Tn the caee of France, figures on the proportion of workers covered by
industry-level agreements suggest much higher union influence, while those on
the proportion covered by plant-level agreements are consistent with the low
density shown in the table. aee Ministere du Travail 1986.
3) For example, the Workplace Industrial Relations Survey reports that the
proportion of private manufacturing establishments with no recognized union
rose from 35% to 44% between 1980 and 1984 (Millward and Stevens, 1986 p. 62)
while the New Earnings Survey shows a fall in the percentage of male workers
covered by collective bargaining from 74% in 1973 to 64% in 1984.
4) Several points of caution here. First, it is possible for wage structures
to change while wage dispersion remains fixed-- if for instance, high and low
wage industries simply change position. As wage structures show persistence of
rank order, however, this is not a serious problem. Second, wage dispersion
could be high but all wages change in concert. This would show up in different
orderings of countries by dispersion and dispersion of changes.
5) Calculations in which I sued the same number of industries for all countries
did not alter any of the findings in the table.

23
6) The calculations are based on relating the dispersion figures from the UN
data to the union densities from table 1. I made one slight modification in
the Chalafors and Driffill's ranking, giving Ireland the same ranking as the
UK, while they left out Ireland.
7) Annual hours worked: 2043 in Japan; 1888 in US.; 1723 in the U.K.; 1678 in
Germany and 1630 in France, according to the OEGD, 1986
8) If labor costs were all of value added, then ln employment would be
perfectly negatively related to in wages, holding ln value added fixed, with a
coefficient of one.
9) This data set was provided to me by Ms. Dewatripont of the University of
Bruxelles, whose work with V. Ginsberg and Dewatripont reveals a significant
wage-employment tradeoff in time series analyses of these data for several
European countries, (Ginsberg and Dewatripont, 1987)
10) It is appropriate in cross-country analysis to measure exchange rates and
wages in nominal units as we are comparing changes in rates in one country
relative to those in other countries.
11) 1 find no relation between indices of corporatism or nominal wage
responsiveness and the outcome measures Crouch and Bruno and Sachs use in their
analyses in the 1979-84 period.
24
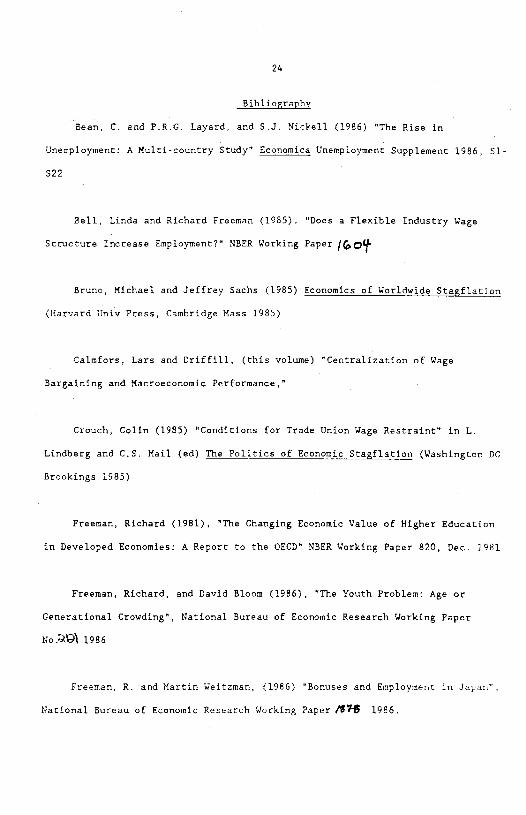
Bibliography
Bean, C. and P.R.C. Layard, and S.J. Nickell (1986) "The Rise in
Unemployment: A Multi-country Study" Economica Unemployment Supplement 1986, Si-
S22
Bell, Linda and Richard Freeman (1985). "Does a Flexible Industry Wage
Structure Increase Employment?" NBER Working Paper
Bruno, Michael and Jeffrey Sachs (1985) Economics of Worldwide Stagflation
(Harvard Univ Press, Cambridge Mass 1985)
Caimfors, Lars and Driffill, (this volume) 'Centralization of Wage
Bargaining and Macroeconomic Performance,"
Crouch, Cohn (1985) "Conditions for Trade Union Wage Restraint" in L.
Lindberg and CS. Mail (ed) The Politics of Economic Stagflation (Washington DC
Brookings 1985)
Freeman, Richard (1981), "The Changing Economic Value of Higher Education
in Developed Economies: A Report to the OECD" NBER Working Paper 820, Dec. 1981
Freeman, Richard, and David Bloom (1986), "The Youth Problem: Age or
Generational Crowding", National Bureau of Economic Research Working Paper
No.\ 1986
Freeman, R. and Martin Weitzman, (1986) "Bonuses and Employment in Japan"
National Bureau of Economic Research Working Paper /7$ 1986.

25
Ginsberg, Victor and Dewatripont, C. (1987) research in progress,
University Libre de Bruxelles, Spring 1987
Gregory, Robert and Vivian Ho (1985) 'Equal Pay and Comparable Worth: What
can the U.S. learn from the Australian Experience" Discussion paper 123 Center
for Economic Policy Research Australian National University July 1985
Hill. Peter (1986) "International Price Levels and Purchasing Power
Parities," OECD Economic Studies no. 6, (Paris Spring 1986)
Klau, F. and Axel Mittelstadt (1986), "Labour Market Flexibility" OECD
Economic Studies 1986
Leroy, R (1987) "Le Salaire Des Jeunes Est-Il Flexible?" Bulletin do
L'Ires, University Catholique de Louvain, no 116, Mai 1987.
Millward, Neil and Mark Stevens (1986), British Workplace Industrial
Relations 1980-84, Cower Publishing Company 1986
Ministere du Travail, De L'Emploi et de Ia Formation Professionelle,
Tableaux Statistics Paris 1986.
A. Neef (1986) "International Trends in Productivity, Labor Costs in
Manufacturing", Monthly Labor Review, December 1986, Vol. 109, num. 12
A. Newell and J.SV. Symons (1986), "Corporatism, Laissez-Faire and the
Rise in Unemployment" Centre for Labour Economics, London School of Economics,
Discussion paper 260, November 1986

26
Organisation of Economic Cooperation and Development,
-----(1984) Employment Outlook, Paris Sept. 1984
(1985) Employment Outlook, Paris Sept. 1985
(1986a) Labour Market Flexibility Paris (May 1986)
(1986b) Employment Outlook,Paris Sept. 1986.
(1986c) Historical Statistics, Paris 1986
(1987) Employment Outlook, Sept. 1987. Paris
Roche, W.K. and Joe Larragy (1987), 'The Trend in Unionisation in the
Republic of Irelan& in T Murphy et al Recent Trends in Irish Industrial
Relations: A Reader (University College Dublin 1987)
Solow, R. (1986), "Unemployment:Getting the Questions Right" Economica
Unemployment Supplement 1986, S23-S34
Summers, Land S. Wadhwani (1987), "Labor Cost Flexibility and Output
Variability: Some International Evidence" mimeo 1987
Tarantelli, Ezio (1986), "Monetary Policy and the Regulation of Inflation
and Unemployment" in Morley Cunderson, Noah Meltz, and Sylvia Ostry, ed
Unemployment international perspectives (University of Toronto, 1986)

27
Van Poeck, (1986), 1abo..r Market Characteristics, Stabilization Policy,
and Real Wage Flisxibiltty' Stadtecer.tr'a loot Econoaisch en Social Onderzoek,
Report 8' .39 rc.. 1936 Ar.twerpnt
Wmrd, M 185' 9'arcnasing Powur Parities and Peal Expenditures in the
CEO" tPA''e ')PrD,

Appendix Table Al: Estitnstes of the Wge-Empiojment Relations by Country Across Indistries
EECDa.ta1970-83
;nt rv
ry d1;/P v din k/P dm74 R2 Sid iced
United Sates -0.82 089 0.91 -0.78 0.86 0.90
(0.07) (0.07) (0. 16) (0.06)
:span -0.79 0,79 0.66 -0.72 0./8 9.66
(0.12) (0.13) (0.27) (0.12)
Germany —0.69 0.66 0.83 —0.68 0.67 0.82
(0.11) (0.08) (0.33) (0.07)
France —0.47 0.86 0.61 —0.61 0.57 0.50
(0.12) (0.16) (0,29) (0.14)
Italy —0.56 0.63 0.51 —0.49 0.64 0.51 (0.12) (0.16) (0.17) (0.15)
United Kingdom —0.63 0.61 0.66 —0.74 0.55 0.61)
(0.18) (0.11) (0.38) (0.11)
Netherlands —0.34 0.86 0.76 —0.66 0.63 0.69
(0.17) (0.18) (0.32) (0.11)
Belgium —0.57 0.65 0.61 —0.36 0.64 0.61
(0.15) (0.13) (0.39) (0.12)
Denmark —0.90 0.79 0.73 —1.25 0.75 0.78
(0.13) (0.11) (0.20) (0.10)
Note: W is earnings; VA is valued added, as given in the EEC data set.
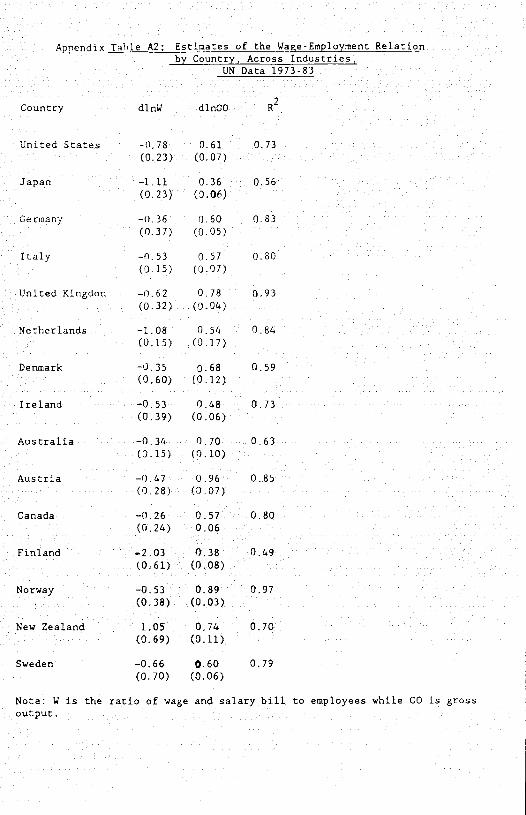
Appendix Thhle A2: Estimates of the Wage-Employment Relation
by Country Across Industries UN Data 1973-83
Country dlnW dinGo R2
United States —0.78 0.61 0.73 (0.23) (007)
Japan —111 036 056 (0.23) (0.06)
Germany —0.36 0.60 0.83 (0.37) (0.05)
Italy —(1.53 0.57 0.80 (0.15) (0.07)
United Kingdon —0.62 0.78 0.93
(0.32) (0.04)
Netherlands —1.08 0.54 0.84
(0.15) (0,17)
Denmark —0.35 0.68 0.59
(0.60) (0.12)
Ireland —0,53 0,48 0.73 (0.39) (0.06)
Australia —0.34 0.70 0.63 (0.15) (0.10)
Austria —0.47 0.96 0.85 (0.28) (0,07)
Canada —0.26 0.57 0.80 (0.24) 0.06
Finland —2.03 0.38 0,49 (0.61) (0.08)
Norway —0.53 0.89 0.97
(0.38) (0.03)
New Zealand 1.05 0.74 0.70
(0.69) (0.11)
Sweden —0.66 0.60 0,79
(0.70) (0.06)
Note: W is the ratio of wage and salary bill to employees while CO is gross output -


![NATIONAL DEFENSE UNIVERSITY The National War ... GOPY NATIONAL DEFENSE UNIVERSITY The National War College STRATE6 STUDIES PROJEC] The provisions of the Freedom .=:- Information Act](https://img.dokumen.tips/doc/110x75/5b06341d7f8b9abf568caf15/national-defense-university-the-national-war-gopy-national-defense-university.jpg)