Embed Size (px)
Citation preview

NBER WORKING PAPER SERIES
THE EFFECT OF COURT-ORDERED HIRING QUOTASON THE COMPOSITION AND QUALITY OF POLICE
Justin McCrary
Working Paper 12368http://www.nber.org/papers/w12368
NATIONAL BUREAU OF ECONOMIC RESEARCH1050 Massachusetts Avenue
Cambridge, MA 02138July 2006
For detailed comments on earlier drafts, I thank David Card, Ken Chay, John DiNardo, Guido Imbens,Jonathan Leonard, Heather Royer, and Emmanuel Saez. For comments that improved the paper, I thank JoeAltonji, Liz Cascio, David Lee, Nicole Maestas, Jesse Rothstein, Eric Verhoogen, Till von Wachter andseminar participants at UC Berkeley and NBER Labor Studies. I also thank Patrick Ronald Edwards, ClariceBryce, Kevin Hudson, and Betty Turner of the Research and Technical Information Branch of the EEOC fortheir role in recovering much of the historical data used in this project. Adam Kingsley of the City of ChicagoDepartment of Law provided data on the Chicago Police Department; Joanne Vanatta of the FBI CriminalJustice Information Services Division, data on the pre-1975 UCR; and Neldra Zeigler of the NYPD, data onentrance exam scores. For research assistance, I thank Stephanie Watt, Jeff Butler, Andrea Cann, AmyHawkins, Katie Ikard, Alma Vega, and Shayesteh Zarrabi. Any errors are my own. The views expressedherein are those of the author(s) and do not necessarily reflect the views of the National Bureau of EconomicResearch.
©2006 by Justin McCrary. All rights reserved. Short sections of text, not to exceed two paragraphs, may bequoted without explicit permission provided that full credit, including © notice, is given to the source.

The Effect of Court-Ordered Hiring Quotas on the Composition and Quality of PoliceJustin McCraryNBER Working Paper No. 12368July 2006JEL No. H4, H7, J1, J4, J7, K3, K4
ABSTRACT
Arguably the most aggressive affirmative action program ever implemented in the United States wasa series of court-ordered racial hiring quotas imposed on municipal police departments. My bestestimate of the effect of court-ordered affirmative action on workforce composition is a 14percentage point gain in the fraction African American among newly hired officers. Evidence onpolice performance is mixed. Despite substantial black-white test score differences on policedepartment entrance examinations, city crime rates appear unaffected by litigation. However,litigation lowers slightly both arrests per crime and the fraction black among serious arrestees.
Justin McCraryUniversity of MichiganFord School of Public Policy & Dept of Economics440 Lorch Hall611 Tappan StreetAnn Arbor, MI 48109-1220and [email protected]

I. Introduction
Arguably the most aggressive affirmative action program ever implemented in the United States
was a series of court-ordered racial hiring quotas imposed on municipal police departments. These
quotas arose out of a wave of class action employment discrimination lawsuits filed in the federal
district courts beginning in 1969. Court-ordered affirmative action in this sector has been both
aggressive and persistent: Boston and Cambridge remain to this day subject to hiring quotas
first imposed in 1973, and Philadelphia and Montgomery labored under similar affirmative action
remedies into the 1990s.1 By the standards of current affirmative action proposals, these measures
are remarkably interventionist. In this paper, I address two key issues. First, did these affirmative
action policies succeed in raising the fraction of police officers who were African American, or did
they merely ratify pre-existing trends? Second, what effect did court-ordered changes in hiring
policies have on stated police department objectives, in particular crime reduction?
Evaluating the magnitude of these impacts is challenging. First, suitable data—in particular,
historical information on black employment share and information on the pattern of litigation—are
not publicly available. I use a new panel data set on 314 large American cities from 1960 to the
present. To measure employment of African American police, I combine confidential information
from the Equal Employment Opportunity Commission (EEOC) with published data from historical
sources. To measure the onset of litigation against departments in this sample, I use published court
decisions. Information on black employment share and litigation is combined with information on
city demographics from the Census Bureau and on police staffing, arrests, and crimes from the
Federal Bureau of Investigation.
The second evaluation challenge regards selection—litigated departments are not necessarily
directly comparable with unlitigated departments. Both private litigants and the Department of
Justice (DOJ) targeted those employers with the largest number of potential black jobs at stake—big
departments with disparities between departmental black employment share and the city fraction
African American. To circumvent this selection problem, I take advantage of the staggered timing
of litigation against police departments and focus on event study estimates of litigation’s impact, as1Castro v. Beecher, 365 F. Supp. 655, 660-662 (D. Mass. 1973), and personal communication with Toni Wolfman;
Freeman v. City of Philadelphia, 751 F. Supp. 509 (E.D. Penn. 1990); and U.S. v. City of Montgomery, 957 F.Supp. 1241 (M.D. Ala. 1997).
1

in Jacobson, LaLonde and Sullivan (1993). Administrative delays in the processing of complaints
by the EEOC, as well as capacity constraints facing the Employment Section of the Civil Rights
Division of the DOJ in the early years of enforcement, led to substantial and plausibly exogenous
variation in the timing of litigation against police departments.2
A third evaluation challenge is that unlitigated departments may have responded to the general
phenomenon of litigation by increasing black employment share, confounding the direct effect of
litigation with the effect of the threat of litigation. I address this question empirically by comparing
the evolution of workplace demographics in unlitigated departments before and after the litigation
of other departments in the same federal district.
The empirical analysis points to several important conclusions. First, despite substantial ini-
tial differences, by 1999 litigated and unlitigated cities employed black workers at similar rates,
conditional on city demographics. Second, initial differences per se are not important enough to
account for the gains accruing to litigated cities. Third, event study analyses indicate that the
convergence in employment patterns between litigated and unlitigated departments occurred en-
tirely in the years following litigation. My best estimate of the 25-year gain in black employment
share is on the order of 10 percentage points. Using first-order Markov approximations outlined in
Section III, I estimate that this corresponds to a 14 percentage point increase in the hiring fraction
African American following litigation. Fourth, there is little evidence of litigation threat effects.
Unlitigated departments in federal districts with litigated departments are no more likely to hire
African Americans after litigation than they were before. Fifth and finally, there is mixed evidence
of differences in police performance between litigated and unlitigated departments, but the bulk of
the evidence suggests little to no effect. City crime rates, arrest rates, and the racial composition
of arrestees all appear to be at best modestly related to litigation. Court-ordered affirmative action
in municipal police departments may thus be an example of an affirmative action program with a
substantial impact on workforce composition but a generally minor impact on productivity.
These findings relate primarily to two literatures. The first of these is concerned with the2For example, in 1977 the National Association of Government Employees (NAGE) filed charges with the EEOC
alleging discrimination by San Antonio against Mexican-Americans. The EEOC referred the case to the DOJ in1980. DOJ acknowledged in 1989 that it had lost the paperwork for the case, and the trial did not proceed until1989 (NAGE v. City Public Service Board of San Antonio, 40 F. 3d 698, 702). For introductory material on thevariety of delays encountered by plaintiffs seeking to file an employment discrimination case, see for example Schleiand Grossman (1976), Rose (1989), and Landy (2005).
2

impact of federal government labor market interventions on black economic progress (Freeman
1973, Ashenfelter and Heckman 1976, Brown 1984, Leonard 1990, Donohue and Heckman 1991). An
important topic for this literature has been assessing the impact of the federal contractor program,
which obliges firms which do business with the federal government to engage in affirmative action
(e.g., Leonard 1984b). The literature’s consensus is that the federal contractor program has had
somewhat modest effects on black economic outcomes (Smith and Welch 1989, Leonard 1990). A few
articles have sought to estimate the impact of court-ordered affirmative action on black economic
outcomes (e.g., Beller 1978), but as noted by Donohue and Heckman (1991), no consensus has
emerged on the evidence, and interpretation is difficult due to endogeneity problems. Wallace
(1976) gives a detailed analysis of the impact of court-ordered affirmative action for AT&T. Using
industry-level data on class action employment discrimination litigation, black employment, and
productivity, Leonard (1984a) estimates small productivity impacts of court-ordered affirmative
action.
The second literature to which this paper contributes is the economics of crime, particularly
the subliterature focused on police performance. The role of race in policing is a long-standing
subject of general interest in the American urban context (Kephart 1957, National Advisory Com-
mission on Civil Disorders 1968, Dulaney 1996). Recently, the topic has attracted the attention
of economists (e.g., Knowles, Persico and Todd 2001, Antonovics and Knight 2004). Lott (2000)
presents an analysis related to that here, focusing on the impact of affirmative action on city crime
rates. Donohue and Levitt (2001) take a broader view and estimate the general impact of police
department racial composition on the racial composition of arrestees using panel data.
The remainder of the paper is organized as follows. Section II describes the aspect of police
hiring procedures which were the subject of litigation and discusses the legal rationale for judicial
intervention into hiring practices. In Section III, a unique administrative data set is used to
examine the racial composition of new hires for Chicago before and after litigation, and Markov
approximations are used to convert estimated impacts on black employment share into impacts
on black hiring share. Sections IV and V present evidence on the impact of litigation on black
employment share and police performance, respectively, while Section VI concludes. Appendix I
describes the data used, and Appendix II provides details on the Markov approximations used.
3
II. Background
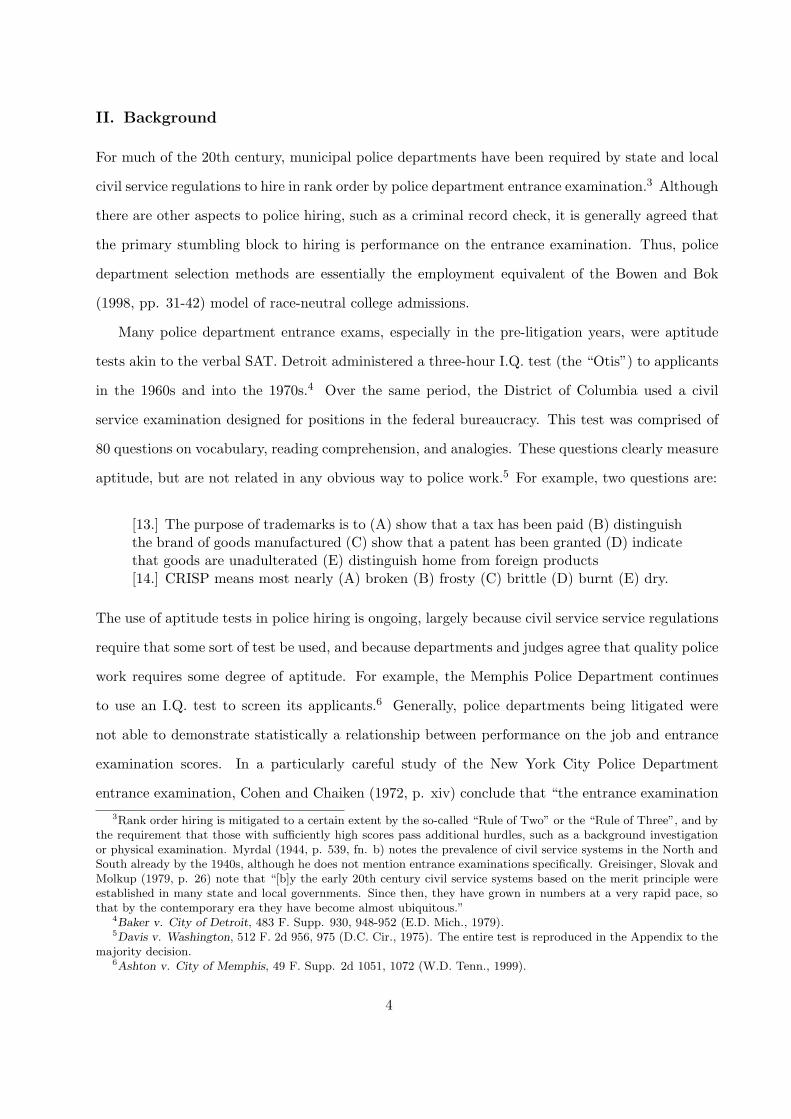
For much of the 20th century, municipal police departments have been required by state and local
civil service regulations to hire in rank order by police department entrance examination.3 Although
there are other aspects to police hiring, such as a criminal record check, it is generally agreed that
the primary stumbling block to hiring is performance on the entrance examination. Thus, police
department selection methods are essentially the employment equivalent of the Bowen and Bok
(1998, pp. 31-42) model of race-neutral college admissions.
Many police department entrance exams, especially in the pre-litigation years, were aptitude
tests akin to the verbal SAT. Detroit administered a three-hour I.Q. test (the “Otis”) to applicants
in the 1960s and into the 1970s.4 Over the same period, the District of Columbia used a civil
service examination designed for positions in the federal bureaucracy. This test was comprised of
80 questions on vocabulary, reading comprehension, and analogies. These questions clearly measure
aptitude, but are not related in any obvious way to police work.5 For example, two questions are:
[13.] The purpose of trademarks is to (A) show that a tax has been paid (B) distinguishthe brand of goods manufactured (C) show that a patent has been granted (D) indicatethat goods are unadulterated (E) distinguish home from foreign products[14.] CRISP means most nearly (A) broken (B) frosty (C) brittle (D) burnt (E) dry.
The use of aptitude tests in police hiring is ongoing, largely because civil service service regulations
require that some sort of test be used, and because departments and judges agree that quality police
work requires some degree of aptitude. For example, the Memphis Police Department continues
to use an I.Q. test to screen its applicants.6 Generally, police departments being litigated were
not able to demonstrate statistically a relationship between performance on the job and entrance
examination scores. In a particularly careful study of the New York City Police Department
entrance examination, Cohen and Chaiken (1972, p. xiv) conclude that “the entrance examination3Rank order hiring is mitigated to a certain extent by the so-called “Rule of Two” or the “Rule of Three”, and by
the requirement that those with sufficiently high scores pass additional hurdles, such as a background investigationor physical examination. Myrdal (1944, p. 539, fn. b) notes the prevalence of civil service systems in the North andSouth already by the 1940s, although he does not mention entrance examinations specifically. Greisinger, Slovak andMolkup (1979, p. 26) note that “[b]y the early 20th century civil service systems based on the merit principle wereestablished in many state and local governments. Since then, they have grown in numbers at a very rapid pace, sothat by the contemporary era they have become almost ubiquitous.”
4Baker v. City of Detroit, 483 F. Supp. 930, 948-952 (E.D. Mich., 1979).5Davis v. Washington, 512 F. 2d 956, 975 (D.C. Cir., 1975). The entire test is reproduced in the Appendix to the
majority decision.6Ashton v. City of Memphis, 49 F. Supp. 2d 1051, 1072 (W.D. Tenn., 1999).
4

for patrolmen does not appear to predict any aspect of job performance measured in this study,
other than the ability to pass later civil service examinations for promotion.”
African American applicants, both historically as well as today, do not perform as well as white
applicants on police department entrance examinations.7 For example, in the Detroit exams of
1967-1971, the African American pass rate was 44.3 percent, and the white pass rate was 80.7
percent.The Memphis tests administered 1981-1989 had a similar impact on black applicants. The
pass rate for whites was a high 96.7 percent, but that for African Americans was 69.2 percent.
This disparity in black-white performance continued into “second-generation” police department
entrance examinations that made clear attempts to improve the bearing of the questions on police
work. For example, approximately 20-25 percent of the questions on the 1970 New York City
Police Department (NYCPD) entrance examination asked applicants to supply the appropriate
behavioral response to a hypothetical situation supposed to typify the day-to-day experiences of a
police officer.8 Yet this exam excluded African Americans at almost the same rate as the Memphis
exam: 81.9 percent of whites passed the 1970 exam, while 54.5 percent of African Americans did.9
Despite the best attempts of police departments to design tests that would satisfy the new legal
regime in which they found themselves, the 1970s federal judiciary frequently found that use of
these exams in police hiring was discriminatory, sometimes even after departments had spent many
years attempting to devise a valid test. In reaching these findings, the courts relied on the notion
of disparate impact, a legal theory developed by jurists in the mid- and late-1960s (Schlei and
Grossman 1976). The central tenet of disparate impact theory is that an employment practice with
no apparent racial motivation may nonetheless be interpreted as tentative evidence of discrimination
if the employment practice disproportionately harms a group protected under civil rights law, such
as African Americans or women. If a protected class group member may demonstrate that an
employment practice leads to a disparate impact for his or her group, then the employer is obliged
to demonstrate that the selection mechanism is predictive of job performance. The Supreme Court7Compare with the general evidence on the black-white test score gap in Jencks and Phillips (1998). To my
knowledge, Kephart (1957, p. 35) is the first to relate black under-representation on police forces to low average testscores. Speaking of Philadelphia, he notes “under-representation seems to stem not from discriminatory personnelpractices, but from the failure of large numbers of Negroes to qualify on the civil service examinations.”
8Guardian’s Association of the New York City Police Department v. Civil Service Commission of the City of NewYork, 431 F. Supp. 526, 543 (S.D. New York, 1977).
9The Rand Corporation, in summarizing its study of the 1968 and 1970 NYCPD entrance examinations, concludedthat it was “confident that the patterns observed for [the 1970 exam] are not unique to that exam but are most likelytypical of the patterns for all recent civil service patrolmen?s exams.” Quoted in 431 F. Supp. 526, 540.
5
sanctioned this theory in 1971 in Griggs v. Duke Power Company: “The touchstone is business
necessity. If an employment practice which operates to exclude Negroes cannot be shown to be
related to job performance, the practice is prohibited.”10
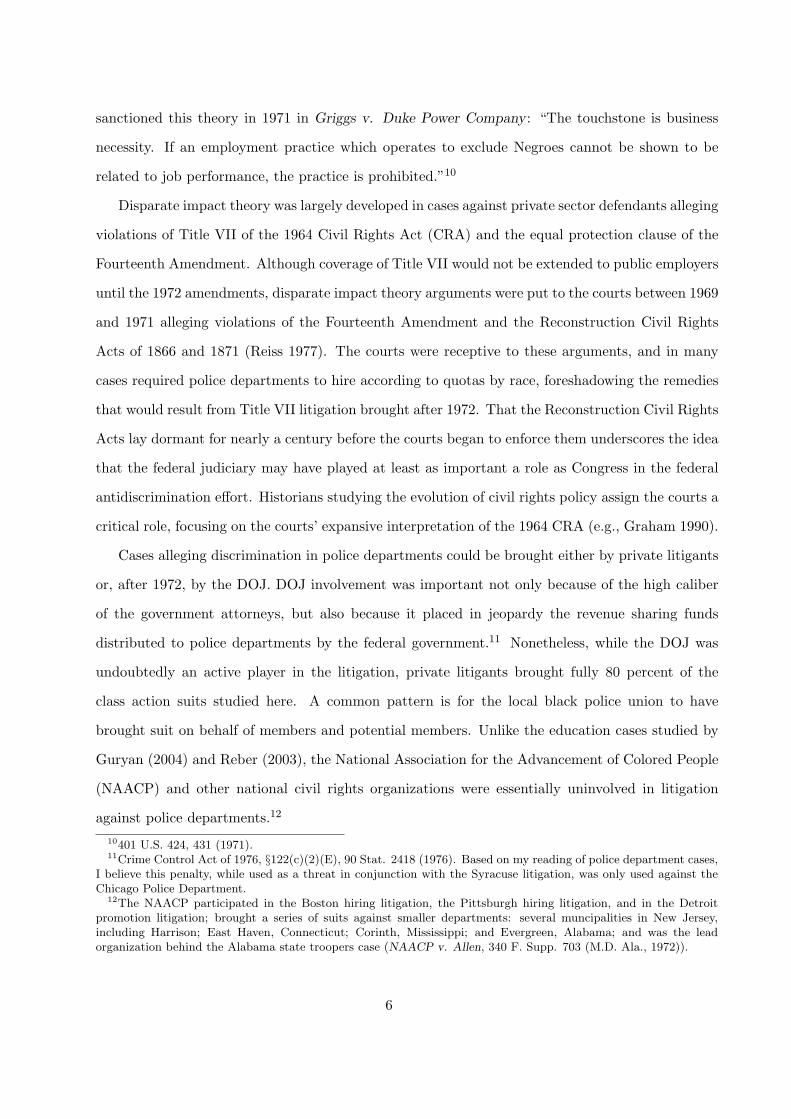
Disparate impact theory was largely developed in cases against private sector defendants alleging
violations of Title VII of the 1964 Civil Rights Act (CRA) and the equal protection clause of the
Fourteenth Amendment. Although coverage of Title VII would not be extended to public employers
until the 1972 amendments, disparate impact theory arguments were put to the courts between 1969
and 1971 alleging violations of the Fourteenth Amendment and the Reconstruction Civil Rights
Acts of 1866 and 1871 (Reiss 1977). The courts were receptive to these arguments, and in many
cases required police departments to hire according to quotas by race, foreshadowing the remedies
that would result from Title VII litigation brought after 1972. That the Reconstruction Civil Rights
Acts lay dormant for nearly a century before the courts began to enforce them underscores the idea
that the federal judiciary may have played at least as important a role as Congress in the federal
antidiscrimination effort. Historians studying the evolution of civil rights policy assign the courts a
critical role, focusing on the courts’ expansive interpretation of the 1964 CRA (e.g., Graham 1990).
Cases alleging discrimination in police departments could be brought either by private litigants
or, after 1972, by the DOJ. DOJ involvement was important not only because of the high caliber
of the government attorneys, but also because it placed in jeopardy the revenue sharing funds
distributed to police departments by the federal government.11 Nonetheless, while the DOJ was
undoubtedly an active player in the litigation, private litigants brought fully 80 percent of the
class action suits studied here. A common pattern is for the local black police union to have
brought suit on behalf of members and potential members. Unlike the education cases studied by
Guryan (2004) and Reber (2003), the National Association for the Advancement of Colored People
(NAACP) and other national civil rights organizations were essentially uninvolved in litigation
against police departments.12
10401 U.S. 424, 431 (1971).11Crime Control Act of 1976, §122(c)(2)(E), 90 Stat. 2418 (1976). Based on my reading of police department cases,
I believe this penalty, while used as a threat in conjunction with the Syracuse litigation, was only used against theChicago Police Department.
12The NAACP participated in the Boston hiring litigation, the Pittsburgh hiring litigation, and in the Detroitpromotion litigation; brought a series of suits against smaller departments: several muncipalities in New Jersey,including Harrison; East Haven, Connecticut; Corinth, Mississippi; and Evergreen, Alabama; and was the leadorganization behind the Alabama state troopers case (NAACP v. Allen, 340 F. Supp. 703 (M.D. Ala., 1972)).
6
Following a judicial determination that a police department entrance examination disparately
impacted African Americans, there was typically a one to three year lag before any quota would
be imposed. During this period, the judge would order the city to devise a test that either did
not exhibit disparate impact or was job-related. If hiring was to proceed in the interim, temporary
hiring quotas were sometimes put in place until the new exam was administered. If the department
proved unable to devise a test that satisfied the court, the court often imposed an ongoing quota.13,14
III. Litigation and the Integration of the Chicago Police Department
Before turning to the main empirical analysis, I first consider the case of Chicago. The hiring
and promotion practices of the Chicago Police Department (CPD) have been subject to litigation
continuously from 1970 to 2000, and the remedies from this litigation include aggressive hiring
quotas and the withholding of some $100 million in revenue sharing funds.15 I demonstrate the
impact of litigation on CPD hiring patterns using a unique administrative data set provided to
me by the City of Chicago. The data set contains records on the race and hiring and termination
dates of a large sample of police officers dating to the early 1960s.16 These data are superior to
those collected by the EEOC, because they can be used to calculate the fraction African American
among new hires for many years prior and subsequent to litigation. In contrast, EEOC data only
contain information on the overall black employment share.
The CPD was first required to justify its employment practices to a federal district court judge
in 1970, after the Afro-American Patrolmen’s League initiated suit. At that time Chicago employed
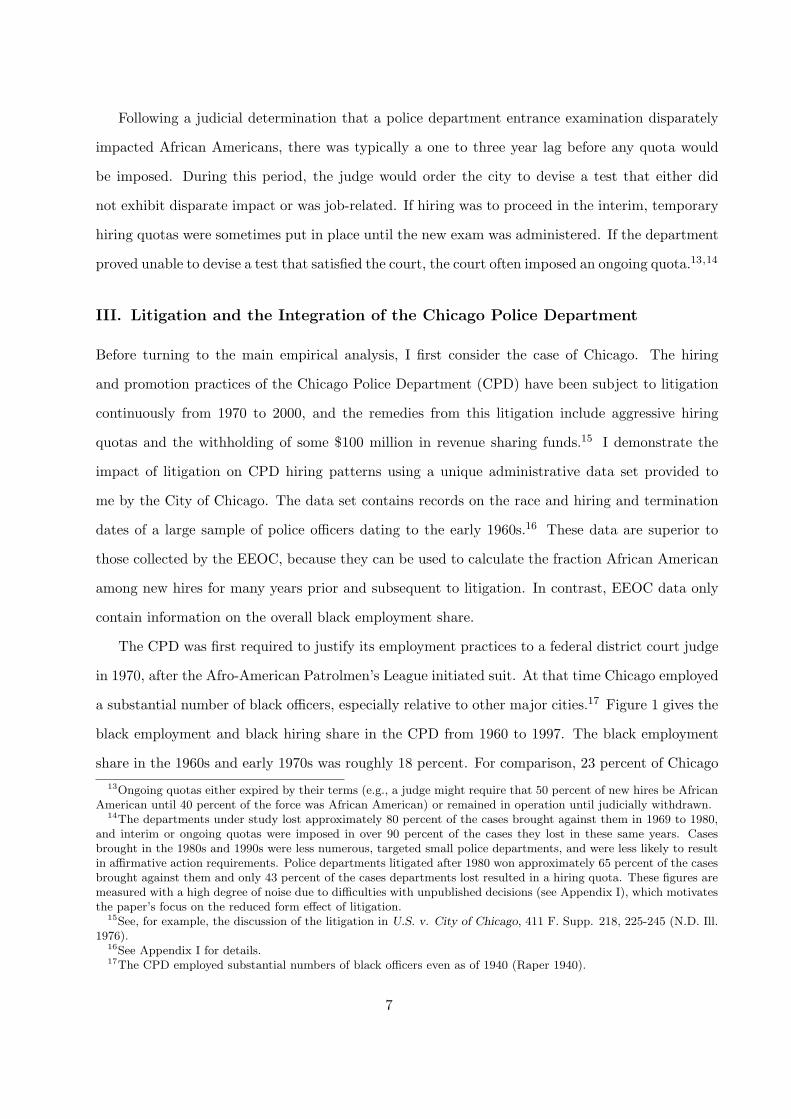
a substantial number of black officers, especially relative to other major cities.17 Figure 1 gives the
black employment and black hiring share in the CPD from 1960 to 1997. The black employment
share in the 1960s and early 1970s was roughly 18 percent. For comparison, 23 percent of Chicago13Ongoing quotas either expired by their terms (e.g., a judge might require that 50 percent of new hires be African
American until 40 percent of the force was African American) or remained in operation until judicially withdrawn.14The departments under study lost approximately 80 percent of the cases brought against them in 1969 to 1980,
and interim or ongoing quotas were imposed in over 90 percent of the cases they lost in these same years. Casesbrought in the 1980s and 1990s were less numerous, targeted small police departments, and were less likely to resultin affirmative action requirements. Police departments litigated after 1980 won approximately 65 percent of the casesbrought against them and only 43 percent of the cases departments lost resulted in a hiring quota. These figures aremeasured with a high degree of noise due to difficulties with unpublished decisions (see Appendix I), which motivatesthe paper’s focus on the reduced form effect of litigation.
15See, for example, the discussion of the litigation in U.S. v. City of Chicago, 411 F. Supp. 218, 225-245 (N.D. Ill.1976).
16See Appendix I for details.17The CPD employed substantial numbers of black officers even as of 1940 (Raper 1940).
7

residents in 1960 were African Americans, and 33 percent were African Americans in 1970. The DOJ
joined the suit against the CPD in 1973, and in 1974 an interim hiring quota on behalf of African
Americans was imposed, followed by an ongoing hiring quota in 1976. Figure 1 demonstrates that
there was substantial compliance with the court’s orders. In the years 1971-1973, the hiring share
was roughly 10 percent. By 1975 it had climbed to 40 percent, and throughout the period 1975-
1990, the hiring share averaged 32 percent. Although the demographic composition of new hires to
the CPD responded dramatically to the hiring quota, the demographic composition of the police
force changed only slowly, because of low quit rates. Using these data, I estimate an annual quit
rate of 3.6 percent, which is within the range of the available estimates for other police departments
in varying time periods.18 Considering the low police department quit rates, we should not expect
court orders to lead to dramatic changes in black employment share. Instead, we would expect
these to lead to a trend break in black employment share after the filing date of litigation.
For cities other than Chicago, high quality data on black hiring share are not available. However,
I have collected data on black employment share for a large sample of police departments. If quit
rates are stable over time, as they appear to be for police departments, it is possible to approximate
the gain in the hiring share African American using data on the gain in the black employment share;
I next describe a simple methodology for doing so. Appendix II develops the approximation
Ft ≈ αFt−k + (1− α)f (1)
where Ft is the black employment share in period t, f is the average hiring fraction African American
during the period t−k to t, and α is a convex factor to be defined. The approximation is an identity
if the quit rates for black and all officers are equal, and if hiring rates, the hiring fraction African
American, and quit rates are constant over the period t − k to t. Those conditions imply that
α =(
1−q1+ε
)k, where q denotes the quit rate, and ε denotes the year-over-year police force growth
rate.19 Suppose the approximation is valid and contemplate a re-stated version of (1):
f − Ft−k ≈ 11− α
(Ft − Ft−k) (2)
18See Appendix II. Quit rates appear to vary somewhere between 3 and 5 percent.19As discussed in Appendix II, the approximation remains accurate if quit rates and hiring rates are small and
satisfy a law of large numbers and if black quit rates are approximately equal to overall quit rates.
8

A simple way to think of (2) is as follows. Suppose that in period t − k a police department is
in a steady state, such that the hiring fraction African American is equal to the overall police
department black employment share (i.e., ft−k = Ft−k, where ft−k is the hiring fraction African
American in period t− k). Litigation occurs, and an affirmative action program is imposed on the
police department, resulting in an increase in the hiring share African American. After k periods,
the police department black employment share is observed to have increased by Ft − Ft−k. Then,
with an estimate of the quit rate q and the year-over-year growth rate ε, we compute α =(
1−q1+ε
)k
and inflate the gain Ft−Ft−k by the factor 11−α ; the approximation in (2) justifies an interpretation
of this quantity as the gain in the hiring share African American over the initial hiring share African
American (i.e., f − ft−k).
To make these ideas concrete, consider Figure 1, where it is clear that the average hiring
fraction African American from 1974 to 1997 far exceeded the historical hiring fraction African
American. Using the 0.088 gain in the black employment share from 1974 to 1997, we can use
the approximation in (2) to estimate the gain in the hiring fraction African American. Using a
3.6 percent quit rate and the observed annual growth rate of the police force of 0.06 percent, the
estimated gain in the hiring fraction African American is 0.088/(
1− (1−0.0361+0.0006
)1997−1974) .= 0.153.
Unlike the data analyzed in the main body of the paper, the administrative data from Chicago
allow us to calculate the hiring share African American directly. Thus, we may assess the quality
of the approximation by simply calculating the hiring share African American over the period 1974
to 1997 and comparing it to the prediction based on the approximation in (2). The actual gain
in the hiring share African American in these data is 0.161, which is roughly comparable to the
prediction of 0.153 given above.
However, there is some discrepancy. The prediction based on the approximation in (2) will be
understated (overstated) if the quit rate is overstated (understated). For example, a quit rate of 3.3
percent rationalizes the prediction and the actual, and a quit rate of 4 percent leads to a prediction
of 0.144, which is too small. As shown in Appendix II, the prediction will also be understated if
the black quit rate exceeds the overall quit rate. This is an important consideration. There is a
large body of evidence indicating that in departments subject to federal court oversight on account
of litigation, white officers harassed black officers with the apparent goal of inducing a high black
9
quit rate.20 If the black quit rate exceeds the overall quit rate, then the true gain in the black
hiring share is at least as large as implied by (2). On the other hand, it is possible that the black
quit rate is less than the overall quit rate, given the clear incentives created by public sector wage
schedules and the private sector black-white wage gap.21 On balance, the approximation probably
yields predictions that are in the right ballpark, but care should be excercised in interpretation.
Did the federal court’s aggressive intervention into CPD hiring practices affect police perfor-
mance measures? Panel B of Figure 1 shows the size of the workforce (solid line, solid squares),
the scope of crime in Chicago (solid line, open triangles), and two measures of arrests per crime
(dotted lines). The figure shows that police per capita has remained nearly constant over the entire
period. Crime per capita does appear to increase slightly in the same year as the quota imposition.
However, it is also apparent that crime is a volatile series—the increase does not appear unusual,
compared to other year-over-year changes in the series. Arrests per crime are mesaured by (i) the
number of index crimes cleared, normalized by the number of crimes (solid squares), and (ii) the
number of index crime arrests, normalized by the number of crimes (open triangles). The first of
these measures is on the same data file as the number of crimes. The second of these measures
is available in a greater number of years, but is taken from two separate data files and hence is
presumably measured with more error than the first. The two series are both rather noisy, and it
is not immediately clear whether there are any productivity effects.
Panel C of Figure 1 gives the fraction African American for arrests for all index crime arrests
and for all arrests. The city fraction black is provided for comparison. These series are noisy as
well and fail to reveal any clear pattern around either the litigation filing date or the date of quota
imposition.
Perhaps the strongest conclusion implied by the police performance measures in panels B and
C is that detecting productivity effects will require a statistically powerful approach, such as that
pursued below. The focus on a large number of cities should help to eliminate much of the noise20For example, “in a welcoming speech given to at least one academy class, a Captain reminded the cadets that
while the Division of Police was forced to accept blacks and females, they did not have to keep them,” Police Officersfor Equal Rights v. City of Columbus, 644 F. Supp. 393, 401 (S.D. Ohio, 1985). For further examples, see forinstance U.S. v. City of Buffalo, 457 F. Supp. 612, 632 (W.D. New York, 1978); Ways v. City of Lincoln, 871 F. 2d750, 753 (8th Cir., 1989); Busby v. City of Orlando, 931 F. 2d 764, 781 (11th Cir., 1991); and Phillips v. Heydt, 197F. Supp. 2d 207 (E.D. Pa., 2002).
21See Carrington, McCue and Pierce (1996) and Altonji and Blank (1999). An analogous context is blacks in themilitary, where in 1978 the black quit rate was lower than the overall quit rate; see Baker v. City of Detroit, 483 F.Supp. 930, fn. 58 (D.C. Mich., 1979).
10

in the available performance measures through averaging, enabling us to detect the productivity
effects of affirmative action.
IV. Litigation and the Composition of Police
In this section of the paper, I first consider comparisons between litigated and unlitigated de-
partments over time. Second, I consider estimators that take advantage of the timing of litigation.
Third, I discuss threats to the internal validity of the estimates presented in the second sub-section.
Finally, I present a direct test of litigation threat effects (cf., Rosen 1969), or the hypothesized ten-
dency of unlitigated departments to integrate in order to avoid litigation.
A. Contrasting the Litigated and the Unlitigated
Litigated cities are far from a representative sample of the 314 cities under study.22 Table
1 presents means and standard deviations of key variables by litigation status for two samples:
the “full sample” (all 314 cities) and the “long sample” (120 cities with information on black
employment share dating to 1960). For cities in the full sample, estimates on black employment
share are not necesarily available before 1969. All statistics in the table, and throughout the paper,
are weighted by 1970 city population unless otherwise noted.
The table indicates that although only 30 percent of all cities are ever litigated, residents of
litigated cities comprise nearly 58 percent of the 60 million residents in 1960, and 50 percent of
the 75 million residents in 1999. While generally much of the federal antidiscrimination effort was
focused on the South, that pattern is not true of the cases studied here. Among litigated cities, 23
percent of the population lives in the South, and 11 percent in the Deep South; among unlitigated
cities, these statistics are 33 and 13 percent, respectively. Figure 2 is a map of the contiguous
United States, with unlitigated cities represented as circles in the top panel and litigated cities
represented as stars in the bottom panel. It is clear from the map that litigation was not confined
to any particular region.
In substantive terms, the most important difference between litigated and unlitigated cities
regards the city fraction African American.23 Throughout the sample period, 1960 to 1999, litigated22See Appendix I for details on the selection of cities for study.23Litigated departments are more likely to have experienced a riot. Of the cities analyzed here, 300 (90 litigated
cities) were also analyzed by Spilerman (1970). I estimate that experiencing a riot in any of the years 1961 to
11

cities had larger African American populations than did unlitigated cities. In 1960, 12 percent of
the residents of unlitigated cities were African Americans, but 18 percent of the residents of litigated
cities were. This six point difference grew to a ten point difference in 1970 and an eleven point
difference in 1980 before stabilizing.
Police department black employment share did not initially keep up with these sharp gains.
In 1970, litigated departments employed only 7 percent black officers. Between 1970 and 1980,
black employment and population shares increased by equal amounts, and between 1980 and 1990,
and again between 1990 and 1999, black employment share grew by more than the city fraction
African American. Consequently, from 1970 to 1999, the difference between black employment and
population shares, or the representation gap, in litigated departments converged from -0.17 to -0.09.
In contrast, the representation gap among unlitigated departments remained roughly constant at
-0.10 in 1970 and 1980, and -0.09 in 1990 and 1999.
To economize on space, the estimates in Table 1 are given only at ten-year intervals. For all
years for which estimates are available, Figure 3 gives the time series graph of the representation
gap separately for litigated and unlitigated departments. The top panel gives estimates for the
full sample, beginning with 1969. Several aspects of the graph are of note. First, unlitigated
departments experience almost no convergence until around 1985. From 1985 to 1993 there is
convergence of about 0.015, followed by a slight widening in the mid- to late-1990s. Second, starting
sometime near 1977, litigated departments’ representation gap converges to that of unlitigated
departments. The convergence is very nearly linear in time starting around 1980.
Taking the numbers in Table 1 and Figure 3 at face value, a simple difference-in-differences
estimate of the long-run impact of litigation on the representation gap is about 0.07. This estimate
could understate or overstate the impact of litigation. For example, the estimate may be too
small if there are important threat effects to litigation, since then part of unlitigated departments’
convergence in representation gap would reflect the effect of litigation. The estimate may also be
too small if there is heterogeneity in the timing of litigation, since late-litigated departments do
not have as many years as early-litigated departments to experience gains in black employment.
1968 increases the probability of litigation by roughly 40 percentage points (separate regressions for each year) anddecreases the year of litigation by 3 years. Unlike the estimates on the impact of litigation below, these correlationsreflect differences in city size; for example, controlling additionally for the log of city population leads to insignificantresults for all but 2 of the 16 coefficients described. In these regressions, the 2 significant coefficients suggest that ariot in 1962 or 1965 delayed litigation by just over 4 years.
12
These two considerations are addressed empirically in Sections IV.D and IV.B, respectively.
On the other hand, a difference-in-differences estimate may be too large. First, convergence in
the representation gap may simply reflect pre-existing trends. Second, litigation may be associated
with broader social trends which would have led to integration, even were litigation never to have
occurred—the “social change” hypothesis of Donohue and Heckman (1991, p. 1605). I next discuss
these two hypotheses in somewhat more detail.
Direct evidence regarding the pre-existing trends hypothesis may be obtained from the long
sample of cities, for which information on black employment share predates 1969. Information on
these departments is included in the final three columns of Table 1. The estimates in Table 1
suggest that black employment share in 1960 was neither zero, nor yet as high as it would be in
1970. Interestingly, the 1960 to 1970 increase in black employment share is larger for unlitigated
cities than for litigated cities, despite the fact that the black population share in unlitigated cities
rose only marginally from 0.17 to 0.18, while that in litigated cities rose from 0.19 to 0.26.
The bottom panel of Figure 3 presents the time series plot of the representation gap for de-
partments in the long sample. The figure speaks against a pre-existing trends hypothesis—the
representation gap worsened substantially in litigated departments between 1960 and 1970. During
the decade of litigation, 1970 to 1980, the representation gap slowed its negative slide. By the end
of the decade the gap was closing. Unlitigated departments, in contrast, appear to have exhibited a
slowly improving representation gap from 1960 to 1999, with some acceleration near 1985. In short,
the figure is not consistent with an important role for pre-existing trends. Indeed, the evidence is
consistent with the proposition that litigation reversed pre-existing trends, a proposition which is
strengthened by the evidence from event study estimates shown below.
To be more specific regarding the type of mechanism underlying a social change hypothesis,
suppose that the 1970s saw both a decade of class action lawsuits against municipal police depart-
ments and the beginning of a new, national hiring regime in which the fraction African American
among new hires was only a little below the city fraction African American.24 In such a state of24An alternative version of the social change hypothesis asserts that a case is more likely to be filed when there is
general political pressure to integrate the police department. Two considerations suggest that this is not an importantthreat to validity. First, the estimates below are strengthened rather than weakened when unrestricted state-by-yearcontrols are included. Since social change is likely to be similar for two cities in the same state, this pattern speaksagainst this specific version of a social change hypothesis. Second, the cases studied here only rarely involve civil rightsgroups (which would be expected to be heavily involved if litigation merely reflected a broader social movement).
13

the world, it would mechanically be true that cities with low representation gaps would experience
the greatest gains. This concern is addressed empirically in Section IV.C, below, using propensity
score reweighting techniques (Rosenbaum and Rubin 1983).
The pre-litigation estimates in Table 1 and in Figure 3 suggest that litigation was targeted at big
cities in which the police department black employment share did not initially rise as quickly as the
city fraction African American. Economically, a pattern of targeted enforcement is notable for two
reasons. First, it suggests that it may have been possible for a department to forestall a class action
employment discrimination suit by hiring more black officers. This does not establish that threat
effects contributed to the observed gains in black employment share in unlitigated cities. However,
it does mean that such a story is not entirely implausible. Second, targeted enforcement is notable
because previous research has failed to find evidence of targeting in the federal contractor program.
Leonard (1985, p. 372) characterizes the compliance review program as a “random enforcement
process”, consistent with the earlier conclusions of Heckman and Wolpin (1976).25
B . The Timing of Litigation
Having considered comparisons between litigated and unlitigated departments, I now turn to
an examination of the timing of litigation. This identification strategy is only feasible to the extent
that different departments are litigated at different times. Figure 4, which gives the histogram of
litigation filing dates of the cases under study, demonstrates that there is quite a bit of heterogeneity
in terms of the timing of the cases brought against police departments.
Importantly, while the cross-sectional differences between litigated and unlitigated cities in
confounders are often quite substantial, the differences among litigated cities litigated at different
times are more minor. Table 2 gives weighted means and standard deviations of key variables
for five different ranges of filing dates. Regional composition varies by the timing of litigation.
However, key confounders such as city fraction African American are quite comparable across at
least the first three filing date ranges.26
25In comparing the enforcement process of the CRA and the federal contractor program, it is economically inter-esting to note that judicial enforcement of the CRA is highly decentralized, with the decision to litigate largely in thehands of individuals who feel they have been discriminated against. When the CRA was initially passed, civil rightsadvocates took a dim view of decentralized enforcement, preferring an Equal Employment Opportunity Commissionwith cease-and-desist authority (Rose 1989, pp. 1133-1134).
26The fourth filing date range is also somewhat close to the others in terms of many characteristics, but the fifthfiling date range is more similar to the unlitigated cities than to any of the litigated cities. However, in a weighted
14
The estimates I present next correspond to least squares estimates of θj in the regression model
Yi,t = µi + λr(i),t +b∑
j=a
θjDji,t + ei,t (3)
where Yi,t denotes the representation gap in department i at time t and Dji,t are leads and lags of
litigation filing dates, defined as
Dji,t =
Di1(t ≤ τi + a) for j = a
Di1(t = τi + j) for a < j < b
Di1(t ≥ τi + b) for j = b
where Di is an indicator for whether the department was ever the defendant to a class action
employment discrimination lawsuit alleging discrimination against African Americans in hiring, τi
gives the filing date for litigated departments, and 1(A) is one if A is true but is otherwise zero.27
Because not all parameters are identified as written, normalize θ0 = 0. The sequence θj then admits
the interpretation of the representation gap difference from filing date to j periods thereafter.28
I refer to the parameter sequence µi as “city effects” and to λr(i),t as “region-by-year effects.”
The empirical work uses “regions” of the four Census regions, the nine Census divisions, and
U.S. States, and also considers the restriction that the region-by-year effects are cross-sectionally
constant (λr(i),t = λt). Both the city effects and the region-by-year effects are nuisance parameters
and are to be estimated by fixed effects.
It is important to note that, moving from left to right in the event study graph, the sample
of cities driving the identification of θj is generally subject to change. For example, only early-
litigated cities can drive the estimated impacts of 20 years after litigation, since late-litigated cities
will not yet have been observed 20 years after they were litigated. For this reason, I assign more
weight to pre-litigation estimates obtained from the long sample—for many cities, the first period
regression, the contrasts will be focused between the first four filing date ranges because of their much greater size.27This specification is similar in spirit to that used by Jacobson et al. (1993). For departments not having judicial
interventions, the filing dates are irrelevant so define them to be zero. It is understood that a < 0.28This is a different normalization than that employed by Jacobson et al. (1993). Because their outcome variable
(earnings) was available far before the first treatment date, the omitted category was earnings from long before thetreatment. This strategy is not feasible here; the first treatment date (1969) is also the first year for which data onAfrican American employment share in police departments is available for the full sample.
15
of information on black employment share is 1969, which coincides with the onset of litigation.
These composition bias effects may be compounded by irregular observation of the outcome
variable, coupled with heterogeneous treatment effects. An example will serve to illustrate. Because
data on police department black employment share are available only at periodic intervals29 a city
such as Oakland, California, which is litigated in 1969 is observed at litigation lags 0, 4, 5, 6, 8, and
so on. A city such as Chicago, Illinois, which is litigated in 1970, is instead observed at litigation
lags -1, 3, 4, 5, 7, and so on.30 In other words, in the absence of a corrective procedure, litigation
effects will be estimated over partially-non-overlapping subsamples. Continuing the example, if
Chicago and Oakland exhibit different gains in representation gap following litigation, then the
event study graph will oscillate about the average effect of the two.
A natural method to correct for the composition bias is to linearly interpolate between obser-
vation years, taking care to correct the standard errors for both the induced serial correlation and
degrees of freedom. This procedure seems particularly plausible in the present context, because of
the low quit rate of police officers (see Equation (1)). Practically, the procedure amounts to using
clustered standard errors at the level of city, inflated manually by a degrees of freedom correction
to reflect that many observations are imputed.
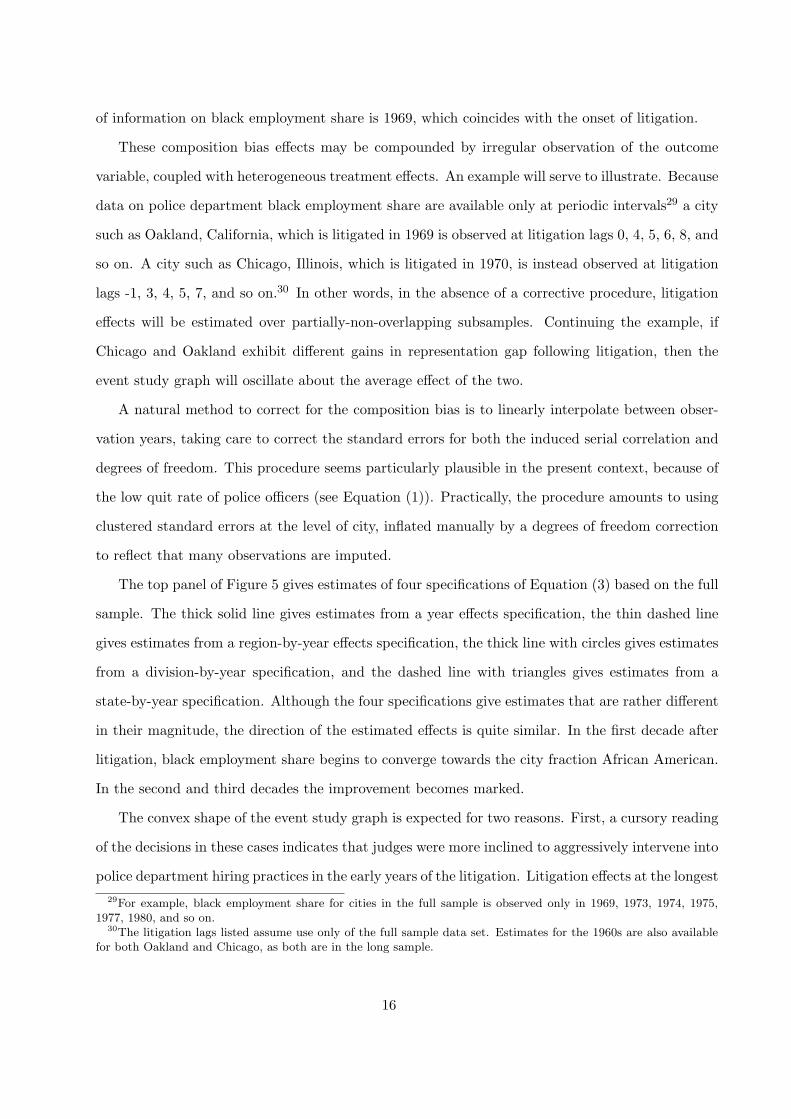
The top panel of Figure 5 gives estimates of four specifications of Equation (3) based on the full
sample. The thick solid line gives estimates from a year effects specification, the thin dashed line
gives estimates from a region-by-year effects specification, the thick line with circles gives estimates
from a division-by-year specification, and the dashed line with triangles gives estimates from a
state-by-year specification. Although the four specifications give estimates that are rather different
in their magnitude, the direction of the estimated effects is quite similar. In the first decade after
litigation, black employment share begins to converge towards the city fraction African American.
In the second and third decades the improvement becomes marked.
The convex shape of the event study graph is expected for two reasons. First, a cursory reading
of the decisions in these cases indicates that judges were more inclined to aggressively intervene into
police department hiring practices in the early years of the litigation. Litigation effects at the longest29For example, black employment share for cities in the full sample is observed only in 1969, 1973, 1974, 1975,
1977, 1980, and so on.30The litigation lags listed assume use only of the full sample data set. Estimates for the 1960s are also available
for both Oakland and Chicago, as both are in the long sample.
16

lags reflect primarily the experience of the earliest litigated. Second, there is heterogeneity in how
long after the filing date the judge would wait before imposing an affirmative action remedy. Some
departments would almost immediately be required to hire according to a quota regime, whereas
other departments would be given some time to devise a new test.
The pre-litigation estimates for the full sample are based on less reliable information than those
for the long sample. Estimates for the long sample are given in the bottom panel of Figure 5. The
estimates for the long sample strongly suggest that litigation was not preceded by representation
gap convergence. In the decade prior to litigation, the representation gap appears to have been
constant or perhaps even growing. The post litigation estimates are not identical to those of the
top panel, but are similar in magnitude. An important difference between the estimates in the top
and bottom panels is that the four specifications in the long sample give estimates that are more
widely varying than are those in the full sample. For example, while the region-by-year effects
models are similar in the long and full samples, the state-by-year effects models are much larger in
the long sample. Conversely, the year effects models are much smaller in the long sample than in
the full.
Because of the near linearity of the estimate sequences graphed in Figure 5, it is natural to pool
the individual estimates to estimate the post-litigation and pre-litigation slopes. The top panel of
Table 3 presents a variety of estimates of the post-litigation slope for the full sample. Following the
pattern of the specifications in Figure 5, Model 1 includes year effects only, Model 2 region-by-year
effects, Model 3 division-by-year effects, and Model 4 state-by-year effects. The first four columns
are the estimates for all 314 cities in the full sample. For these cities, the estimated slope is in the
range 0.07 to 0.12, with a standard error of about 0.02.31
Columns (5) to (8) exclude all unlitigated cities from the estimation. The litigation effects for
these models, then, are based purely off of the timing of the litigation among the litigated. This31As noted above, the reported standard errors here and throughout the paper are “clustered” at the level of the
city and inflated by a degrees of freedom correction. More specifically they are the square root of the diagonals of thematrix
`nT‹Pn
i=1 Ti
´ `Pni=1 X ′
iXiwi
´−1 `Pni=1 X ′
i eie′iXiwi
´ `Pni=1 X ′
iXiwi
´−1where T is the number of possible
time-series observations, Ti is the number of time-series observations for city i with (unimputed) information onblack employment share, wi is 1970 city population, normalized to sum to 1, Xi is the T ×K matrix of time-seriesobservations for city i, and ei is the T -vector of fitted residuals for city i. Because there are a moderate to largenumber of cities in all specifications in Table 3, conventional t-ratio tests using these standard errors will exhibitapproximately correct size regardless of the form of the heteroskedasticity and serial correlation within each city,provided that the residuals across cities are independent. (The only potential exception to this is the estimates incolumns (21) to (24), which are based on only the 43 litigated cities in the long sample. For these estimates, t-ratiotests of nominal 5 percent size likely have actual size of 10 percent.)
17

has some appeal: one might view with some caution estimates that rely on using the unlitigated
as a model of the counterfactual evolution of the representation gap among the litigated, had they
in fact never been litigated. Nevertheless, caution is warranted in interpreting these estimates.
Identification leans on a and b, the endpoints of the event study graph, which are usually thought
of as nuisance parameters. To see the role played by a and b in identification, suppose that we were
to estimate the pre- and post-litigation slopes in one step, by regressing Yi,t on city effects, year
effects, and on the pre- and post-litigation trends W 1i,t = (t− τi)Di1(a < t ≤ τi) + aDi1(t ≤ a) and
W 2i,t = (t − τi)Di1(τi < t ≤ b) + bDi1(t > b). As a → −∞ and b → ∞, W 1
i,t + W 2i,t → (t − τi)Di,
which is linearly dependent on city and year effects in a sample with Di = 1 for each city. That
is, the model is unidentified. Alternatively, a researcher thinking not of the event study graph but
rather of a trend-break model might have defined the regressors as W 1i,t = (t− τi)Di1(t < τi) and
W 2i,t = (t− τi)Di1(t > τi). This model is similarly unidentified: W 1
i,t + W 2i,t = (t− τi)Di.
With these caveats in mind, it is interesting to note that the estimates for the 92 litigated cities
are somewhat larger than the estimates that include all 314 cities. Estimates using all 314 cities
can only differ from those using the 92 litigated cities due to different estimated year effects (or
region-by-year effects, etc.). It is apparent that the year effects implicit in the estimates for the 92
litigated cities exhibit somewhat less of an upward trend than do the year effects from estimates
for all 314 cities.
A pattern common to the estimates from both the full and the long samples is that the richer
the set of geographical controls, the larger the estimated effects. For example, the state-by-year
effects specification (Model 4) suggests that the impact of litigation is at least twice that suggested
by the year effects specification (Model 1). This pattern is particularly pronounced for the long
sample estimates in the bottom panel. This pattern strengthens the plausibility of the hypothesis
that litigation is playing a causal role in black employment share gains; if litigation merely reflected
omitted factors which were correlated with black employment share gains, then we would expect
inclusion of richer geographic controls to make the effects smaller rather than larger.32
The bottom panel of Table 3 reports post-litigation trend estimates for subsets of cities in
the long sample. These are generally similar to those in the top panel. The estimated impact of32Comparisons across these specifications could in principle be invalid, since the observations identifying Model 4
are a subset of the observations identifying Models 1, 2, and 3. However, the estimates in columns (9) through (12)indicate that the effects are similar when the estimates are estimated over the same subsamples.
18
litigation is altered only slightly when we restrict our attention to litigated cities and when we
restrict our attention to cities contributing to identification of Model 4.
Because of the greater confidence in the pre-litigation estimates for the long sample, the bottom
panel also presents estimates of the post-litigation trend less the pre-litigation trend. In all but one
case (column (21)), these trend-break estimates are larger than the simple post-litigation trend,
reflecting the negative estimated pre-litigation trends for cities in the long sample.33
C . Social Change
In Section IV.A, above, I discussed the possibility that initial differences in the representation
gap could contribute mechanically to gains in black employment share. To address this possibility,
I assign weights to the unlitigated, where the weights are chosen so that the reweighted distribution
of the 1969 representation gap for the unlitigated is similar to the distribution for the litigated.34
The weighting function that achieves this balance is the ratio of the conditional to the unconditional
probability of litigation. Such reweighting schemes are commonly used to generate counterfactual
distributions (DiNardo, Fortin and Lemieux 1996) and in the program evaluation literature (e.g.,
Heckman, Ichimura, Smith and Todd 1998).35
Columns (13) to (16) of Table 3 give reweighted estimates of the post-litigation slope for the
four specifications considered above. To estimate the conditional probability of litigation, I use a
probit model with a third-degree polynomial in the 1969 representation gap; for the unconditional
probability I use the sample average.
The estimates from this reweighting scheme suggest that the 25-year gain in black employment33It is unclear whether the post-litigation trend is more or less appropriate than the trend-break model. For
example, the post-litigation trend would be more appropriate if the negative pre-litigation trend would have abatedsoon after the filing date of litigation. However, the post-litigation trend would be too conservative, and the trend-break model would be more appropriate, if the negative pre-litigation trend would have continued in the absence oflitigation.
34One could also reweight the data to mimic the initial distribution of the representation gap for the unlitigated orfor the average department. In this paper, I focus on addressing the counterfactual evolution of the representationgap in litigated cities, had they never been litigated. From a policy perspective, this is the right treatment effect tobe estimated, since future affirmative action policies of this type would target departments with representation gapssimilar to those of the litigated.
35The literature’s motivation for reweighting is typically implicit rather than explicit. Short proof that reweightingbalances potential confounders in distribution: let X denote covariates to be balanced, D an indicator, g(·) anarbitrary bounded, continuous function, and assume p ≡ E[D|X] ∈ (0, 1) and π ≡ E[D] ∈ (0, 1). Note thatE[g(X)(1 − D) p
1−p] = E[g(X)p] and E[g(X)D] = E[g(X)p], implying E[g(X)|D = 1] = E[g(X)w|D = 0], where
w ≡ p1−p
‹π
1−π. The implication follows from the converse to the Helly-Bray theorem (Davidson 1994, Theorem 22.8).
19
share may be slightly smaller than previously estimated. For example, the difference between
Model 2 in column (2) (usual weights) and Model 2 in column (14) (reweighting the unlitigated to
achieve balance) is about 0.023; that between the estimates for Model 4 is about 0.008. A similar
reweighting exercise is performed in columns (29) to (32) for the long sample. These estimates
suggest that the degree of overstatement in the original estimates is between 0.003 and 0.012.
Unreported event study estimates of the impact of litigation on representation gap, weighting by
the same factor, are visually quite similar to those presented in Figure 5.
D . Threat Effects
Testing a litigation threat effects hypothesis requires that we specify how beliefs regarding
threats are formed. A natural approach in this application is to consider whether unlitigated cities
respond to the litigation of other cities in the same federal district.
To test this idea, I consider the unlitigated cities in the full and long samples, matching each
unlitigated city with a litigated city in the same federal district.36 For cases where a single match
is available, I assign to the unlitigated city the litigation date of the litigated city. In situations
with multiple matches, I assign to the unlitigated city the minimum of the available dates, since
that would correspond to the first date as of which an unlitigated city would have been alerted to
the possibility of litigation in the district.37
This matching procedure generates a sample of unlitigated cities in the full and long samples
with neighbor-litigation dates. Some cities are located in a state or sub-state area with no litigated
city (e.g., the cities in Rhode Island). These cities play the role of the unthreatened in this analysis
and are analogous to the unlitigated in the analysis of the preceding subsections.
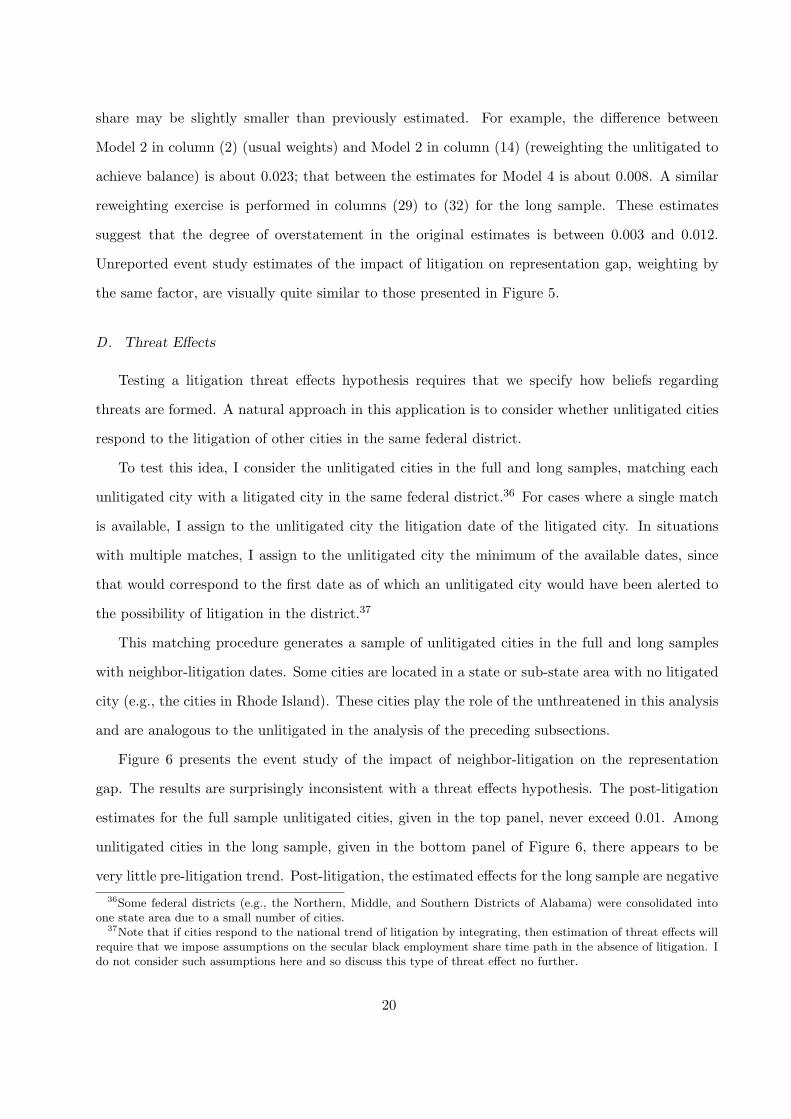
Figure 6 presents the event study of the impact of neighbor-litigation on the representation
gap. The results are surprisingly inconsistent with a threat effects hypothesis. The post-litigation
estimates for the full sample unlitigated cities, given in the top panel, never exceed 0.01. Among
unlitigated cities in the long sample, given in the bottom panel of Figure 6, there appears to be
very little pre-litigation trend. Post-litigation, the estimated effects for the long sample are negative36Some federal districts (e.g., the Northern, Middle, and Southern Districts of Alabama) were consolidated into
one state area due to a small number of cities.37Note that if cities respond to the national trend of litigation by integrating, then estimation of threat effects will
require that we impose assumptions on the secular black employment share time path in the absence of litigation. Ido not consider such assumptions here and so discuss this type of threat effect no further.
20

rather than the expected positive for both Model 3 and for Model 4.
E . Robustness
Because the dependent variable in the above estimation is the simple difference between black
employment share and city fraction African American, the estimates presented are potentially
driven by changes in city demographics, which presumably do not respond to litigation. The
most direct way to address this concern is to re-estimate Equation (3) with city fraction African
American replacing the representation gap. In results not reported, such estimates are quite small
in magnitude (generally below 1 percentage point) and slightly positive in the post-litigation period.
For all models, re-estimating Equation (3) with police department black employment share as the
dependent variable and including city fraction African American as a control results in a coefficient
close to one for city fraction African American. The robustness of the results to the manner in
which we control for city fraction African American means that the estimates of the impact of
litigation reported in this paper apply equally to the representation gap and to police department
black employment share.
While litigation is unrelated to city fraction African American, litigation is related to black and
white flight. Re-estimating Equation (3) with the log of city population replacing the representation
gap indicates that litigation is associated with roughly a 10 percent decline in city population over
25 years (results not reported).
V. Litigation and Crime
The judges intervening in police department hiring practices seem to have had a clear goal of
inducing police departments to hire more black officers. It is not inconceivable, however, that
an unintended consequence of the effort was more crime. As noted in Section II, above, police
department entrance examinations exhibit sizeable black-white test score gaps. It is fairly clear
that police department entrance examinations test aptitude, to at least some extent. If these exams
successfully isolate aspects of aptitude that are relevant to the job of police officer, then the natural
expectation is that hiring quotas with bite would lead to a downgrading in the quality of a police
force, as departments are required to hire individuals whose low test scores would otherwise have
prevented their selection.
21

However, if these exams select applicants on the basis of aspects of aptitude which are irrelevant
to police performance, then court-ordered hiring quotas would be of little consequence, except to
the extent that more black officers would be hired as a result. It has long been argued that African
Americans are more effective crime fighters than other Americans, at least conditional on entrance
exam score (e.g., National Advisory Commission on Civil Disorders 1968 (Chapter 11), National
Advisory Commission on Criminal Justice Standards and Goals 1973 (pp. 330-333), Decker and
Smith 1980, Donohue and Levitt 2001). It is possible that this effect could be strong enough to
offset any aptitude differences between applicant groups. Moreover, in Section V.B, I simulate the
effect of quota hiring on the test score distribution of new hires, as compared with the traditional
mechanism of rank-order hiring, disregarding race. Quantitatively, quota hiring affects entrance
exam scores of new cadets only slightly. This suggests that aptitude differences are likely to be small,
and that net productivity effects will reflect primarily the crime-fighting ability of the marginally
hired African American officer relative to that of the marginally hired individual absent a quota
hiring regime.
Litigation might also afford the productivity of incumbent officers through a morale effect.
Morale and productivity effects would be expected to manifest themselves at different time horizons.
Shortly after litigation, nearly all officers are still incumbents, due to the low police quit rate. Thus,
productivity effects should be small and morale effects should predominate. Many years after
litigation, much of the workforce will have been replaced with officers hired under the affirmative
action regime, and productivity gains or losses should manifest themselves more strongly. At the
same time, it is plausible that morale effects dissipate over long time horizons, so that the long-run
effect is dominated by productivity considerations. However, as emphasized above, net productivity
reflects both the skill content of police department entrance exams and the crime-fighting ability
of black officers relative to that of other officers, so the sign of any long-run effect of litigation on
police performance is theoretically ambiguous.
Even if litigation does not affect crime, it could affect intermediate aspects of police performance,
such as the racial composition of arrests. This issue has been studied by Donohue and Levitt
(2001), who conclude that the hiring of black (white) officers increases the number of white (black)
arrestees, but leaves unchanged the number of black (white) arrestees. Since litigation results in an
increase in black officers at the expense of white officers, their results imply that litigation should
22

decrease the number of black arrests and increase the number of white arrests, for a decrease in
the fraction black of arrestees. The evidence presented below is consistent with this prediction, but
the magnitude of the effect is modest.
The effect of court-ordered affirmative action on crime has also been studied by Lott (2000).
Lott considers only affirmative action required by DOJ consent decrees still in place as of 1987, when
public-use data on police department black employment share become available. Lott’s estimates
imply that affirmative action increases crime. Lott emphasizes a specific mechanism, arguing
that affirmative action over this period involves reducing standards for applicants generally. This
argument is difficult to reconcile with the simulation of Section V.B. Moreover, that mechanism is
less plausible in the historical context studied here, where affirmative action typically meant hiring
in rank order of test score, stratified by race—in which case no reduction of standards for non-black
applicants was required.38
The 19 departments still subject to consent decrees as of 1987 are a selected sample, in two
different ways, of departments placed under affirmative action obligations. First, they do not in-
clude those departments litigated by private actors. Second, they do not include those departments
which had already by 1987 complied with any court-ordered affirmative action. These considera-
tions suggest that crime rates in these cities may have as much to do with inflexible management as
they do with changes in workforce demographics. My own measure of affirmative action is whether
a department was ever subject to litigation alleging hiring discrimination against African Ameri-
cans. It incorporates litigation brought by both the DOJ and private actors and does not reflect
compliance with affirmative action mandates.
A. Descriptive Statistics and Estimation Results
I begin with a consideration of simple descriptive statistics on crime rates by litigation status
and litigation timing. For both the full and long samples, panel C of Table 1 gives the log crime rate
for litigated and unlitigated cities at ten-year intervals beginning in 1960. For the full sample, it
appears that crime rates in litigated and unlitigated cities differed by less than ten percent until the38If entrance examinations were previously job related and were diluted of their content in order to eliminate
disparate impact, then these considerations again become important. While there are undoubtedly examples of testdilution my reading of the history is that the additional pressure to establish a fair and impartial process for derivingtest questions related to job performance on net made the examinations more job related rather than less.
23
1990s, when crime rates fell dramatically in the litigated cities. Among cities in the long sample,
the unlitigated had higher crime than the litigated in 1960. However, beginning in 1970 the crime
rates in litigated and unlitigated cities have a close correspondence.
Panel C of Table 2 gives the log crime rate for five categories of litigation date ranges at ten-
year intervals beginning in 1960. Cities litigated in 1977-1980 have a 1960 crime rate that is 30
percent higher than the estimates for the other four litigation date ranges. Between 1960 and 1970,
however, the crime rate in cities that were litigated 1969-1974 and in the 1980s soared relative to
that in cities litigated 1977-1980. Between 1970 and 1999, the crime rates in the five city groups
appear to move roughly in parallel.
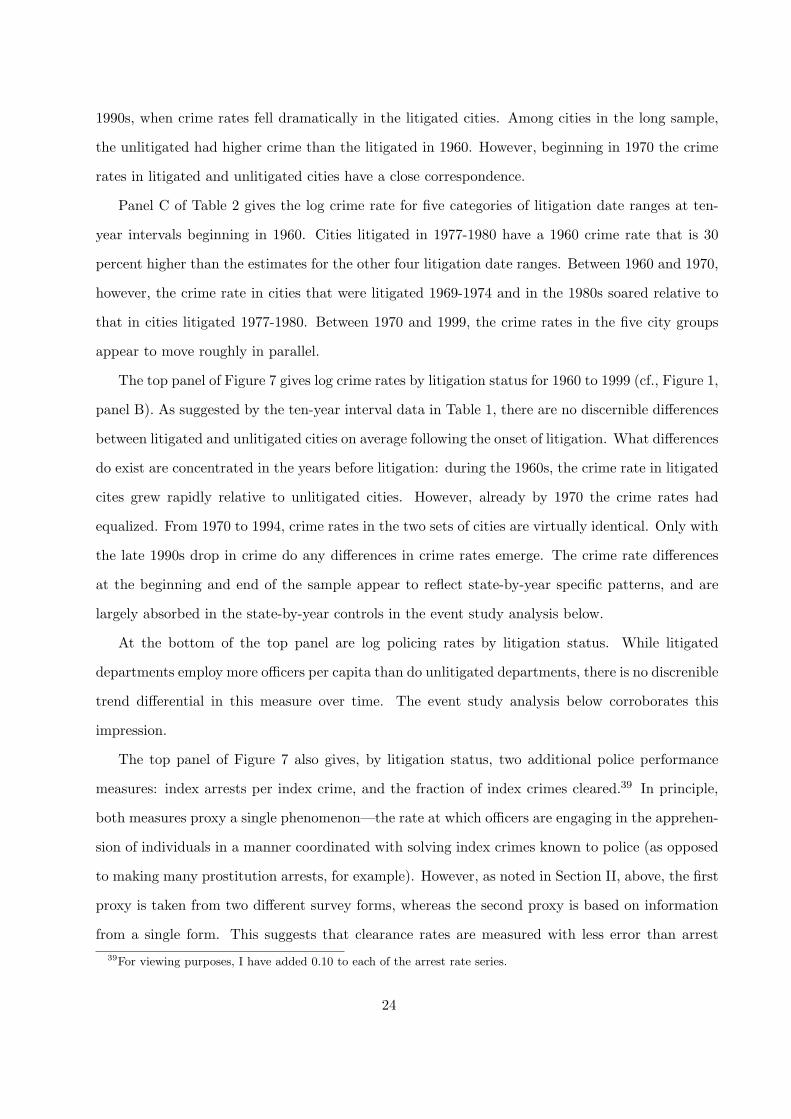
The top panel of Figure 7 gives log crime rates by litigation status for 1960 to 1999 (cf., Figure 1,
panel B). As suggested by the ten-year interval data in Table 1, there are no discernible differences
between litigated and unlitigated cities on average following the onset of litigation. What differences
do exist are concentrated in the years before litigation: during the 1960s, the crime rate in litigated
cites grew rapidly relative to unlitigated cities. However, already by 1970 the crime rates had
equalized. From 1970 to 1994, crime rates in the two sets of cities are virtually identical. Only with
the late 1990s drop in crime do any differences in crime rates emerge. The crime rate differences
at the beginning and end of the sample appear to reflect state-by-year specific patterns, and are
largely absorbed in the state-by-year controls in the event study analysis below.
At the bottom of the top panel are log policing rates by litigation status. While litigated
departments employ more officers per capita than do unlitigated departments, there is no discrenible
trend differential in this measure over time. The event study analysis below corroborates this
impression.
The top panel of Figure 7 also gives, by litigation status, two additional police performance
measures: index arrests per index crime, and the fraction of index crimes cleared.39 In principle,
both measures proxy a single phenomenon—the rate at which officers are engaging in the apprehen-
sion of individuals in a manner coordinated with solving index crimes known to police (as opposed
to making many prostitution arrests, for example). However, as noted in Section II, above, the first
proxy is taken from two different survey forms, whereas the second proxy is based on information
from a single form. This suggests that clearance rates are measured with less error than arrest39For viewing purposes, I have added 0.10 to each of the arrest rate series.
24
rates.
There is remarkable similarity between litigated and unlitigated departments in terms of arrest
rates and clearance rates. While arrest rates exhibit a differential litigated-unlitigated trend prior
to the era of litigation, this is not confirmed by the data on clearance rates. Indeed, clearance rates
corroborate the essential impression conveyed by crime rates: litigated and unlitigated departments
delivered roughly similar police performance before, during, and after litigation. The event study
estimates below suggest, however, that these broad similarities may potentially mask some modest
effect sizes.
The bottom panel of Figure 7 gives the fraction African American among index crime arrestees,
separately by litigation status. Litigated departments have always arrested substantially more
African Americans than unlitigated departments. There is some convergence in the arrest fraction
black beginning in the 1990s, but the magnitude is small.
With that backdrop, I now turn to event study estimates of the impact of litigation on police
performance. To economize on space, I present event study graphs only for the more interesting
results. Panel A of Figure 8 gives event study estimates of the impact of litigation on city crime
rates. These estimates are not consistent with a major impact of black police on crime rates,
although the evident noise in the crime series means it is difficult to detect small effect sizes.
Panel B of Figure 8 gives event study estimates for the clearance rate. While the point estimates
are generally insignificant (including the pre-litigation estimates and the longer litigation lags),
there is a statistically significant drop in clearance rates in litigated departments 5 to 7 years after
litigation.40 The timing of the effects is consistent with turmoil in the department. Quotas were
typically imposed in these cases 1 to 3 years after the filing date of litigation, and the decline in
clearances is precipitous at 3 years after litigation. However, because affirmative action continued
to affect hiring in departments throughout the study period, the timing of these effects is not
consistent with net productivity differences between affirmative action hires and incumbents, as
the effects dissipate after a handful of years.
Panel C of Figure 8 gives event study estimates for the fraction of index crime arrestees who are
African American. This series is particularly noteworthy, since the timing of the effects is consistent40For example, Model 1 estimates have t-ratios of -3.45, -2.32, and -2.29, and Model 4 estimates have t-ratios of
-3.25, -3.59, and -3.24. Estimates from Model 4 are significant in years 3 through 13.
25
with the gains in black employment share. As noted by Donohue and Levitt (2001), the effect of
the racial composition of the police on the racial composition of arrests could reflect many factors,
including changes in the probabilities of false arrest (presumably due to information processing)
and changes in the probabilities of true arrests (presumably due to officer tastes or corruption).41
Table 4 summarizes the long-run trends in these outcomes, as well as for log police per 100,000
populuation, the arrest rate, and the fraction black among all arrestees. Both the post-litigation
trend and the break in trend at the litigation filing data are reported. The point estimates in
the table are generally small and insignificant. An important exception is the estimate for the
fraction black among index crime arrestees, which is suggestive of effects of affirmative action on
intermediate aspects of police performance.42
B . The Distribution of Entrance Exam Scores by Race
I next present evidence on the temporal evolution of the distribution of entrance examination
scores by race for the New York City Police Department. These data allow direct calculation of the
difference in the distribution of test scores of newly hired officers under various hiring rules. For
example, it is possible to calculate the distribution of test scores under the rank-order hiring rule
traditionally used by police departments, and we may compare this distribution directly with the
distribution of test scores which would result if an aggressive hiring quota were imposed. These
two distributions turn out to be rather similar, suggesting a limited role for the hypothesis that
quotas increase crime by circumventing standards.
I have been able to obtain information on the distribution of test scores by race for the 1968,
1970, 1979, and 1998-99 examinations.43 For all examinations for which I have data, Table 5
gives the fraction of white and black applicants with scores in each decile of the overall test score
distribution. The numbers in the Table suggest that in both the 1968 and 1970 examinations,
African Americans constituted roughly 5 percent of those in the upper three deciles and 20 percent
of all applicants.
In 1972, the Guardians Association and the Hispanic Society of the NYCPD mounted a legal41These are not the only effects discussed by Donohue and Levitt (2001), but the other other key effects are
transmitted through impacts on crime. The results below indicate that the impact of litigation on crime is modestand perhaps zero.
42Note as well that the temporary decline in clearance rates is not captured by long-run trends.43See Appendix I.
26
challenge to these examinations. The court found that the city was in violation of Title VII because
the exams were insufficiently job-related; however, the case was declared moot because of the mid-
1970s fiscal crisis, which was to preclude hiring in the NYCPD for a period of several years. When
the City was again in a financial position to contemplate hiring, in 1979, the Personnel Department
went to great lengths to design an exam that was job related:
Exam No. 8155 is a “second generation” selection procedure. Despite the various flawsin construction of the test, it is clear that some attempt was made to develop the testwith recognition of at least some of the standards that courts had established in thefirst wave of Title VII cases. Aware that the validity of the test would likely have to bedemonstrated, the City performed an extensive job analysis, consciously used concepts[from the EEOC Uniform Guidelines on Employee Selection Procedures] in determiningthe qualities that were being tested for, and attempted to eliminate extraneous variables,such as the applicant’s prior knowledge, his reading level, and his ability to completethe test in a relatively short amount of time.44
However, after the test was administered, the Guardians again challenged the test under Title
VII, because this test—although it exhibited less disparate impact than the 1968 and 1970 exams—
continued to pass whites at a much higher rate than African Americans. For example, non-whites
constituted only 18 percent of those among the top three deciles, despite being 34 percent of
applicants.
Interestingly, the black-white test score gap on the NYCPD entrance exam does not appear
to have changed much since 1979. Figure 9 gives separate histograms for whites, and for African
Americans and Latinos combined, for the 1979 and 1998-99 examinations. Due to the extremely
large sample sizes, and the fact that the support of test scores is discrete, the histogram requires
no smoothing. Brief inspection of the figure reveals that although there are substantial differences
between the test score distributions for whites and non-whites, there are virtually no differences in
the white test score distribution over time, and the non-white test score distribution over time.
Using the data underlying Figure 9, it is a simple matter to simulate the impact of quota hiring
on the distribution of test scores among the newly hired. For example, from the 1979 exam, the
NYCPD anticipated that all those with scores of at least 94 would move on to the next phase in the
selection process. Thus, all new hires were, in the absence of court intervention, to be drawn from
the extreme upper tail of the test score distribution. The range of scores would have naturally been44630 F. 2d 79, 89.
27

from a low of 94 to a high of 110, with an average score of 96.8. In 1980, in response to the evidence
regarding the difference in the distribution of test scores by race, the district court judge ordered
that 50 percent of new hires be African American or Latino.45 I estimate that a cohort selected
under this aggressive quota would have had scores ranging from 87 to 110 and an average of 95.3.
Thus, it appears that even with an aggressive hiring quota and a visually discernible difference in
test score distributions, the average qualifications of an entering cohort would only be affected in
relatively minor ways. While it is possible that one bad apple spoils the bunch, the most natural
model of the effect of police officer quality on crime posits that crime depends on the sum of officers’
test scores. If this is the right model, then even the most aggressive affirmative action measures
would not be expected to affect city crime rates through effects on the distribution of aptitude
among entering cohorts.
VI. Conclusion
This paper has examined the impact of class action employment discrimination litigation on black
employment share and police performance in 314 large municipal police departments. Regarding
the impact of litigation on black employment share, the evidence points to several key conclusions.
First, the litigation of the 1970s was targeted at big cities with large and growing African American
populations and low black employment share. Second, despite substantial initial differences between
litigated and unlitigated cities, by 1999 litigated cities’ representation gap was largely equal to that
of unlitigated cities. Third, this convergence appears to have occurred almost entirely in the years
following litigation. Fourth, although unlitigated cities with large initial representation gaps exhibit
more convergence than cities with small gaps, this pattern is not strong enough to account for the
gains accruing to litigated cities. Fifth, there is little evidence supporting a threat effect hypothesis.
In particular, litigated cities do not appear to exhibit any gains in black employment share prior
to litigation, and unlitigated cities do not appear to integrate following the filing of the first class
action employment discrimination suit in their state.
On the whole, I interpret the evidence summarized in this paper as consistent with a major
role for the federal courts in integrating police departments in the United States. My best estimate45Guardians Association of the New York City Police Department v. New York City Police Department, 484 F.
Supp. 785, 799 (S.D. New York, 1980). This example is for illustrative purposes only; the 50 percent hiring quotawas subsequently softened by the appeals court. 630 F. 2d 79.
28

of the 25-year gain in police department black employment share is 10 percentage points, and
the effect is estimated with some precision. Because of the low attrition rate of police officers,
this is consistent with a hiring fraction African American roughly 14 percentage points above the
pre-litigation police department fraction black.
In contrast to the estimated impact of litigation on police department black employment share,
I find little evidence of an impact of litigation on crime. This may be because of a complex
series of effects that offset one another. For example, there is some evidence that litigation led
to turmoil in the department, temporarily reducing clearance rates, which presumably encouraged
crime. However, this effect on crime is not detectable, perhaps because African American officers
are more productive crime fighters than other Americans.
The analysis in this paper rules out one mechanism by which litigation might have been expected
to affect crime. Police departments’ standard practice is to hire in rank order by test score, and
judges handing down quotas typically allowed departments to continue to do so, but required that
they do so separately by race. Using data on test score distributions in New York City, thought to
be representative of those for all police departments, I show that in such a context, even aggressive
hiring quotas change the test score distribution of new hires only minimally. This suggests that the
magnitude of any aptitude differences induced by quota hiring is small, even for long-term quota
hiring regimes. Unless African Americans fare much better on the New York City Police Department
entrance examinations than on the entrance examinations of other cities, these conclusions would
seem to hold for police departments generally.
29
Appendix I. Data
Sample of Cities: The 314 cities for study were selected from among those U.S. municipalitieswith the largest police and fire departments, on the basis of the Census of Governments from 1972,1977, 1982, 1987, 1992, and 1997. The specific mechanism for selection was as follows. First, Imerged the employment counts by function of government for all municipal respondents in theabove years. Average employment levels over the period were computed. There were 328 citieswhose average police and fire employment levels placed them in the top 400 nationally of bothcategories. These cities were then sought in the electronic files of the EEO-4 survey. Satisfactorydata for 314 cities was available. Most of the cities unable to be matched are quite small. However,Washington, D.C. and San Francisco were excluded from the analysis because survey responsesfrom these cities were not available until the 1980s.46 The resulting sample is comprised of 314cities in all nine Census regions, and in all but the least populated of the 48 contiguous states.47
Black Police Officer Data: Data on police department demographics are obtained primarilyfrom the EEO-4 survey of the Equal Employment Opportunity Commission (EEOC), conductedannually by the EEOC since 1973.48 These data are confidential, but may be made available toresearchers. Tabulations of these data have typically been published by the EEOC and are avail-able in libraries (see, for example, Equal Employment Opportunity Commission 1999). Previousresearchers have been able to access electronic files for 1980, 1984, 1985, 1987, 1989, 1990, 1991,1993, 1995, 1997, and 1999. As part of the research for this study, I traveled to the EEOC andrecovered the 1973 and 1974 surveys. Electronic files in EBCDIC and packed decimal format wereavailable, but codebooks were not. Aided by the institutional knowledge of Ron Edwards, I inferreda codebook for these data and constructed electronic files. In EEOC headquarters, I located sev-eral 9 track reels containing the only known copies of the 1982 EEO-4 survey. Unfortunately, thesereels, had experienced a high degree of physical degradation, and only half of the records from the1982 survey are available. In the Alexandria warehouse of the EEOC, I located microfilm recordsfor 1975, 1977, and 1981. A team of research assistants entered these data for all cities (1975 and1977) and for those cities missing 1980 records (1981). The 1981 records are important, since largecities are systematically missing in 1980.49 The city identifiers assigned by the EEOC had a smallnumber of errors for the years 1980 to 1999, which I corrected manually using name and addressinformation for each city. Identifiers for 1973 and 1974 also do not conform to the 1980 identifiers;for these years, I created a full crosswalk for all identifiers.
Because the first EEO-4 survey was not conducted until 1973, further data on the number ofAfrican American officers in police departments were collected from several historical sources. Themost nationally comprehensive International City Manager Association (1970), which details thenumber of “minority group employees-uniformed”. I interpret these numbers as the number ofAfrican American and Latino officers and have discounted them by the estimated 1973 fraction ofAfrican American and Latino officers that were African American. The other nationally compre-hensive survey comes from unpublished research (Raper 1940) on “Negro policemen” upon which
46The fire and police departments of San Francisco were litigated in 1970 and 1973, respectively. The policedepartment of Washington, D.C. was litigated in 1970.
47Montana, North Dakota, Vermont, and Wyoming are all unrepresented. The 2000 population ranks of thesestates among the 48 contiguous states are 43, 46, 47, and 48, respectively.
48Beginning in 1991, the EEOC has conducted the EEO-4 survey only once every two years. The 1972 EqualEmployment Opportunity Act granted authority to the EEOC to collect data from public employers, expanding theEEOC’s older data collection authority regarding private employers (conferred by the 1964 Civil Rights Act).
49For example, neither New York nor Los Angeles is included in the 1980 file. The source of this problem appears tobe that electronically submitted returns were ironically not included in the electronic file compiled by the contractorfor the 1980 survey. Data for cities located on the same microfilm reel as a city with missing data were also included.
30

Myrdal (1944) relied.50 Raper’s research led to surveys of Southern police departments spanning1947 to 1969. Raper was a longtime writer for the Commission on Interracial Cooperation, whichthe Southern Regional Council (SRC) succeeded in 1944. From 1947 to 1954, the SRC contin-ued Raper’s surveys of the number of “Negro uniformed policemen, detectives (plainclothes), andpolicewomen” for Southern municipalities, publishing results annually in New South.51
Publication of these numbers ceased after 1954, as the SRC focused its efforts on school deseg-regation and voter registration (Rudwick 1961). However, Elliott Rudwick conducted surveys ofSouthern police departments in 1954, 1959, and 1961 and the SRC published the results in Rud-wick (1962). Then, in 1969, the SRC attempted what was to be its final survey of Southern policedepartments. The results of the survey were not published, but the data are available in recentlypublished microfilm records Southern Regional Council (2000, Reel 111(434), pp. 289-298).
For non-Southern cities, data on the number of “Negro police” in 1954 for a small numberof cities are published in Kephart (1954) and Kephart (1957). Data on larger cities’ black em-ployment share have also been published in the reports of several presidential and gubernatorialcommissions: President’s Commission on Law Enforcement and Administration of Justice (1967),National Advisory Commission on Civil Disorders (1968), and National Advisory Commission onCriminal Justice Standards and Goals (1973). Finally, it appears that the U.S. Commission onCivil Rights conducted a survey of employment of African American police officers in 230 depart-ments in 1962 (President’s Commission on Law Enforcement and Administration of Justice 1967,pp. 167-168). However, the Commission did not publish this work, the Commission Library doesnot possess a copy, and the survey results are not part of the holdings of the National Archives’holdings of the Commission’s papers. I believe this is the only nationally comprehensive surveyinformation on the employment of black police officers not included in the data used for this study.
The historical sources consulted allowed estimation of 1969 black employment share for all314 cities under study. Because litigation began in 1969, this is an important aspect of the datacollection undertaken here. For a subset of 120 cities, referred to in the body of the text as the “longsample,” data on black employment share for 1960 to 1969 are available.Data on black employmentshare were combined with data on city fraction African American (linearly interpolated betweenCensus years).
I also use an administrative data set on police officers in the Chicago Police Department (CPD),provided to me by Adam Kingsley of the City of Chicago Department of Law following a recordsrequest. The data set contains, for every individual who has worked for the CPD since approxi-mately the late 1970s, a hiring date, a termination date, race and other information not used here.Details on the construction of this data set from CPD administrative records is provided in Siskinand Griffin (1997). I use these data to construct a sample of CPD police officers for all years from1960-1997. Using the Uniform Crime Reports (UCR), I estimated the sampling rate for each ofthese extracts. From a low of 40 percent in 1960, the rate rises smoothly in time, arriving at aconstant level 95-105 percent beginning in 1977. The sampling rate for African American officersis higher than that of other officers for the early years (sources on black police available for 1962,1967, and 1969). I estimate the black sampling rate in these years to be 80, 76, and 70 percent.These rates are to be compared to the overall rates of 50, 65, and 71 percent, respectively. Thedownward trend in Figure 1 in hiring fraction African American pre-1970 is likely an artifact ofthis phenomenon, but the 1974 spike may not be attributed to this because the sampling rates were
50Comparing 1930 and 1940 Census published totals of African American police officers with Raper’s estimatessuggests that Raper identified the employers of some 90 percent of the black police officers in the country.
51Outline of volumes used: October 1947, Vol. 2, No. 10, p. 9; September 1948, Vol. 3, No. 9, p. 7; September1949, Vol. 4, No. 9, p. 9; September-October 1950, Vol. 5, Nos. 9 and 10, p. 6; September 1952, Vol. 7, No. 9, p.6; and October-November 1953, Vol. 8, Nos. 10 and 11, pp. 6-7.
31

similar already in 1969.Litigation Data: To learn which cities were litigated, I read over 1,300 published decisions
in which hiring discrimination against African Americans on the part of the city police or cityfire department was alleged.52 These decisions were located in a multi-step process. First, forall 314 cities under study, a keyword search on “discrimination”, “black”, and “police”/”fire” wasconducted in conjunction with the name of the city (e.g., “Norfolk”). Second, the resulting list ofcases was scanned and those deemed potentially relevant were selected for skimming. In the thirdstep, decisions determined to pertain to discrimination against either the police or fire departmentin the city were read in their entirety (preliminary research indicated that judges in fire departmentcases frequently mention litigation against the police department in the same city). Fourth, all casescited by each of those decisions as pertaining to discrimination cases were consulted. Two pieces ofevidence suggest that this strategy led to a relatively complete record of the litigation. First, onlya handful of cases identified in the fourth step had not been already been located using keywordsearches. Second, the cases listed in U.S. Department of Justice (2001) are a strict subset of thecases located by the first search method.
It was not possible to determine which departments were subject to quotas during which timeperiods. Because of unpublished decisions and judicial choices regarding what to discuss in thetext of an opinion, information on quotas is much more poorly measured than whether a city waslitigated, and the date as of which the litigation began. Litigation filing dates were determined byreference to the first two digits of the Civil Action Number (CAN) for located cases. Because litiga-tion filing dates are embedded in the CAN, the location of even one published decision pertainingto a case results in knowledge of the filing year.
Crime Data: Data on crime and police staffing were obtained from the Uniform Crime Reportsavailable from the Inter-university Consortium for Political and Social Research (ICPSR) for 1975to 1999. Data prior to 1975 are not available from ICPSR, but are available from the FederalBureau of Investigation.53
Entrance Exam Data: The 1968 and 1970 data are from Chaiken and Cohen (1973). The1979 data are from Guardians Association of the New York City Police Department v. the NewYork City Police Department, 630 F. 2d 79, 103 (2nd Cir., 1980). The 1998-99 data were obtainedfrom the New York City Police Department following a records request.
City Demographics Data: City demographics such as fraction African American and popu-lation were taken from the population censuses for 1960, 1970, 1980, 1990, and 2000, and linearlyinterpolated between census years. Electronic files were available for all years except for 1960,where I substituted published tabulations.54
Riot Data: Data on riots 1961 to 1968 are taken from the Data and Program Library Serviceat the University of Wisconsin.
Availability of Data: A series of electronic files containing all data and programs used for thispaper are available for researchers with access to EEOC data files. Interested researchers shouldcontact Ron Edwards at the EEOC.
52Interested researchers may obtain additional records (e.g., unpublished decisions and consent decrees) on the casesstudied here by contacting the federal district court in which the case originated. That strategy was not pursuedhere due to cost.
53These files were obtained with the help of Joanne Vanatta of the Programs Support Section of the FBI, RonEdwards of the EEOC, and Rick Kawin of UC Berkeley.
54For 1970, information in the electronic file was missing for East Hartford and West Hartford, Connecticut, andBrookline, Massachusetts, and published tabulations were again used.
32

Appendix II. Using Quit Rates to Predict Changes in Hiring Practices
This appendix justifies the approximation in (1). Let NBt and Nt denote the number of black
and all officers, respectively, at time t; Ht the number of officers hired between t− 1 and t; qBt the
quit rate of black officers; and ft the hiring fraction African American. The identity
NBt = NB
t−1 −NBt−1q
Bt−1 + Htft
states simply that the number of black officers in period t is equal to the number of black officersin period t − 1, less the number of black officers quitting, plus the number of black officers hired.Dividing both sides by the number of total officers implies
Ft =NB
t
Nt=
NBt−1
Nt
(1− qB
t−1
)+
Ht
Ntft =
NBt−1
Nt−1
Nt−1
Nt
(1− qB
t−1
)+
Ht
Ntft
=1− qB
t−1
1 + εtFt−1 + htft
≡ γt−1Ft−1 + htft
where γt−1 = (1 − qBt−1)
/(1 + εt), ht is the new hires rate and, as in the main text, Ft denotes
the black employment share in period t and εt is the year-over-year growth rate in the size of theworkforce (i.e., εt = (Nt −Nt−1)
/Nt−1). Iterating on this recursion yields
Ft = Γt,kFt−k +k−1∑
j=0
Γt,jht−jft−j = Γt,kFt−k + h fk−1∑
j=0
Γt,j + C[ht−j , ft−j ]k−1∑
j=0
Γt,j (4)
where Γt,j =∏j
i=1 γt−i for j > 0 and Γt,j = 1 for j = 0, C[ht−j , ft−j ] is the weighted covariance ofthe hiring fraction African American and the hiring rates over the past k periods, h is the weightedaverage of hiring rates, and f is the weighted average of the hiring fraction African American, withweights proportional to Γt,j and summing to one.
I now consider simplifying assumptions designed to allow something meaningful to be said aboutthe likely fraction African American among new hires, given information solely on gains in the blackemployment share and an estimate of the quit rate. Two assumptions which are sufficient are
A1. Quit Rates, Hiring Rates, and the Hiring Fraction African American are Constant:qτ = q, hτ = h, and fτ = f , for τ ∈ {t− k, t− k + 1, . . . , t− 1, t}.
A2. Black Quit Rates are Equal to Overall Quit Rates:qBτ = qτ for τ ∈ {t− k, t− k + 1, . . . , t− 1, t}.
Since ht ≡ (εt + qt−1)/(1 + εt), Assumptions A1 and A2 imply εt ≡ ε, leading to the identity
Ft =(
1− q
1 + ε
)k
Ft−k +
{1−
(1− q
1 + ε
)k}
f
which we recognize as (1). Letting α =(
1−q1+ε
)k, we have
f − Ft−k =1
1− α(Ft − Ft−k)
33

which we recognize as the conversion Equation (2). An alternative set of sufficient assumptions isalso available, recorded here as B1 through B3:
B1. Black Quit Rates and Employment Growth Rates are Small:qBτ and ετ are near zero for each τ ∈ {t− k, t− k + 1, . . . , t− 1, t}
B2. Hiring Rates and the Hiring Fraction African American are Uncorrelated:C[hτ , fτ ] = 0 for τ ∈ {t− k, t− k + 1, . . . , t− 1, t}.
B3. Law of Large Numbers:qt, qB
t , and ht are covariance stationary and jointly ergodic, and k is large.
Assumptions B1 and B3 imply that A1 holds approximately. For example, a second-orderTaylor approximation for ln(1 + x) shows that
Γt,k = exp(−k
{qB + ε
})exp
(12k
{V [qB
t−i] +(qB
)2})
exp(
12k
{V [εt−i] + (ε)2
})+ o (5)
where o is a general representation for an error which is (here, to second-order) small when blackquit rates and employment growth rates are small, and now q and ε denote the simple averages ofquit and employment growth rates, respectively.55 Under B3, the terms 1
2k{V [qBt−i] +
(qB
)2} and12k{V [εt−i]+(ε)2} are small if quit rates are small relative to k, leading to Γt,k ≈
((1− qB)
/(1 + ε)
)k
(another Taylor expansion shows this is approximately equal to the the first factor in (5)).To assess the numerical accuracy of this approximation, consider a simulation with parameters
relevant for the context of this paper. Suppose k = 25, qBt is distributed uniformly between 0.03
and 0.05, and εt is distributed uniformly beween 0.005 and 0.015. Then((1− qB)
/(1 + ε)
)k hasan average percentage error for Γt,k of 5.2 percent, with a near perfect correlation.56
Since the weights Γt,j are bounded, assumptions B2 and B3 imply that C[ht−j , ft−j ]p= 0, and
assumption B3 and Slutsky’s theorem imply that hp= (ε + q)
/(1 + ε), where Ak
p= Bk means that
Ak and Bk share a probability limit. This leads to
Ftp=
(1− qB
1 + ε
)k
Ft−k +ε + q
ε + qB
{1−
(1− qB
1 + ε
)k}
f + o
(cf., (1)). Letting α = (1− qB)/(1 + ε) and δ = (ε + q)
/(ε + qB), we obtain
δf − Ft−k ≈ 11− α
(Ft − Ft−k)
(cf., (2)). This implies that 11−α (Ft − Ft−k) will understate the regime-shift in the hiring fraction
African American if qB > q and will overstate the regime-shift if qB < q.In the text, I implement this approximation technique using a year-over-year growth rate esti-
mate of 1 percent and a quit rate of 4 percent. While the year-over-year growth rate is observeddirectly, the quit rate is not. However, 4 percent is in line with the available evidence. The Chicago
55Note that since the Γt,k are bounded, under B3, the simple and weighted averages are equal in probability.
56On average across 10,000 replications,“
1−qB
1+ε
”k
was 0.281, while Γt,k was 0.267. The overstatement is attributable
to quit rates being generally larger than employment growth rates in the chosen example.
34

data described in Section III yield an estimated quit rate of 3.6 percent.57 Butterfield (2001) notesthat “[i]n New York City, more than 1,700 officers left the 41,000-member force last year throughretirement or resignation, a third more than the year before.” (Implied quit rate estimates of1700/41000 .= 0.041 and 1275/41000 .= 0.031.) More historically, the District Court of the EasternDistrict of Pennsylvania reports that “[a]s of September 22, 1972 there were 8,082 members of the[Philadelphia] Police Department . . . [D]efendants estimate that 96 persons presently employed onthe Police Force will no longer be employed on the Police Force as of January 1, 1973.” (Estimateof 96[365/(8 + 31 + 30 + 31)]/8082 .= 0.043.)58
Further corroboration of this quit rate estimate is available from the 1991-1992 Police Use ofForce survey (Pate and Fridell 1994), which reports average years of service among several hundredlarge municipal police departments to be 11.3. If T denotes completed time of service, then tomaintain a constant workforce size, a department will hire 1/T of its workforce at each point intime, and among those working, average time of service will be
∫ T0 x 1
T dx = T2 . Thus, 11.3 average
years of service among current workers translates into average completed years of service of 22.6—ora quit rate of about 1/22.6 .= 0.044. This estimate is likely slightly overstated, because T > 2 · 11.3in a growing department, since entering cohorts must become progressively larger.
References
Altonji, Joseph and Rebecca Blank, “Race and Gender in the Labor Market,” in Orley Ashenfelterand David E. Card, eds., The Handbook of Labor Economics, Vol. 3C, Amsterdam: Elsevier,1999.
Antonovics, Kate L. and Brian G. Knight, “A New Look at Racial Profiling: Evidence from theBoston Police Department,” NBER Working Paper #10634, July 2004.
Ashenfelter, Orley and James J. Heckman, “Measuring the Effect of an Antidiscrimination Pro-gram,” in Orley Ashenfelter and James Blum, eds., Evaluating the Labor-Market Effects ofSocial Programs, Princeton: Industrial Relations Section, Princeton University, Research Re-port Series No. 120, 1976, pp. 46–84.
Beller, Andrea H., “The Economics of Enforcement of An Antidiscrimination Law: Title VII ofthe Civil Rights Act of 1964,” Journal of Law and Economics, October 1978, 21 (2), 359–380.
Bowen, William G. and Derek Bok, The Shape of the River: Long-Term Consequences of Con-sidering Race in College and University Admissions, Princeton: Princeton University Press,1998.
Brown, Charles, “Black-White Earnings Ratios Since the Civil Rights Act of 1964: The Importanceof Labor Market Dropouts,” Quarterly Journal of Economics, February 1984, 99 (1), 31–44.
Butterfield, Fox, “City Police Work Losing Its Appeal and Its Veterans,” New York Times, July30, 2001.
Carrington, William J., Kristin McCue, and Brooks Pierce, “Black-White Wage Convergence: TheRole of Public Sector Wages and Employment,” Industrial and Labor Relations Review, April1996, 49 (3), 456–471.
57For the sample of officers in the force between 1979 and 1997. Before 1979, it appears that the quit rate isartificially low due to the sampling scheme.
58348 F. Supp. 1084, 1110 (E.D. Pa. 1972).
35

Chaiken, Jan M. and Bernard Cohen, Police Civil Service Selection Procedures in New York City:Comparison of Ethnic Groups, New York: New York Rand Institute, 1973.
Cohen, Bernard and Jan M. Chaiken, Police Background Characteristics and Performance: ReportPrepared for the National Institute of Law Enforcement and Criminal Justice, New York: NewYork Rand Institute, 1972.
Davidson, James, Stochastic Limit Theory: An Introduction for Econometricians, New York:Oxford University Press, 1994.
Decker, Scott H. and Russell L. Smith, “Police Minority Recruitment: A Note on its Effectivenessin Improving Black Evaluations of Police,” Journal of Criminal Justice, 1980, 8 (6), 387–393.
DiNardo, John, Nicole Fortin, and Thomas Lemieux, “Labor Market Institutions and the Dis-tribution of Wages, 1973-1992: A Semi-Parametric Approach,” Econometrica, 1996, 64 (5),1001–1044.
Donohue, John J., III and James J. Heckman, “Continuous Versus Episodic Change: The Impactof Civil Rights Policy on the Economic Status of Blacks,” Journal of Economic Literature,December 1991, 29 (4), 1603–1643.
Donohue, John J. III and Steven D. Levitt, “The Impact of Race on Policing and Arrests,” Journalof Law and Economics, October 2001, 44 (2), 367–394.
Dulaney, W. Marvin, Black Police in America, Indianapolis: Indiana University Press, 1996.
Equal Employment Opportunity Commission, Job Patterns for Minorities and Women in Stateand Local Government, Washington, D.C.: EEOC, 1999.
Freeman, Richard B., “Changes in the Labor Market for Black Americans, 1948-1972,” BrookingsPapers on Economic Activity, 1973, 1973 (1), 67–131.
Graham, Hugh Davis, The Civil Rights Era: Origins and Development of National Policy, 1960-1972, New York: Oxford University Press, 1990.
Greisinger, George, Jeffrey S. Slovak, and Joseph J. Molkup, Civil Service Systems: Their Impacton Police Administration, Washington, D.C.: U.S. GPO, 1979.
Guryan, Jonathan, “Desegregation and Black Dropout Rates,” American Economic Review,September 2004, 94 (4), 919–943.
Heckman, James J. and Kenneth Wolpin, “Does the Contract Compliance Program Work? AnAnalysis of Chicago Data,” Industrial and Labor Relations Review, July 1976, 29 (4), 544–564.
, Hidehiko Ichimura, Jeff Smith, and Petra Todd, “Characterizing Selection Bias Using Ex-perimental Data,” Econometrica, September 1998, 66 (5), 1017–1098.
International City Manager Association, Municipal Yearbook, Washington, D.C.: ICMA, 1970.
Jacobson, Louis S., Robert J. LaLonde, and Daniel G. Sullivan, “Earnings Losses of DisplacedWorkers,” American Economic Review, September 1993, 83 (4), 685–709.
Jencks, Christopher and Meredith Phillips, The Black-White Test Score Gap, Washington, D.C.:Brookings Institution, 1998.
36

Kephart, William, “The Integration of Negroes Into the Urban Police Force,” Journal of CriminalLaw, Criminology, and Police Science, September-October 1954, 45, 325–333.
, Racial Factors and Urban Law Enforcement, Philadelphia: University of Pennsylvania Press,1957.
Knowles, John, Nicola Persico, and Petra Todd, “Racial Bias in Motor Vehicle Searches: Theoryand Evidence,” Journal of Political Economy, February 2001, 109 (11), 203–229.
Landy, Frank J., “Phases of Employment Litigation,” in Frank J. Landy, ed., Employment Discrim-ination Litigation: Behavioral, Quantitative, and Legal Perspectives, San Francisco: Jossey-Bass, 2005, chapter 1.
Leonard, Jonathan S., “Antidiscrimination or Reverse Discrimination: The Impact of Chang-ing Demographics, Title VII, and Affirmative Action on Productivity,” Journal of HumanResources, Spring 1984, 19 (2), 145–174.
, “The Impact of Affirmative Action on Employment,” Journal of Labor Economics, October1984, 2 (4), 439–463.
, “Affirmative Action as Earnings Redistribution: The Targeting of Compliance Reviews,”Journal of Labor Economics, July 1985, 3 (3), 363–384.
, “The Impact of Affirmative Action Regulation and Equal Employment Law on Black Em-ployment,” Journal of Economic Perspectives, Autumn 1990, 4 (4), 47–63.
Lott, John R. Jr., “Does a Helping Hand Put Others at Risk? Affirmative Action, Police Depart-ments, and Crime,” Economic Inquiry, April 2000, 38 (2), 239–276.
Myrdal, Gunnar, An American Dilemma: The Negro Problem and Modern Democracy, New York:Harper and Row, 1944.
National Advisory Commission on Civil Disorders, Report of the National Advisory Commissionon Civil Disorders, Washington, D.C.: GPO, 1968.
National Advisory Commission on Criminal Justice Standards and Goals, Report on Police, Wash-ington, D.C.: GPO, 1973.
Pate, Antony M. and Lorie E. Fridell, “Police Use of Force: Official Reports, Citizen Complaints,and Legal Consequences, 1991-1992,” 1994. [computer file]. Washington, D.C.: Police Foun-dation.
President’s Commission on Law Enforcement and Administration of Justice, Task Force Report:The Police, Washington, D.C.: GPO, 1967.
Raper, Arthur, “Race and Class Pressures,” 1940. Unpublished manuscript. Schomburg Centerfor Black Culture, New York Public Library.
Reber, Sarah, “Court-Ordered Desegregation: Successes and Failures in Integrating AmericanSchools Since Brown,” 2003. Unpublished manuscript. University of California, Los Angeles.
Reiss, Michael, “Requiem for an ‘Independent Remedy’: The Civil Rights Acts of 1866 and 1871as Remedies for Employment Discrimination,” Southern California Law Review, 1977, 50,961–1025.
37

Rose, David L., “Twenty-Five Years Later: Where Do We Stand on Equal Employment Opportu-nity Law Enforcement?,” Vanderbilt Law Review, 1989, 42, 1121–1181.
Rosen, Sherwin, “Trade Union Power, Threat Effects, and the Extent of Organization,” Review ofEconomic Studies, April 1969, 36 (2), 185–196.
Rosenbaum, Paul R. and Donald B. Rubin, “The Central Role of the Propensity Score in Obser-vational Studies for Causal Effects,” Biometrika, April 1983, 70 (1), 41–55.
Rudwick, Elliott M., “Negro Police Employment in the Urban South,” Journal Negro Education,Spring 1961, 30 (2), 102–108.
, The Unequal Badge: Negro Policemen in the South, Atlanta: Southern Regional Council,1962.
Schlei, Barbara Lindemann and Paul Grossman, Employment Discrimination Law, Washington,D.C.: Bureau of National Affairs, 1976.
Siskin, Bernard R. and David W. Griffin, “Analysis of Distributions by Rank, Race, and Gender:City of Chicago Police Department, 1987-1991,” 1997. Philadelphia: Center for ForensicEconomic Studies.
Smith, James P. and Finis Welch, “Black Economic Progress After Myrdal,” Journal of EconomicLiterature, June 1989, 27 (2), 519–564.
Southern Regional Council, Southern Regional Council Papers, 1944-1968, Ann Arbor: UniversityMicrofilms International, 2000.
, New South, Various Years.
Spilerman, Seymour, “The Causes of Racial Disturbances: A Comparison of Alternative Explana-tions,” American Sociological Review, August 1970, 35 (4), 627–649.
U.S. Department of Justice, “Employment Litigation Section Complaints Filed Involving Police ofFire Departments as of July 31, 2001,” 2001. Unpublished manuscript. U.S. Department ofJustice, Civil Rights Division, Employment Section.
Wallace, Phyllis A., Equal Employment Opportunity and the AT&T Case, Cambridge: MIT Press,1976.
38

Figure 1. The Chicago Experience
A. Black Employment Share and Black Hiring Share
0.00
0.05
0.10
0.15
0.20
0.25
0.30
0.35
0.40
0.45
0.50
1960 1965 1970 1975 1980 1985 1990 1995 2000
Em
ploy
men
t Sha
re, N
ew H
ire S
hare
Dep't Fraction Black New Hires Fraction Black
Filing Year, Afro-American Patrolmen's League v. Conlisk
Quota imposition, U.S. v. City of Chicago
B. Production of Crime Control: Aggregate Inputs and Outputs
5.5
6.0
6.5
7.0
7.5
8.0
8.5
9.0
9.5
10.0
1960 1965 1970 1975 1980 1985 1990 1995 2000
Log
Crim
e R
ate,
Log
Pol
ice
Rat
e
0
0.1
0.2
0.3
0.4
0.5
0.6
0.7
Log Police per 100,000 Population Log Crimes per 100,000 Population
Arrests per Crime Clearance Rate
Arre
st R
ate,
Cle
aran
ce R
ate
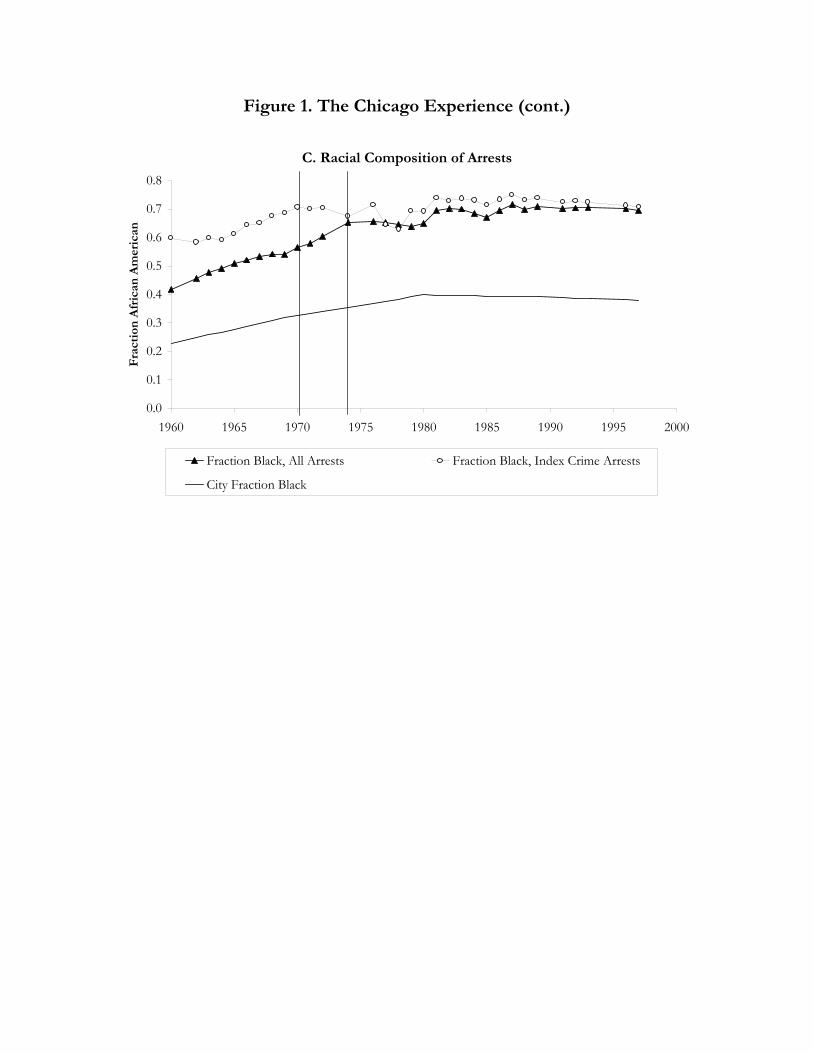
Figure 1. The Chicago Experience (cont.)
C. Racial Composition of Arrests
0.0
0.1
0.2
0.3
0.4
0.5
0.6
0.7
0.8
1960 1965 1970 1975 1980 1985 1990 1995 2000
Frac
tion
Afric
an A
mer
ican
Fraction Black, All Arrests Fraction Black, Index Crime Arrests
City Fraction Black

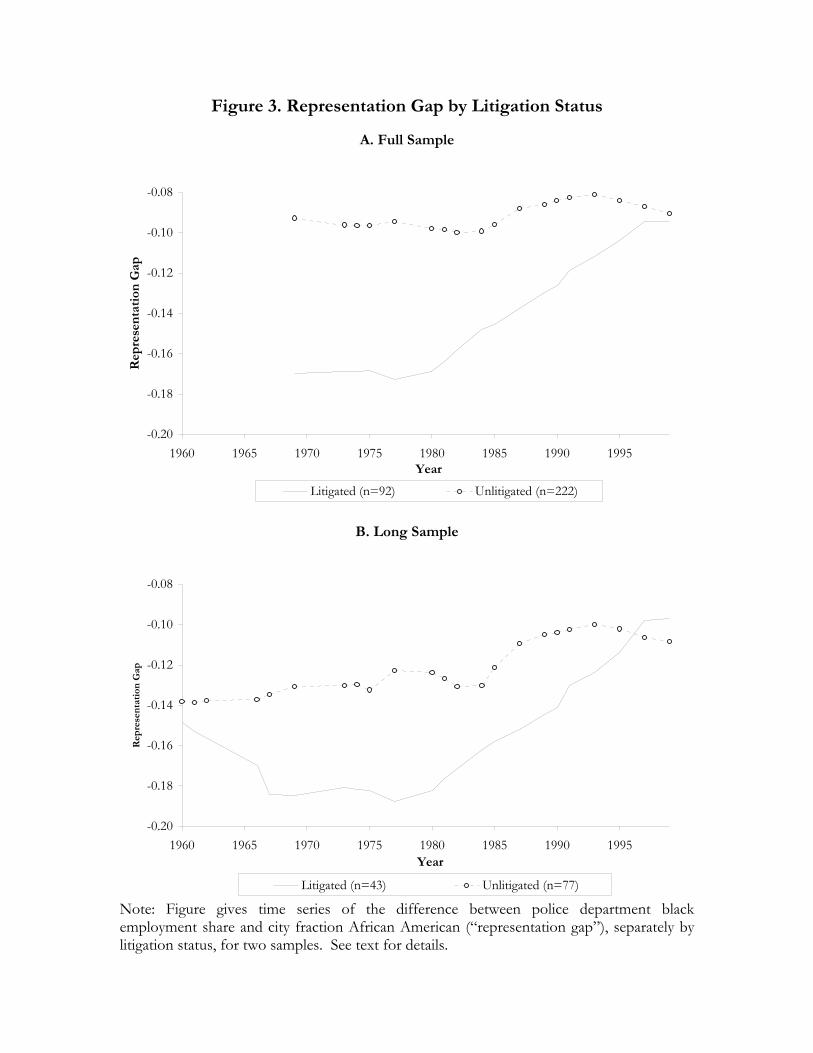
Figure 3. Representation Gap by Litigation Status
A. Full Sample
-0.20
-0.18
-0.16
-0.14
-0.12
-0.10
-0.08
1960 1965 1970 1975 1980 1985 1990 1995Year
Rep
rese
ntat
ion
Gap
Litigated (n=92) Unlitigated (n=222)
B. Long Sample
-0.20
-0.18
-0.16
-0.14
-0.12
-0.10
-0.08
1960 1965 1970 1975 1980 1985 1990 1995Year
Rep
rese
ntat
ion
Gap
Litigated (n=43) Unlitigated (n=77)
Note: Figure gives time series of the difference between police department black employment share and city fraction African American (“representation gap”), separately by litigation status, for two samples. See text for details.

Figure 4. Histograms of Litigation Filing Dates
A. Unweighted
0
2
4
6
8
10
12
14
16
1969 1974 1979 1984 1989 1994 1999
Year
Num
ber o
f Citi
es L
itiga
ted
B. Weighted by 1970 City Population
0
1
2
3
4
5
6
7
8
9
10
1969 1974 1979 1984 1989 1994 1999
Year
Popu
latio
n (in
Mill
ions
) Liti
gate
d

Figure 5. Event Study Estimates of the Impact of Litigation on the Representation Gap
A. Full Sample
-0.04
0
0.04
0.08
0.12
0.16
-11 -6 -1 4 9 14 19 24
Years Since Litigation Filing Date
Rep
rese
ntat
ion
Gap
Con
verg
ence
Model 1: Year Effects Only Model 2: Region by Year EffectsModel 3: Division by Year Effects Model 4: State by Year Effects
B. Long Sample
-0.04
0
0.04
0.08
0.12
0.16
-11 -6 -1 4 9 14 19 24
Years Since Litigation Filing Date
Rep
rese
ntat
ion
Gap
Con
verg
ence
Model 1: Year Effects Only Model 2: Region by Year EffectsModel 3: Division by Year Effects Model 4: State by Year Effects

Figure 6. A Direct Test of the Litigation Threat Effect Hypothesis
A. Unlitigated in Full Sample
-0.04
0
0.04
0.08
0.12
0.16
-11 -6 -1 4 9 14 19 24
Years Since Neighbor's Litigation Filing Date
Rep
rese
ntat
ion
Gap
Con
verg
ence
Model 1: Year Effects Only Model 2: Region by Year EffectsModel 3: Division by Year Effects Model 4: State by Year Effects
B. Unlitigated in Long Sample
-0.04
0
0.04
0.08
0.12
0.16
-11 -6 -1 4 9 14 19 24
Years Since Neighbor's Litigation Filing Date
Rep
rese
ntat
ion
Gap
Con
verg
ence
Model 1: Year Effects Only Model 2: Region by Year EffectsModel 3: Division by Year Effects Model 4: State by Year Effects

Figure 7. Police Performance Measures, by Litigation Status
A. Aggregate Inputs and Outputs
4.90
5.40
5.90
6.40
6.90
7.40
7.90
8.40
8.90
1960 1965 1970 1975 1980 1985 1990 1995 2000
Log
Pol
ice,
Log
Cri
me
Rat
e
0
0.1
0.2
0.3
0.4
0.5
0.6
0.7
0.8
Arr
est,
Cle
aran
ce R
ate
Log Police per 100,000 Population, Unlitigated Log Police per 100,000 Population, LitigatedLog Crimes per 100,000 Population, Unlitigated Log Crimes per 100,000 Population, LitigatedArrests per Crime, Unlitigated Arrests per Crime, LitigatedClearance Rate, Unlitigated Clearance Rate, Litigated
Log Crimes
Arrests per Crime
Clearance Rate
Log Police
Note: Arrests per crime shifted by 10 percentage points for viewing purposes.
B. Racial Composition of Arrests
0.10
0.15
0.20
0.25
0.30
0.35
0.40
0.45
0.50
0.55
0.60
1960 1965 1970 1975 1980 1985 1990 1995 2000
Fra
ctio
n A
fric
an A
mer
ican
City Fraction Black, Unlitigated City Fraction Black, LitigatedFraction Black, Index Arrests, Unlitigated Fraction Black, Index Arrests, Litigated
Arrest Fraction Black
City Fraction Black

Figure 8. Event Study Estimates of the Impact of Litigation on Police Performance
A. Log Crime per 100,000 Population
-0.16
-0.12
-0.08
-0.04
0
0.04
0.08
0.12
0.16
-11 -6 -1 4 9 14 19 24
Years Since Litigation Filing Date
Est
imat
ed E
ffect
of L
itiga
tion
Model 1: Year Effects Only Model 2: Region by Year EffectsModel 3: Division by Year Effects Model 4: State by Year Effects
B. Clearance Rates
-0.1
-0.06
-0.02
0.02
-11 -6 -1 4 9 14 19 24
Years Since Litigation Filing Date
Est
imat
ed E
ffect
of L
itiga
tion
Model 1: Year Effects Only Model 2: Region by Year EffectsModel 3: Division by Year Effects Model 4: State by Year Effects
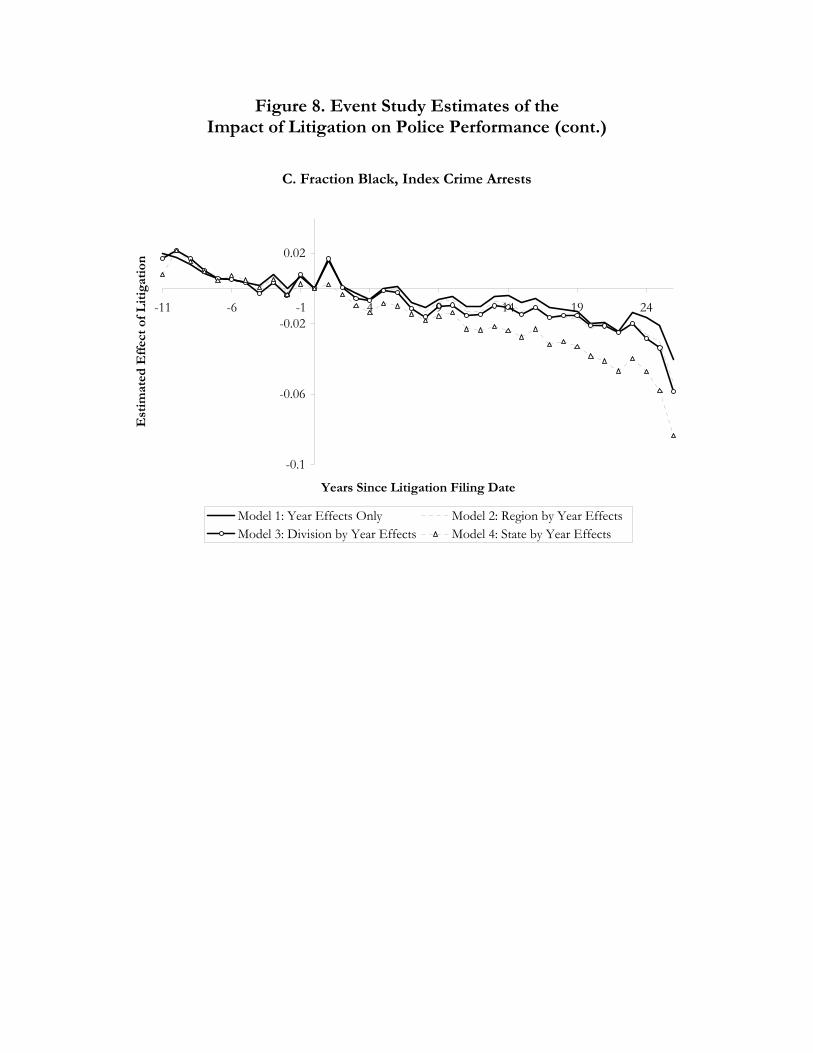
Figure 8. Event Study Estimates of the Impact of Litigation on Police Performance (cont.)
C. Fraction Black, Index Crime Arrests
-0.1
-0.06
-0.02
0.02
-11 -6 -1 4 9 14 19 24
Years Since Litigation Filing Date
Est
imat
ed E
ffect
of L
itiga
tion
Model 1: Year Effects Only Model 2: Region by Year EffectsModel 3: Division by Year Effects Model 4: State by Year Effects

Figure 9. Entrance Exam Score Distributions by Race, NYCPD
A. 1979 Exam
0.00
0.01
0.02
0.03
0.04
0.05
0.06
0.07
0.08
70 75 80 85 90 95 100 105
Exam Score
Frac
tion
of A
pplic
ants
Atta
inin
g Sc
ore
Pooled African American and Latino applicants
White applicants
B. 1998-1999 Exams
0.00
0.01
0.02
0.03
0.04
0.05
30 40 50 60 70 80
Exam Score
Frac
tion
of A
pplic
ants
Atta
inin
g Sc
ore
Pooled African American and Latino applicants
White applicants
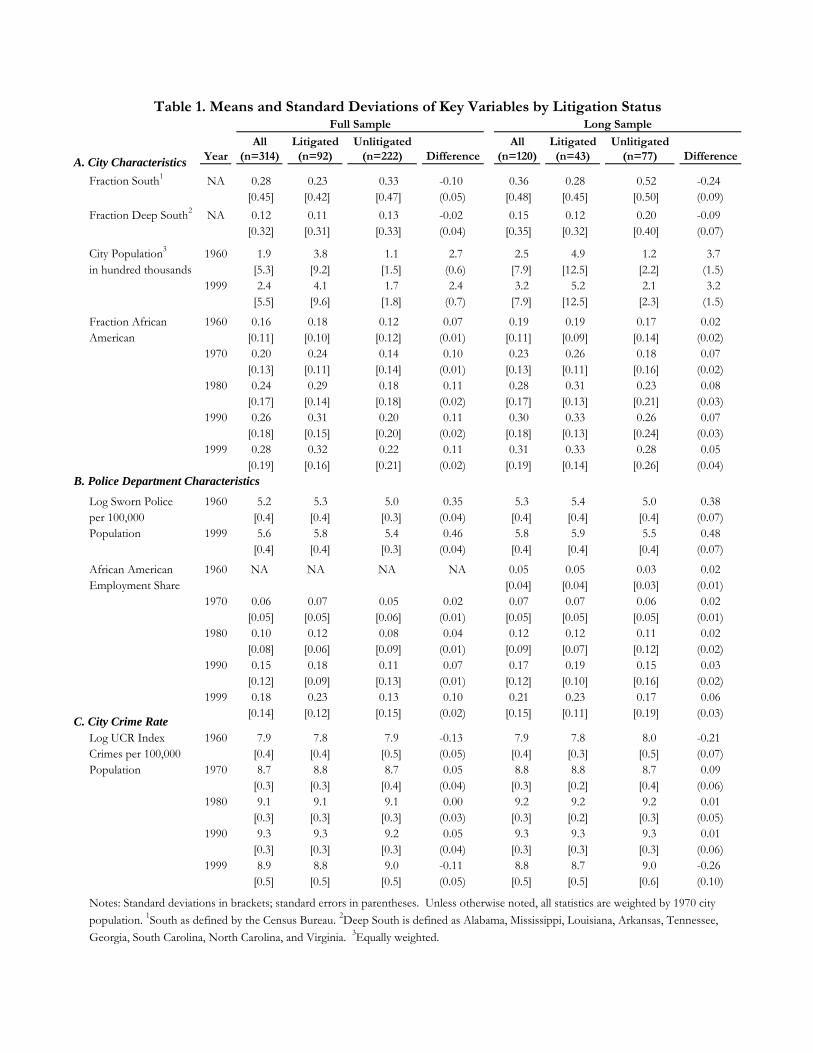
Table 1. Means and Standard Deviations of Key Variables by Litigation StatusFull Sample Long Sample
YearAll
(n=314)Litigated (n=92)
Unlitigated (n=222) Difference
All (n=120)
Litigated (n=43)
Unlitigated (n=77) Difference
Fraction South1 NA 0.28 0.23 0.33 -0.10 0.36 0.28 0.52 -0.24 [0.45] [0.42] [0.47] (0.05) [0.48] [0.45] [0.50] (0.09)
Fraction Deep South2 NA 0.12 0.11 0.13 -0.02 0.15 0.12 0.20 -0.09 [0.32] [0.31] [0.33] (0.04) [0.35] [0.32] [0.40] (0.07)
City Population3 1960 1.9 3.8 1.1 2.7 2.5 4.9 1.2 3.7 in hundred thousands [5.3] [9.2] [1.5] (0.6) [7.9] [12.5] [2.2] (1.5)
1999 2.4 4.1 1.7 2.4 3.2 5.2 2.1 3.2 [5.5] [9.6] [1.8] (0.7) [7.9] [12.5] [2.3] (1.5)
Fraction African 1960 0.16 0.18 0.12 0.07 0.19 0.19 0.17 0.02 American [0.11] [0.10] [0.12] (0.01) [0.11] [0.09] [0.14] (0.02)
1970 0.20 0.24 0.14 0.10 0.23 0.26 0.18 0.07 [0.13] [0.11] [0.14] (0.01) [0.13] [0.11] [0.16] (0.02)
1980 0.24 0.29 0.18 0.11 0.28 0.31 0.23 0.08 [0.17] [0.14] [0.18] (0.02) [0.17] [0.13] [0.21] (0.03)
1990 0.26 0.31 0.20 0.11 0.30 0.33 0.26 0.07 [0.18] [0.15] [0.20] (0.02) [0.18] [0.13] [0.24] (0.03)
1999 0.28 0.32 0.22 0.11 0.31 0.33 0.28 0.05 [0.19] [0.16] [0.21] (0.02) [0.19] [0.14] [0.26] (0.04)
B. Police Department CharacteristicsLog Sworn Police 1960 5.2 5.3 5.0 0.35 5.3 5.4 5.0 0.38 per 100,000 [0.4] [0.4] [0.3] (0.04) [0.4] [0.4] [0.4] (0.07)Population 1999 5.6 5.8 5.4 0.46 5.8 5.9 5.5 0.48
[0.4] [0.4] [0.3] (0.04) [0.4] [0.4] [0.4] (0.07)
African American 1960 NA NA NA NA 0.05 0.05 0.03 0.02 Employment Share [0.04] [0.04] [0.03] (0.01)
1970 0.06 0.07 0.05 0.02 0.07 0.07 0.06 0.02 [0.05] [0.05] [0.06] (0.01) [0.05] [0.05] [0.05] (0.01)
1980 0.10 0.12 0.08 0.04 0.12 0.12 0.11 0.02 [0.08] [0.06] [0.09] (0.01) [0.09] [0.07] [0.12] (0.02)
1990 0.15 0.18 0.11 0.07 0.17 0.19 0.15 0.03 [0.12] [0.09] [0.13] (0.01) [0.12] [0.10] [0.16] (0.02)
1999 0.18 0.23 0.13 0.10 0.21 0.23 0.17 0.06 [0.14] [0.12] [0.15] (0.02) [0.15] [0.11] [0.19] (0.03)
Log UCR Index 1960 7.9 7.8 7.9 -0.13 7.9 7.8 8.0 -0.21 Crimes per 100,000 [0.4] [0.4] [0.5] (0.05) [0.4] [0.3] [0.5] (0.07)Population 1970 8.7 8.8 8.7 0.05 8.8 8.8 8.7 0.09
[0.3] [0.3] [0.4] (0.04) [0.3] [0.2] [0.4] (0.06)1980 9.1 9.1 9.1 0.00 9.2 9.2 9.2 0.01
[0.3] [0.3] [0.3] (0.03) [0.3] [0.2] [0.3] (0.05)1990 9.3 9.3 9.2 0.05 9.3 9.3 9.3 0.01
[0.3] [0.3] [0.3] (0.04) [0.3] [0.3] [0.3] (0.06)1999 8.9 8.8 9.0 -0.11 8.8 8.7 9.0 -0.26
[0.5] [0.5] [0.5] (0.05) [0.5] [0.5] [0.6] (0.10)
Notes: Standard deviations in brackets; standard errors in parentheses. Unless otherwise noted, all statistics are weighted by 1970 city population. 1South as defined by the Census Bureau. 2Deep South is defined as Alabama, Mississippi, Louisiana, Arkansas, Tennessee, Georgia, South Carolina, North Carolina, and Virginia. 3Equally weighted.
A. City Characteristics
C. City Crime Rate
Table 2. Means and Standard Deviations of Key Variables by Litigation Timing
Year
Litigated 1969-71 (n=19)
Litigated 1972-73 (n=17)
Litigated 1974-76 (n=18)
Litigated 1977-80 (n=18)
Litigated 1981-2000
(n=20)A. City CharacteristicsFraction South NA 0.07 0.24 0.50 0.15 0.23 Fraction Deep South NA 0.03 0.10 0.25 0.12 0.06
City Population 1960 4.4 8.5 3.1 2.7 0.9 in hundred thousands [8.8] [18.1] [2.4] [5.6] [0.5]
1999 4.0 8.5 3.7 3.4 1.2 [7.0] [18.8] [3.6] [8.4] [0.5]
Fraction African 1960 0.20 0.19 0.21 0.15 0.08 American [0.09] [0.09] [0.12] [0.08] [0.10]
1970 0.27 0.27 0.23 0.19 0.12 [0.11] [0.11] [0.11] [0.07] [0.13]
1980 0.32 0.32 0.29 0.20 0.15 [0.13] [0.13] [0.13] [0.09] [0.16]
1990 0.33 0.35 0.32 0.20 0.16 [0.12] [0.13] [0.15] [0.11] [0.17]
1999 0.33 0.36 0.36 0.21 0.19 [0.12] [0.14] [0.18] [0.14] [0.18]
B. Police Department CharacteristicsLog Sworn Police 1960 5.6 5.5 5.1 5.1 4.9 per 100,000 Population [0.2] [0.4] [0.3] [0.2] [0.4]
1999 6.0 6.0 5.5 5.6 5.4 [0.3] [0.3] [0.2] [0.2] [0.4]
African American 1960 0.081 0.041 0.041 NA NA Employment Share [0.05] [0.01] [0.04]
1970 0.12 0.06 0.05 0.04 0.04 [0.07] [0.03] [0.03] [0.02] [0.05]
1980 0.16 0.12 0.10 0.09 0.05 [0.06] [0.06] [0.05] [0.03] [0.05]
1990 0.21 0.19 0.19 0.15 0.08 [0.07] [0.10] [0.10] [0.05] [0.08]
1999 0.26 0.25 0.24 0.16 0.09 [0.09] [0.11] [0.15] [0.06] [0.08]
C. City Crime RateLog UCR Index Crimes 1960 7.8 7.8 7.8 8.1 7.8 per 100,000 Population [0.3] [0.2] [0.2] [0.5] [0.5]
1970 8.6 8.9 8.7 8.8 8.6 [0.4] [0.2] [0.2] [0.2] [0.5]
1980 9.0 9.2 9.1 9.2 9.1 [0.3] [0.1] [0.3] [0.2] [0.5]
1990 9.3 9.3 9.3 9.2 9.2 [0.4] [0.2] [0.4] [0.2] [0.5]
1999 9.0 8.7 9.1 8.8 8.8 [0.3] [0.5] [0.3] [0.3] [0.6]
Notes: Standard deviations in brackets. Estimates presented are based on the full sample only, unlessotherwise noted. 1 Estimates for 1969-71, 1972-73, and 1974-76 taken from the 11, 9, and 8 respective cities inthe long sample with litigation dates in the given categories. Estimates for other litigation date ranges omittedbecause long sample cities do not appear to be representative.

Table 3. Parametric Estimates of the Impact of Litigation on the Representation Gap
A. Full Sample EstimatesAll 314 Cities 92 Litigated Cities Only
Model 1 Model 2 Model 3 Model 4 Model 1 Model 2 Model 3 Model 4
(1) (2) (3) (4) (5) (6) (7) (8)
25 * Post- 0.060 0.096 0.097 0.121 0.057 0.107 0.107 0.154 Litigation Trend (0.031) (0.022) (0.024) (0.018) (0.066) (0.046) (0.045) (0.032)
255 Cities Identifying Model 4 Reweighting the UnlitigatedModel 1 Model 2 Model 3 Model 4 Model 1 Model 2 Model 3 Model 4
(9) (10) (11) (12) (13) (14) (15) (16)
25 * Post- 0.055 0.101 0.101 0.121 0.033 0.073 0.072 0.113 Litigation Trend (0.033) (0.026) (0.027) (0.018) (0.032) (0.028) (0.032) (0.022)
B. Long Sample EstimatesAll 120 Cities 43 Litigated Cities Only
Model 1 Model 2 Model 3 Model 4 Model 1 Model 2 Model 3 Model 4
(17) (18) (19) (20) (21) (22) (23) (24)
25 * Post- 0.048 0.097 0.102 0.162 0.049 0.106 0.108 0.158 Litigation Trend (0.046) (0.042) (0.047) (0.025) (0.062) (0.052) (0.054) (0.035)
25 * Post-Pre 0.123 0.179 0.175 0.283 0.041 0.162 0.158 0.278 Trend Difference (0.059) (0.061) (0.060) (0.045) (0.091) (0.055) (0.056) (0.040)
86 Cities Identifying Model 4 Reweighting the UnlitigatedModel 1 Model 2 Model 3 Model 4 Model 1 Model 2 Model 3 Model 4
(25) (26) (27) (28) (29) (30) (31) (32)
25 * Post- 0.100 0.121 0.118 0.162 0.036 0.094 0.095 0.156 Litigation Trend (0.071) (0.056) (0.057) (0.025) (0.046) (0.041) (0.046) (0.032)
25 * Post-Pre 0.172 0.199 0.189 0.283 0.134 0.183 0.173 0.289 Trend Difference (0.107) (0.070) (0.068) (0.034) (0.069) (0.067) (0.063) (0.041)
Notes: Standard errors, clustered at the level of the city and adjusted for degrees of freedom, presented in parentheses. PanelA presents estimates of the annual gain (times 25) in representation gap in the years following litigation for four choices ofspecification, three subsets of the full sample, and two different weighting schemes. The four specifications correspond tothose from Figure 5: year effects only, region-by-year effects, division-by-year effects, and state-by-year effects. Estimates incolumns (13) to (16) are weighted by a factor that approximately equalizes in distribution the 1969 representation gap forlitigated and unlitigated cities (see text for details). Panel B is organized identically, but is based on the 120 cities in the longsample. Panel B additionally reports the difference in post-litigation and pre-litigation annual gains in representation gap.

Table 4. Parametric Estimates of the Impact of Litigation on Police Performance
Log Police per 100,000 Population Log Crime per 100,000 PopulationModel 1 Model 2 Model 3 Model 4 Model 1 Model 2 Model 3 Model 4
(1) (2) (3) (4) (5) (6) (7) (8)
25 * Post- -0.014 0.012 0.016 0.025 -0.077 -0.088 -0.080 -0.044 Litigation Trend (0.031) (0.027) (0.029) (0.036) (0.137) (0.062) (0.059) (0.050)
25 * Post-Pre -0.021 -0.016 -0.054 -0.104 -0.211 -0.078 -0.111 -0.024 Trend Difference (0.084) (0.063) (0.060) (0.057) (0.365) (0.153) (0.145) (0.116)
Arrest Rate Clearance RateModel 1 Model 2 Model 3 Model 4 Model 1 Model 2 Model 3 Model 4
(9) (10) (11) (12) (13) (14) (15) (16)
25 * Post- -0.072 -0.077 -0.078 -0.229 -0.044 -0.029 -0.035 -0.048 Litigation Trend (0.059) (0.059) (0.061) (0.151) (0.041) (0.038) (0.040) (0.032)
25 * Post-Pre 0.114 0.039 0.012 -0.275 -0.001 0.023 0.006 0.030 Trend Difference (0.145) (0.097) (0.095) (0.211) (0.058) (0.054) (0.058) (0.048)
Fraction Black, All Arrests Fraction Black, All Index ArrestsModel 1 Model 2 Model 3 Model 4 Model 1 Model 2 Model 3 Model 4
(17) (18) (19) (20) (21) (22) (23) (24)
25 * Post- 0.007 0.004 0.002 -0.023 -0.026 -0.033 -0.033 -0.054 Litigation Trend (0.023) (0.020) (0.018) (0.019) (0.020) (0.020) (0.018) (0.017)
25 * Post-Pre 0.004 -0.004 -0.006 -0.041 0.003 -0.005 -0.004 -0.035 Trend Difference (0.043) (0.038) (0.038) (0.039) (0.052) (0.044) (0.044) (0.045)
Notes: Standard errors, clustered at the level of the city, presented in parentheses.
Table 5. New York City Police DepartmentEntrance Examination Scores by Race, 1968-1999
July 1968 Examination May 1970 Examination
DecileScore Range
White Fraction
Black Fraction
Score Range
White Fraction
Black Fraction
1 96-100 12.9 2.3 94-100 12.7 2.92 90-96 12.9 2.6 92-94 12.1 4.03 86-90 12.8 3.5 89-92 11.8 5.54 82-86 12.0 6.8 87-89 12.2 4.25 78-82 10.2 13.3 84-87 10.8 8.06 73-78 10.6 9.1 80-84 10.5 9.37 69-73 7.1 14.8 76-80 9.8 10.48 63-69 7.1 15.9 70-76 8.6 13.89 56-63 8.2 11.2 61-70 7.1 17.910 29-56 6.2 20.6 0-61 4.5 24.2
N 2,774 725 4,511 1,002
June 1979 Examination1 Pooled 1998-1999 Examinations1
DecileScore Range
White Fraction
Black Fraction2
Score Range
White Fraction
Black Fraction2
1 99-110 10.0 3.9 75-85 16.2 4.12 97-98 15.4 5.1 72-74 13.5 5.33 95-96 15.4 8.3 69-71 14.8 8.04 93-94 13.1 9.4 66-68 13.8 9.25 91-92 11.4 10.4 63-65 11.4 10.76 89-90 8.8 10.9 60-62 9.1 11.27 86-88 9.1 14.1 56-59 8.5 14.68 81-85 9.3 17.9 51-55 6.8 15.39 71-80 7.1 18.9 41-50 4.7 15.910 0-70 NA NA 0-40 1.2 5.6
N 19,109 9,858 13,009 11,197
Notes: 1Because of test score aggregation, score ranges are approximate deciles. 2Black includesAfrican Americans and Latinos. For the 1968 and 1970 examinations, the distribution of scoresis available separately for African Americans and Latinos. The distributions for these two groupsare quite similar.