Embed Size (px)
Citation preview
NBER WORKING PAPER SERIES
THE INEFFECTIVENESS OF EFFECTIVETAX RATES ON BUSINESS INVESTMENT
Robert S. Chirinko
Working Paper No. 1704
NATIONAL BUREAU OF ECONOMIC RESEARCH1050 Massachusetts Avenue
Cambridge, MA 02138September 1985
The author would like to give particular thanks to Robert Eisnerand Robert Gordon for their extensive criticisms and assistance ona previous draft presented at the 1981 Winter Meeting of theEconometric Society. Helpful comments have also been provided byCraig Hakkio, Fumio Hayashi, Patric Hendershott, Stephen King,Andrew Lyon, Michael Marrese, Robert McDonald, Arlie Sterling,Lawrence Summers, and two anonymous referees. Financial supportfrom the Social Science Research Council, the Hoover Institution,and the National Science Foundation under Grant No. SES-83O9O73 isgratefully acknowledged. All errors, omissions, and conclusionsremain the sole responsibility of the author. The researchreported here is part of the NBER's research programs in EconomicFluctuations and Taxation and project in Government Budget. Anyopinions expressed are those of the author and not those of theNational Bureau of Economic Research.
NBER Working Paper l7O4September 1985
The Ineffectiveness of EffectiveTax Rates on Business Investment
ABSTRACT
In his F1sher-Schultz Lecture, Martin Feldstein examined the effects of
non—neutral tax rules on busIness Investment by estimating three econometric
models, and he concluded that 'the rising rate of inflation has, because of the
structure of existing U.S. tax rules, substantially discouraged investment In
the past 15 years." In a detailed examination of Feldstein's Effective Tax
Rate model and a less extensive review of his other formulations (Neoclassical
and Return—Over-Cost models), a number of important and independent criticisms
are advanced. Our results from examining all three models suggest strongly
that taxes have not adversely affected capital formation during the recent
episode of inflation, a conclusion consistent with the relatively robust levels
of net Investment between 1965 and 1981 actually shown in the newly benchmarked
National Income data.
Robert S. ChirinkoCommittee on Policy StudiesUniversity of Chicago1050 E. 59th StreetChicago, IL 60637(312) 962—8400
THE INEFFECTIVENESS OF EFFECTIVE TAX RATES ON BUSINESS INVESTNT
I. INTRODUCTION
An incorrectly perceived decline in the rate of capital formation
during the recent episode of inflation, coupled with the recognition of
non—neutralities in the tax system, has renewed interest by both policy—
makers and academic economists in the relationships between taxes and
investment. Chief among these non—neutralities are the depreciation of
fixed assets based on historical purchase costs, firstjn, first—out
accounting rules, the taxation of nominal capital gains and interest
receipts, and the tax deductibility of nominal interest payments. The
resulting impact on investment incentives has been investigated inten-
sively and a general conclusion from these theoretical studies is that
inflation, by increasing taxes on capital, can have significant adverse
effects on capital formation.
Within the context of this broad research program, Martin Feldstein (1982)
devoted the Fisher—Schultz Lecture to examining non—neutral tax rules by
estimating two new investment models, Effective Tax Rate and Return—
Over—Cost, as well as the familiar Neoclassical model. Based on the
econometric results from three different models, Feldstein concluded
that "the rising rate of inflation has, because of the structure of
existing U.S. tax rules, substantially discouraged investment in the
past 15 years" (Feldstein, 1982, p. 860).

"-7—
tn this paper, we offer a detailed examination of the Effective Tax
Rate model, as well as a less extensive review of the remaining
specifications, and challenge the estimates on which Feldstein based his
conclusion. Section II presents the original specification of the
Effective Tax Rate model, whose key explanatory variable is the net—of--
tax real return accruing to those with financial claims on business
capital. The original model is reestimated with the newly benchmarked
National Incoms Account data, and continues to support Feldstein's basic
conclusion that the net—of--tax real return on capital has had a signif-
icant influence on net investment.
In Section III, we argue that the rate of return variable is
inconsistent with Feldsteia's theory in not allowing for increases in
the value of the capital stock relative to the overall rate of inflation.
Introducing these net revaluations into the original specification
leads to a dramatic reversal: the rate of return variable becomes in-
significant and cyclical conditions, as measured by capacity utilization,
emerge as important.
To quantify the magnitude of the effect of non—neutral tax rules,
Feldstein showed that,if the net—of—tax real return had remained at its
1965 value, then the net investment—output ratio would have been 64%
higher than its historical value in 1978. Section IV analyzes this
methodology in terms of the original specification and finds that, due
almost evenly to data revisions and a correction in the simulation
method, the net investment—output ratio would have risen only 16%, a 75%
reduction in the previously reported effect. We then examine movements
in pretax income, depreciation, and taxes, and discover that the net—of—
tax real return, far from being depressed by taxes, would have increased
by 27.4% in 1979 if the non—tax components had maintained their 1965
values.

—3—
We conclude that the Effective Tax Rate model, when properly
specified and evaluated, does not imply that taxes have adversely
affected capital formation during the recent inflation episode and,
in Section V, we examine briefly the remaining two econometric
equations considered by Feldstein. Misspecifications relating to
the opportunity cost of funds and lag distributions may bias upward
the effect of tax parameters on investment in Feldstein's Neoclassical
specification. The Return—Over—Cost model depends crucially on the
existence of a standard investment project comprising capital assets
purchased in fixed proportions, and evidence is cited that the
proportions of equipment to structures or nonresidential capital to
the inventory stock will not be constant during an inflationary period.
Thus, for a number of independent reasons, we find that the estimates
developed in the Fisher—Schultz Lecture do not support Feldstein's
conclusion that taxes have exerted a significantly depressing effect
on net investment between the inid—1960s and the late 1970s (Section VI).
Before investigating Feldstein's econometric specifications, it
is useful to pause and examine the time series for the ratio of net
nonresidential fixed investment to output (I"/Y). The presumed decline
in this ratio between 1966 and 1978 has contributed to the belief in a

—4-.
deficient rate of capital formation, possibly caused by the excessive
taxation of capital income (e.g., Feldstein, 1982, p. 827). However,
the time pattern of I'/Y, displayed in column 1 of Table 1 and based on
the newly benchmarked National Income and Product Account (NIPA) data,
contradicts the notion that net investment has been low by historical
standards. Data are presented for the years 1953 to 1981, and the
period has been divided in 1966, the year in which 1fl/y peaked and
inflation, as measured by the overall GNP deflator, began to
accelerate. The mean of fl/y for the period 1967—1981 is 3.138, 10.2%
higher than the mean for 1953—1966 and 4.7% higher than the mean of
2.997 calculated from 1953 to 1981. A casual inspection of the data
indicates that net investment, while severely depressed by and
recovering slowiy from the OPEC shock of 1973—1974, has been very
healthy by historical standards.1
The NIPA benchmark revisions, undertaken periodically and most
recently in December 1980, resulted in significant increases in both the
level and growth rate of business plant and equipment expenditures,2 and
consequently in net investment. Previous estimates of 1n1/y are
displayed in column 2 of Table 1, and are markedly lower than the most
recent figures, though the mean for 1967—1978 continues to exceed the
mean for the entire period. The magnitude and timing of the discrepancy
resulting from the new and old data are highlighted by the level and
percentage differences, displayed in columns 3 and 4, respectively.
Persistent discrepancies between the ft/y series emerge in 1970, and
become more pronounced from 1975 through 1978. Thus, the concern for a
"capital shortage", due to the presence of non—neutral tax rules in the
inflationary 1970s, may be largely displaced by the benchmark revisions in
the NIPA data.

—5—
TABLE IRATIO OF NET NONRESIDENTIAL FIXED INVES ENT TO OUTPUT
OLD AND NEWLY REVISED DATA
(percent)Year Ir/Y I'/Y Coig. Cols.
(New Data) (Old Data) (1)—(2) (3)/(2)(1) (2) (3) (4)
1953 2.806 2.700 .106 3.9371954 2.386 2.300 .086 3.7381955 2.890 2.800 .090 3.2051956 3.142 3.100 .042 1.3471957 2.983 2.900 .083 2.8731958 1.792 1.700 .092 5.3971959 2.134 2.000 .134 6.6931960 2.387 2.200 .187 8.5191961 2.128 1.900 .228 11.9971962 2.512 2.300 .212 9.1981963 2.595 2.300 .295 12,8091964 3.115 2.900 .215 7.4141965 4.240 4.000 .240 5,9941966 4.742 4.500 .242 5.3801967 4.034 3.800 .234 6.1581968 3.875 3.700 .175 4.7261969 4.082 3.800 .282 7.4311970 3.473 3.100 .373 12.0241971 2.913 2,500 .413 16.5361972 3.120 2.800 .320 11.4281973 4.008 3.400 .608 17.8811974 3.478 3.100 .378 12.1801975 1.864 1.400 .464 33.1441976 1.969 1.500 .469 31.2421977 2.639 2.000 .639 31.9531978 3.146 2.500 .646 25.8261979 3.331 N.A. N.A. N.A.1980 2.647 N.A. N.A. N.A.1981 2,491 N.A. N.A. N.A.
Means1953—1978 3.01711 2.739 .279 11.5011953—1966 2.847 2.686 .161 6.3211967—1978 3.217 2.800 .417 17.544
Coefficients of Variation1953—1978 .263 .292 .629 .8091953—1966 .283 .293 .490 .5361967—1978 .238 .301 .373 .596
*Definitions and sources for the variables are contained in the Aoendix.11For 1953—1981, the mean value of 1n/y is 2,997.N.A., not available.
—6--
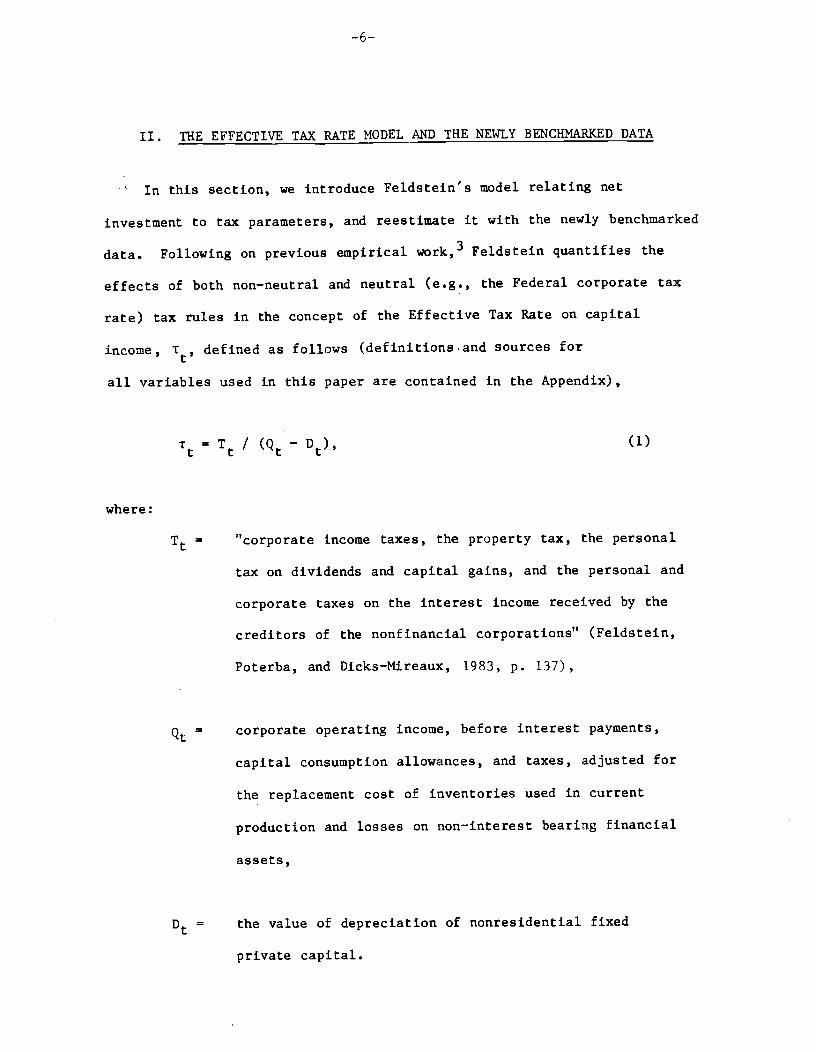
II. THE EFFECTIVE TAX RATE MODEL AND THE NEWLY BENCHNARKED DATA
In this section, we introduce Feldstein's model relating net
investment to tax parameters, and reestimate it with the newly benchmarked
data. Following on previous empirical work,3 Feldstein quantifies the
effects of both non—neutral and neutral (e.g., the Federal corporate tax
rate) tax rules in the concept of the Effective Tax Rate on capital
income, T, defined as follows (definitionsand sources for
all variables used in this paper are contained in the Appendix),
T / — Dr), (1)
where:
Tt = "corporate income taxes, the property tax, the personal
tax on dividends and capital gains, and the personal and
corporate taxes ott the interest income received by the
creditors of the nonfinancial corporations" (Feldstein,
Poterba, and Dicks—Mireaux, 1983, p. 137),
Qt = corporate operating income, before interest payments,
capital consumption allowances, and taxes, adjusted for
the replacement cost of inventories used in current
production and losses on non—interest bearing financial
assets,
Dt = the value of depreciation of nonresidential fixed
private capital.

Thus, provides a comprehensive measure of all taxes assessed on an
adjusted flow of capital income after it is eventually received by bond-
holders and equityholders4
In evaluating the effect of taxation on capital formation,
Feldstein posits that net investment is dependent on the net—of—tax real
return to capital, defined as the product of (l—T) and the net pretax
return on capital. The net pretax return, Rt, is calculated as the
return before taxes, net of depreciation expenses, accruing to those
with financial claims on the firm's capital stock,
Rt= — Dt) / K, (2)
Kt=
KPE,t + KIN,t + KL,t, (3)
where:
the replacement value of the firm's total
stock of capital at the beginning of period t,
KPE,t = the replacement cost of fixed plant and
equipment at the beginning of period t,
KIN,t = the replacement cost of inventories at the
begining of period t,
KL,t the market value of land at the beginning of
period t.
The net—of—tax real return, RN, is computed by combining (1) and (2),

—8—
= (1 — T) * Rt
= D Tt * t_ D (4)
Qt_Dt Kt
— D— T) I K.
Thus, RNt is the yield, adjusted for depreciation and taxes, on a
capital investment valued at Kt. It is, however, an average yield that
may not accurately reflect marginal returns.5
The basic hypothesis examined by Feldstein is the degree to which
net investment is affected by RNt. Using what is now considered the
"old" NIPA data, Feldstein estimated the following econometric
specification, which we label the Effective Tax Rate (ETR) model,
(IIY) = b0 + b1 UCAPt + b2 + et, (5)
where e is an orthogonal error. The term UCAPt..l is the Federal
Reserve Board's Index of Capacity Utilization for Total Manufacturing, and
captures cyclical effects. Both explanatory variables are entered lagged one
period to reflect delays in decision making, production, and delivery of
capital goods, and to avoid simultaneity (Feldstein, 1982, p. 839).6 The
ETR model was estimated with annual data and a first—order Cochrane—
Orcutt correction to remove serial correlation from the residuals.
(Estimates without the autocorrelation correction, presented in
Chirinko, 1982a, Chapter V, Table III, are not qualitatively different
from the results to be discussed in this section.)
—9—
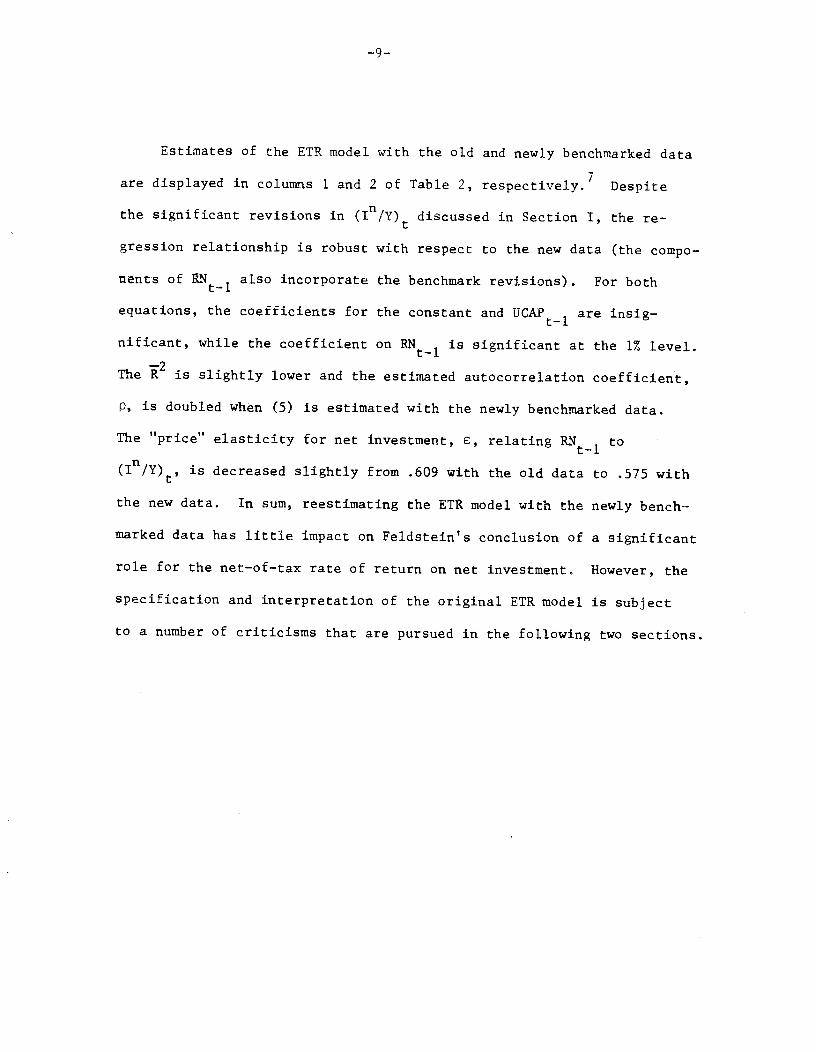
Estimates of the ETR model with the old and newly benchmarked data
are displayed in columns 1 and 2 of Table 2, respectively.7 Despite
the significant revisions in (1n/Y) discussed in Section I, the re-
gression relationship is robust with respect to the new data (the compo—
nnts of also incorporate the benchmark revisions). For both
equations, the coefficients for the constant and UCAP are insig—
nificant, while the coefficient on is significant at the 1% level.
The 2 is slightly lower and the estimated autocorrelation coefficient,
p, is doubled when (5) is estimated with the newly benchmarked data.
The "price" elasticity for net investment, E, relating to
(I'/Y), is decreased slightly from .609 with the old data to .575 with
the new data. In sum, reestimating the ETR model with the newly bench--
marked data has little impact on Feldstein's conclusion of a significant
role for the net—of—tax rate of return on net investment. However, the
specification and interpretation of the original ETR model is subject
to a number of criticisms that are pursued in the following two sections.

—10—
TABLE 2ESTIMATED EQUATIONS
THE ORIGINAL AND MODIFIED EFFECTIVE TAX RATE MODELS*
Dependent Variable = (Inh/Y)t
Original ModifiedVariable or Old Data New Data New Data New DataStatistic
(1) (2) (3) (4)Constant —2.091 —.611 —2.908 —1.555
(1.756) (1.709) (2.245) (1.932)
UCAP —1 .038 .023 .065 .054t (.023) (.022) (.028) (.023)
(.087) (.094)
RNNR# .130t—1
(.091)
RNNR@ 1.018ti
——— ——— —-— (.006)p .250 .466 .398 .644
(.198) (.173) (.180) (.150)
.766 .725 .504 .607
.391 .405 .543 .483Durbln—Watson 1.959 2.052 1.698 2.006Res. Sum Sq. 3.209 3.764 6.782 5.371Mean of Dep. Var. 2.758 3.048 3.048 3.048Mean of "Price" Var. 3.841 3.995 4.046 6.379"Price" Elasticity, c .609 .575 .173 .038
Observations 24 26 26 26F 2.71 .59 1.04
*Estimates in column 1 are for the period 1955—1978 and in columns 2—4for the period 1955—1980. Definitions and sources for the variablesare contained in the Appendix. Standard errors itt parentheses.
Net revaluations in RNNR 1 are based on the price of new plant andequipment.
@Nt revaluations in RNNR 1 are based on Standard & Poor's compositestock price index.
+F statistic for the Chow test; breakpoint between 1966 and 1967.

—11—
III. NET REVALUATIONS OF THE CAPITAL STOCK
The key variable in the Effective Tax Rate model, is defined
as the income flow, net of taxes and depreciation, accruing to
bondholders and equityholders relative to their capital investment at
the beginning of the period (see (4)). In general, however, thisinconsistent with Feldstein's
measure is / model in not allowing for capital gains on the initial
8investment relative to the overall rate of inflation. Consideration of
these net revaluations of capital leads to a modified definition of the
net—of—tax real return,
=RN + (6)
NRt= . (Kj,t / K) — (7)
j cJ
where: RRt = net—of—tax real return with net
revaluations of capital,
NRt= net revaluations of capital,
the percentage change in the value of the
jth type of capital,
the overall rate of inflation,
J = plant and equipment (PE), Inventories
(IN), or land (L).
Under the assumption that changes in the value of capital have been
matched by inflation, the original and modified definitions of the rate
of return will be equal.

—12—
Changes in the value of existing (tangible) capital — plant,
equipment, Inventories, land can be measured by changes in the
value of new capital, calculated from published price deflators.9
While price series for plant and equipment can be readily obtained, no
suitable sources exist for the prices of land and inventories.10 These
latter deficiencies arise because transactions in land occur infrequently
and the NIPA inventory price index applies to the end of the period and
is heavily influenced by changes in the composition of Inventory stocks.
Rather than utilizing poor proxies, we have decided to omit changes in
the prices of inventories and land from NRt,
= .65 * — 'pt,
where .65 is the share of plant and equipment in the firm's total tangible
capital stock (Feldstein, et. al., 1983, p. 134, fn. 13). The overall
rate of inflation is calculated from the implicit price deflator for GNP.
The net—of—tax real returns with and without the addition of net
revaluations of the stock of plant and equipment, and the level and
percentage differences between these two series are displayed in Table
3, columns 1 through 4, respectively. The introduction of net
revaluations reduces the dispersion of the means of the rate of return
series in the sub—sample periods and only slightly affects the
coefficients of variation. The largest positive percentage increases in
NR relative to occur in 1956—1957 and 1974—1975, which are also the
years that witnessed the largest inflation rates in the first and second
parts of the sample. Given the non—neutral tax rules that are reflected
in Tt. displayed in column 5, it is not surprising that the effective
—13—
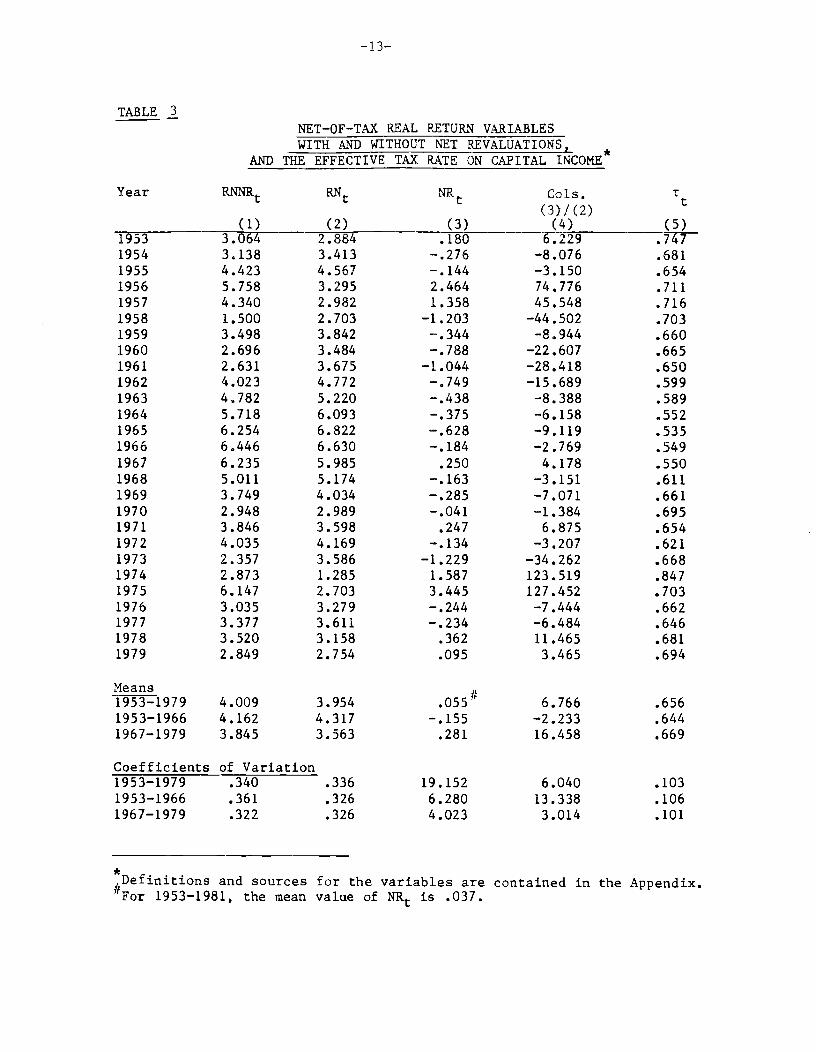
TABLE 3NET-OF-TAX REAL RETURN VARIABLESWITH AND WITHOUT NET REVALUATIONS, *
AND THE EFFECTIVE TAX RATE ON CAPITAL INCOME
Year RNN1 NRt Cols. T
(3)/(2)t
(1) (2) (3) (4) (5)1953 3.064 2.884 .180 6.229 .7471954 3.138 3.413 —.276 —8.076 .681
1955 4.423 4.567 —.144 —3.150 .6541956 5.758 3.295 2.464 74.776 .7111957 4.340 2.982 1.358 45.548 .7161958 1.500 2.703 —1.203 —44.502 .7031959 3.498 3.842 —.344 —8.944 .6601960 2.696 3.484 —.788 —22.607 .6651961 2.631 3.675 —1.044 —28.418 .6501962 4.023 4.772 —.749 —15.689 .5991963 4,782 5.220 —.438 —8.388 .5891964 5.718 6.093 —.375 —6.158 .5521965 6.254 6.822 —.628 —9.119 .5351966 6.446 6.630 —.184 —2.769 .5491967 6.235 5.985 .250 4.178 .5501968 5.011 5.174 —.163 —3.151 .6111969 3.749 4.034 —.285 —7.071 .6611970 2.948 2.989 —.041 —1.384 .6951971 3.846 3.598 .247 6.875 .6541972 4.035 4.169 —.134 —3.207 .6211973 2.357 3.586 —1.229 —34.262 .6681974 2.873 1.285 1.587 123.519 .8471975 6,147 2.703 3.445 127.452 .7031976 3.035 3.279 —.244 —7.444 .6621977 3.377 3.611 —.234 —6.484 .6461978 3.520 3.158 .362 11.465 .6811979 2.849 2.754 .095 3.465 .694
Means1953—1979 4.009 3.954 .055# 6.766 .6561953—1966 4.162 4.317 —.155 —2.233 .6441967—1979 3.845 3.563 .281 16.458 .669
Coefficients of Variation1953—1979 .340 .336 19.152 6.040 .1031953—1966 .361 .326 6.280 13.338 .1061967—1979 .322 .326 4.023 3.014 .101
Definitions and sources for the variables are contained in the Appendix.For 1953—1981, the mean value of NRt is .037.

—14—
tax rate was also very high in these years. Thus, net revaluations will
tend to mitigate the impact of effective tax rates in the ETR model.
In order to test the importance of net revaluations, the original
ETR model is modified by replacing with RNNRt1. Estimates based
on the original and modified models are presented in columns 2 and 3 of
Table 2, respectively, and offer a striking reversal of the influence
of the capacity and rate of return variables on net investment. The
coefficient (and the implied elasticity) on the adjusted rate of return
falls by 70%, and is no longer statistically different from zero, even
at the 10% level.11 However, cyclical factors, represented by UCAPt1,
become statistically significant at the 5% level.
As a further test of the modified ETR model, we measure changes
in the value of existing capital by changes in financial capital, calcu-
lated from Standard & Poor's composite stock price index (SF).12 The
resulting parameter estimates allow for an assessment of the robustness
of our econometric evidence, and are presented in column 4 of Table 2.
The of .607 is bracketed by the 12 statistics from the previous re-
gressions and, unlike these results, both UCAP and RNNRt 1 prove
statistically significant. However, the elasticity for RNNR1is only
.038, indicating a quantitatively unimportant role for the rate of
return variable.
Additional support for including net revaluations is obtained
when the original and both modified ETR models are tested for structural
stability. Following Feldstein, we split the sample between 1966 and
1967 and, at the 10% level, the appropriate F statistic (shown in Table
2) indicates that the original ETR model is unstableJ3However, the
null hypothesis of structural stability can not be rejected with the
modified ETR model using either measure of the value of existing capital.14
in sum, the econometric results discussed in this section indicate
a significant niisspecification in the original ETR model, and a dramatic
reversal in the roles of price and output variables on net investment.
While the modified ETR model may be just another "false model" (to use
Feldsteints terminology), it is the model consistent with the theoretical
ideas presented in the Fisher—Schultz Lecture.

—16—
IV. THE IMPACT OF AXE, THE GROSS PRETAX RETURN AND DEPRECIATION
ON THE RATE OF RETURN AND NET INVESTMENT
The analyses of the ETR model developed in Sections II and III have
focused on the statistical significance of coefficients. While
appropriately large t—statistlcs are necessary in order to ascribe
explanatory power to independent variables, further information can be
obtained by calculating the magnitude of the effects implied by the
estimated coefficients. Feldstein assesses the implications of the ETR
model by using the estimated equation, including the residual e to
compute the net investment—output ratio under an alternative path of
From 1965 onward, the net—of—tax real return is set equal to its
value in 1965, the year in which RNt reaches a peak for the sample
period)5Given the one—period lag in the model, this alternative path
will lead to differences between the simulated and actual paths of the
dependent variable beginning in 1967, and the scenario attempts to
quantify the impact of the effective tax rate, boosted by the
interaction of inflation and non—neutral tax rules, on capital
formation. Feldstein concluded that, if RN had been maintained at its
1965 level, (In/Y) would have been 64% higher than actually realized in
1978. Parallel calculations, based on the newly benchmarked data and the
corresponding, parameter estimates (column 2 of Table 2), reveal that
the magnitude is lowered to 46% in 1978 but rises to a substantial 68%
in 1980.
-17-
While the simulation procedure can be criticized for the
instability of parameters and endogeneity of the explanatory
variables,16 the fundamental problem is that Feldstein's results mirror
the influence of both higher effective tax rates and lower net pretax
returns. For 1965 onward, Feldstein has defined the alternative net—of—
tax real return as RN —11965) * R1965. If we are concerned
with the effect of taxes on net investment over this period, then the
alternative rate of return should be defined by holding only at its
1965 value (RN' = (1 —11965) * Re). Simulations based on the newly
benchmarked data for RN and RN are displayed in the first two rows of
Table 4, and generate vastly different results. When both
and are held constant, the original ETR model implies that (Inh/Y)t
would have been 43% higher on average than actual values for the period
1967—1980, compared to a 17% average difference when only Tt is held
fixed.17
Thus, an appropriate simulation of Feldstein's original ETR
model with the newly revised data lowers substantially the estimated
impact of effective tax rates on net investment during the recent
episode of inflation.
The interpretation of the above simulations is unclear because
the rise in T can be due to increased taxes (Tn) in the numerator or
lower pretax operating income or higher depreciation (Dr) in the
denominator. These considerations indicate that it will be useful to
decompose RNt into the following three components,
= (Q/K) — (D/K) — (T/K), (9)

—18—
TABLE 4
DIFFERENCES BETWEEN CONDITIONAL AND ACTUAL VALUES OF
MEAN AND END OF PERIOD VALUES*
Conditional Mean (1967—1980) 1980Variable Level Perc. Level Perc.
Diff. Diff. Diff. Diff.(1) (2) (3) (4)
Original ETR Model
RN; = (1_r1965)*
R1965 1.360 42.72 1.812 68.43
RN=
(1_11965)*
Rt .548 17.22 .628 23.72
UCAP' = UCAP .142 4.46 .090 3.40t 1965
Modified ETR Model
RNNR' = RN' + NR .289 9.06 .442 16.69
RNNR" = RN" + NR .162 5.09 .186 7.01t t t
UCAP' = UCAP .403 12.65 .255 9.65t 1965
*Conditional values of (It1/Y) are based on alternative paths of theexplanatory variables that are defined in the Table and indicated byprimes. For each simulation, the other explanatory variable takeson historical values. The calculations in rows 1—3 are based onthe coefficients in column 2 of Table 2 and in rows 4—6 n thecoefficients in column 3 of Table 2. Columns 1 and 3 contain thelevel differences between the conditional and actual values of (V'/Y)tcolumns 2 and 4 contain the comparable percentage differences.
—19--
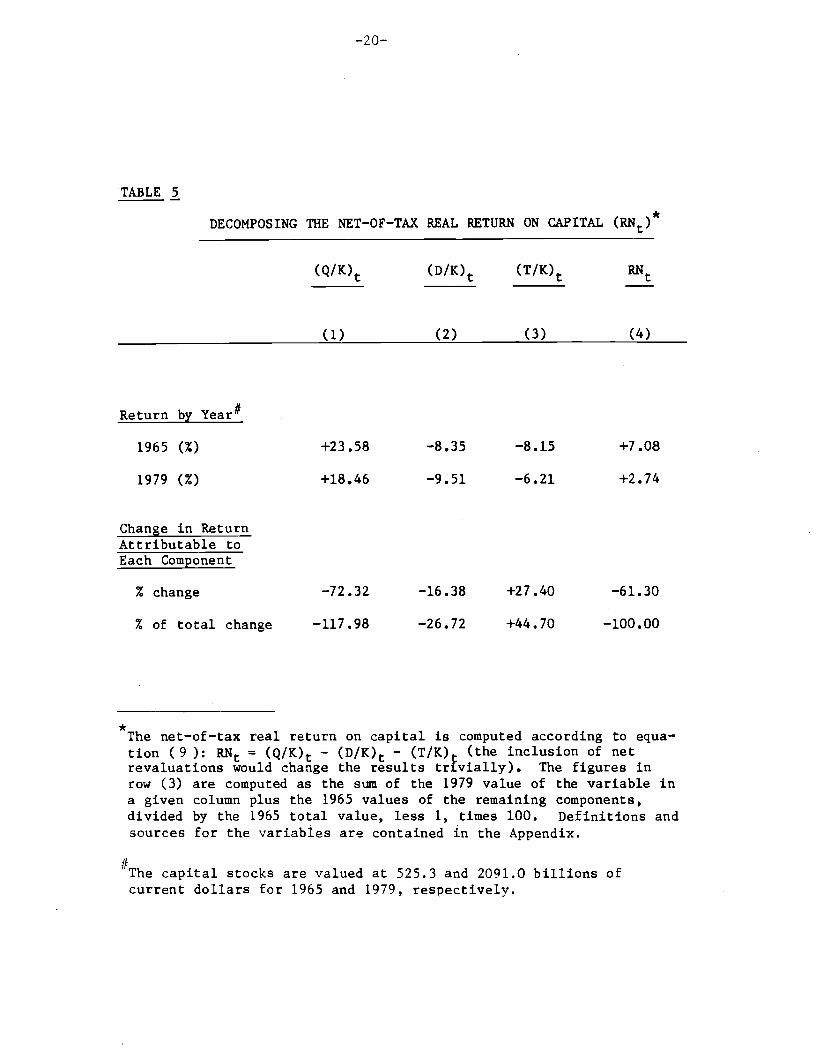
where (9) is equivalent to (4).18Calculations based on (9) for 1965 and
1979 are presented in Table 5, and provide a striking challenge to the
popular notion that the fall in RNt has been caused by higher taxes.
From 1965 to 1979, RNt declined from 7.08 to 2.74 a —61.3% change
relative to its 1965 value. However, as indicated in the third row, the
change in the gross pretax return of —723%, holding (D/K) and (T/K)t
at their 1965 values, was greater than the overall decrease in RNt.
Depreciation alone contributed to a further decline of 16.4% and taxes,
far from contributing to a decline in the rate of return, would have
lead to a 27.4% increase in RN. if the other components had maintained
their 1965 values.
This latter calculation may be misleading because of the positive
relationship between pretax income and tax payments. In order to adjust
for the lower level of economic activity in 1979, we assume that each
one point drop in (QIK)t lowers (T/K)t by the effective tax rates on
dividends and real retained earnings and on corporate income assessed by
Federal, State, and Local governments (the average for 1965—1979 of
these tax rates is .4431). If we use the above assumptions to adjust
(T/K)1979 upward for falling pretax income and if (QIK) and (D/K) had
remained at their 1965 levels, then the net—of—tax real return would
have been 6.75 in 1979, a 4.65% decline that is much smaller than the
actual 61.3% drop. Thus neither appropriate simulations with
Feldstein's original ETR model nor a careful examination of his data
reveal that taxes have exerted a significantly depressing effect on net
investment.
—20--
TABLE 5
DECOMPOSING THE NET-OF—TAX REAL RETURN ON CAPITAL
(Q/K) (D/K)t (T/K)
(1) (2) (3) (4)
Return by Year#
1965 (%) +23.58 —8.35 —8.15 +7.08
1979 (%) +18.46 —9.51 —6.21 +2.74
Change in ReturnAttributable toEach Component
% change —72.32 —16.38 +27.40 —61.30
% of total change —117.98 —26.72 +44.70 —100.00
*The net—of—tax real return on capital is computed according to equa-tion (9): RNt = (Q/K)t — (D/K)t — (T/K),. (the inclusion of netrevaluations would change the results trfvially). The figures inrow (3) are computed as the sum of the 1979 value of the variable ina given column plus the 1965 values of the remaining components,divided by the 1965 total value, less 1, times 100. Definitions andsources for the variables are contained in the Appendix.
1The capital stocks are valued at 525.3 and 2091.0 billions ofcurrent dollars for 1965 and 1979, respectively.

—21—
V. ADDITIONAL ECONOMETRIC EVIDENCE
Apart from the ETR model, Feldsteia presented econometric evidence
from two other models reaffirming a significant relationship between taxes
and Investment and, in the following two subsections, we show that these
estimates are also subject to a number of reservations
A. Neoclassical Model
The neoclassical theory of investment, as developed by Jorgenson
(1963) arid Hall and Jorgenson (1971), relates the desired capital stock to
the level of output and the user cost of capital, the latter combtnng in
a nonlinear fashion the opportunity cost of funds, the depreciation rate,
and various tax parameters. Unlike in the ETR model, the impact of taxes
on Investment is assessed at the margin (cf., fns. 1, 5), Movements in
output or the user cost are translated into net investment through the
same distributed lag coefficients, reflecting adjustment costs brought
about by delays in planning and delivery. Using estimates from this
model, Feldstein concluded that higher taxes and financing costs,
resulting from inflation and raising the user cost, have weakened the
incentive to Invest since the mId4196Os.19
The relationship between net investment and the user cost is
overstated in this model for three reasons. First, since Feldstein used a
single lag distribution, the lag coefficients represent an amalgam of
output and u.ser cost effect8. If output has the stronger influence On
investment, then the single lag distribution will overstate the potency of
the user cost, hence taxes. Second, the opportunity cost of funds is
taken as a weighted average of the costs of debt and equity, the latter
equal to an earnings—stock price ratio adjusted for the difference between
book and economic profits. The presence of an earnings"prIce ratio in the

—22—
user cost variable may involve a misspecification, for a decline in this
ratio may well reflect an increase in expected future earnings relative to
current earnings rather than a decline in the cost of funds. Insofar as
buoyant equity markets and surging Investment are both positively
associated with the state of the business cycle, a significant but
spurious inverse relationship between investment and the user cost will
exist. Econometric verification of the Importance of these two biases has
been presented in Chirinko and Eisner (1982, 1983): when an equation for
equipment expenditures (taken from the Data Resources Inc. model) based
essentially on the neoclassical model was reestimated with separate lag
distributions and the earnlngshprloe ratio removed from the opportunity
cost of funds, the estimated response of equipment investment to changes
in tax credits and depreciation allowances fell, relative to previous
estimates, by approximately 80%!20
Third, the nominal cost of equity is defined as the sum of an
adjusted earnings-price ratio and capital gains. The latter term is
equated to the overall rate of Inflation which, however, may overstate
capital gains on equity. From 1965 to 1981, the compound annual growth
rate in Standard & Poor's composite stock price index was only 2.33%,
compared to 5.98% in the GM? deflator. The languid increase in capital
gains relative to the overall inflation rate may have counterbalanced the
rise In the adjusted earnings'prIce ratio, resulting in a moderately
increasing or stable real cost of equity and a stable or possibly
declining real cost of funds. By assuming that capital gains have matched
the Inflation rate, Feldstein overestimated the rise In the cost of
capital services since the mld—1960s, and hence the adverse effects on
investment in the Neoclassical model.

—23—
B. ReturnOver—Cost Model
The third model analyzed by Feldsteln quantifies investment
incentives by contrasting the internal rate of return a firm can afford to
pay on a standard investment project with the cost of funds (i.e., the
returnsover'cost). In an inflationary environment, the internal return is
decreased by historical cost depreciation and increased by the tax
deductability of nomInal interest payments, and Feldstein's calculations
indicate that the return firms can afford to pay has not been greatly
affected by inflation. However, the cost of funds has risen
substantially, thus reducing the spread between the return on and cost of
an investment project. (The criticism advanced above concerning the
calculation of the real cost of equity applies with equal force to the
cost of funds used in the Return'OverCost model.) Positive and
significant regression coefficients on the return—overcost variable, with
the components entered either as one term or separately, led Feldsteiri to
conclude that nonneutral tax rules have had an adverse effect on
investment.
However, the Return-Over-sCost model is suspect as a useful tool for
analyzing non'neutral tax rules. A key maintained assumption of the model
is that there exists a standard investment project comprising capital
assets purchased In fixed proportions. At a theoretical level, such an
assumption is unwarranted in the presence of non-ineutral tax rules that
may favor a particular type of capital.21 Empirically, the ratio of the
constant dollar stocks of equipment to structures has risen from .77 In
1950 to 1.33 in 1980.
Even If the equIpment-structures mix is neutral with respect to
inflation, the standard investment project assumption is Inappropriate in

—24—
the presence of an inventory stock of materials used in the production
process. The user cost of the inventory stock depends on the inventory
accounting rule and turnover rate and, with first41n, first-'out
accounting, increases In the rate of Inflation, ceteris paribus, raise the
effective price of inventories and Induce a substitution toward more plant
and equipment (Chirinko, 1982b).22 In a world with more than one capital
asset owned by firms, the Return'Wver-COst model would not appear to be
useful in assessing the relationship between taxes and investment in new
plant and equipments
Lastly, the Return'OvertCo8t model is no longer stable over time when
estimated with the newly benchmarked data. Following Feldstein, we split
the sample between 1966 and 1967, and the F statistic for stability of' the
coefficients over the two sub3samples Is 8.76, significant at the 1%
level.

VI. SUMMARY AND CONCLUSIONS
This paper has examined the evidence from three econometric models
presented by Martin Feldstein In his Fisherr$Schultz Lecture, and
particular attention has been given to the Effective Tax Rate model. In
Section II, the original specification proved very robust to reestimation
with the newly benchmarked data, and Feldstein's basic conclusion
concerning the importance of the netofMtax real return remained
essentially unchanged. It has been argued In Section III that the rate of
return has been mlsspecif led by not incorporating the net revaluations of
the capital stock. Including net revaluations in the rate of return led
to a dramatic reversal of the roles of flpricesvt and output in the
estimated model, as the netof-tax real return lost its statistical
significance to the capacity utilization variable. In Section IV, the
magnitude of the effect of taxes on net investment in the original model
was examined. Due almost evenly to data revisions and a correction in the
simulation method, we found that, if the effective tax rate had been held
at its 1965 value, the net investment—output ratio would have risen only
16% in 1978 relative to Its historical value, a 75% reduction in the
previously reported effect. An examination of the components of RNt led
to the surprising conclusion that, ceteris paribus, changes in taxes have
significantly raised the netof'tax real return to capital. The results
generated in this paper suggest strongly that the Effective Tax Rate
model, when properly specified and evaluated, does not imply that taxes
have adversely affected business capital formation during the recent
episode of inflation,23 a conclusion consistent with the relatively robust
levels of net investment between 1965 and 1981 actually shown in the
—26—
benchrnarked National Income data.
As Feldstein states in is Lecture, evidence from any one model is
unlikely to be definitive because it may be subject to a number of biases
affecting the results in unknown ways. Thus Feldstein also analyzed the
Return$OverCost and Neoclassical models; our review of these two
specifications generated supporting evidence for the conclusion of a
limited role for tax incentives (Section V). We have clearly not
exhausted all plausible models of the investment process nor all possible
variatIons of the specifications under reviews In particular, lIttle
attention has been given to the explicit modeling of expectations and
additional dynamic elements influencing the capital formation process.
Models have been developed that are well'4suited for examining these
factors, and their implications for tax policy have been summarized
elsewhere (Chirlnko, 1983). Based on the current study, we conclude that
fiscal policies aimed at stimulating capital formation are likely to
succeed only insofar as they have a salutary effect on the level of
capacity utilization. The direct impact of tax policy on net investment
appears to be negligible.

—27-
APPENDIX
Data Sources and Glos
Sources
CEA — Council of Economic Advisers (1981).
FELD — Feldstein (1982).
FPDM — Feldstein, Poterba, Dicks—Mireaux (1983)
SCB — U.S. Department of Commerce: 1952—1976 (1981b),
1977—1980 (1981a).
Variables
D — current dollar depreciation of nonresidential fixed
private capital; SCB, Table (T) 5.2, Line (L) 8
1n — constant dollar net nonresidential fixed investment;
SCB, T 5.3, L 9
(In,y)OLD— ratio of net investment to output, old NIPA data;
FELD, TI, Column (C) 1, p. 20
K — the replacement value of the firm's total stock of
capital; FPDM, pp. 134—135
NR — net revaluations of K; equation (8)
p — implicit deflator for gross national product;
SCB, T 7.1, L 1
q — implicit deflator for gross nonresidential fixed invest-
ment; SCB, T 7.1, L 8
Q — current dollar operating income, before capital
consumption allowances and taxes, adjusted for the
replacement cost of inventories used in current
production and losses on non—interest bearing
financial assets; FPDM, T 3, C 1 Plus D
—28—
R — net pretax return on K; FPDM, T 2, C 4, and equation (2)
RN — net—of—tax real return on K; equation (4)
RN' — alternative path of RN; see Table 4
RN" — alternative path of RN; see Table 4
RNNR — net—of—tax real return on K with net revaluations;
equation (6)
RNNR' — alternative path of RNNR; see Table 4
RNNR" — alternative path of RNNR; see Table 4
SP — Standard & Poor's composite stock price index; CEA, T B—90, C 7
T — current dollar total taxes assessed on an adjusted flow of
capital income after it is eventually received by
bondholders and equityholders
— effective tax rate on capital income; FPDM, T 3, C 9, and
equation (1)
UCAP — Federal REserve Board Index of Total Manufacturing
Capacity; CEA, T B—43, C 1
UCAP' — alternative path of UCAP; see Table 4
Y — constant dollar Gross National Product; SCB, T 1.2, L 1

—29--
REFERENCES
Abel, Andrew, B., 1981, Taxes, Inflation and the Durability of Capital,Journal of Political Economy 89, 5148-,560.
Auerbach, Alan J., 1979, Inflation and the Choice of Asset Life, Journalof Political Economy 87, 621—638.
Chirinko, Robert S., 1982a, Taxes, Inflation, and Capital Formation: FourEssays in Theory and Econometrics (unpublished Ph.D. thesis,Northwestern University) *
_______, 1982b, The Impact of the Inventory Profits Tax and Other NonNeutralities on Capital Formation, Northwestern University.
_______ 1983, Investment and Tax Policy: A Survey of Existing Models andEmpirical Results With Applications to the High—Technology Sector,Cornell University.
_______ and Robert Eisner, 1982, The Effects of Tax Parameters in theInvestment Equations in Macroeconomic Econometric Models, in:Marshall E. Blume, Jean Crockett, and Paul Taubman, eds., EconomicActivity arid Finance (Balliriger, Cambridge, Massachusetts).
_____________ 1983, Tax Policy and Investment in Major U.S. Macroceconomic Econometric Models, Journal of Public EconomicS 21,139'166.
_______ and Stephen R. King, 1984, Hidden Stimuli to Capital Formation:Debt and the Incomplete Adjustment of Financial Returns, CornellUniversity.
Council of Economic Advisers, 1981, Economic Report of the President(U.S. Government Printing Office, Washington).
Eisner, Robert, 1969, Fiscal and Monetary Policy Reconsidered, AmericanEconomic Review 59, 897—905.
Fair, Ray C., 1981, A Comment on Feldstein's Fisher-'Schultz Lecture, NBERWorking Paper No. 716.
Feldstein, Martin, 1982, Inflation, Tax Rules and Investment, Econometrica50, 825862.
_______ and James Poterba, 1980, State and Local Taxes and the Rate ofReturn on Non—Financial Corporate Capital, !'IBER Working Paper No.508R.
______________ and Louis Dicks-'Mireaux, 1983, The Effective Tax Rate andthe Pretax Rate of Return, Journal of Public Economics 21, 129-e158.
—30—
_______ and Lawrence H. Summers, 1979, Inflation and the Taxation ofCapital Income inthe Corporate Sector, National Tax Journal 32,14145147Q•
_____________ 1980,Inflation and the Taxation of Capital Income in theCorporate Sector: Reply, National Tax Journal 33, '485*'488.
Fullerton, Don, 19814, Which Effective Tax Rate?, National Tax Journal 37,23r 142.
Gordon, Robert J., 1979, Energy Efficiency, User Cost Change, and theMeasurement of Durable Goods Prices, NBER Working Paper No. 1408.
Gravelle, Jane G., 1980, Inflation and the Taxation of Capital Income inthe Corporate Sector: A Comment, National Tax Journal 33, k73*1483.
Hall, Robert E.. and Dale W. Jorgenson, 1971, ApplIcation of the Theory
of Optimum Capital Accumulation, in: Gary Fromin, ed., Tax Incentivesand Capital Spending (Brookings Institution, Washington).
Hulten, Charles, R. and James W. Robertson, 19814, The Taxation of HighTechnology Industries, Nattonal Tax Joutnal 37, 327431t5.
Humphrey, David 3. and J.R. Moroney, 1975, Substitution Among Capital,Labor, and Natural Resource Products in American Manufacturing,Journal of Political Economy 83, 57M82.
Jorgenson, Dale W., 1963, Capital Theory and Investment Behavior,American Economic Review 53, 2k7259.
King, Mervyn and Don Fullerton, 19814, The Taxation of Income from Capital:A Comparative Study of the United States, the United Kingdom, Sweden,and West Germany (The University of Chicago Press, Chicago andLondon).
Lucas, Robert E., Jr., 1976, Econometric Policy Evaluation: A Critique,CarnegieRochesterconferene in Public Policy, The PhillipsCurve and Labor Markets 1, 19!146.
Morrison, Catherine J. and Ernst R. Berndt, 1981, Short Run LaborProductivity In a Dynamic Model, Journal of Econometrics 16, 339365.
Nerlove, Marc, 1972, Lags in Economic Behavior, Econometrica 140, 221'251.
Sargent, Thomas, J., 1981, Interpreting Economic Time Series, Journal ofPolitical Economy 89, 2132148.
Schmidt, Peter and Robin Sickles, 1977, Some Further Evidence on the Useof the Chow Test Under Heteroscedasticity, Econometrica 145,1293i298.
Sinai, Allen and Otto Eckstein, 1983, Tax Policy and Business FixedInvestment Revisited, Journal of Economic Behavior and Organization14, 131'4162.

—31—
Sullivan, Martin A., 1981, The Adequacy of Capital Recovery in the UnitedStates, (unpublished undergraduate thesis) Harvard University.
Summers, Lawrence FL, 1981, Taxation and Corporate Investment: A qTheoryApproach, Brookings Papers on Economic Activity 1981:1, 67—127.
Toyoda, Toshthisa, 1974, Use of the Chow Test Under Heteroscedasticity,Econometrica 12, 6O16O8.
U.S. Department of Commerce, Bureau of Economic Analysis, 1980, TheNational Income and Product Accounts of the United States: AnIntroduction to the Revised Estimates for 1929—80, Survey of CurrentBusiness 60, 1-'26.
_______, 1981a, Survey of Current Business Special Supplement (U.S.overumei Pr..uklub 5uw,ju)
_______, 1981b, The National Income and Product Accounts of the UnitedStates (U.S. Government Printing Office, Washington).

—32—
FOOTNOTES
1 • Two caveats associated with this conclusion should be rioted.
First, it has been argued that the reported net investment and GNP figures
should be reduced by the amount of direct pollution abatement
expenditures, which do not affect output as recorded in the National
Income Accounts (Summers, 1981, pp. 71'73). When this adjustment Is made
to the 1fl/y series, capital formation in recent years continues to be
strong by historical standards: the mean for the period 1953197g of 2.8
is exceeded or equaled by the mean for 1967-'1979 of 2.9 and by the values
for 1978 and 1979 of 2.8 and 3.0, respectively. Second, alternative
breakpoints in the sample may lead to different assessments of the
strength of net investment. The 196&fl967 split was chosen because it was
the one used by Feldsteth in his empirical work and, as mentioned in the
text, In/Y peaked and inflation began to accelerate in the mid1960s.
2. During the postwar period, benchmark revisions have been
undertaken in 19L7, 1951, 195k, 1965, 1976, and 1980. The purpose of
these benchmarks is to allow for the "incorporation of newly available and
revised source data" (e.g., input-output tables), "the reconsideration and
improvement of definitions, classifications, and estimating procedures,
the Introduction of new series" (e.g., the economic measure of capital
consumption in the 1976 benchmark), "and the redesign of tables to make
them more convenient and informative" (U.S. Department of Commerce, 1980,
p. 1). In the 1980 benchmark, significant revisions occurred in
expenditures on producers durable equipment, now based solely on commodity
flows but previously calculated as an average of commodity flows and
responses from the Bureau of Economic Analysis' Plant and Equipment
—33—
Survey. An increasing amount of equipment leasing by non—producing firms
and a decrease in the number of respondents to the Survey partly explain
the growing discrepency between the commodity flow and survey methods.
Expanded coverage and the use of recently released input4output tables
also contributed to the higher estimates of producers durable equipment.
The level of nonresidential structures was increased by the inclusion of
hotels and motels from the residential structure category, although this
transfer did not appreciably alter the growth rate.
j. me concept or tne rrective Tax nate on capitai. income was
initially presented in Feldsteln and Summers (1979), extended to include
state and local taxes In FeldsteIn and Poterba (1980), and recalculated
with the newly benehinarked data In Feldsteln, Poterba, and Dicks'MIreaux
(1983). Cf., fn. 4•
14• In contrast to the marginal effective tax rates that have been
calculated by some researchers (e.g., King and Fullerton, 1981!), is an
average effective tax rate. While no definitive definition of "the"
marginal or average effective tax rate exists (Fullerton, 1981!), it is
interesting to note that the correlation coefficient between the marginal
and average effective corporate tax rates of Hulten and Robertson (19814)
is .89 for the period 1952i980 or i9521982. Cf., fn. 5 for a further
discussion of average and marginal concepts.
5. See Gravelle (1980), Feldsteln and Summers (1980), Sullivan
(1981, Chapter Iv), and Feldstein, Poterba, and DIcks-Mireaux (1983, p.
1143, fn. 38). Fullerton (1981!) provides an excellent discussion of
various definitions of and differences in average and marginal effective
tax rates and, by extension, average and marginal net returns. Neither
concept would appear to be dominant In the analysis of capital formation.
—34—
Average returns are a deficient measure because they are not directly
related to the marginal decisions at the core of economic theory.
However, quantifying the marginal return on capital can be achieved Only
by considering selected features of the tax code and by relying on a
number of maintained assumptions ? competitive market structure, uniformly
positive cash flows, and the maximization of a particular objective
function. Studies using average returns are best viewed as complementary
to work on marginal returns where, in the former, potentially restrictive
assumptions are relaxed at the expense of a direct link to the
neoclassical model of capita]. accumulation.
6. It should be noted that (5) is not an investment schedule,
but rather a supply curve for funds allocated to nonresidential fixed
investment, conditional on the aggregate amount of saving (Feldstein,
1982, p. 836).
7. The results presented in column 1 are comparable to those
reported in equation (3.2) (Feldstein, 1982, p. 840), and differ
slightly due to scaling of the variables, less precision in the data,
and possibly the convergence criterion for the estimate of the auto—
correlation coefficient..
8. As with the net—of—tax real return, it is the expected rates
of capital gains and inflation that are the relevant variables, which,
following the reasoning implicit in Feldstein's study, we proxy by
lagged realizations. While superior proxies maybe available, their
implementation would require significant departures from Feldstein's
framework, and hence have not been utilized.
—35—
9. With a rise in the price of investment goods, equityholders
enjoy a capital gain on existing capital but, due to higher priced
inputs, suffer an increase in operating costs. Insofar as the price of
output fails to rise pan passu, the latter effect may lead to lower
operating income, Qt and is captured by Feldstein's
10. It has been argued that the published price index for plant
and equipment, which is calculated based on production costs, may suffer
from a systematic upward bias, leading to a similar bias in In the
presence of quality changes in new capital goods not proportional to the
added cost of production, the published series may overstate price
increases (or understate decreases) relative to an index based on the
value to capital goods users (Gordon, 1979). While the methodology
underlying the construction of price series may be open to debate,
systematic bias in the aggregate investment deflator is not apparent
over a long time horizon. For the period 1953—1981, the ratio (q/p).
scaled to unity in 1953, reaches a peak in 1957 (1.050), generally falls
for the ensuing 17 years, and bottoms—out in 1973 (.942). The ratio
rises sharply between 1973 and 1975. From 1975—1981, the series
exhibits a dained oscillatory pattern and, in 1981, equals its 1953
value. While the time series of (q/p) may exhibit some serial
correlation, casual inspection of the data do not reveal a systematic
bias that will affect the results presented in this paper. Further
evidence in support of our measure of NRt is that, when summed over the
sample period, net revaluations are zero (Table 3).

—36—
11. Since the elasticity is the product of an estimated
coefficient and the inverse of the mean of (I'/Y)t, both of which are
stochastic and non—independent, we do not know the distribution of c.
Logarithmic regressions of the original and modified ETR models
generated estimated 's that are slightly smaller than, but not
significantly different from,those reported in Table 2, The confidence
intervals for these estimated C's are similar to those of the estimated
b2s discussed in the text.
12. in this case, NR (SPfSP) —
13. The discussion in Feldstein (1982) suggests that the 1966—197
breakpoint was chosen simply to halve the sample. In addition, 1966 is
the year in which (Inh/Y)t peaked and inflation, as measured by the
overall GNP deflator, began to accelerate.
14. As noted by Toyoda (1974), the Chow test's significance levels
are increased when the regression standard errors from the sub—samples
are unequal. The percentage differences between the regression standard
errors from the sub—samples are only 6.97%, 10.94%, and 12.22% for the
original and modified models, respectively, and thus have a trivial
effect on the critical region (Toyoda, 1974, Table I; Schmidt and Sickle,
(1977).

—37.-
15. Rather than a decline in profitability, the observed fall in RNt
could be due to a change in the mix of tangible to riontangible capital.
For example, proportionate declines in the stock of research and
development and the flow of capital income, leaving "true" profitability
unaffected, would nonetheless result in a decline in RNt as measured in
this study. However, the correlation coefficient between RNt and a rate
of return Including the stocks of research and development and goodwill Is
.97 (this statistic is based on series whose cyclical components have been
removed).
16. The Issue of unstable parameters, due to changes in policy or
nonrpolicy factors, has been discussed In Eisner (1969), Lucas (1976), and
Sargent (1981). Of' further concern Is the feedback from the
counterfactual path of RNt to greater investment, a larger capital stock,
and ultimately a lower RNt. This scenario suggests that the reported
results from any of these simulations are biased upward, though the
magnitude of the bias is likely to be small because of net Investment's
negligible impact on the capital stock.
17. The coefficient on capacity utilization Is significant only in
the modified ETR model, and holding UCAPt to its 1965 value would have
resulted in 13% more Investment on average between 1967198O. Simulation
results with the insignificant variables are presented in Table , rows
3r5, and the response of net Investment is small.
18. This decomposition suggests that we may wish to relax the
constraint implicit In (5) that forces each component of the rate of
return to affect net investment through the same coefficient. The
theoretical justification for such a decomposition follows from
Interpreting the estimated coefficient as an amalgam of expectation and
—38—
delivery lag parameters, which may vary systematically among components of'
RNt (Eisner, 1969; Nerlove, 1972). Estimates of this more general model
reveal that the constraint is barely rejected for the original ETR model
and easily rejected for the modified ETR model (all tests are based on a
5% significance level). In addition, only the coefficients of (Q/K)ti
and (T/K)t,4i are statistically different from zero.
19. Chirinko and King (198J4) show that, in an inflationary
environment, the presumed rise in the user cost and the bias in favor of
shorteri'lived assets occur only under a limited set of circumstances.
20. A comment has been offered by Sinai and Eckstein (1983).
21. See Auerbach (1979), Abel (1981), and fn. 19.
22. This conclusion rests on the substitutability of materials for
capital in production. See Humphrey and Moroney (1975) and Morrison and
Berndt (1981) for supporting evidence.
23. Fair (1981) also fails to discover a significant rate of return
effect on net investment in an alternative investment equation.